Abstract
The water flow within the turbine passage of a hydropower station exhibits high-speed closed-pressure flow. The flow field characteristics will directly affect the turbine’s operational efficiency and safety. To ensure the safe operation of the turbine and accurately monitor its flow state, the relationship between the flow characteristics in the turbine passage and its discharge noise must be established. In this study, the relationship between the flow field and the noise field of the turbine is explored using a combination of a model turbine passage discharge noise test and numerical simulation of flow field characteristics. Results show that the operating parameters are closely related to the discharge noise’s characteristics, in which the operating head and discharge of the unit’s operating parameters greatly influence the discharge noise in the flow passage. Hydrodynamic factors, such as fluctuation pressure and pressure in the flow field, show a strong correlation with the discharge noise characteristics. As the pressure and fluctuation pressure in the inlet area of the spiral case intensify, the sound pressure level (SPL) of the discharge noise increases and the main frequency decreases. A large-scale vortex easily forms in the spiral case and draft tube area, thereby causing low-frequency fluctuation and forming high-decibel noise. Also, the runner area is the main sound source region of the turbine passage. The research results will provide technical and theoretical support for the safe operation and accurate fault diagnosis of hydropower stations.
1. Introduction
During the operation of a hydropower station, large volumes of water are discharged through a complex flow passage, leading to turbulent water flow and the generation of high-decibel discharge noise. This noise pollution affects the internal and surrounding environment of the hydropower station building. The discharge noise also refers to the characteristic signal of the closed flow passage of the turbine to transmit the running state of the water flow. This signal can be used as a direct and effective diagnostic basis for the safe operation of the hydropower station [1]. Therefore, establishing a connection between the discharge flow field and the discharge noise of the hydropower station is the premise for reducing the noise pollution of the hydropower station and monitoring the running state of the flow passage.
The turbine’s internal flow passage structure is complex, and its internal water flow is characterized as high-speed pressure flow. Due to the closure of the flow passage and the complexity of the hydrodynamic characteristics of the water flow, monitoring the running state of the turbine in real time by using conventional methods, such as the energy method, the high-speed photography method, and the full-wave rectifier spectrum analysis method, becomes difficult [2]. The vibration-based fault monitoring and diagnosis system is commonly installed in hydropower stations. However, traditional vibration diagnosis has certain limitations on the faults, such as cavitation, von Karman vortex, and cracks in the flow components [3]. Discharge noise corresponds to an intuitive manifestation of the hydrodynamic characteristics of the water flow in the turbine passage and the safe operation of the unit. For example, during the operation of the Ganran Hydropower Station in Turkey, an abnormal metal howling was observed in the discharge noise. After the shutdown inspection, the special discharge noise was attributed to the crack of the blade and the formation of a von Karman vortex [4]. Vibration and severe noise are generated when the Sayano–Shushenesk Hydropower Station in Russia operated in a non-favorable area. The underwater sound resonates with the structure, thereby aggravating the vibration of the unit. However, serious safety accidents have occurred due to the failure to stop operation in time [5,6]. The discharge noise reflects the running state of the turbine in real time. The running state database of the turbine passage can be established by monitoring the discharge noise, and the characteristic parameters of the discharge noise under each state of the unit can be extracted [7]. Through the identification of the discharge noise characteristics, the operation safety of the hydropower station can be monitored and diagnosed in time.
Currently, numerous scholars have analyzed and examined discharge noise characteristics in fluid machinery flow passage and have obtained substantial research findings [8,9,10]. For example, Zheng [11] used the indirect acoustic boundary element method to calculate the external field noise caused by the rotating dipole source of the blade. They concluded that the dynamic and static interferences between the rotating impeller and the stationary spiral case of the mixed-flow pump mainly caused the flow-induced noise. Mao [12] used a DES turbulence model and acoustic analogy method to calculate the fluctuation pressure characteristics and flow-induced noise of a pump turbine during load rejection. Additionally, considerable research has been performed on the discharge noise formed in the flow passages of various types of hydroelectric turbines, and some research results have been obtained [13,14]. Yan [15] used a numerical simulation method to study the problem of unknown water noise caused by the Francis turbine. The sound power level of the main noise radiation position of the near-field noise of each component and the sound spectrum characteristics of the far-field noise were obtained. The turbine unit of a low-head hydropower station in southwest China produces strong vibration and noise when the unit is operated at full load above the rated head. Findings also show that the unstable fluctuation pressure caused by the flow passage vortex at the runner blade is attributed to the discharge noise [16]. Wang [17] investigated the influence of guide vane opening on the flow-induced noise of the Francis turbine by numerical simulation and determined the distribution characteristics of the external field noise of the turbine. With the increase in the guide vane opening, the SPL of the radiated external field noise rises and the dipole characteristics become more obvious. Liu [18] used the acoustic analogy model in Fluent software to simulate and analyze the discharge noise in the turbine passage. He concluded that the flow noise generated by the Francis turbine under small opening conditions is divided into broadband and discrete noises. The frequency range of the broadband noise distribution is wide, which is consistent with the wall fluctuation pressure law of the turbine flow components. Wu [19] used vibration acceleration and ultrasonic sensor load monitoring technology to monitor and record the noise characteristics of turbine operation. He also identified the cavitation erosion state in the flow passage according to the noise spectrum characteristics.
The aforementioned research on the discharge noise of the turbine passage mainly focused on characteristics under different operating conditions or the cavitation noise inside the flow passage. Research on the relationship between the discharge noise characteristics of different regions of the turbine passage and its operating parameters and the flow field characteristics is limited. Therefore, to reduce the discharge noise pollution of hydropower stations effectively, turbine passage faults must be identified in real time through the discharge noise characteristics. The relationships between the discharge noise in different regions of the turbine and its operating parameters and the flow field characteristics must be conducted urgently.
2. Research Method
2.1. Model Turbine Passage Discharge Noise Monitoring Test
2.1.1. Test Equipment and Instruments
To determine the discharge noise characteristics of conventional hydraulic turbines under different operating conditions, the discharge noise monitoring test is performed using the laboratory model Francis turbine energy test bench (Table 1). The turbine energy test bench is mainly composed of the upstream reservoir, the diversion pipe, the turbine passage, the tail water tank, the return water tank, and the operating table, as shown in Figure 1 and Figure 2. The head of the upstream reservoir, the discharge flow rate of the runner, and the rotor speed can be controlled by adjusting diversion pipeline valve openings, the opening of the guide vane, and the load of the rotor, respectively. The instantaneous runner speed, torque and power, and other related parameters can be recorded during the test.

Table 1.
Main parameters of model hydraulic turbine.
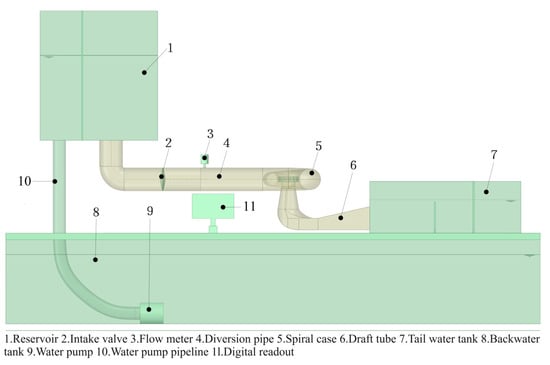
Figure 1.
Design drawing of energy test bench for Francis turbine model.
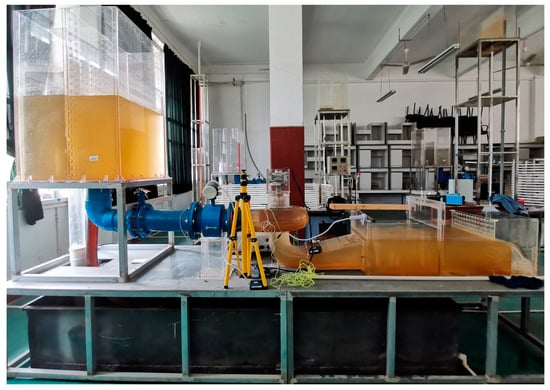
Figure 2.
Francis turbine model energy test bench.
A CoCo-80X handheld dynamic signal analysis and data recorder from Crystal Instruments(Santa Clara, CA, USA) was used for signal recording. The D130F20 capacitive acoustic sensor from the PCB Company in the United States was used to record the changes in sound pressure. Prior to the collection of discharge noise signal, a CAL standard sound source from the PCB Company was used to calibrate the acoustic sensor. A portable direct reading current meter was used to measure the flow velocity at the outlet section of the draft tube when the discharge of the flow passage reached stability.
2.1.2. Test Method
The operating conditions of the turbine are realized by adjusting the opening of the diversion valve (e.g., fully open, semi-open, and closed), the opening of the guide vane (e.g., 22.79, 19.13, and 15.54 mm), and the impedance load of the unit (e.g., 0 A and 0.2 A.) When the impedance load is 0 A, the torque is 0. To determine the influence of turbine operating parameters on its discharge noise, 12 sets of test conditions are set up within the adjustable range of the energy test bench. The test process monitors and records the up- and downstream water levels, runner speed, torque, power, acoustic signal, vibration signal, and flow rate of each working condition (Table 2).

Table 2.
Model hydraulic turbine operating condition information.
With the modifications in operating conditions, the internal flow field and the noise field of the turbine passage will also change accordingly, especially for the flow components with severe turbulence and large pressure gradients, such as the spiral case, distributor, runner, and draft tube. To better distinguish the hydrodynamic correlation between the discharge noise at these flow components and the flow field, acoustic monitoring must be conducted in these areas. Noise measurement involves budget estimation, engineering, and precision methods [20]. In the experiment, the engineering method was used to monitor the discharge noise. The acoustic monitoring measuring points were arranged at the inlet section of the spiral case and the outlet section of the runner, which were 2 cm away from the side wall (Figure 3). The acoustic sensor was calibrated before the acoustic measurement. When the turbine discharge process reached stability, the noise monitoring was carried out with a duration of 20 s. To minimize the influence of background noise on the discharge noise, the test was carried out in the late night with the weakest background noise. The background noise of the test environment was mainly low-frequency noise below 200 Hz. The test showed how discharge noise changed with operating conditions, so the influence of background noise could be ignored.
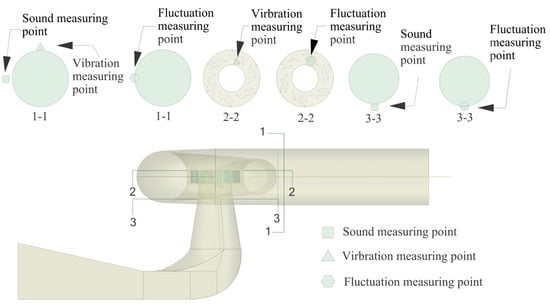
Figure 3.
Hydraulic turbine measuring point distribution map, 1-1 is the spiral case inlet section, 2-2 is the top cover section, 3-3 is the runner outlet section.
2.2. Three-Dimensional Numerical Simulation of Turbine Flow Field
The flow within the turbine is a complex turbulent motion, and the passage produces complex hydraulic characteristics, such as strong shear, strong vortex, strong interference, and multiple scales [21,22]. The turbine passage corresponds to a high-speed closed-pressure flow passage, making it difficult to monitor and capture the hydrodynamic distribution characteristics of the flow field in real time. In this study, the numerical simulation method was used to determine the hydrodynamic distribution characteristics of the turbine passage. A three-dimensional model was constructed based on the model hydraulic turbine, and CFD software was used to calculate the flow field. The turbine passage boundary is complex and involves the rotating motion boundary. To enhance the flow passage boundary fitting, an unstructured grid was used to divide the fluid domain, obtaining a total of 3,282,000 elements. The model can be divided into six sub-computational domains based on the distinct functions and complexities of each flow component. These domains can enable effective static and dynamic separation between the runner and other regions.
The turbulence model has a great influence on the accuracy of flow field simulation results. The RNG k-ε model is suitable for flows with high strain rates and large streamline curvatures, displaying high accuracy in the simulation of the hydrodynamic characteristics of the turbine passage [23]. Therefore, the RNG k-ε model will be used in this study. This model satisfies the continuity equation and momentum conservation equation:
where is the velocity vector; are the components of velocity vector in directions; is the fluid density; is the pressure of the fluid particle at the calculated position; and are the generalized source term of the momentum equation.
2.2.1. Grid Independence Verification
The mesh density of the model directly affects the accuracy of the calculation results. With an increasing number of grids, the model becomes more adaptable to the spatial structure and produces more precise simulation results. However, excessive number of grids affects the calculation speed and occupies more space, thereby increasing the workload of the computer. Therefore, a suitable grid model must be selected.
After comparing and evaluating three different grid model schemes (Table 3), Scheme 1 did not meet the required velocity error rate and is not considered. Scheme 2 and Scheme 3 met the error requirements of flow field results. Scheme 3 had the smallest error of flow field results, but its accuracy did not improve much compared with Scheme 2. Moreover, the workload of the computer increased remarkably. Therefore, Scheme 2 was selected as the grid model of this study for flow field calculation.

Table 3.
Comparison of numerical simulation results of different mesh numbers.
2.2.2. Model Verification
The numerical calculation results are greatly affected by relevant parameters, such as the model and the grid. To ensure that the flow field simulated by the numerical simulation can be consistent with the experimental discharge flow field, the numerical simulation results should be calibrated. During the experiment, the flow velocity at three measurement points (e.g., C1 = [80, −630, −301.47]; C2 = [0, −630, −301.47]; and C3 = [−80, −630, −301.47]) in the outlet section of the draft tube was measured and averaged, and the error was compared with the simulation results at the same measurement points under the same operating conditions.
Based on the error analysis between the measured and simulated mean values of the flow velocity at different flow velocity measurement points (Table 4), the simulated results are within 5% error of the measured results, which accords with the standard of error.

Table 4.
Error comparison of turbine flow field results.
3. Results and Discussion
3.1. Characteristics of Discharge Noise
Through the fast Fourier transform processing and filtering noise reduction of the turbine discharge noise signal monitored by the CoCo-80X handheld dynamic signal analysis and data recorder, the time domain and spectrum diagrams of the noise signal in the typical area of the turbine under various operating conditions are obtained. Figure 4a,b demonstrate that the noise amplitude fluctuates between −0.5 and 0.5 Pa in the spiral case inlet area and −1–1 Pa in the runner outlet area. The noise amplitude in the runner outlet area is higher than that in the spiral case inlet area, and the SPL is also greater in the runner outlet area compared with the spiral case inlet area. The noise frequency bands of the two areas are mainly concentrated in the range of 0–3500 Hz, as shown in Figure 4c,d. The spiral case inlet section has a higher main frequency than the runner outlet section, and the main frequency peak is lower.
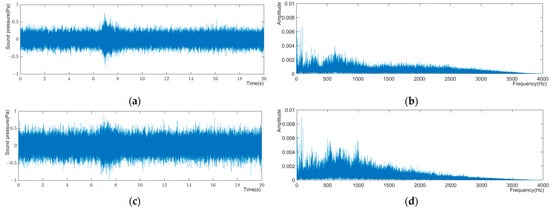
Figure 4.
(a) Time domain diagram of acoustic signal at the spiral case inlet in Condition 3; (b) frequency domain diagram of acoustic signal at the spiral case inlet in Condition 3; (c) time domain diagram of the acoustic signal at the runner outlet in Condition 3; (d) frequency domain diagram of the acoustic signal at the runner outlet in Condition 3.
The average SPL of the measuring points in the spiral case inlet area and the runner outlet area under different operating conditions of the turbine is greater than 69 dB (Table 5). This value surpasses the permitted environmental noise value and indicates that the hydropower station’s turbine operation poses some degree of noise pollution to the environment.

Table 5.
SPL (dB) at each measuring point under different operating conditions.
Influence of Operating Condition Changes on the Noise Characteristics
Based on the frequency spectrum of the two areas under different working conditions, under the operating conditions of the large opening (full opening) of the diversion valve, the main frequency band of the acoustic signal in the spiral case inlet area is 0–200 Hz and 400–800 Hz, and the main frequency band in the runner outlet area is 400–1000 Hz. Under the condition of small valve opening (semi-open), the main frequency band of the acoustic signal in the spiral case inlet area is 0–600 Hz, and the main frequency band in the runner outlet area is consistent with the spiral case inlet area (Figure 5). Although the main frequency bands of the acoustic signals in the two areas have overlapping frequency bands, the spectral amplitude of the measuring point in the spiral case inlet area is smaller than that in the runner outlet area, indicating that discharge noise contributes more remarkably to the runner outlet area.
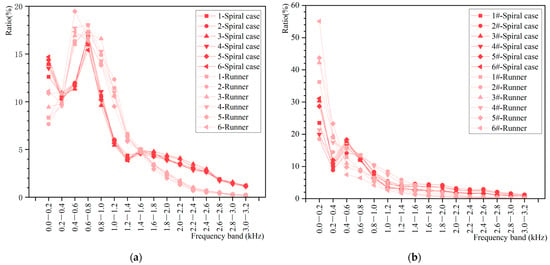
Figure 5.
(a) is the energy ratio diagram of acoustic signal in operating conditions 1 to 6, (b) is the energy ratio diagram of acoustic signal in operating conditions 1# to 6#.
The acoustic signal energy ratio diagram (the distribution ratio of acoustic signal in different frequency bands) of the measuring point in the spiral case inlet area and runner outlet area under different working conditions (Figure 5) indicates that in the low-frequency band, which is prone to accidents, the energy of the runner outlet area is larger than that of the spiral case inlet area when the valve opening is small. Therefore, the flow state of the runner outlet area is the main source of the turbine discharge noise.
Under different operating conditions, the SPL of the measuring point in the spiral case inlet area is lower than that of the runner outlet area. Under the small valve opening, the SPL of the two regions changes greatly with the change in the operating parameters of the turbine. This phenomenon suggests that the noise characteristics possess high sensitivity to operating parameter changes in the turbine. It also shows that the water flow stability under the small valve opening is larger than that of the valve opening.
With the changes in the operating parameters of the turbine, the SPL of the measuring points in the two regions shows an increasing trend with the rise of the head and a decreasing trend with the increment of the flow rate. This finding shows that the change in the operating head and flow rate of the turbine has a certain influence on the SPL of the discharge noise of the flow passage.
3.2. Key Hydrodynamic Factors Affecting the Discharge Noise Characteristics
Discharge noise refers to the radiation noise caused by the interaction between water flow and the solid boundary and the turbulence inside the water flow. The main excitation mechanism is the transfer of internal stress and pressure disturbance in water, solid boundary, and air excited by the relative motion of solid and water flow and the irregular motion of water flow itself [24]. Therefore, the changes in hydrodynamic factors, such as flow velocity, pressure, turbulence, and vorticity, stimulate different interactions between the water body and the boundary or inside the water body, which may affect the discharge noise characteristics, which, even under some load, will affect the unit operation stability [25]. To identify the key hydrodynamic factors that affect the discharge noise characteristics of the turbine, the flow velocity and velocity gradient, pressure and pressure gradient, turbulent kinetic energy, and vorticity of the flow field in each region of the turbine under different operating conditions were analyzed through the numerical simulation of the whole turbine passage.
3.2.1. Spiral Case Area
Based on the hydrodynamic numerical simulation results of the whole turbine passage under different operating conditions, the distribution law of the flow field in the spiral case area is the same (Figure 6 and Figure 7). The flow velocity in the spiral case area shows a gradually decreasing gradient change from the radial direction of the seat ring to the outer wall of the spiral case. As the wrap angle decreases, the flow velocity gradient gradually becomes uniform, and the water flow inside the spiral case gradually becomes stable. Furthermore, the strong turbulence area gradually moves from the central area to the seat ring. This phenomenon indicates that the water flow exhibits a certain fluctuation or turbulence along the circumferential direction in the internal flow of the spiral case.

Figure 6.
Flow field distribution of spiral case plane in Condition 6 (SPL: 69.74 dB).

Figure 7.
Flow field distribution of spiral case plane in Condition 6# (SPL: 73.38 dB).
Remarkable variations in pressure, pressure gradient, flow velocity, and flow velocity gradient in the spiral case area are observed, depending on the opening of the valve. Half-open valves result in higher pressure and flow velocity. As a result, the SPL of the discharge noise also rises. Overall, these findings suggest that the key hydrodynamic factors affecting discharge noise characteristics in the spiral case region are pressure, pressure difference, flow velocity, and flow velocity difference.
3.2.2. Runner Outlet Area
Under the same operating conditions as the turbine, the water flow in the runner outlet area converges from the outer edge to the center of the runner, whereas the flow velocity below the gap between the runner lower ring and the runner chamber wall is larger (Figure 8 and Figure 9). Consequently, the flow velocity at the corresponding position between the runner blades heightens, and the flow velocity under the blade declines. The turbulent kinetic energy at the outer edge of the runner outlet area exhibits a gradient of decreasing trend to the center of the section.

Figure 8.
Flow field distribution of runner outlet plane in Condition 6 (SPL: 72.61 dB).

Figure 9.
Flow field distribution of runner outlet plane in Condition 6# (SPL: 80.28 dB).
Under different operating conditions, the flow field distribution law of the runner outlet area remains consistent. Similar to the spiral case area, the flow field pressure, pressure difference, flow velocity, and velocity difference of the runner outlet area greatly differ under varying valve openings. The flow turbulence in this area is intense under the semi-open valve, and the SPL of the discharge noise is high. This finding suggests that the key hydrodynamic factors that affect the discharge noise characteristics of the runner outlet area are pressure, pressure difference, flow velocity, and flow velocity difference.
3.3. Correlation Analysis
Through the analysis of the key hydrodynamic factors that affect the discharge noise in different regions of the turbine, the hydrodynamic factors of the flow passage and their distribution greatly affect the discharge noise. To determine the influence of different hydrodynamic factors on the characteristic value of the discharge noise and their relationship, the Pearson product–moment correlation coefficient is used to identify the relationship between the hydrodynamic factors and the noise characteristic values.
3.3.1. SPL
Through the analysis of the hydrodynamic characteristics of the flow field under different working conditions, differences in the flow velocity, pressure, turbulent kinetic energy, vorticity, fluctuation pressure, and its distribution gradient have been noted. The correlation matrix between the main hydrodynamic factors at the pressure fluctuation monitoring point and the SPL of the discharge noise is established. The key factors that affect the discharge noise are obtained by calculating the correlation coefficient among different hydrodynamic factors and the SPL of the noise.
According to the correlation diagram (Figure 10) between SPL and hydrodynamic factors, the SPL at the volute inlet and runner outlet has a significant correlation with the mean fluctuating pressure and pressure. The SPL of the discharge noise at the spiral case inlet is positively correlated with the mean fluctuating pressure and pressure. Conversely, the SPL at the runner outlet is negatively correlated with these two hydrodynamic factors due to the negative pressure phenomenon occurring at the runner outlet. Different from the spiral case inlet area, the SPL at the runner outlet exhibits a significant positive correlation with the fluctuating pressure amplitude and the flow velocity in this area. The analysis reasons are as follows: the flow state in the spiral case inlet area is relatively smooth, and the pressure does not pulsate significantly. However, due to the consumption of water energy and the directional rotation of the runner, the hydrodynamic factors in the runner outlet vary greatly. The greater the fluctuating pressure amplitude and velocity, the more pronounced the interaction between the flow beam and the edge wall, resulting in an increase in the SPL of the discharge noise.
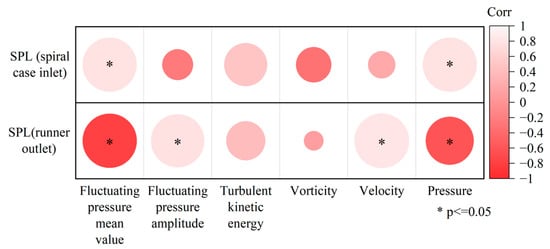
Figure 10.
Correlation between SPL and hydrodynamic factors.
3.3.2. Main Frequency
The same method is used to identify the key hydrodynamic factors affecting the main frequency of the discharge noise. It is found that the relationship between the main frequency of the discharge noise and the hydrodynamic factors differs from that of the SPL (Figure 11). The main frequency of the discharge noise in the spiral case inlet area is negatively correlated with the mean fluctuating pressure and pressure, and the main frequency of the runner outlet area is significantly positively correlated with these. The dominant frequency is significantly negatively correlated with fluctuating pressure amplitude, turbulent kinetic energy, and flow velocity. With the decrease in the mean fluctuating pressure and pressure in the runner outlet area, the fluctuating pressure amplitude, turbulent kinetic energy, and flow velocity increase continuously, indicating that the turbine’ operation is more unstable. The unit operates under unfavorable hydraulic conditions. At this time, the SPL in this area increases, and the water flow is prone to form low-frequency vibration, which may affect the operational safety of the unit.
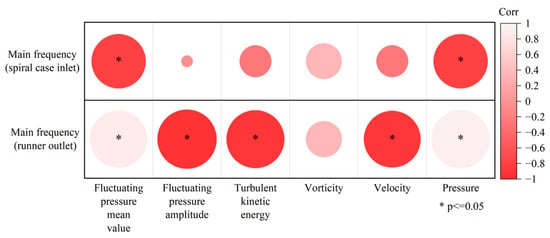
Figure 11.
Correlation between main frequency and hydrodynamic factors.
According to the correlation analysis, it is found that both the SPL and the main frequency of the discharge noise are significantly correlated with the mean fluctuating pressure and pressure. Thus, it can be concluded that the mean fluctuating pressure and pressure are the key hydrodynamic factors affecting the discharge noise characteristics. Moreover, the study found that the discharge noise characteristics in the runner outlet area are significantly correlated with multiple hydrodynamic factors, and there is a certain correlation between the hydrodynamic factors (Figure 12), indicating that the discharge noise characteristics in the runner outlet area are the result of the interaction of multiple hydrodynamic factors.
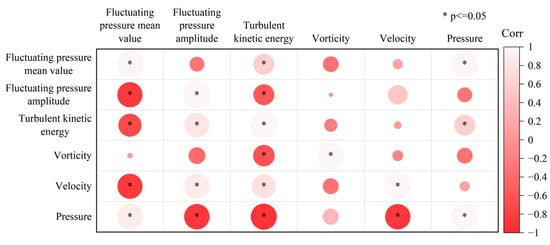
Figure 12.
Correlation of hydrodynamic factors (the upper triangular matrix of the figure is the correlation of the hydrodynamic factors of the measuring points at the volute inlet, and the lower triangular matrix is the correlation of the hydrodynamic factors of the measuring points at the runner outlet).
3.4. Discussion: Differences between Models and Field Measurements
This study monitors the discharge noise of Francis turbine passage in a large hydropower station in China. The location of acoustic monitoring measuring points is limited by the internal arrangement of the hydropower station and the outsourced concrete of the turbine passage. To minimize the influence of a large volume of concrete on the measurement results, the discharge noise was measured at the manhole of the spiral casing and conical pipe of the No.4 unit of the power plant (operating conditions of the unit: operating head: 94.4 m; guide vane opening degree: 54.6%; output: 677.9 MW). The results show that the noise SPL at the two measurement points is greater than 90 dB. Furthermore, the sound pressure amplitude at the manhole of the conical pipe is greater than that at the manhole of the spiral case, which is consistent with the trend of the experimental results. Both of these findings demonstrate that the region is the primary source area of the passage. In terms of noise frequency, the field measurement of the discharge noise frequency within 0–5000 Hz revealed a wider range of frequencies, with the main frequency band of the noise signal being 0–200 Hz. In comparison, the measurement point at the manhole of conical pipe exhibited a stronger signal characteristic in the high-frequency band. The noise signal collected by field measurement is different from the model experiment, which contains more noise signal samples, and electromagnetic noise and mechanical noise will also be generated during the operation of the unit, resulting in different signal characteristics. In this paper, the model experiment is used to study the discharge noise, although the model experiment has certain differences compared with the field measurement results, and the model experiment results can be corrected in the subsequent study, and the corresponding accurate results can be obtained.
4. Conclusions
This study analyses the results of hydrodynamic numerical simulations and experimental monitoring results for discharge noise in the model turbine passage under various operating conditions. It examines the correlation between discharge noise and hydrodynamic characteristics in distinct regions of the turbine passage, identifying the key factors that affect discharge noise characteristics.
(1) In the power generation discharge process, the flow field characteristics of the turbine passage are greatly affected by the operating head and the discharge. When the water flows through different regions, a large number of vortices of different scales forms easily. Among them, the water flow in the spiral case and draft tube area forms a large-scale vortex, which causes low-frequency pressure fluctuation, generates high-decibel discharge noise, and poses a certain threat to the safe operation of the hydropower station.
(2) The discharge noise of the turbine passage shows the characteristics of wide frequency (frequency range 0–3500 Hz) and high SPL (i.e., exceeding environmental noise standards). The runner area corresponds to the core area of water energy conversion. The amplitude fluctuation of sound signal and fluctuation pressure in the runner outlet area is greater than that in the spiral case inlet area. This finding shows that the runner area is the main sound source area of the turbine passage. The SPL and main frequency under different operating conditions are remarkably different, showing a strong sensitivity to the operating parameters of the turbine. As verified, the discharge noise is a reliable signal source for monitoring the running state of the turbine passage.
(3) Under different operating conditions, the SPL in the spiral case inlet area and runner outlet area is greater than 69 dB, which exceeds the allowable noise value of the environment and causes noise pollution. The SPL and main frequency of the discharge noise in the turbine passage relate to the hydrodynamic factors of the flow field. In particular, the mean fluctuating pressure and pressure have a strong correlation with the SPL and main frequency of the discharge noise. Thus, mean fluctuation pressure and pressure are important hydrodynamic factors that affect discharge noise.
5. Discussion and Future Prospects
Consistent with previous research, the correlation between mean fluctuation pressure and discharge noise has been determined. On this basis, this study also clarifies the correlation between the discharge noise characteristics in some areas and the hydrodynamic factors, such as flow velocity, pressure, turbulent kinetic energy, and vorticity, in the flow field. Considering that the research object of this paper is a model Francis turbine, its flow field characteristics and noise characteristics are different from those of large hydropower station turbines. Therefore, the research results of this study also have certain limitations. Although the signals collected in the laboratory are filtered and denoised, the influence of pump noise and laboratory wall surface in the experimental environment cannot be eliminated. The influence exists in the process of the experiment, and the main research content is the correlation between the discharge noise and the flow field under different working conditions, so the influence can be ignored. In subsequent research, the noise can be further separated and the interference of other noise on the experimental results can be removed. Furthermore, the discharge noise characteristics show a certain correlation with multiple hydrodynamic factors, indicating that the discharge noise characteristics are the results of the combined action of multiple hydrodynamic factors in the flow field. In future research, in-depth research can be performed in this direction, and the correlation function relationship between the characteristic value of discharge noise and the characteristic value of the flow field can be established, thereby providing a theoretical basis for reducing the discharge noise pollution from the noise source and using the discharge noise to feedback and monitor the flow pattern inside the turbine passage and the operation safety of the hydropower station.
Author Contributions
M.S. conducted the experiments, processed the data, and wrote the main manuscript. Y.W. and X.L. supervised the experiments and revised the manuscript. All authors have read and agreed to the published version of the manuscript.
Funding
This research was funded by the Open Research Found of Hubei Technology Innovation Center for Smart Hydropower (1523020038), and the National Natural Science Foundation of China (52279070).
Data Availability Statement
Data is contained within the article.
Conflicts of Interest
The authors declare no conflicts of interest.
References
- Dao, F.; Zeng, Y.; Zou, Y.D.; Li, X.; Qian, J. Acoustic vibration approach for detecting faults in hydroelectric units: A review. Energies 2021, 14, 7840. [Google Scholar] [CrossRef]
- Kang, Y.Z.; Feng, C.; Liu, L.Z.; Gao, S.; Cang, Y. Comparison of three kinds of sensors used to identify the incipient cavitation. Sens. Rev. 2018, 38, 13–20. [Google Scholar] [CrossRef]
- Wang, H.; Wu, C.; Zou, G.; Lu, W.; Chu, F.; Chen, Z.; Zhu, J.; Ren, J.; Chen, W. Acoustic fault diagnosis technology research and application in hydraulic turbine. Large Electr. Mach. Hydraul. Turbine 2010, 31, 45–50+54. [Google Scholar]
- Du, S. Turkish Ganran hydropower station turbine abnormal noise problem analysis and treatment. Mech. Electr. Tech. Hydropower Stn. 2014, 37, 58–59+62. [Google Scholar] [CrossRef]
- Yang, J.; Zhao, K.; Li, L.; Wu, P. Analysis on the causes of units 7 and 9 accidents at Sayano-Shushenskaya hydropower station. J. Hydroelectr. Eng. 2011, 30, 226–234. [Google Scholar]
- Kurzin, V.B.; Seleznev, V.S. Mechanism of emergence of intense vibrations of turbines on the Sayano-Shushensk hydro power plant. J. Appl. Mech. Tech. Phys. 2010, 51, 590–597. [Google Scholar] [CrossRef]
- Pan, L.; An, X.; Zhou, Y. Multi-dimension health assessment and diagnosis of hydropower unit based on big data. J. Hydraul. Eng. 2018, 49, 1178–1186. [Google Scholar] [CrossRef]
- Dong, L.; Dai, C.; Lin, H.B.; Chen, Y.P. Noise comparison of centrifugal pump operating in pump and turbine mode. J. Cent. South. Univ. 2018, 25, 2733–2753. [Google Scholar] [CrossRef]
- Dong, L.; Dai, C.; Liu, H.L.; Kong, F.Y. Experimental and numerical investigation of interior flow-induced noise in pump as turbine. J. Vibroeng 2016, 18, 3383–3396. [Google Scholar] [CrossRef][Green Version]
- Guo, C.; Gao, M.; He, S.Y. A review of the flow-Induced noise study for centrifugal pumps. Appl. Sci. 2020, 10, 1022. [Google Scholar] [CrossRef]
- Zheng, Y.; Chen, Y.; Mao, X.; Wang, H.; Shi, W.; Kan, K.; Zhang, Y. Pressure pulsation characteristics and its impact on flow-induced noise in mixed-flow pump. Trans. Chin. Soc. Agric. Eng. 2015, 31, 67–73. [Google Scholar]
- Mao, X.; Sun, A.; Pavesi, G.; Zheng, Y.; Ge, X. Simulation of flow induced noise in process of pump-turbine load rejection. Trans. Chin. Soc. Agric. Eng. 2018, 34, 52–58. [Google Scholar]
- Kang, Z.Y.; Feng, C.; Liu, Z.L.; Cang, Y.; Gao, S. Analysis of the incipient cavitation noise signal characteristics of hydroturbine. Appl. Acoust. 2017, 127, 118–125. [Google Scholar] [CrossRef]
- Valentín, D.; Presas, A.; Egusquiza, M.; Valero, C.; Egusquiza, E. Transmission of high frequency vibrations in rotating systems. application to cavitation detection in hydraulic turbines. Appl. Sci. 2018, 8, 451. [Google Scholar] [CrossRef]
- Yan, P.; Yu, F.; Zeng, Y.; Li, Z.; Geng, Z.; An, B. Numerical simulation of hydroacoustic characteristics of mixed-flow turbine. Water Power 2023, 49, 57–61. [Google Scholar]
- Lu, L.; Zhang, L.D.; Yang, J.; Zhou, L.; Xu, Z.J. Cause research about vibration and noise caused by channel vortices at high load in Francis turbine. In Proceedings of the 3rd International Conference on Energy, Environment and Sustainable Development, EESD 2013, Shanghai, China, 12–13 November 2013; pp. 1569–1573. [Google Scholar]
- Wang, H.; Zheng, Y.; Sun, A.; Zhang, F.; Gao, C.; Zhou, Y. The influence of guide vane opening on pressure pulsation characteristics and flow-induced noise in Francis turbine. South-North. Water Transf. Water Sci. Technol. 2018, 16, 186–192. [Google Scholar] [CrossRef]
- Liu, J. Horizontal Francis Turbine Simulation of Flow Characteristics and Noise Analysis. Master’s Thesis, Kunming University of Science and Technology, Kunming, China, 2016. [Google Scholar]
- Wu, D. Study on Acoustics based Condition Monitoring Technique of Hydro Turbines. Ph.D. Thesis, Huazhong University of Science and Technology, Wuhan, China, 2008. [Google Scholar]
- Hu, Z. The Generation Mechanism of Water Flow Noise in Stilling Pool and Influencing Factors of the Research. Ph.D. Thesis, Shenyang Agricultural University, Shenyang, China, 2016. [Google Scholar]
- Wang, F. Application of CFD to turbulent flow analysis and performance prediction in hydraulic machinery. J. China Agric. Univ. 2005, 10, 75–80. [Google Scholar]
- Su, W.T.; Li, X.B.; Li, F.C.; Wei, X.Z.; Han, W.F.; Liu, S.H. Experimental investigation on the characteristics of hydrodynamic stabilities in francis hydroturbine models. Adv. Mech. Eng. 2014, 2014, 486821. [Google Scholar] [CrossRef]
- Li, J.; Yu, J.; Wu, Y. 3D unsteady turbulent simulations of transients of the Francis turbine. In Proceedings of the 25th IAHR Symposium on Hydraulic Machinery and Systems, Timisoara, Romania, 20–24 September 2010. [Google Scholar]
- Zhou, X.; Wu, Y. Study of similarities for fluid-dynamic noise. Acta Acust. 2002, 27, 373–378. [Google Scholar] [CrossRef]
- Amini, A.; Vagnoni, E.; Favrel, A.; Yamaishi, K.; Müller, A.; Avellan, F. Upper part-load instability in a reduced-scale Francis turbine: An experimental study. Exp. Fluids 2023, 64, 110. [Google Scholar] [CrossRef]
Disclaimer/Publisher’s Note: The statements, opinions and data contained in all publications are solely those of the individual author(s) and contributor(s) and not of MDPI and/or the editor(s). MDPI and/or the editor(s) disclaim responsibility for any injury to people or property resulting from any ideas, methods, instructions or products referred to in the content. |
© 2024 by the authors. Licensee MDPI, Basel, Switzerland. This article is an open access article distributed under the terms and conditions of the Creative Commons Attribution (CC BY) license (https://creativecommons.org/licenses/by/4.0/).