Abstract
Copper is an essential element in living organisms and is crucial in marine ecosystems. However, excessive concentrations can lead to seawater pollution and pose a risk of toxicity to marine organisms, as it is a heavy metal. In addition, it can enter the human body through the food chain, potentially endangering human health. Consequently, there is increasing focus on the rapid and highly sensitive detection of copper ions (Cu2+). We prepared a graphite carbon electrode modified with graphitised multi-walled carbon nanotubes/copper(II) ion carrier IV (GMWCNT/copper(II) ion carrier IV/glassy carbon electrode (GCE)) using a drop-coating method. Scanning electron microscopy (SEM) analysis revealed that the composite material film possessed a large surface area. Incorporating this composite material significantly enhanced the adsorption capacity for ions on the electrode surface and greatly improved conductivity. Differential pulse anodic stripping voltammetry (DPASV) was employed to quantify copper levels in seawater. Under optimal experimental conditions, a strong linear relationship was observed between the Cu2+ response peak current and its concentration within a range of 50–500 µg L−1, with a correlation coefficient of 0.996. The GMWCNT/copper(II) ion carrier IV/GCE exhibited excellent stability and reproducibility, achieving a low detection limit for Cu2+ at 0.74 µg L−1 when applied to copper detection in seawater. Furthermore, spiked recovery rates ranging from 98.6% to 102.8% demonstrated the method’s high sensitivity, convenient operation, and practical value for real-world applications in detecting Cu2+ levels in seawater.
1. Introduction
Copper is one of the essential trace elements with crucial functions in the biological activities of living organisms. It is vital for maintaining normal haematopoietic function, preserving the integrity of the central nervous system, promoting the health of bones, vasculature, and skin, and participating in the body’s antioxidant processes [1]. Despite its role as a micronutrient, excessive copper intake can lead to necrotising hepatitis, haemolytic anaemia, and kidney problems [2,3], potentially resulting in diseases such as Alzheimer’s disease and cardiomyopathy [4]. The direct exposure of marine organisms to copper ions can lead to bioaccumulation, posing a threat to human safety. For instance, oysters with a strong capacity to accumulate copper can exhibit a ‘blue oyster’ phenomenon, where their meat turns blue due to excessive copper content [5,6]. Human activities, including seawater aquaculture, ship transportation, sewage discharge, and coastal engineering, are significant sources of heavy metals in marine environments [7,8]. Because copper is an essential element, the right amount of copper is beneficial to human health, and copper can be deposited in the body, metabolised, and eliminated, so from ancient times to the present, people have often used copper containers or utensils. According to World Health Organization (WHO) standards [9], the copper content in drinking water should not exceed 2.0 mg·L−1; however, Chinese drinking water regulations set this limit at 1.0 mg·L−1 [10]. At the same time, water in nature is more complex. In China, the copper requirements for environmental standards and drinking water standards are not the same; environmental standards can be even more stringent. This is because copper in the environment, if the concentration is more than 0.5 mg·L−1 and the PH is greater than 7, will occur in natural precipitation, in mud enriched with a lot of copper hydroxide or copper oxides, in acid rain, and in other conditions. It is easy to suddenly release a large amount of copper, which results in drinking water safety problems. At the same time, as sewage is discharged into natural water bodies and the water ecological environment in which natural water bodies are located is relatively sensitive to heavy metals, if the concentration of copper is too high, it will affect the normal growth and reproduction of aquatic organisms, thus destroying the balance of water ecology. Chinese regulations also require industrial enterprises to limit their pollutant emissions by keeping the concentration of copper below 1.0 mg·L−1, while fisheries’ water quality standards demand copper levels be lower than 0.01 mg·L−1. Therefore, accurately determining copper ions with high sensitivity and precision in seawater is imperative.
Currently, commonly used methods for copper ion detection include atomic absorption spectroscopy (AAS) [11], atomic fluorescence spectroscopy (AFS) [12], high-performance liquid chromatography (HPLC) [13], inductively coupled plasma (ICP) [14], and ultraviolet spectrophotometry [15]. Although these detection methods are accurate and effective, their high costs, complex pre-treatment procedures, bulky instrument sizes, and reliance on specialised personnel limit their widespread application. In contrast, electrochemical analysis [16] has emerged as a significant technique for heavy metal detection due to its environmental friendliness, simplicity, ease of integration and miniaturisation, [17,18] and capability for real-time monitoring without being restricted to laboratory settings. Electrochemical dissolution voltammetry has proven effective in quickly detecting copper ions in natural aqueous environments [19]. Graphitised multi-walled carbon nanotubes (GMWCNTs) are considered ideal electrode modification materials due to their low cost, large specific surface area, high conductivity, and chemical stability [20] and have been applied in various detection applications [21,22]. Previous studies have used GMWCNTs to detect copper ions [23,24]. Copper(II) ion carrier IV [25] reacts with copper ions to create binding sites, forming stable complexes for accurate detection and analysis.
This study investigates the fabrication of a composite film-modified GCE by dissolving copper(II) ion carrier IV and GMWCNT materials in a DMF solution using the drop-coating method aimed at preparing a GMWCNT/copper(II) ion carrier IV/GCE. The developed GMWCNT/copper(II) ion carrier IV/GCE, based on differential pulse anodic stripping voltammetry (DPASV), enables the rapid and highly sensitive detection of copper ions in nearshore seawater.
2. Experimental Procedures and Materials
2.1. Relevant Instruments and Reagents
The CHI830D electrochemical workstation (Shanghai, China), FA224 electronic analytical balance (Shanghai Hai lichen Instrument Technology), JP-040s ultrasonic cleaner (Shenzhen Jianmeng Ultrasonic Instrument), LC-LX-H165A high-speed centrifuge (Shanghai Hai lichen Instrument Technology), DHG-101 electric blast drying oven (Shanghai Changyi Instrument Equipment), TESCAN MIRA LMS high-resolution scanning electron microscope (TESCAN Limited, Czech Republic), and PLUSE2-5TH ultra-pure water system (Nanjing Easy Pure Tech Development) were utilised in this study.
Graphitised multi-walled carbon nanotubes (purity ≥ 99.9%, Shanghai Aladdin Biochemical Technology) were employed. The copper(II) ion carrier (Kereskedelmi reagensek, purity 98%, Tianjin Xian Si Apure Technology), dimethylformamide (DMF) (purity ≥ 99.8%, Shanghai Aladdin Biochemical Technology), K3[Fe(CN)6] (purity ≥ 99.5%), and copper ion standard solution (concentration 1 mg/mL, National Nonferrous Metals and Electronic Materials Analysis Testing Center) were used as materials of analytical or superior purity grade. Ultra-pure water with a resistivity of 18.0 MΩ·cm was utilised in the experiment. The seawater samples for the spiked recovery experiments were collected from lakes near Beibu Gulf University, originating from waters close to the Maotai Sea.
2.2. Preparation of Modification Solution
GMWCNTs were precisely weighed at 20 mg using an electronic analytical balance and transferred into a 25 mL round-bottom flask. They were then dissolved in 5 mL of DMF solution and subjected to ultrasonic dispersion for 1 h to obtain a homogeneous GMWCNT solution.
2.3. Preparation of Modified Electrode
First, 5 mg of copper(II) ion carrier IV was accurately weighed using an electronic analytical balance and added to the GMWCNT solution. Ultrasonic dispersion was conducted for 2 h to obtain a uniform composite solution with a concentration of 5.0 mg·L−1.
The GCE (diameter Φ = 3 mm) was polished using alumina powder (1.0 µm, 0.3 µm and 50 nm) on a polishing cloth until the surface achieved a bright finish. Subsequently, the GCE was rinsed with ultra-pure water and dried at room temperature to prevent adsorption on the electrode surface. Finally, cyclic voltammetry (CV) scanning of the activated GCE in a 0.1 mol L−1 potassium ferricyanide solution was performed, setting potential parameters from −0.2 V to +0.2 V until a complete overlap of curves occurred, indicating the completion of the electrode activation process.
2.4. Experimental Measurement
The detection of Cu2+ was performed using constant-potential deposition and differential pulse voltammetry techniques. Initially, a sodium acetate buffer solution with a pH of 4.5 (0.1 mol L−1 HAc-NaAc) was prepared, and the standard copper ion solution was diluted to various concentrations using the HAc-NaAc buffer. A three-electrode system was employed at room temperature, consisting of a glass carbon electrode as the working electrode, a saturated mercury chloride (Hg/HgCl) electrode as the counter electrode, and a platinum wire electrode as the reference electrode. The GMWCNT/copper(II) ion carrier IV/GC composite-modified electrodes were also utilised for the potentiostatic deposition and enrichment of Cu2+. The deposition process involved applying a potential of −1.1 V for 300 s.
For differential pulse voltammetry (DPV) analysis, the scanning potential range was set from −0.3 V to 0.1 V with an increment of 50 mV per step, with the frequency set at 25 Hz, the amplitude at 5 mV, and the rest time at 2 s between each scan cycle. Subsequently, differential pulse voltammograms were recorded for different concentrations of Cu2+, enabling the construction of linear calibration curves and the determination of the detection limit. See Figure 1.
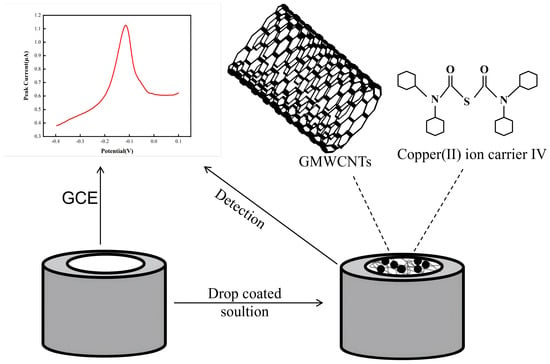
Figure 1.
Schematic diagram of detection mechanism.
3. Results and Discussion
3.1. Morphological and Electrochemical Characterisation of the Modified Materials
The morphological characteristics of GMWCNTs and the GMWCNT/copper(II) ion carrier IV composite materials were observed using scanning electron microscopy (SEM). In the modified GMWCNT/copper(II) ion carrier IV/GCE system, GMWCNTs enhance conductivity, while copper(II) ion carrier IV provides specific channels for Cu2+. At amplification factors of Mag = 1 kx and Mag = 5 kx, Figure 2 shows the microstructure of GMWCNTs with numerous surface voids, thereby increasing the specific surface area of the nanocomposite material. Figure 3 demonstrates the microstructure of GMWCNTs/copper(II) ion carrier IV, where the copper(II) ion carrier IV particles are clearly embedded in the voids and on the surface of the GMWCNTs, indicating the successful formation of a composite between them.
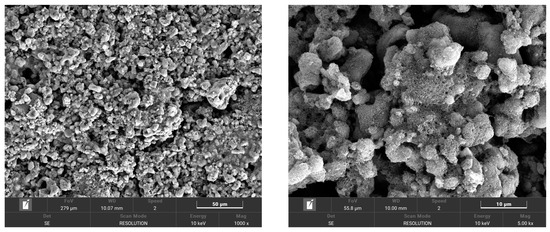
Figure 2.
SEM images of the GMWCNT materials.
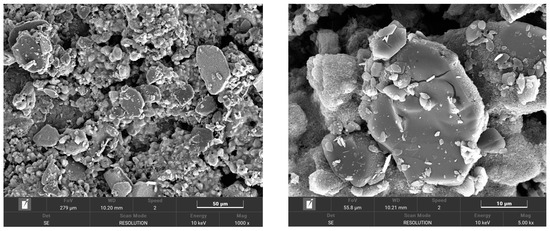
Figure 3.
SEM images of the GMWCNT/copper(II) ion carrier IV composite material.
Comparing Figure 2 and Figure 3, it can be observed that the GMWCNT/copper(II) ion carrier IV/GCE composites exhibit a more uniform distribution and a more stable structure at the same magnification. The larger specific surface area provided more rapid electron transfer channels between the electrode and electrolyte, facilitating electron transfer and increasing the electroactive sites for the electrode reaction, thus greatly improving the detection sensitivity.
The CV curves of the modified electrode and the bare electrode In a 0.1 M potassium ferricyanide solution are presented in Figure 4. A comparison reveals that the peak current value of the bare electrode is significantly lower than that of the GMWCNT/copper(II) ion carrier IV-modified electrode. This difference is attributed to two main factors: First, GMWCNTs possess a high specific surface area and excellent electrical conductivity, enhancing their ion adsorption capacity. Second, GMWCNTs exhibit exceptional electron transport characteristics with a high electron transfer rate, resulting in an efficient electron transport channel on the electrode surface and accelerating the corresponding reactions.
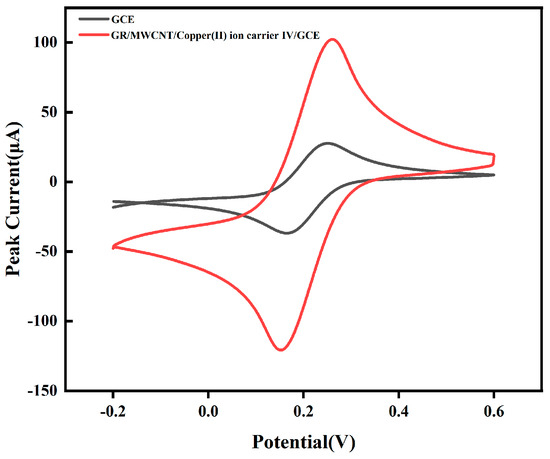
Figure 4.
The cyclic voltammetric curve of various electrodes in 0.1 mol L−1 potassium ferricyanide solution.
In order to detect the electrochemical activity of the modified electrode, GMWCNTs/copper(II) ion carrier IV was investigated for cycling in 0.1 mol L−1 potassium ferricyanide solution, and Figure 5 shows the 1st, 15th, and 20th cycles of the GMWCNTs/copper(II) ion carrier IV. It is obvious from the figure that the electrochemical activity of the GMWCNTs/copper(II) ion carrier IV increased significantly from the 1st cycle to the 15th cycle and finally stabilised at the 20th cycle.
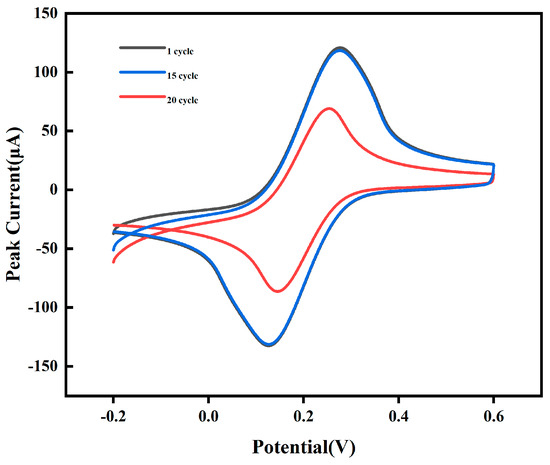
Figure 5.
CV curves of the GMWCNT/copper(II) ion carrier IV/GCE in 0.1 mol L−1 potassium ferricyanide solution at various cycles.
Electrodes can be categorised based on their involvement in surface-controlled or diffusion-controlled processes during electrochemical reactions. To examine the surface characteristics of modified electrodes, the GMWCNT/copper(II) ion carrier IV/GCE was immersed in a 0.1 mol L−1 potassium ferricyanide solution, and CV tests were conducted at various scan rates (scanning speeds of 10 mv/s, 20 mv/s, 30 mv/s, 40 mv/s, 50 mv/s). The resultant CV curve, as shown in Figure 6a, illustrates that an increase in the scan rate led to an increase in the peak current (Ip), which exhibited a linear relationship with the square root of the scan rate (V1/2), as depicted in Figure 6b. This behaviour indicates that the GMWCNT/copper(II) ion carrier IV/GCE operates under diffusion control.
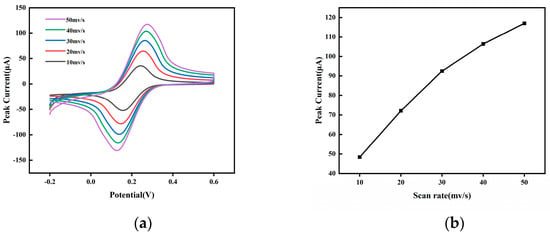
Figure 6.
(a) CV responses of GMWCNT/copper(II) ion carrier IV/GCE at various scan rates in 0.1 mol L−1 potassium ferricyanide solution. (b) Standard curve relating peak current to scan rate.
3.2. Comparative Analysis of Detection Performance Exhibited by Diversely Modified Electrodes
In order to investigate the effect of different materials on the response to Cu(II) by comparing the response strengths of four different electrodes, i.e., GCE, GR/GCE, GMWCNTs/GCE, and GMWCNTs/copper(II) ion carrier IV/GCECu2+ signals (Figure 7), by using differential pulse voltammetry (DPSV), we observed that all four electrodes exhibited improved peak shape and higher peak currents near −0.1 V, corresponding to the peak Cu2+ dissolution potential. Notably, the dissolution currents at the GMWCNT/GCE were significantly higher than those at the GC and GR/GC microelectrodes. This enhancement is attributed to the large specific surface area of GR and MWCNTs, which favours the adsorption of metal ions, and the strong adsorption force generated by the π-π-conjugated structure, which effectively enhances the enrichment of Cu2+.
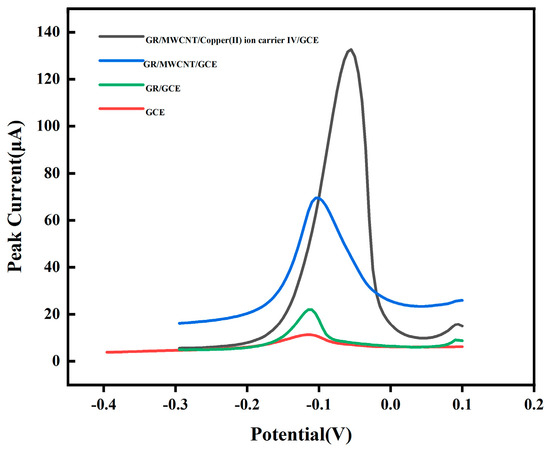
Figure 7.
DPSV plot of different electrodes in a sodium acetate solution containing 500 μg L−1 of Cu2+.
Compared to the GMWCNT/GCE, the response signal of Cu2+ was the strongest on the GMWCNT/Cu(II) ion carrier IV/GC-modified electrode, which showed a higher peak dissolution current on the GMWCNT/Cu(II) ion carrier IV/GC microelectrode, which also indicated that the modified electrode had superior electrochemical performance in terms of detection. This superior performance can be attributed to the specific channel provided by copper(II) ion carrier IV for Cu2+ and its ability to increase the electrode surface transport rate. The results show that the copper ion selectively-enhanced nanocomposite film-modified microelectrodes have good selectivity and sensitivity.
3.3. Optimisation of Experimental Conditions
3.3.1. Effect of Deposition Potential and Time
Dissolution voltammetry involves two key electrochemical steps: an electrolytic enrichment process and an electrolytic dissolution process. During electrolytic enrichment, a limiting voltage is applied to the working electrode, reducing heavy metal ions into metallic elements, which are then deposited onto the surface of the modified electrode. The electrolytic dissolution step involves applying a range of scanning voltages to the deposited modified electrode, resulting in the oxidation of the metallic element back into its ion valence state and subsequent dissolution into the electrolyte solution. Throughout this redox reaction process, electron migration generates an electric current, enabling the detection of changes in electrical signals on the surface of the modified electrode. Notably, both the deposition potential and deposition time significantly influence the peak current.
Therefore, given the impact of the enrichment potential on the efficiency of the enrichment process, optimising the enrichment potential is crucial for expediting the enrichment of target metal ions and enhancing the accuracy of Cu2+ detection. As depicted in Figure 8a, a continuous increase in the peak dissolution current is observed within a potential range of −0.5 V to −1.3 V, with the maximum peak current response achieved at −1.3 V. However, beyond −1.3 V, a decline in the peak dissolution current is observed due to hydrogen evolution on the modified electrode surface, which not only impedes Cu2+ deposition but also causes the enriched Cu2+ to detach from the surface. Between −1.4 V and −1.3 V, the electrodeposition reaction fails to provide sufficient electrochemical reduction for Cu2+. Thus, an optimal deposition potential of −1.3 V is determined.
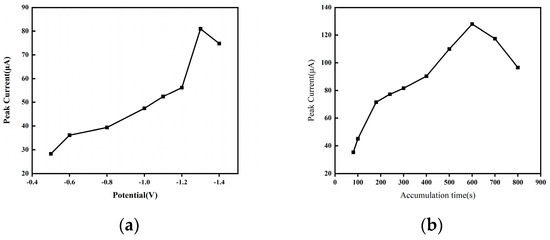
Figure 8.
(a) Effect of deposition potential on the Cu2+ response peak current. (b) Effect of deposition time on the Cu 2+ response peak current.
The adsorption capacity of the GMWCNT/copper(II) ion carrier IV/GC-modified electrode for Cu2+ increases until it reaches saturation. As shown in Figure 8b, the peak current rapidly increases with deposition time from 100 s to 600 s but does not further increase beyond this threshold. This phenomenon can be attributed to the prolonged enrichment time leading to the saturation of active sites on the modified electrode surface and the ‘hydrogen evolution’ reaction, which causes the detachment of deposited Cu2+. An optimal deposition time of 600 s was determined based on the experimental conditions and environmental factors.
3.3.2. Effect of Hac-NaAc Electrolyte PH
The dissolution voltammetric response of Cu2+ was significantly affected by the pH of the electrolyte. By measuring the DPSV curves of the GMWCNT/copper(II) ion carrier IV/GCE under different pH conditions, the experimental results are shown in Figure 9, where a sustained increase in current was observed in the pH range from 3.5 to 4.5; however, a significant decrease in peak current was observed at pH 4.5. This trend is mainly attributed to two factors: firstly, at too low a pH, the increased concentration of H⁺ ions in the buffer competes with the Cu2+ ions, leading to hydrogen precipitation and a decrease in the peak dissolution current. Secondly, hydrolysis at too high a pH leads to the formation of metal hydroxides from Cu2+, reducing its presence in the solution and thus affecting the detection ability of the Cu2+ sensor. Therefore, the optimal ambient pH to achieve accurate measurements is 4.5.
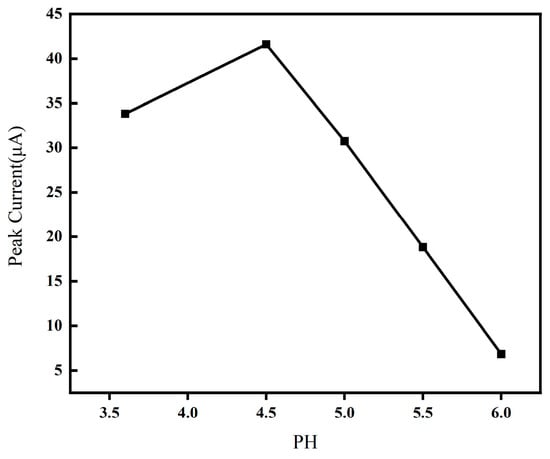
Figure 9.
Effects of different pH values.
3.3.3. Effect of Film Thickness
The effect of the film thicknesses of GMWCNTs/copper(II) ion carrier IV on the peak current response of Cu2+ was investigated in the range of 2~12 µL, as shown in Figure 10, where the horizontal coordinate indicates the film thickness in GMWCNT/copper(II) ion carrier IV/GCE composites and the vertical coordinate indicates the corresponding peak current. When the content is too low, it leads to an uneven dispersion of the active ingredient in the film. The increase in film thickness from 2 µL to 10 µL resulted in an increase in the peak current response value. The maximum peak current response was reached at a film thickness of 10 µL. However, a further increase in film thickness to 12 µL resulted in a gradual decrease in the peak current response. If the content was too high, too many proton transport channels would hinder Cu(II) transport and increase the resistance of Cu(II) transport, and the electron transfer hindrance caused by the insufficient adsorption capacity would make the reaction on the electrode surface more difficult, resulting in a decrease in peak current. Therefore, a film thickness of 10 µL was chosen for this experiment.
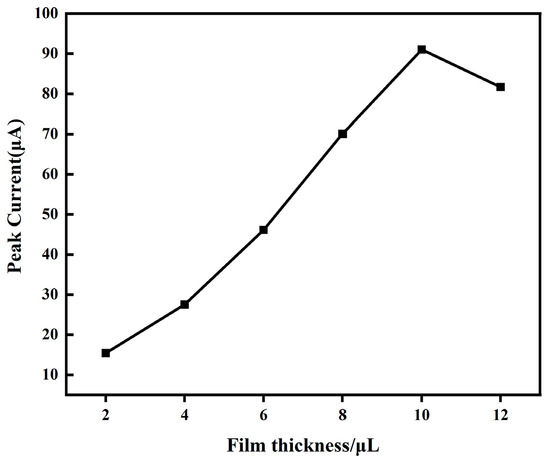
Figure 10.
Effect of the membrane thickness.
3.4. Standard Curve
Considering the experimental findings, the optimal deposition potential, deposition time, and other experimental parameters were established. DPV was utilised to detect various concentrations of Cu2+ using sensors. Figure 11a displays the DPV curves for detection concentrations ranging from 50 to 500 µg L−1, with each curve distinctly presented. As the concentration of copper (II) increases, the peak shifts to a higher potential. Figure 11b depicts the linear regression curve. The slope K, derived from the detection limit equation within the range of 50 µg L−1 to 500 µg L−1, is 0.194.
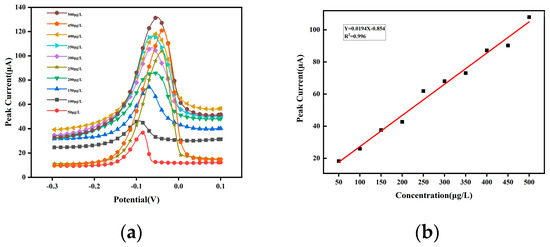
Figure 11.
(a) Plot of GMWCNT/copper(II) ion carrier IV/GCE Cu2+ at different concentrations (50 to 500 μg L−1); (b) corresponding linear regression curves.
The experimental data, illustrated in Figure 11b, yield the linear regression equation y = 0.194x + 7.886, where y represents the peak dissolution current and x denotes the concentration of Cu2+. The linear correlation coefficient R2 is 0.996, and the detection limit is determined to be 0.74 µg L−1, falling below the allowable limits for Cu2+ concentration in drinking water set by both WHO and China. These results demonstrate that the GMWCNT/copper(II) ion carrier IV/GCE exhibits outstanding electrochemical performance, high sensitivity, and a low detection limit in detecting Cu2+.
3.5. Stability and Reproducibility Analysis of Modified Electrode
Stability is a key factor in evaluating the practical applicability of sensors. To assess the stability of the GMWCNT/copper(II) ion carrier IV modification material, eight consecutive DPV experiments were performed in an HAc-NaAc buffer with a pH value of 4.5 and a Cu2+ concentration of 100 µg L−1. The results, depicted in Figure 12, show that the peak dissolution current across these eight DPV experiments exhibited a remarkably low relative standard deviation (RSD) of only 0.48%, demonstrating the exceptional stability of the modified material incorporating GMWCNTs/copper(II) ion carrier IV.
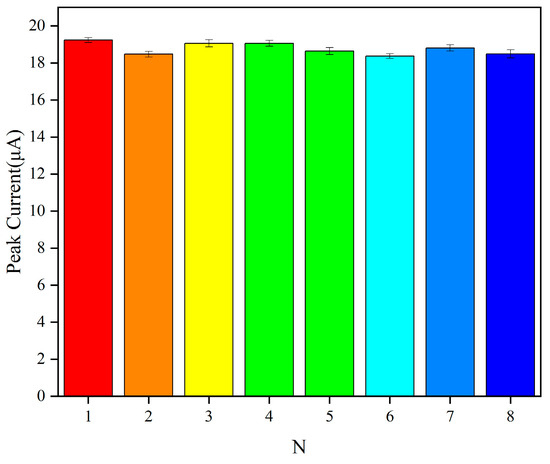
Figure 12.
Stability test results of the same modified electrode in 100 µg L−1 Cu2+ over eight consecutive measurements.
To further validate the stability of the GMWCNT/copper(II) ion carrier Ⅳ/GCE, the GMWCNT/copper(II) ion carrier Ⅳ/GCE was subjected to a DPSV assay in 0.1 mL−1 HAc-NaAc (pH = 4.5) buffer, and the Cu2+ concentration used was 27 µg L−1, which was determined continuously for 30 days (one week was used as a node to calculate the experimental data). The experimental results are shown in Figure 13. The calculated results showed that the variation in the peak current remained below 2.8%, further confirming the excellent stability of the GMWCNT/Cu(II) ion carrier IV/GCE.
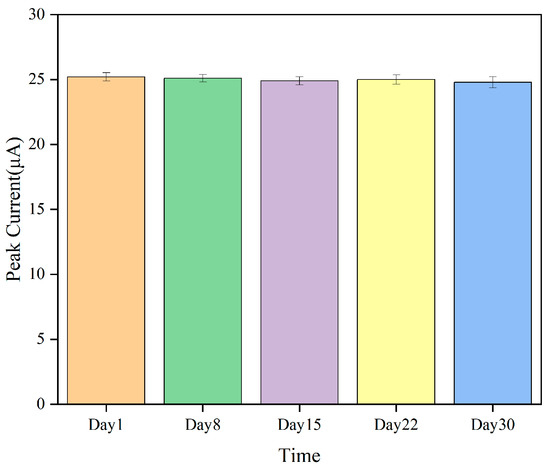
Figure 13.
Stability of GMWCNT/copper(II) ion carrier IV/GCE by 30-day continuous assay.
Five batches of GCE electrodes were modified using the same GMWCNTs/copper(II) ion carrier IV in HAc-NaAc buffer solution with a Cu2+ concentration of 150 µg L−1. Each modified electrode was subjected to a DPSV assay separately. The experimental results are shown in Figure 14. The Cu2+ detected by the modified electrodes had good reproducibility with an RSD of 4.79% based on the peak dissolution current obtained from five experiments.
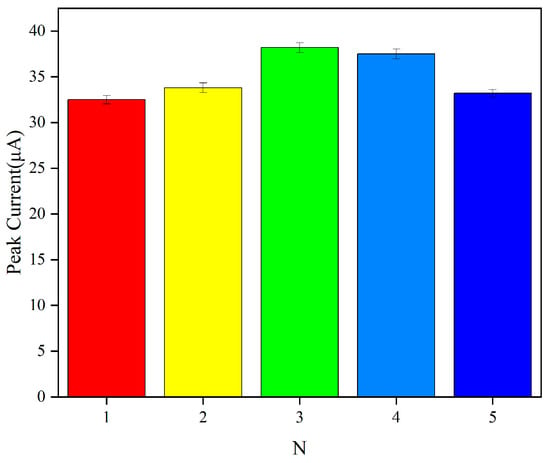
Figure 14.
Reproducibility of different modified electrodes in 150 μg L−1 Cu2+.
3.6. Electrochemical Characterisation of Modified Electrodes
In order to further analyse the electrochemical properties of the GMWCNT/copper(II) ion carrier Ⅳ/GCE, electrochemical impedance spectroscopy (EIS) was used to investigate the charge transfer process of the GCE, the GR/GCE, the GMWCNT/GCE, and the GMWCNT/copper(II) ion carrier Ⅳ/GCE in a 0.1 Mol KCl solution of 1 mMol K3[Fe(CN)6]. II) ion carrier Ⅳ/GCE, and the results are shown in Figure 15. The parameters were as follows: initial potential difference: 0.2 V; high frequency: 1 × 10⁵ Hz; low frequency: 0.1 Hz; amplitude: 0.05 V; and quiet time: 2 s. When the bare electrode (GCE) was compared with the GR/GCE, GMWCNT/GCE, and GMWCNT/copper(II) ion carrier Ⅳ/GCE, the semicircular diameter of the impedance curve was obviously the largest, while the semicircular diameter of the impedance curve of the GMWCNT/copper(Ⅱ) ion carrier Ⅳ/GCE was obviously reduced compared with that of the GR/GCE, indicating that the modified material has good conductivity and can accelerate the rate of electron transfer in the system; i.e., it has a smaller impedance. The radius of the GMWCNT/copper(Ⅱ) ion carrier Ⅳ/GCE is slightly reduced compared with that of the GMWCNT/GCE, and the GMWCNT/copper(II) ion carrier Ⅳ/GCE curve is relatively stable.
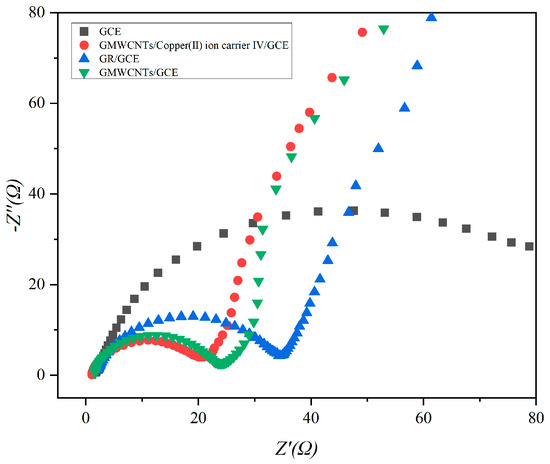
Figure 15.
Charge transfer processes of the GMWCNT/copper(II) ion carrier IV/GCE, GCE, GR/GCE, and GMWCNT/GCE in a 0.1 Mol KCl solution of 1 mMol K3[Fe(CN)6].
This is due to the fact that the introduction of copper(II) ion carrier IV has relatively little effect on the electron transfer process at the electrode interface, but the curves are relatively stable due to the properties of copper(II) ion carrier IV itself, showing better results. The results of the electrochemical impedance spectroscopy (EIS) analyses are in agreement with the cyclic voltammogram results.
3.7. Anti-Interference Ability
In order to evaluate the performance of the Cu(II) sensor in seawater base, the immunity of the sensor to Cu(II) detection was investigated by adding different interfering ions. Therefore, 100-fold concentrations of Zn(II), Cr(II), Pb(II), and Cd(II) interfering ions were added to the 50 μg-L−1 Cu(II) standard solution, respectively, and the results of the assay calculations are shown in Figure 16. The effects of these interfering ions on the changes in the peak currents of Cu(II) were all within 5%, which indicated that the GMWCNT/copper(II) ion carrier Ⅳ/GCE has better anti-interference ability.
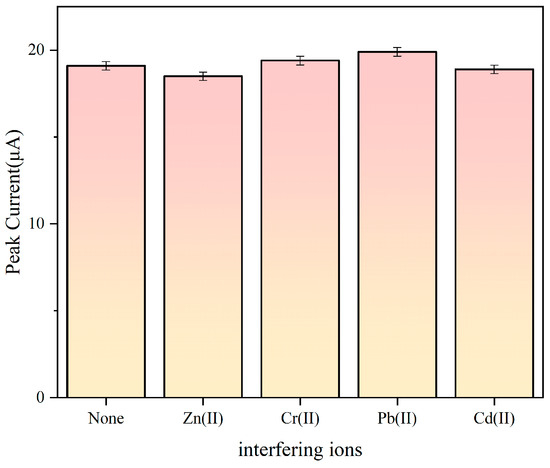
Figure 16.
Peak current of Cu(II) solution after the addition of a 100-fold concentration of Zn(II), Cr(II), Pb(II), and Cd(II) interfering ions.
3.8. Copper Content Analysis of Actual Samples
The water sample for this study was collected from the campus lake at Beibu Gulf University, sourced from the coastal waters of the Mawei Sea, and was of a mixed composition. After allowing the samples to settle for 48 h to precipitate impurities, the supernatant was filtered through a 0.45 µm filter membrane. A volume of 20 mL of the filtered water sample was taken for a standard recovery experiment. Table 1 shows that the concentration of Cu2+ in the actual water sample is significantly lower than the maximum permissible level set by regulatory authorities for drinking water quality. The experimental recoveries were found to be 98.6%, 101.5%, and 102.8%, respectively, indicating the high detection accuracy of our modified material sensor and its suitability for high-sensitivity analysis of real water samples.

Table 1.
Recovery rate of spikes.
4. Conclusions
In order to achieve rapid and highly sensitive detection of copper ions (Cu2+), this paper investigates the feasibility and rapid and highly sensitive properties of a GMWCNT/copper(II)ion carrier IV/GCE for the detection of copper ions. Firstly, the optimum conditions for the GMWCNT/copper(II) ion carrier IV/GCE and the GCE, GR/GCE, and GMWCNT/GCE were investigated experimentally, and the optimum conditions were established, including the selection of the electrolyte, the selection of pH, the selection of the deposition potential, the time, and the thickness of the film. Under the experimental optimum conditions, the GMWCNT/copper(II) ion carrier IV/GCE was used to test its stability, reproducibility, impedance, anti-interference, and immunity. The above experiments revealed that the GMWCNT/copper(II) ion carrier IV/GCE has feasibility, rapidity, and high sensitivity for the detection of copper ions.
The detection of copper ions in seawater was conducted using glass carbon electrodes modified with graphitised multi-wall carbon nanotubes and a copper ion carrier. Through experimental investigation, optimal conditions were established, including using a 0.1 mol L−1 sodium acetate buffer solution as the electrolyte and maintaining a pH of 4.5. The deposition potential and time were set at −1.3 V and 600 s, respectively, with the film thickness controlled at 10 µL. Under these optimised conditions, the reliable detection of Cu2+ within the range of 50 to 500 µg L−1 was achieved, with a detection limit as low as 0.74 µg L−1 being obtained. The application of this method to detect Cu2+ in seawater demonstrated excellent accuracy and sensitivity, with recovery rates ranging from 98.6% to 102.8%.
Author Contributions
Conceptualization, C.Z. and W.T.; Methodology, W.T., Y.G., H.H. and Z.Z.; Software, C.Z. and W.T.; Validation, Y.Z. and Y.G.; Formal analysis, C.Z.; Investigation, H.H. and Z.Z.; Resources, C.Q.; Data curation, W.T.; Writing—original draft, C.Z. and W.T.; Writing—review & editing, C.Z. and C.Q.; Visualization, Y.G.; Supervision, W.Q. and Y.Z.; Project administration, W.Q. and Y.Z.; Funding acquisition, C.Q. and W.Q. All authors have read and agreed to the published version of the manuscript.
Funding
Supported by the National Natural Science Foundation of China (No. 52161042), High-end Foreign Experts Introduction Program (G2022033007L), CSSC Guangxi Shipbuilding and Marine Engineering Technology Cooperation Project (ZCGXJSB20226300222-06), and Qinzhou Scientific Research and Technology Development Program (202116622).
Data Availability Statement
Data are contained within the article.
Conflicts of Interest
The authors declare no conflict of interest.
References
- Uauy, R.; Olivares, M.; Gonzalez, M. Essentiality of copper in humans. Nutr. Rev. 2010, 45, 176–180. [Google Scholar] [CrossRef] [PubMed]
- Fu, P.; Han, H.; Ye, B.; Ji, R.; Li, J.; Liu, A.; Li, S.; Yang, L.; Zhang, S. Trace element copper effects on human health. J. Prev. Med. Henan J. 2021, 32, 888–892. [Google Scholar]
- Xiang, S.; Liu, Y. Trace element copper and human physiological function and disease. Univ. Chem. 2022, 37, 2107128. (In Chinese) [Google Scholar]
- Grandis, D.J.; Nah, G.; Whitman, I.R.; Vittinghoff, E.; Dewland, T.A.; Olgin, J.E.; Marcus, G.M. Wilson’s disease and cardiac myopathy. Am. J. Cardiol. 2017, 120, 2056–2060. [Google Scholar] [CrossRef] [PubMed]
- Wang, W.X.; Yang, Y.; Guo, X.; He, M.; Guo, F.; Ke, C. Copper and zinc contamination in oysters: Subcellular distribution and detoxification. Environ. Toxicol. Chem. 2011, 30, 1767–1774. [Google Scholar] [CrossRef]
- Fung, C.N.; Lam, J.C.; Zheng, G.J.; Connell, D.W.; Monirith, I.; Tanabe, S.; Richardson, B.J.; Lam, P.K. Mussel-based monitoring of trace metal and organic contaminants along the east coast of China using Perna viridis and Mytilus edulis. Environ. Pollut. 2004, 127, 203–216. [Google Scholar] [CrossRef] [PubMed]
- Yin, S.; Wu, Y.; Xu, W.; Li, Y.; Shen, Z.; Feng, C. Contribution of the upper river, the estuarine region, and the adjacent sea to the heavy metal pollution in the Yangtze Estuary. Chemosphere 2016, 155, 564–572. [Google Scholar] [CrossRef] [PubMed]
- Christophoridis, C.; Bourliva, A.; Evgenakis, E.; Papadopoulou, L.; Fytianos, K. Effects of anthropogenic activities on the levels of heavy metals in marine surface sediments of the Thessaloniki Bay, Northern Greece: Spatial distribution, sources and contamination assessment. Microchem. J. 2019, 149, 104001. [Google Scholar] [CrossRef]
- Fernandez-Luqueno, F.; Lopez-Valdez, F.; Gamero-Melo, P.; Luna-Suarez, S.; Aguilera-Gonzalez, E.N.; Martínez, A.I.; García-Guillermo, M.D.; Hernandez-Martinez, G.; Herrera-Mendoza, R.; Álvarez-Garza, M.A.; et al. Heavy metal pollution in drinking water-a global risk for human health: A review. Afr. J. Environ. Sci. Technol. 2013, 7, 567–584. [Google Scholar]
- Qi, C.; Song, Y.; Liu, X.; Liao, Y.; Liu, T.; Wang, Z. Comparative study on the contents of Manganese and copper in source water and tap water in Yongzhou City. J. Hunan Univ. Sci. Technol. 2014, 35, 87–91. (In Chinese) [Google Scholar]
- Porento, M.; Sutinen, V.; Julku, T.; Oikari, R. Detection of copper in water using on-line plasma-excited atomic absorption spectroscopy (AAS). Appl. Spectrosc. 2011, 65, 678–683. [Google Scholar] [CrossRef] [PubMed]
- Xu, W.; Hao, X.; Li, T.; Dai, S.; Fang, Z. Dual-Mode Fluorescence and Visual Fluorescent Test Paper Detection of Copper Ions and EDTA. ACS Omega 2021, 6, 29157–29165. [Google Scholar] [CrossRef] [PubMed]
- Hu, Q.; Yang, G.; Zhao, Y.; Yin, J. Determination of copper, nickel, cobalt, silver, lead, cadmium, and mercury ions in water by solid-phase extraction and the RP-HPLC with UV-Vis detection. Anal. Bioanal. Chem. 2003, 375, 831–835. [Google Scholar] [CrossRef] [PubMed]
- Zhang, L.; Nie, X.Y.; Le, T. Rapid determination of 15 metallic elements in 2 kinds of coix seeds by inductively coupled plasma-mass spectrometry after closed-vessel microwave digestion. J. Food Process Eng. 2017, 40, e12528. [Google Scholar] [CrossRef]
- Zhou, F.; Li, C.; Yang, C.; Zhu, H.; Li, Y. A spectrophotometric method for simultaneous determination of trace ions of copper, cobalt, and nickel in the zinc sulfate solution by ultraviolet-visible spectrometry. Spectrochim. Acta Part A Mol. Biomol. Spectrosc. 2019, 223, 117370. [Google Scholar] [CrossRef] [PubMed]
- Zhu, X.; Qin, H.; Liu, J.; Zhang, Z.; Lu, Y.; Yuan, X.; Wu, D. A novel electrochemical method to evaluate the cytotoxicity of heavy metals. J. Hazard. Mater. 2014, 271, 210–219. [Google Scholar] [CrossRef]
- Li, Z.; Zhu, M. Detection of pollutants in water bodies: Electrochemical detection or photo-electrochemical detection? Chem. Commun. 2020, 56, 14541–14552. [Google Scholar] [CrossRef] [PubMed]
- Ding, Q.; Li, C.; Wang, H.; Xu, C.; Kuang, H. Electrochemical detection of heavy metal ions in water. Chem. Commun. 2021, 57, 7215–7231. [Google Scholar] [CrossRef]
- Maddipatla, D.; Saeed, T.S.; Narakathu, B.B.; Obare, S.O.; Atashbar, M.Z. Incorporating a novel hexaazatriphenylene derivative to a flexible screen-printed electrochemical sensor for copper ion detection in water samples. IEEE Sens. J. 2020, 20, 12582–12591. [Google Scholar] [CrossRef]
- Alhashmi Alamer, F.; Almalki, G.A. Fabrication of Conductive Fabrics Based on SWCNTs, MWCNTs and Graphene and Their Applications: A Review. Polymers 2022, 14, 5376. [Google Scholar] [CrossRef] [PubMed]
- Hou, L. Effect of Outer Diameter and Length of Graphitized Multi-Wall Carbon Nanotubes on Electrochemical Performance of Aluminum Ion Batteries. Master’s Thesis, Shandong University of Science and Technology, Qingdao, China, 2020. [Google Scholar]
- Ni, M.; Chen, J.; Wang, C.; Wang, Y.; Huang, L.; Xiong, W.; Zhao, P.; Xie, Y.; Fei, J. A high-sensitive dopamine electrochemical sensor based on multilayer Ti3C2 MXene, graphitized multi-walled carbon nanotubes and ZnO nanospheres. Microchem. J. 2022, 178, 107410. [Google Scholar] [CrossRef]
- Pesado-Gómez, C.; Serrano-García, J.S.; Amaya-Flórez, A.; Pesado-Gómez, G.; Soto-Contreras, A.; Morales-Morales, D.; Colorado-Peralta, R. Fullerenes; Report Summarizes Fullerenes Study Findings from People’s Hospital (Simultaneous Electrochemical Determination of Lead and Copper Based on Graphenated Multi-walled Carbon Nanotubes). Nanotechnology Weekly, 15 February 2024; 215550. [Google Scholar]
- Enyu, G. Simultaneous Electrochemical Determination of Lead and Copper Based on Graphenated Multi-walled Carbon Nanotubes. Int. J. Electrochem. Sci. 2015, 10, 7341–7348. [Google Scholar]
- Vareda, J.P.; Valente AJ, M.; Durães, L. Ligands as copper and nickel ionophores: Applications and implications on wastewater treatment. Adv. Colloid Interface Sci. 2021, 289, 102364. [Google Scholar] [CrossRef] [PubMed]
Disclaimer/Publisher’s Note: The statements, opinions and data contained in all publications are solely those of the individual author(s) and contributor(s) and not of MDPI and/or the editor(s). MDPI and/or the editor(s) disclaim responsibility for any injury to people or property resulting from any ideas, methods, instructions or products referred to in the content. |
© 2024 by the authors. Licensee MDPI, Basel, Switzerland. This article is an open access article distributed under the terms and conditions of the Creative Commons Attribution (CC BY) license (https://creativecommons.org/licenses/by/4.0/).