Review

Comprehensive Review for Energy Recovery Technologies Used in Water Distribution Systems Considering Their Performance, Technical Challenges, and Economic Viability

by
Admitos A. Bideris-Davos
* and
Panagis N. Vovos
Laboratory of Power Systems, Renewable and Distributed Generation, Department of Electrical and Computer Engineering, University of Patras, University Campus, 26504 Rion, Greece
*
Author to whom correspondence should be addressed.
Water 2024, 16(15), 2129; https://doi.org/10.3390/w16152129
Submission received: 25 June 2024 / Revised: 20 July 2024 / Accepted: 22 July 2024 / Published: 27 July 2024
(This article belongs to the Section Water-Energy Nexus)

Abstract

:
Urban water distribution systems (WDSs) exhibit significant energy potential that is currently dissipated in the form of excess pressure, either at brake-pressure tanks (BPTs) or pressure reduction valves (PRVs). Recent research focuses on the implementation of energy harvesting methods within WDSs in order to improve the energy efficiency of such systems. This paper provides a systematic review of the technologies developed for energy exploitation in WDSs, covering both their technical and economic aspects, while considering their reliability in providing water pressure regulation. Drawn from the existing literature and state of the art, a systematic analysis was carried out that specifies and categorizes the most essential parameters that impact the implementation of energy recovery turbines into WDSs. Different turbine types, design parameters, and performance properties, such as generation efficiency and pressure regulation precision, were considered. Finally, practical challenges and consequences emerging from the joint optimization of water and power systems are addressed.

1. Introduction

The hydropower units installed in WDSs are typically classified according to their power generation capacity as pico (<5 kW), micro (5–100 kW), and mini (100–1000 kW). Harvesting energy from WDSs reduces greenhouse emissions, because that energy would be otherwise produced by conventional energy sources. Currently, according to the U.S. Energy Information Administration, for each kWh produced by conventional generation, 0.39 kg of CO2 is emitted on average. Reference [1] demonstrated that the energy produced by an energy harvesting device within a typical WDS in southern Italy reduces annual CO2 emissions by an equal amount produced by 255 cars. As shown in [2], turbines installed within water transmission pipelines could cover a great share of the energy requirements of the pumping stations. The reduction in CO2 emissions resulting from such a scenario can reach up to (33%). Reference [3] explains that the motives for implementing micro-hydro schemes at remote areas are even greater, because in many countries, the respective cost for grid interconnection remains unacceptably high and the power supply from a distant point at the main grid is unreliable. It also underlines the importance of environmental legislation for the rapid stimulation of the global market toward pico hydropower technologies.
The energy potential that is currently wasted in PRVs and BPTs is significant. According to [4], the average power that is dissipated from a PRV of a typical WDS is around 10 kW, while it can reach up to 100 kW for the highest flows and pressures. This seems to match the findings in [5], which estimate the average power dissipated from 15 PRVs of an Iranian WDS at about 170 kW. According to [6], the average capacity of recovered power in urban WDSs, considering PRVs, BPTs, and sewage discharge points, ranges between 0.1 and 83 kW. Similar research in [7] reports that micro-turbine installations within WDSs typically range between 5 and 100 kW.
It is evident that if this energy surplus in WDSs is harnessed, a significant income can be added to the operator’s budget, since produced electricity can be sold to the power system at a tariff ranging from USD 10 to 20/kWh for pico-hydro [3], while much higher revenues can be obtained from self-consumption under a net-metering scheme [8]. In the last decade, the reliability and affordability of such pico/micro turbines have significantly improved, boosting the global market size [3]. A major advantage of pico/micro-hydroturbine projects within urban WDSs is that there is no geographical limitation since they employ existing infrastructure and space, opposed to typical hydropower projects that require the construction of dams and the utilization of reservoirs. The alleviation of such cost is proven pivotal toward their economic feasibility, balancing out their limited power output. Hydropower and pump storage from small to large scales are well documented and mature technologies. However, their implementation in the pico–micro scale within WDSs, when along with power generation they are required to perform pressure regulation, might raise additional challenges to their design and operation. Unfortunately, this fact is mostly neglected by the vast majority of the literature, which addresses the issue mainly from the standpoint of power generation. This paper aims to review the energy recovery technologies employed within WDSs, but a special focus is on turbine technologies that can effectively attain pressure control when it is required.
This paper is organized as follows: Section 2 describes the main devices and structures that are used for pressure control within WDSs, along with a brief discussion on studies that explore the dissipated energy potential from their operation. Section 3 describes the state of the art for energy recovery in WDSs, with an emphasis on the various turbine types and their infrastructure requirements, while providing the various equations used for characteristic curve construction and best efficiency point (BEP) prediction. Section 3 also features a review breakdown regarding several studies that involve only the WDS side and those that include the interaction between WDSs and the power distribution system (PDS). In Section 4, the cost models of such hydropower plants found in the literature are analytically presented with reference to their potential limitations and the factors that impact their accuracy. Additionally, several empirical approaches that are employed for the estimation of the turbine’s total cost and the major parameters that are used for its economic viability assessment are addressed. Section 5 summarizes the main economic and technical challenges for the installation of turbines within WDSs along with those that have not been fully investigated yet. In Section 6, a brief summary of the paper is provided and future research possibilities are suggested.

2. Pressure Management Devices and Techniques

Pressure management within WDSs is primarily accomplished by the use of hydraulic structures (BPTs) and hydraulic devices (PRVs). They are both properly placed at specific areas of the network in order to limit water pressure to values that are safe for both the network and the consumers.
BPTs are constructed by the WDS operator at network points that exhibit immense pressure, in order to keep the piezometric level of the discharge point fixed at atmospheric pressure. They often operate as balancing reservoirs with a small capacity, i.e., store water during low-consumption periods that is later required to meet the demand during high-consumption periods. Recent literature regarding the employment of energy recovery devices at the entrance of BPTs is limited [9,10,11], despite their high-energy yield and the fact that there is no direct interference with the water supply service. Due to the high-pressure values and the requirement to discharge water at atmospheric pressure, impulse turbines like Pelton turbines are often proposed to be installed at the entrance of such tanks. Findings in [9] suggest that the installation of a turbine at BPT sites with potential power below 10 kW cannot be economically justified. These findings seem to be in agreement with [12], where the power threshold for a conventional turbine to be economically viable (with a payback period of 6 years or less) was calculated at 10 kW.
PRVs are mainly installed at WDS points where pipeline and costumer safety standards may be violated due to immense pressure, as well as leakage management. They isolate parts of the network or divide it into smaller areas, known as district metering areas (DMAs), where both demand and pressure are monitored and regulated. While optimal placement and the number of PRVs within WDSs reduce the water losses and the associated investment cost [13], their inability to recover dissipated power from the water network leaves significant revenue unexploited. The employment of PRVs instead of energy recovery machines as pressure reduction devices is not considered an economically sustainable option, as indicated by [14]. In opposition to the case of BPTs, the one-to-one replacement of PRVs with turbines is more practical and cheaper, as they will be hosted in existing vaults. Unlike BPTs, the required bypass system needed for backup (e.g., turbine failure or maintenance) is already placed and paid for PRV vaults. According to extensive water utility data drawn from [4], for PRV sizes between 38 and 355 mm, the average pressure drop and dissipated power are estimated around 3.5 bar (35 m of head) and 8 kW, respectively. According to the same paper, the installation of turbines for energy production purposes presents a payback period of 10 years or less at sites where the generation potential exceeds a threshold between 3 kW and 25 kW, considering the range of turbine costs available in the global market. This seems to be in accordance with the findings in [6], which conclude that most studies disregard the installation of micro-hydropower when the estimated capacity is below 2 kW.

3. State of the Art

3.1. Energy Recovery Technologies in WDS

Currently, there are several technologies described in the literature that address this issue, mainly from the perspective of energy recovery. The most common turbine technology employed is the pump used as turbine (PAT), mainly due to its low purchase cost resulting from the wide commercial availability of pumps. According to [1], the installation of a PAT system within a WDS, can typically produce an annual income between EUR 25 k and EUR 50 k . Reference [15] performed a thorough review regarding the various empirical methods employed to predict the BEP of a PAT and proposed an improved approach to both BEP prediction and the construction of the characteristic curves. Reference [16] explored the potential energy existing in irrigation systems of southern Italy and applied a multi-variable optimization method for PAT selection and optimal hydropower configuration. A numerical model to predict the BEP of PATs when the actual pump characteristics from catalogues are available is established in [17]. The results demonstrated high accuracy when the detailed geometrical parameters of the pumps were provided. In [18], a physics-based simulation model was developed that utilizes the performance curve of pumps in order to predict the performance curves of PATs. Reference [19] estimates the energy potential that can be exploited by different PATs installed in WDSs. However, none of the used PATs was specifically selected or designed for the WDS under consideration, and hence, their final efficiency was not satisfactory, being lower than 60% for all PATs. In [20], it was demonstrated that up to 15% of the initial investment cost can be saved when an appropriately designed PAT is employed for micro-hydropower generation, instead of a custom-made Crossflow turbine. A model that determines the most economically feasible pressure control device between a PRV and PAT by considering the water and energy cost savings associated with their operation is developed in [14]. For each simulated scenario, the net present value (NPV) of the PAT operation was 6% to 29% higher than the one achieved by the PRV. The implementation of a full-scale PAT system in the WDS of Antalya city is described in [21]. The PAT operates in parallel with a PRV and generates up to 7 kWh of energy, with an average efficiency of 54%, while applying an average pressure drop of 1 bar on its exit. A framework for the selection of two PATs operating in parallel in order to substitute PRVs, while ensuring maximum energy production, is proposed in [22]. However, their pressure regulation was proven inadequate, with significant discrepancy between the ideal pressure regulation and the one provided by the PAT, while unacceptable low pressures during PAT operation have also been witnessed.
Reference [23] develops a computer program for the preliminary selection of turbines installed in WDS. However, it focuses solely on the energy recovery aspect and considers constant turbine efficiency for its calculations, neglecting its variation due to the fluctuating operating conditions of a WDS. In [24], a concise methodology for designing turbines in the pressure regulation mode is presented, with pressure regulation precision comparable to PRVs. The results demonstrated that turbine design can adapt to PRV size and pressure requirements, while maintaining over 60% hydraulic efficiency during all time periods. The optimal location of centrifugal micro-turbines and PRVs within the WDS of Funchal is investigated in [25], with the aim of maximizing energy production and minimizing water leakages. The PRV and turbine cost models adopted by this research pushed the optimal solution toward installing more turbines at the middle part of the network, where the energy potential is significant, while PRVs were mostly placed near the extremities of the network. In [2], it was demonstrated that by allowing higher velocities in the main WDS pipelines up to a certain limit, the financial viability of such projects is improved by the increased power generation offered by Pelton turbines. For most of the simulated scenarios in that work, the installation of Pelton turbines was proven economically viable, leading to payback periods less than 10 years. It has to be noted, though, that Pelton turbines cannot regulate pressure; thus, substitute PRVs. Finally, reference [5] developed an operative framework for the selection of conventional turbine technologies for the purpose of replacing existing PRVs in an Iranian WDS. The dissipated energy by the PRVs was calculated to be enough to supply more than 40% of the energy fed to the WDS pumps. However, turbine types are selected only according to their specific speed, without considering their size, performance, and actual efficiency variation resulting from the fluctuating operating conditions.
One of the emerging pico-scale hydropower technologies includes the installation of various in-pipe hydrokinetic turbines, mainly spherical, as reported in [26,27,28,29]. Analytical overviews regarding the different in-pipe applications and technologies can be found in [29,30,31]. Their low initial cost, ease of manufacturing, wide application range, and consistency in power generation are included among the main advantages for their installation within pressurized pipelines. However, the lower hydrodynamic efficiency compared to conventional turbines [28], along with the fact that the underlying technicalities in turbine design and performance modeling are still not sufficiently investigated or documented, impedes their widespread installation at the moment.

3.2. Studies Involving WDSs and PDSs

The coordinated operation between urban WDSs and PDSs has been explored to a certain degree. Most studies focus on shifting the pump operation schedule to time periods where the electricity prices are lower in order to minimize energy costs for both systems [32,33,34]. The energy flexibility provided by the WDS is utilized in order to minimize the day-ahead operational cost of the interconnected WDS and PDS in [35]. Reference [36] investigated the role of a WDS in providing demand-side services to the PDS and formulates an optimization model for the demand-side management of the integrated system. Moreover, a scheme for the operation of hydropower units utilized in pump storage, aiming at minimizing the operational costs of the PDS and the optimal utilization of water tanks, is formulated in [37]. In [38], an integrated framework is applied on a PDS with privately-owned microgrids connected to a WDS. The framework aims at the enhancement of the resilience of the interconnected system through the energy management of the microgrids. In [39], a co-optimization framework for simultaneous hydropower generation and water pressure regulation is presented. In that work, PRVs are replaced with Francis turbines operating as links between the two systems. The objective function of the formulation aimed at maximizing the power injection to the electric grid with respect to both system constraints, while turbines offered pressure regulation, equivalent to the operation of PRVs. Reference [40] proposes the coupling of PV and pumping systems in order to reduce the energy costs of the water facilities. Specifically, it proposes the conversion of underutilized pumping stations to pumped storage stations via the introduction of Pelton hydroturbines. The hydraulic turbines coordinate their operation with the non-dispatchable photovoltaics, in order to maximize the economic performance of large WDSs.

3.3. Infrastructure Requirements of Pressure-Regulating Devices

The infrastructure required by conventional turbines (Figure 1a), PATs (Figure 1b), and PRVs (Figure 1c) as pressure-regulating devices, is illustrated in Figure 1. Both turbines and PATs require two on–off valves (OVF) for cases of emergency maintenance. All three configurations also require a pressure meter to ensure that the downstream pressure requirements are satisfied.
PATs in particular, require two flow control valves (FCVs) in order to regulate the water flowing through the PATs and hence its performance. Due to their lack of adjustable blade mechanisms, their operational flexibility relies on the implementation of both electrical regulation (the variation of rotational speed by means of an inverter drive) and hydraulic regulation (the installation of a PRV or another PAT in parallel for bypassing part of the flow or absorbing excess pressure). This requirement not only drives up the installation cost, but also increases the total space occupied by the PAT infrastructure, which may become a restricting factor when implemented in WDSs. Indeed, in [1], the two PRVs required for the hydraulic regulation of a PAT (one in series and one in parallel) made up 42% of the total PAT cost and increased the overall cost in comparison with the actual PAT cost by a factor of nine. Even when using another PAT in parallel to improve the pressure control of the initial PAT, the pressure regulation capability of the system is still not able to meet specific pressure requirements, as demonstrated in [22]. Additionally, this joint operation often leads to the underutilization of the ancillary PAT, as it might be required to operate for just a short period of time, as it is also showcased in [22].
For turbines, both flow control and hydraulic regulation are performed by the unit itself by means of the guide vanes. Hence, the PRV in parallel with the turbine is solely required as a bypass path for water during planned maintenance or repair work of the turbine. As a result, when accurate pressure regulation is needed, the PRV in parallel with the turbine will have a longer lifetime and lower maintenance cost than the PRV connected in parallel with the PAT. This extra cost in the case of PATs is not negligible. Findings in [14] indicate that, for diameters between 50 and 600 mm, the total installation cost of a PRV ranges between EUR 2520 and EUR 72,621, respectively, so it constitutes a significant amount throughout its service lifetime. Expressions that estimate the purchase cost of the PRV and the total PRV installation cost, which includes the purchase cost of the valve, the labor cost, and the cost of the additional hydraulic equipment (Figure 1c), are presented in Table 1. In the same table, an estimation of the cost of the inverter required by turbines and PATs for the regulation of their shaft speed is provided.

3.4. Turbine Types

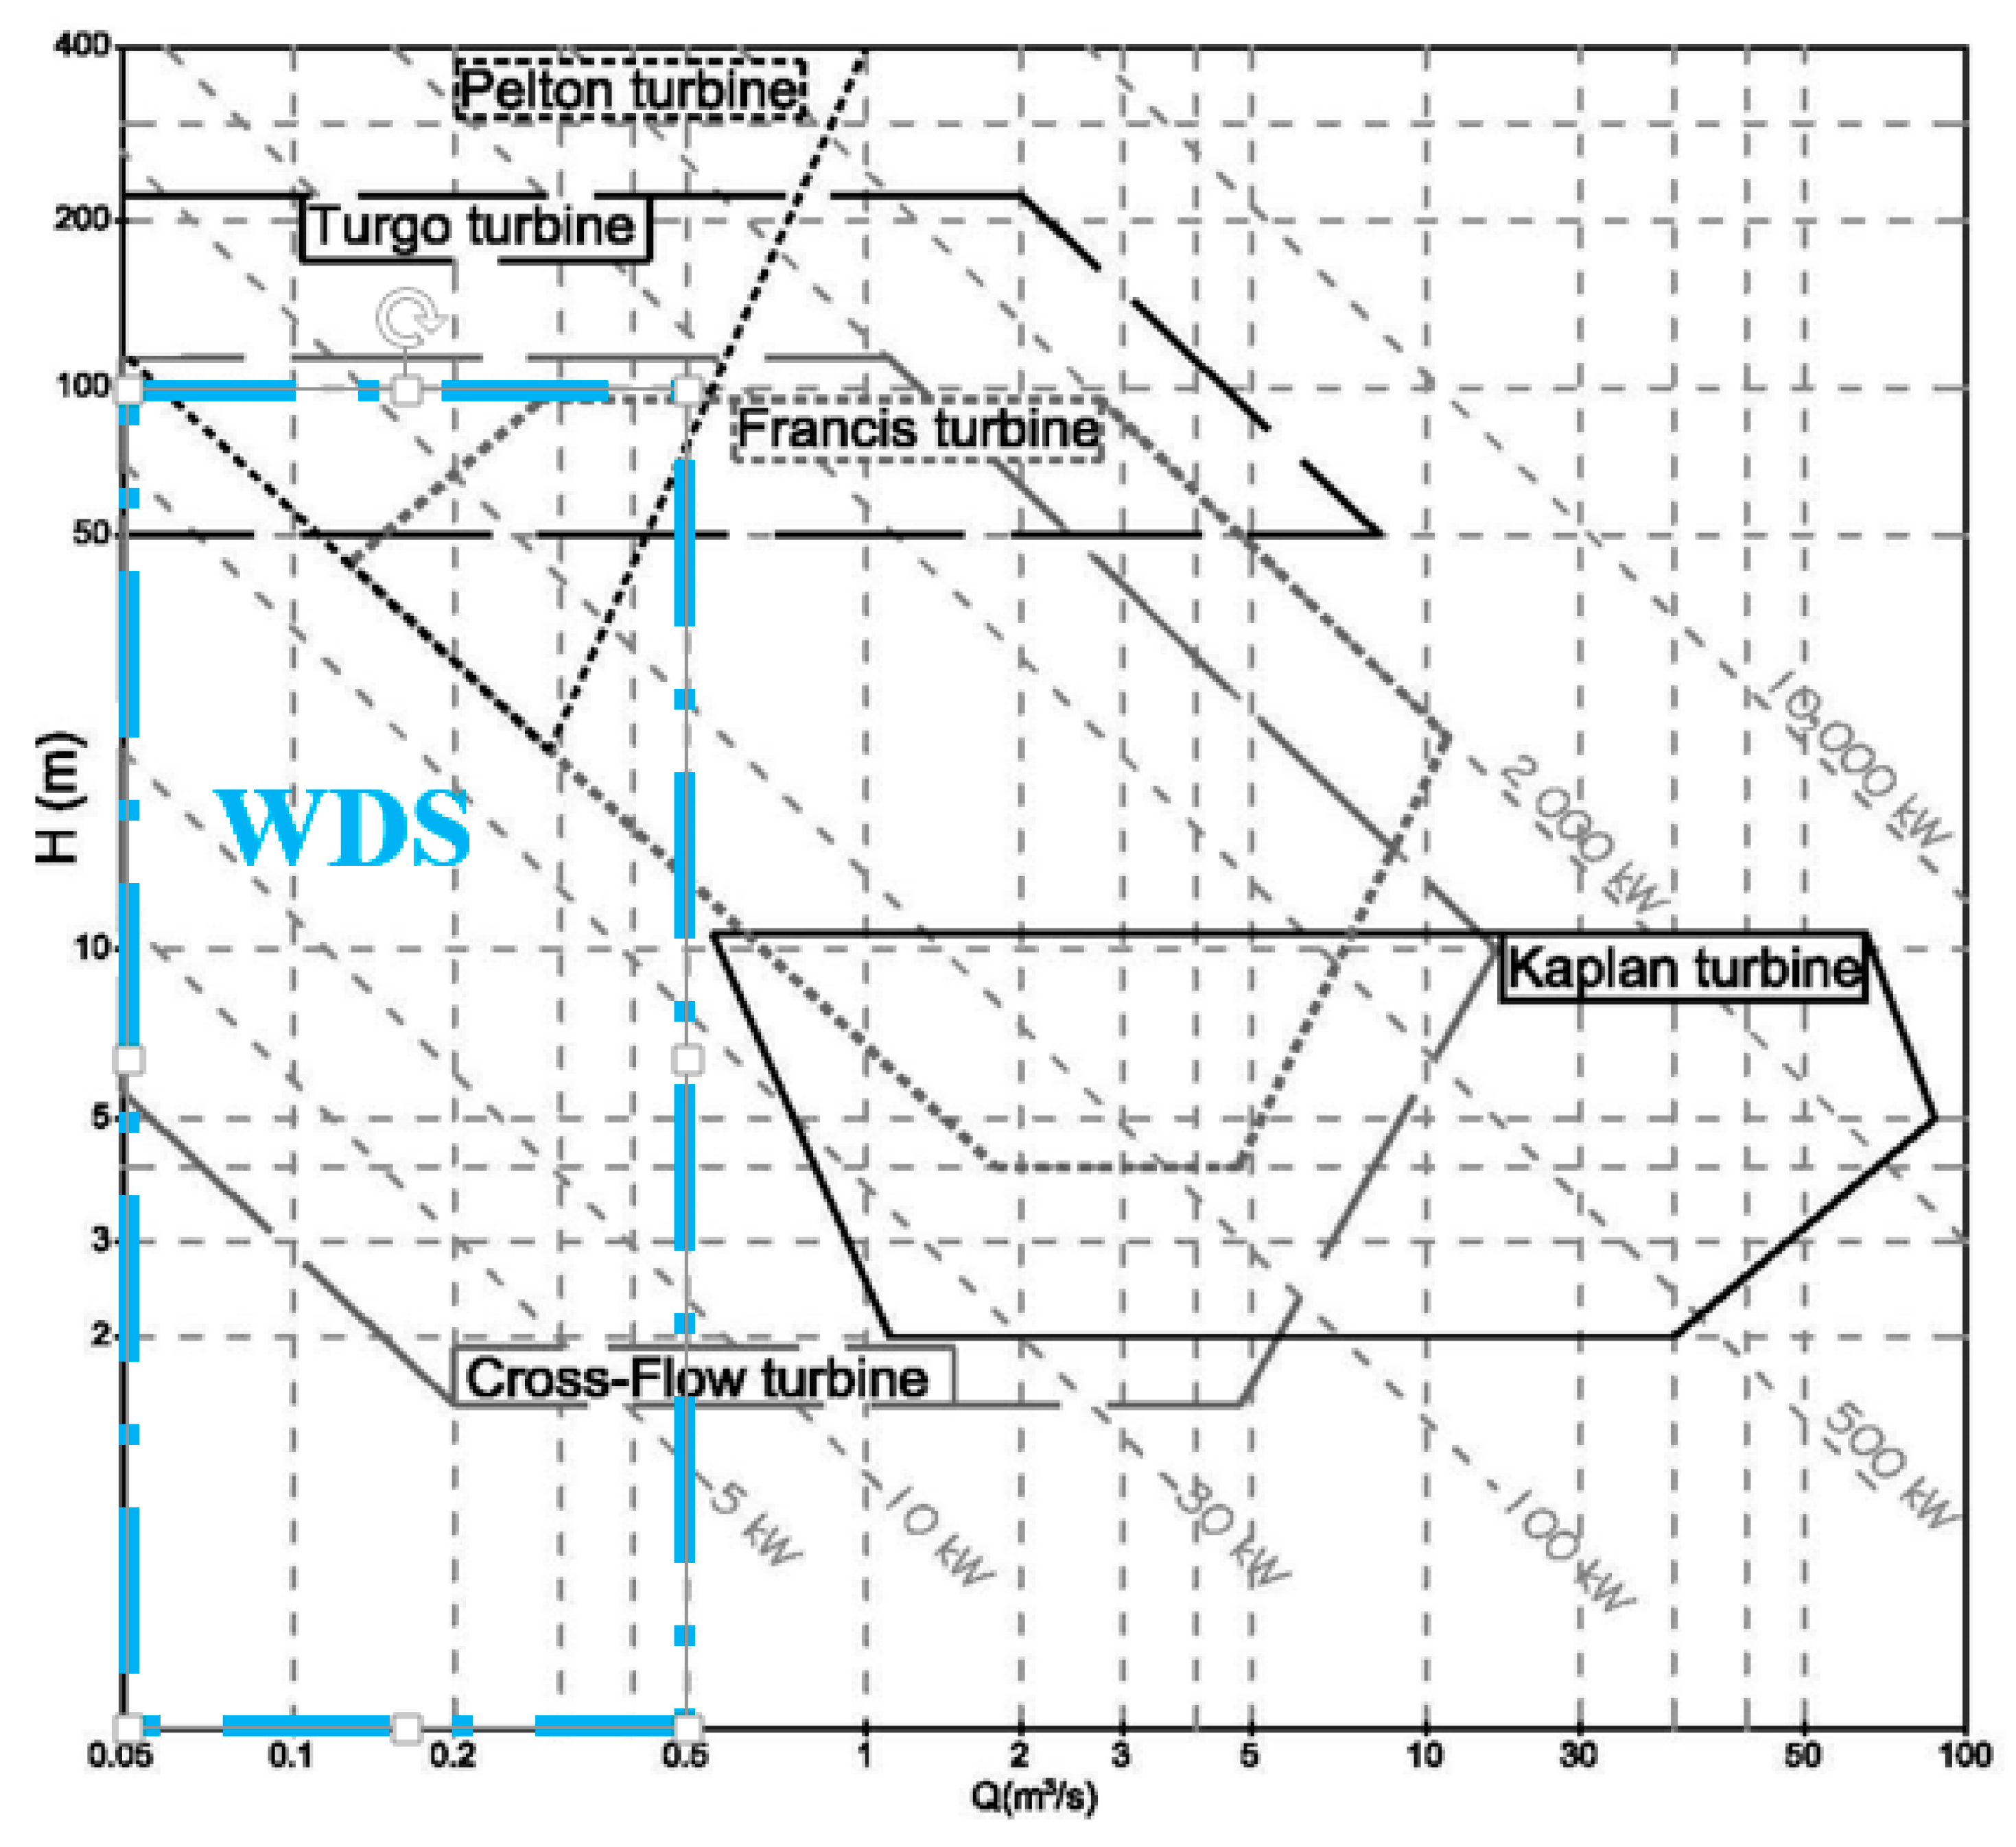
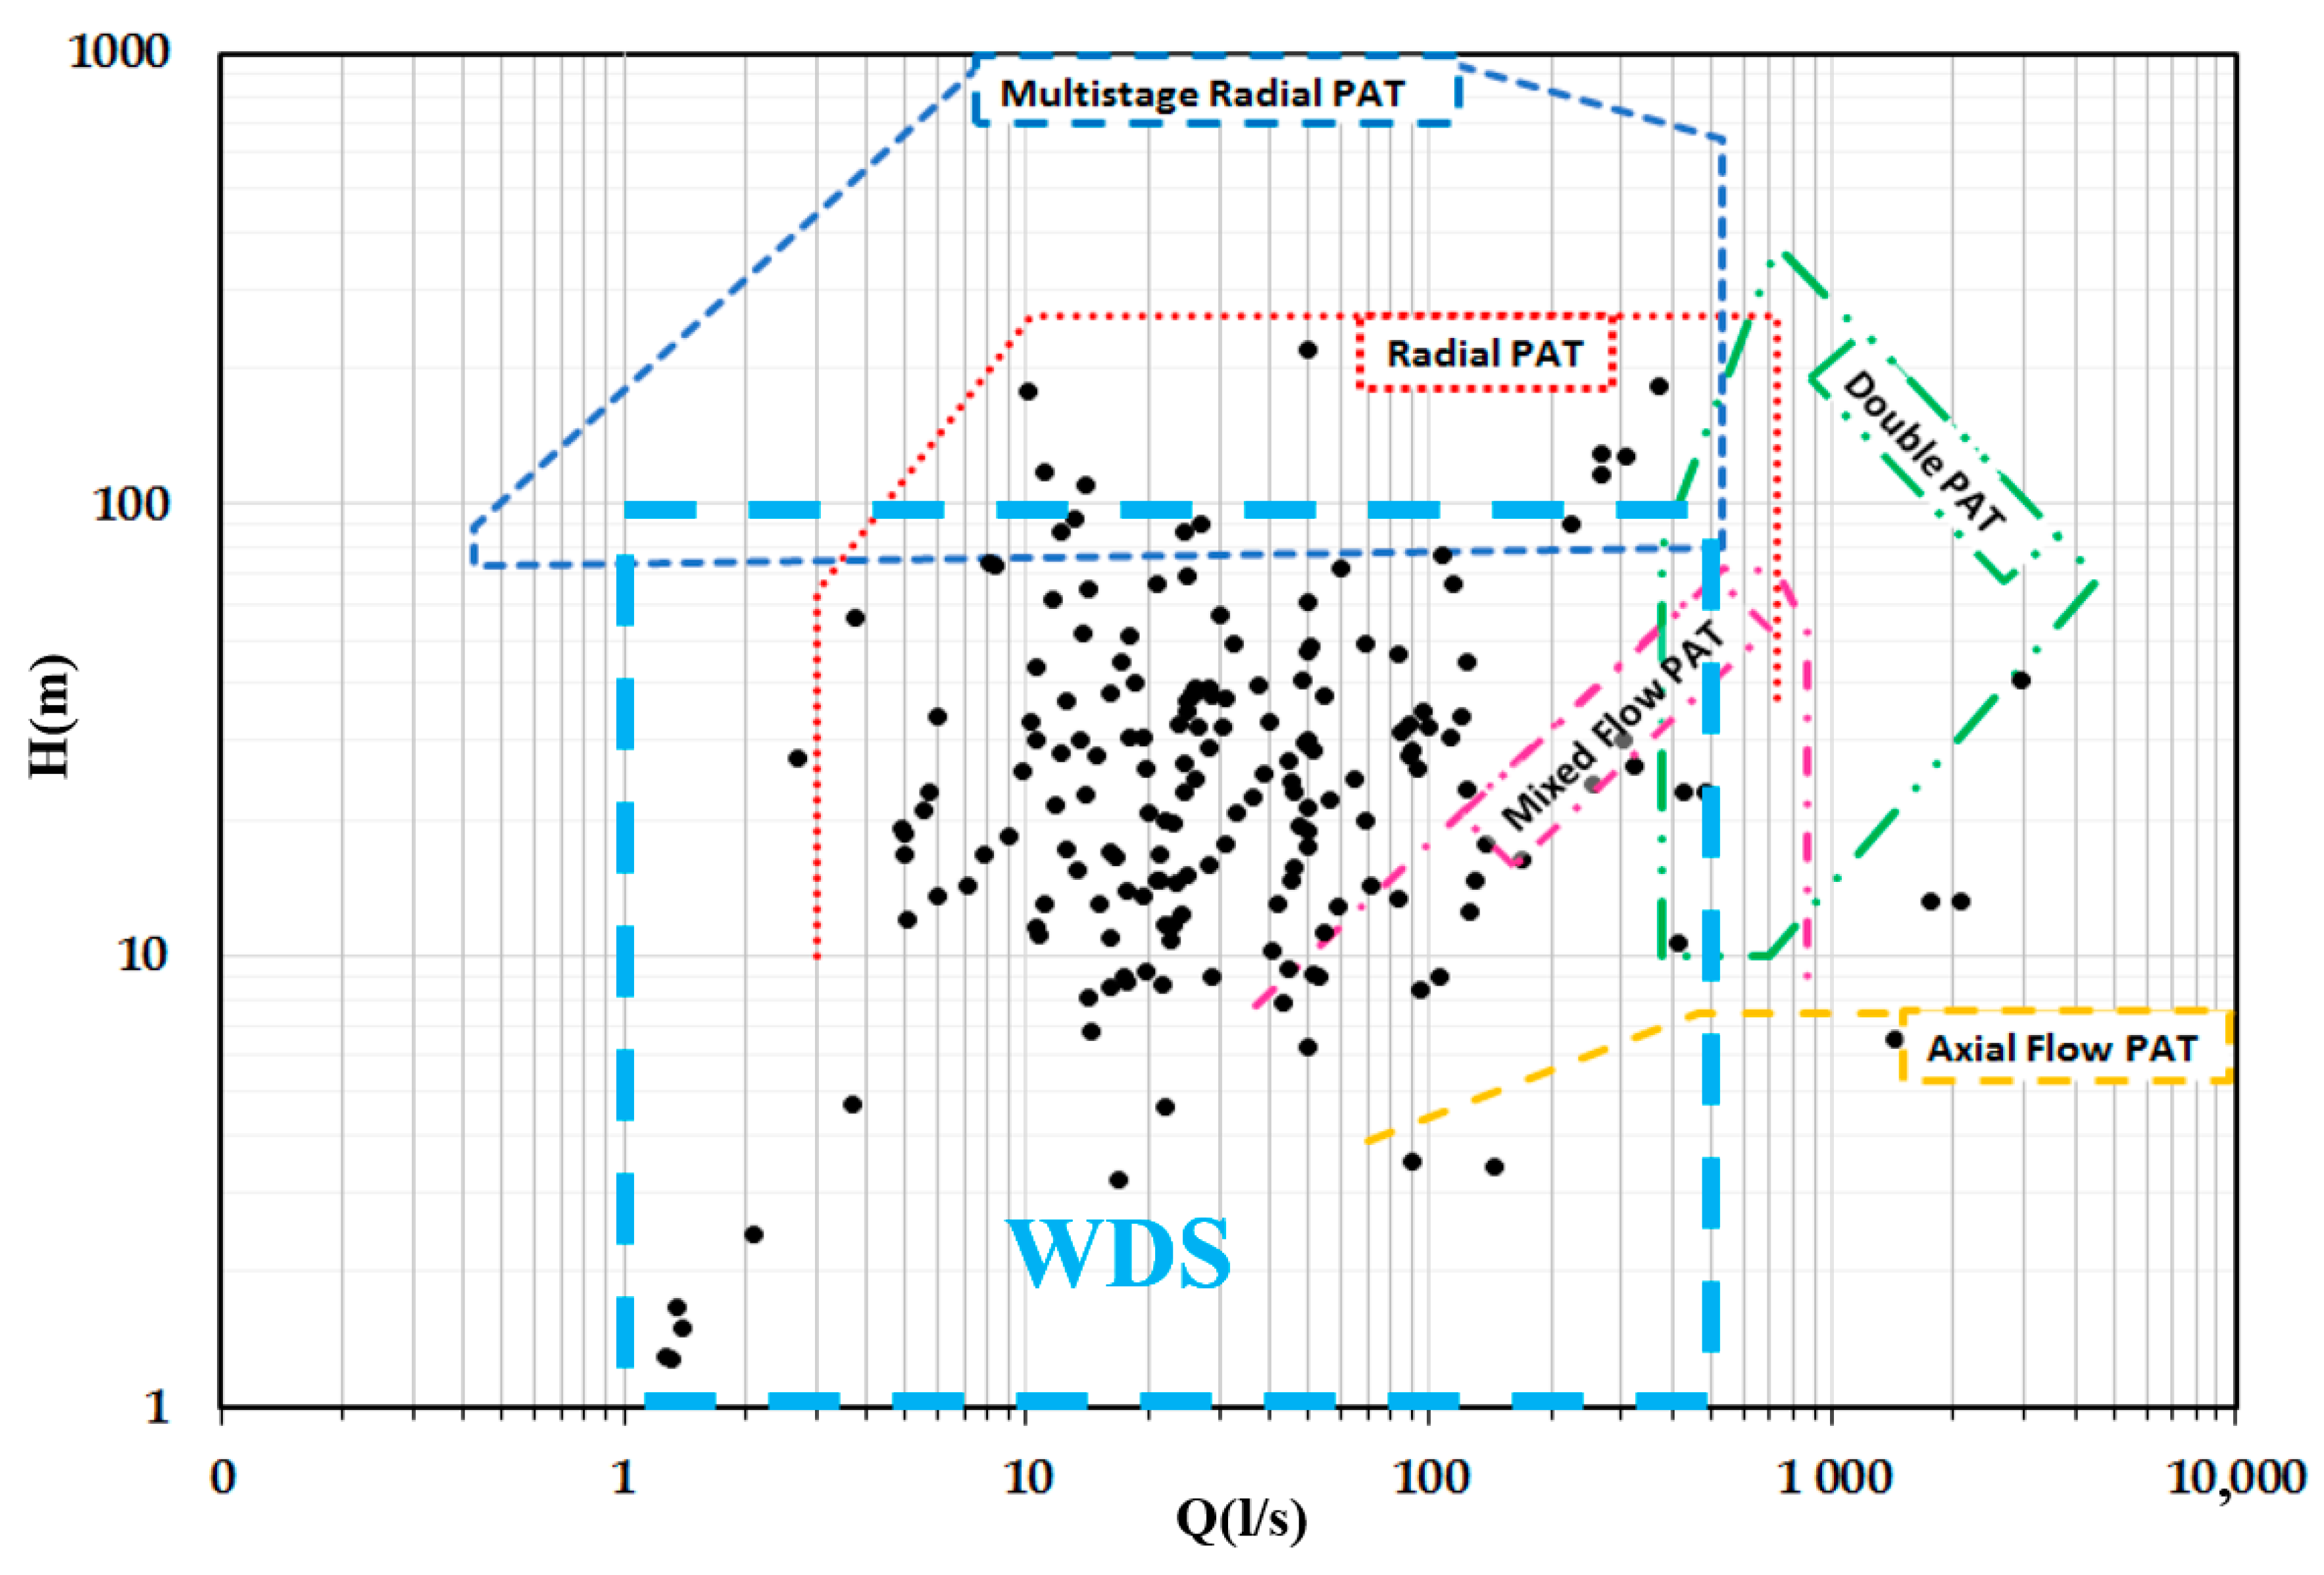
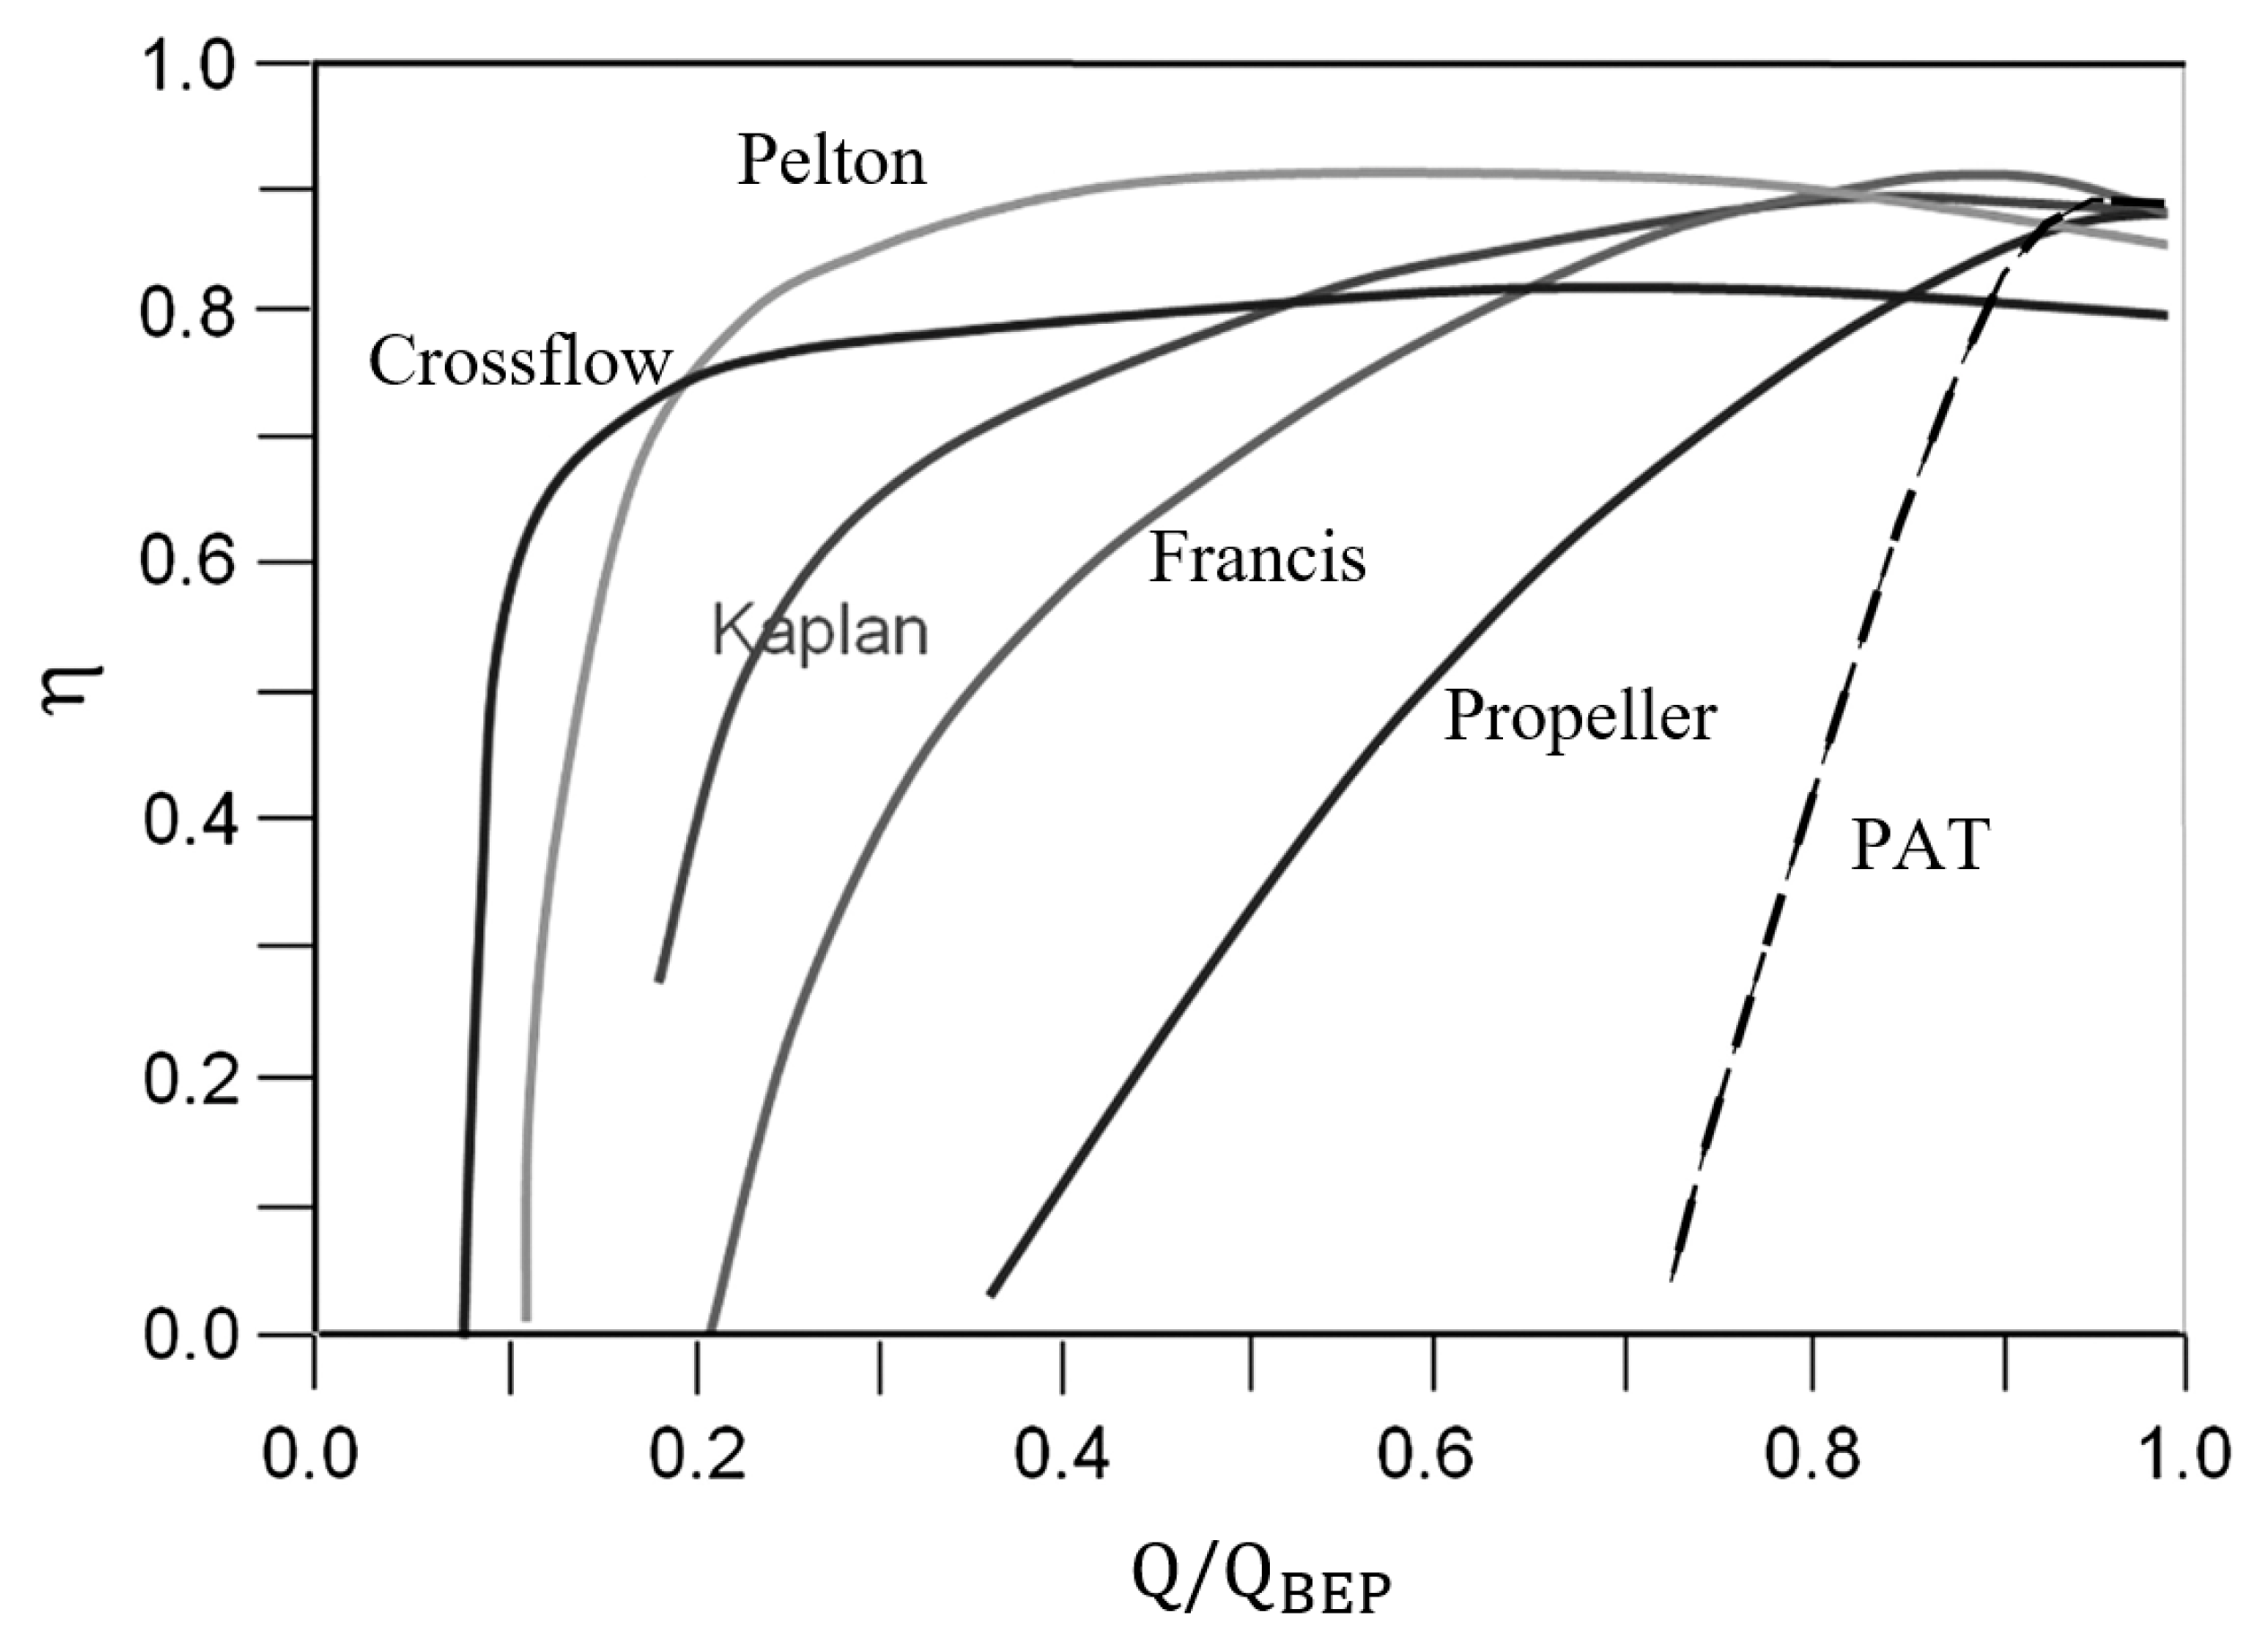
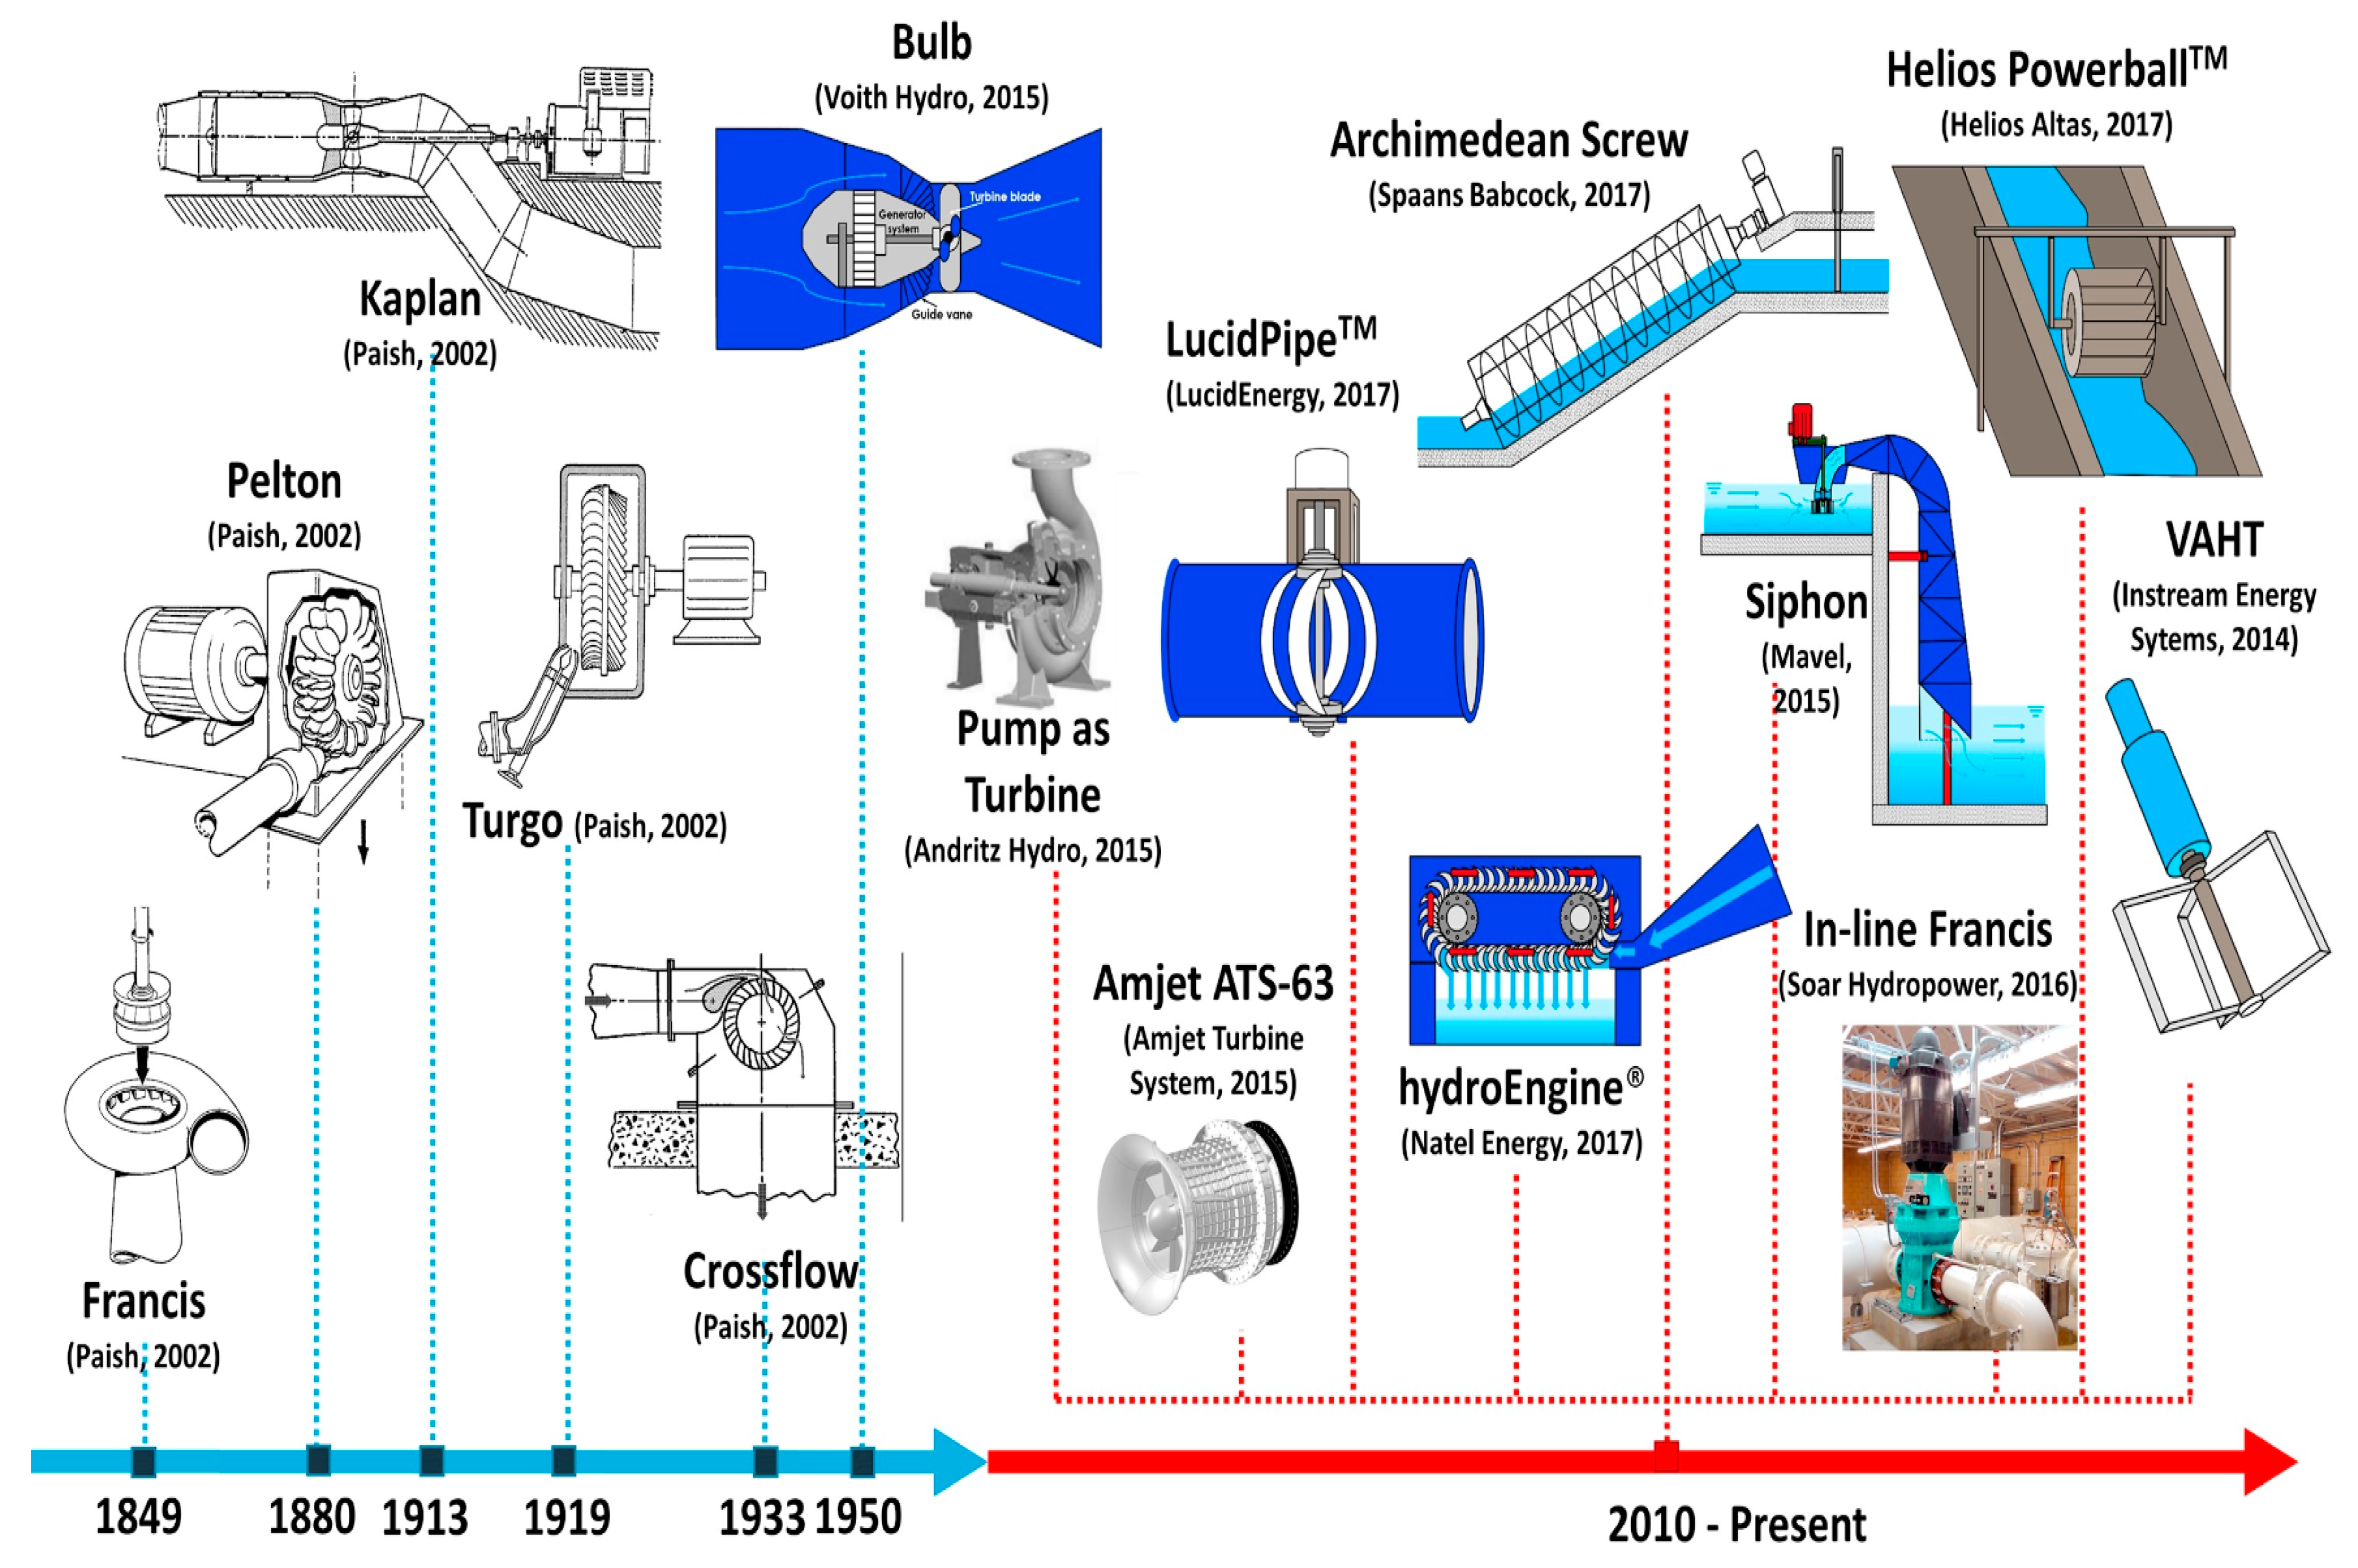
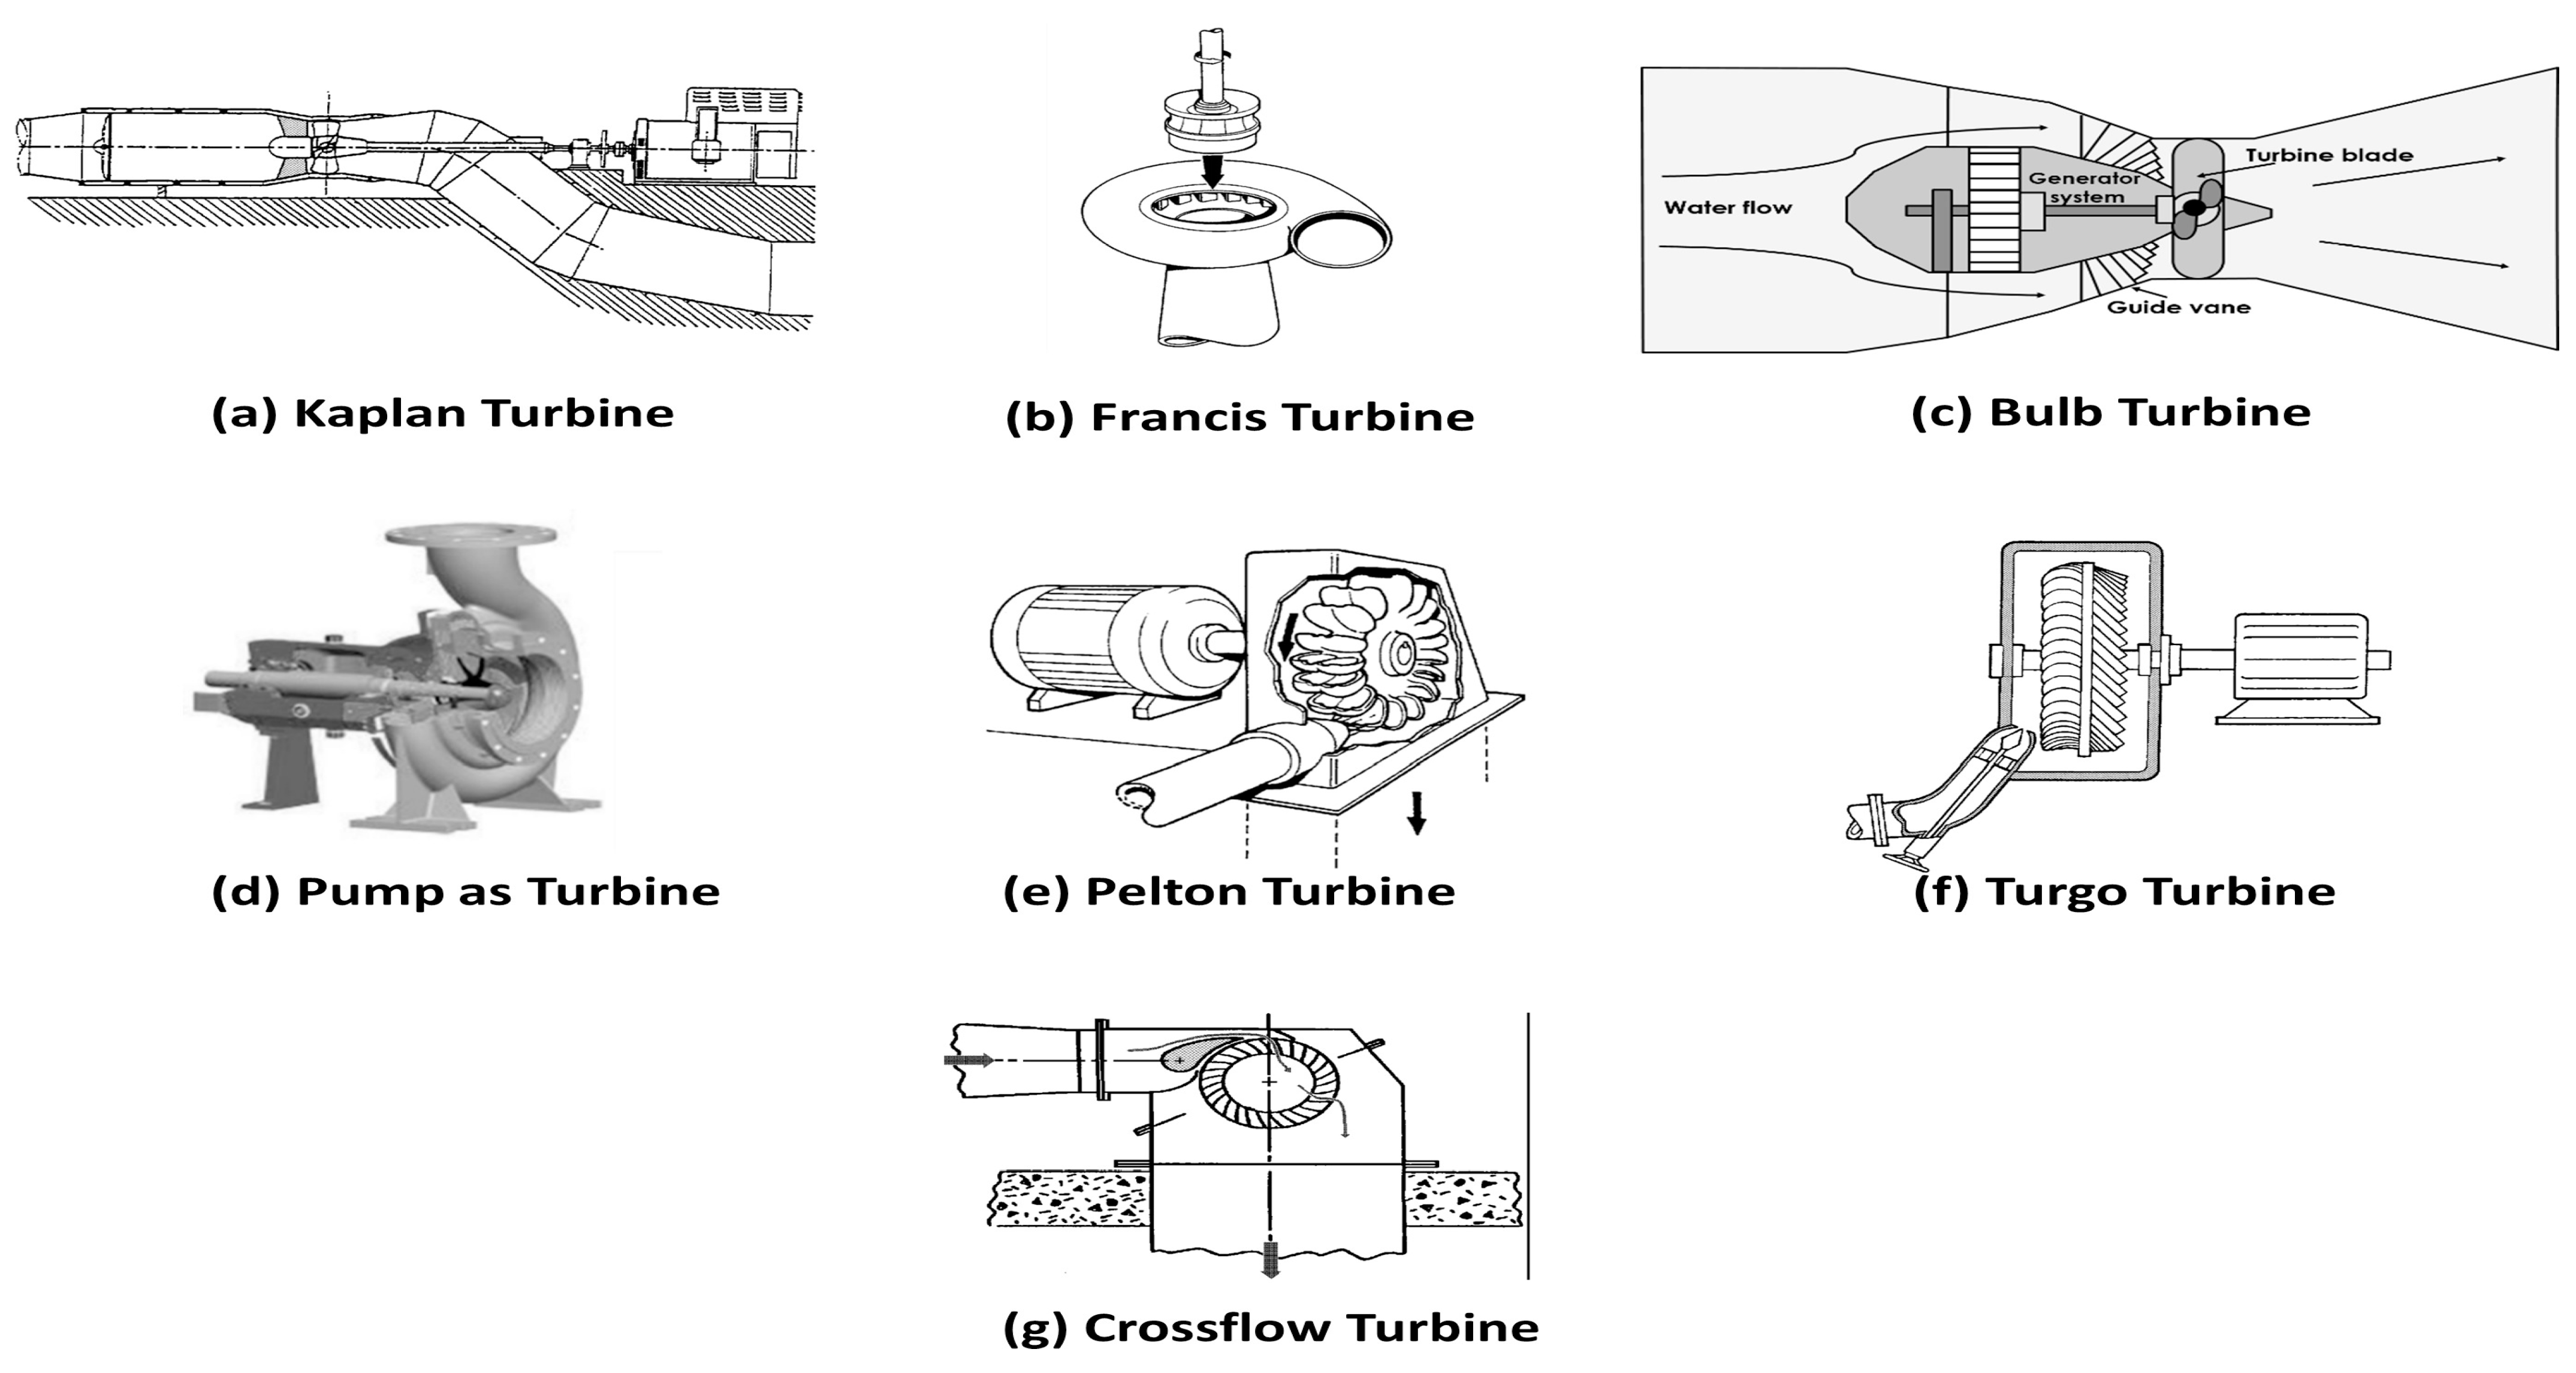
Micro-hydroturbine schemes can be classified into two main categories: impulse and reaction turbines. The three main types of impulse turbines are Pelton, Turgo, and Crossflow (also known as Banki) turbines. They generally provide atmospheric pressure outflow (not controllable), with the exception of Crossflow turbines that provide very limited pressure regulation [43]. Reaction turbines basically include Francis, Kaplan, semi-Kaplan (or propeller) turbines, and PATs. Francis and semi-Kaplan turbines possess an adjustable guide vane mechanism (single-regulated). Kaplan turbines have additionally an adjustable runner blade mechanism (double-regulated). PATs have no embedded mechanism for pressure regulation and rely on PRVs or other PATs operating in parallel for such purposes [1,14,16,20,22]. The application range of conventional turbines and PATs is depicted in Figure 2 and Figure 3, respectively. In both figures, the typical flow and head values in urban WDSs are illustrated as well. The efficiency of the different turbine types in part-load conditions is illustrated in Figure 4. Moreover, the evolution of turbine technologies through the years is depicted in Figure 5, while the schematic representation of the traditional turbine types is provided in Figure 6 [29].
Despite their complicated design that requires special casing and guide vanes, the startup budget of Francis turbines is lower than Pelton turbines. This is due to the fact that Pelton turbines require large-size components that drive up the cost, while Francis turbines usually have a smaller runner and generator [29]. However, the latter are less efficient at part-load conditions, compared to Pelton turbines (Figure 4) that display a flat efficiency curve in sites with great flow variations [29]. However, the inadequacy of Pelton turbines to regulate pressure and their requirement for large heads and low flow rates limits their applicability on WDSs at points that do not require downstream pressure, like BPTs [2,29]. In Table 2, the main operational characteristics of conventional turbines along with their potential installation points within WDSs are presented. Table 3 summarizes the benefits and limitations for turbines and PATs as energy harvesting machines in WDSs. In Table 4, the principal characteristic curve equations and correlations that govern the operation of reaction turbines and PATs, respectively, are presented. Note that for turbines, characteristic curves can be directly expressed into design parameters, such as, runner diameter ( D ) , blade width ( b ) , guide vane opening ( α ) , and blade angle ( β ) , while for PATs, they can only be correlated with operational parameters, such as turbine flow rate Q T and turbine head drop H T . The performance estimation for PATs is still accompanied with significant uncertainties, due to the lack of analytical models. Thus, expensive laboratory testing or time-consuming CFD simulations are required for the validation of the expected performance. Therefore, the identification of the most suitable PAT size and model and its installation at water networks that present variable operating conditions is accompanied with a certain investment risk according to [16,17,44]. Conversely, the investment risk of a turbine is mostly associated with its high purchase cost, since its operational flexibility is guaranteed. Specifically for PATs, the estimation of the BEP in turbine mode when the BEP in pump mode is known, can be determined according to Table 5. Finally, Table 6, provides a list of the equations that are widely used in the literature for the determination of the BEP for turbines and PATs under different rotational speeds. The great variety, and thus uncertainty, of empirical models expressing the BEP of PATs with respect to rotational speed is obvious.
Figure 2. Application range chart for different turbine types [45].
Water 16 02129 g002
Figure 3. Range of application for different PAT types (based on [15]).
Water 16 02129 g003
Figure 4. Typical efficiency curve for different turbine types (adopted from [2]).
Water 16 02129 g004
Figure 5. Evolution of turbine technology through the years, as drawn from [29].
Water 16 02129 g005
Figure 6. Basic layout and configuration of various conventional turbines [29].
Water 16 02129 g006
Table 2. Turbine types, operating conditions, and candidate installation location in WDSs. Head and flow rate ranges according to [5] and efficiency ranges according to [31,46].
NameTypeHead (m)Flow Rate
( m 3 s )
Efficiency at Design Point (%)/Part Flow Pressure Regulation AbilityInstallation Point
PeltonImpulse7–15000.001–10070–90/Very HighNo BPTs, in-pipe
TurgoImpulse3–2500.001–1070–90/High–Very HighNo Only in BPTs
CrossflowImpulse2–2000.04–1380/MediumLowBPTs, in-pipe *
FrancisReaction30–7000.07–10080–90/Medium–HighHighBPTs, PRVs, in-pipe
KaplanReaction1–700.05–100080–90/HighVery highBPTs, PRVs, in-pipe
Semi-KaplanReaction1–700.05–100080–90/LowMedium BPTs, PRVs, in-pipe
PATReaction2–4000.03–0.540–75/Very lowLimitedBPTs, PRVs, in-pipe
SphericalReaction1–40.5–1010–50/NSΝοIn-pipe
Note: * Proven as not financially feasible for in-pipe hydropower installations, according to [47].
Table 3. Factors that influence decision making on the type of the energy recovery machine.
TurbinePAT
EfficiencyHigher efficiency at BEP and part-load conditions 1Inferior hydraulic efficiency 2
Simulation/modelingWell-documented and supported by CFD resultsCharacteristic curves not typically provided by manufacturer
CostHigh purchase cost 3Low purchase cost
DesignComplex designSimple design
MaintenanceMaintenance requires a certain level of expertiseEasy maintenance
Pressure regulation abilityCan provide pressure regulation without PRV assistanceRequires additional hydraulic equipment (PRVs or more PATs) for accurate pressure regulation
PerformanceOperational flexibility and wide range of applicationsNarrow operating range and performance prediction still based on empirical relations and prediction methods
Market availabilityUsually requires ad hoc design (limited range of standard diameters and power capacities in market)Mass-produced with wide commercial availability 4
Notes: 1 Typically within the range of 70–90%, according to [44]. 2 Typically between 40 and 75% according to [16,20,21,40,48,49,50]. 3 Typically 2–10 times higher than PATs [14,44] but less than half for P > 40 kW [12]. 4 Wide variety between 1.7 kW and 160 kW range [44].
Table 4. Characteristic curve equations for reaction turbines and characteristic curve correlations for PATs.
Turbine
Expression H T = f 1 · Q T 2 + f 2 · Q T + f 3
ReferenceType f 1 ,  f 2 f 3
[51] *Francis f 1 = ζ f
f 2 = π · D 2 · N T   60 · g 1 π · D 1 · b 1 ·   t g α 1 + 1 π · D 2 · b 2   · t g β 2
f 3 = 1 g π · D 2 · N T 60 2 + k · w c 2 2
[51] *Kaplan f 1 = ζ f
f 2 = 4 · D m i d · N T g · 60 · D t i p 2 D h 2 · 1 t g a 1 + 1 t g β 2
f 3 = 1 g π · D m i d · N T 60 2 + k · w c 2 2
PAT
Expression H T H T , B E P = f 1 · Q T Q T , B E P 2 + f 2 · Q T Q T , B E P + f 3
Reference f 1 , f 2 f 3
[52] f 1 = 0.2394
f 2 = 0.769
f 3 = 0
[15] f 1 = 0.406
f 2 = 0.621
f 3 = 0
[53] f 1 = 1.16
f 2 = 99 · 10 4 · N s t 1.0627
f 3 = 0.9027 99 · 10 4 · N s t
[7] N s t < 65 N s t < 65
f 1 = 1.15
f 2 = 10 4 · N s t 2 + 1.9 · 10 3 · N s t 0.9386
f 3 = 8 · 10 5 2.6 · 10 3 · N s t + 0.7798
N s t > 65 N s t > 65
f 1 = 0.0411 N s t 2.8572
f 2 = 0.0609 · N s t + 5.7993
f 3 = 0.019 · N s t 1.8141
Notes: Specific speed of turbine as calculated by N s t = N Q H 0.75 . * Refer to [39,51] for an analytical explanation of each parameter within f 1 , f 2 , f 3 expressions.
Table 5. BEP prediction in turbine model when BEP in pump mode is available. The turbine and pump mode are denoted by the subscripts T and P, respectively.
Type Q T , B E P [50] H T , B E P [50] n T , B E P [54]
PAT 1.2   Q P , B E P n P , B E P 0.55 1.2   H P , B E P n P , B E P 1.1 0.89 0.024 Q T , B E P 0.41 0.076 0.22 + l n ( N s t 52.993 ) 2
Table 6. BEP prediction models under different rotational speed N 2 .
ReferenceType Q 2 / Q B E P H 2 / H B E P n 2 / n B E P
Classical affinity laws [51]Turbine
and PAT
H 2 H B E P 3 2 N B E P N 2 2 N 2 N B E P 2 n 2 = n B E P
[55]PAT 1.0323 N 2 N B E P 0.7977 1.0253 N 2 N B E P 1.5615 0.4013 N 2 N B E P 2 + 0.845 N 2 N B E P + 0.5606
[56]PAT 1.004 N 2 N B E P 0.825 0.972 N 2 N B E P 1.603 0.317 N 2 N B E P 2 + 0.587 N 2 N B E P + 0.707
[57]PAT 1.08 N 2 N B E P 0.7 1.89 N 2 N B E P 2 1.54 N 2 N B E P + 0.74 0.36 N 2 N B E P 2 + 0.69 N 2 N B E P + 0.66
[58]PAT 0.9974 N 2 N B E P 0.3651 0.9962 N 2 N B E P 1.0851 4.3506 N 2 N B E P 2 + 8.8879 N 2 N B E P 3.5444
[59]PAT 1.3595 N 2 N B E P 1.4568 N 2 N B E P 2
[7]PAT 0.9811 N 2 N B E P 0.801 0.9656 N 2 N B E P 1.654 0.2679 N 2 N B E P 3 0.9511 N 2 N B E P 2 + 1.074 N 2 N B E P + 0.5962

4. Cost Models

Cost models and graphs for the estimation of the total cost of turbines available in the literature need to be used with care, for the following reasons:
  • Most models are derived from correlating the cost drawn from a restricted pool of hydropower projects, and thus their accuracy depends on the completeness of the data sets, their similarity to those that they were drawn from, and the interpolation method used [60,61].
  • They are often drawn from projects completed long ago, and they may need to be updated to current market prices in order to reflect the present cost of electro-mechanical equipment.
  • Civil work cost is site-dependent, and every turbine installation may utilize a variety of components and characteristics, and thus the distribution of the various costs over the total cost may vary significantly from site to site.
  • Most of the available capital cost functions are derived from small hydropower plants that often require the construction of dams and reservoirs, and thus their employment in the economic assessment of micro-turbine schemes installed in a WDS may lead to an overestimation of the total cost. Only in [60,62] is an estimation method developed specifically for the cost of the electro-mechanical equipment of micro-turbine projects.
  • Civil work and electro-mechanical equipment cost is highly dependent on the location and country. In [60], it was demonstrated that when applying the models derived from data sets based on countries with different economic profiles to the country where the project will be deployed, like the ones of [61,63], the estimated cost may deviate by a factor greater than 2.5. This is mainly caused by the significantly different cost of electro-mechanical equipment, materials, and labor in the country of deployment (Nepal) in comparison to the counties that the data set is based (e.g., such as [61,63] for Europe).
  • Many cost models use a single expression for all turbines, ignoring the impact of certain correlation constants that depend on turbine type. For example, the cost of Pelton turbines is more sensitive to flow rate variation, while the cost of Kaplan turbines is more sensitive to mechanical power variation. Such correlations often decrease the accuracy of such expressions.
  • Cost models in the literature show great variety in their expressions. Therefore, determining which expression is more suitable to better estimate real costs may be challenging. According to [61], involving more parameters into the expressions, like flow rate, tends to make the expressions to follow the cost variation more accurately. However, such a detailed input data set is not always available or complete, especially during preliminary analysis.
Table 7 summarizes the cost models found in the literature for the estimation of the electro-mechanical cost and categorizes them according to the number of parameters they use along with their chronological distribution. As observed, for conventional turbines, only in [61,62,64], the derived cost estimations are not exclusively expressed as a function of power at design point P d and head at design point H d . Conversely, PAT estimation is usually correlated as a product of flow rate at design point Q d and H d . Table 8 provides a reasonable estimate of the total turbine cost, according to empirical approaches available in the literature that correlate cost only with power capacity (specific cost).
Compared to small run-of-river hydropower plants (<1 MW), the flow rate through WDS pipelines is lower. Moreover, in urban WDSs, the diameter of the main distribution pipeline rarely exceeds 500 mm. For pipeline safety, reduction in water losses, and sedimentation prevention, the pipe diameter is selected so that the water velocity is typically kept between 0.5 and 1 m/s for most distribution pipes (90–300 mm) and between 1 and 2 m/s for main distribution pipes (>300 mm) and their flow rate can range up to 0.5 m/s, as illustrated in Figure 2 and Figure 3. Therefore, expressions like the ones found in Table 7 by [64] cannot be directly applied due to the higher flow rate and velocity values that they were derived from. The correlations for turbines in Table 7 from [76] are not applicable to WDS either, as they were developed from a statistical analysis of small (>1 MW) to large (>50 MW) projects. The equations from [60] are directly applicable to WDS locations with no downstream pressure requirements, as they were derived from turbine technologies that provide limited to no pressure regulation. Additionally, the equation from [61] should be employed with care, since it includes a negative fixed cost (independent of power or head) that may lead to a misleading interpretation of the results, especially for low-power outputs (<10 kW). Finally, equations like [16,77] that calculate only the cost of the turbogenerator set should be used in conjunction with expressions like from [42] in order to estimate the total electro-mechanical cost.
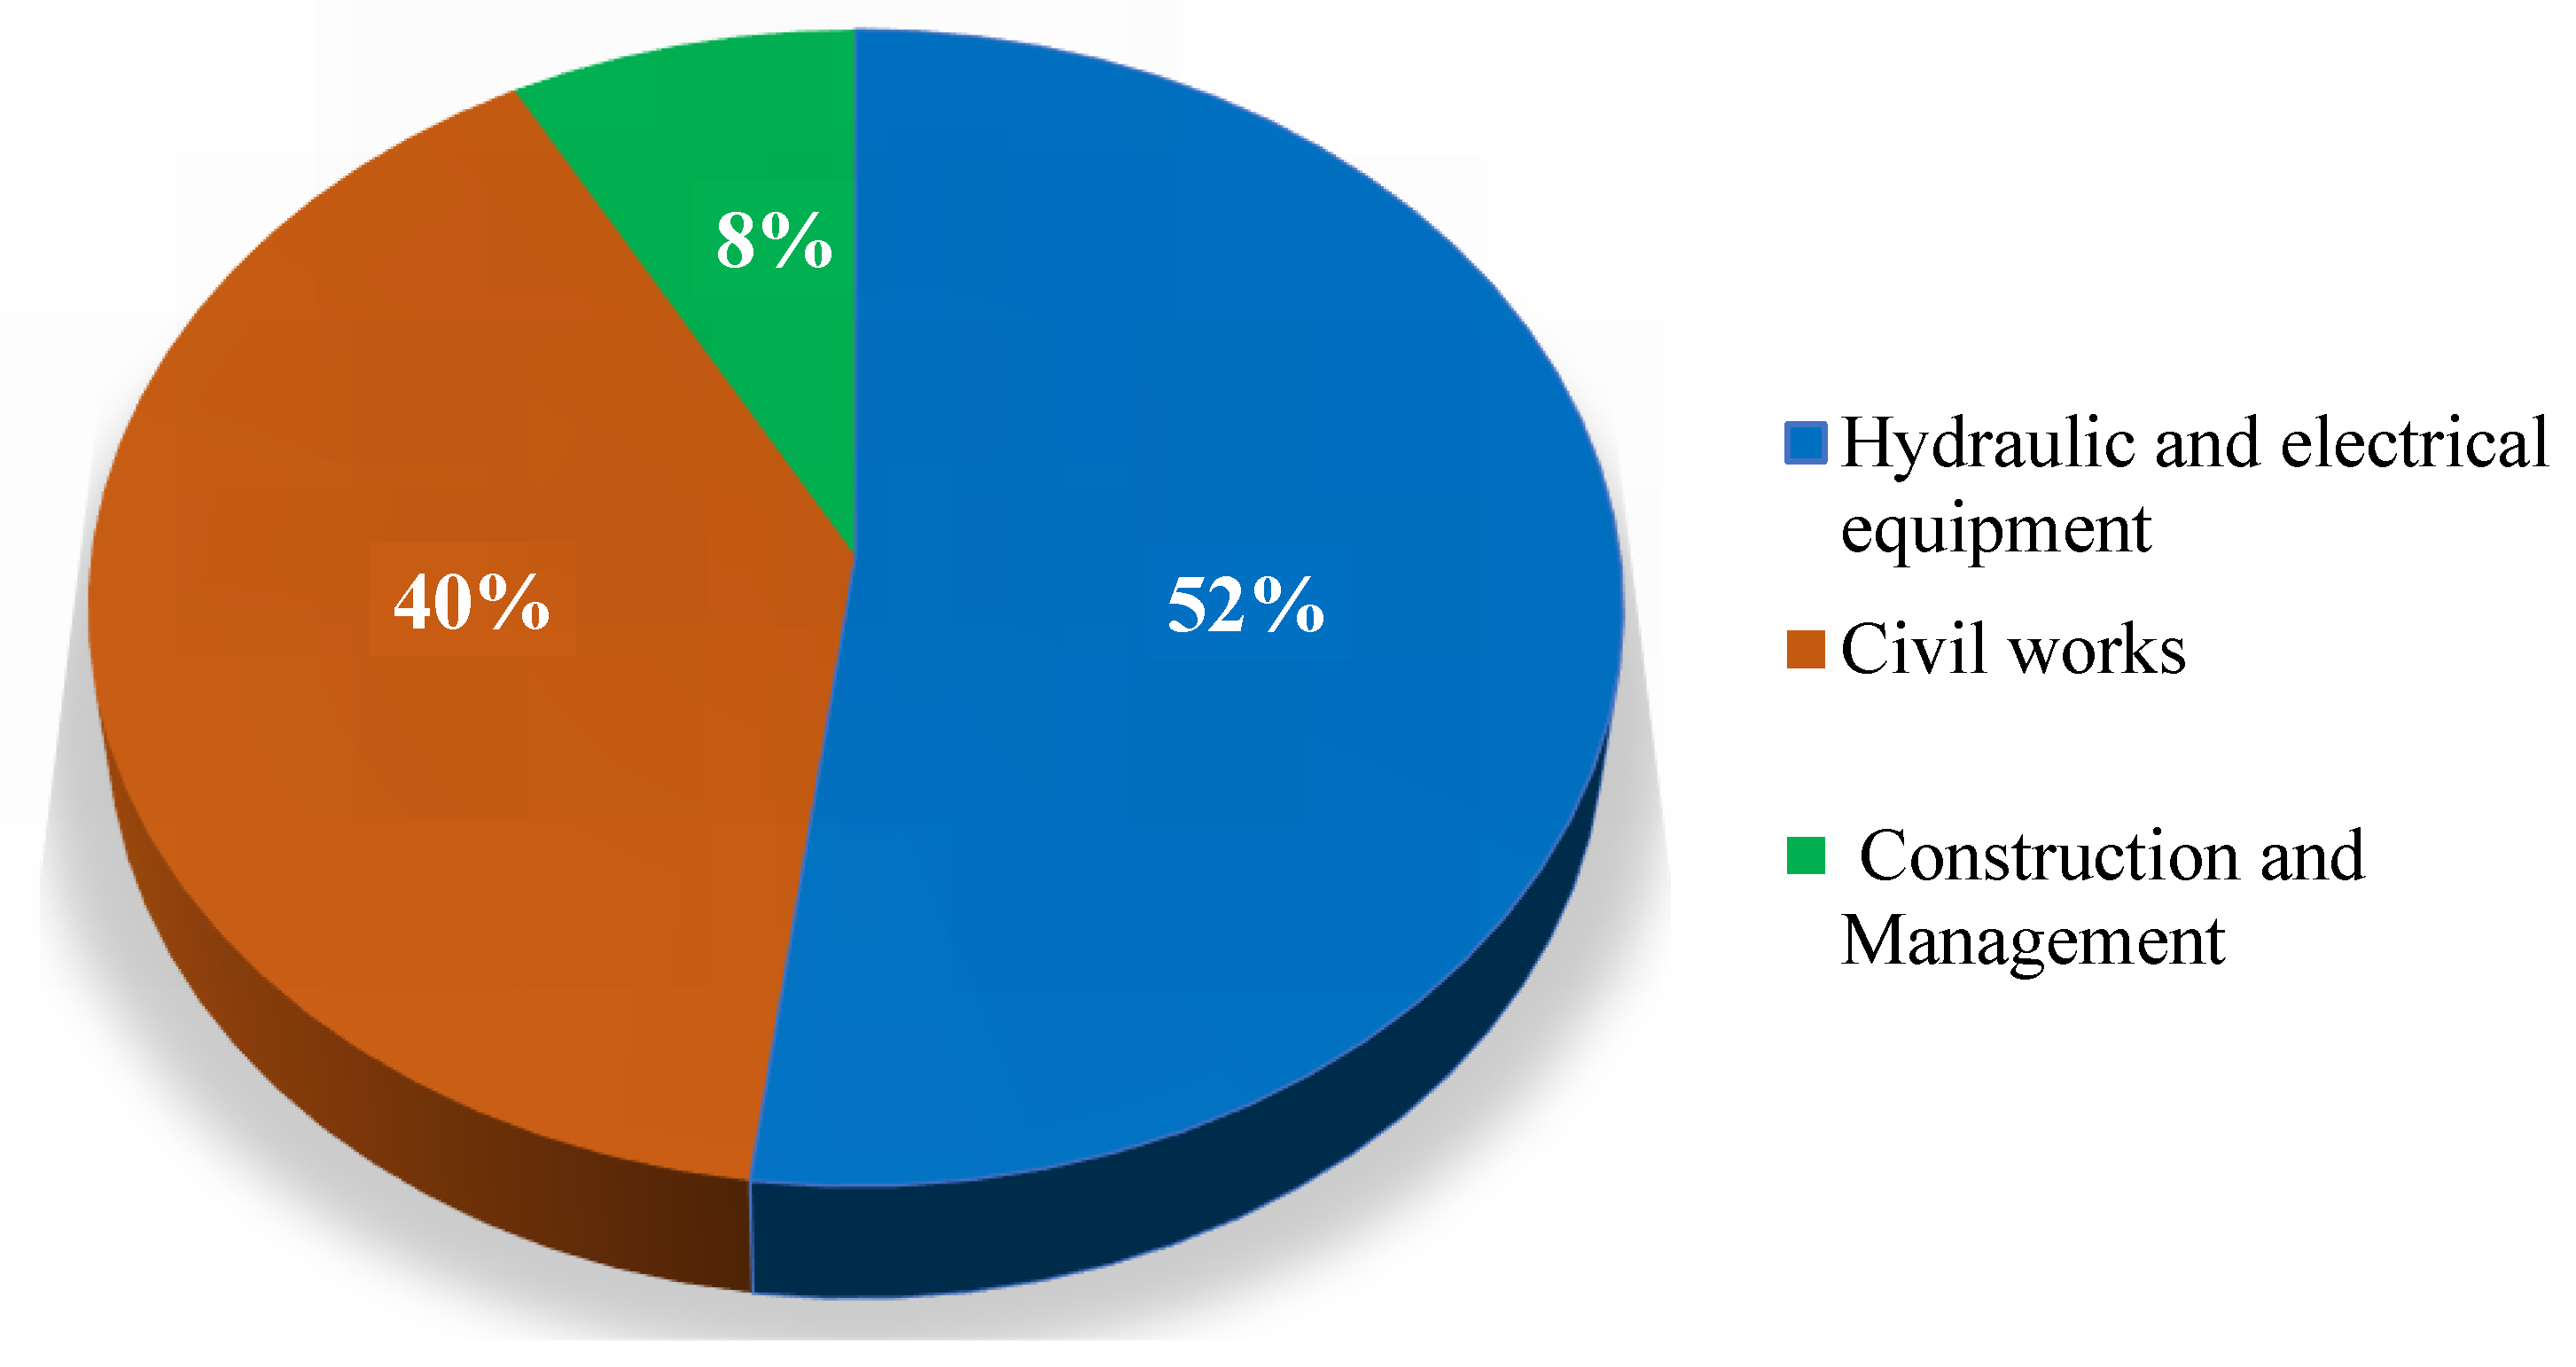
The total turbine cost is divided into a fixed and a variable component. The fixed cost includes the civil works cost (materials and labor), the electrical and hydraulic equipment cost (turbogenerator set, electrical regulation, and control system), and the construction and management costs. The typical distribution of these costs over the total fixed cost is depicted in Figure 7, as drawn from various studies that involve small hydropower plants [44,47,62,63,83]. For micro-hydropower projects (<100 kW), civil work costs comprise only 20% of the total costs due to their limited construction requirements (no dams or reservoirs) [39,60].
The variable cost includes the operation and maintenance (O&M) cost of the turbine. According to [84], for micro-hydropower, it is 2% on average of the total turbine cost. Reference [83] proposes that any value between 1% and 6% is realistic. Specifically for PATs, the O&M is around 15% of the total installation cost, according to [41,80,81].
The service lifetime of the various turbines is very crucial for the assessment of their economic viability. For conventional turbines, it ranges from 25 to 50 years [9], while for PATs, it ranges between 10 and 15 years [1,20,85,86]. According to various financial indexes, a discount rate between 5 and 20% is typically used [87], with the adoption of 10% being the most frequent and adequate for the interpretation of the results [88,89]. A rule of thumb for economic viability is that the payback period should be at least half of the project’s lifetime, meaning that the upfront turbine cost should be recovered in 15 years for conventional turbines and in 5–7 years for PATs. However, the adopted feed-in tariff for generated power and discount rate vary significantly for different countries and regions as shown in numerous studies [9,10,39,40,78,79,85]. Therefore, before assessing the profitability of investing in a hydroturbine scheme, their values should be adjusted in order to reflect local standards and current market prices and be adapted to the respective turbine technology. Moreover, for turbines replacing PRVs, the shadow cost of avoiding the purchase and O&M cost of a PRV should be considered, also over the turbine’s service lifetime.

5. Discussion

Based on the existing literature findings, there are several aspects that should be considered when addressing the possibility of installing energy recovery pressure-regulating turbines within WDSs. The main guidelines provided by the literature regarding the turbine projects, specifically developed for WDSs, are summarized below:
  • The energy yield of the site should typically exceed 3 kW, otherwise the project’s financial viability is highly uncertain.
  • For sites with insignificant variation in operating conditions (flow and head) and an installed capacity smaller than 20 kW, PATs are the most cost-efficient solution. However, when accurate pressure regulation is also required, low-cost reaction turbines are a better choice.
  • During a preliminary cost assessment analysis, it is better to deploy a cost model derived from data sets that are closer to those of the case under study. This ensures a lower discrepancy between expected and actual cost.
  • Impulse turbines should be considered at locations without any downstream pressure requirements, such as, BPTs.
  • Especially for PATs, whose performance prediction is still accompanied with uncertainties, optimal placement is crucial for the economic feasibility of the project.
  • When estimating the total cost of the turbine, the contribution of the associated costs should be determined with caution for each scenario, as they differ for each turbine type (Pelton and Francis), country (materials price and labor wage), and WDS location (whether they employ existing infrastructure or not). For example, when a turbine is specifically designed to replace a PRV, it will be accommodated within the existing PRV station, so civil work costs are already paid; hydraulic equipment and pipes in parallel are already in place. Conversely, at BPT locations, such hydraulic equipment will be required, as well as the installation of a bypass system, introduction of gate valves, etc.
  • A turbine architecture with fewer moving parts is simpler and cheaper. Therefore, when the flow and head variation is not significant, electrical regulation (electronic load controllers) should be preferred over the more expensive hydraulic regulation (hydraulic and mechanical governors) required for part-flow operation.
  • In order to ensure the economic feasibility of the project, the payback period should be at least two times lower than the turbine’s expected lifespan.
  • During all instances, the turbine design and operation should be carefully considered, so that the minimum pressure requirements of the WDS are not violated, thus preventing any kind of disruption to the service quality of the network.
  • During the assessment of the economic viability of pressure-regulating turbines replacing existing PRVs, the significant shadow cost of avoiding the purchase and O&M cost of a PRV should be considered over the turbine’s service lifetime. Under the same rationale, the environmental repercussions should be considered as well (e.g., the reduction in CO2 emissions and potential water savings created by the turbine pressure regulation).
The main economic and technical challenges that accompany the installation of energy recovery machines in WDSs are as follows:
  • The selection of the appropriate turbine type, design, and dimension relies heavily upon site conditions, and thus there is need for extensive hydraulic data (water flow rate and head) from several years before the installation [12].
  • The number of installed micro-hydropower projects within WDSs is restricted, and the commercial availability of pico-hydroturbines is limited. As a result, an investment from private owners will become less probable.
  • Many institutional and regulatory aspects are still unresolved: no licensing protocols, lack of subsidies for the development of such mini projects, ambiguity on how the profits will be shared between water and electric system operators, etc.
  • Turbines generally require well-trained manpower with a certain level of expertise in order to perform their installation and maintenance.
  • Sites of high-energy potential are generally located at the inner parts of the WDS [24,25,39]. Operators are usually reluctant to intervene at such critical areas, especially when turbines are not specifically designed to simultaneously provide accurate pressure regulation.
  • The connection point of the turbine to the PDS should be appropriately selected, so that it allows full absorption of the produced energy, without creating adverse effects on bus voltage levels. This way, the net monetary benefit of the turbine operation will be maximized [39].
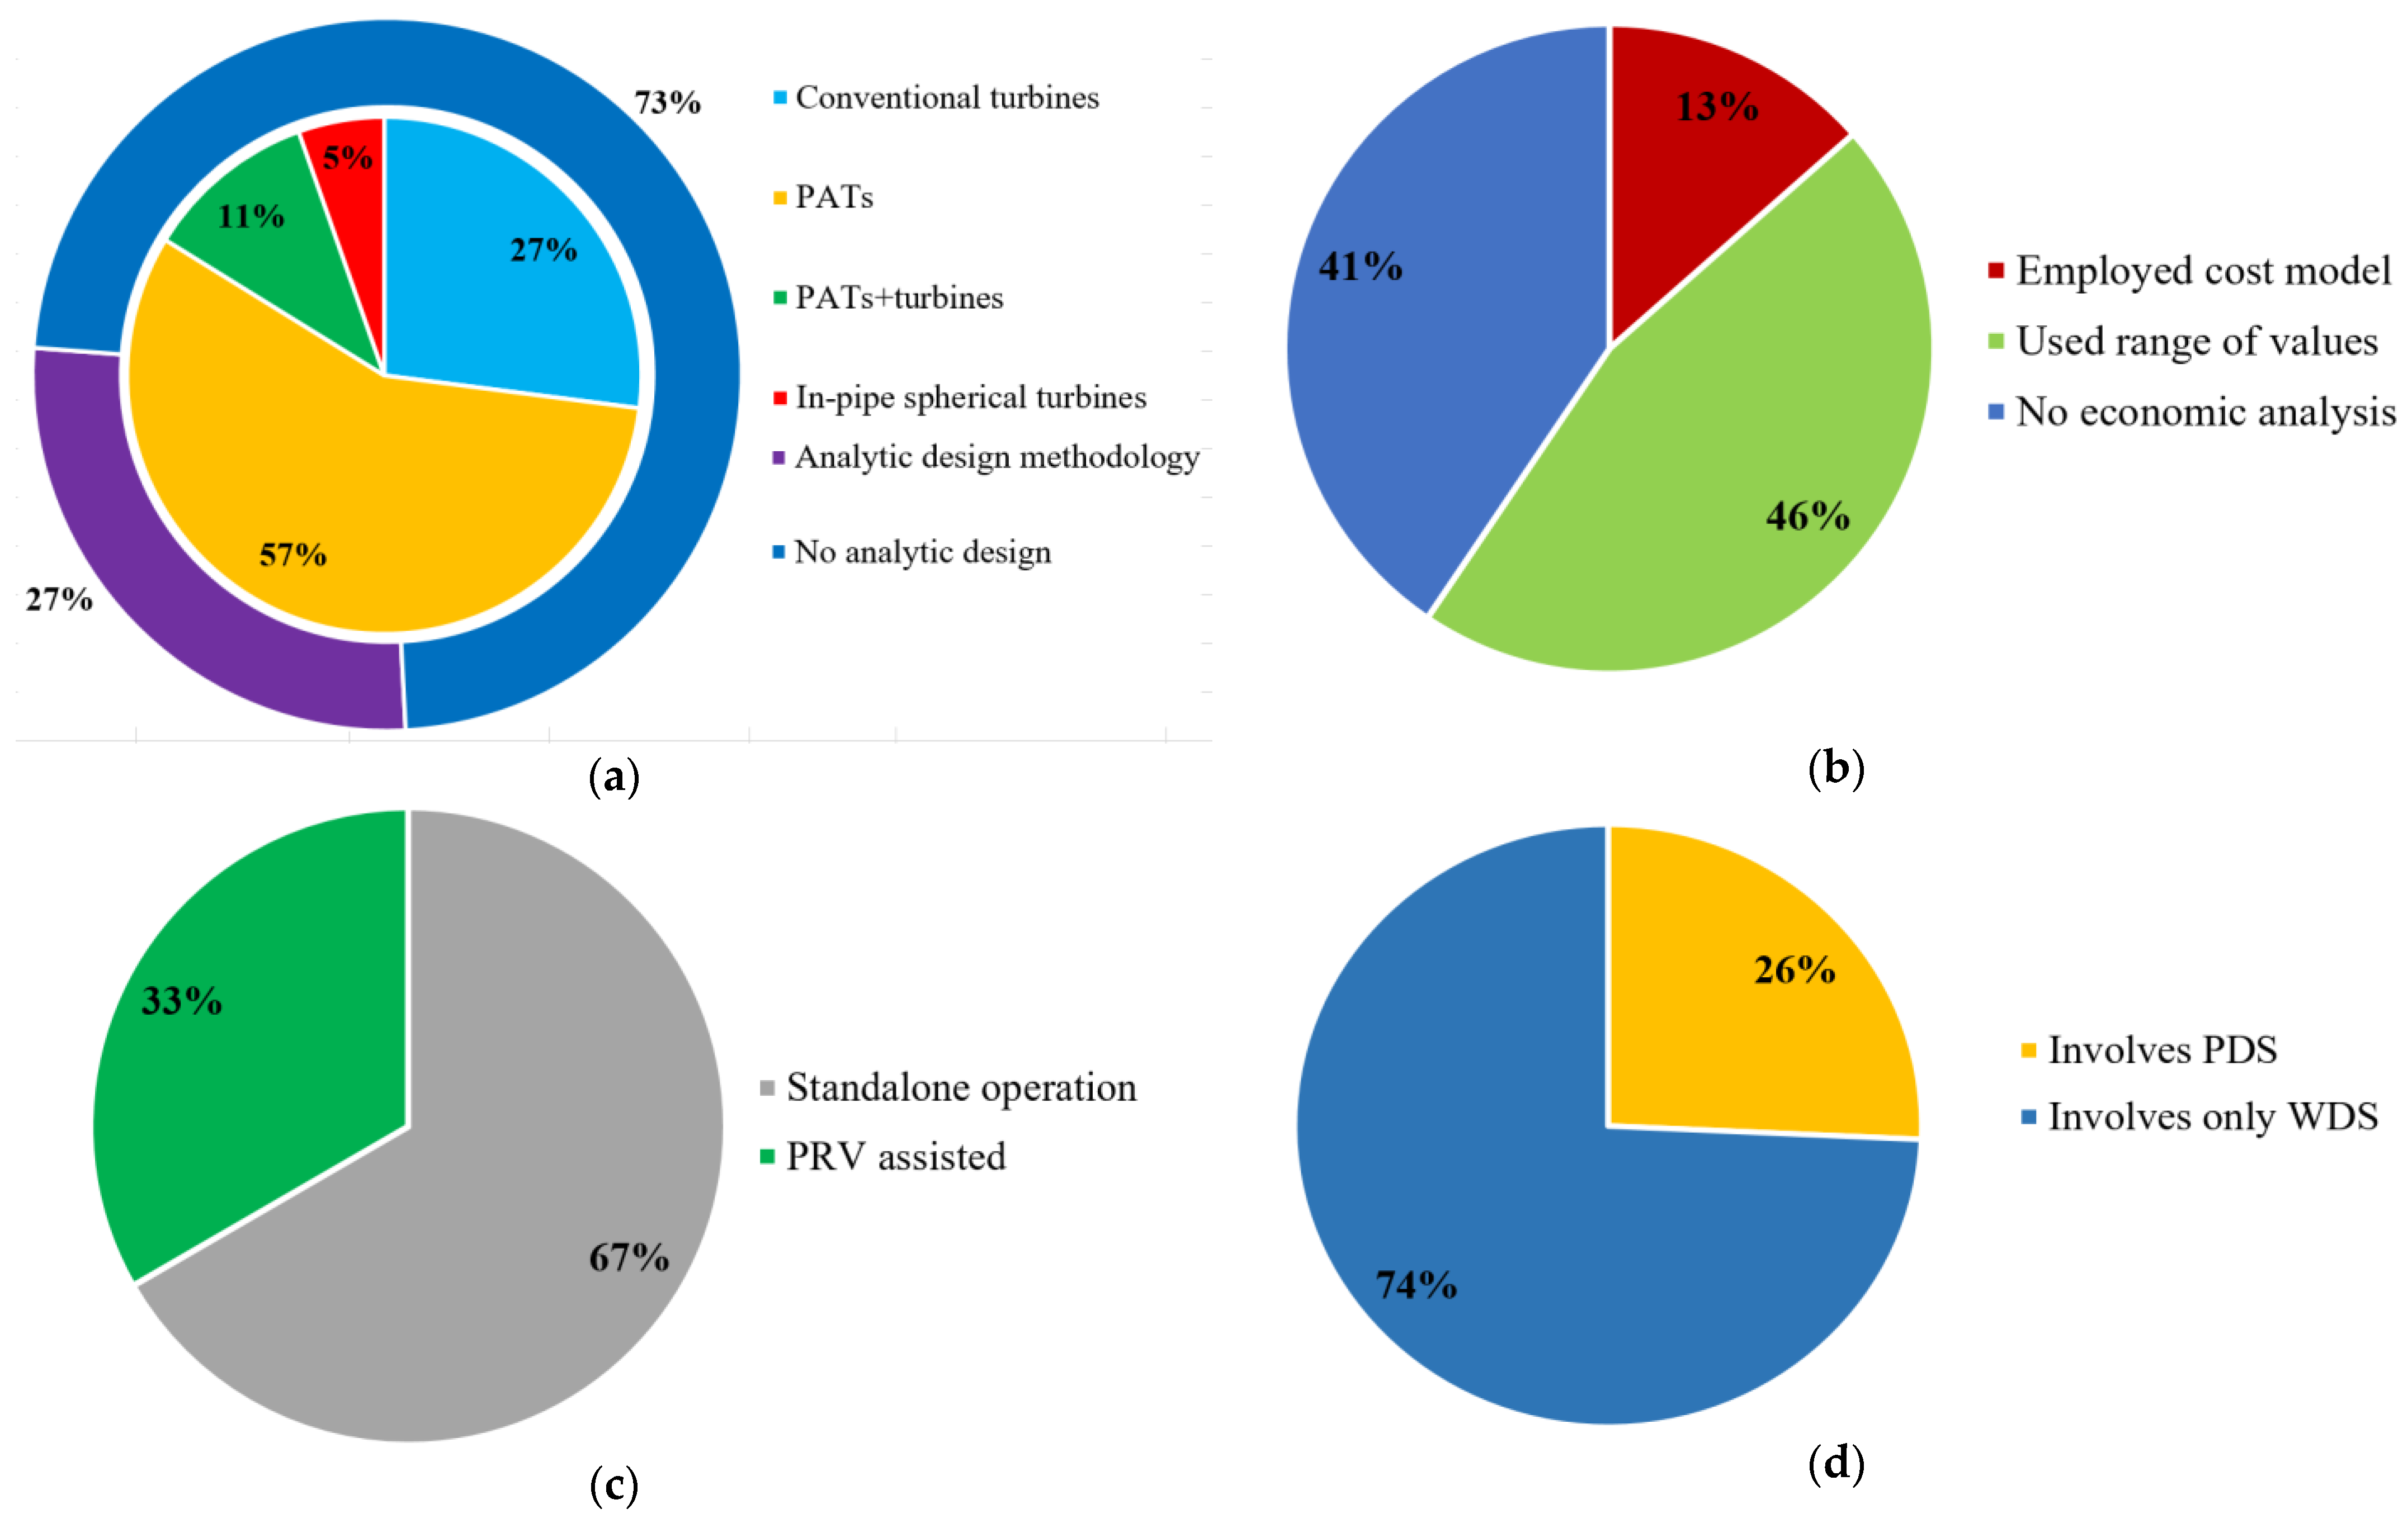
Finally, a categorization of the above-referenced studies that consider the employment of energy recovery machines within WDSs (37 in total), considering their different turbine types, modeling approaches, and scope, is illustrated in Figure 8. It is evident that the vast majority of research investigates the issue mainly from the perspective of dissipated energy, with the number of studies that consider a turbine’s analytical design and pressure regulation ability and incorporate the constraints imposed by both WDSs and PDSs into their modeling being rather limited. The most dominant turbine technology is the PAT, mainly due its low purchase cost and on-self availability.

6. Conclusions

This paper provides a systematic review regarding energy harvesting technologies installed in WDSs. An extensive description is given for the different turbine types and their performance and infrastructure requirements, with an emphasis on their benefits and limitations in power generation, pressure regulation, and placement within the WDS. Despite their efficiency in pressure management, hydraulic devices and structures like PRVs or BPTs represent a significant potential for renewable energy that can be exploited with the employment of energy recovery turbines. Conventional turbines are generally more expensive compared to PATs, but are a proven better choice when accurate pressure regulation is required over a wide range of flow and inlet pressure. The available cost models for the estimation of the electrical and hydraulic equipment depend on several factors such as turbine type, power capacity, and design point, while the total turbine cost also relies on various geographical parameters, since the cost of materials and labor wages vary from country to country.
Future research should focus on the development of optimization frameworks that involve the operational constraints and intricacies of both WDSs and PDSs, while ensuring maximum power generation, short turbine payback periods, and optimal service quality to both systems. Future research focusing on the coordinated operation and planning of resources on both systems could drastically increase the economic viability of energy recovery projects in WDSs, while ensuring maximum exploitation of existing infrastructure and facilities.

Author Contributions

Conceptualization, P.N.V.; methodology, A.A.B.-D.; writing—original draft preparation, A.A.B.-D.; writing—review and editing, A.A.B.-D. and P.N.V.; supervision, P.N.V. All authors have read and agreed to the published version of the manuscript.

Funding

This research received no external funding.

Data Availability Statement

Not applicable.

Conflicts of Interest

The authors declare no conflicts of interest.

References

  1. Stefanizzi, M.; Capurso, T.; Balacco, G.; Binetti, M.; Camporeale, S.M.; Torresi, M. Selection, Control and Techno-Economic Feasibility of Pumps as Turbines in Water Distribution Networks. Renew. Energy 2020, 162, 1292–1306. [Google Scholar] [CrossRef]
  2. Itani, Y.; Soliman, M.R.; Kahil, M. Recovering Energy by Hydro-Turbines Application in Water Transmission Pipelines: A Case Study West of Saudi Arabia. Energy 2020, 211, 118613. [Google Scholar] [CrossRef]
  3. Lahimer, A.; Alghoul, M.; Sopian, K.; Amin, N.; Asim, N.; Fadhel, M. Research and Development Aspects of Pico-Hydro Power. Renew. Sustain. Energy Rev. 2012, 16, 5861–5878. [Google Scholar] [CrossRef]
  4. Ferrarese, G.; Malavasi, S. Perspectives of Water Distribution Networks with the GreenValve System. Water 2020, 12, 1579. [Google Scholar] [CrossRef]
  5. Hamlehdar, M.; Yousefi, H.; Noorollahi, Y.; Mohammadi, M. Energy Recovery from Water Distribution Networks Using Micro Hydropower: A Case Study in Iran. Energy 2022, 252, 124024. [Google Scholar] [CrossRef]
  6. Boroomandnia, A.; Rismanchi, B.; Wu, W. A Review of Micro Hydro Systems in Urban Areas: Opportunities and Challenges. Renew. Sustain. Energy Rev. 2022, 169, 112866. [Google Scholar] [CrossRef]
  7. Le Marre, M.; Mandin, P.; Lanoisellé, J.-L.; Bezuglov, R. Experimental Study on Performance Predictions of Pumps as Turbine. Energy Convers. Manag. 2023, 292, 117235. [Google Scholar] [CrossRef]
  8. Poullikkas, A. A Comparative Assessment of Net Metering and Feed in Tariff Schemes for Residential PV Systems. Sustain. Energy Technol. Assessments 2013, 3, 1–8. [Google Scholar] [CrossRef]
  9. McNabola, A.; Coughlan, P.; Williams, A.P. The Technical and Economic Feasibility of Energy Recovery in Water Supply Networks. Renew. Energy Power Qual. J. 2011, 1, 1123–1127. [Google Scholar] [CrossRef]
  10. McNabola, A.; Coughlan, P.; Williams, A.P. Energy Recovery in the Water Industry: An Assessment of the Potential of Micro-Hydropower. Water Environ. J. 2013, 28, 294–304. [Google Scholar] [CrossRef]
  11. Voltz, T.J.; Grischek, T. Microturbines at Drinking Water Tanks Fed by Gravity Pipelines: A Method and Excel Tool for Maximizing Annual Energy Generation Based on Historical Tank Outflow Data. Water 2019, 11, 1403. [Google Scholar] [CrossRef]
  12. Ramos, H.M.; Borga, A.; Simão, M. New Design Solutions for Low-Power Energy Production in Water Pipe Systems. Water Sci. Eng. 2009, 2, 69–84. [Google Scholar] [CrossRef]
  13. Morani, M.C.; Carravetta, A.; Fecarotta, O. A Mixed Integer Non-Linear Programming Model for the Optimal Valve Placement within Water Distribution Networks. Environ. Sci. Proc. 2022, 21, 2. [Google Scholar] [CrossRef]
  14. García, I.F.; Novara, D.; Mc Nabola, A. A Model for Selecting the Most Cost-Effective Pressure Control Device for More Sustainable Water Supply Networks. Water 2019, 11, 1297. [Google Scholar] [CrossRef]
  15. Pérez-Sánchez, M.; Sánchez-Romero, F.J.; Ramos, H.M.; López-Jiménez, P.A. Improved Planning of Energy Recovery in Water Systems Using a New Analytic Approach to PAT Performance Curves. Water 2020, 12, 468. [Google Scholar] [CrossRef]
  16. Algieri, A.; Zema, D.A.; Nicotra, A.; Zimbone, S.M. Potential Energy Exploitation in Collective Irrigation Systems Using Pumps as Turbines: A Case Study in Calabria (Southern Italy). J. Clean. Prod. 2020, 257, 120538. [Google Scholar] [CrossRef]
  17. Barbarelli, S.; Amelio, M.; Florio, G. Predictive Model Estimating the Performances of Centrifugal Pumps Used as Turbines. Energy 2016, 107, 103–121. [Google Scholar] [CrossRef]
  18. Venturini, M.; Manservigi, L.; Alvisi, S.; Simani, S. Development of a physics-based model to predict the performance of pumps as turbines. Appl. Energy 2018, 231, 343–354. [Google Scholar] [CrossRef]
  19. Venturini, M.; Alvisi, S.; Simani, S.; Manservigi, L. Energy production by means of Pumps As Turbines in water distribution networks. Energies 2017, 10, 1666. [Google Scholar] [CrossRef]
  20. Nasir, A.; Salau, A.O.; Dribssa, E.; Girma, M. Technical and Economic Analysis of a Pump as a Turbine for Rural Electrification. Int. J. Sustain. Energy 2023, 42, 914–928. [Google Scholar] [CrossRef]
  21. Muhammetoglu, A.; Karadirek, I.E.; Ozen, O.; Muhammetoglu, H. Full-Scale PAT Application for Energy Production and Pressure Reduction in a Water Distribution Network. J. Water Resour. Plan. Manag. 2017, 143, 04017040. [Google Scholar] [CrossRef]
  22. Lima, G.M.; Luvizotto, E.; Brentan, B.M. Selection and Location of Pumps as Turbines Substituting Pressure Reducing Valves. Renew. Energy 2017, 109, 392–405. [Google Scholar] [CrossRef]
  23. Rodríguez-Pérez, M.; Pulido-Calvo, I.; Cáceres-Ramos, P. A Computer Program to Support the Selection of Turbines to Recover Unused Energy at Hydraulic Networks. Water 2021, 13, 467. [Google Scholar] [CrossRef]
  24. Bideris-Davos, A.A.; Vovos, P.N. Algorithm for Appropriate Design of Hydroelectric Turbines as Replacements for Pressure Reduction Valves in Water Distribution Systems. Water 2023, 15, 554. [Google Scholar] [CrossRef]
  25. Morani, M.C.; Simão, M.; Gazur, I.; Santos, R.S.; Carravetta, A.; Fecarotta, O.; Ramos, H.M. Pressure Drop and Energy Recovery with a New Centrifugal Micro-Turbine: Fundamentals and Application in a Real WDN. Energies 2022, 15, 1528. [Google Scholar] [CrossRef]
  26. Mosbahi, M.; Ayadi, A.; Mabrouki, I.; Driss, Z.; Tucciarelli, T.; Abid, M.S. Effect of the Converging Pipe on the Performance of a Lucid Spherical Rotor. Arab. J. Sci. Eng. 2018, 44, 1583–1600. [Google Scholar] [CrossRef]
  27. Oladosu, T.L.; Koya, O.A. Numerical Analysis of Lift-Based In-Pipe Turbine for Predicting Hydropower Harnessing Potential in Selected Water Distribution Networks for Waterlines Optimization. Eng. Sci. Technol. Int. J. 2018, 21, 672–678. [Google Scholar] [CrossRef]
  28. Muratoglu, A.; Demir, M.S. Modeling Spherical Turbines for In-Pipe Energy Conversion. Ocean Eng. 2022, 246, 110497. [Google Scholar] [CrossRef]
  29. Sari, M.A.; Badruzzaman, M.; Cherchi, C.; Swindle, M.; Ajami, N.; Jacangelo, J.G. Recent innovations and trends in in-conduit hydropower technologies and their applications in water distribution systems. J. Environ. Manag. 2018, 228, 416–428. [Google Scholar] [CrossRef] [PubMed]
  30. Casini, M. Harvesting Energy from In-Pipe Hydro Systems at Urban and Building Scale. Int. J. Smart Grid Clean Energy 2015, 4, 316–327. [Google Scholar] [CrossRef]
  31. Saini, G.; Saini, R.P. A Review on Technology, Configurations, and Performance of Cross-Flow Hydrokinetic Turbines. Int. J. Energy Res. 2019, 43, 6639–6679. [Google Scholar] [CrossRef]
  32. Zamzam, A.S.; Dall’Anese, E.; Zhao, C.; Taylor, J.A.; Sidiropoulos, N.D. Optimal Water–Power Flow-Problem: Formulation and Distributed Optimal Solution. IEEE Trans. Control Netw. Syst. 2019, 6, 37–47. [Google Scholar] [CrossRef]
  33. Singh, M.K.; Kekatos, V. Optimal Scheduling of Water Distribution Systems. IEEE Trans. Control Netw. Syst. 2020, 7, 711–723. [Google Scholar] [CrossRef]
  34. Menke, R.; Abraham, E.; Parpas, P.; Stoianov, I. Demonstrating Demand Response from Water Distribution System through Pump Scheduling. Appl. Energy 2016, 170, 377–387. [Google Scholar] [CrossRef]
  35. Oikonomou, K.; Parvania, M. Optimal Coordinated Operation of Interdependent Power and Water Distribution Systems. IEEE Trans. Smart Grid 2020, 11, 4784–4794. [Google Scholar] [CrossRef]
  36. Li, Q.; Yu, S.; Al-Sumaiti, A.S.; Turitsyn, K. Micro Water–Energy Nexus: Optimal Demand-Side Management and Quasi-Convex Hull Relaxation. IEEE Trans. Control Netw. Syst. 2019, 6, 1313–1322. [Google Scholar] [CrossRef]
  37. Majidi, M.; Rodriguez-Garcia, L.; Mosier, T.; Parvania, M. Coordinated Operation of Pumped-Storage Hydropower with Power and Water Distribution Systems. Int. J. Electr. Power Energy Syst. 2022, 142, 108297. [Google Scholar] [CrossRef]
  38. Najafi, J.; Peiravi, A.; Anvari-Moghaddam, A.; Guerrero, J. An Efficient Interactive Framework for Improving Resilience of Power-Water Distribution Systems with Multiple Privately-Owned Microgrids. Int. J. Electr. Power Energy Syst. 2020, 116, 105550. [Google Scholar] [CrossRef]
  39. Bideris-Davos, A.A.; Vovos, P.N. Co-Optimization of Power and Water Distribution Systems for Simultaneous Hydropower Generation and Water Pressure Regulation. Energy Rep. 2024, 11, 3135–3148. [Google Scholar] [CrossRef]
  40. Petrollese, M.; Seche, P.; Cocco, D. Analysis and Optimization of Solar-Pumped Hydro Storage Systems Integrated in Water Supply Networks. Energy 2019, 189, 116176. [Google Scholar] [CrossRef]
  41. Marini, G.; Di Menna, F.; Maio, M.; Fontana, N. HYPER: Computer-Assisted Optimal Pump-as-Turbine (PAT) Selection for Microhydropower Generation and Pressure Regulation in a Water Distribution Network (WDN). Water 2023, 15, 2807. [Google Scholar] [CrossRef]
  42. Saidur, R.; Mekhilef, S.; Ali, M.; Safari, A.; Mohammed, H. Applications of Variable Speed Drive (VSD) in Electrical Motors Energy Savings. Renew. Sustain. Energy Rev. 2012, 16, 543–550. [Google Scholar] [CrossRef]
  43. Du, J.; Yang, H.; Shen, Z.; Chen, J. Micro Hydro Power Generation from Water Supply System in High Rise Buildings Using Pump as Turbines. Energy 2017, 137, 431–440. [Google Scholar] [CrossRef]
  44. Laghari, J.; Mokhlis, H.; Bakar, A.; Mohammad, H. A Comprehensive Overview of New Designs in the Hydraulic, Electrical Equipments and Controllers of Mini Hydro Power Plants Making It Cost Effective Technology. Renew. Sustain. Energy Rev. 2013, 20, 279–293. [Google Scholar] [CrossRef]
  45. Pérez-Sánchez, M.; Sánchez-Romero, F.J.; Ramos, H.M.; López-Jiménez, P.A. Energy Recovery in Existing Water Networks: Towards Greater Sustainability. Water 2017, 9, 97. [Google Scholar] [CrossRef]
  46. Elbatran, A.; Yaakob, O.; Ahmed, Y.M.; Shabara, H. Operation, Performance and Economic Analysis of Low Head Micro-Hydropower Turbines for Rural and Remote Areas: A Review. Renew. Sustain. Energy Rev. 2015, 43, 40–50. [Google Scholar] [CrossRef]
  47. Samora, I.; Hasmatuchi, V.; Münch-Alligné, C.; Franca, M.J.; Schleiss, A.J.; Ramos, H.M. Experimental Characterization of a Five Blade Tubular Propeller Turbine for Pipe Inline Installation. Renew. Energy 2016, 95, 356–366. [Google Scholar] [CrossRef]
  48. Postacchini, M.; Darvini, G.; Finizio, F.; Pelagalli, L.; Soldini, L.; Di Giuseppe, E. Hydropower Generation Through Pump as Turbine: Experimental Study and Potential Application to Small-Scale WDN. Water 2020, 12, 958. [Google Scholar] [CrossRef]
  49. Ávila, C.A.M.; Sánchez-Romero, F.-J.; López-Jiménez, P.A.; Pérez-Sánchez, M. Definition of the Operational Curves by Modification of the Affinity Laws to Improve the Simulation of PATs. Water 2021, 13, 1880. [Google Scholar] [CrossRef]
  50. Yang, S.-S.; Derakhshan, S.; Kong, F.-Y. Theoretical, Numerical and Experimental Prediction of Pump as Turbine Performance. Renew. Energy 2012, 48, 507–513. [Google Scholar] [CrossRef]
  51. Papantonis, D. Hydraulic Turbomachines: Pumps, Turbines-Hydrodynamic Transmissions, 2nd ed.; Tsotras: Athens, Greece, 2016; Chapter 6. (In Greek) [Google Scholar]
  52. Rossi, M.; Nigro, A.; Renzi, M. A Predicting Model of PaTs’ Performance in Off-Design Operating Conditions. Energy Procedia 2019, 158, 123–128. [Google Scholar] [CrossRef]
  53. Novara, D.; McNabola, A. A Model for the Extrapolation of the Characteristic Curves of Pumps as Turbines from a Datum Best Efficiency Point. Energy Convers. Manag. 2018, 174, 1–7. [Google Scholar] [CrossRef]
  54. Novara, D.; McNabola, A. The Development of a Decision Support Software for the Design of Micro-Hydropower Schemes Utilizing a Pump as Turbine. Proceedings 2018, 2, 678. [Google Scholar] [CrossRef]
  55. Carravetta, A.; Conte, M.; Fecarotta, O.; Ramos, H. Evaluation of PAT Performances by Modified Affinity Law. Procedia Eng. 2014, 89, 581–587. [Google Scholar] [CrossRef]
  56. Fecarotta, O.; Carravetta, A.; Ramos, H.M.; Martino, R. An Improved Affinity Model to Enhance Variable Operating Strategy for Pumps Used as Turbines. J. Hydraul. Res. 2016, 54, 332–341. [Google Scholar] [CrossRef]
  57. Pérez-Sánchez, M.; López-Jiménez, P.A.; Ramos, H.M. Modified Affinity Laws in Hydraulic Machines towards the Best Efficiency Line. Water Resour. Manag. 2017, 32, 829–844. [Google Scholar] [CrossRef]
  58. Tahani, M.; Kandi, A.; Moghimi, M.; Houreh, S.D. Rotational speed variation assessment of centrifugal pump-as-turbine as an energy utilization device under water distribution network condition. Energy 2020, 213, 118502. [Google Scholar] [CrossRef]
  59. Fontanella, S.; Fecarotta, O.; Molino, B.; Cozzolino, L.; Della Morte, R. A Performance Prediction Model for Pumps as Turbines (PATs). Water 2020, 12, 1175. [Google Scholar] [CrossRef]
  60. Butchers, J.; Williamson, S.; Booker, J.; Maitland, T.; Karki, P.B.; Pradhan, B.R.; Pradhan, S.R.; Gautam, B. Cost Estimation of Micro-Hydropower Equipment in Nepal. Dev. Eng. 2022, 7, 100097. [Google Scholar] [CrossRef]
  61. Cavazzini, G.; Santolin, A.; Pavesi, G.; Ardizzon, G. Accurate Estimation Model for Small and Micro Hydropower Plants Costs in Hybrid Energy Systems Modelling. Energy 2016, 103, 746–757. [Google Scholar] [CrossRef]
  62. Malhan, P.; Mittal, M. Evaluation of Different Statistical Techniques for Developing Cost Correlations of Micro Hydro Power Plants. Sustain. Energy Technol. Assessments 2021, 43, 100904. [Google Scholar] [CrossRef]
  63. Ogayar, B.; Vidal, P. Cost Determination of the Electro-Mechanical Equipment of a Small Hydro-Power Plant. Renew. Energy 2009, 34, 6–13. [Google Scholar] [CrossRef]
  64. Aggidis, G.; Luchinskaya, E.; Rothschild, R.; Howard, D. The Costs of Small-Scale Hydro Power Production: Impact on the Development of Existing Potential. Renew. Energy 2010, 35, 2632–2638. [Google Scholar] [CrossRef]
  65. Gordon, J.L.; Penman, A.C. Quick estimating techniques for small hydro potential. J. Water Power Dam Constr. 1979, 31, 46–51. [Google Scholar]
  66. Lasu, S.; Persson, T. Mini Power Station in Sweden. Int. Fachtag Uber Umbau Erweitrung Wasserkr. 1979, 34, 163–172. [Google Scholar]
  67. Gulliver, J.S.; Dotan, A. Cost estimated for hydropower at existing dams. J. Energy Eng. 1984, 110, 204–214. [Google Scholar] [CrossRef]
  68. Wallace, A.R.; Whittington HW, P.; Henderson, D.S. An Economic Analysis of the Capital Cost in Micro Hydro. Proceedings 3rd Int. Conf. Small Hydro. 1988, p. 8. Available online: https://www.research.ed.ac.uk/en/publications/an-economic-analysis-of-the-capital-cost-in-micro-hydro (accessed on 20 June 2024).
  69. Chenal, R. Evaluation du Cout de Construction D’une Petite Centrale Hydroelectrique Nouvelle et Complete et du Prix de Revient du kwh (p < d 1000 kw). Suisse: MHylab. 2000. Available online: https://www.mhylab.ch/images/public/images/cout_PCH.pdf (accessed on 20 June 2024).
  70. Voros, N.; Kiranoudis, C.; Maroulis, Z. Short-Cut Design of Small Hydroelectric Plants. Renew. Energy 2000, 19, 545–563. [Google Scholar] [CrossRef]
  71. Papantonis, D. Small Hydro Power Station; Simeon: Athens, Greece, 2001. [Google Scholar]
  72. Gordon, J.L. Determining Ballpark costs for a proposed project. Hydro Rev. Worldwide 2003, 11, 37–41. [Google Scholar]
  73. Kaldellis, J.; Vlachou, D.; Korbakis, G. Techno-Economic Evaluation of Small Hydro Power Plants in Greece: A Complete Sensitivity Analysis. Energy Policy 2005, 33, 1969–1985. [Google Scholar] [CrossRef]
  74. Singal, S.; Saini, R. Analytical Approach for Development of Correlations for Cost of Canal-Based SHP Schemes. Renew. Energy 2008, 33, 2549–2558. [Google Scholar] [CrossRef]
  75. Filho, G.L.T.; dos Santos, I.F.S.; Barros, R.M. Cost Estimate of Small Hydroelectric Power Plants Based on the Aspect Factor. Renew. Sustain. Energy Rev. 2017, 77, 229–238. [Google Scholar] [CrossRef]
  76. Alzohbi, G. The Cost of Electromechanical Equipment in a Small Hydro Power Storage Plant. J. Energy Syst. 2018, 2, 238–259. [Google Scholar] [CrossRef]
  77. Novara, D.; Carravetta, A.; McNabola, A.; Ramos, H.M. Cost Model for Pumps as Turbines in Run-of-River and In-Pipe Microhydropower Applications. J. Water Resour. Plan. Manag. 2019, 145, 04019012. [Google Scholar] [CrossRef]
  78. Carravetta, A.; Del Giudice, G.; Fecarotta, O.; Ramos, H.M. PAT Design Strategy for Energy Recovery in Water Distribution Networks by Electrical Regulation. Energies 2013, 6, 411–424. [Google Scholar] [CrossRef]
  79. Gagliano, A.; Tina, G.; Nocera, F.; Patania, F. Technical and Economic Perspective for Repowering of Micro Hydro Power Plants: A Case Study of an Early XX Century Power Plant. Energy Procedia 2014, 62, 512–521. [Google Scholar] [CrossRef]
  80. De Marchis, M.; Freni, G. Pump as turbine implementation in a dynamic numerical model: Cost analysis for energy recovery in water distribution network. J. Hydroinform. 2015, 17, 347–360. [Google Scholar] [CrossRef]
  81. De Marchis, M.; Fontanazza, C.M.; Freni, G.; Messineo, A.; Milici, B.; Napoli, E.; Notaro, V.; Puleo, V.; Scopa, A. Energy Recovery in Water Distribution Networks. Implementation of Pumps as Turbine in a Dynamic Numerical Model. Procedia Eng. 2014, 70, 439–448. [Google Scholar] [CrossRef]
  82. Crespo Chacón, M.; Rodríguez Díaz, J.A.; García Morillo, J.; McNabola, A. Pump-as-Turbine Selection Methodology for Energy Recovery in Irrigation Networks: Minimising the Payback Period. Water 2019, 11, 149. [Google Scholar] [CrossRef]
  83. Hatata, A.; El-Saadawi, M.; Saad, S. A Feasibility Study of Small Hydro Power for Selected Locations in Egypt. Energy Strat. Rev. 2019, 24, 300–313. [Google Scholar] [CrossRef]
  84. Zema, D.A.; Nicotra, A.; Tamburino, V.; Zimbone, S.M. A Simple Method to Evaluate the Technical and Economic Feasibility of Micro Hydro Power Plants in Existing Irrigation Systems. Renew. Energy 2016, 85, 498–506. [Google Scholar] [CrossRef]
  85. Pugliese, F.; Giugni, M. An Operative Framework for the Optimal Selection of Centrifugal Pumps As Turbines (PATs) in Water Distribution Networks (WDNs). Water 2022, 14, 1785. [Google Scholar] [CrossRef]
  86. Kramer, M.; Terheiden, K.; Wieprecht, S. Pumps as turbines for efficient energy recovery in water supply networks. Renew. Energy 2018, 122, 17–25. [Google Scholar] [CrossRef]
  87. Klein, S.; Fox, E. A Review of Small Hydropower Performance and Cost. Renew. Sustain. Energy Rev. 2022, 169, 112898. [Google Scholar] [CrossRef]
  88. Kaldellis, J. The contribution of small hydro power stations to the electricity generation in Greece: Technical and economic considerations. Energy Policy 2007, 35, 2187–2196. [Google Scholar] [CrossRef]
  89. Forouzbakhsh, F.; Hosseini, S.; Vakilian, M. An Approach to the Investment Analysis of Small and Medium Hydro-Power Plants. Energy Policy 2007, 35, 1013–1024. [Google Scholar] [CrossRef]
Figure 1. Turbine (a), PAT (b), and PRV (c) infrastructure for pressure regulation in WDSs.
Water 16 02129 g001
Figure 7. Typical distribution of fixed costs in a small hydropower plants.
Water 16 02129 g007
Figure 8. Overview of the studies considering the (a) turbine types and designs; (b) pressure regulation capabilities; (c) economic assessment; (d) involvement of PDS; into the analysis.
Water 16 02129 g008
Table 1. Equipment cost [14,41,42].
ReferenceEquipment Cos t   Expression   *   ( E U R )
[41]PRV 6.7109 · D v 1.3107
Calculated from [14]Total PRV installation 0.185 · D p 2 + 6.497 · D p + 876.9
[42]Inverter 1239.9 + 165.72   P ( k W )
Note: * D p = pipe diameter (mm) and D v = valve diameter (mm).
Table 7. Cost equations available in the literature for the estimation of the electro-mechanical equipment cost. NS = Not Specified.
Cost FunctionTurbine Types Considered
/Project Classification
CountryYearReference
9000 P d 0.7 · H d 0.35   ( U S D ) Various/Micro-small
( 5   M W )
Canada1979[65]
97,436 P d 0.53 · H d 0.53 ( U S D )Various/SmallSweden1979[66]
9600 P d 0.82 · H d 0.35 ( U S D ) Various/Micro-SmallU.S.A.1984[67]
31,500 P d 0.25 · H d 0.75 U S D k W NS/SmallU.K.1998[68]
16,990 P d 0.91 · H d 0.14 + 34,120   E U R k W NS/Micro-smallSwitzerland2000[69]
40,000 P d 0.7 · H d 0.35 ( U S D ) Francis, Pelton, Kaplan/
Small
Greece2000[70]
20,570 P d 0.7 · H d 0.35 ( E U R ) Various/small
( 10   M W )
Greece2001[71]
12,900 P d 0.82 · H d 0.246 U S D k W NS/SmallU.S.A.2003[72]
3300 P d 0.122 · H d 0.107 U S D k W S-type Kaplan/Small
( 10   M W )
Greece2005[73]
63,346 P d 0.1913 · H d 0.2171 + 78,661 P d 0.1855 · H d 0.2083
+ 40,860 P d 0.1892 · H d 0.2118 + 18,739 P d 0.1803 · H d 0.2075 E U R k W
NS/SmallIndia2008[74]
17,693 P d 0.3644725 · H d 0.281735 E U R k W Pelton/Micro to smallSpain2009[63]
25,698 P d 0.560135 · H d 0.127243 E U R k W Francis/Mini to small
33,236 P d 0.58338 · H d 0.113901 E U R k W Kaplan/Micro to small
19,498 P d 0.58338 · H d 0.113901 E U R k W Semi-Kaplan/Micro to small
8300 d · H d 0.54 ( G B P ) P e l t o n   F r a n c i s   F r a n c i s   F r a n c i s   K a p l a n   K a p l a n /Mini to small U.K.2010[64]
142,00 0 d · H d 0.5 0.07 ( G B P ) , Q = (0.5–2.5) m 3 / s
282,000 d · H d 0.5 0.11 ( G B P ) , Q = (2.5–10) m 3 / s
50,000 d · H d 0.5 0.52 ( G B P ) , Q > 10 m 3 / s
15,000 d · H d 0.68 , Q = (0.5–5) m 3 / s
46,000 d · H d 0.35 ( G B P ) , Q = (5–30) m 3 / s
1,358,677.67 · H d 0.014 + 8489.85 · d 0.515   + 3382.1 P d 0.416   1,479,160.63   ( E U R ) Pelton/Micro to smallItaly2016[61]
190.37 · H d 1.27963 + 1,441,610.56 · d 0.03064   + 9.62402 · P d 1.28487   1,621,571.28   ( E U R ) Francis/Small
139,318.161 · H d 0.02156 + 0.06372 · d 1.45636   + 155,227.37 P d 0.11053   302,038.27   ( E U R ) Kaplan, Semi-Kaplan/Micro to small
1567.2 · 1821.43 P d 0.5 H d 1.25 0.1026 U S D k W Various/SmallIndia2017[75]
In-line turbine: 5730 P d 0.345 E U R k W
PAT: 25,200 P d 0.891 E U R k W
Turbine+PAT/Pico-mini (<120 kW)Switzerland2019[11]
69,040 − 1180P − 596H + 127.6 P d 2   − 124.6PH + 44.94 H d 2   − 1.02 P d 3   + 0.6473 P d 2   H + 0.3239P H d 2   − 0.2877 H d 3   I N R k W Various/MicroIndia2021[62]
5399 P d 0.837 · H d 0.53   ( U S D )
7765 P d 0.5552 · H d 0.237 ( U S D )
Crossflow/Micro
Pelton/Micro
Nepal2022[60]
1355.6 · P d 0.8296 · H d 0.1035 ( ) PAT/Pico-mini
( 550 kW)
Europe2018[76]
Radial with 1 pair of poles: 11,913.91 · d · H d 0.5 + E U R   1289.92
Radial with 2 pairs of poles: 12,717.29 · d · H d 0.5 + E U R   1038.44
Radial with 3 pairs of poles: 15,797.72 · d · H d 0.5 + E U R   1147.92
Vertical with 1 pair of poles: 25,299.50 · d · H d 0.5 + E U R   1173.85
PAT (PAT+gen)/MicroItaly2019[77]
2393.1 P d 0.485 E U R k W PAT (PAT+gen)/MicroItaly2020[16]
Table 8. Specific cost of turbines, according to the literature.
ReferenceSpecific Cost Type
[78]2300–7500 E U R k W Turbine
[79] 3800–4500 E U R k W Turbine
[44]1500–2500 E U R k W Turbine—PAT
[10]3000–6000 E U R k W Turbine
[4]3700–7400 E U R k W Turbine—PAT
[80,81]2000 E U R k W PAT
[82]1800–4200 E U R k W PAT
[60]843–1490 U S D k W Turbine
Disclaimer/Publisher’s Note: The statements, opinions and data contained in all publications are solely those of the individual author(s) and contributor(s) and not of MDPI and/or the editor(s). MDPI and/or the editor(s) disclaim responsibility for any injury to people or property resulting from any ideas, methods, instructions or products referred to in the content.