Article

Assessing the Relative and Combined Effect of Climate and Land Use on Water-Related Ecosystem Services in the Yangtze River Economic Belt, China

1
National Engineering Center of Eco-Environments in Pan-Yangtze Basin, Wuhan 430014, China
2
YANGTZE Eco-Environment Engineering Research Center, China Three Gorges Corporation, Wuhan 430014, China
3
State-Owned Assets Supervision and Administration Commission of the State Council, Social Responsibility Bureau, Beijing 100031, China
4
General Institute of Water Resources and Hydropower Planning and Design (GIWP), Ministry of Water Resources, Beijing 100032, China
*
Author to whom correspondence should be addressed.
Water 2024, 16(15), 2126; https://doi.org/10.3390/w16152126
Submission received: 2 July 2024 / Revised: 24 July 2024 / Accepted: 25 July 2024 / Published: 26 July 2024
(This article belongs to the Section Water Resources Management, Policy and Governance)

Abstract

:
The ecosystem service (ES) is essential for residents’ health and well-being. The ecosystem service value (ESV) is one of the measures to scientifically quantify the wealth of ESs. However, climate and human activities intensely affect the sustainability of ESs. Therefore, knowing the relative and combined effects of climate and human activities on ESs and ESV can be crucial. This study selects the Yangtze River Economic Belt (YREB) as the study area to detect how climate and human activities affected the ES and ESV changes during 2001–2020, including net primary productivity, water yield, soil retention, water purification, and integrated ESV. The results show that the southern YREB has relatively higher ESs than the northern YREB, except for the NDR-P, which is mainly located in the urban agglomeration area. The general ranking for the ESV of different provinces in the YREB is sequenced from higher to lower as Sichuan, Yunnan, Hunan, Jiangxi, Guizhou, Hubei, Zhejiang, Anhui, Jiangsu, Chongqing, and Shanghai. Specifically, the ESV of Sichuan is the highest at about 972 billion yuan (133.57 billion USD), while the lowest ESV has been discovered in Shanghai at approximately 0.25 billion yuan (0.03 billion USD). It can be noticed that the regions where climate is the major influencing factor for ESs are concentrated upstream of the YREB, and human activities mainly influence ESs in highly urbanized areas. Furthermore, climate and human activities account for the highest proportion (86%) of synergistic effects for ESV in Yunnan. In contrast, Jiangsu, Zhejiang, and Shanghai accounted for the lowest proportions, at 18%, 26%, and 31%, respectively. This study may provide crucial insights into how ESs and ESV in the YREB have changed during the study period to inform policymakers, drawing more attention to the inhibitory and synergistic effects arising from the interaction between climate and human activities, to make more reliable decisions on adapting to climate crises in the future.

1. Introduction

Ecosystem services (ESs) are crucial for environmental and human life [1]. According to previous research, ecosystem services could be classified as provisioning, regulating, supporting, and cultural services, which are essential for alleviating environmental degradation and guaranteeing human health [2]. Additionally, in order to scientifically assess and compare the different ESs, the ecosystem service value (ESV) is quantified by economic methods, which makes it possible to detect the coordination between socioeconomic development and ecological protection [3].
Researchers have proved that human activities, such as urbanization, cultivation, and industrialization, and climate, such as radiation, precipitation, and temperature, are the two major factors for ES and ESV changes [4,5]. The research carried out in California indicated that the ESV would decline under climate change scenarios [6]. Meanwhile, the review study demonstrated that most of the countries in the world have now experienced population and urban expansion, which converted natural areas into agricultural and built-up regions and caused the decline of ESV [7]. To define the impact of human activities and climate change on ESs and ESV, studies focus on the independent influence in the past while drawing more attention to the interaction between factors [8]. The human activities mainly affect the ESs through land use change. For example, the urban area has been observed to increase the water yield from 30.43% to 49.62% between 1984 and 2022 in Peru [9]. Due to intense land use change, ESs including climate regulation, water supply, the provision of raw materials, and food production in the southern plains of Nepal have declined [10]. Although the land use changes caused by human activities mainly confer negative effects on ES changes, the climate has been recognized as having multiple impacts, both positive and negative [11]. Climate change has been proven to improve the water yield and net primary productivity in the Yangtze River Economic Belt, China, from 1999 to 2018, and are significant factors for ES increases in forest areas [12]. Similar results have been found in Kentucky, USA, which illustrated that climate change has more influence on water yield than land use change [13]. Therefore, understanding the complex impact of climate and human activities on ESs still needs more exploration.
Apparently, accurate and refined simulation is the primary condition for a better understanding of the relationship between human activities, climate, ESs, and ESV [14]. With the updates and iterations of remote sensing techniques and simulation tools, conducting relatively high-resolution and accurate analyses of human activities and climate impacts has become possible [15]. Nowadays, the InVEST (Integrated Valuation of Ecosystem Services and Trade-offs) model is the most widely used approach for ES evaluation and has been validated in regions worldwide. Moreover, the CASA (Carnegie–Ames–Stanford approach) model is well-known in vegetation effect estimation, such as net primary productivity and gross primary productivity [16,17]. The InVEST model could be used to provide analyses for ES changes in the future in designed scenarios. The InVEST model has been used to detect how ESs would change under three conditions, including business as usual, cropland protection scenarios, and ecological protection scenarios in the Beijing–Tianjin–Hebei region, China [18]. By using the PLUS model and InVEST model, four different land-developing scenarios have been established to define how ESV and habit quality would change in Chengdu, China [19]. Furthermore, the InVEST model could also be used to evaluate the environmental risks and environmental policies. The impact risk and ES supply potential of coastal ecosystems have been constructed by the habitat risk assessment module of the InVEST model [20]. The need for eco-compensation, which could be described as the imbalance between ESs and GDP (gross domestic product), has been recognized by the InVEST model [21]. Thus, the InVEST model has been observed to be able to conduct different studies for ESs and ESV research fields.
However, most relevant studies denote the impact of climate and human activities on ES changes. Some studies focus on the trade-offs and synergistic effects between different ESs [22], while less research tries to discover the impact of human activities and climate on each ES, such as the inhibitory and synergistic effects [13]. These effects may provide practical information for policymakers to implement targeted measures to improve the natural and residents’ wealth.
This study aims at revealing the inhibitory and synergistic effects between climate and human activities on ESs in the YREB, which experienced intense human activities and climate change during the years 2001 to 2020. This covers the period of National strategies from “the 10th Five-Year Plan” to “the 13th Five-Year Plan”. The findings could be used by policymakers used for the planning of effective environmental protection measures.

2. Study Area and Data Source

2.1. Study Area

The Yangtze River Economic Belt (YREB) is developed along the main stream of the Yangtze River, which is more than 6300 km long (Figure 1a). The YREB contributes over 40% of the total national population, and over 46% of the national gross domestic product [21]. Different from the Yangtze River Basin, the sub-streams of the YREB are classified by the administration boundaries. For example, Shanghai, Jiangsu, Zhejiang, and Anhui are downstream of the YREB; Hubei, Hunan, and Jiangxi are midstream of the YREB; and Chongqing, Yunnan, Guizhou, and Sichuan are upstream of the YREB [23].
The upstream and midstream of the YREB serve as critical protected areas for forests, grasslands, wetlands, and biodiversity, covering a higher proportion of grasslands and forests [24]. The downstream of the YREB has the fastest development pace with less area, containing a higher proportion of urban and agricultural areas [25] (Figure 1b). The land use transition image (Figure 1c) mainly shows the composition of the changes for each land use type. It is found that the mutual transformation of forest and grassland is the main transition feature in the YREB. In addition, the policy of returning the agricultural area to forests and grasslands has converted a large agricultural area in the YREB into an ecological area. At the same time, urban expansion has mainly occupied the agricultural area [26]. Furthermore, the transition of different land use types to agricultural areas may aim to ensure the essential cultivation space and guarantee the important granary function of the YREB.

2.2. Data Sources

The LULC maps were provided by the Climate Change Initiative (CCI, 300m resolution, http://maps.elie.ucl.ac.be/CCI/viewer/download.php, accessed on 10 November 2022). The meteorological data, including temperature, precipitation, and radiation from 2001 to 2020, were provided by the National Meteorological Administration of China (http://data.cma.cn, accessed on 5 October 2022). The DEM data with 90 × 90 m spatial resolution were collected from the Resource and Environment Data Cloud Platform of China (http://www.resdc.cn/, accessed on 9 April 2019). Soil data, including soil types and root depth, were obtained from the China Soil Map based on the Harmonized World Soil Database provided by the Institute of Tibetan Plateau Research Chinese Academy of Sciences (https://data.tpdc.ac.cn, accessed on 5 June 2023).

3. Methods

3.1. Methodological Scheme

The steps of this study have been listed below. (1) The ESs (net primary productivity, water yield, soil retention, and nutrition purification) are simulated by the InVEST model and the CASA model. (2) The direct market approach and the alternative market approach are used to transmit the four ESs to the economic indicator (unit: yuan), while the sum of these four ESs is called the integrated ESV. (3) Correlation analysis is conducted to identify the characteristics of ESs and ESV. (4) The relative importance index is organized to define the dominant factor for ES and ESV changes, and the combined effect index functions to recognize the different interactions (inhibitory and synergistic) between human activities and climate on ES and ESV changes.

3.2. Quantification of Ecosystem Services

3.2.1. Net Primary Productivity

The estimation of the net primary productivity (NPP) of vegetation is generally based on the CASA model [27]. This study uses monthly precipitation, average temperature, radiation, and NDVI data to estimate the NPP. The primary calculation method is shown in the following equations:
N P P ( x , t ) = A P A R ( x , t ) × ε ( x , t )
where A P A R ( x , t ) represents the photosynthetic effective radiation (MJ/m2/month) absorbed by grid x in month t , and ε ( x , t ) represents the actual light energy utilization rate.
A P A R ( x , t ) = S O L ( x , t ) × F P A R ( x , t ) × 0.5
where F P A R ( x , t ) represents the absorption ratio of the vegetation layer to the incident light and the effective radiation, and   S O L ( x , t ) represents the total solar radiation (MJ/m2/month) of grid x in month t .
F P A R N D V I ( x , t ) = ( N D V I ( x , t ) N D V I i , m i n ) × ( F P A R m a x F P A R m i n ) N D V I i , m a x N D V I i , m i n
where N D V I i , m a x and N D V I i , m i n are the maximum and minimum NDVI of the i th vegetation type, respectively.

3.2.2. Water Yield

The principle of the water yield (WY) module of the InVEST model is based on the estimation method of the Budyko water heat coupling balance [28]. The water yield module conducts simulations based on precipitation, potential evapotranspiration, land use and land cover (LULC), the available water content of vegetation, soil type, and other conditions. The equations are listed below:
Y x j = ( 1 A E T x j P x ) × P x
where Y x j is the annual water yield of land type j in grid x (mm·yr−1);   A E T x j   is the actual evaporation of land type j in grid x (mm·yr−1); and P x  is the annual precipitation of grid x (mm·yr−1).
A E T x j P x = 1 + ω x + R x j 1 + ω x + R x j + 1 / R x j
where A E T x j P x is the ratio of actual evapotranspiration to precipitation, obtained by the Budyko method; R x j is the Budyko index of the j th land use type on grid x ; and ω x is the ratio of vegetation storage and precipitation.

3.2.3. Soil Retention

The main principle is using the USLE (Universal Soil Loss Equation) to quantify the degree of soil erosion in different regions based on terrain, landform, slope, soil, precipitation, and other conditions [28]. The soil retention (SR) is calculated by the gap between theory SR ( T S R x ) and practice SR ( P S R x ). the equation is listed below:
S R x = TSR x P S R x
TSR x = R x × K x × L S x ;   P S R x = R x × K x × L S x × C x × P x
where S R x is the actual soil retention of grid x considering vegetation interception (tons·ha−1·yr−1); R x is precipitation erosivity (MJ·mm·ha−1·h−1·yr−1); K x is soil erodibility (tons·ha·h·ha−1·MJ−1·mm−1); L S x is the slope length factor; C x is the vegetation coverage factor; and   P x is the factor of soil retention measures.

3.2.4. Nutrition Purification

The nutrition purification module of the InVEST model is used to evaluate the nutrient export in ecosystems [28]. This study draws more attention to phosphorous pollutants (NDR-P), which have become the major challenge for Yangtze River environment protection. Specifically, the higher the NDR-P value, the higher the pollutants exported to the environment, which reflects the lower ecosystem service. The equation is listed below:
A L V ( x ) = H S S ( x ) · p o l ( x )
where A L V ( x ) is the adjusted loading value for pixel x, p o l ( x ) is the export coefficient for pixel x, and H S S ( x ) is the hydrologic sensitivity score for pixel x, which is calculated as:
H S S ( x ) = λ x λ ¯ w
where λ x   is the runoff index for each pixel and λ ¯ w is the mean runoff index.

3.2.5. Ecosystem Services Value Quantified Methods

The ESV for NPP, WY, SR, and NDR-P is quantified by the direct market approach and the alternative market approach, which has been proven to perform well in several studies [29,30]. The different calculated approaches for each ES are listed in Table 1. The conversion rate from USD to yuan is 0.14 (1 yuan is 0.14 USD).

3.3. Statistical Methods

3.3.1. Correlation Analysis

This study chooses Pearson correlation analysis as the primary method for relationship detection between two ESs. The main evaluation method for the Pearson correlation coefficient is shown in Equation (10), which directly calculates two variables’ series [33]. The relationship between two or more variables is characterized by the correlation coefficient, which ranges from [−1, 1].
ρ = i = 1 N ( x i x ¯ ) ( y i y ¯ ) i = 1 N ( x i x ¯ ) 2 ( y i y ¯ ) 2

3.3.2. Relative Importance and Combined Effect Index

In reference to relevant research and previous related studies by the group members, the relative importance index (RII) and a combined effect index (CEI) were used to quantify the inhibitory and synergistic effects of ESs and ESV by the changing environment [13,34]. The equation is listed below, and the scenario establishment methods are listed in Section 3.4:
RII = Scenario 2 Scenario 1 Scenario 3 Scenario 1 Max ( Scenario 1 )
CEI = Scenario 2 + Scenario 3 Scenario 1 Scenario 4 Max ( Scenario 1 )
The RII is conducted to identify the dominant factors for ES and ESV changes. When the RII > 0, the human activities could be recognized to have a more significant impact than climate; when the RII < 0, the human activities have less impact; when the RII = 0, human activities and climate have the same influence. The CEI is used to detect the interaction between human activities and climate. When the CEI > 0, the human activities and climate show an inhibitory effect; when the CEI < 0, the synergistic effect is observed; when CEI = 0, there is no interaction between human activities and climate.

3.4. Scenario Analysis

The scenarios in the equations for calculating the RII and CEI indices are shown in Table 2. In this study, 2001 and 2020 have been selected to establish the scenarios. This study uses the control variable method to distinguish the impact of human activities (LULC) and climate. For example, scenario 1 indicates that the ES simulations by the InVEST and CASA models are using the data set for LULC in 2001 and the average climatic data from 2001 to 2005. Scenario 2 would change the LULC data in 2020 while maintaining the average climatic data from 2001 to 2005. The difference between scenario 1 and scenario 2 could explain the changes in ESs and ESV in human activities.

4. Results and Discussion

4.1. Characteristics of Ecosystem Services in the Yangtze River Economic Belt

4.1.1. Ecosystem Service Changes in the Yangtze River Economic Belt from 2001 to 2020

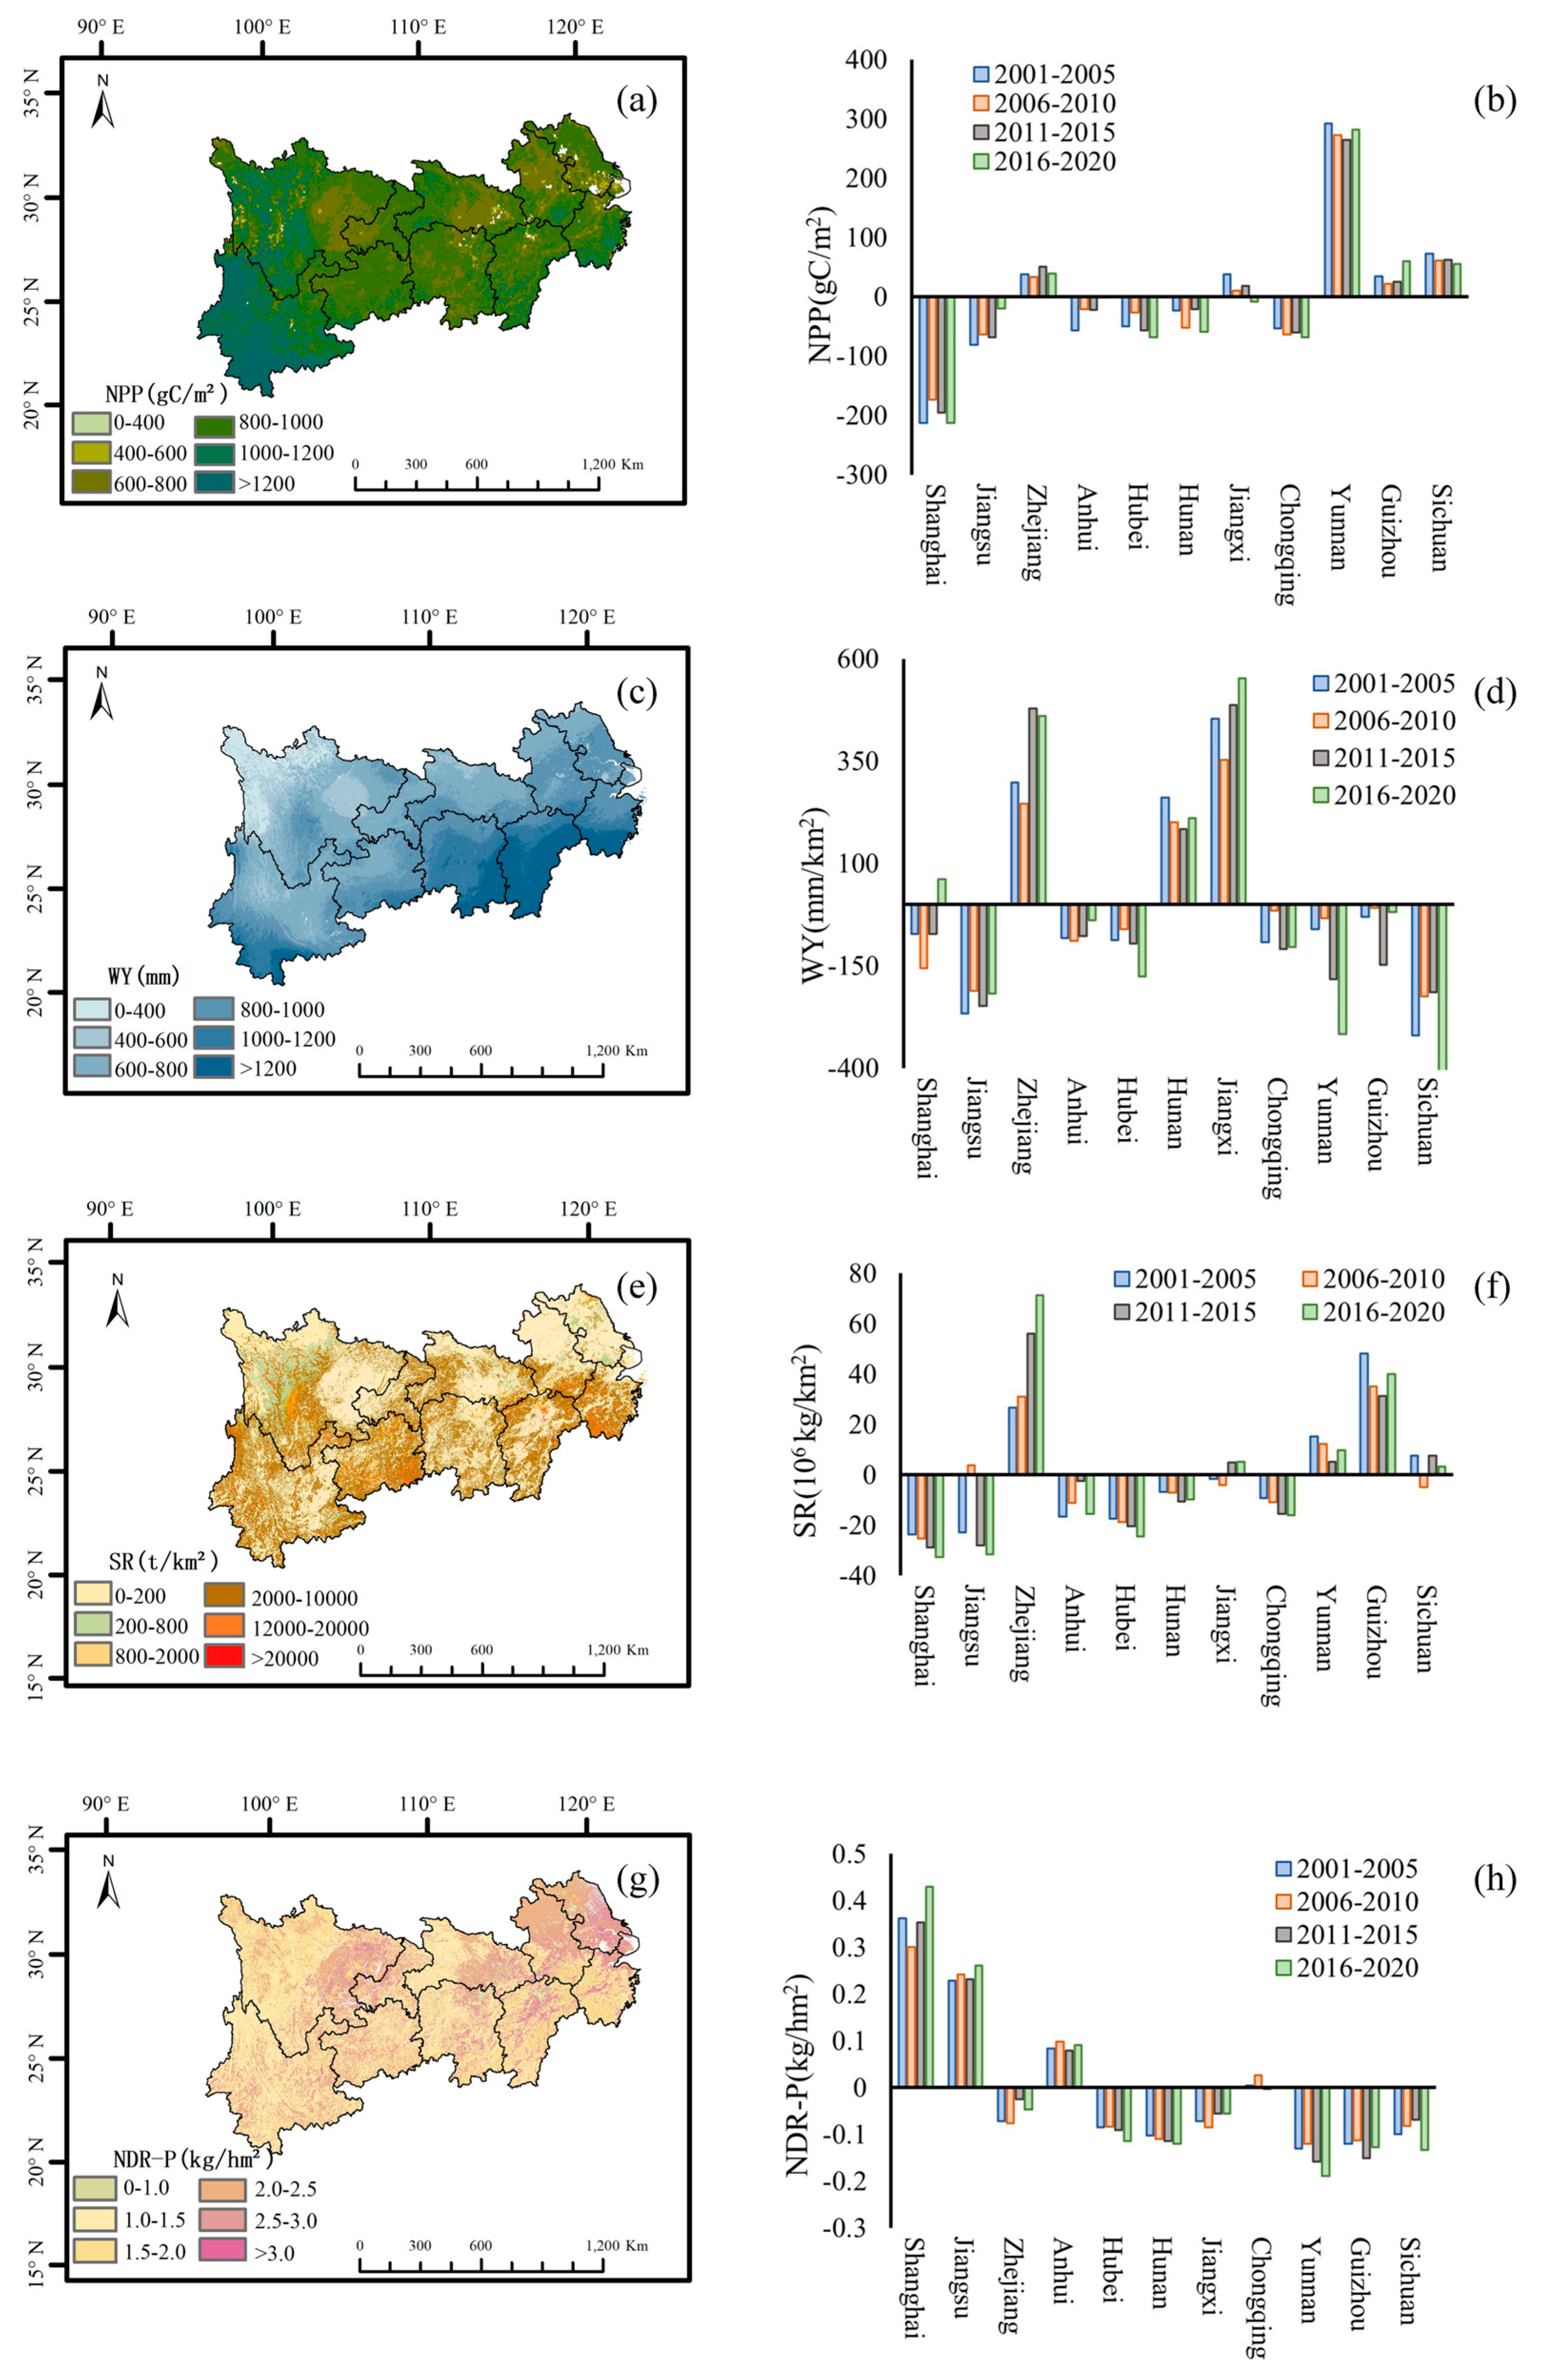
The NPP of the YREB shows a decreasing trend from southwest to northeast, which is related to the stepped landform characteristics of China (Figure 2a). The Zhejiang, Jiangxi, Yunnan, Guizhou, and Sichuan provinces present higher unit NPP than the average unit NPP of YREB during the study period. Significantly, the unit NPP of Yunnan province is much higher than that of all other provinces in the YREB. The unit NPP anomalies of Jiangxi, Hubei, and Hunan in the middle reaches show a decreasing trend during the study period (Figure 2b). For example, the unit NPP anomaly of Jiangxi province changed from positive to negative from 2016 to 2020. In the Yangtze River Delta, Shanghai has the lowest unit NPP compared to other provinces due to lower vegetation coverage. The unit NPP of Anhui and Jiangsu are closer to the average level in the YREB during the study period. It is worth noting that, different from Shanghai, Jiangsu, and Anhui, the unit NPP anomaly of Zhejiang province during different research periods is positive, which may indicate that Zhejiang has successfully realized the coordinated development of the economy and ecological environment [35].
Generally, the WY of the southern YREB is higher than the northern YREB (Figure 2c). The Zhejiang, Hunan, and Jiangxi provinces have a relatively high proportion of higher WY areas in the YREB. The unit WY of Zhejiang, Jiangxi, and Hunan provinces present consistently higher than the average level in the YREB (Figure 2d). The unit WY of Yunnan, Sichuan, Hubei, Guizhou, Anhui, Chongqing, and Jiangsu provinces are all below the average level during the study period. Furthermore, the unit WY of Shanghai was lower than the average from 2001 to 2015. However, the unit WY in Shanghai has risen higher than the average from 2016 to 2020. The rapid urbanization process has not further reduced the WY of Shanghai, which may be due to the increase in precipitation to offset the total reduction in WY caused by urbanization [21].
The unit SR in Zhejiang Province shows a significant upward trend, which may closely relate to the good growth of vegetation (Figure 2e). The unit SR of Zhejiang and Guizhou provinces are higher than the average level in the YREB from 2001 to 2020. It should be noted that the unit SR of Sichuan province is below the average level during the period of 2006–2010 while being higher in other periods. This may be caused by the complex terrain and mountainous plateau, where grassland is the main vegetation and is susceptible to climate change [36]. During the research period, the unit SR of Hunan, Hubei, Jiangsu, Shanghai, and Chongqing showed a continuous downward trend (Figure 2f), which may be related to the encroachment of natural ecological resources to boost the pace of urban agglomeration.
It is evident that the NDR-P of the YREB is mainly concentrated in the Yangtze River Delta Urban Agglomeration, the Urban Agglomeration in the Middle Reaches of the Yangtze River, and the Chengdu–Chongqing Urban Agglomeration during the research period (Figure 2g). The unit NDR-P of Shanghai, Jiangsu, and Anhui are higher than the average unit NDR-P in the YREB. Nevertheless, the unit NDR-P of Zhejiang, Hubei, Hunan, Jiangxi, Yunnan, Guizhou, and Sichuan stay lower than the average level of the YREB (Figure 2h). The findings may indicate that the rapid development of the Yangtze River Delta urban agglomeration has increased the pressure on NDR-P management in the Yangtze River Delta region [37].

4.1.2. The Correlation between Ecosystem Services

The results for the correlation between different ESs in the YREB can be found in Table 3. The correlation between various ESs does not show a strong relationship, except for the correlation between the WY and NPP, as well as the SR and NDR-P, which are significantly correlated. The WY and NPP show a significantly correlated relationship, which may indicate that improved vegetation growth in the YREB could strengthen the interception, absorption, and infiltration ability of surface runoff for the vegetation root system, which leads to an increase in the soil water content [6]. The corresponding soil water content also enables vegetation to have sufficient raw materials for transpiration and photosynthesis, which promotes vegetation growth [38]. The significant correlation between SR and NDR-P indicates that similar driving factors, such as precipitation and LULC, drive these two ESs. The change in precipitation may form various surface runoff intensities for different LULCs. When the surface runoff scouring intensity exceeds the threshold of the soil conservation ability, the soil will be dispersed and cause soil loss [39]. Correspondingly, the nutrients in the soil are diffused with the runoff formed by precipitation, causing non-point source pollution. The NPP is positively correlated with SR and negatively correlated with NDR-P without significance. The findings would show that the soil retention and pollutant interception ability of vegetation is limited and could not be infinitely enhanced through vegetation growth.
After conducting the analysis to identify the relationship between ESs in different provinces and cities, the results show that there are unique interrelationships among ESs (Table 4). There is a significant correlation between NPP and WY in all provinces and cities, except Jiangsu and Shanghai, where there is a relatively smaller proportion of forest and relatively low soil water storage capacity. In addition, considering the significant positive correlation between WY and NDR-P in Jiangsu and Shanghai, which have less forest area and large urban areas, the precipitation carries nutrients into the river without adequate interception and absorption by vegetation and soil, which may cause more non-point source pollution [40]. On the contrary, a significant negative correlation exists between WY and NDR-P in Zhejiang, Jiangxi, Yunnan, and Hunan, indicating that the forest area presents better pollutant absorption capacity than other LULC types [37]. This judgment can also be drawn from the negative relationship between NPP and NDR-P in the provinces, where there is a larger proportion of forest area in plains (Zhejiang, Hunan, Jiangxi, Yunnan).
In addition, provinces and cities such as Hubei, Chongqing, and Anhui, which have a relatively large proportion of agricultural land, have a positive correlation between NPP and NDR-P. This may be due to the orderly cultivation of agriculture, leading to better vegetation growth, which increases both the non-point source pollutant export and the NPP of vegetation [24]. In Zhejiang, Jiangxi, Hunan, and Anhui, a significant positive correlation exists between NPP and SR, while no significant correlation has been observed in other provinces. This may be due to the aggregation effect of vegetation. Research shows that in large forest proportion areas, the ecological benefits of vegetation in soil fixation and protection could be amplified [41]. Furthermore, the significant positive correlation between WY and SR in Zhejiang, Yunnan, and Hunan could strengthen the indication that forest areas can enhance both the WY and SR capabilities of the local ecosystem.

4.2. Characteristics of Integrated Ecosystem Service Value in the Yangtze River Economic Belt

4.2.1. The Temporal and Spatial Changes in Ecosystem Service Value in the Yangtze River Economic Belt

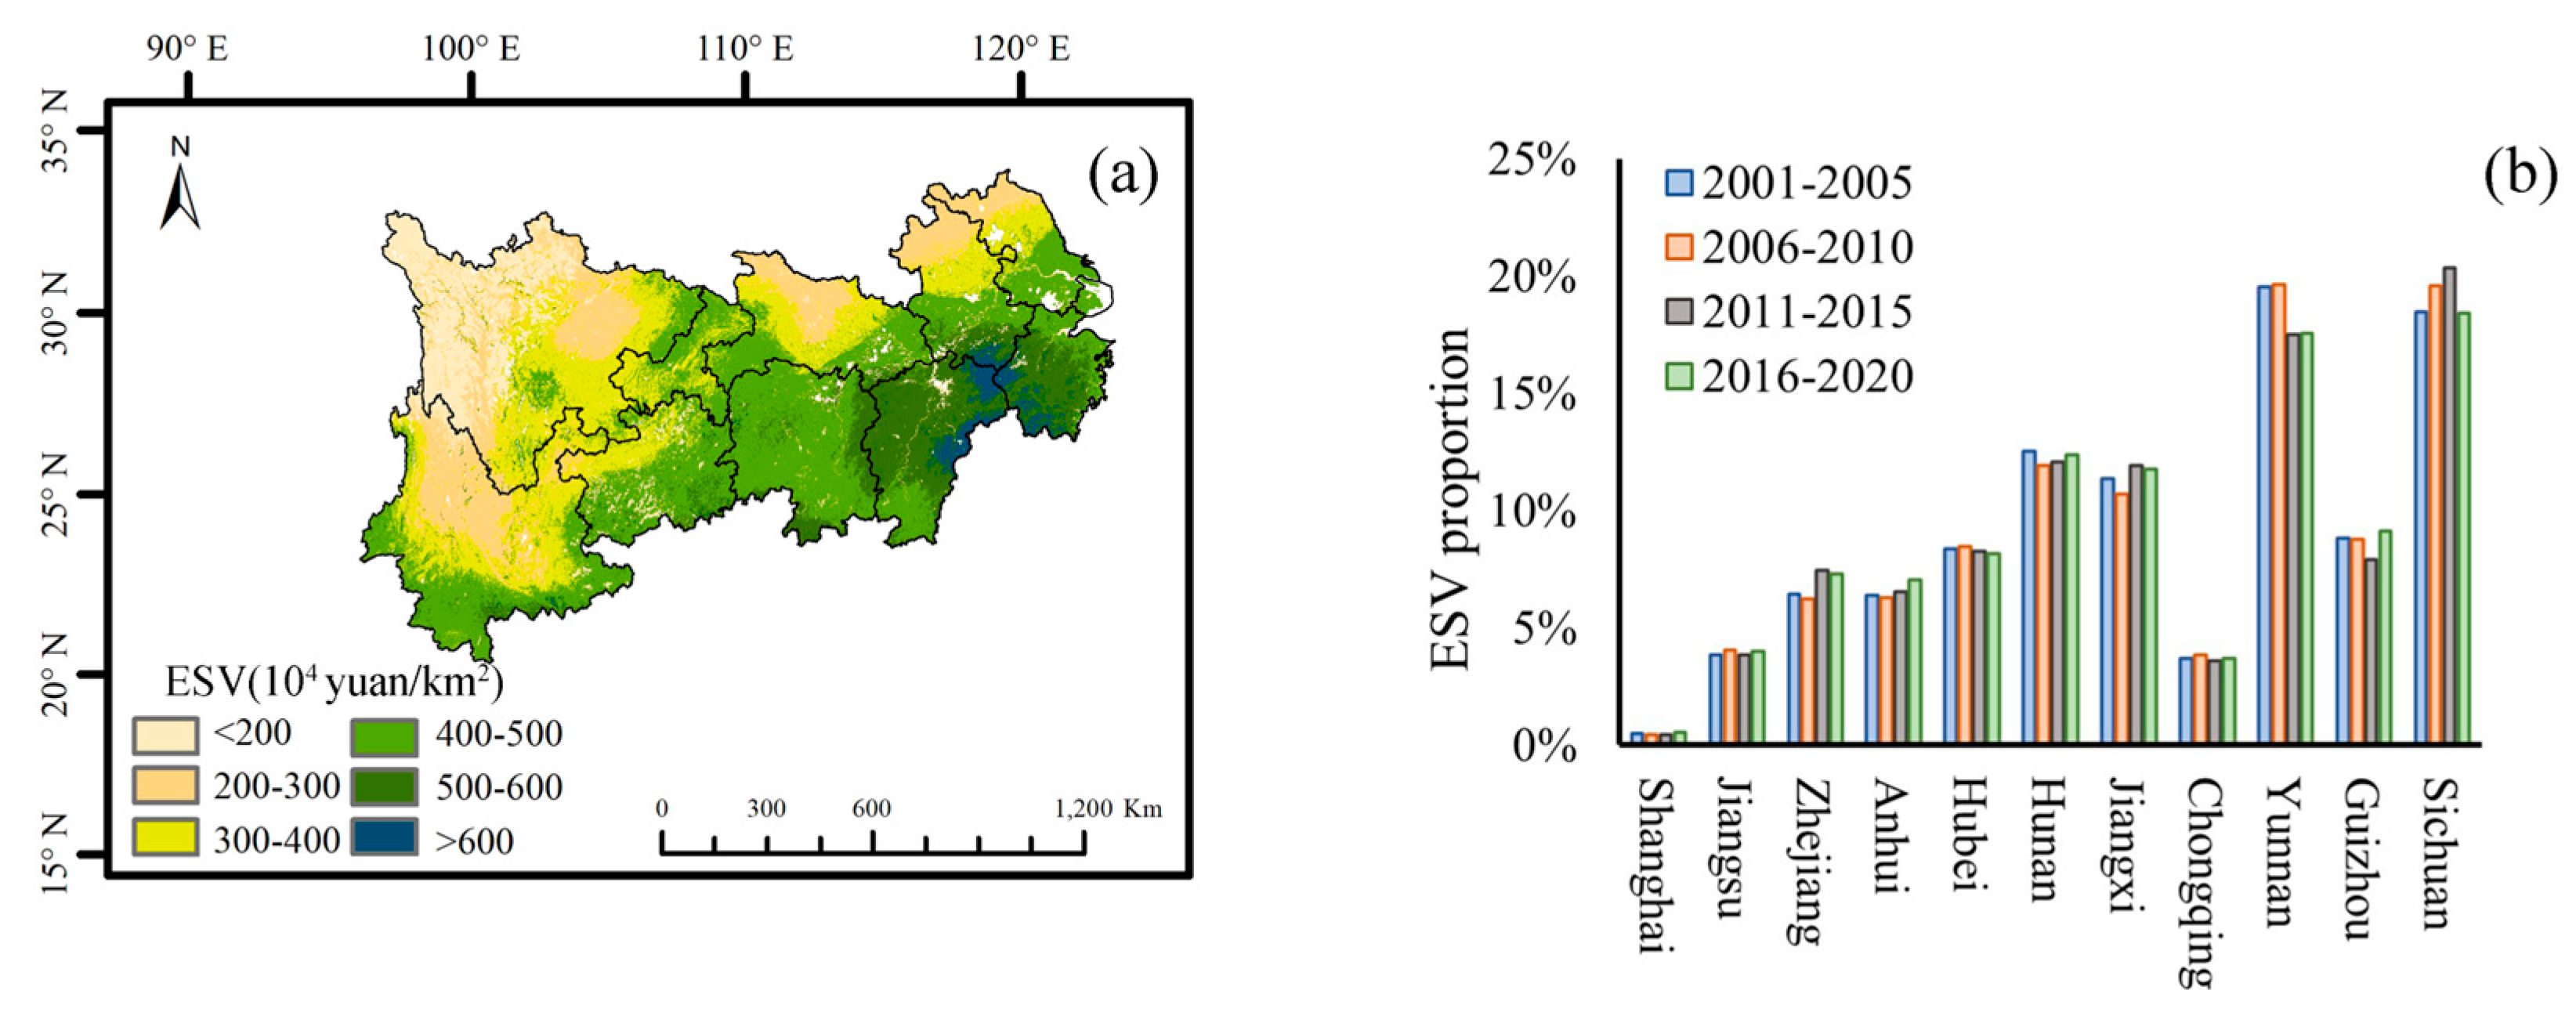
During the study period, the higher unit integrated ESV was observed in Wuyuan, Mount Huangshan, and Qiandao Lake, which are located at the junction of the Zhejiang, Anhui, and Jiangxi provinces, with approximately 5 million yuan/km2 (Figure 3a). Moreover, the unit integrated ESV in southwestern Yunnan at Pu’er and Xishuangbanna regions is also higher than the other regions in the YREB, with over 4 million yuan/km2. Considering the total amount of integrated ESV, Zhejiang contributes the highest proportion among the provinces in the downstream YREB, accounting for about 7% of the total ESV in the YREB. The proportion of ESV is similar in the Hunan and Jiangxi provinces, which account for about 13% of the total ESV in the YREB. Additionally, Yunnan and Sichuan contain the highest ESV proportion in the YREB, accounting for over 20% of the total ESV in the YREB (Figure 3b).

4.2.2. The Integrated Ecosystem Service Value Changes in Different Provinces of the Yangtze River Economic Belt

The twenty-year average values for the integrated ESV of the provinces and cities in the YREB from 2001 to 2020 are shown in the following table (Table 5). The general ranking for the ESV of different provinces in the YREB is recognized from higher to lower as Sichuan, Yunnan, Hunan, Jiangxi, Guizhou, Hubei, Zhejiang, Anhui, Jiangsu, Chongqing, and Shanghai. Specifically, the ESV for Sichuan and Yunnan are the highest, with 972 billion yuan and 934 billion yuan, respectively. Due to having the smallest geographical area, Shanghai has the lowest integrated ESV at 25 billion yuan. The integrated ESV of Zhejiang and Anhui are relatively similar, with 342 billion yuan and 333 billion yuan, respectively. The integrated ESV of Jiangxi and Hunan differ by only 38 billion yuan. The difference between Hubei and Guizhou is 19 billion yuan, and the difference between Jiangsu and Chongqing is about 8 billion yuan. From the 20-year time scale analysis, the integrated ESV of most provinces and cities in the YREB has shown an increasing trend. The Zhejiang, Sichuan, Jiangxi, Hunan, Hubei, Guizhou, Anhui, Chongqing, and Jiangsu provinces present higher integrated ESV in the 2016–2020 period than any other periods, which has been marked in bold in Table 5. It is noticed that Zhejiang has the highest increasing rate, and it has shown an upward trend in all four consecutive research periods.
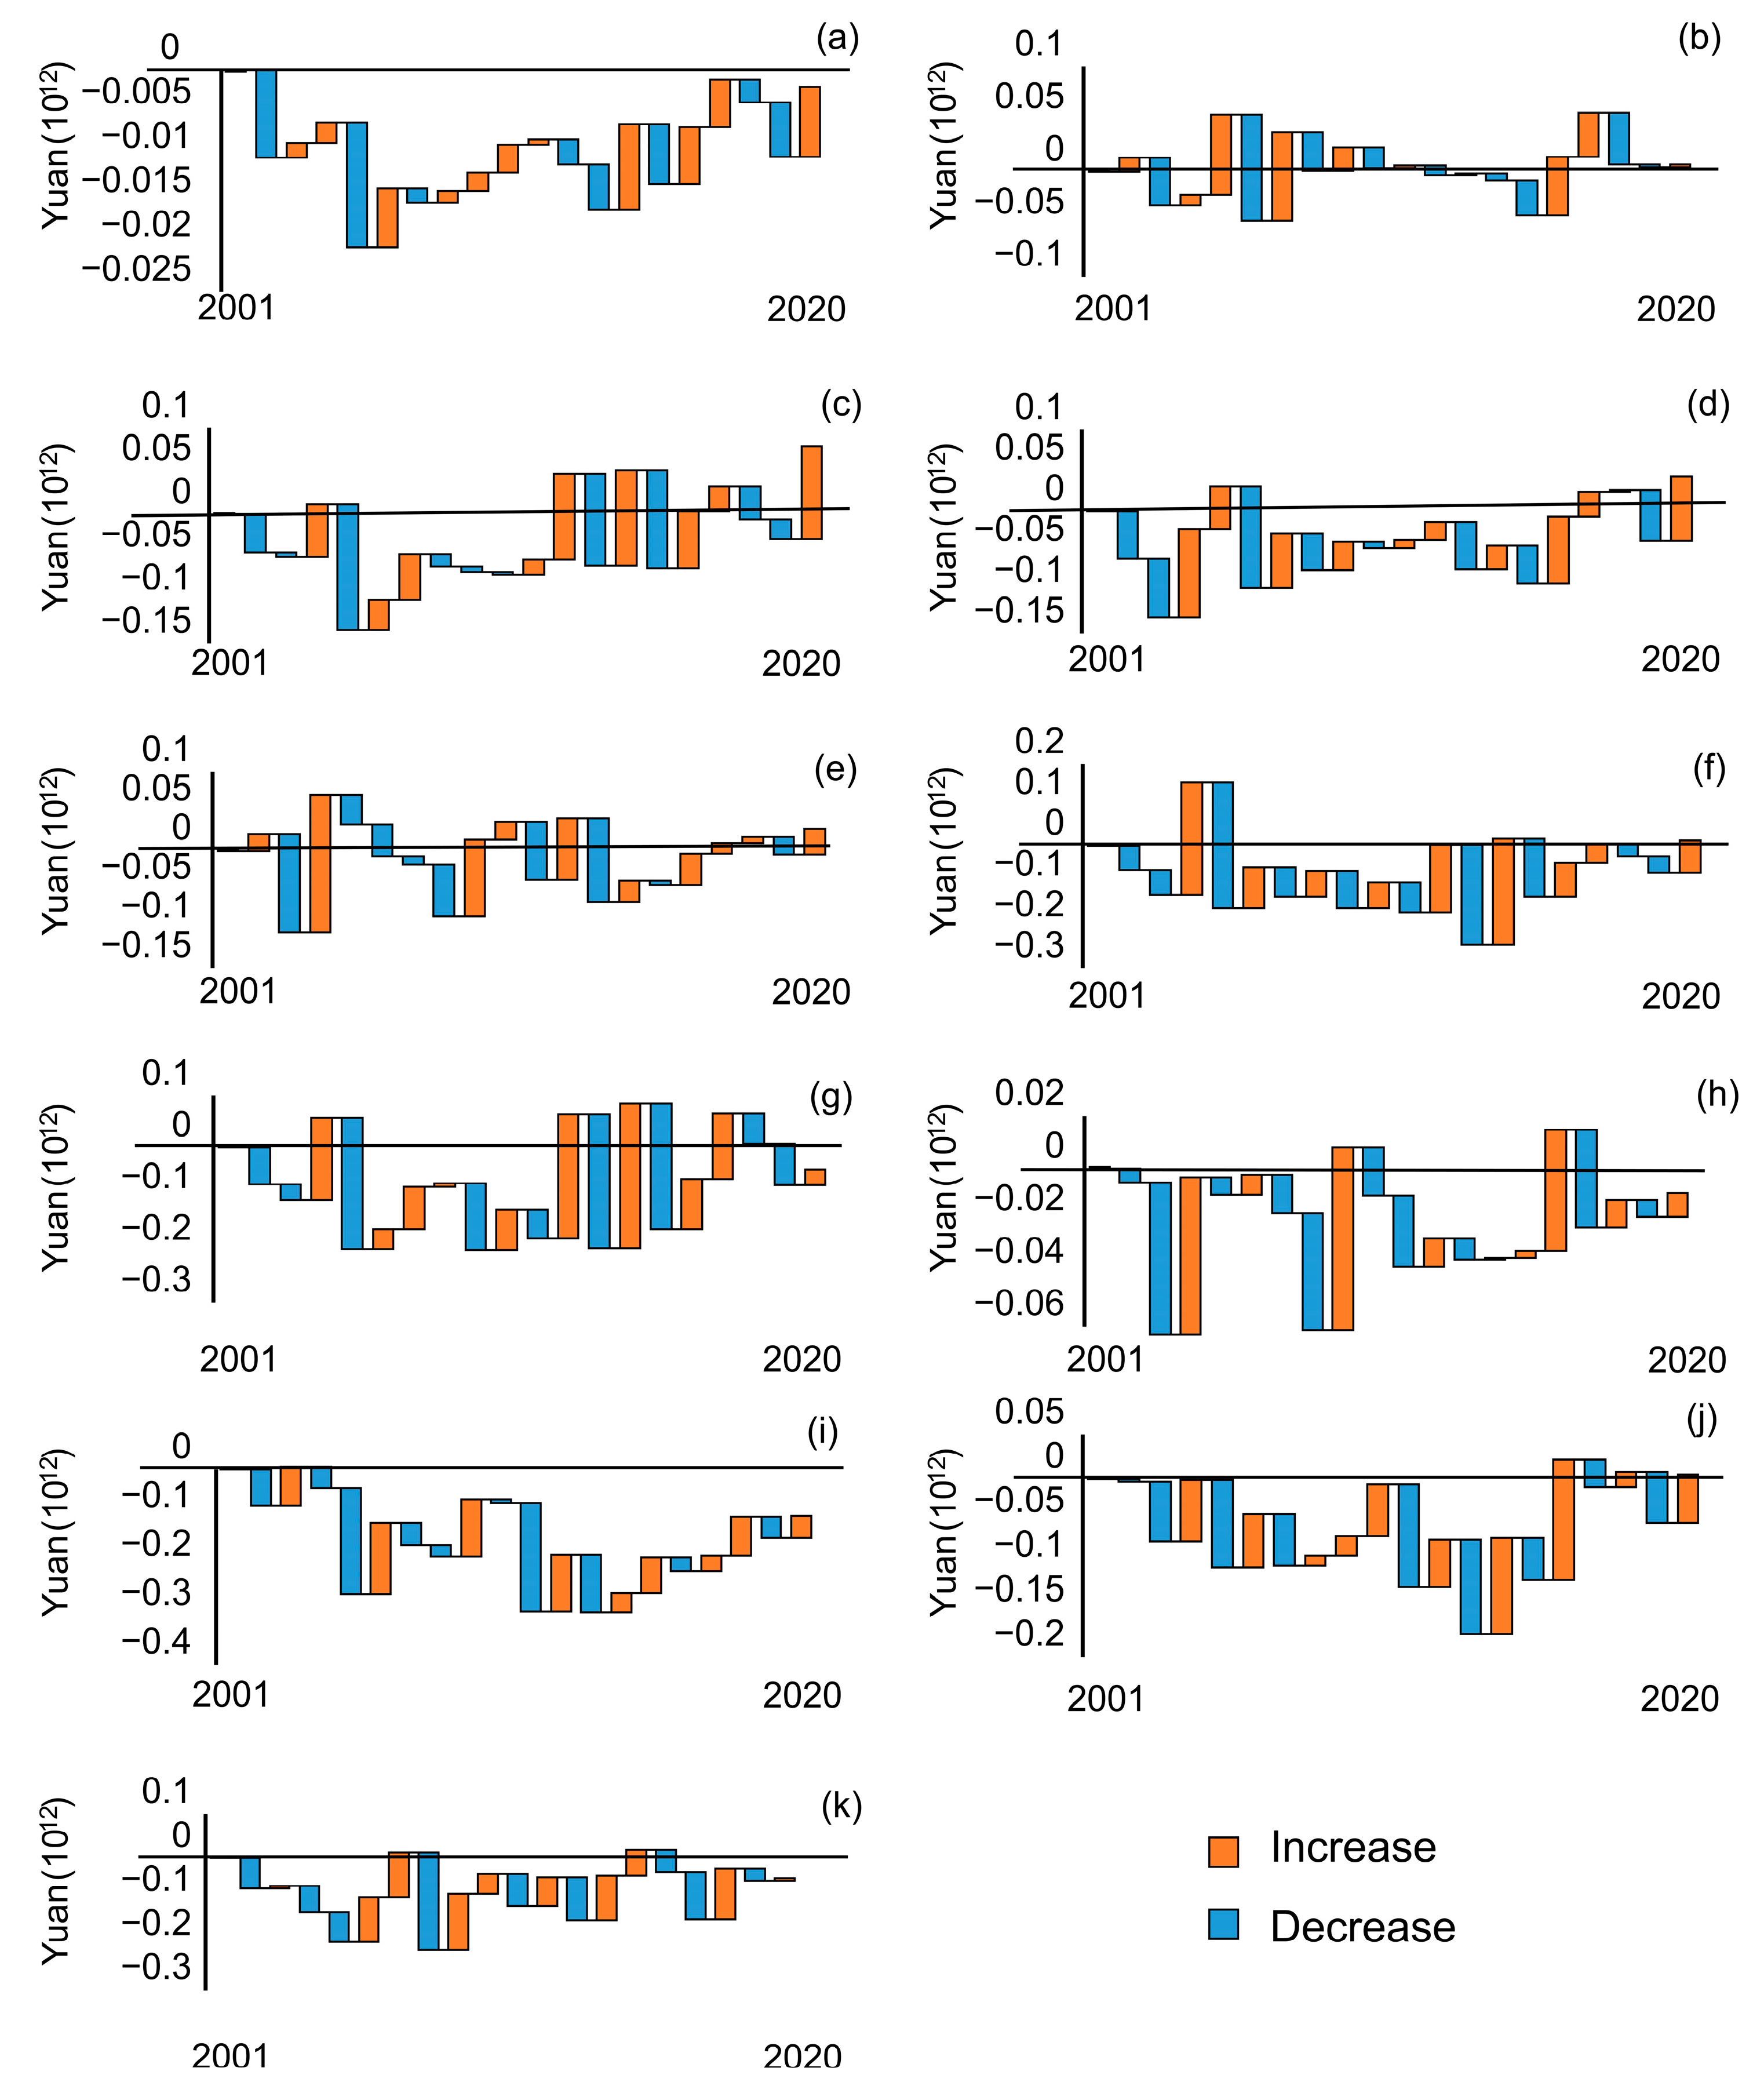
In addition, this study uses the integrated ESV of each province in the YREB in 2001 as a benchmark to analyze the changing characteristics of each province’s integrated ESV from one year to the previous year, from 2001 to 2020 (Figure 4). The integrated ESV of more than half of the provinces in the YREB in 2020 was higher than that in 2001, including Zhejiang, Anhui, Hunan, Hubei, Guizhou, and Jiangsu. Moreover, the integrated ESV of Zhejiang and Anhui in 2020 increased significantly compared with 2001. For example, Zhejiang province increased by 89 billion yuan, and Anhui province increased by 46 billion yuan from 2001 to 2020. Nevertheless, the integrated ESV of Shanghai, Jiangxi, Chongqing, Sichuan, and Yunnan in 2020 are not able to recover to the level in 2001. Specifically, Shanghai has decreased by 4 billion yuan, and Yunnan decreased by 64 billion yuan, though these regions began to recover in 2011–2020 after experiencing a continuous decline of the integrated ESV. It is worth noting that the changing characteristics of the integrated ESV of most provinces and cities show a “U”-shape trend, including Zhejiang, Yunnan, Jiangxi, Shanghai, and Hunan, which would directly relate to human activities and climate change.

4.3. Relative Importance and Combined Effect Analysis

4.3.1. Relative Importance

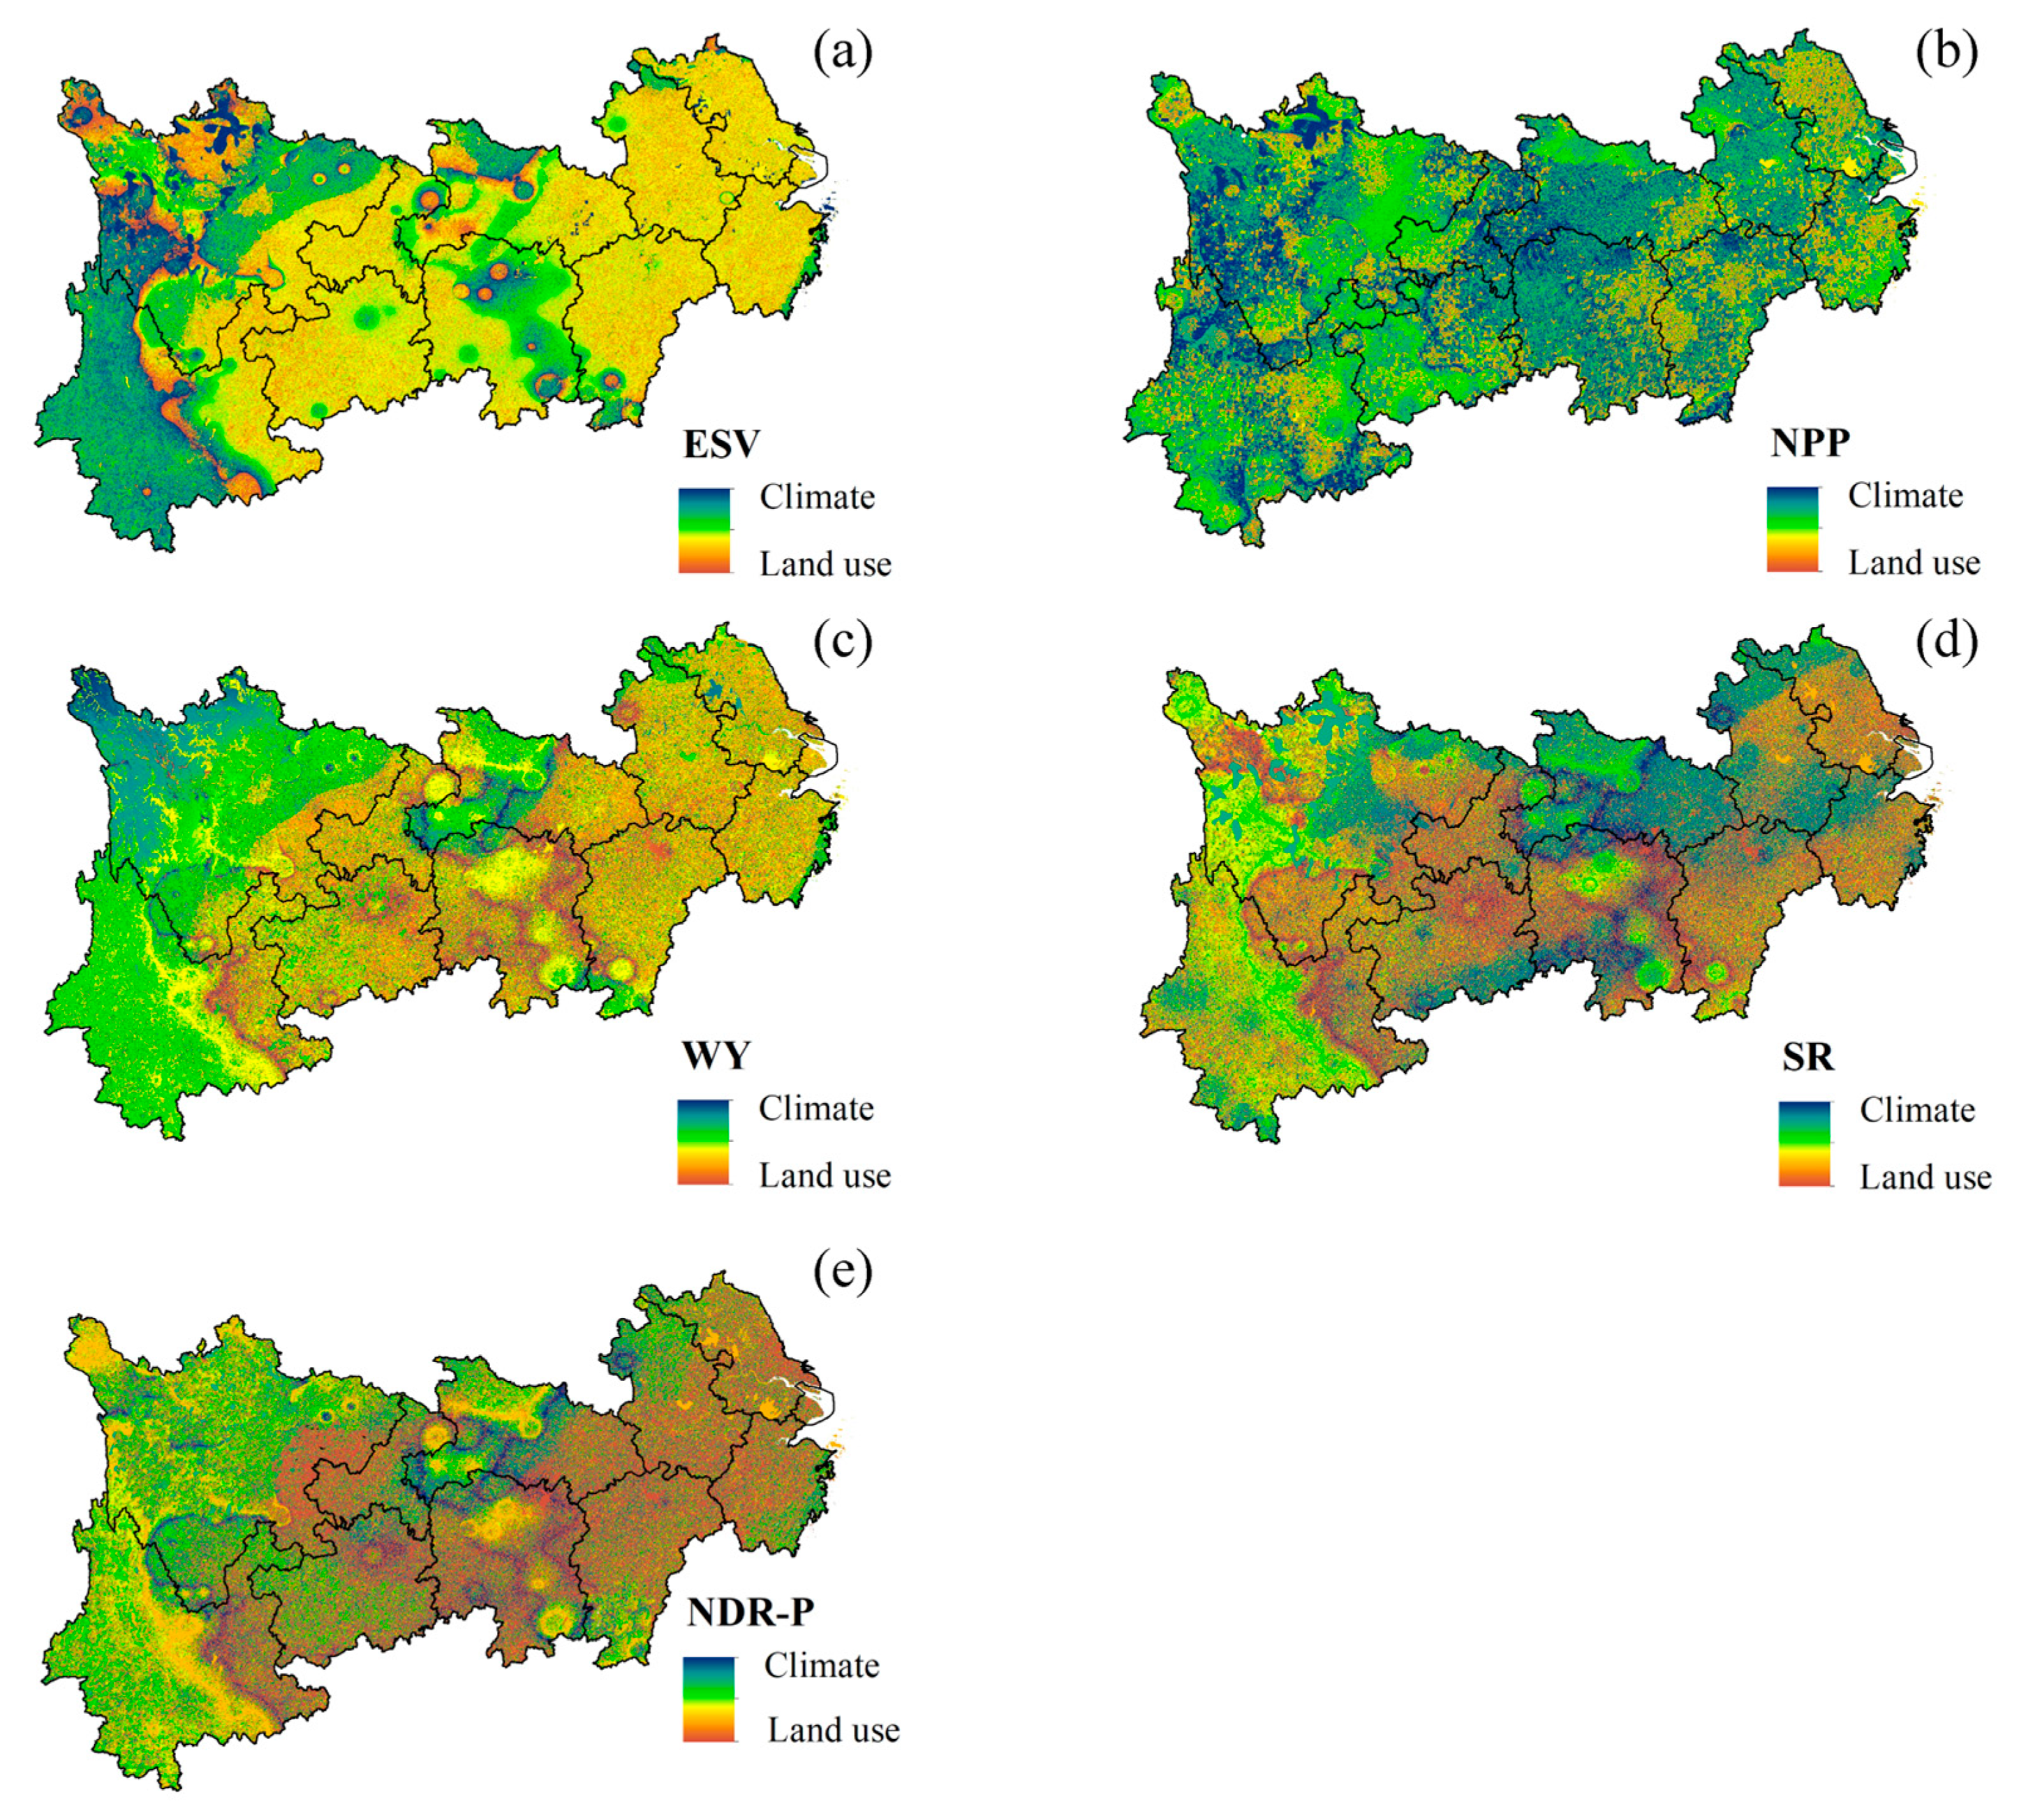
Climate has been observed as the main influencing factor of ESV in Sichuan, Yunnan, Guizhou, and Hunan, while human activities have a greater impact on the Yangtze River Delta region, as well as the junction of Hubei–Hunan–Jiangxi and Chongqing–Chengdu (Figure 5a). This is consistent with the previous findings of current studies. This finding highlights the necessity of the rational construction and planning of ecological space in the urbanization process.
Climate is shown to be the main influencing factor for NPP in the entire YREB (Figure 5b), especially in the eastern part of Sichuan, the central and eastern part of Hubei, the northern part of Jiangsu, the northern part of Anhui, and the northern part of Zhejiang. It is noticed that in protected areas with dense primary forests, including Yunnan, Hunan, Jiangxi, Chongqing, and other regions, less area presents climate as a major factor of NPP change. This may be because the primary forests form a microclimate locally, which can resist the disturbance of vegetation growth brought about by climate change to a certain extent [23].
The regions where climate is the main influencing factor of WY change are concentrated upstream of the YREB, including Chongqing, Yunnan, Guizhou, and Sichuan, as well as the western part of Hubei, southern Hunan, and Jiangxi in the midstream of the YREB (Figure 5c). Therefore, under the influence of global climate change, it is of great significance to enhance the climate suitability and stability of the ecosystem in the protected area to ensure the ecosystem service functions.
The areas where climate represents the dominant factor for SR are concentrated in Sichuan, Yunnan, Hubei, Anhui, northern Jiangsu, and Zhejiang (Figure 5d). The grassland and agricultural areas in these areas are relatively large, which may indicate that the ecosystem functions of grassland and agricultural areas are more sensitive to climate change and the SR stability is relatively weak. This study found that SR in Guizhou was mainly affected by human activities, which may indicate that for a region with special geological conditions such as Guizhou [38], it is more necessary to consider how to control soil and water conservation effectively.
Obviously, the impact of human activities is mainly concentrated in the three urban agglomerations [42], which experience a highly developed urbanization process. In contrast, the influence of climate on NDR-P is concentrated primarily in the southwest of the YREB, where it has been noted to have better vegetation growth (Figure 5e). Climate affects the NDR-P mainly through precipitation. When there is less precipitation, vegetation can fix total nitrogen and total phosphorus by the root system of the vegetation. However, when the precipitation increases beyond the threshold of the vegetation’s adsorption capacity of nutrients, the nutrients will migrate into the river with runoff to cause non-point source pollution [40].

4.3.2. Combined Effects

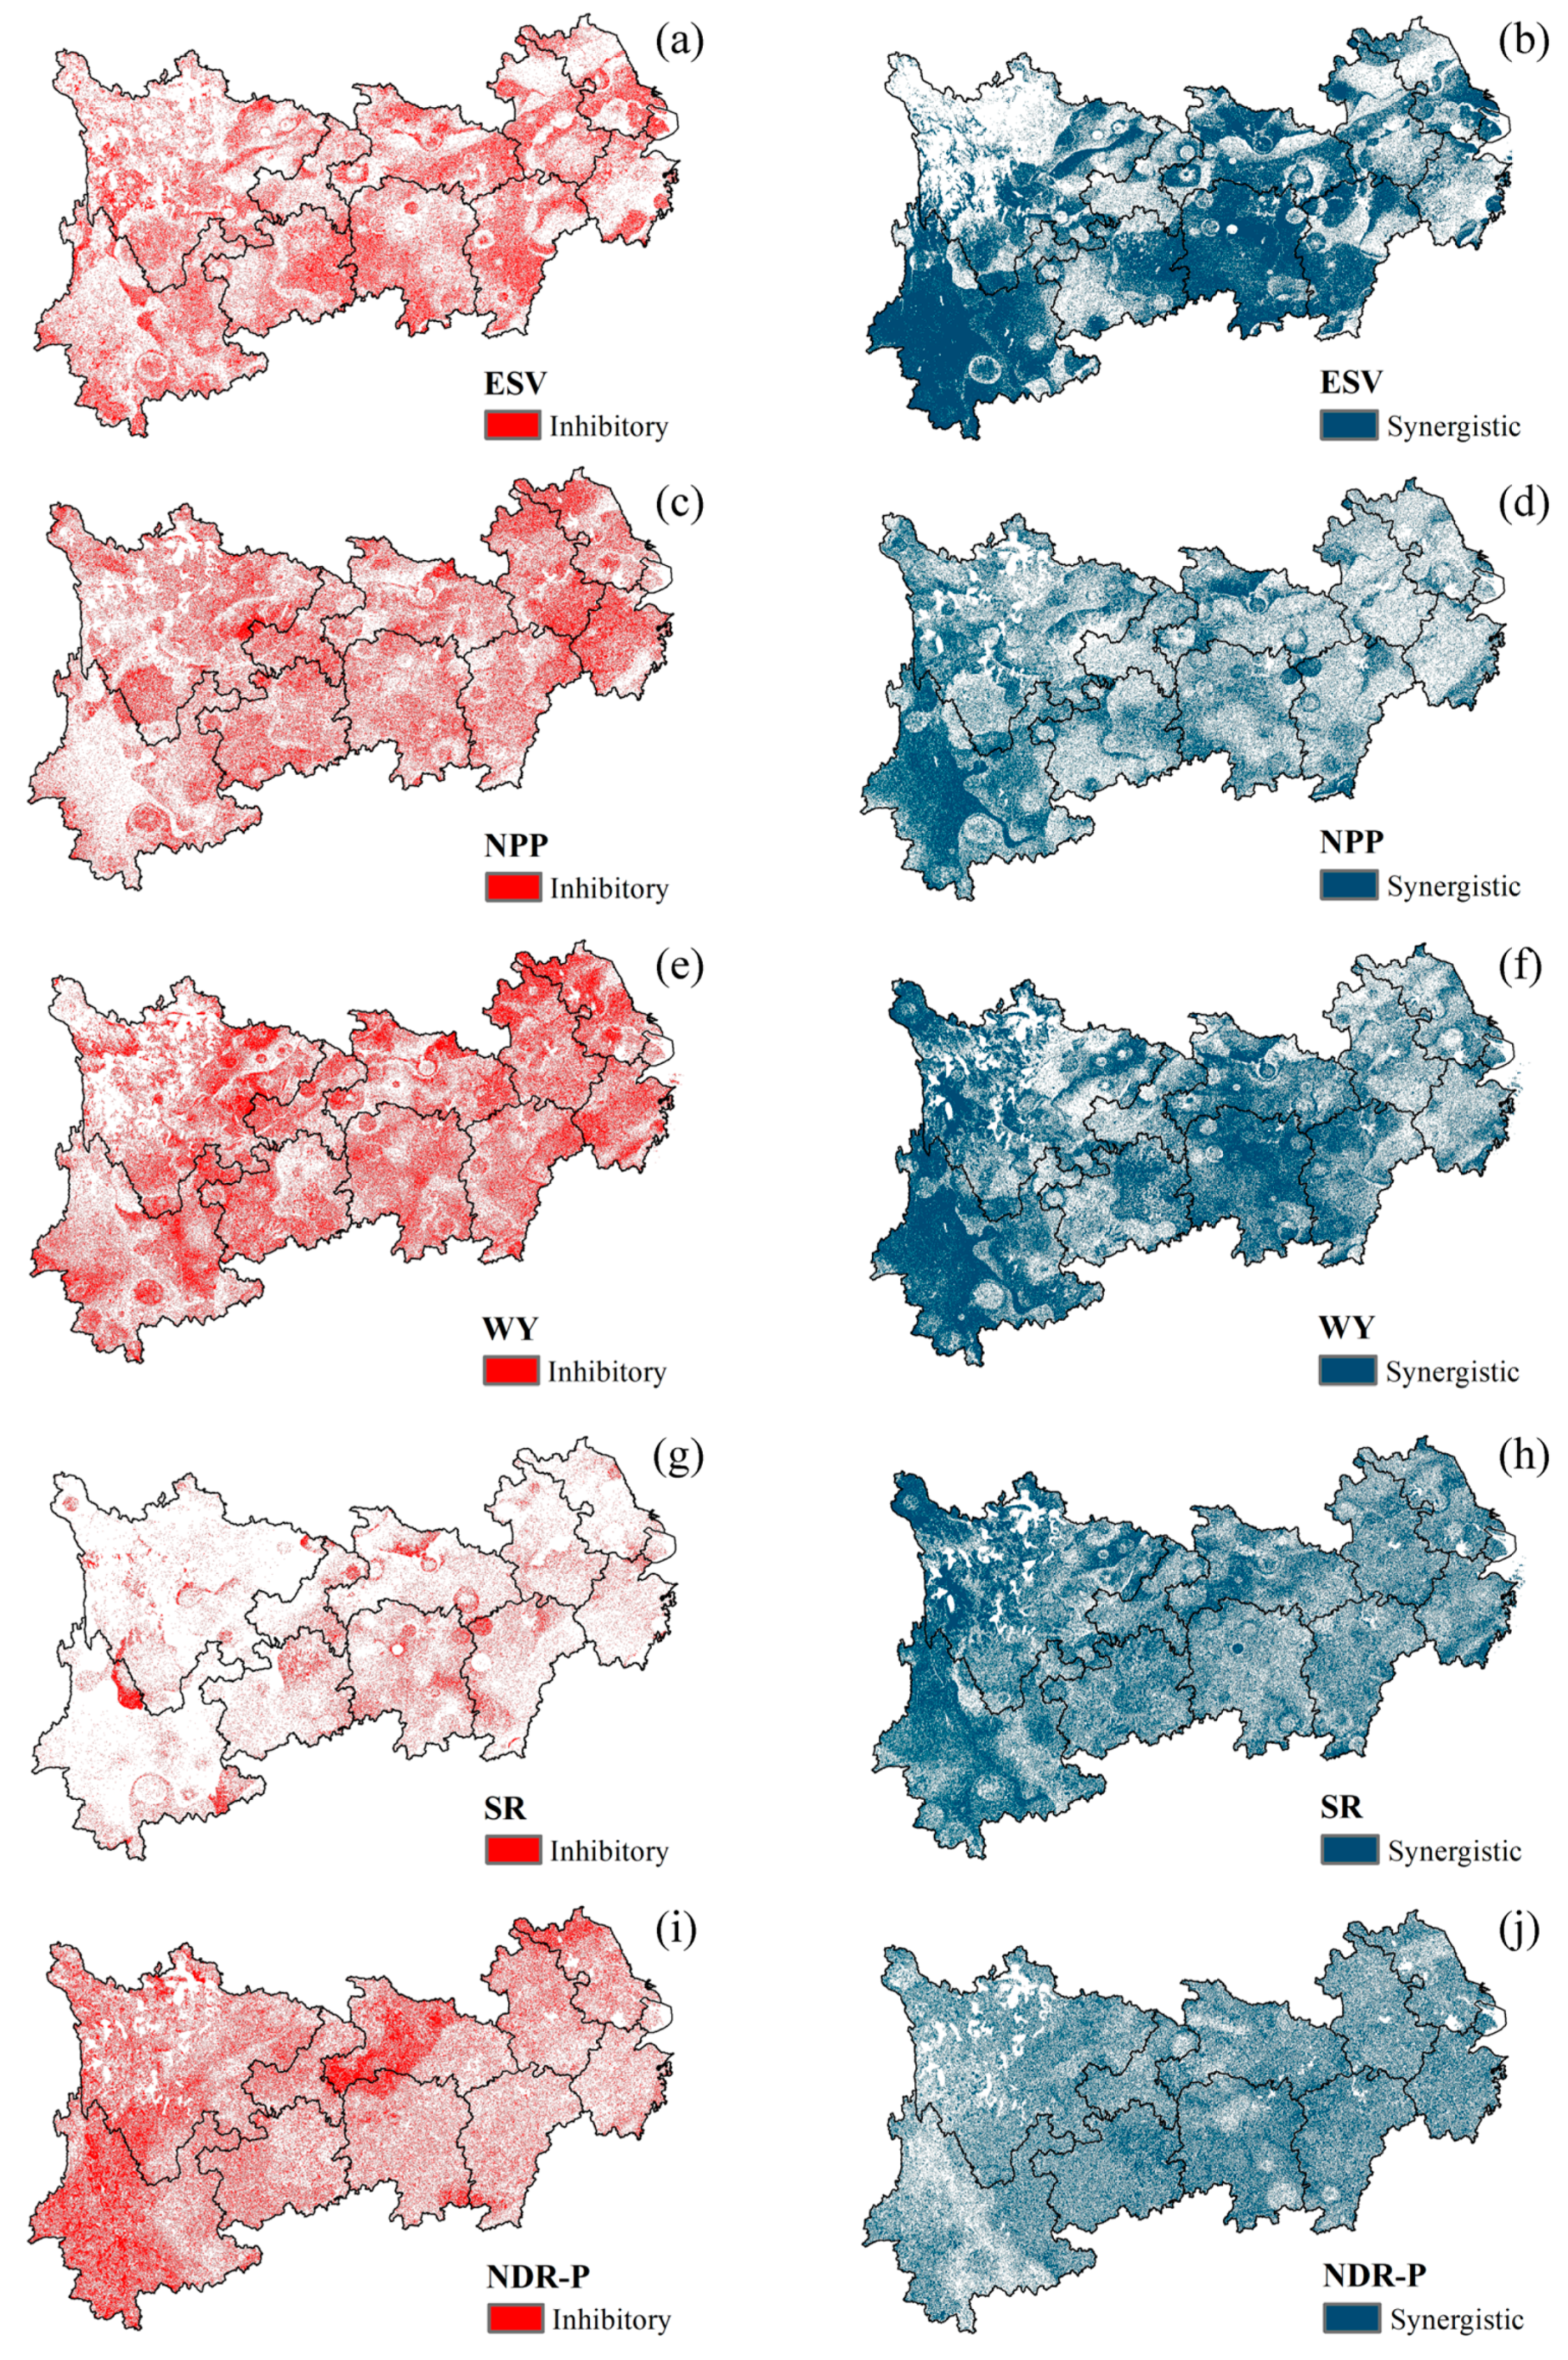
The climate and human activities have varied effects on different ESs. Generally, the climate and human activities have shown a strong synergistic effect on ESV in Yunnan and the junction area of Hunan–Hubei–Jiangxi, where important national protection regions are located, Dongting Lake and Poyang Lake (b). However, in places such as the Yangtze River Delta and the Chengdu–Chongqing urban agglomeration, climate and human activities reflect the inhibitory effects (a). Specifically, climate and human activities accounted for the highest proportion of synergistic effects in Yunnan Province, reaching 86%. Hunan, Hubei, and Jiangxi accounted for 74%, 56%, and 48%, respectively, while Jiangsu, Zhejiang, and Shanghai accounted for the lowest proportions of 18%, 26%, and 31%, respectively (Table 6). It is worth noting that the area in northwest Sichuan has not shown synergistic or inhibitory effects for either climate or human activities, which accounts for the highest proportion of 27% around the YREB (Table 6), which may be due to the fact that human activities and climate in northwest Sichuan are not intense and have not changed significantly.
The spatial distribution of the synergistic and inhibitory effects of climate and human activities in ESV, NPP, and WY is relatively consistent. Yunnan has presented the highest proportion of synergistic effects for climate and human activities in ESV, NPP, and WY for approximately 80% of the total area (Table 6). According to the analysis of the effects of climate and human activities on NPP, 56% and 64% of the inhibitory effects were indicated in Zhejiang and Anhui (Table 6), respectively, which are mainly concentrated in northern Zhejiang and southern Anhui. The results could indicate that the region needs to improve and enhance the awareness of climate suitability design, including the adaptation of vegetation structure to climate change and the design of ecological space in urbanization [43]. Particularly, the climate and human activities rarely show inhibitory effects for SR (g and h). Most of the areas in the YREB present synergistic effects, which could be explained by the high intensity of precipitation causing a major risk of soil erosion.
Furthermore, the climate and human activities in most regions of the YREB show synergistic effects on NDR-P, and the proportion of areas that show synergistic effects in all provinces is also relatively even for more than 40%, except Hubei and Yunnan. It is worth noting that 57% and 63% of the total area in Hubei and Yunnan show inhibitory effects, which are mainly located in western Hubei and southwestern Yunnan (Table 6). These areas, such as Shennongjia and Xishuangbanna, cover a large number of nature reserves. This finding shows that the primary forest and high vegetation cover areas can resist the risks and impacts of the climate change crisis. See Figure 6.

5. Limitations and Uncertainties

This study focuses on the NPP, WY, SR, and NDR-P, as well as their value. However, many ESs that are also crucial for the ecosystem have not been discussed in this study. Therefore, future studies could step further and draw attention to other ESs to give more efficient advice and findings for large-scale environmental protection strategies, such as different forest and agriculture types (wood, grass, and fruits) with various values. Moreover, although the InVEST model and CASA model have been recognized and widely used as major tools for detecting ESs [16], the accuracy may not be as precise as hydrological and ecological models, such as the SWAT (Soil and Water Assessment Tool) model. For example, the InVEST model does not consider groundwater, reservoir water, and other types of water yield that may come to the study area from external areas. Artificial constructions such as dams also could not be simulated by using the InVEST model. The model for ES simulation could be further renewed and iterated to consider the effects of specific infrastructure, which would be more helpful in improving the accuracy of ES modeling.

6. Conclusions

This study aims to identify the relative and combined effects of climate and human activities on ESs and ESV in the YREB from 2001 to 2020 at the province scale. The average ESV of Sichuan province is the highest in the YREB, with 969 billion yuan. Generally, the integrated ESV of the southern YREB is higher than the northern YREB, which is highly consistent with the water yield and precipitation. The relative effect analysis detects that climate and human activities play major roles in ESV changes upstream of the YREB and in the three Urban Agglomerations, respectively. Furthermore, the combined effects analysis indicates that climate and human activities account for the highest proportion of synergistic effects for ESV in Yunnan, while Jiangsu, Zhejiang, and Shanghai account for the highest proportion of inhibitory effects.
The insight of our study suggests that researchers and policymakers should more greatly consider the complex interaction between climate change and human activities. Due to the synergistic and inhibitory effects, the climate could diminish or accelerate negative effects caused by human activities, which may have an essential influence on the stability of the ecosystem.

Author Contributions

Conceptualization, Y.W. and Y.T.; data curation, Y.W., M.Y. and Y.T.; methodology, Y.W.; resources, T.Y.; software, Y.W.; supervision, Y.T. and W.L.; validation, W.L. and W.M.; visualization, Y.W.; writing—original draft, Y.W. and X.G.; writing—review and editing, Y.W. and M.Y. All authors have read and agreed to the published version of the manuscript.

Funding

This study was supported by the National Natural Science Foundation of China (Grant No. U2040206) and the China Three Gorges Corporation Research Project (NBWL202200489).

Institutional Review Board Statement

Not applicable.

Informed Consent Statement

Not applicable.

Data Availability Statement

Data are contained within the article.

Conflicts of Interest

The authors declare no conflicts of interest.

References

  1. Daily, G.C.; Matson, P.A. Ecosystem services: From theory to implementation. Proc. Natl. Acad. Sci. USA 2008, 105, 9455–9456. [Google Scholar] [CrossRef] [PubMed]
  2. Guerry, A.D.; Polasky, S.; Lubchenco, J.; Chaplin-Kramer, R.; Daily, G.C.; Griffin, R.; Ruckelshaus, M.; Bateman, I.J.; Duraiappah, A.; Elmqvist, T.; et al. Natural capital and ecosystem services informing decisions: From promise to practice. Proc. Natl. Acad. Sci. USA 2015, 112, 7348–7355. [Google Scholar] [CrossRef] [PubMed]
  3. Daily, G.C.; Söderqvist, T.; Aniyar, S.; Arrow, K.; Dasgupta, P.; Ehrlich, P.R.; Folke, C.; Jansson, A.; Jansson, B.; Kautsky, N.; et al. Ecology. The value of nature and the nature of value. Science 2000, 289, 395–396. [Google Scholar] [CrossRef] [PubMed]
  4. Scholes, R.J. Climate change and ecosystem services. WIREs Clim. Chang. 2016, 7, 537–550. [Google Scholar] [CrossRef]
  5. Foley, J.A.; Defries, R.; Asner, G.P.; Barford, C.; Bonan, G.; Carpenter, S.R.; Chapin, F.S.; Coe, M.T.; Daily, G.C.; Gibbs, H.K.; et al. Global consequences of land use. Science 2005, 309, 570–574. [Google Scholar] [CrossRef]
  6. Shaw, M.R.; Pendleton, L.; Cameron, D.R.; Morris, B.; Bachelet, D.; Klausmeyer, K.; MacKenzie, J.; Conklin, D.R.; Bratman, G.N.; Lenihan, J.; et al. The impact of climate change on California’s ecosystem services. Clim. Chang. 2011, 109, 465–484. [Google Scholar] [CrossRef]
  7. Hasan, S.S.; Zhen, L.; Miah, M.G.; Ahamed, T.; Samie, A. Impact of land use change on ecosystem services: A review. Environ. Dev. 2020, 34, 100527. [Google Scholar] [CrossRef]
  8. Sun, L.; Yu, H.; Sun, M.; Wang, Y. Coupled impacts of climate and land use changes on regional ecosystem services. J. Environ. Manag. 2023, 326, 116753. [Google Scholar] [CrossRef]
  9. Carrasco-Valencia, L.; Vilca-Campana, K.; Iruri-Ramos, C.; Cárdenas-Pillco, B.; Ollero, A.; Chanove-Manrique, A. Effect of LULC Changes on Annual Water Yield in the Urban Section of the Chili River, Arequipa, Using the InVEST Model. Water 2024, 16, 664. [Google Scholar] [CrossRef]
  10. Sharma, R.; Rimal, B.; Baral, H.; Nehren, U.; Paudyal, K.; Sharma, S.; Rijal, S.; Ranpal, S.; Acharya, R.P.; Alenazy, A.A.; et al. Impact of Land Cover Change on Ecosystem Services in a Tropical Forested Landscape. Resources 2019, 8, 18. [Google Scholar] [CrossRef]
  11. Munang, R.; Thiaw, I.; Alverson, K.; Liu, J.; Han, Z. The role of ecosystem services in climate change adaptation and disaster risk reduction. Curr. Opin. Environ. Sust. 2013, 5, 47–52. [Google Scholar] [CrossRef]
  12. Wu, Y.; Xu, Y.; Zhang, X.; Li, C.; Hao, F. Multi-Remote Sensing Data Analysis for Identifying the Impact of Human Activities on Water-Related Ecosystem Services in the Yangtze River Economic Belt, China. Water 2023, 15, 915. [Google Scholar] [CrossRef]
  13. Bai, Y.; Ochuodho, T.O.; Yang, J. Impact of land use and climate change on water-related ecosystem services in Kentucky, USA. Ecol. Indic. 2019, 102, 51–64. [Google Scholar] [CrossRef]
  14. Babbar, D.; Areendran, G.; Sahana, M.; Sarma, K.; Raj, K.; Sivadas, A. Assessment and prediction of carbon sequestration using Markov chain and InVEST model in Sariska Tiger Reserve, India. J. Clean. Prod. 2021, 278, 123333. [Google Scholar] [CrossRef]
  15. Xiao, P.; Zhou, Y.; Li, M.; Xu, J. Spatiotemporal patterns of habitat quality and its topographic gradient effects of Hubei Province based on the InVEST model. Environ. Dev. Sustain. 2023, 25, 6419–6448. [Google Scholar] [CrossRef]
  16. Vigerstol, K.L.; Aukema, J.E. A comparison of tools for modeling freshwater ecosystem services. J. Environ. Manag. 2011, 92, 2403–2409. [Google Scholar] [CrossRef] [PubMed]
  17. Wu, Y.; Xu, Y.; Yin, G.; Zhang, X.; Li, C.; Wu, L.; Wang, X.; Hu, Q.; Hao, F. A collaborated framework to improve hydrologic ecosystem services management with sparse data in a semi-arid basin. Hydrol. Res. 2021, 52, 1159–1172. [Google Scholar] [CrossRef]
  18. Li, Q.; Li, W.; Wang, S.; Wang, J. Assessing heterogeneity of trade-offs/synergies and values among ecosystem services in Beijing-Tianjin-Hebei urban agglomeration. Ecol. Indic. 2022, 140, 109026. [Google Scholar] [CrossRef]
  19. Huang, G.; Feng, S.; Hu, C. A Study of the Spatiotemporal Evolution Patterns and Coupling Coordination between Ecosystem Service Values and Habitat Quality in Diverse Scenarios: The Case of Chengdu Metropolitan Area, China. Sustainability 2024, 16, 3741. [Google Scholar] [CrossRef]
  20. Caro, C.; Marques, J.C.; Cunha, P.P.; Teixeira, Z. Ecosystem services as a resilience descriptor in habitat risk assessment using the InVEST model. Ecol. Indic. 2020, 115, 106426. [Google Scholar] [CrossRef]
  21. Xu, Y.; Wu, Y.; Zhang, X.; Yin, G.; Fu, Y.; Wang, X.; Hu, Q.; Hao, F. Contributions of climate change to eco-compensation identification in the Yangtze River economic Belt, China. Ecol. Indic. 2021, 133, 108425. [Google Scholar] [CrossRef]
  22. Deng, L.; Li, Y.; Cao, Z.; Hao, R.; Wang, Z.; Zou, J.; Wu, Q.; Qiao, J. Revealing Impacts of Human Activities and Natural Factors on Dynamic Changes of Relationships among Ecosystem Services: A Case Study in the Huang-Huai-Hai Plain, China. Int. J. Environ. Res. Public Health 2022, 19, 10230. [Google Scholar] [CrossRef] [PubMed]
  23. Xu, X.; Yang, G.; Tan, Y.; Liu, J.; Hu, H. Ecosystem services trade-offs and determinants in China’s Yangtze River Economic Belt from 2000 to 2015. Sci. Total Environ. 2018, 634, 1601–1614. [Google Scholar] [CrossRef] [PubMed]
  24. Wang, N.; Li, S.; Kang, Q.; Wang, Y. Exploring the land ecological security and its spatio-temporal changes in the Yangtze River Economic Belt of China, 2000–2020. Ecol. Indic. 2023, 154, 110645. [Google Scholar] [CrossRef]
  25. Wu, J.; Sun, W. Regional Integration and Sustainable Development in the Yangtze River Delta, China: Towards a Conceptual Framework and Research Agenda. Land 2023, 12, 470. [Google Scholar] [CrossRef]
  26. Li, Y.; Lin, Q.; Zhang, J.; Fang, L.; Li, Y.; Zhang, L.; Wen, C. Convergence Analysis of the Overall Benefits of Returning Farmland into Forest in the Upper Yangtze River Basin, China. Sustainability 2023, 15, 1100. [Google Scholar] [CrossRef]
  27. Xu, F.; Wang, X.; Li, L. NPP and Vegetation Carbon Sink Capacity Estimation of Urban Green Space Using the Optimized CASA Model: A Case Study of Five Chinese Cities. Atmosphere 2023, 14, 1161. [Google Scholar] [CrossRef]
  28. Sharp, R.; Douglass, J.; Wolny, S.; Arkema, K.; Bernhardt, J.; Bierbower, W.; Chaumont, N.; Denu, D.; Fisher, D.; Glowinski, K.; et al. InVEST User’s Guide 3.9; The Natural Capital Project: Stanford, CA, USA, 2017. [Google Scholar]
  29. Kong, L.; Wu, T.; Xiao, Y.; Xu, W.; Zhang, X.; Daily, G.C.; Ouyang, Z. Natural capital investments in China undermined by reclamation for cropland. Nat. Ecol. Evol. 2023, 7, 1771–1777. [Google Scholar] [CrossRef]
  30. Costanza, R.; de Groot, R.; Sutton, P.; van der Ploeg, S.; Anderson, S.J.; Kubiszewski, I.; Farber, S.; Turner, R.K. Changes in the global value of ecosystem services. Global Environ. Chang. 2014, 26, 152–158. [Google Scholar] [CrossRef]
  31. He, Q.; Zeng, C.; Xie, P.; Liu, Y.; Zhang, M. An assessment of forest biomass carbon storage and ecological compensation based on surface area: A case study of Hubei Province, China. Ecol. Indic. 2018, 90, 392–400. [Google Scholar] [CrossRef]
  32. Ouyang, Z.; Wang, R.; Zhao, J. Ecosystem services and their economic valuation. Chin. J. Appl. Ecol. 1999, 10, 635–640. (In Chinese) [Google Scholar]
  33. Benesty, J.; Chen, J.; Huang, Y.; Cohen, I. Pearson Correlation Coefficient. In Noise Reduction in Speech Processing; Benesty, J., Ed.; Springer: Dordrecht, The Netherlands; London, UK; New York, NY, USA, 2009; pp. 1–4. ISBN 9783642002953. [Google Scholar]
  34. Wu, Y.; Zhang, X.; Li, C.; Xu, Y.; Hao, F.; Yin, G. Ecosystem service trade-offs and synergies under influence of climate and land cover change in an afforested semiarid basin, China. Ecol. Eng. 2021, 159, 106083. [Google Scholar] [CrossRef]
  35. Zhu, B.; Wang, Z.; Sun, C.; Dewancker, B. The motivation and development impact of energy saving to sustainability in the construction of green campus: A case study of the Zhejiang University, China. Environ. Dev. Sustain. 2021, 23, 14068–14089. [Google Scholar] [CrossRef]
  36. Luo, Q.; Luo, L.; Zhou, Q.; Song, Y. Does China’s Yangtze River Economic Belt policy impact on local ecosystem services? Sci. Total Environ. 2019, 676, 231–241. [Google Scholar] [CrossRef]
  37. Wang, H.; He, W.; Zhang, Z.; Liu, X.; Yang, Y.; Xue, H.; Xu, T.; Liu, K.; Xian, Y.; Liu, S.; et al. Spatio-temporal evolution mechanism and dynamic simulation of nitrogen and phosphorus pollution of the Yangtze River economic Belt in China. Environ. Pollut. 2024, 357, 124402. [Google Scholar] [CrossRef]
  38. Zhang, X.; Zhang, G.; Long, X.; Zhang, Q.; Liu, D.; Wu, H.; Li, S. Identifying the drivers of water yield ecosystem service: A case study in the Yangtze River Basin, China. Ecol. Indic. 2021, 132, 108304. [Google Scholar] [CrossRef]
  39. Luo, R.; Yang, S.; Zhou, Y.; Gao, P.; Zhang, T. Spatial Pattern Analysis of a Water-Related Ecosystem Service and Evaluation of the Grassland-Carrying Capacity of the Heihe River Basin under Land Use Change. Water 2021, 13, 2658. [Google Scholar] [CrossRef]
  40. Cheng, X.; Chen, L.; Sun, R. Modeling the non-point source pollution risks by combing pollutant sources, precipitation, and landscape structure. Environ. Sci. Pollut. Res. 2019, 26, 11856–11863. [Google Scholar] [CrossRef]
  41. Salata, S.; Garnero, G.; Barbieri, C.; Giaimo, C. The Integration of Ecosystem Services in Planning: An Evaluation of the Nutrient Retention Model Using InVEST Software. Land 2017, 6, 48. [Google Scholar] [CrossRef]
  42. Yang, Y.; Lu, H.; Liang, D.; Chen, Y.; Tian, P.; Xia, J.; Wang, H.; Lei, X. Ecological sustainability and its driving factor of urban agglomerations in the Yangtze River Economic Belt based on three-dimensional ecological footprint analysis. J. Clean. Prod. 2022, 330, 129802. [Google Scholar] [CrossRef]
  43. Peng, L.; Wu, H.; Li, Z. Spatial–Temporal Evolutions of Ecological Environment Quality and Ecological Resilience Pattern in the Middle and Lower Reaches of the Yangtze River Economic Belt. Remote Sens. 2023, 15, 430. [Google Scholar] [CrossRef]
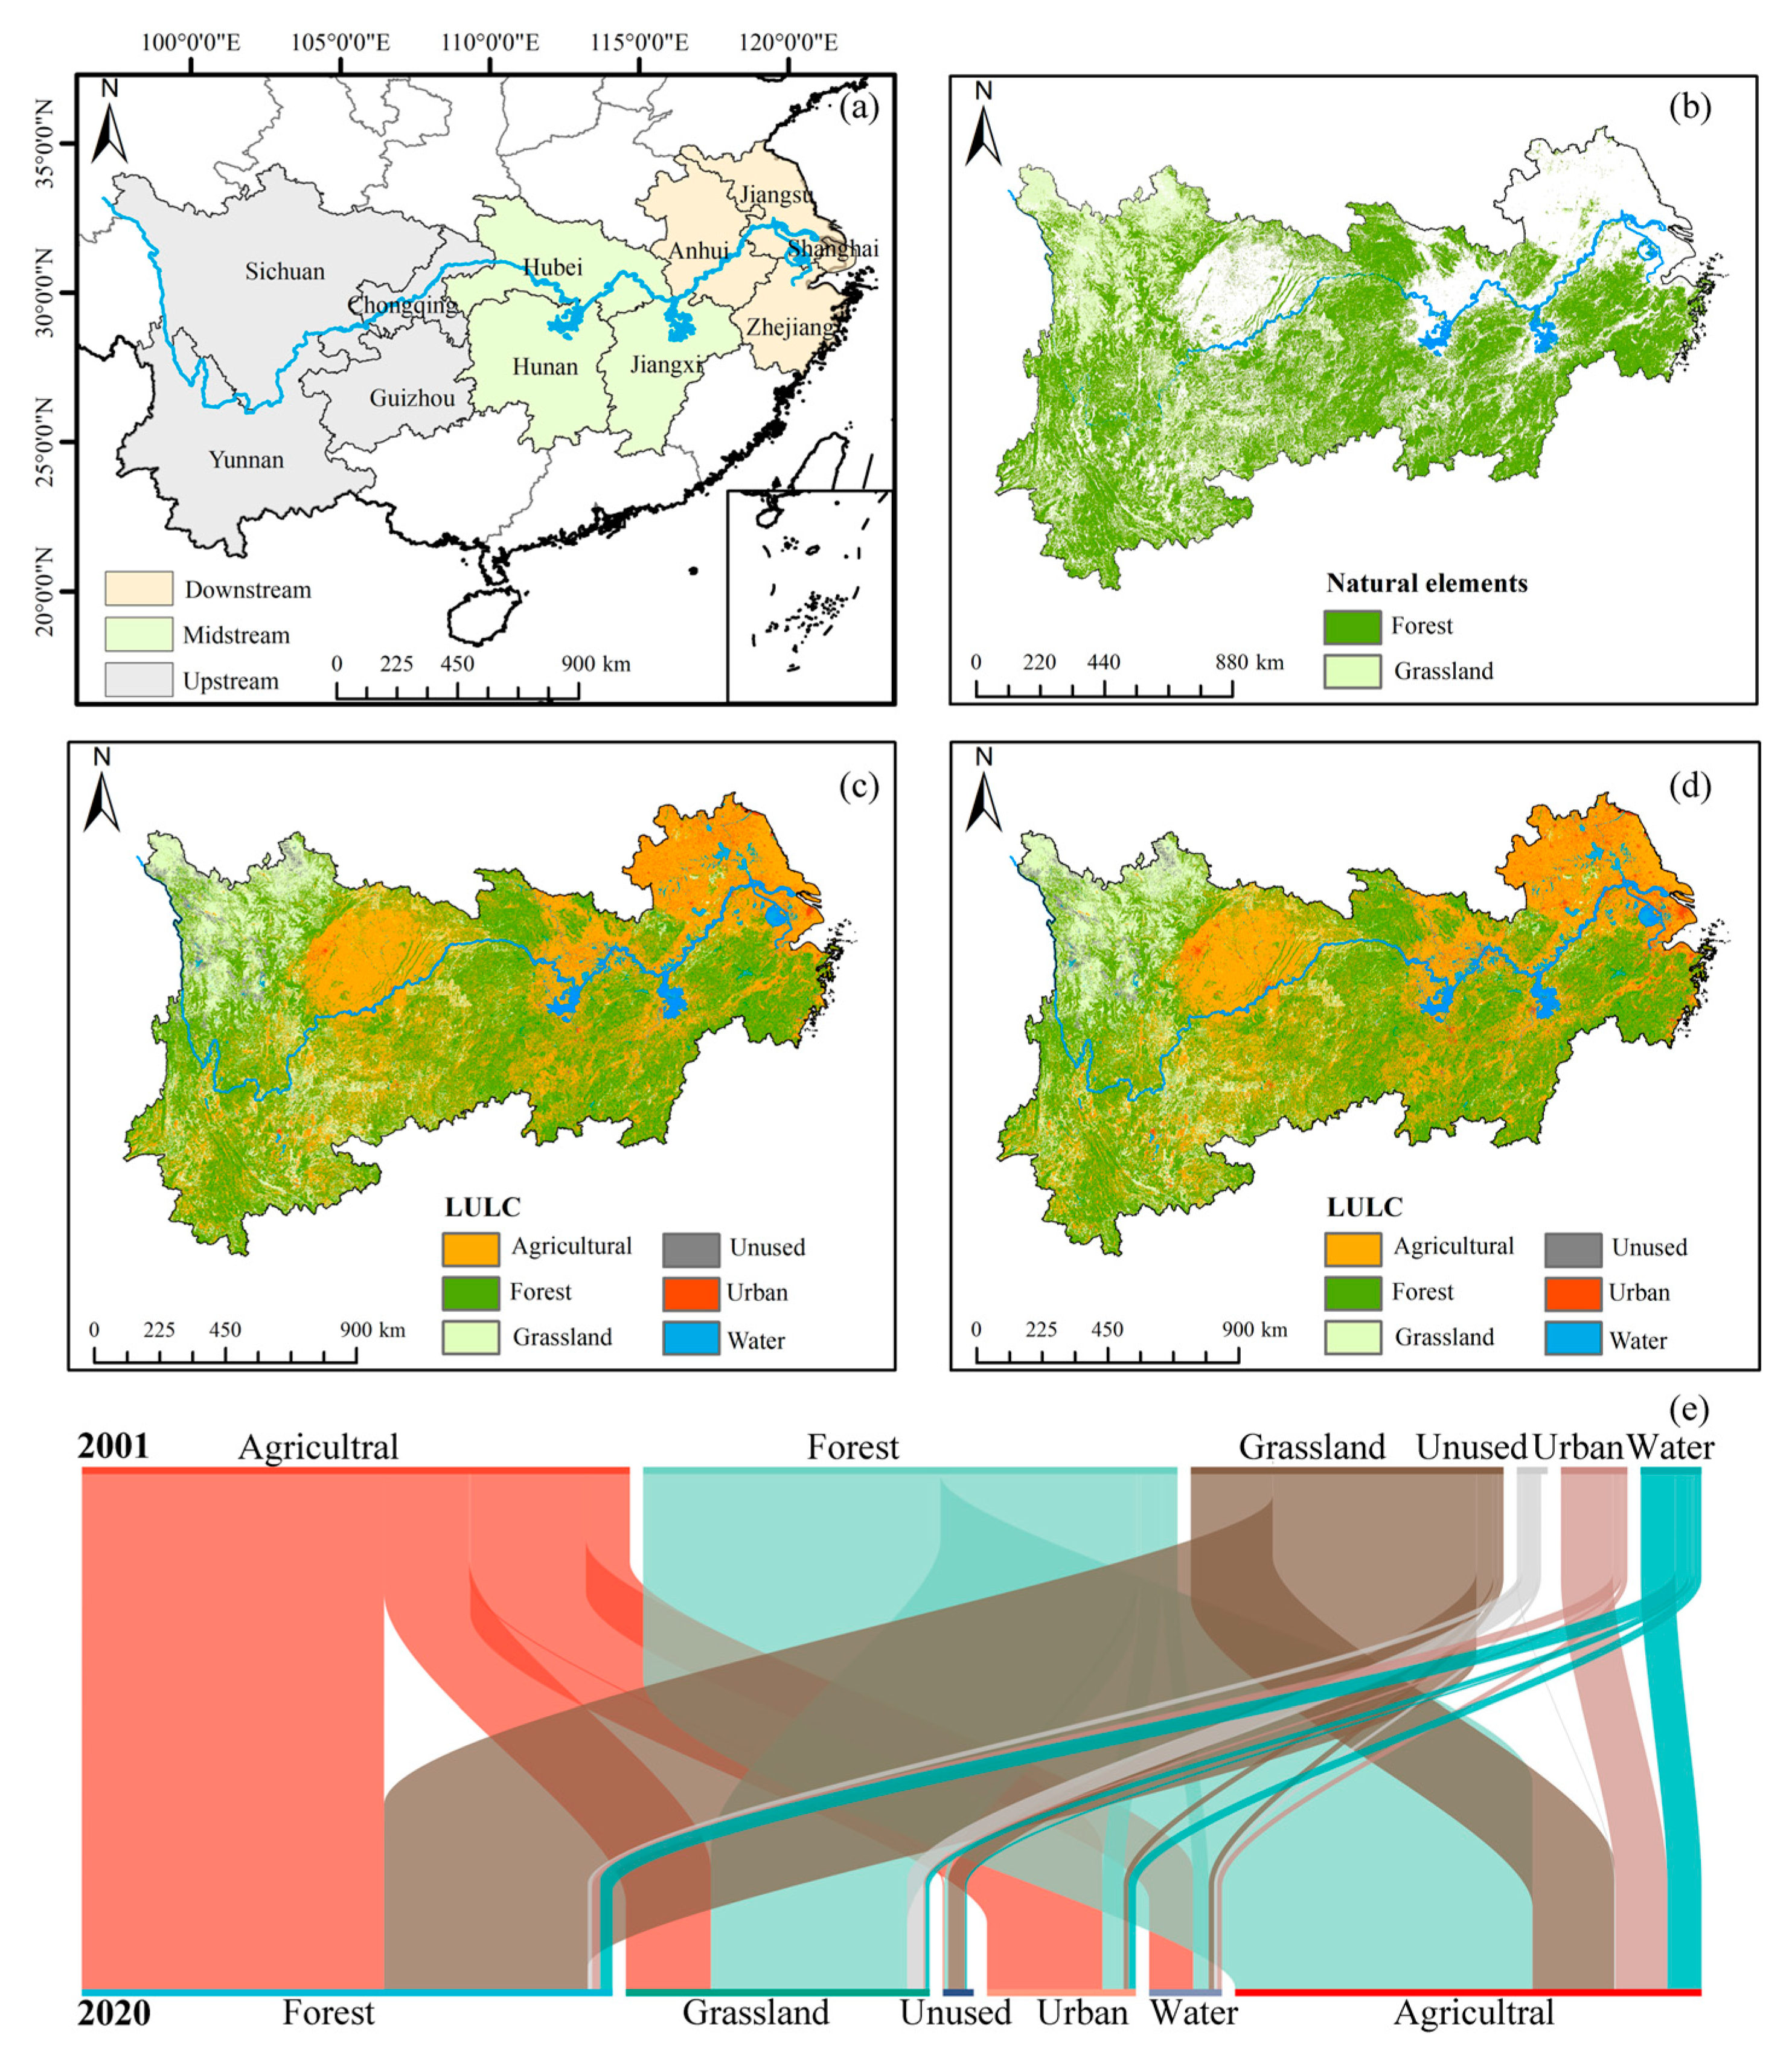
Figure 1. Location and land use transition of the study area ((a): the location of the Yangtze River Economic Belt; (b): the natural elements of the YREB in 2020; (c): the LULC of the YREB in 2001; (d): the LULC of the YREB in 2020; (e): land use transition from 2001 to 2020).
Water 16 02126 g001
Figure 2. Spatial characteristics of 20-year average ecosystem services in the YREB from 2001 to 2020. (a): NPP, net primary productivity; (c): WY, water yield; (e): SR, soil retention; (g): NDR-P, phosphorous pollutants; per unit area anomaly for ecosystem services for different time series from 2001 to 2020. (b): NPP, net primary productivity; (d): WY, water yield; (f): SR, soil retention; (h): NDR-P, phosphorous pollutants.
Water 16 02126 g002
Figure 3. Spatial characteristics of 20-year average integrated ecosystem service value (ESV) in the Yangtze River Economic Belt from 2001 to 2020 (a); the proportion of integrated ecosystem service values in provinces at different periods (b).
Water 16 02126 g003
Figure 4. The changing trend of integrated ecosystem service value among provinces in the Yangtze River Economic Belt from 2001 to 2020 ((a): Shanghai; (b): Jiangsu; (c): Zhejiang; (d): Anhui; (e): Hubei; (f): Hunan; (g): Jiangxi; (h): Chongqing; (i): Yunnan; (j): Guizhou; (k): Sichuan).
Water 16 02126 g004
Figure 5. Relative importance of climate and human activities on ecosystem services ((a): ESV, ecosystem service value; (b): NPP, net primary productivity; (c): WY, water yield; (d): SR, soil retention; (e): NDR-P, phosphorous pollutants).
Water 16 02126 g005
Figure 6. Combined effects of climate and human activities on ecosystem services ((a,b): ESV, ecosystem service value; (c,d): NPP, net primary productivity; (e,f): WY, water yield; (g,h): SR, soil retention; (i,j): NDR-P, phosphorous pollutants).
Water 16 02126 g006
Table 1. The ecosystem service values quantified methods for different ecosystem services.
Ecosystem ServicesEcosystem Service Values Quantification Methods
NPPAlternative market approach: the NPP is used to characterize the carbon fixation and oxygen release function by photosynthesis by vegetation, and the benefit can be calculated by the cost of afforestation [31].
WYDirect market approach: the first list of residents’ average water prices in major cities of the Yangtze River Economic Belt in 2018 is taken as the accounting method parameters [12].
SRAlternative market approach: using the method of Ouyang’s [32] study, which indicates that the economic benefits of SR mainly come from the reduction in the siltation effect of sediment.
NDR-PAlternative market approach: the NDR-P mainly refers to the non-point source pollution treatment cost of phosphorus per unit of weight of the lake [12].
Note: NPP, net primary productivity; WY, water yield; SR, soil retention; NDR-P, phosphorous pollutants.
Table 2. The datasets for different scenarios.
Land Use 2001Land Use 2020
Climate 2001–2005Scenario 1Scenario 2
Climate 2016–2020Scenario 3Scenario 4
Table 3. Correlation between different ecosystem services in the Yangtze River Economic Belt from 2001 to 2020.
WYSRNDR-PNPP
WY10.276−0.1210.003
SR0.27610.0130.105
NDR-P−0.1210.0131−0.132
NPP0.0030.105−0.1321
Note: The numbers in the table represent the p-values of significance tests at 95% confidence intervals, and p < 0.05 indicates a significant correlation. NPP, net primary productivity; WY, water yield; SR, soil retention; NDR-P, phosphorous pollutants.
Table 4. The correlation of different ecosystem services at provincial scales in the Yangtze River Economic Belt.
ZhejiangYunnanSichuanJiangxiHunanHubeiGuizhouAnhuiShanghaiChongqingJiangsu
NPP/SR0.0320.0980.0650.0120.0280.0510.0970.0110.1250.0740.102
NPP/WY0.0010.0060.0350.0030.0010.0410.0230.0110.0510.0220.053
NPP/NDR-P−0.048−0.0660.102−0.058−0.0460.0680.0770.0340.1340.0710.088
WY/SR0.0240.0440.2010.0780.0140.1510.0680.0530.0510.1250.135
WY/NDR-P−0.028−0.011−0.111−0.012−0.050−0.112−0.0640.1240.0420.0310.041
SR/NDR-P0.0120.0260.0130.0390.0210.0190.0380.0270.0110.0410.046
Note: The symbol is the sign of the correlation coefficient. The blue background presents a significant negative correlation, and the red background shows a significant positive correlation. The darker color represents the correlation that is more significant. NPP, net primary productivity; WY, water yield; SR, Soil Retention; NDR-P, phosphorous pollutants.
Table 5. Integrated ecosystem service value of provinces and cities in the Yangtze River Economic Belt during different periods (1011 yuan).
2001–20052006–20102011–20152016–2020Average
Shanghai0.290.220.230.250.25
Jiangsu2.012.011.862.132.01
Zhejiang3.023.163.63.913.42
Anhui3.293.123.153.753.33
Hubei4.324.164.024.374.22
Hunan6.475.875.816.66.19
Jiangxi5.985.255.736.295.81
Chongqing1.912.011.841.981.93
Yunnan10.19.468.429.379.34
Guizhou4.564.323.924.864.41
Sichuan9.539.729.799.849.72
Table 6. The percentage of pixels in provinces for different combined effects (%).
ESsEffectsShanghaiJiangsuZhejiangAnhuiHubeiHunanJiangxiChongqingYunnanGuizhouSichuan
ESVSynergistic3118264156744842864735
Inhibitory5368554842264351144338
No effects16141911209701027
NPPSynergistic2129403652454032813339
Inhibitory6770566446374866185936
No effects121402181221825
WYSynergistic4338343262684848834942
Inhibitory4255616734324652174837
No effects1575140600321
SRSynergistic7966686973687464726272
Inhibitory121381116202521122813
No effects92124201112115161015
NDR-PSynergistic7453626440465159335351
Inhibitory2647383257384241634438
No effects0004316704311
Note: ESs, ecosystem services; ESV, ecosystem service value; NPP, net primary productivity; WY, water yield; SR, soil retention; NDR-P, phosphorous pollutants.
Disclaimer/Publisher’s Note: The statements, opinions and data contained in all publications are solely those of the individual author(s) and contributor(s) and not of MDPI and/or the editor(s). MDPI and/or the editor(s) disclaim responsibility for any injury to people or property resulting from any ideas, methods, instructions or products referred to in the content.