Article

Simulation and Prediction of Snowmelt Runoff in the Tangwang River Basin Based on the NEX-GDDP-CMIP6 Climate Model

1
School of Hydraulic and Electric Power, Heilongjiang University, Harbin 150080, China
2
Institute of Groundwater Cold Region, Heilongjiang University, Harbin 150080, China
3
International Joint Laboratory of Hydrology and Hydraulic Engineering in Cold Regions of Heilongjiang Province, Harbin 150080, China
4
Heilongjiang Hydrology and Water Resources Center Yichun Sub-Center, Yichun 153000, China
*
Author to whom correspondence should be addressed.
Water 2024, 16(15), 2082; https://doi.org/10.3390/w16152082
Submission received: 14 June 2024 / Revised: 8 July 2024 / Accepted: 18 July 2024 / Published: 24 July 2024
(This article belongs to the Section Water and Climate Change)

Abstract

:
In this study, the future snowmelt runoff in the chilly northeast region’s Tangwang River Basin was simulated and predicted using the SWAT model, which was built and used based on the NEX-GDDP-CMIP6 climate model. This study conducted a detailed analysis of the spatial and temporal distribution characteristics of snowmelt runoff using high-resolution DEM, land use, and soil data, along with data from historical and future climatic scenarios. Using box plots and the Bflow digital filtering approach, this study first determined the snowmelt runoff period before precisely defining the snowmelt periods. Sensitivity analysis and parameter rate determination ensured the simulation accuracy of the SWAT model, and the correlation coefficients of the total runoff validation period and rate period were 0.75 and 0.76, with Nashiness coefficients of 0.75 for both. The correlation coefficients of the snowmelt runoff were 0.73 and 0.74, with Nashiness coefficients of 0.7 and 0.68 for both, and the model was in good agreement with the measured data. It was discovered that while temperatures indicate an increasing tendency across all future climate scenarios, precipitation is predicted to increase under the SSP2-4.5 scenario. The SSP2-4.5 scenario predicted a decreasing trend regarding runoff, while the SSP1-2.6 and SSP5-8.5 scenarios showed an increasing trend with little overall change and the SSP5-8.5 scenario even showed a decrease of 6.35%. These differences were evident in the monthly runoff simulation projections. Overall, the findings point to the possibility that, despite future climate change having a negligible effect on the hydrological cycle of the Tangwang River Basin, it may intensify and increase the frequency of extreme weather events, creating difficulties for the management of water resources and the issuing of flood warnings. For the purpose of planning water resources and studying hydrological change in this basin and other basins in cold regions, this study offers a crucial scientific foundation. An in-depth study of snowmelt runoff is of great practical significance for optimizing water resource management, rational planning of water use, spring flood prevention, and disaster mitigation and prevention, and provides valuable data support for future research on snowmelt runoff.

1. Introduction

Northeastern China is home to the Northeast Cold Zone, a region distinguished by a temperate monsoon climate with long, cold winters and short, warm summers [1], vast amounts of black soil, and an abundance of water resources. It is a major hub for food production and an important industrial base in China [2], as well as a rich source of biodiversity with distinctive natural landscapes and cultural features. Snowmelt runoff is a significant springtime water supply in northeastern China’s frigid climate, and the region’s agriculture depends on the replenishment of springtime snowmelt water [3]. Similar to how studying the temporal and spatial distribution of snowmelt runoff in irrigated agriculture may lessen the effects of drought on crops and boost irrigation efficiency, a sudden surge in snowmelt runoff can also result in catastrophic flooding [4]. Reducing the amount of damage caused by floods and developing efficient flood control methods can be aided by accurate forecasts of the temporal and spatial variations in snowmelt runoff. Researching snowmelt runoff in the cold northeastern region is important because it can show how climate change affects the region’s hydrological cycle and provide scientific support for the wise use and management of water resources [5]. Simultaneously, it can support the creation of policies and actions to adapt to climate change, safeguard the stability of the society and economy of the cold northeastern region of China, safeguard and enhance the ecological environment in the area, encourage the sustainable development of industry and agriculture, and assist in assessing and mitigating the risk of flooding brought on by snowmelt, improving both the security of the economy and people’s lives.
Snowmelt runoff models are increasingly being created with the use of remote sensing and geographic information systems (GISs), thanks to their rapid growth [6]. To obtain important input data, these models perform inverse calculations after analyzing remotely sensed observations. Strong technological support for water resource management and flood warnings is provided by remote sensing and GIS-based models, which are able to simulate and predict the snowmelt process and its impact on river flow with greater accuracy [7]. The SRM model based on degree-day factor [8] and the SWAT model based on energy balance [9] are currently the most widely used models for snowmelt runoff. Both of these models have better simulation effects and require less data, and they can both play a significant role even in areas where information is lacking.
Yang [10] revealed the impact of the semi-dry cold of the Manas River on the flow from 2001 to 2015 using the SRM model and wavelet coherence analysis. Environmental influences on the flow and its constituents in the source catchment region offer technical assistance for identifying control elements and delineating runoff in the cold desert zone. In order to demonstrate the short duration and flood risk of high runoff volume, Goodarzi [11] employed the SRM model to simulate the runoff in the center basin of Azizhai. It also came to the conclusion that snowpack has a considerable, and not-to-be-ignored, impact on runoff and flooding as elevation rises. In order to forecast future runoff under the RCP 4.5 and RCP 8.5 warming scenarios, Elmer [12] used the SRM model to study the Christmas River sub-basin (Peru) and came to the conclusion that runoff would grow in the other months and decrease in the summer. The accuracy of the empirical snowmelt runoff equations in the basin was found to be superior to that of the SRM snowmelt runoff model by comparative analysis. Tian [13] simulated snowmelt runoff in the Baishan Reservoir watershed of the Second Songhua River based on an empirical snowmelt runoff equation optimized by a genetic algorithm and an SRM model.
Using the SWAT model, Soumyadip [14] created a semi-distributed hydrological model for the Upper Arakananda River Basin that performed well in rate determination and model validation. The model’s validation and rate determination produced satisfactory findings that matched the observed flows. Additionally, it showed that April has the largest snowmelt, which explains why April’s snowmelt contributes the most to runoff. With an increase in the Nash efficiency coefficients and correlation coefficients by a factor of 1.9 and 1.6, respectively, Yang [15] improved the simulation accuracy by integrating a glacier melt algorithm that accounts for the effect of solar radiation using the SWAT+ model. This is very helpful in a watershed where the data are few and primarily dominated by glacier meltwater. In order to predict future runoff with future scenarios RCP4.5 and RCP8.5, Shukla [16] used the SWAT model to simulate snowmelt runoff in the upper reaches of the Satluj river basin in the Himalayas. Better simulation results were obtained, and it was discovered that precipitation, temperature, and runoff volume had all significantly increased. Singh [17] used the GSM-SOCONT and SWAT models to model the Teesta River in the Himalayan basin. To improve the simulation accuracy, the radiative component was added to the Degree Day Approach (DDA) based on the Temperature Index Model (TIM) in the GSM-SOCONT model. The revised glacier parameters were then imported into the SWAT model. For the Hulan River, Liu [18] optimized the SWAT model’s source code settings. The findings of the optimized simulation were compared with the original model once the calibration process was finished. The outcomes demonstrated improved daily runoff simulation accuracy, with the model’s simulation accuracy increasing with the size of the discrepancy between the observed and simulated values in the source code.
In order to foster the advancement of models and augment scientific comprehension of the Earth’s climate system, the World Climate Research Program (WCRP) launched the sixth international Coupled Model Intercomparison Program (CMIP6) climate model. This model seeks to address novel scientific inquiries in the domain of climate change and furnish backing for the execution of the WCRP’s “Grand Challenges” initiative. It is the most comprehensive and scientifically sound climate data model globally [19]. With the goal of addressing novel scientific inquiries concerning climate change and facilitating the execution of the WCRP “Grand Challenges” initiative, CMIP6 is now the world’s most comprehensive, scientific, and extensive climate model dataset. The two-way coupling of atmospheric chemical processes is realized by the CMIP6 process, which is primarily driven by the carbon and nitrogen cycle processes [20,21].
The resolution of atmospheric and oceanic models has also been greatly enhanced. Compared to CMIP6, CMIP5 primarily offers historical and future RCP (Root Concentration Pathway) scenarios [22], which comprise 35 climate models. In order to scientifically incorporate the effects of future socio-economic development, CMIP6 combines shared socio-economic pathways (SSPs) with typical concentration pathway (RCP) scenarios. This fully accounts for the effects of globalization, technological innovation, economic development, and governmental management and offers a new scientific option for research across all sectors [23]. Zhang [24] showed that the CMIP6 climate uncertainty is 0.94–1.96 times higher than the CMIP5 climate uncertainty when comparing the uncertainty of precipitation and temperature extremes projected by 24 global climate models under the forcing of three emission scenarios in each phase of CMIP5 and CMIP6. However, downscaling of the CMIP6 climate model data is required due to the inadequacies of the poor geographical resolution and possible inter-regional bias of the General Circulation Models (GCMs) in the CMIP6 climate models [25].
NASA produces NEX-GDDP, a set of downscaled, high-resolution CMIP model datasets [26] that are useful for evaluating how climate change affects sensitive climate systems and terrain effects. 2015 saw the publication of the initial version, known as the NEX-GDDP-CMIP5 dataset, and Bao [27] used the NEX-GDDP dataset to significantly outperform GCM at regional and local scales. Chen and associates [28] compared the direct output of CMIP5 with NEX-GDDP models, and the results displayed the spatial distribution of extreme precipitation in China more accurately and produced predictions that are more trustworthy. Released in 2022, the second-generation NEX-GDDP-CMIP6 dataset comprises four emission scenarios (SSP1,2-6, SSP2,4-5, SSP3,7-0, and SSP5,8-5) for 35 CMIP6 GCM climate models from 2015–2100 and the 1950–2014 historical experiment. It boasts a greater spatial and temporal resolution. Eight meteorological variables are included in the dataset, which has a 0.25° spatial resolution: mean air temperature, mean wind speed, precipitation, longwave and shortwave radiation, and maximum and lowest air temperatures. Using the day-by-day values from China’s national-level ground-based weather stations and the NEX-GDDP-CMIP6 climatic model dataset, Tong [29] examined the spatial-temporal variation of extreme precipitation indices in the Huaihe River Basin of China. The Huaihe River basin’s anticipated extreme precipitation increase was characterized by spatial changes that decreased from northwest to southeast, as indicated by the extreme precipitation index in the basin, which increased marginally from northwest to southeast. Zhang [30] makes use of the gridded observation day dataset CN05.1, as well as the NEX-GDDP-CMIP6 climate model dataset. A comparative study of extreme high-temperature indices in southwest China indicates that, under various SSP scenarios, particularly under SSP5-8.5, these indices will generally increase in the future; by the end of the twenty-first century, there will be a significant increase in both the number of high-temperature days and the annual maximum temperature, as well as heatwaves. There will be a rise in both the frequency and length of heatwaves. Muhadaisi [31] calculated the variations in extreme temperature and precipitation indices for various SSP paths in comparison to 1.5 °C, 2 °C, and 3 °C baseline warming using the NEX-GDDP-CMIP6 dataset. There was an observed increased tendency in temperature and humidity, which resulted in more dramatic index swings in terms of frequency, intensity, and length.

2. Materials and Methods

2.1. Overview of the Study Area

The Tangwang River watershed is located in Yichun City, Heilongjiang Province, originating at the southern foot of the western slope of the Xiaoxinganling Mountains, with a watershed area of about 20,838 square kilometers. The river flows from north to south through several districts and counties in Yichun City, including Tangwang County, Youyi District, Xinqing District, Hongxing District, etc., and finally joins the Songhua River about 5 km southwest of Tangyuan County, Jiamusi City, which is a typical mountain stream forested watershed [32]. The low hills of the Xiaoxinganling, which are high in the north and low in the south, dominate the morphology of the Tangwang River Basin watershed. The elevation range of these hills is primarily 200–600 m. Its climate is classified as mid-temperate continental monsoon, with short, rainy summers, dry, windy spring and fall seasons, and quick cooling. It is situated in the frigid northeast. The average annual temperature is 0.4 °C, with January being the coldest month at −23.9 °C and July being the hottest at 20.5 °C. Permafrost depths exceed 2.9 m, with frost-free and freezing periods of roughly 110 and 215 days, respectively. The mountains and woods in the upper portions of the basin have an impact on the wind speed, which ranges from a maximum of 28 m/s to an average of 2.4 m/s. Summertime brings lots of northeasterly winds, fall brings southwesterly winds, and spring and winter provide lots of westerly and northwesterly breezes. The annual average precipitation at the downstream Chenming hydrological station is 577.1 mm, while the annual average is almost 600 mm. With a maximum of 888.4 mm and a minimum of 297.3 mm, precipitation is concentrated in June through September, making up over 75% of the annual total. There is notable inter-annual fluctuation in this precipitation pattern. Surface runoff makes up the majority of the flow from the basin, and the primary source of this runoff is atmospheric precipitation, which includes snowmelt and rainfall [33]. The majority of the yearly runoff—more than 80%—comes from rainfall, with the remaining 10% coming from snowmelt between early April and mid-May. Annual minimum and maximum runoff fluctuate significantly from year to year, and runoff is very variable. Uneven intra-annual distribution occurs, with barely 8% in the winter and 85% from May to September.

2.2. Data Sources

2.2.1. Digital Elevation Model (DEM)

The DEM (Digital Elevation Model) is the key spatial data required to capture the topographic features of the watershed and is essential for hydrologic simulation. High-resolution DEM data are critical for SWAT modeling, and studies have shown that the optimal resolution of 20–150 m is recommended for elevation data when using SWAT for runoff simulation [34]. SRTM 90 m and ASTER GDEM-30 m data are commonly used. In this study, ASTER GDEM-30 m data were used to generate the applicable watershed DEM based on the latitude and longitude of the Tangwang River watershed, downloaded and processed from the Geospatial Data Cloud website.

2.2.2. Land Use Data

Land use data are essential for modeling watershed hydrology and nonpoint source pollution [35], affecting evapotranspiration, runoff, soil erosion, and pollutant inputs and transport. In this study, we used the Chinese Academy of Sciences (CAS) “China Multi-Period Land Use Remote Sensing Monitoring Dataset (CNLUCC)” to process the land use data in the Tangwang River watershed by reclassification to obtain nine land types, and to establish an index table to complete the construction of the data. The coding of land use types in the study area is shown in Table 1.

2.2.3. Soil Type

Soil data cover the physical and chemical properties of soils and their distribution, which are essential for modeling soil erosion, nutrient loss, pollutant adsorption, and water movement [36]. In this study, the HWSD global soil database was used and the statistical table of soil types obtained by calculating soil physicochemical properties and reclassifying the soils in the study area through SPAW(6.02) software before establishing the soil database is shown in Table 2.

2.2.4. Hydrometeorological Data

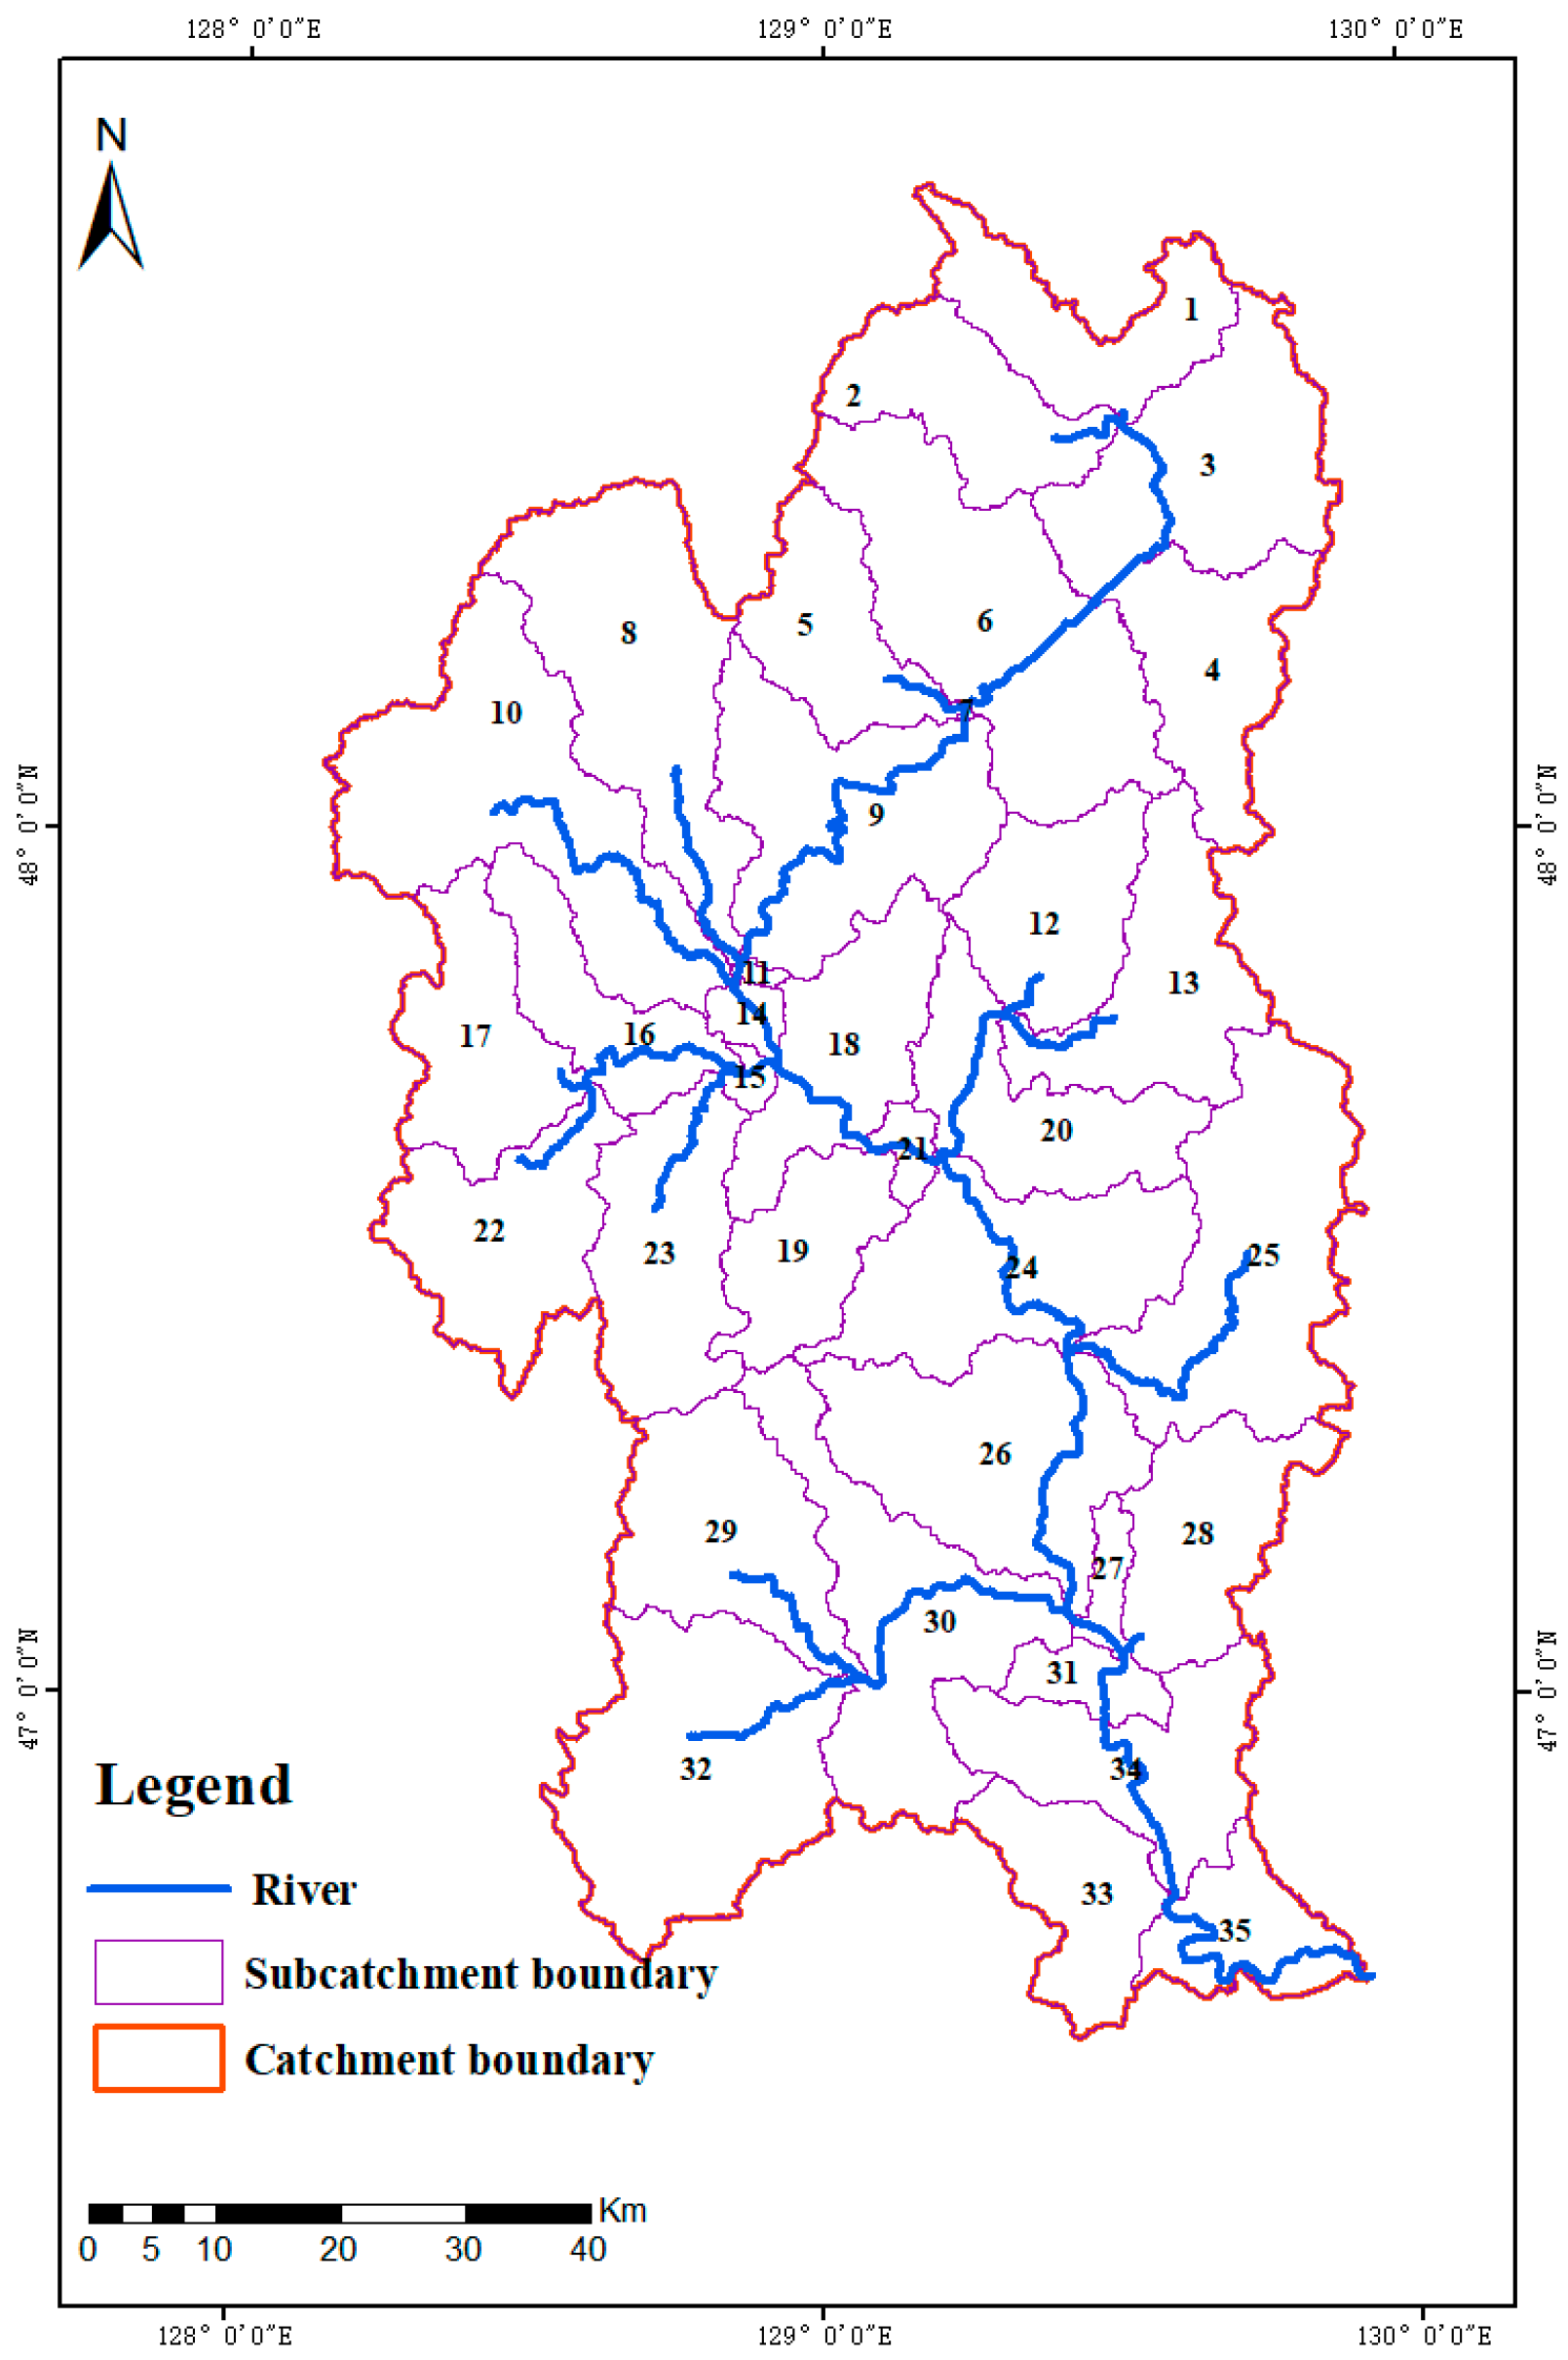
The hydrological data, which have acceptable data continuity and can be used for model rate determination and validation, are taken from the daily average runoff data collected at Chenming (II) hydrological station in the Tangwang River basin from 2001 to 2022. This study uses two different forms of meteorological data: projected meteorological data and historical meteorological observation data. The National Meteorological Science Data Center provides daily data from four meteorological stations in the Tangwang River Basin (Wuyiling, Wuying, Yichun, and Tangyuan), covering the period from 1974 to 2022. These data include the daily precipitation, average wind speed, maximum and minimum air temperature, relative humidity, solar radiation, and surface temperature at each station. These daily data form the basis for the historical meteorological data. The meteorological information was created by interpolating the missing data using SWAT weather(1.0) software. The locations of hydrological and meteorological stations are displayed in Figure 1. The temperature and precipitation data from three climate model datasets (SSP1-2.6, SSP2-4.5, and SSP5-8.5) in the NEX-GDDP-CMIP6 dataset of the Beijing Climate Center BCC-CSM2-MR data were utilized to create the future climate data.

2.3. Soil and Water Assessment Tool

The SWAT model is an integrated hydrologic model designed to simulate watershed hydrologic cycles and water quality issues. Developed by Dr. Arnold [37,38], it has simulated hydrologic processes in several watersheds in the U.S. The SWAT model accurately predicts watershed hydrology and supports water resource management, agriculture, environmental planning, and policy development. It has been widely used at home and abroad and has been well-evaluated in Alberta, Canada [39], the Vietnam River Basin [40], and the Hulan River Basin [41,42]. Initially, the watershed’s digital elevation DEM is processed, mask extraction and depression filling are performed, flow direction and confluence are calculated, a sub-basin area threshold of 10% is set for segmentation, and based on this, the river network is generated and the hydrological stations are edited by hand. Using the Chenming (II) station as the watershed outlet, the hydrological response unit was divided into 35 sub-watersheds by combining data on land use, soil type, and slope. Then, the hydrological response unit was divided into 130 hydrologic response units, with Figure 2 illustrating the sub-basin division.

2.4. Research Methodology

2.4.1. Baseflow Partitioning Method

The common and widely used baseflow segmentation methods are roughly as follows: graphical method [43], Kalinin method, sliding minimum method, isotope tracer method, HYSEP method, digital filtering method, etc. In this study, the Bflow digital filtering method is used, the basic principle of which is to consider the flow time series of a river as consisting of a high-frequency (direct runoff) and a low-frequency (baseflow) signal, and to separate these two parts using mathematical models. The model can be integrated and used with the SWAT model, which effectively assists the SWAT model in the division of baseflow and the determination of model parameters. In the arid regions of northwest China [44] and central Korea [45], more satisfactory results have been achieved in practical application, proving its practical value and effectiveness in practical hydrological analysis. The filtering equation is:
q i = β q i 1 + 1 + β 2 Q i Q i 1
b i = Q i q i
where:is the surface runoff at the ith moment; (m3/s) is a direct response to the high-frequency signal; is the surface runoff at the ith moment (m3/s); is the river runoff at the ith moment (m3/s); is the river runoff at the ith moment (m3/s); is the baseflow at the ith moment, which is a low-frequency signal. is the filtering parameter, often taking the value of 0.85, 0.925, or 0.95.

2.4.2. Evaluation Criteria

The merit of SWAT model outputs can be assessed by parameter tuning through the 995ppu plot fit of the SWAT-cup tool, which is more accurately judged based on the correlation coefficient (R2) and the Nash coefficient (Ens). The Nash coefficient (En) measures the quantitative difference between the simulated and measured values, and the correlation coefficient (R2) measures the trend agreement between the two. Both values range from 0 to 1, with values closer to 1 indicating a better match between the simulated and measured values. Usually, an E-value greater than 0.5 can be considered a good fit between the model simulation and the actual measurement, meeting the requirements [46].
E n s = 1 i = 1 n Q o b s Q s i m 2 i = 1 n Q o b s Q o b s ¯ 2
R 2 = i = 1 n Q o b s Q o b s ¯ Q s i m Q s i m ¯ 2 i = 1 n Q o b s Q o b s ¯ 2 i = 1 n Q s i m Q s i m ¯ 2
where: Q o b s is the actual measured runoff volume (m3/s); Q s i m is the simulated runoff volume (m3/s); Q o b s ¯ is the average value of the actual measured runoff volume (m3/s); Q s i m ¯ is the average value of the simulated runoff volume (m3/s); n indicates the length of the runoff time series.

2.4.3. Land Use Dynamic Index and Transfer Matrix

The single land use motivation index (LUD) refers to the ratio of the change of a certain land use type within a certain time frame to a specific period, which focuses on describing the rate of change of a single land use type, and is a measure of the degree of development of human development for the exploitation or protection of a certain land use type within a certain period of time. The formula for calculating the single land use motivation index is as shown in Equation (5).
The total absolute value of each land use type’s single dynamic attitude in the region over a predetermined period of time is the Comprehensive Land Use Dynamic Attitude Index (CLUD), which can be used to gauge how much the different land use types have changed over time. Formula (6) provides the formula for calculating the Comprehensive Land Use Dynamic Attitude.
A Markov model is applied to land use change and the land use transfer matrix approach can quantify the transfer between various land use types. Equation (7) displays the formula.
K = U b U a U a × 1 T × 100 %
L C = i = 1 n Δ L U i j 2 i = 1 n L U i × 1 T × 100 %
S i j = S 12 S 1 n S n 1 S n n
where K represents a single land use dynamic attitude; Ua and Ub represent the initial and final areas of a single land use type; T represents the time period of the change; LC represents the comprehensive land use dynamic attitude; Δ L U i j represents the absolute value of the area of land class i converted to non-i land class during time T; and L U i represents the initial area of land class i. S represents the area; n represents the number of land use types before and after conversion; i and j (i, j = 1, 2, ..., n) represent the land types before and after conversion, respectively; and Sij represents the area of land type i converted to land type j before the conversion.

2.4.4. Snowmelt Runoff Segmentation Results

The complicated hydrological process of snowmelt runoff, which is impacted by topography, human activity, and meteorology, establishes the distribution and trend of the water that melts across time and space [47]. There are two stages to the process [10]:
(1) Process that produces runoff of snow: when the temperature rises in the spring, solar radiation and air heat are absorbed by the snow, causing it to melt. A “stagnant phase” is created when the snowpack and soil absorb the first melted water. The water moves into the “outflow phase” and creates surface runoff when it surpasses the water-holding capacity.
(2) Confluence of snowmelt water: Meltwater runs off the land, collects in natural watercourses, and either evaporates or partially percolates. The meltwater eventually finds its way into lakes and rivers, where it provides a source of water. This procedure is essential to managing water resources and issuing flood warnings. It is impacted by meteorological parameters including temperature, precipitation, solar radiation, and surface conditions such as terrain, soil, and vegetation. There are two types of runoff from spring rivers: subsurface runoff, or baseflow, and direct runoff [48]. Surface runoff and loamy streamflow from rainfall or snowmelt that immediately reacts to snowmelt and causes a sudden spike in streamflow make up direct runoff. However, baseflow—which is essential to preserving the long-term stability of stream flow—is the slow replenishment of the stream channel following precipitation or surface water seeping into the earth and flowing underground over time.
Baseflow can be divided by utilizing techniques for splitting baseflow and examining the makeup of river runoff to identify snowmelt runoff. Direct runoff is obtained by deducting baseflow from total runoff following baseflow separation. While snowmelt runoff is computed using precipitation data, the contribution of snowmelt to direct runoff is evaluated by integrating temperature and other meteorological data.
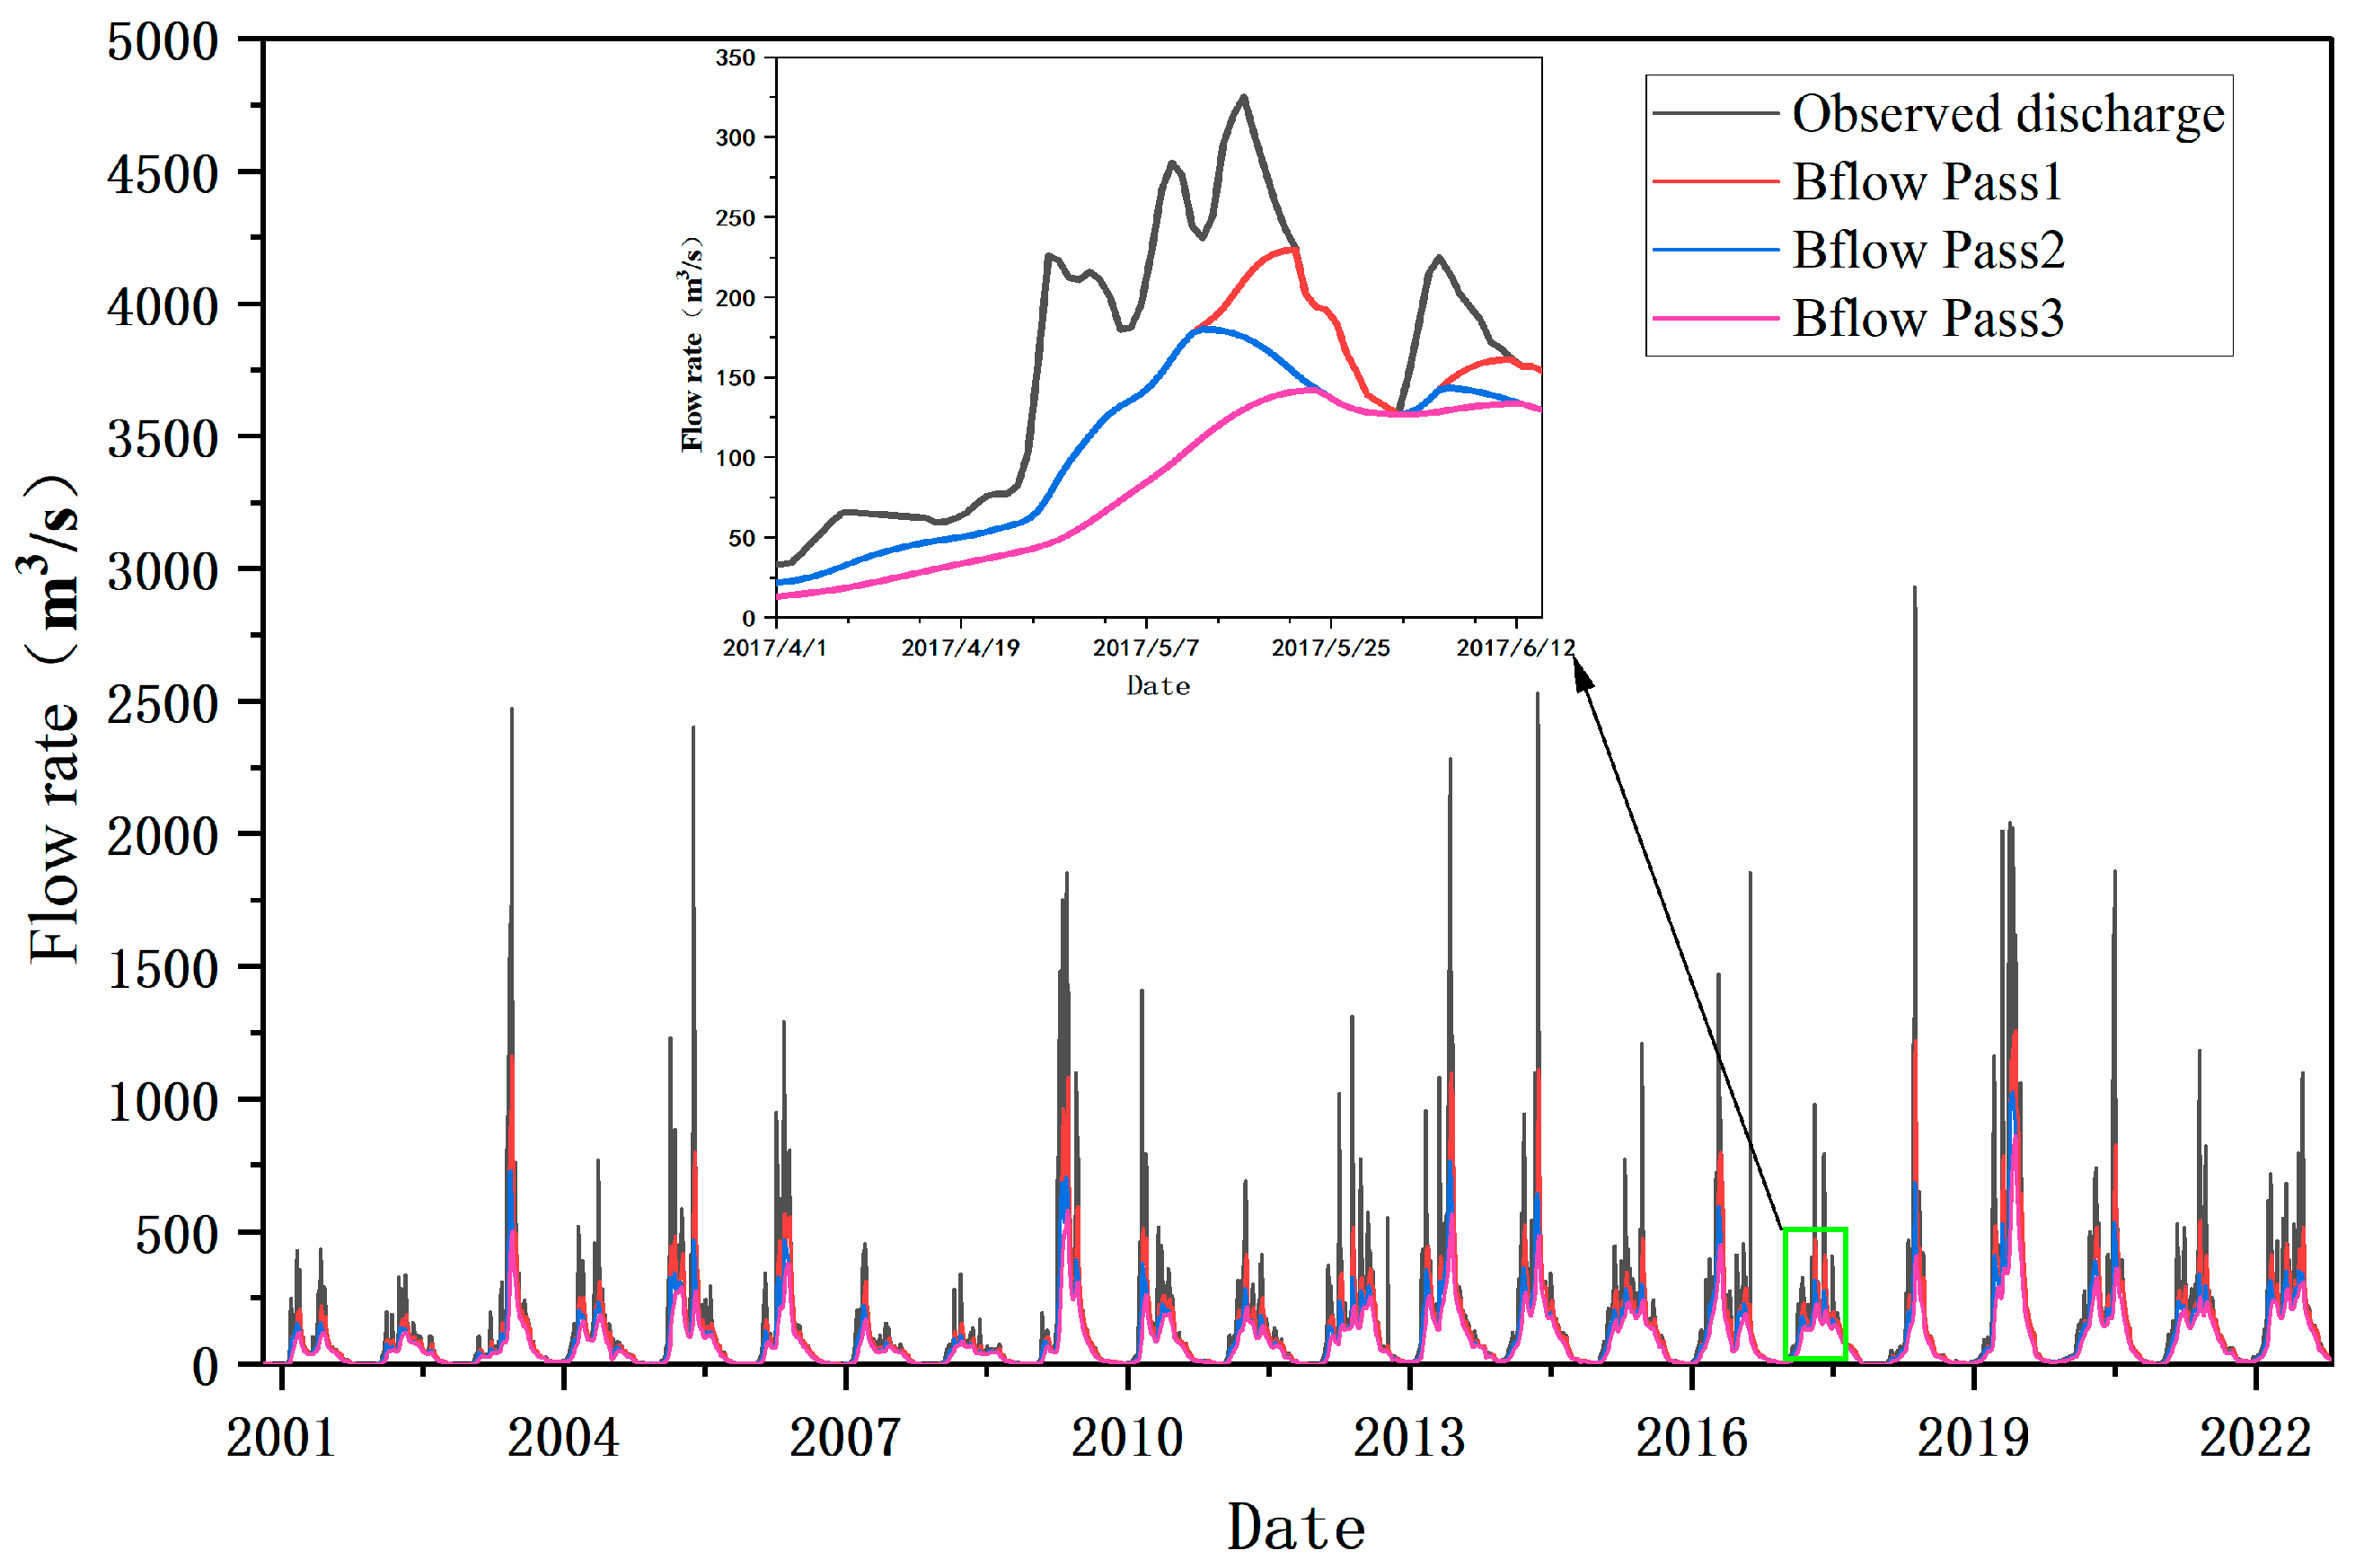
The daily flow of Chenming (II) station in the Tangwang River Basin from 2001 to 2022 was divided into baseflow using the Bflow digital filtering analysis method, and the results of three runoff divisions were obtained to determine the baseflow division ratio for each year. By plotting the Tangwang River basin runoff process line and using the digital filtering method on three sets of runoff baseflow segmentation results, as shown in Figure 3, it can be seen in the first segmentation of the baseflow that the obtained proportion is high, indicating that it may contain part of the direct runoff; on the other hand, the third segmentation of the baseflow obtained by the value of the baseflow is low, and the baseflow curve is too smooth and has lost the important details of hydrological processes. In contrast, the results of the second segmentation are closer to the actual situation and have better accuracy.
Select the second baseflow segmentation results as the Tangwang River Basin snowmelt runoff period baseflow ratio. This is because in the northeastern cold region, snowmelt runoff occurs roughly in the spring, so the year-by-year total runoff process line and baseflow ratio of the Tangwang River Basin, as well as the total runoff changes and trends, can be used to determine the start and end dates of the snowmelt runoff, along with the selection of the beginning of the year in the time series, the middle of the year, and the end of the year. The beginning, middle, and end years of the time series, i.e., 2001, 2011, 2012, and 2022, are selected as typical years to analyze the change rule of baseflow ratio, and the process lines of total runoff and baseflow ratio in typical years are shown in Figure 4.
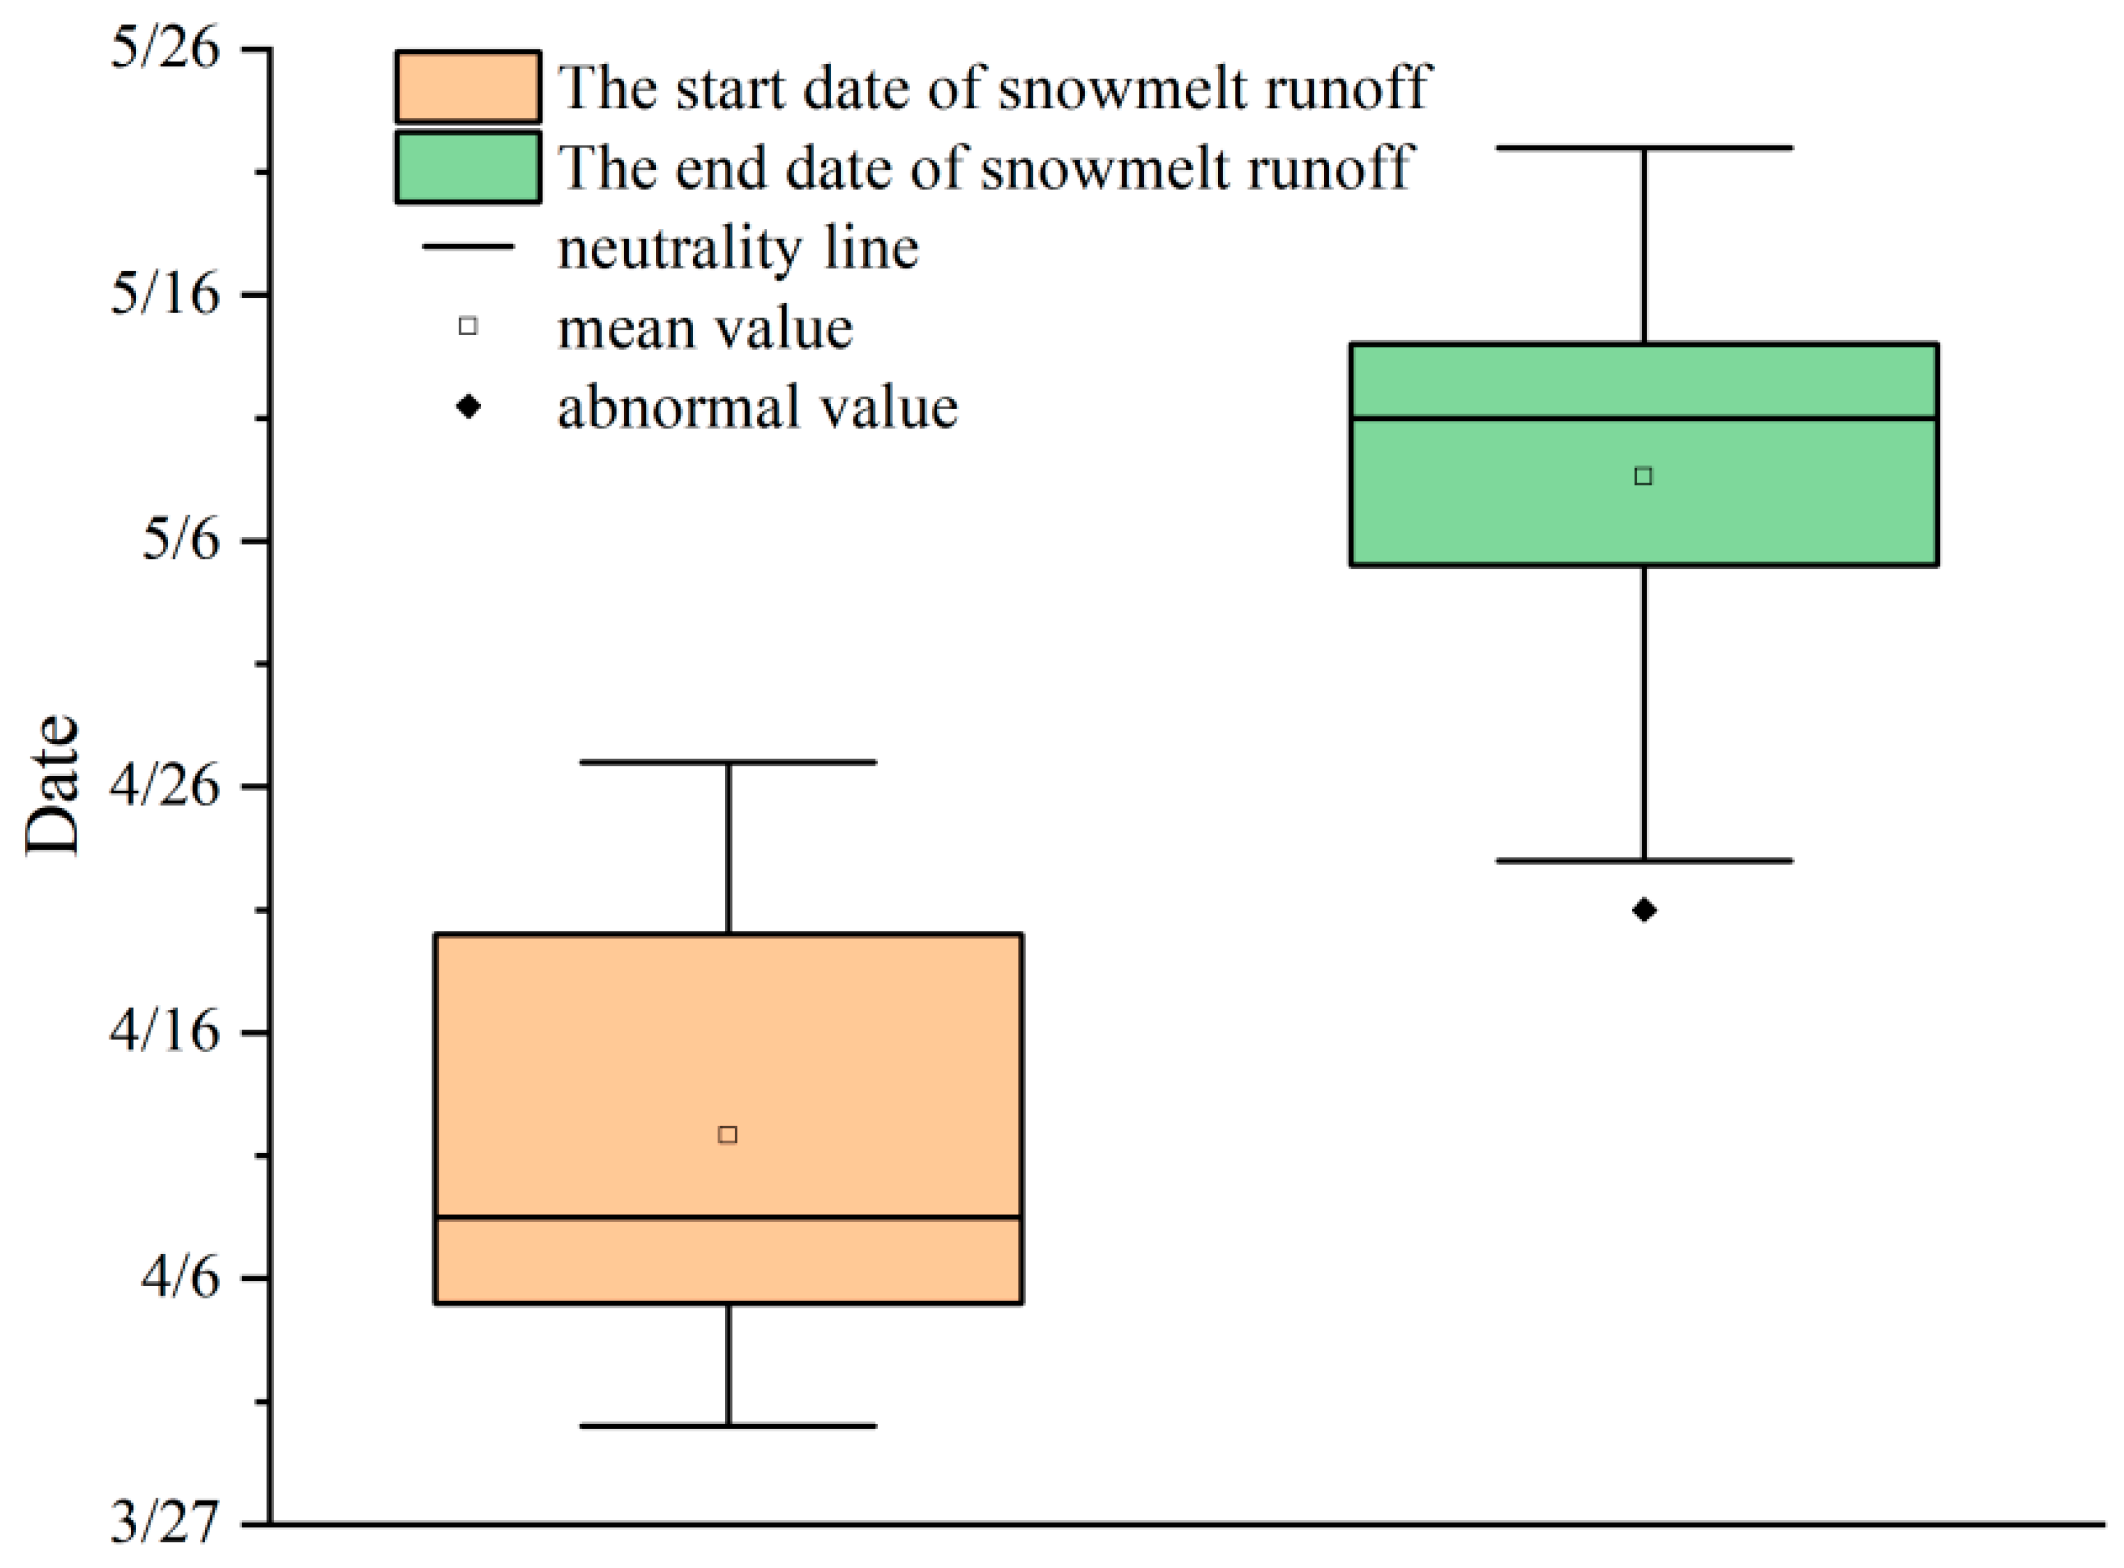
Due to low precipitation and temperature variations in March, the river was largely unthawed and the soil was frozen, which decreased infiltration. Subsurface runoff accounted for the majority of the runoff volume, with surface runoff being smaller [49]. As temperatures rise and snowmelt occurs from the end of March to mid-April, baseflow ratios steadily decline and surface runoff increases. Baseflow ratios decline to a minimum, surface runoff diminishes, and baseflow ratios climb to a maximum, often by mid-May, before the soil thaws and snowmelt replenishes groundwater. As a result, the start date for snowmelt runoff is set for April, when baseflow ratios are at their lowest, and the termination date is set for late April or early May, when baseflow ratios are at their highest [13]. Establish the date of the snowmelt season for every year, then tabulate the data using a box plot. Box plots are a clear, easy-to-understand way to quickly communicate a lot of information about data collection, such as its distribution patterns, skewness, and possible outliers. The data’s minimum, first quartile (Q1), median (Q2), third quartile (Q3), and maximum values are displayed, for instance, in Figure 5.
The snowmelt runoff start date varied between 31 March and 27 April, with the primary concentration occurring between 4 April and 19 April. Table 3 displays the statistical values from the box plot of the Tangwang River Basin. There was some fluctuation in the final date of snowmelt runoff between 21 April and 19 May, with a substantial concentration occurring between 2 May and 14 May. When characterizing the central tendency of discrete data in statistical analysis, the median value, or simply the median, of the box plot is significant. Consequently, the start and finish dates of the snowmelt runoff, which lasted 34 days overall and started on 8 April and ended on 11 May, were determined by taking the median of the box plot.

3. Results and Analysis

3.1. Future Scenario—Declining Water Changes

3.1.1. Annual Precipitation Changes during Snowmelt Runoff Periods

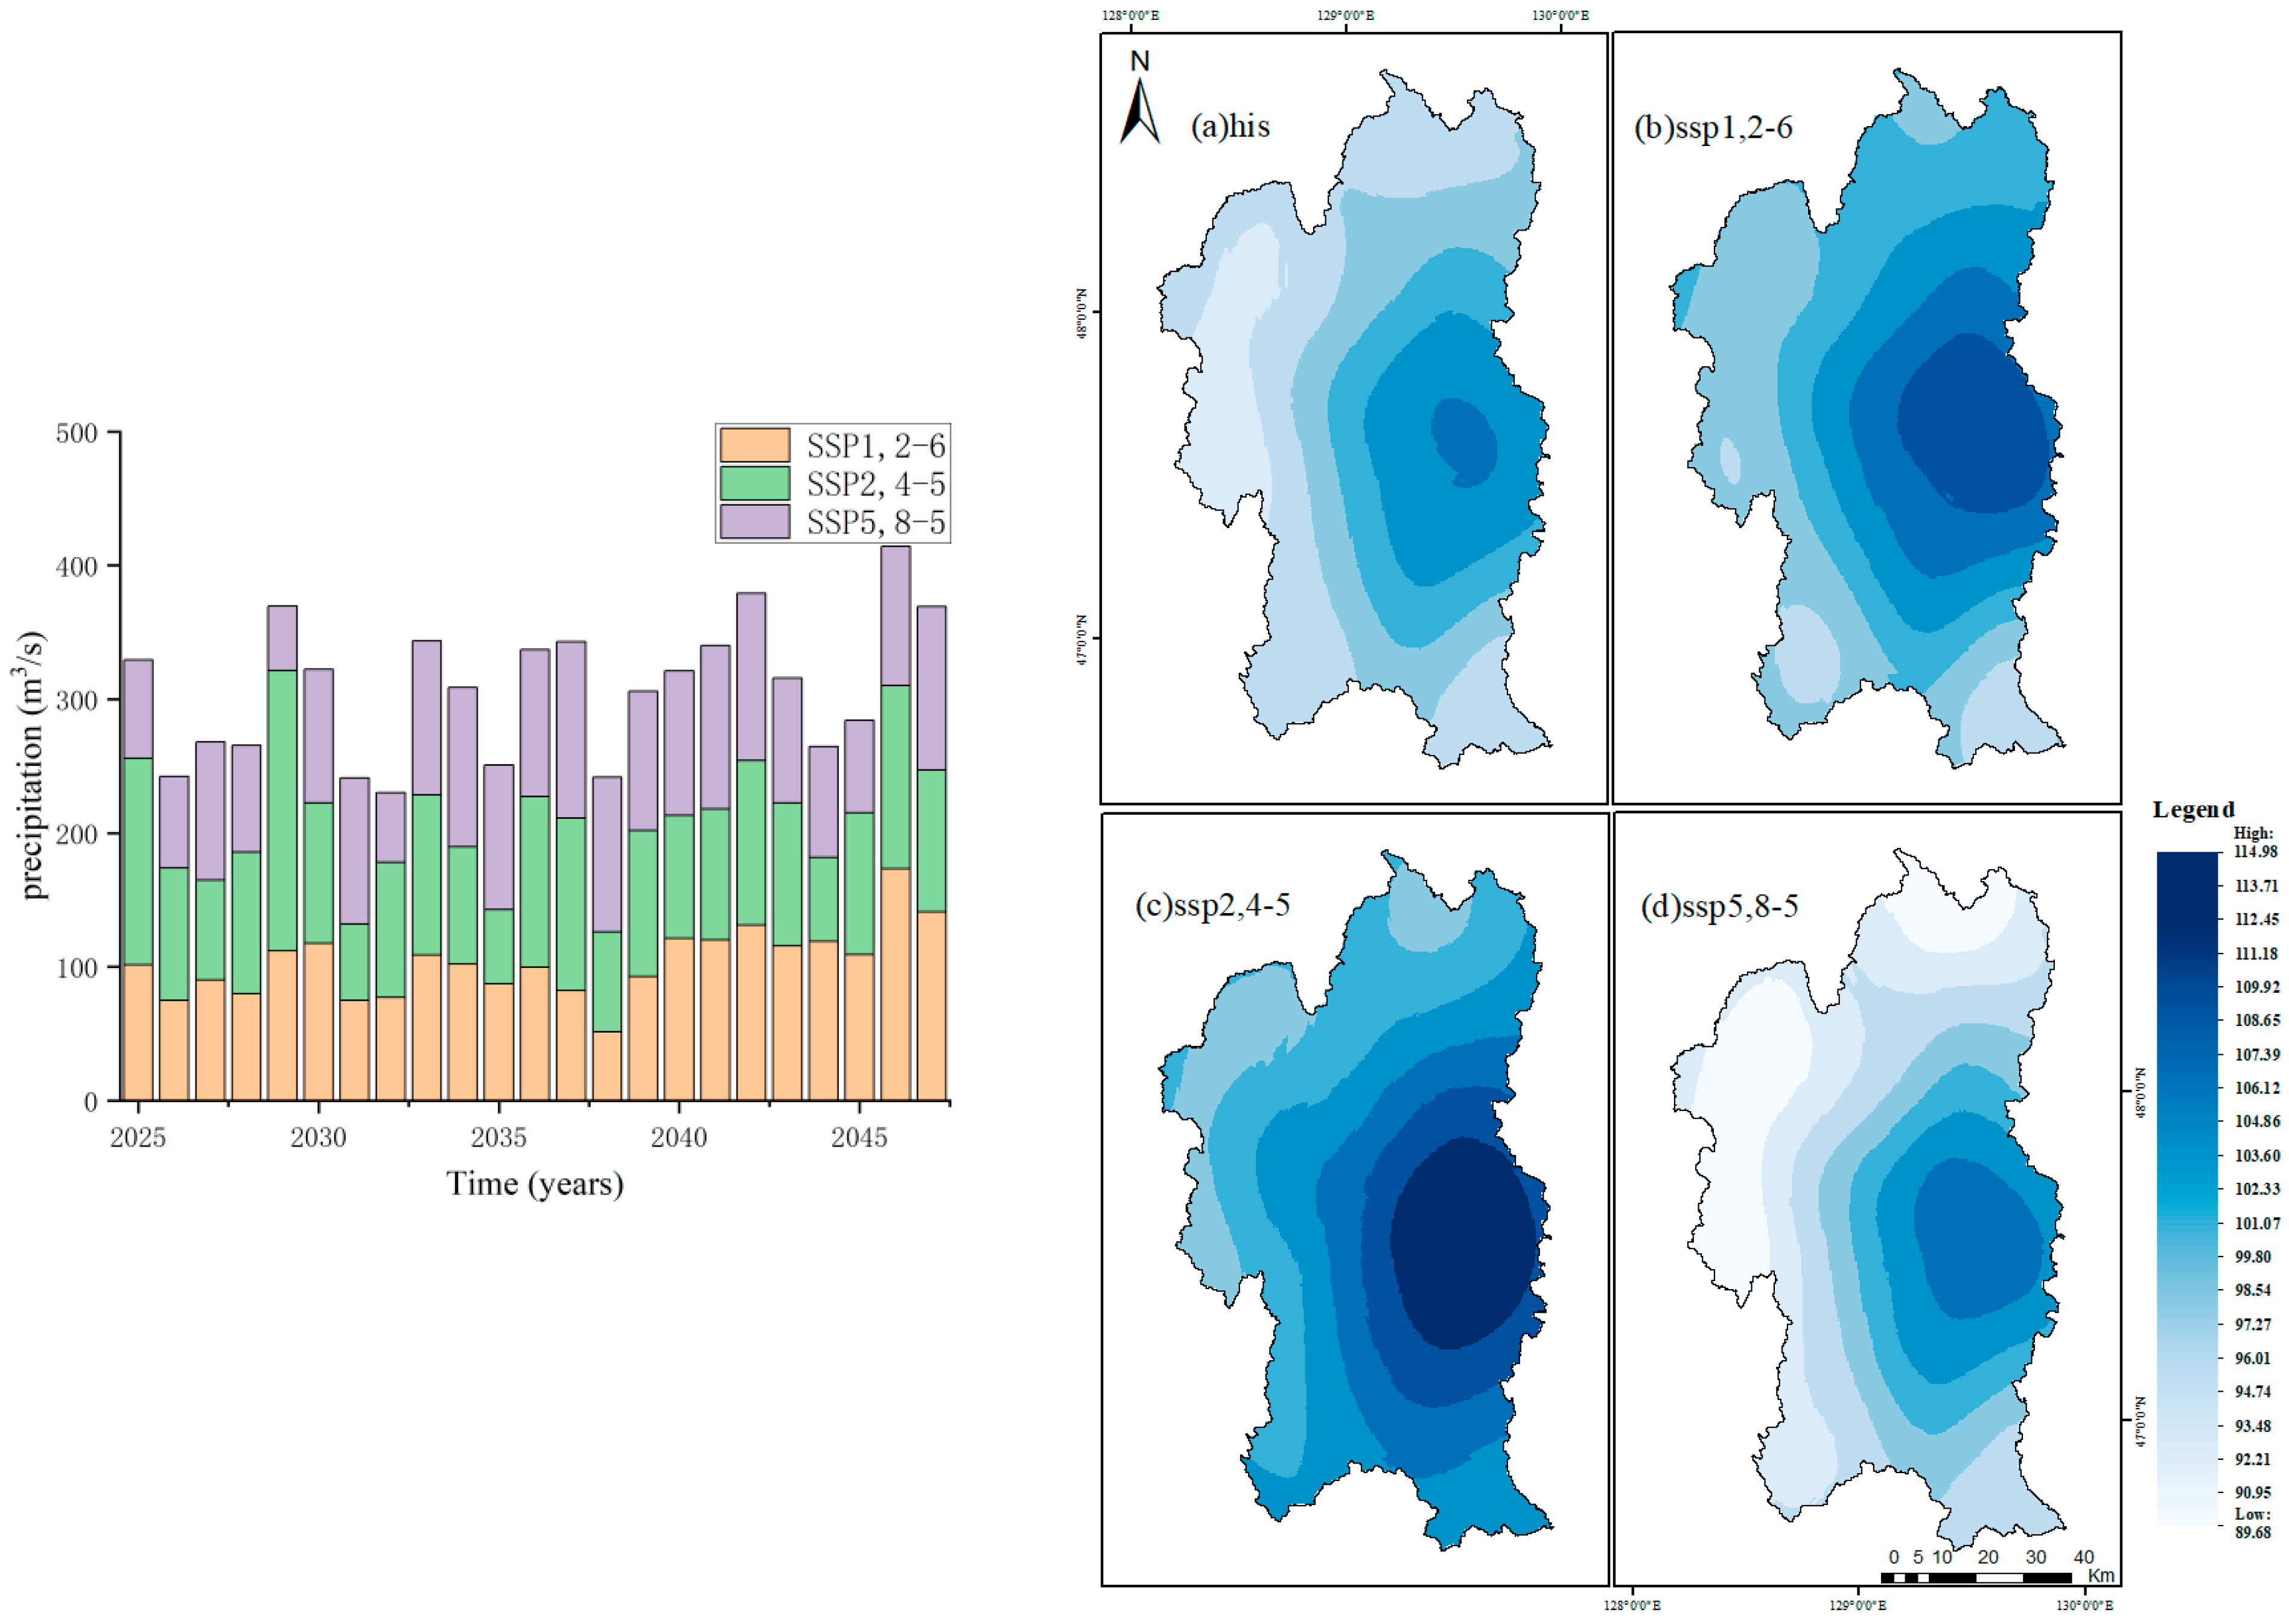
The future climate model used data from three forcing scenarios (SSP1,2-6, SSP2,4-5, and SSP5,8-5) to estimate changes in precipitation over the snowmelt runoff period from 2025 to 2047. The average multi-year precipitation for these three situations is 103.56 mm, 106.18 mm, and 98.41 mm, respectively, as Figure 6 illustrates. According to predictions, 2046 will have the most precipitation (173.21 mm, 136.91 mm, and 104.19 mm), while 2032 will have the least (77.11 mm, 100.98 mm, and 52.03 mm, respectively). In comparison to the 99.74 mm of precipitation recorded between 1980 and 2014, future precipitation is expected to increase by 3.83%, 6.46%, and −1.33%, respectively. This suggests that average annual precipitation will remain relatively constant, but total precipitation is expected to surpass historical levels, particularly in the case of the SSP2-4.5 scenario. Using the Kriging interpolation method, the spatial distribution of precipitation in the Tangwang River Basin during the snowmelt runoff season is displayed. According to the regional precipitation characteristics, it demonstrates that the average annual precipitation is higher in the east and decreases in all directions. The variations in yearly precipitation across the various scenario models are negligible, and they are all in line with the northeastern region’s precipitation pattern and can accurately replicate the volume of runoff during the snowmelt runoff period.

3.1.2. Changes in Daily Precipitation during Snowmelt Runoff Periods

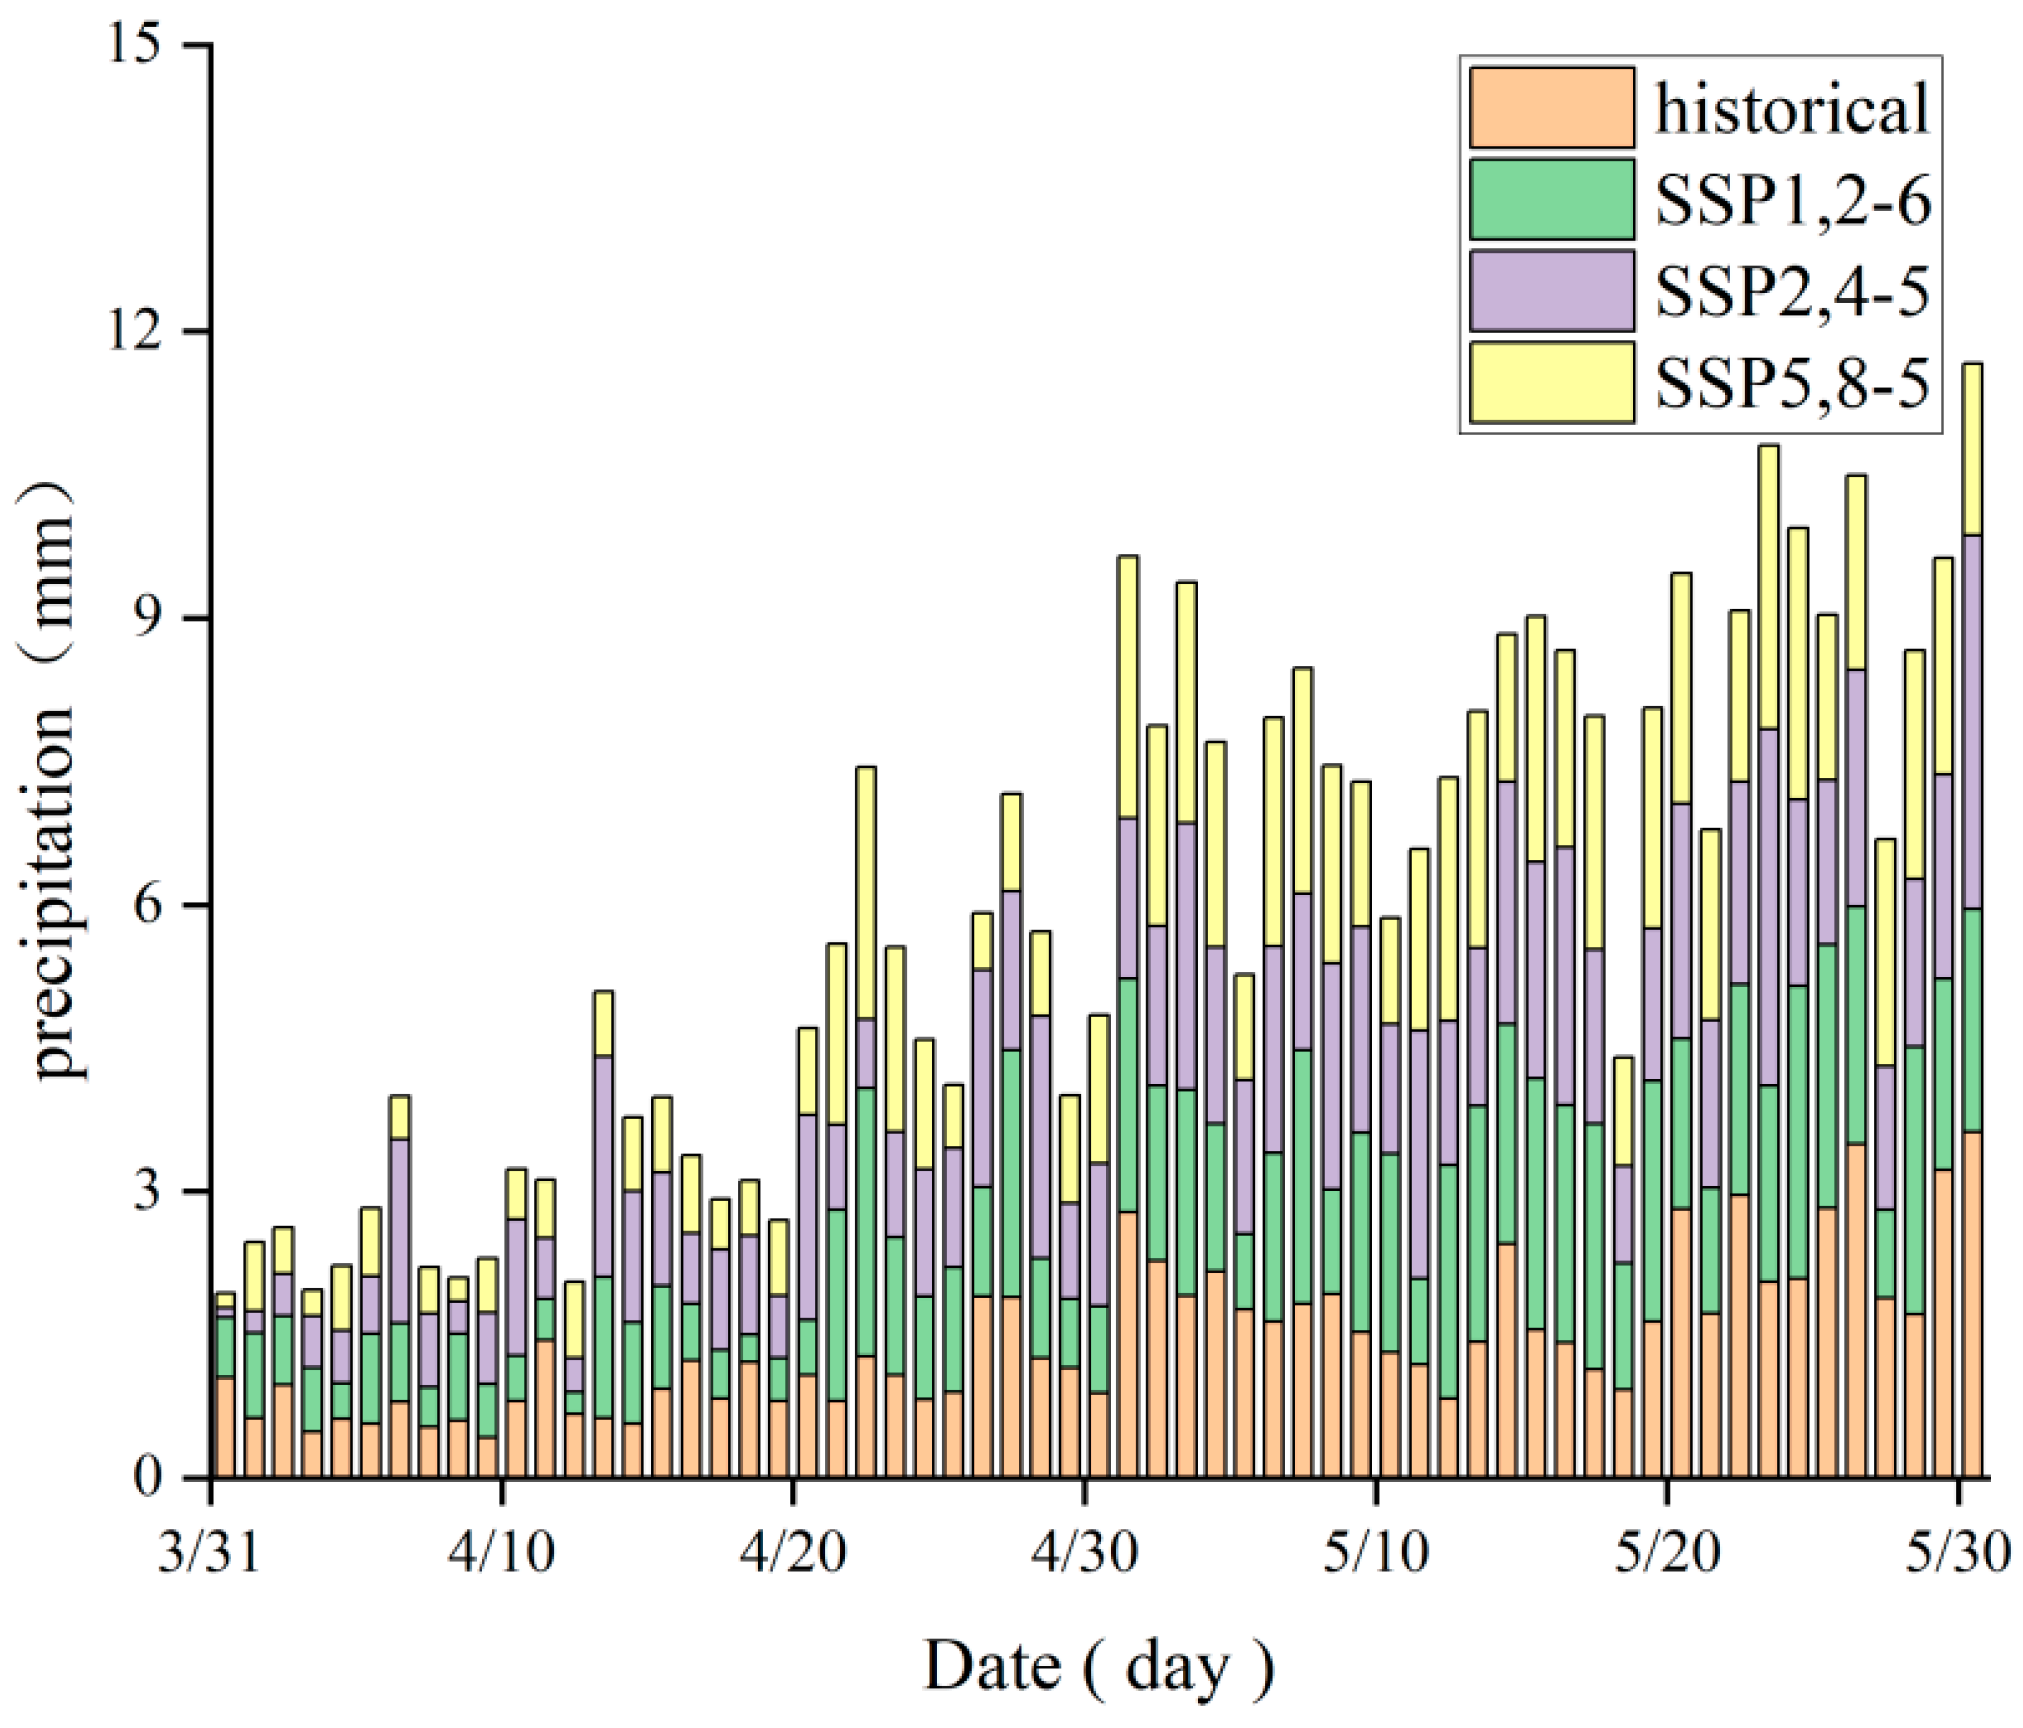
The daily precipitation during snowmelt runoff period is shown in Figure 7. The amount of precipitation each day under historical conditions peaked on 31 May at 3.62 mm. The highest precipitation of 3.91 mm on 31 May, 8% higher than historical levels, was recorded by the SSP2-4.5 scenario; the SSP5-8.5 scenario recorded daily precipitation of 2.97 mm on 24 May, an increase of 17.96%; and the SSP1-2.6 scenario recorded daily precipitation of 3.06 mm on 25 May, 15.5% lower than historical levels. The minimal precipitation under the SSP scenario was 0.23 mm, 0.1 mm, and 0.15 mm on 13 April, 11 April, and 1 April, respectively, all of which were below historical values. The historical minimum daily precipitation was 0.42 mm on 10 April. In the historical climate, the multi-year average daily precipitation is 1.46 mm; in the three scenarios, it is 1.49 mm, 1.57 mm, and 1.47 mm. Under scenarios SSP1-2.6, SSP2-4.5, and SSP5-8.5, the multi-year average daily precipitation is expected to increase by 2%, 7.5%, and 0.7% during future snowmelt runoff periods, respectively. A significant rise in average daily precipitation from the historical base period is depicted in Scenario SSP2-4.5, and this increase may be linked to future warming and growing carbon emissions.

3.2. Temperature Changes under Future Scenarios

3.2.1. Annual Temperature Changes during Snowmelt Runoff Periods

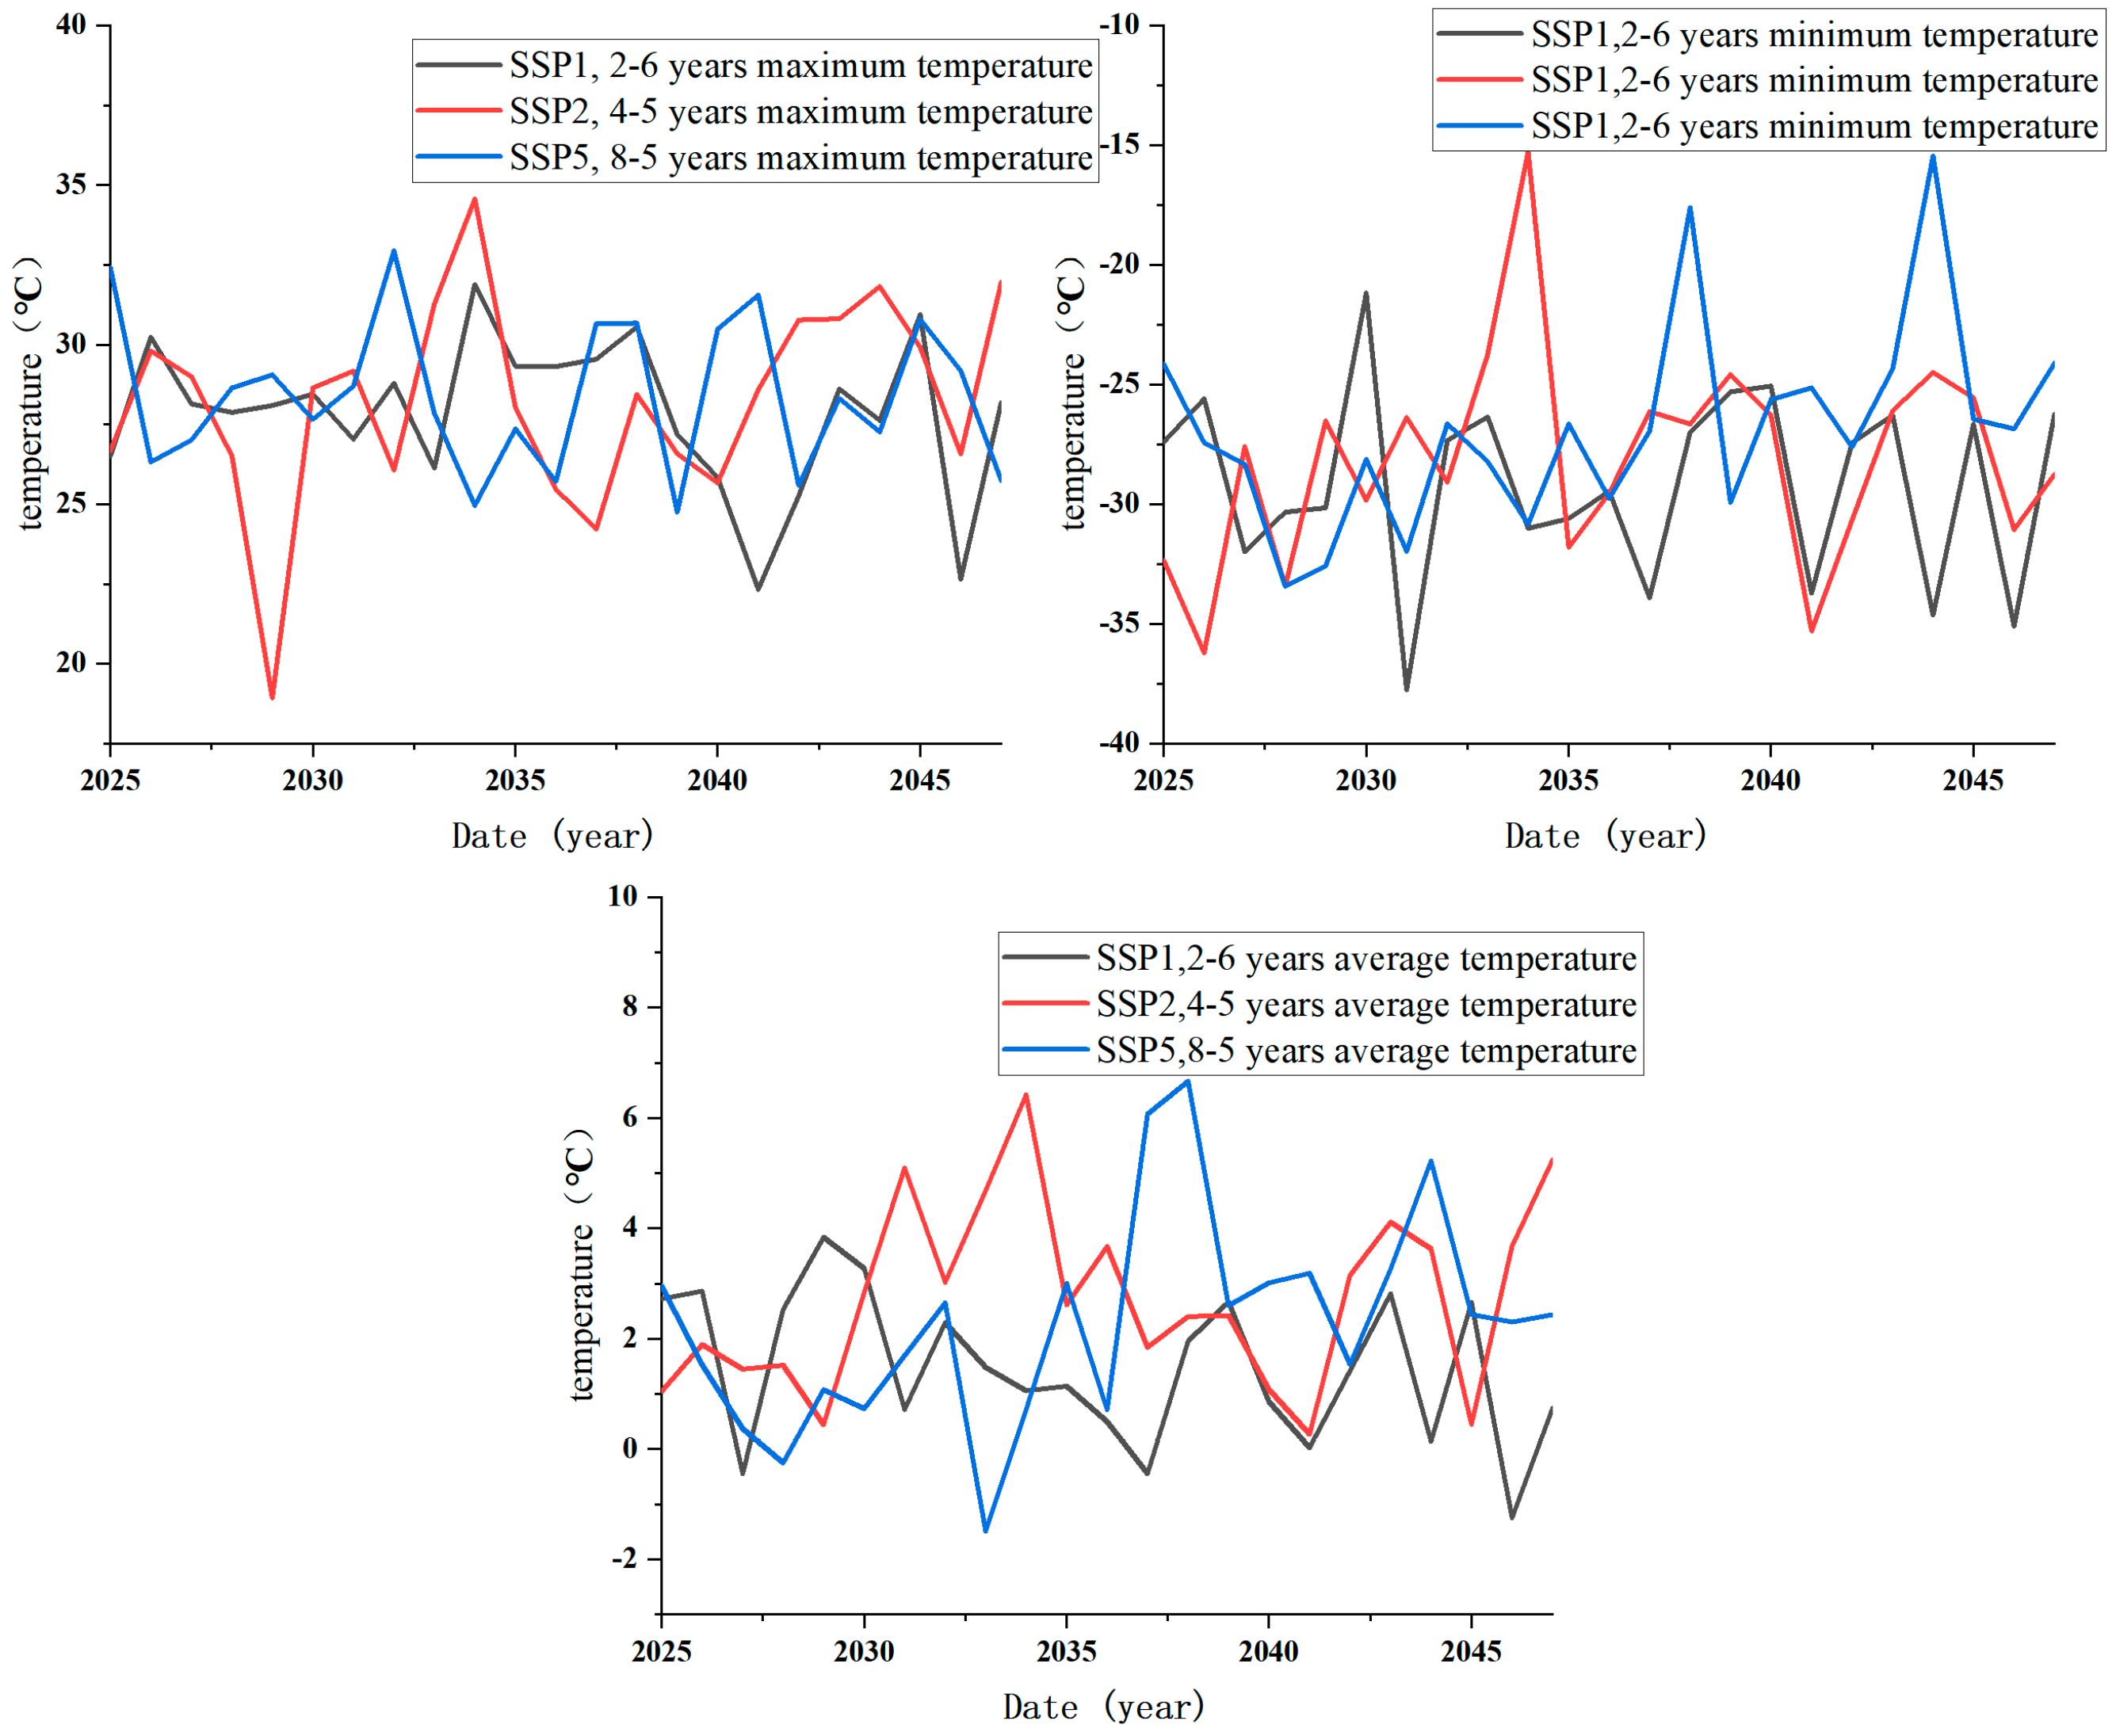
Temperature variations during the snowmelt runoff period from 2025 to 2047 can be predicted using the data from the Future Climate Model’s three forcing scenarios. As can be seen in Figure 8, the multi-year averages of the basin’s maximum temperatures over this period are generally high, ranging from 27.85 °C to 28.24 °C to 28.42 °C. The hottest years, with maximum temperatures of 31.89 °C, 34.57 °C, and 32.95 °C, respectively, all occur in 2034. The multi-year averages of the minimum temperatures were −29.15 °C, −28.14 °C, and −26.88 °C. The lowest minimum temperatures were recorded in 2031, 2026, and 2028, with minimum temperatures of −37.36 °C, −36.21 °C, and −33.42 °C, respectively. The average temperature for a period of years was 2.74 °C, 2.28 °C, and 1.46 °C. Values of 3.83 °C in 2029, 6.42 °C in 2034, and 6.67 °C in 2038 were the highest average years and temperatures, respectively; −11.6 °C in 2038, −9 °C in 2025, and −13.95 °C in 2033 were the lowest average years and temperatures. The future snowmelt runoff period is characterized by an overall increase in temperature compared to the average temperatures of 1980–2014 (27.31 °C/−31.2 °C/0.81 °C), with the SSP5-8.5 scenario exhibiting the most warming and the SSP1-2.6 scenario the least.
The mean annual maximum, minimum, and average air temperatures in the Tangwang River Basin during the snowmelt runoff period for the historical base period and the three future climatic scenarios are shown in the following Figure 9, which also shows the temporal and spatial variability of these values. Southeast is where the majority of the watershed’s maximum temperatures are found, with the SSP2-4.5 scenario having the highest high-temperature values. With the lowest low-temperature values in the SSP5-8.5 scenario, minimum temperatures are primarily found at the basin’s edge, with the northwest and northeast of the basin experiencing very low temperatures. The east had lower mean temperatures while all directions saw rising temperatures.

3.2.2. Daily Temperature Changes during Snowmelt Runoff

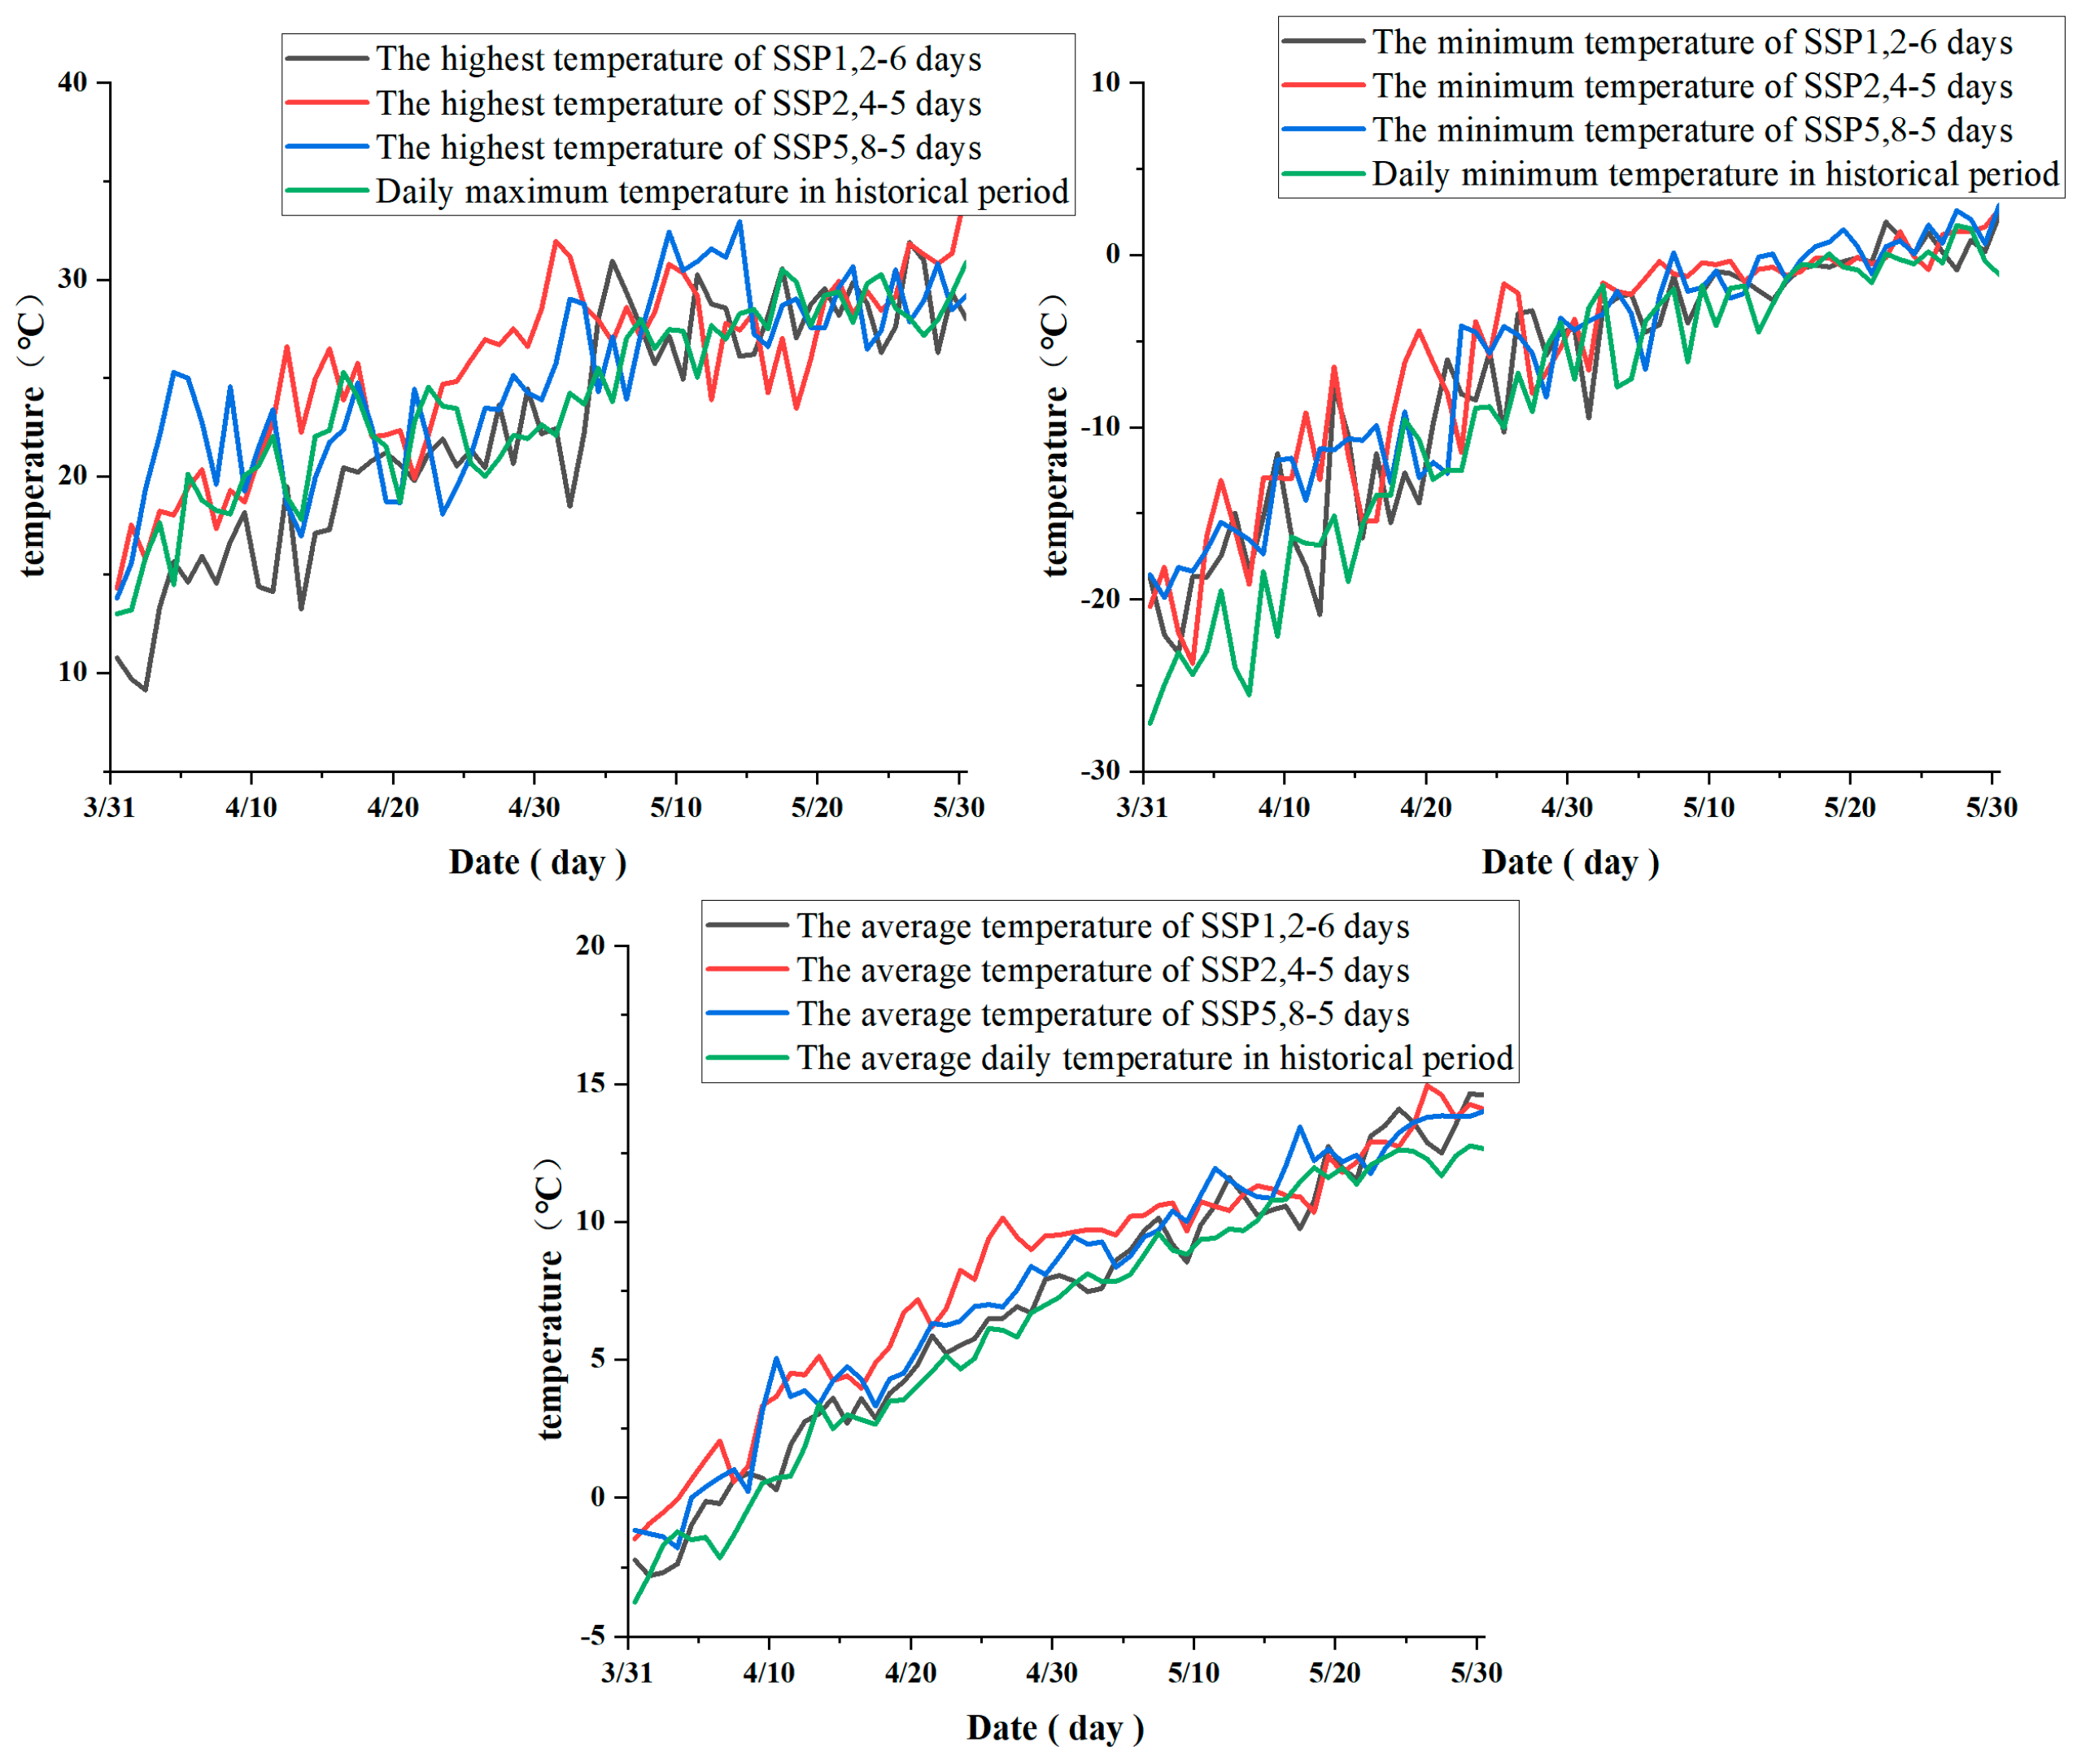
The daily temperature variation during snowmelt runoff is shown in Figure 10. Based on the previous section, it was concluded that the snowmelt runoff season in the Tangwang River Basin occurs annually from April to May. The multi-year average daily temperature variations during the snowmelt runoff period under the historical base period and the future climate model were plotted using the daily climatic data of the three forcing scenarios under the future climate model (Figure 10). The findings indicate that for both the historical era and the future climate scenarios, there is a rising tendency in temperatures during the snowmelt runoff period.
According to historical records, the Tangwang River Basin’s maximum temperature maxima during the snowmelt runoff period was 31 May (30.88 °C), while 3 April (13.05 °C) was the lowest; 1 April (−27.2 °C) was the lowest and 28 May (1.72 °C) was the highest. The maximum temperature under the SSP1-2.6 scenario is as high as 31.89 °C on 27 May and as low as 9.15 °C on 3 April. The minimum temperature under the SSP1-2.6 scenario is as low as −23.11 °C on 3 April and as high as 2.3 °C on 31 May. The maximum temperature under the SSP2-4.5 scenario is as high as 34.57 °C on 31 May and as low as 14.32 °C on 1 April. The minimum temperature under the SSP2-4.5 scenario is as low as −23.72 °C on 4 April and as high as 2.67 °C on 31 May. In the SSP5-8.5 scenario, the maximum temperature reached an extreme value of 32.94 °C on 15 May and the minimum temperature reached an extreme value of 13.83 °C on 1 April. The minimum temperature reached an extreme value of −19.89 °C on 2 April and the extreme value reached 2.89 °C on 31 May. For all cases, the average, minimum, and maximum temperatures, while the extreme values typically happen in early April, they typically happen in late May. The rising trend in Northeastern temperatures was reflected in the SSP2-4.5 and SSP5-8.5 scenarios, where temperatures were regularly higher during the snowmelt runoff than during the historical period.

3.3. Land Use Change Analysis

Land use data for 2020–2050 under the future scenarios provided by Zhang [50] were used with a resolution of 1 km, including three future scenarios (SSP1,2-6, SSP2,4-5, and SSP5,8-5), WETL was merged into BARR, and URLD and UIDU were merged into URHD. The area and distribution of different land use types within the Tangwang River Basin were quantitatively analyzed using ArcGIS (Table 4). The findings indicated that there had not been a significant alteration in the watershed’s land use. With about 94% of the total area, forest land dominates the Tangwang River Basin land type hierarchy. The future land use change of Tangwang River Basin is shown in Figure 11.When examining various future eras and scenarios, it can be observed that, in the SSP1,2-6 scenario, the overall share of cropland stays constant, with only a greater percentage shifting to woodland in 2050. In the SSP2,4-5 and SSP1,2-6 scenarios, woodland increases or stays the same in 2030 and 2050, and decreases slightly in the SSP5,8-5 scenario. The Tangwang River Basin’s concentration on forestry conservation and planting, which includes initiatives such as enhanced afforestation, greater forest cover, and better forest management, is responsible for these developments.
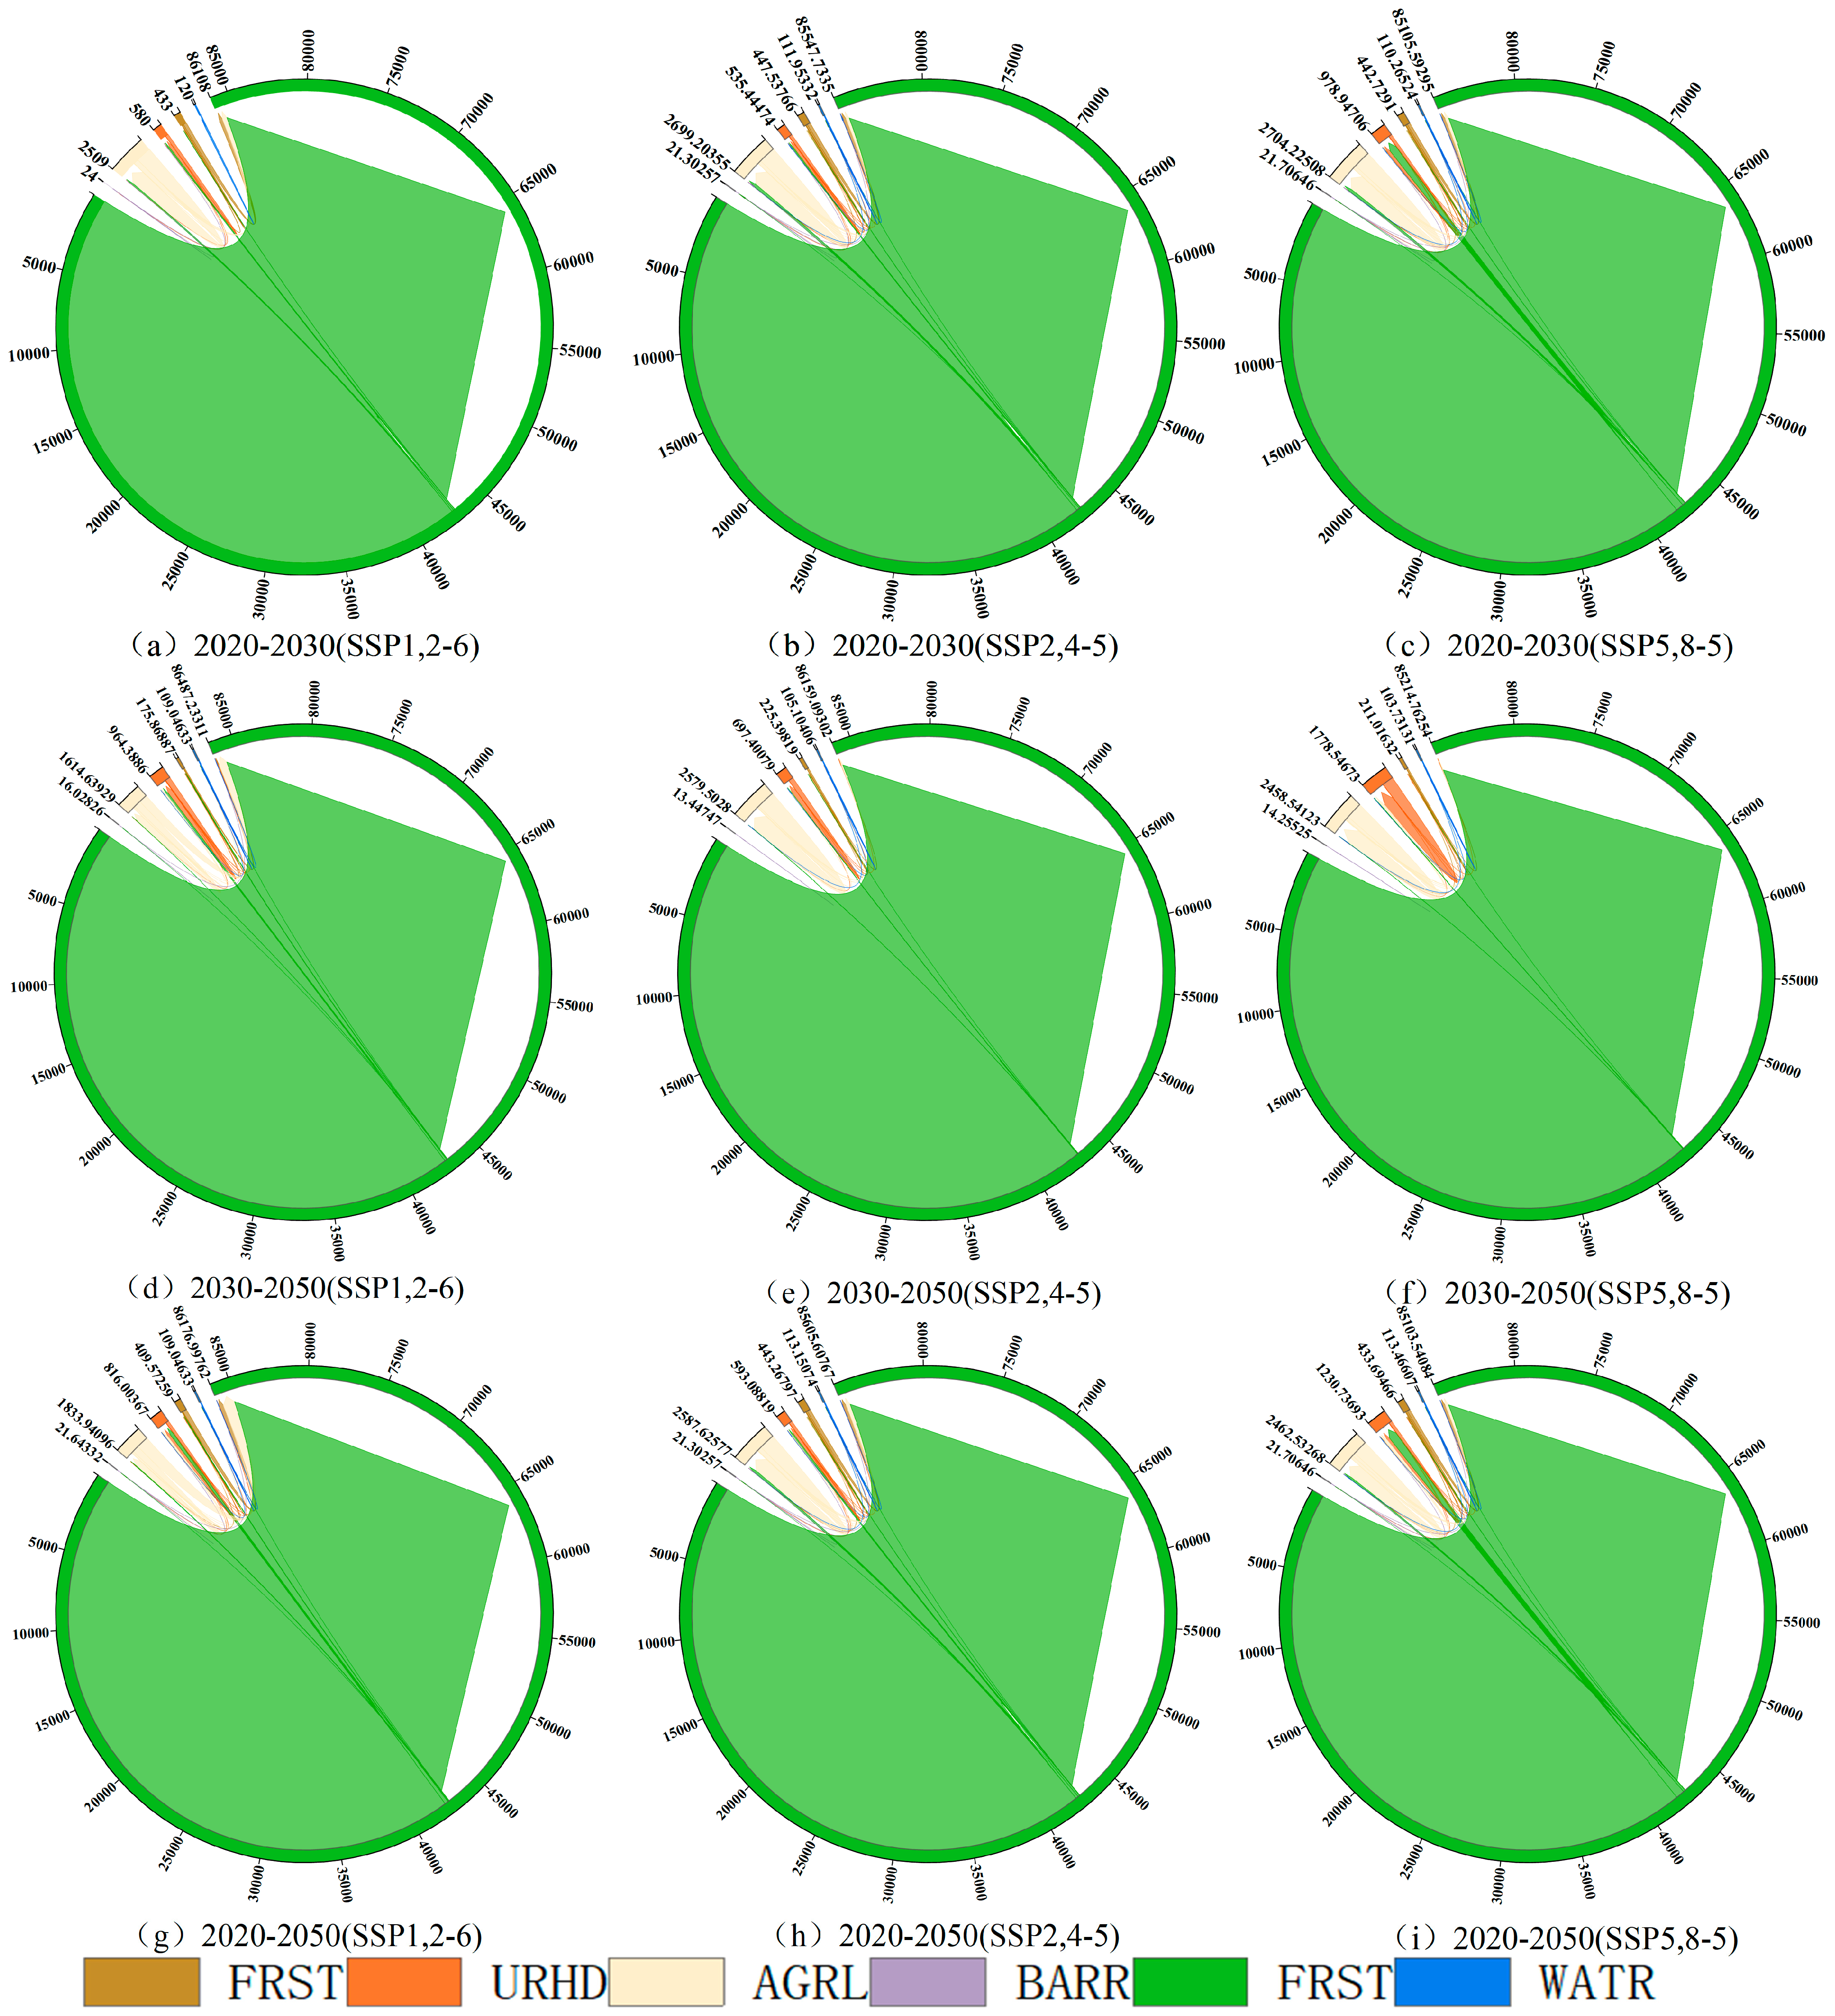
Through the land transfer matrix, we have analyzed the land use changes in the Tangwang River Basin in detail, revealing the scale and direction of the conversion between different land types. Together, Figure 12 and Table 5 show the outcomes of the visualization of land use patterns when combined with visualizable chordal diagrams. It is evident that the SSP1,2-6 scenarios show the most extreme land use change between 2020 and 2050, after which it tends to level off, with arable land decreasing by 37.56 km2, forest land increasing by 266.77 km2, grassland decreasing by 105.93 km2, and urban land increasing by 199.9 km2 over the course of 30 years. The majority of the conversion of arable land and grassland to woodland occurs over this time, with 797.5 km2 of arable land and 797.5 km2 of forest area converted, respectively. The majority of cultivated land and grassland—797.5 km2 and 269.2 km2, respectively—was turned into forest land. Tangwanghe’s land use has changed overall, primarily becoming forest land with more noticeable alterations.

3.4. Sensitivity Analysis of SWAT Model Parameters

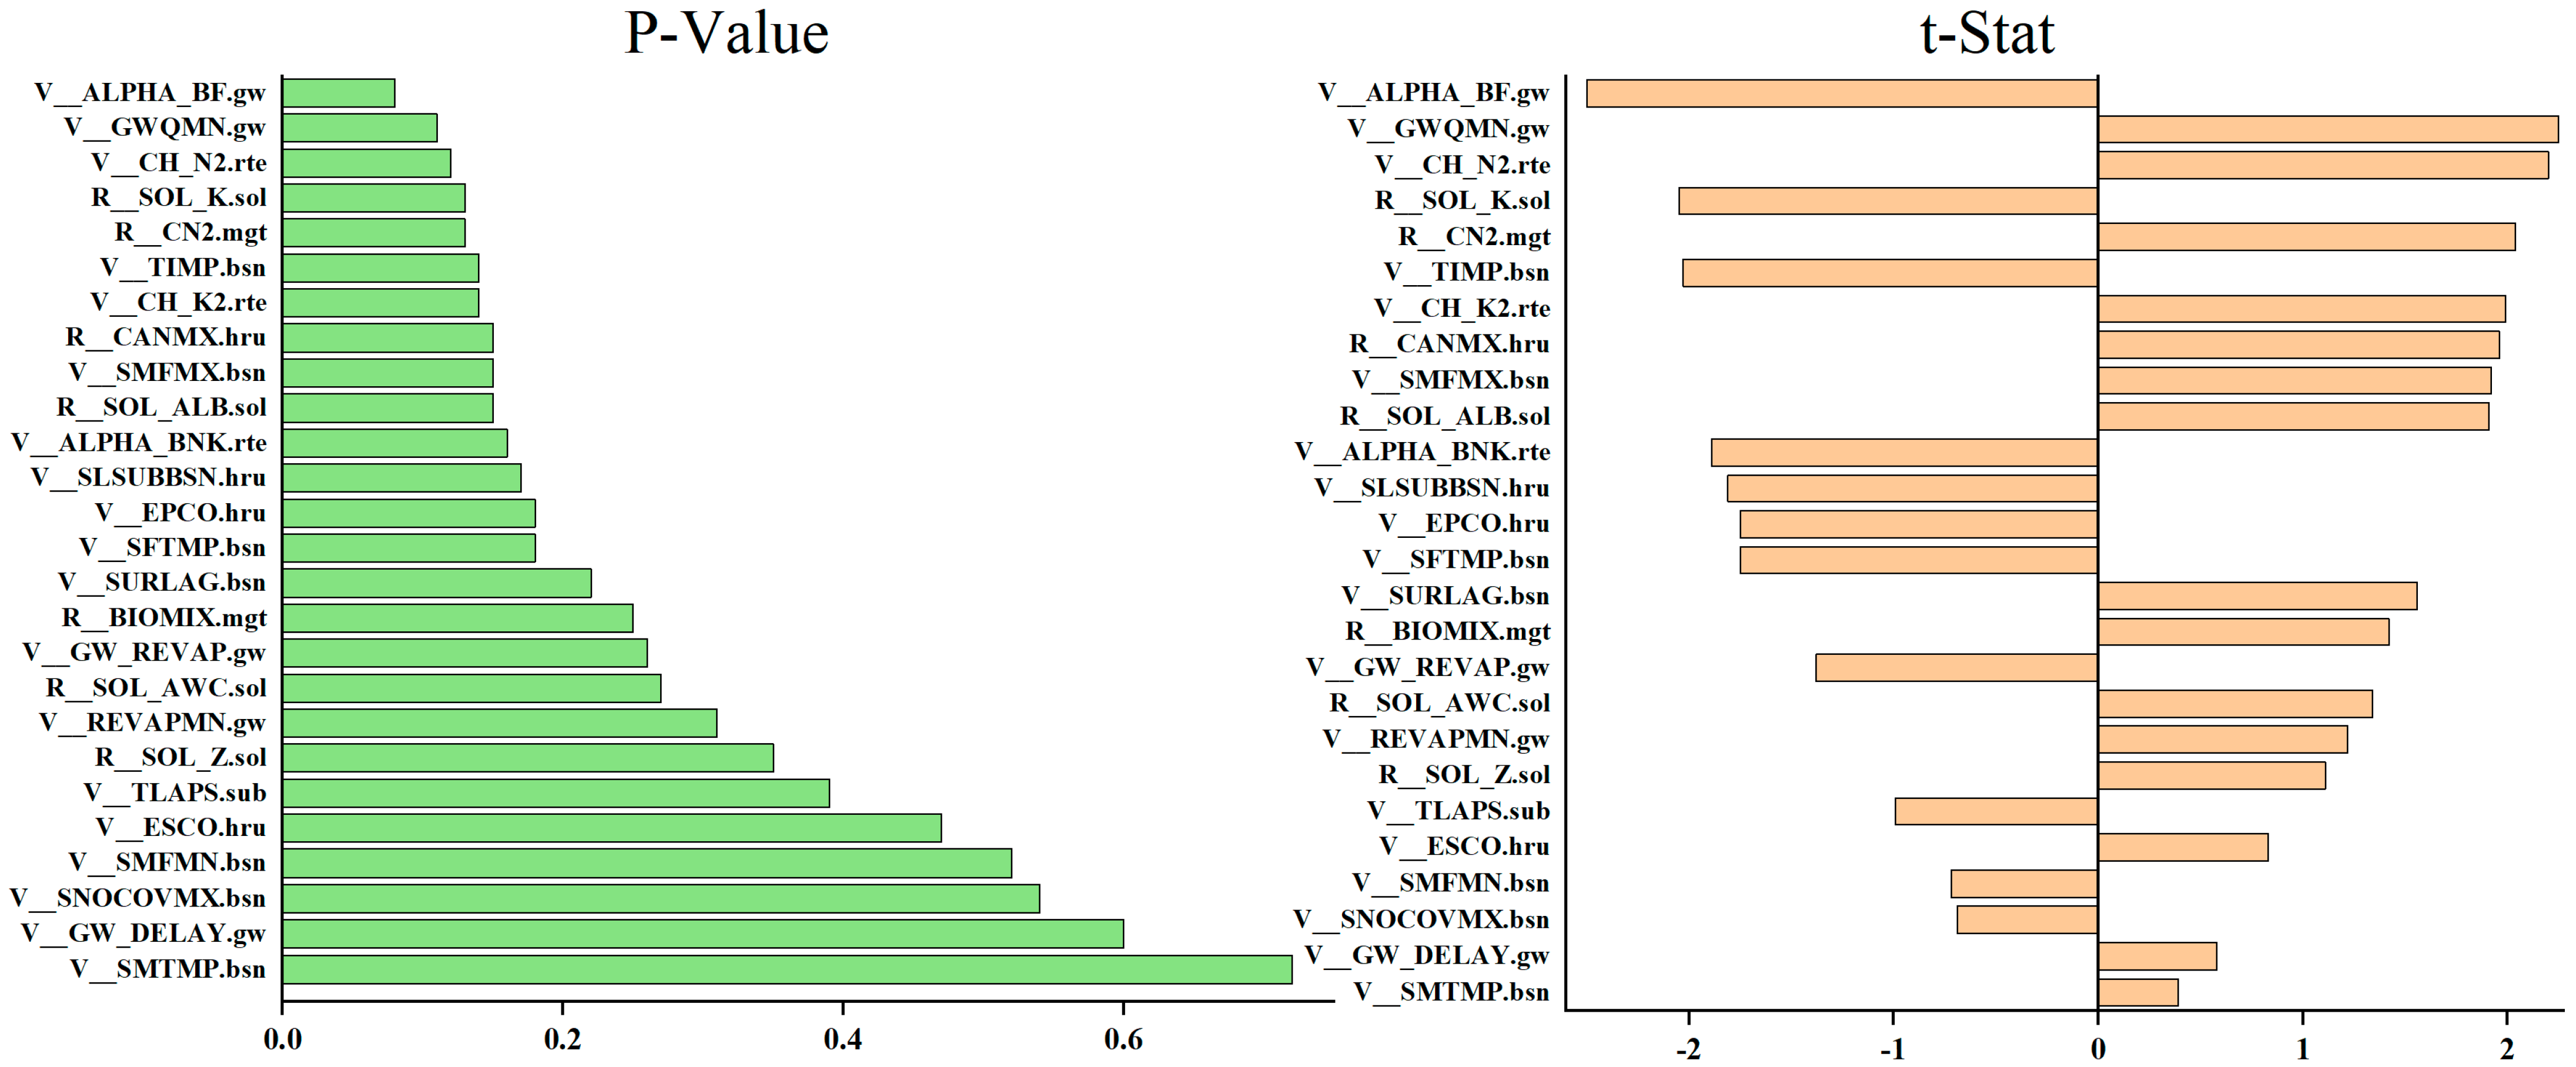
Daily runoff simulations for the Tangwang River Basin for the years 2001–2022 were carried out using the well-established SWAT model, with 1999 and 2000 serving as warm-up periods. Comparative analysis was used to identify 26 sensitive parameters, and multiple regression techniques were used for sensitivity analysis to evaluate parameter sensitivity based on t-stat and P-value values. The sensitivity is increasingly important the closer the P-value is to 0. The baseflow recession coefficient ALPHA_BF, the shallow groundwater generating baseflow threshold depth GWQMN, and the SCS runoff curve CN2 variables are more sensitive and have a bigger impact on the runoff simulation in the Tangwang River basin, as can be seen in the Figure 13. Figure 13 shows the parameter sensitivity map. To maximize the simulation accuracy, the parameters were manually modified and the sensitive parameters were reinserted into the model for parameter modification and model rate setup. Table 6 presents the final outcomes of the model parameters.

3.5. SWAT Model Runoff Simulation

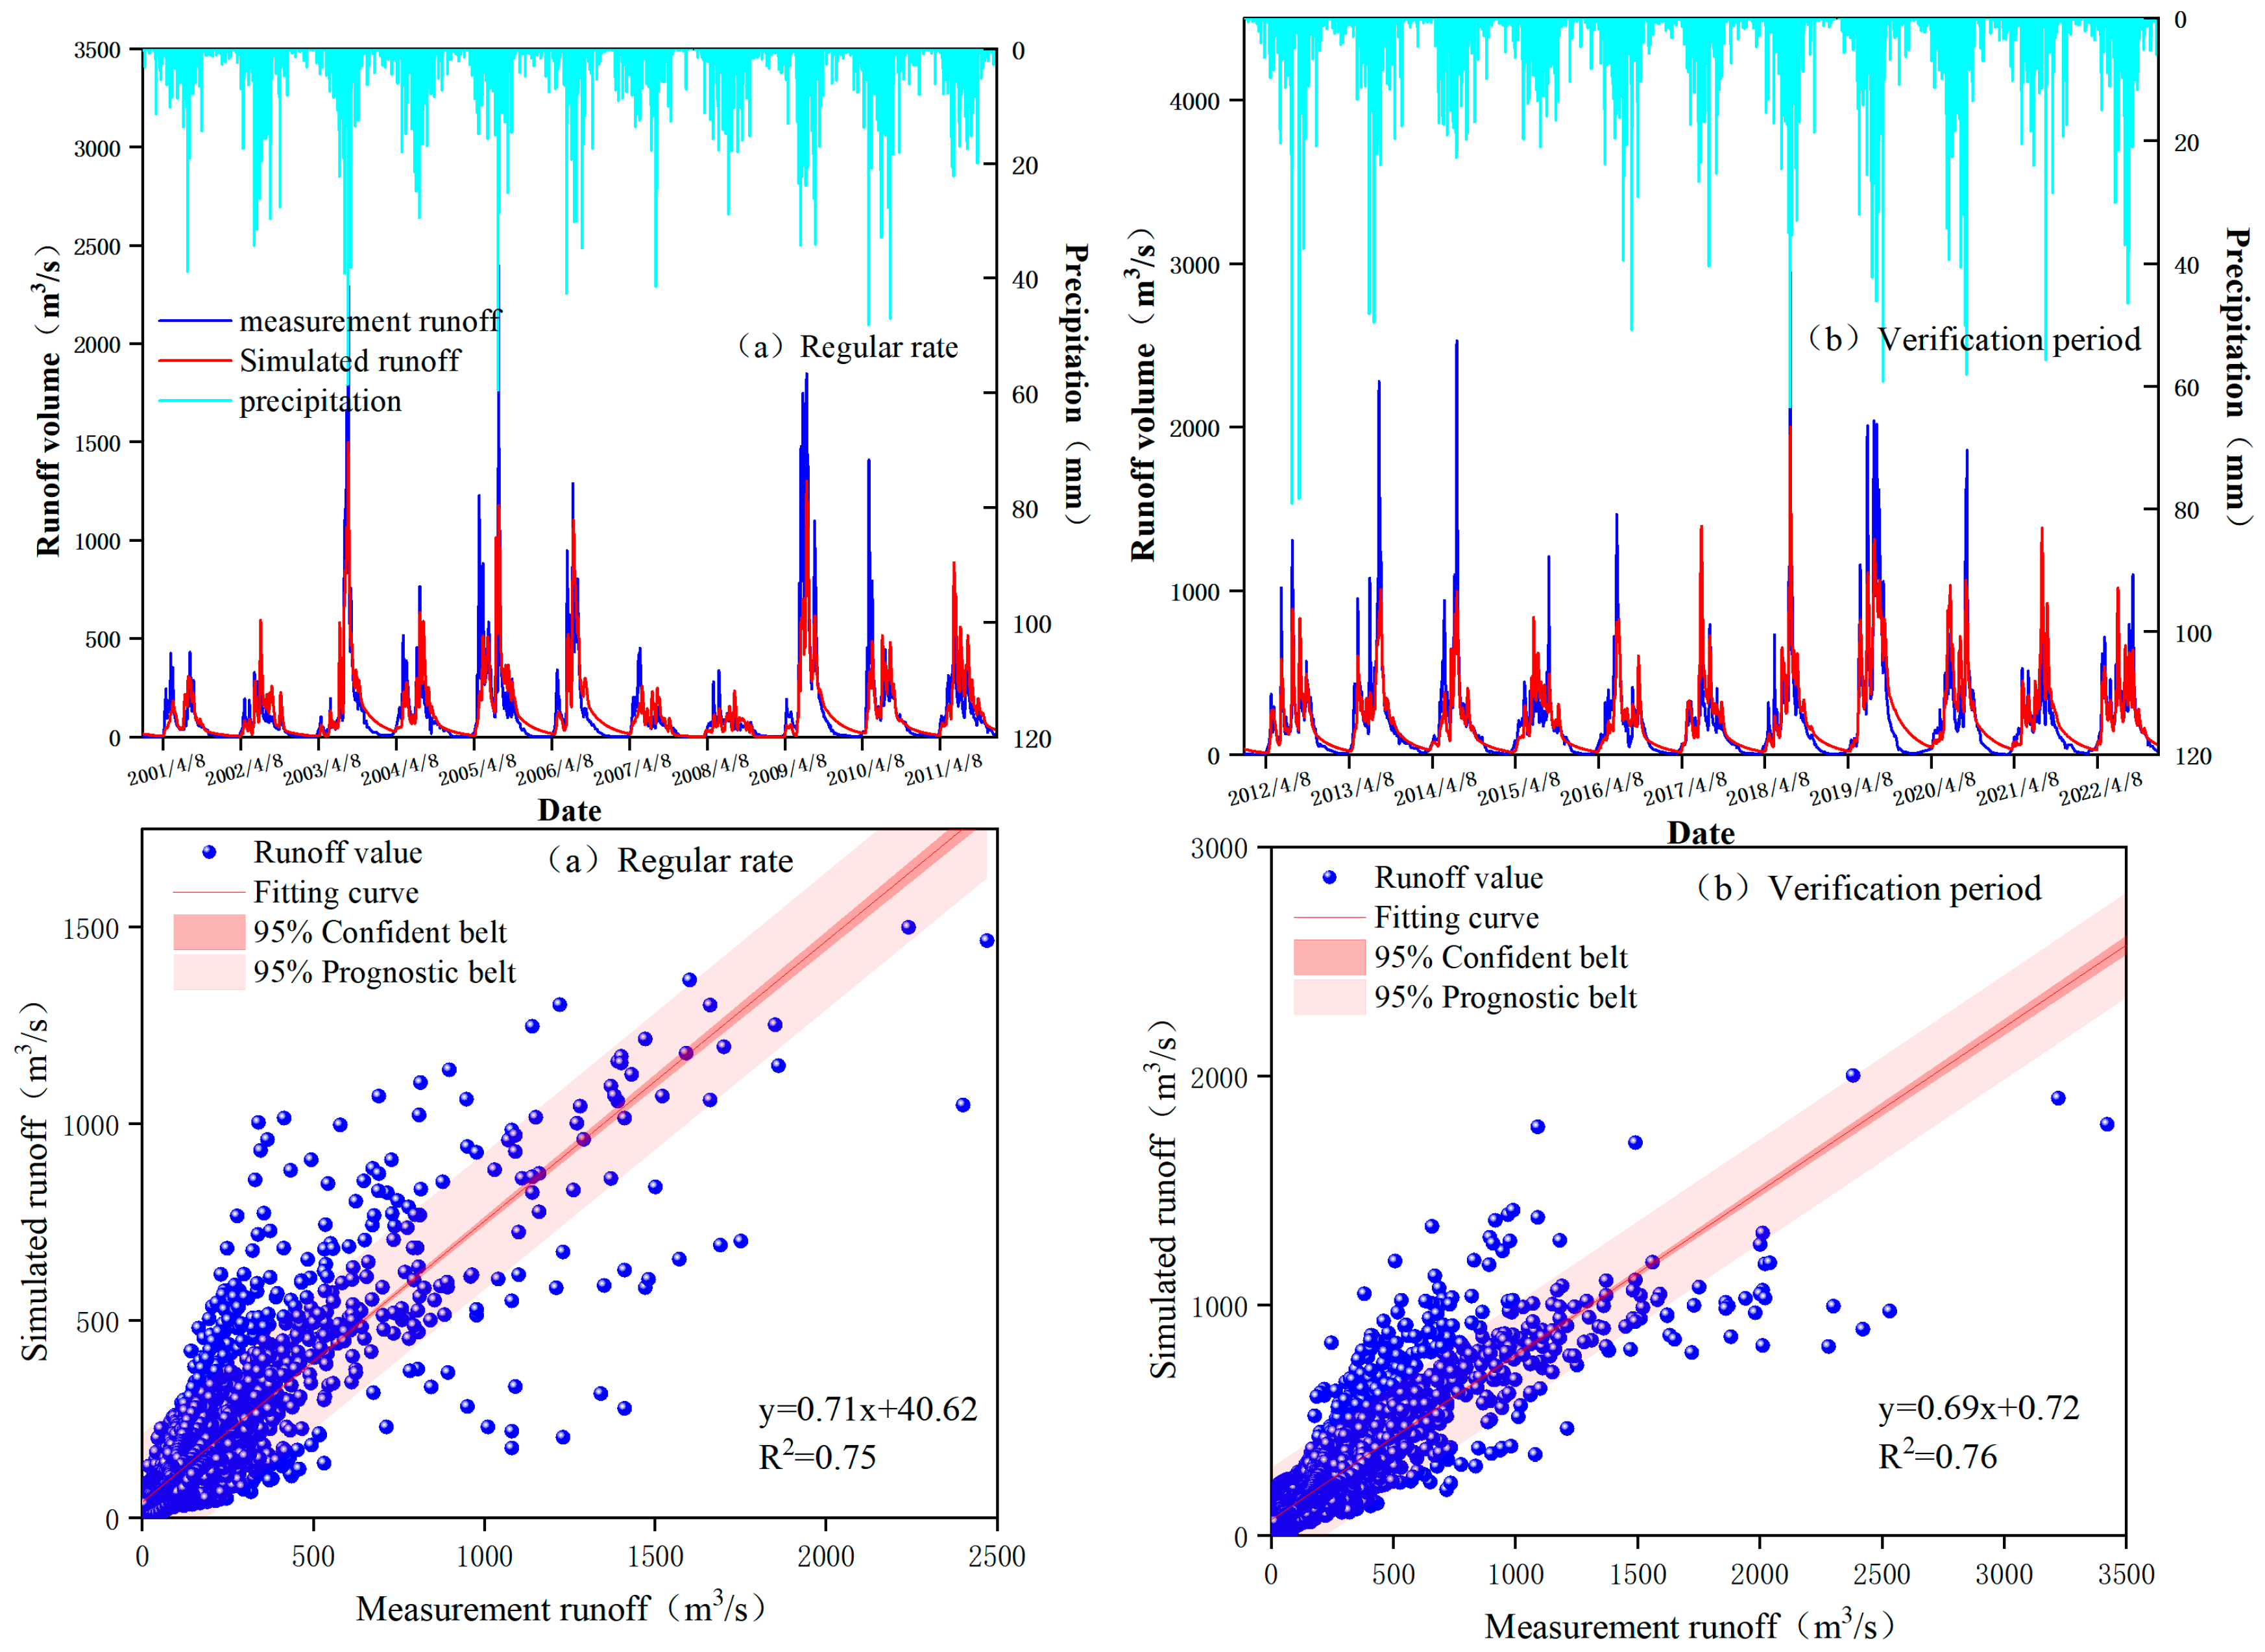
The SWAT-CUP(2012) software’s optimal parameter values were incorporated back into the SWAT model for parameter modification. The model was then rerun to simulate the daily average flow of the rate period (2001–2011) and the validation period (2012–2022), and the results were compared with the measured values to obtain accurate results for the Tangwang River Basin’s runoff simulation. The model produced high linearity and good agreement, with correlation coefficients of 0.75 and 0.76 and Nashability coefficients of 0.75, both within a reasonable range. The validation period and rate period’s correlation coefficients are 0.75 and 0.76, respectively, and the Nashability coefficients are 0.75. These values fall within a reasonable range and exhibit a strong linear relationship and a good degree of agreement, suggesting that the snowmelt runoff that the SWAT model simulates is successful. Figure 14 depicts the simulated process line with a linear relationship.
The snowmelt runoff period’s periodical simulated runoff is higher than the measured runoff, and the runoff in the validation period is not significantly different, indicating that the model may have overestimated the snowmelt runoff period in its early stages. However, with model optimization and adjustment, the model can accurately reflect the actual snowmelt runoff in the validation period. This can be seen in Figure 15, which displays the daily simulation results of the snowmelt runoff period in the basin year by year. This suggests that the snowmelt runoff at the start of the simulation period may have been overstated by the model. The complexity of snowmelt processes, including the simulation of the rate, infiltration of the snowmelt water, surface runoff, etc., may be the reason for the relative coefficients and Nash coefficients of the snowmelt runoff simulation being slightly lower than those of the total runoff simulation. The correlation coefficients of the validation and rate periods are 0.73 and 0.74, and the Nash coefficients are 0.7 and 0.68. Moreover, the simulation of runoff from melting snow is more intricate. Additionally, a number of variables, including temperature changes, solar radiation, the thickness of the snow layer, the amount of water in the snow, etc., may have an impact on the modeling of snowmelt runoff. However, the simulation findings are better and all fall within a tolerable range, suggesting that the parameters found in the SWAT snowmelt runoff parameters sensitivity study have a better effect on the model during simulation.

3.6. Future Runoff Changes

3.6.1. Annual Runoff Changes

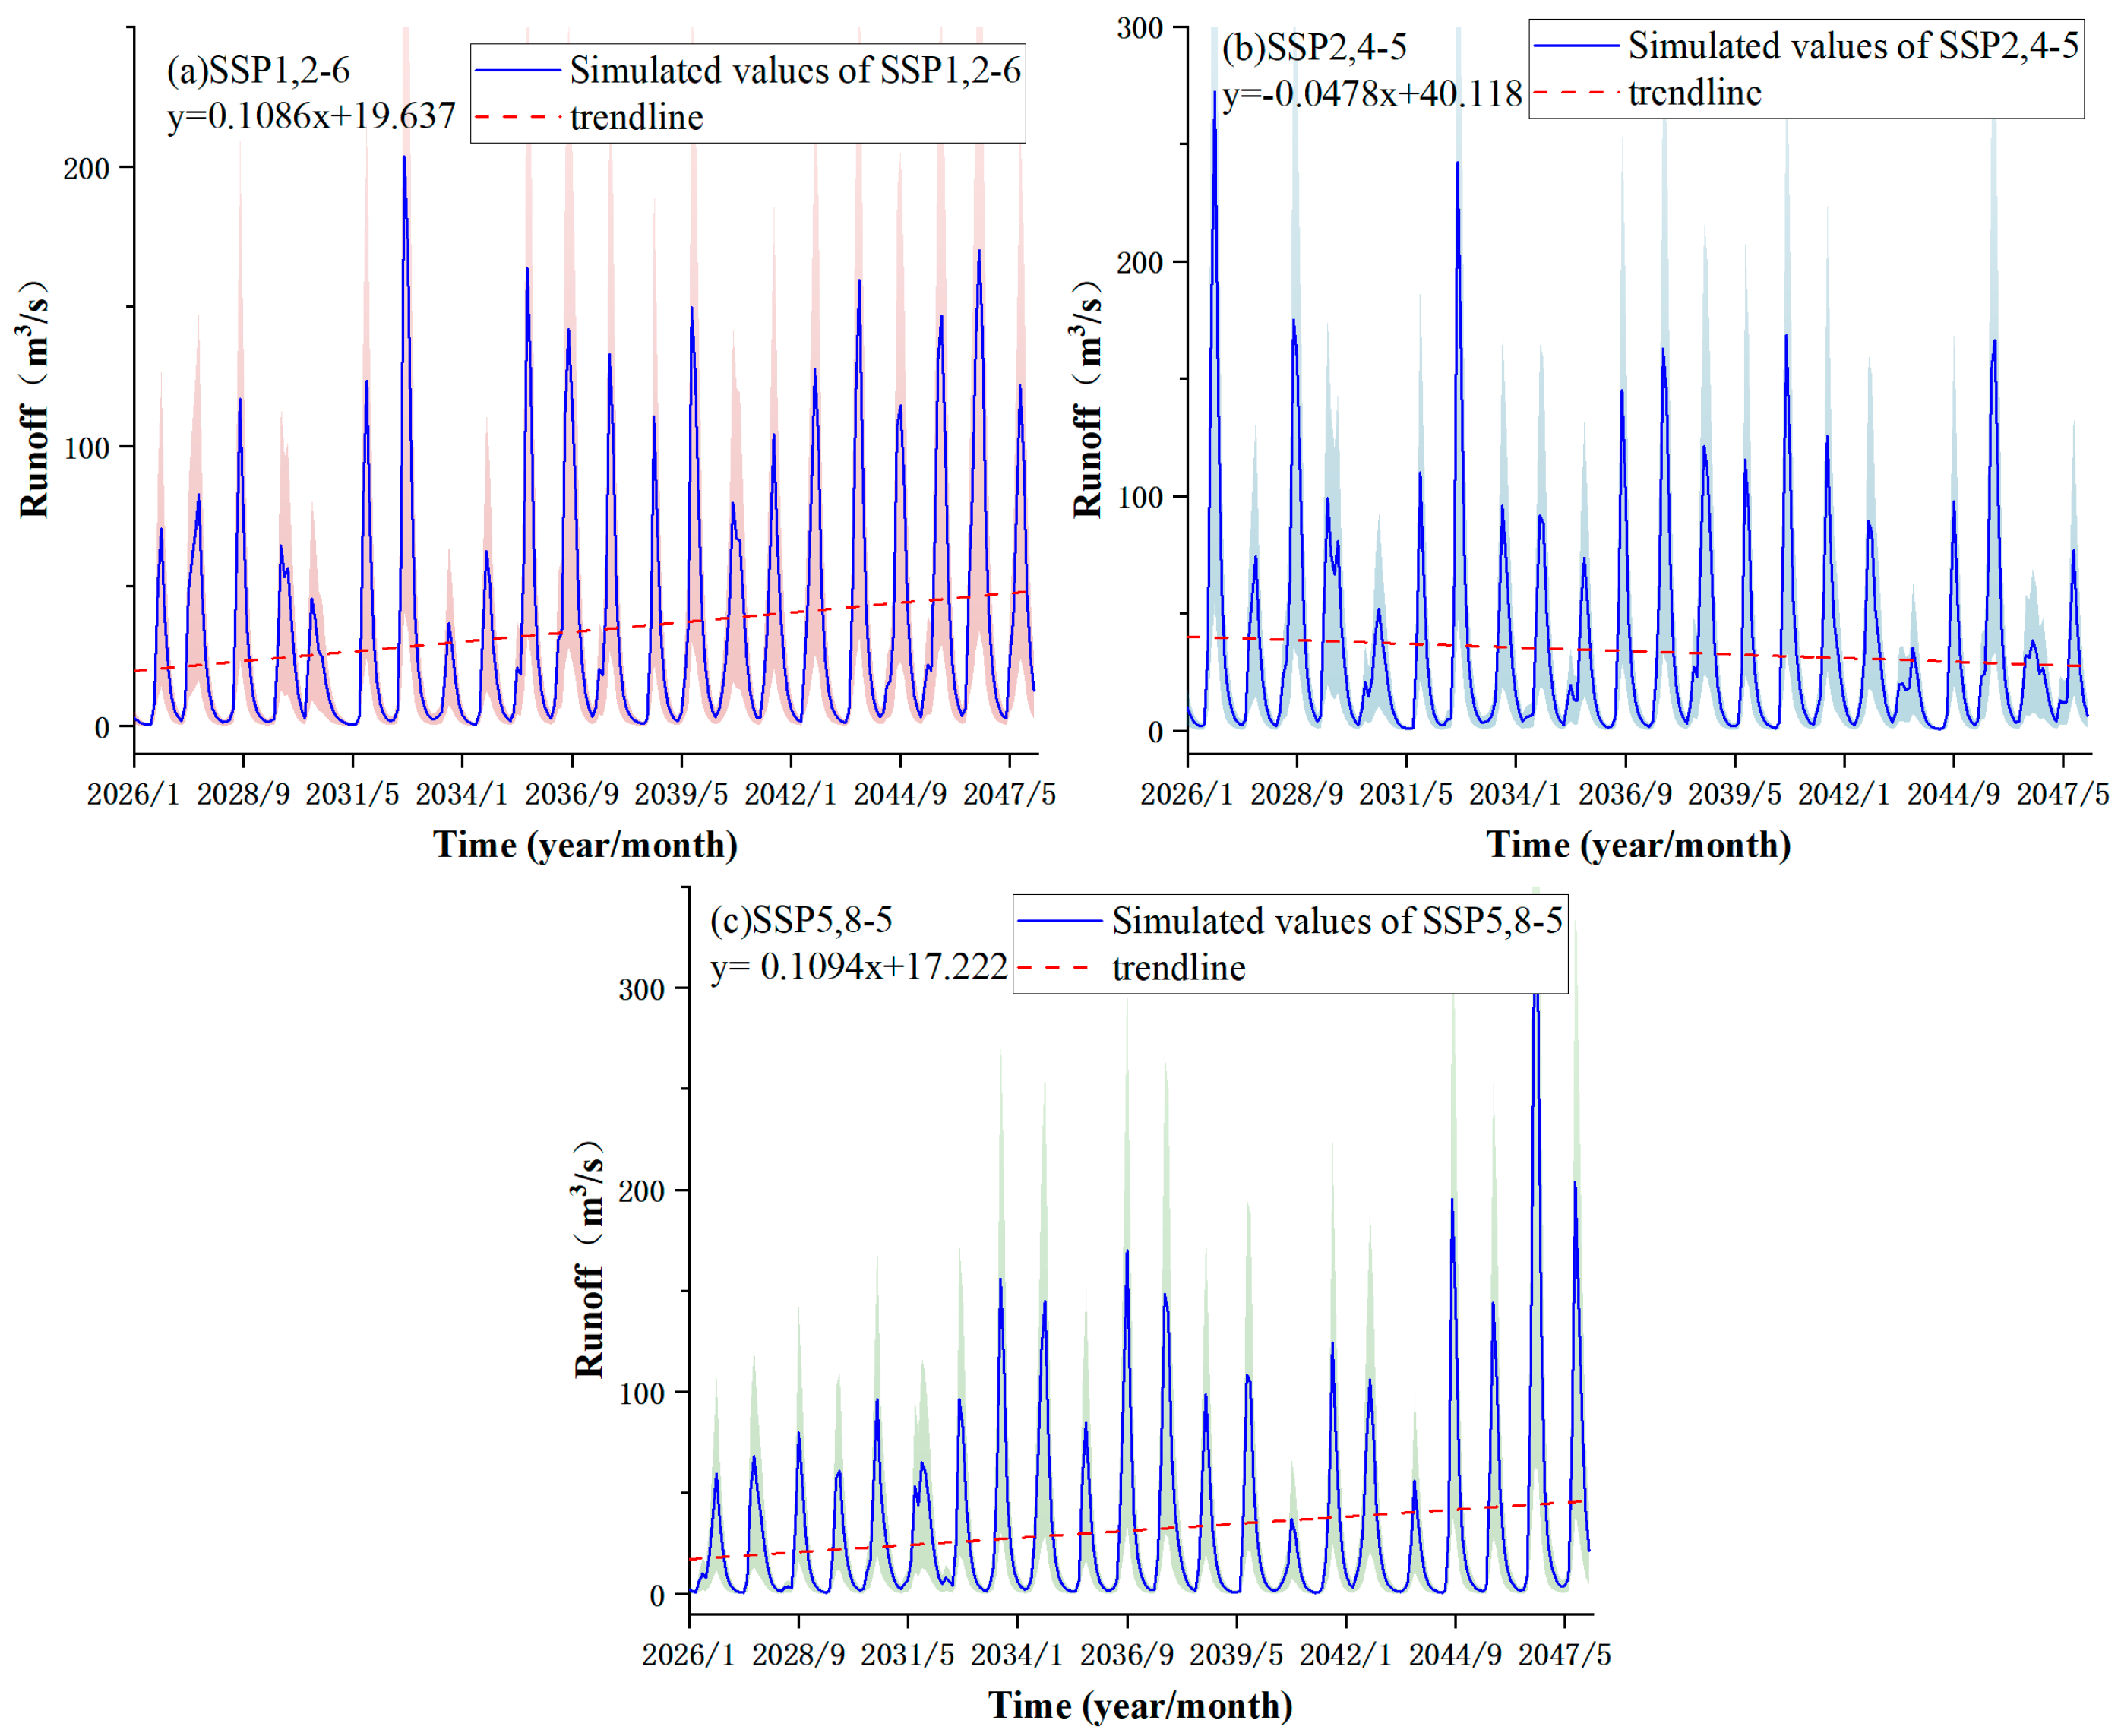
Using the parameters found in the model above, daily meteorological data (precipitation and maximum and lowest temperatures) for the three future climate scenarios were arranged into text format. A forked file was made and imported into the SWAT model using the coordinates and elevations of the center of mass sites in the Tangwang River watershed. Monthly runoff simulations were used to determine the monthly average runoff volume for the entire basin and to provide the runoff volume of each sub-basin outlet section, with 2025 serving as the model warm-up period. The findings are presented in Figure 16, where different scenarios’ runoff patterns are displayed for the years 2026–2047. The SSP2-4.5 scenario indicates a decrease in runoff, whereas the SSP1-2.6 and SSP5-8.5 scenarios show increases.
When comparing future climatic scenarios to the multi-year average runoff in the historical baseline period, the 1980–2014 basin runoff serves as a baseline (see Table 7). In fact, the SSP5-8.5 scenario reduces runoff by 6.35%. Future changes are generally expected to stay within reasonable bounds, suggesting that the hydrologic cycle will only be somewhat impacted by climate change. The water supplies in the basin, however, will undoubtedly face difficulties due to the likelihood of increasingly frequent and powerful extreme weather events.

3.6.2. Annual Snowmelt Runoff Change in Years

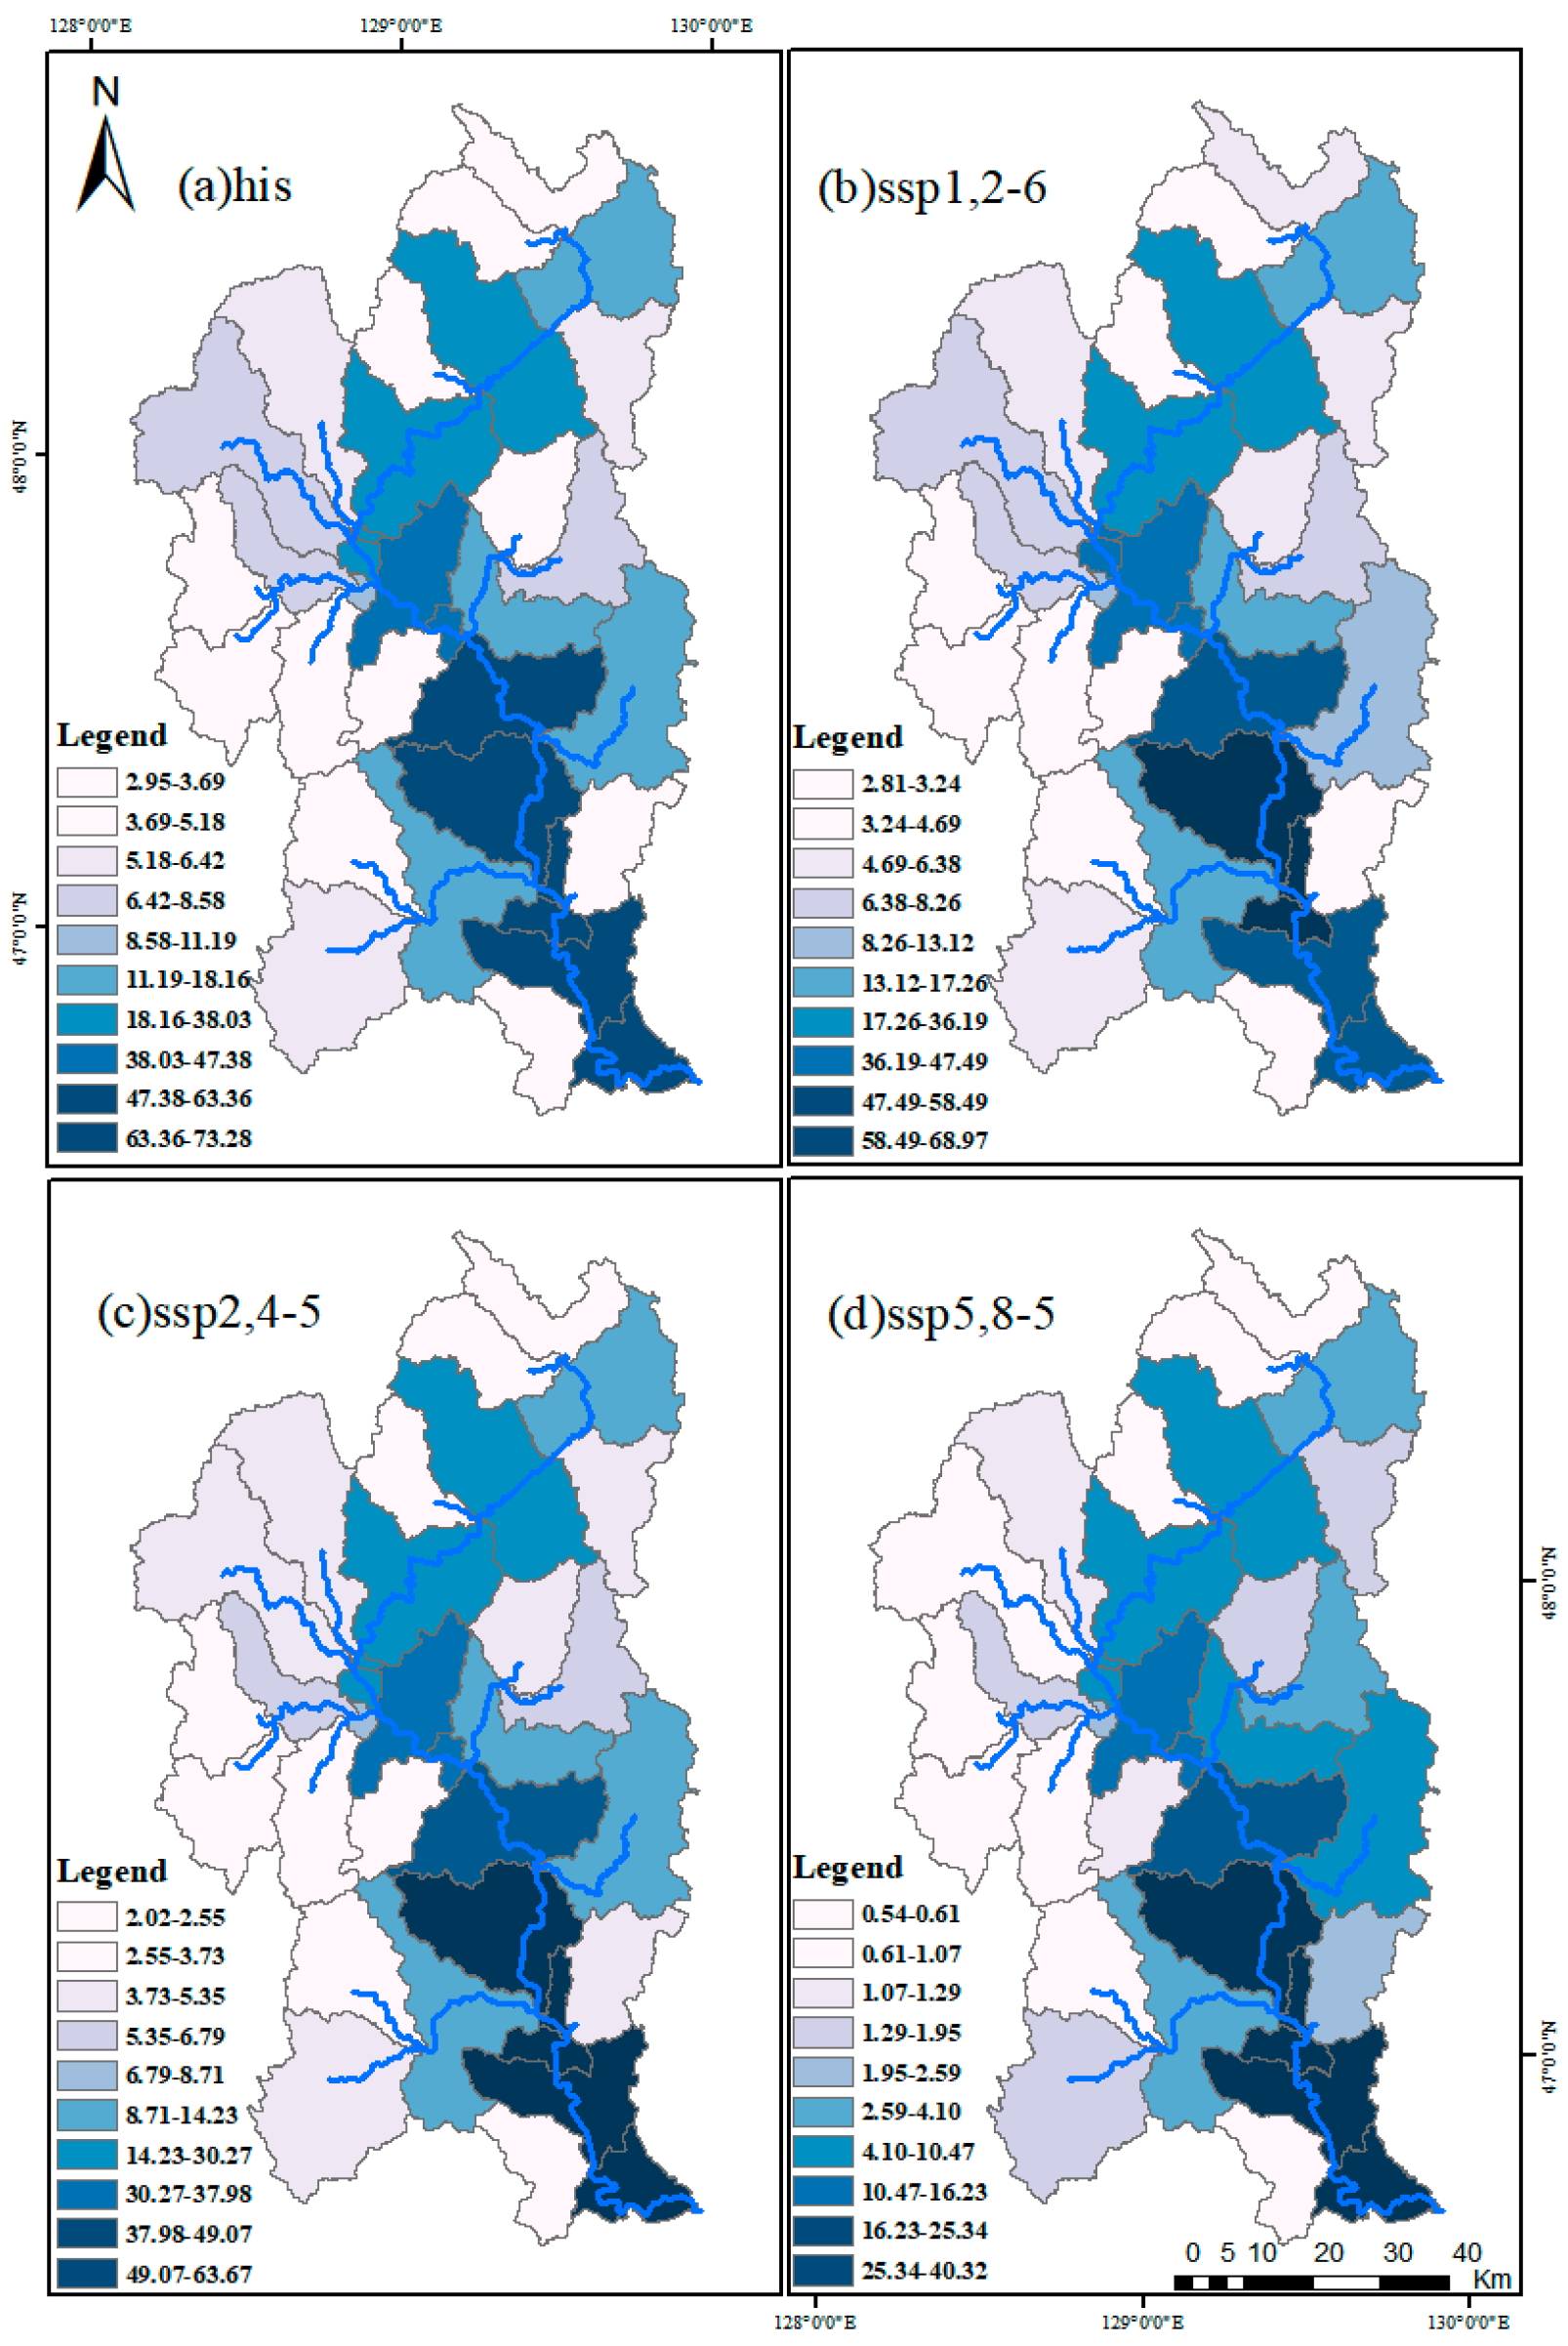
Figure 17 illustrates the distribution of runoff volume during snowmelt runoff periods for sub-basins in the Tangwang River Basin under historical and future scenarios. The high runoff sub-basins are mostly located at the outlet of the watershed and increase along the mainstem. The maximum runoff volume for the historical period was 73.28 m3/s, while the minimum runoff volume for the SSP5-8.5 scenario was 0.54 m3/s, a difference of 72.74 m3/s. Runoff volumes for the SSP1-2.6 and SSP2-4.5 scenarios were similar to the historical baseline period, but generally lower for the SSP5-8.5 scenario.

3.6.3. Change in Runoff during the Year

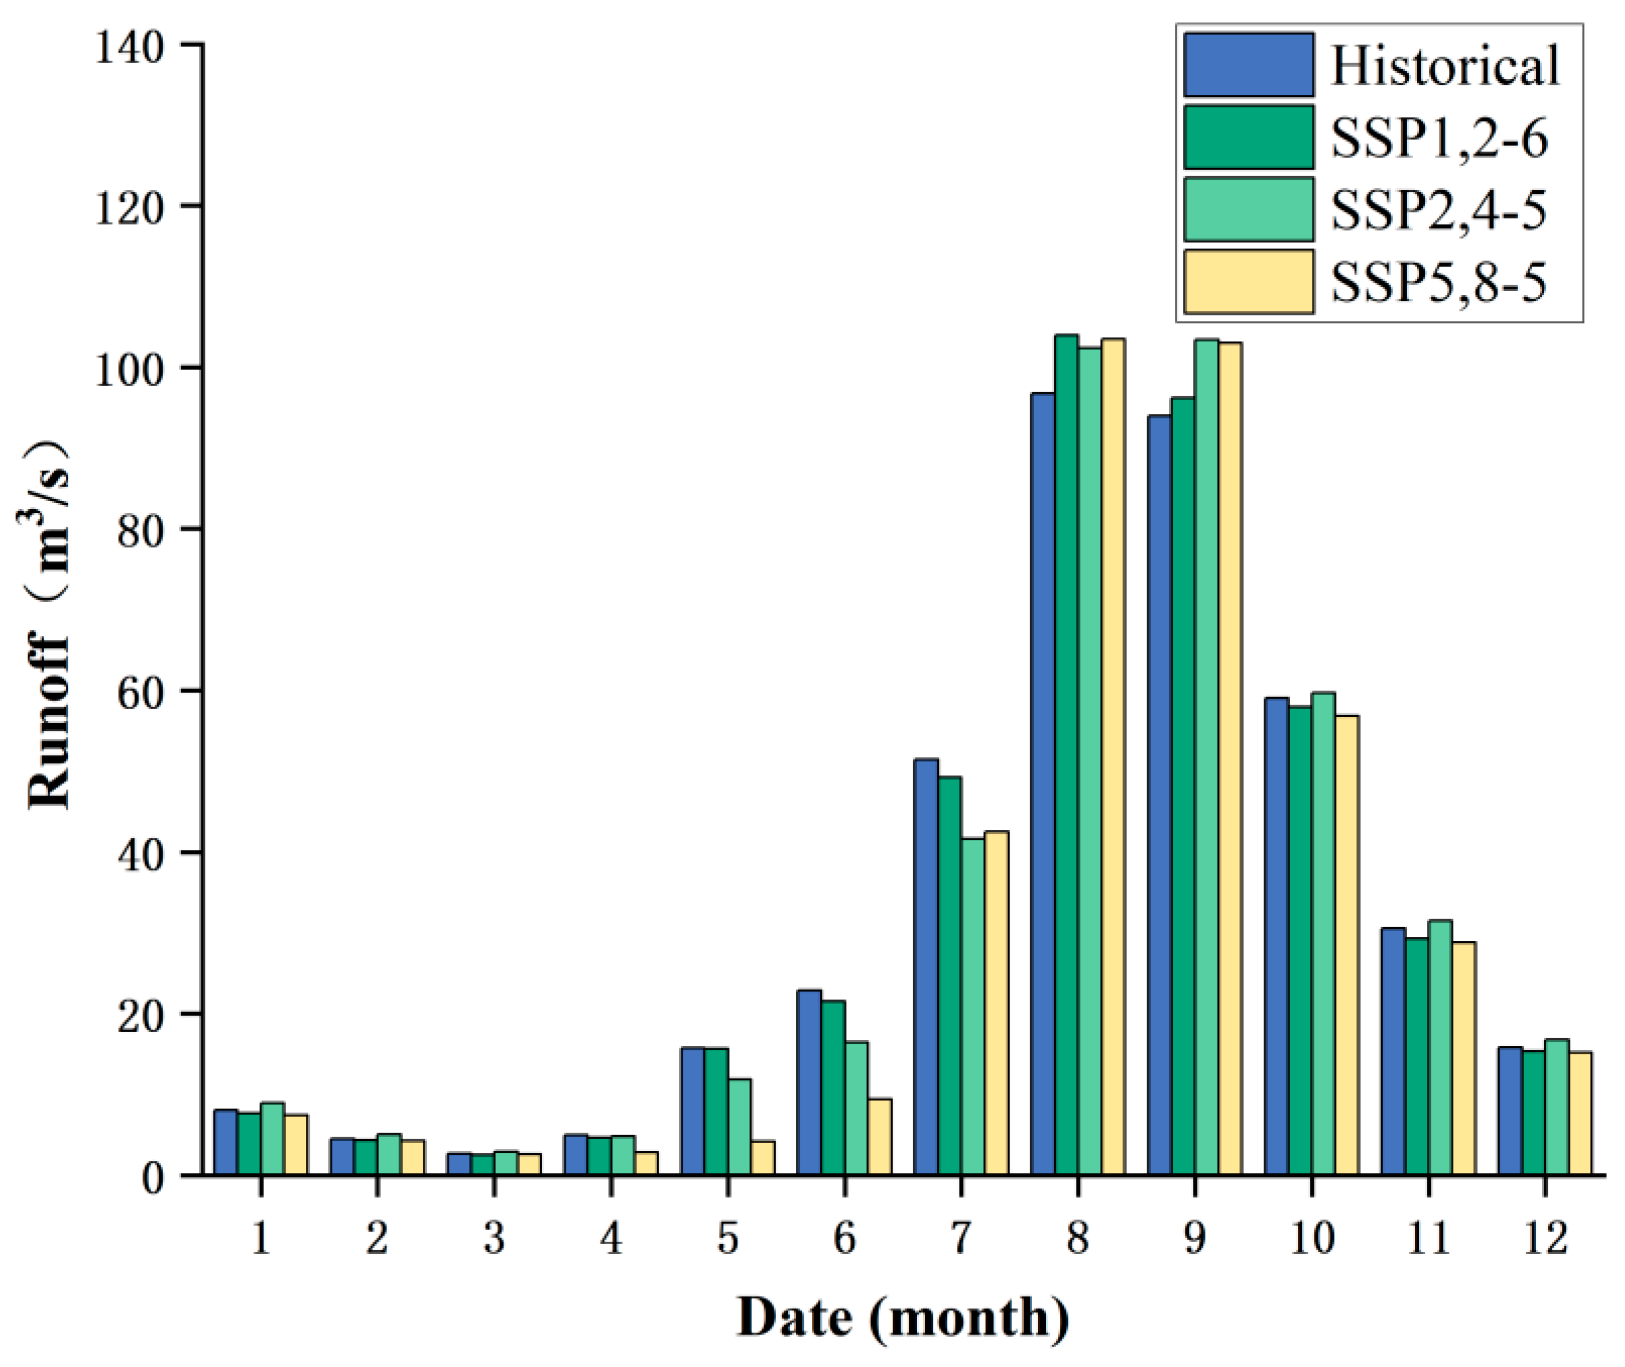
The intra-annual distribution of monthly runoff volumes under the two scenario models was compared to observed volumes based on projected data for the years 2026–2047. Figure 18 illustrates that, in comparison to the historical base period, summer monthly runoff volumes generally rise in the three future climate scenarios. This increase is mostly attributable to higher summer temperatures and precipitation. In the meantime, monthly runoff in the non-summer months either stayed the same or dropped relative to historical levels. This is probably because warmer temperatures cause more evaporation, which lowers groundwater and surface water recharge. Even though increased summer runoff may temporarily increase available water supplies, it also increases the risk of flooding. Reduced runoff in other seasons may make droughts worse, particularly in the dry season when water scarcity may affect domestic, industrial, and agricultural water usage.
In the Tangwang River Basin, runoff under the three future climate scenarios altered very little during the snowmelt runoff period (April–May), even falling slightly short of the historical baseline period. However, future climate models show that warmth and precipitation would work together to gradually boost spring runoff, indicating that climatic drivers positively influence runoff during the snowmelt runoff period.

4. Discussion and Results

4.1. SWAT Modeling and Parametric Sensitivity Analysis

In this paper, the SWAT model is constructed for the Tangwang River basin, a typical cold-zone watershed in northeastern China. In order to identify the factors influencing the runoff in the Tangwang River basin, the downstream outlet Chenming (II) hydrological station is used. Current runoff and snowmelt runoff are simulated, and the meteorological and sub-bedding factors are analyzed. The results show that the air temperature is the main influencing factor in the Tangwang River basin, which is consistent with the findings of the previous study [51]. In order to increase the precision and dependability of the model prediction, the parameters that were most appropriate for the cold climate of northeastern China were chosen. These parameters were further refined using ongoing iteration and parameter sensitivity analysis to identify the parameters that had the most profound effects on the model output. The variations in the number of iterations and the choice of algorithms employed in the SWAT-CUP software are the primary causes of the variations in t-Stat values, P-Value values, and sensitivity rankings across various research. The baseflow abatement factor ALPHA_BF, the shallow groundwater-generated baseflow threshold depth GWQMN, and the CN2 factor of the SCS runoff curve were found to be the primary sensitivity parameters in this study. This aligns with the majority of the research investigations [52,53] that determined the sensitivity parameters.

4.2. Future Land Use Shift Analysis

This study computes the degree of both single and comprehensive dynamic changes in order to conduct a quantitative analysis of land use change and transfer in the Tangwang River Basin. The 2020–2050 SSP1,2-6 scenario represents the most significant phase of land use change in the Tangwang River Basin, with a notable rise in the extent of wooded land and a notable drop in agricultural land and grassland. The land use changes in the 2020–2030 SSP2,4-5 and SSP5,8-5 scenarios, however, are consistent with Luoman’s [32] prediction of land changes in the northeastern region, with the areas of forest and grassland land gradually shrinking and turning into unused land and the expanding urbanized areas gradually increasing in area. Nevertheless, land use changes are inconsistent across scenarios. Runoff volume is directly impacted by changes in land types; forests and grasslands can decrease surface runoff by increasing soil infiltration capacity through the vegetation’s root and litter layers, while urbanized areas significantly increase surface runoff volume and runoff rate due to increased hard surfaces, increasing the risk of flooding and significantly increasing runoff volume. These findings are consistent with studies conducted in watersheds such as the Karst Basin [54], the Indus River [55], and the Songkhla River [56].

4.3. Analysis of Future Meteorological and Hydrological Changes

This research uses three future climate scenarios to assess the changes between temperature and precipitation using the NEX-GDDP-CMIP6 dataset. The analysis is utilized to estimate future runoff. It is clear that the Tangwang River Basin will see minimal, if any, changes in precipitation in the future; nevertheless, the SSP2,4-5 scenarios predict increased precipitation, which is strongly correlated with changes in future vegetation area and human activity. In all cases, temperatures are trending upward, which might cause the basin to experience more frequent droughts and water shortages. Furthermore, there will be future variations in the degree to which agricultural, meteorological, and hydrological droughts are related. Future meteorological and hydrological drought trends in China are largely in line with what Xue [57] predicted; however, there is a certain amount of error in the range, which could be the result of a dataset downscaling error, adding to the range’s uncertainty. As a result, the algorithm’s accuracy needs to be increased in the studies that follow. Extreme drought episodes with a lengthy duration, a wide range of impacts, and high destructive potential are predicted to occur increasingly frequently in the future against the backdrop of worsening climate change, particularly under the high greenhouse gas emission scenario of SSP5,8-5. These results contribute to a better understanding of the danger of drought in the context of global warming and serve as a crucial resource for the evaluation and management of drought events.

4.4. Snowmelt Runoff Simulation Analysis

The primary hydrological station used in this paper for both basin runoff simulation and snowmelt runoff simulation is the Tangwang River Basin Chenming (II) station. The corresponding parameters of snowmelt, such as the maximum and small snowmelt factor, snowmelt base temperature, etc., are determined, and the optimal range for the snowmelt runoff simulation is determined. The results show a lack of accuracy, which could be attributed to the use of the SWAT model for snowmelt runoff simulations in the cold northeastern region. The poor adaptability of the SWAT model to the simulation of snowmelt runoff in the cold region of northeastern China, the complexity of the snowmelt runoff mechanism and formulae, the need to improve the original formulae of the SWAT model, and the selection of parameters and the range of the parameters should be optimized. The algorithms in the SWAT-CUP software tend to be diversified, which is the main source of the uncertainty factors in the SWAT model. Currently, the methods responsible for the low accuracy of snowmelt runoff are the degree-day glacier melting algorithm that introduces the influence of solar radiation into SWAT [15], the introduction of total radiation into the temperature index method, the modification of the seasonal variation formula of the snowmelt factor [3], and the change of the snowmelt temperature threshold according to the snow depth and seasonal snowmelt zone temperature obtained from passive microwave remote sensing data, which improves the simulation accuracy.

5. Conclusions

This study included the construction of a SWAT model for the cold northeastern Tangwang River Basin, simulation of snowmelt runoff within the basin, baseflow segmentation using the Bflow digital book filtering method, counting of snowmelt time periods in conjunction with box plots, and analysis of changes in meteorological factors over the next 23 years utilizing future CMIP6 data. The primary findings can be summed up as follows:
  • The snowmelt runoff in the Tangwang River basin was successfully simulated by the SWAT model in conjunction with the Bflow digital filtering method. The model calibration results demonstrated that the correlation coefficients and Nash coefficients were within acceptable ranges, indicating a high level of simulation accuracy and a good match with the measured data.
  • Variability is evident in projected runoff trends under many climatic scenarios. It appears that climate change is significantly affecting the hydrologic cycle in the watershed because runoff is predicted to decrease under the SSP2-4.5 scenario and to increase under the SSP1-2.6 and SSP5-8.5 scenarios.
  • Monthly runoff in non-summer months may drop due to higher evaporation and worsening drought conditions, presenting a challenge to water availability; monthly runoff in summer months is predicted to climb due to increased temperatures and precipitation, raising the danger of flooding.
  • The Tangwang River Basin’s flood early warning systems and water resource management may likely face difficulties as a result of future climate change, which will also likely lead to more frequent and intense extreme weather events. Adaptive management strategies will be needed to address these possible problems with water security.

Author Contributions

Data curation, Q.L.; Writing—original draft, Y.-X.Z. and G.-W.L.; Writing—review & editing, C.-L.D.; Funding acquisition, Z.-W.Z. All authors have read and agreed to the published version of the manuscript.

Funding

This research was funded by: (1) [Research and analysis of Sino-Russian glacial flow measurement technology in Heilongjiang (Amur River) and suggestions on survey schemes]. (2) [Yunnan Key Laboratory of International Rivers and Transboundary Eco-Security] grant number [2022KF03] And The APC was funded by [2022KF03].

Data Availability Statement

Data available in a publicly accessible repository: This data can be found here: (1). Available online: https://cds.nccs.nasa.gov/nex-gddp/), accessed on 15 June 2024. (2). https://www.nature.com/articles/s41597-023-02637-7, accessed on 15 June 2024.

Conflicts of Interest

The authors declare no conflict of interest.

References

  1. Duan, L.; Cai, T. Changes in magnitude and timing of high flows in large rain-dominated watersheds in the cold region of north-eastern China. Water 2018, 10, 1658. [Google Scholar] [CrossRef]
  2. Cheng, J.; Zhang, X.; Jia, M.; Su, Q.; Kong, D.; Zhang, Y. Integrated use of GIS and USLE models for LULC change analysis and soil erosion risk assessment in the Hulan river basin, Northeastern China. Water 2024, 16, 241. [Google Scholar] [CrossRef]
  3. Hongling, Z.; Hongyan, L.; Yunqing, X.; Changhai, L.; Heshan, N. Improvement of the SWAT model for snowmelt runoff simulation in seasonal snowmelt area using remote sensing data. Remote Sens. 2022, 14, 5823. [Google Scholar] [CrossRef]
  4. Wei, Q.; Lian, F.; Hong, Y.; Junguo, L. Warming winter, drying spring and shifting hydrological regimes in Northeast China under climate change. J. Hydrol. 2022, 606, 127390. [Google Scholar]
  5. Xuejiao, W.; Wei, Z.; Hongyi, L.; Yinping, L.; Xiaoduo, P.; Yongping, S. Analysis of seasonal snowmelt contribution using a distributed energy balance model for a river basin in the Altai Mountains of northwestern China. Hydrol. Process. 2021, 35, 14046. [Google Scholar]
  6. Wu, Z.; Fang, H. Snowmelt erosion: A review. Earth-Sci. Rev. 2024, 250, 104704. [Google Scholar] [CrossRef]
  7. Huang, Y.; Jiang, Y.; Jiang, B.; Bailey, R.T.; Masud, B.; Smerdon, B.; Faramarzi, M. Modelling impacts of climate change on snow drought, groundwater drought, and their feedback mechanism in a snow-dominated watershed in western Canada. J. Hydrol. 2024, 636, 131342. [Google Scholar] [CrossRef]
  8. Abudu, S.; Cui, C.-L.; Saydi, M.; King, J.P. Application of snowmelt runoff model (SRM) in mountainous watersheds: A review. Water Sci. Eng. 2012, 5, 123–136. [Google Scholar]
  9. Duan, Y.; Meng, F.; Liu, T.; Huang, Y.; Luo, M.; Xing, W.; Maeyer, P.D. Sub-Daily Simulation of Mountain Flood Processes Based on the Modified Soil Water Assessment Tool (SWAT) Model. Int. J. Environ. Res. Public Health 2019, 16, 3118. [Google Scholar] [CrossRef]
  10. Yang, W.; Zhang, X.; Wang, Z.; Li, Z. Identifying components and controls of streamflow in a cold and arid headwater catchment. J. Hydrol. 2024, 633, 131022. [Google Scholar] [CrossRef]
  11. Goodarzi, M.R.; Sabaghzadeh, M.; Niazkar, M. Evaluation of snowmelt impacts on flood flows based on remote sensing using SRM model. Water 2023, 15, 1650. [Google Scholar] [CrossRef]
  12. Elmer, C.; Abel, M.; Elgar, B.; Fredy, C.; Fernando, C.; Rolando, S.; Héctor, V.; Efrain, T. Modelling snowmelt runoff from tropical Andean glaciers under climate change scenarios in the Santa river sub-basin (Peru). Water 2021, 13, 3535. [Google Scholar] [CrossRef]
  13. Tian, L.; Li, H.; Li, F.; Li, X.; Du, X.; Ye, X. Identification of key influence factors and an empirical formula for spring snowmeltrunoff A case study in midtemperate zone of northeast China. Sci. Rep. 2018, 8, 16950. [Google Scholar] [CrossRef]
  14. Soumyadip, B.; Sujata, B. Estimation of monthly snowmelt contribution to runoff using gridded meteorological data in SWAT model for upper Alaknanda river basin, India. Environ. Monit. Assess. 2023, 196, 86. [Google Scholar]
  15. Chengde, Y.; Min, X.; Congsheng, F.; Shichang, K.; Yi, L. The coupling of glacier melt module in SWAT+ model based on multi-source remote sensing data: A case study in the upper Yarkant river basin. Remote Sens. 2022, 14, 6080. [Google Scholar] [CrossRef]
  16. Sanjay, K.J.; Sandeep, S.; Kansal, M.L. Hydrological modelling of a snow/glacier-fed western Himalayan basin to simulate the current and future streamflows under changing climate scenarios. Sci. Total Environ. 2021, 795, 148871. [Google Scholar]
  17. Singh, V.; Jain, S.K.; Goyal, M.K. An assessment of snow-glacier melt runoff under climate change scenarios in the Himalayan basin. Stoch. Environ. Res. Risk Assess. 2021, 35, 2067–2092. [Google Scholar] [CrossRef]
  18. Liu, Y.; Cui, G.; Li, H. Optimization and application of snow melting modules in SWAT model for the alpine regions of northern China. Water 2020, 12, 636. [Google Scholar] [CrossRef]
  19. Liqing, Z.; Wang, X.; Jiaqi, L. Evaluation of Arctic sea ice extent according to Chinese CMIP6 models. Chin. J. Polar Res. 2022, 34, 460–470. (In Chinese) [Google Scholar]
  20. Zhou, T.-J.; Zou, L.-W.; Chen, X.L. Commentary on the coupled model intercomparison project phase 6 (CMIP6). Clim. Chang. Res. 2019, 15, 445–456. (In Chinese) [Google Scholar]
  21. Yu, W.; Huixin, L.; Huijun, W.; Bo, S.; Huopo, C. Evaluation of CMIP6 model simulations of extreme precipitation in China and comparison with CMIP5. Acta Meteorol. Sin. 2021, 79, 360–386. (In Chinese) [Google Scholar]
  22. Taylor, K.E.; Stouffer, R.J.; Meehl, G.A. An overview of cmip5 and the experiment design. Bull. Am. Meteorol. Soc. 2012, 93, 485–498. [Google Scholar] [CrossRef]
  23. Shi, X.; Chen, X.; Dai, Y.; Hu, G. Climate sensitivity and feedbacks of BCC-CSM to idealized CO2 forcing from CMIP5 to CMIP6. J. Meteorol. Res. 2020, 34, 865–878. [Google Scholar] [CrossRef]
  24. Zhang, S.B.; Chen, J. Uncertainty in projection of climate extremes: A comparison of CMIP5 and CMIP6. J. Meteorol. Res. 2021, 35, 646–662. [Google Scholar] [CrossRef]
  25. Thrasher, B.; Xiong, J.; Wang, W.; Melton, F.; Michaelis, A.; Nemani, R. Downscaled climate projections suitable for resource management. EOS 2013, 94, 321–323. [Google Scholar] [CrossRef]
  26. Chen, H.-P.; Sun, J.-Q.; Li, H.-X. Future changes in precipitation extremes over China using the NEX-GDDP high-resolution daily downscaled data-set. Atmos. Ocean. Sci. Lett. 2017, 10, 403–410. [Google Scholar] [CrossRef]
  27. Bao, Y.; Wen, X. Projection of China’s near- and long-term climate in a new high-resolution daily downscaled dataset NEX-GDDP. J. Meteorol. Res. 2017, 31, 236–249. [Google Scholar] [CrossRef]
  28. Chen, L.; Xu, C.; Li, X. Projections of temperature extremes based on preferred CMIP5 models: A case study in the Kaidu-Kongqi River basin in Northwest China. J. Arid. Land 2021, 13, 568–580. [Google Scholar] [CrossRef]
  29. Tong, M.; Li, L.; Li, Z.; Tian, Z. Spatiotemporal analysis of future precipitation changes in the Huaihe river basin based on the NEX-GDDP-CMIP6 dataset and monitoring data. Water 2023, 15, 3805. [Google Scholar] [CrossRef]
  30. Zhang, F.; Wei, L.; Li, Y.; Tang, H.; Zhang, T.; Yang, B. Evaluation and projection of extreme high temperature indices in southwestern China using NEX-GDDP-CMIP6. J. Meteorol. Res. 2024, 38, 88–107. [Google Scholar] [CrossRef]
  31. Muhadaisi, A.; Shuangcheng, L.; Abudurexiti, A.; Yueyao, W.; Lijin, Z. Prediction of extreme climate on the Tibetan plateau based on NEX-GDDP-CMIP6. Human and Ecol. Risk Assess. 2023, 29, 1261–1275. [Google Scholar]
  32. Liu, W.; Cai, T.; Fu, G.; Zhang, A.; Liu, C.; Yu, H. The streamflow trend in Tangwang River basin in northeast China and its difference response to climate and land use change in sub-basins. Environ. Earth Sci. 2013, 69, 51–62. [Google Scholar] [CrossRef]
  33. Junbo, Z.X.H.Z.L.X. Study of runoff variation in Tangwang river basin. J. China Three Gorges Univ. 2018, 40, 12–14. (In Chinese) [Google Scholar]
  34. Ridwansyah, I.; Yulianti, M.; Apip, A.; Onodera, S.-I.; Shimizu, Y.; Wibowo, H.; Fakhrudin, M. The impact of land use and climate change on surface runoff and groundwater in Cimanuk watershed, Indonesia. Limnology 2020, 21, 487–498. [Google Scholar] [CrossRef]
  35. Nkwasa, A.; Chawanda, C.J.; Msigwa, A.; Komakech, H.C.; Verbeiren, B.; van Griensven, A. How can we represent seasonal land use dynamics in SWAT and SWAT plus models for African cultivated catchments? Water 2020, 12, 1541. [Google Scholar] [CrossRef]
  36. Long, S.; Gao, J.; Shao, H.; Wang, L.; Zhang, X.; Gao, Z. Developing SWAT-S to strengthen the soil erosion forecasting performance of the SWAT model. Land Degrad. Dev. 2024, 35, 280–295. [Google Scholar] [CrossRef]
  37. Che, L.; Wan, L. Water Quality Analysis and Evaluation of Eutrophication in a Swamp Wetland in the Permafrost Region of the Lesser Khingan Mountains, China. Bull. Environ. Contam. Toxicol. 2021, 108, 234–242. [Google Scholar]
  38. Arnold, J.G.; Srinivasan, R.; Muttiah, R.S.; Allen, P.M. Continental scale simulation of the hydrologic balance. J. Am. Water Resour. Assoc. 1995, 35, 1037–1051. [Google Scholar] [CrossRef]
  39. Chanasyk, D.S.; Mapfumo, E.; Willms, W. Quantification and simulation of surface runoff from fescue grassland watersheds. Agric. Water Manag. 2003, 59, 137–153. [Google Scholar] [CrossRef]
  40. Vu, M.T.; Raghavan, S.V.; Liong, S.Y. SWAT use of gridded observations for simulating runoff—A Vietnam river basin study. Hydrol. Earth Syst. Sci. 2012, 16, 2801–2811. [Google Scholar] [CrossRef]
  41. Su, Q.; Dai, C.; Zhang, Z.; Zhang, S.; Li, R.; Qi, P. Runoff simulation and climate change analysis in Hulan river basin based on SWAT model. Water 2023, 15, 2845. [Google Scholar] [CrossRef]
  42. Liu, G.W.; Dai, C.L.; Shao, Z.X.; Xiao, R.H.; Guo, H.C. Assessment of ecological flow in Hulan river basin utilizing SWAT model and diverse hydrological approaches. Sustainability 2024, 16, 2513. [Google Scholar] [CrossRef]
  43. McNamara, J.P.; Kane, D.L.; Hinzman, L.D. Hydrograph separations in an arctic watershed using mixing model and graphical techniques. Water Resour. Res. 1997, 33, 1707–1719. [Google Scholar] [CrossRef]
  44. Sheng, H.; Yang, D.; Jiang, W.; Yu, G.; Haijun, Q.; Mingming, C.; Jinxi, S.; Honglin, W. Spatiotemporal variation characteristics of baseflow in the Bahe river basin based on digital filter method and SWAT model. Sci. Geogr. Sin. 2017, 37, 455–463. [Google Scholar]
  45. Lee, J.; Park, M.; Min, J.-H.; Na, E.H. Integrated assessment of the land use change and climate change impact on baseflow by using hydrologic model. Sustainability 2023, 15, 12465. [Google Scholar] [CrossRef]
  46. Moriasi, D.N.; Arnold, J.G.; van Liew, M.W.; Bingner, R.L.; Harmel, R.D.; Veith, T.L. Model evaluation guidelines for systematic quantification of accuracy in watershed simulations. Trans. ASABE 2007, 50, 885–900. [Google Scholar] [CrossRef]
  47. Ren, W.; Li, X.; Zheng, D.; Zeng, R.; Su, J.; Mu, T.; Wang, Y. Enhancing flood simulation in data-limited glacial river basins through hybrid modeling and multi-source remote sensing data. Remote Sens. 2023, 15, 4527. [Google Scholar] [CrossRef]
  48. Charles, W.; Robert, L. A hydrograph-based approach to improve satellite-derived snow water equivalent at the watershed scale. Water 2022, 14, 3575. [Google Scholar] [CrossRef]
  49. Hayashi, M.; van der Kamp, G. Simple equations to represent the volume–area–depth relations of shallow wetlands in small topographic depressions. J. Hydrol. 2000, 237, 74–85. [Google Scholar] [CrossRef]
  50. Zhang, T.; Cheng, C.; Wu, X. Mapping the spatial heterogeneity of global land use and land cover from 2020 to 2100 at a 1 km resolution. Sci. Data 2023, 10, 748. [Google Scholar] [CrossRef]
  51. Jin, X.; Jin, Y.; Yuan, D.; Mao, X. Effects of land-use data resolution on hydrologic modelling, a case study in the upper reach of the Heihe River, Northwest China. Ecol. Model. 2019, 404, 61–68. [Google Scholar] [CrossRef]
  52. Wang, B.; Guo, S.S.; Feng, J.; Huang, J.B.; Gong, X.L. Simulation on effect of snowmelt on cropland soil moisture within basin in high latitude cold region using SWAT. Trans. Chin. Soc. Agric. Mach. 2022, 53, 271–278. [Google Scholar]
  53. Shrestha, S.; Bhatta, B.; Shrestha, M.; Shrestha, P.K. Integrated assessment of the climate and landuse change impact on hydrology and water quality in the Songkhram river basin, Thailand. Sci. Total Environ. 2018, 643, 1610–1622. [Google Scholar] [CrossRef]
  54. Luoman, P.; Jiuchun, Y.; Lingxue, Y.; Changsheng, X.; Fengqin, Y.; Yubo, Z.; Shuwen, Z. Simulating land-use changes and predicting maize potential yields in northeast China for 2050. Int. J. Environ. Res. Public Health 2021, 18, 938. [Google Scholar] [CrossRef]
  55. Mo, C.; Bao, M.; Lai, S.; Deng, J.; Tang, P.; Xing, Z.; Tang, G.; Li, L. Impact of future climate and land use changes on runoff in a typical Karst basin, southwest China. Water 2023, 15, 2240. [Google Scholar] [CrossRef]
  56. Kashif, H.; Ullah, K.A.; Sohail, A.; Mansoor, K.; Ahmad, K.F.; Wisal, K.; Jehanzeb, K. Hydrological impacts of climate and land-use change on flow regime variations in upper Indus basin. J. Water Clim. Chang. 2022, 13, 758–770. [Google Scholar]
  57. Xue, R.; Sun, B.; Li, W.; Li, H.; Zhou, B.; Luo, X.; Ai, W. Future projections of meteorological, agricultural and hydrological droughts in China using the emergent constraint. J. Hydrol. Reg. Stud. 2024, 53, 101767. [Google Scholar] [CrossRef]
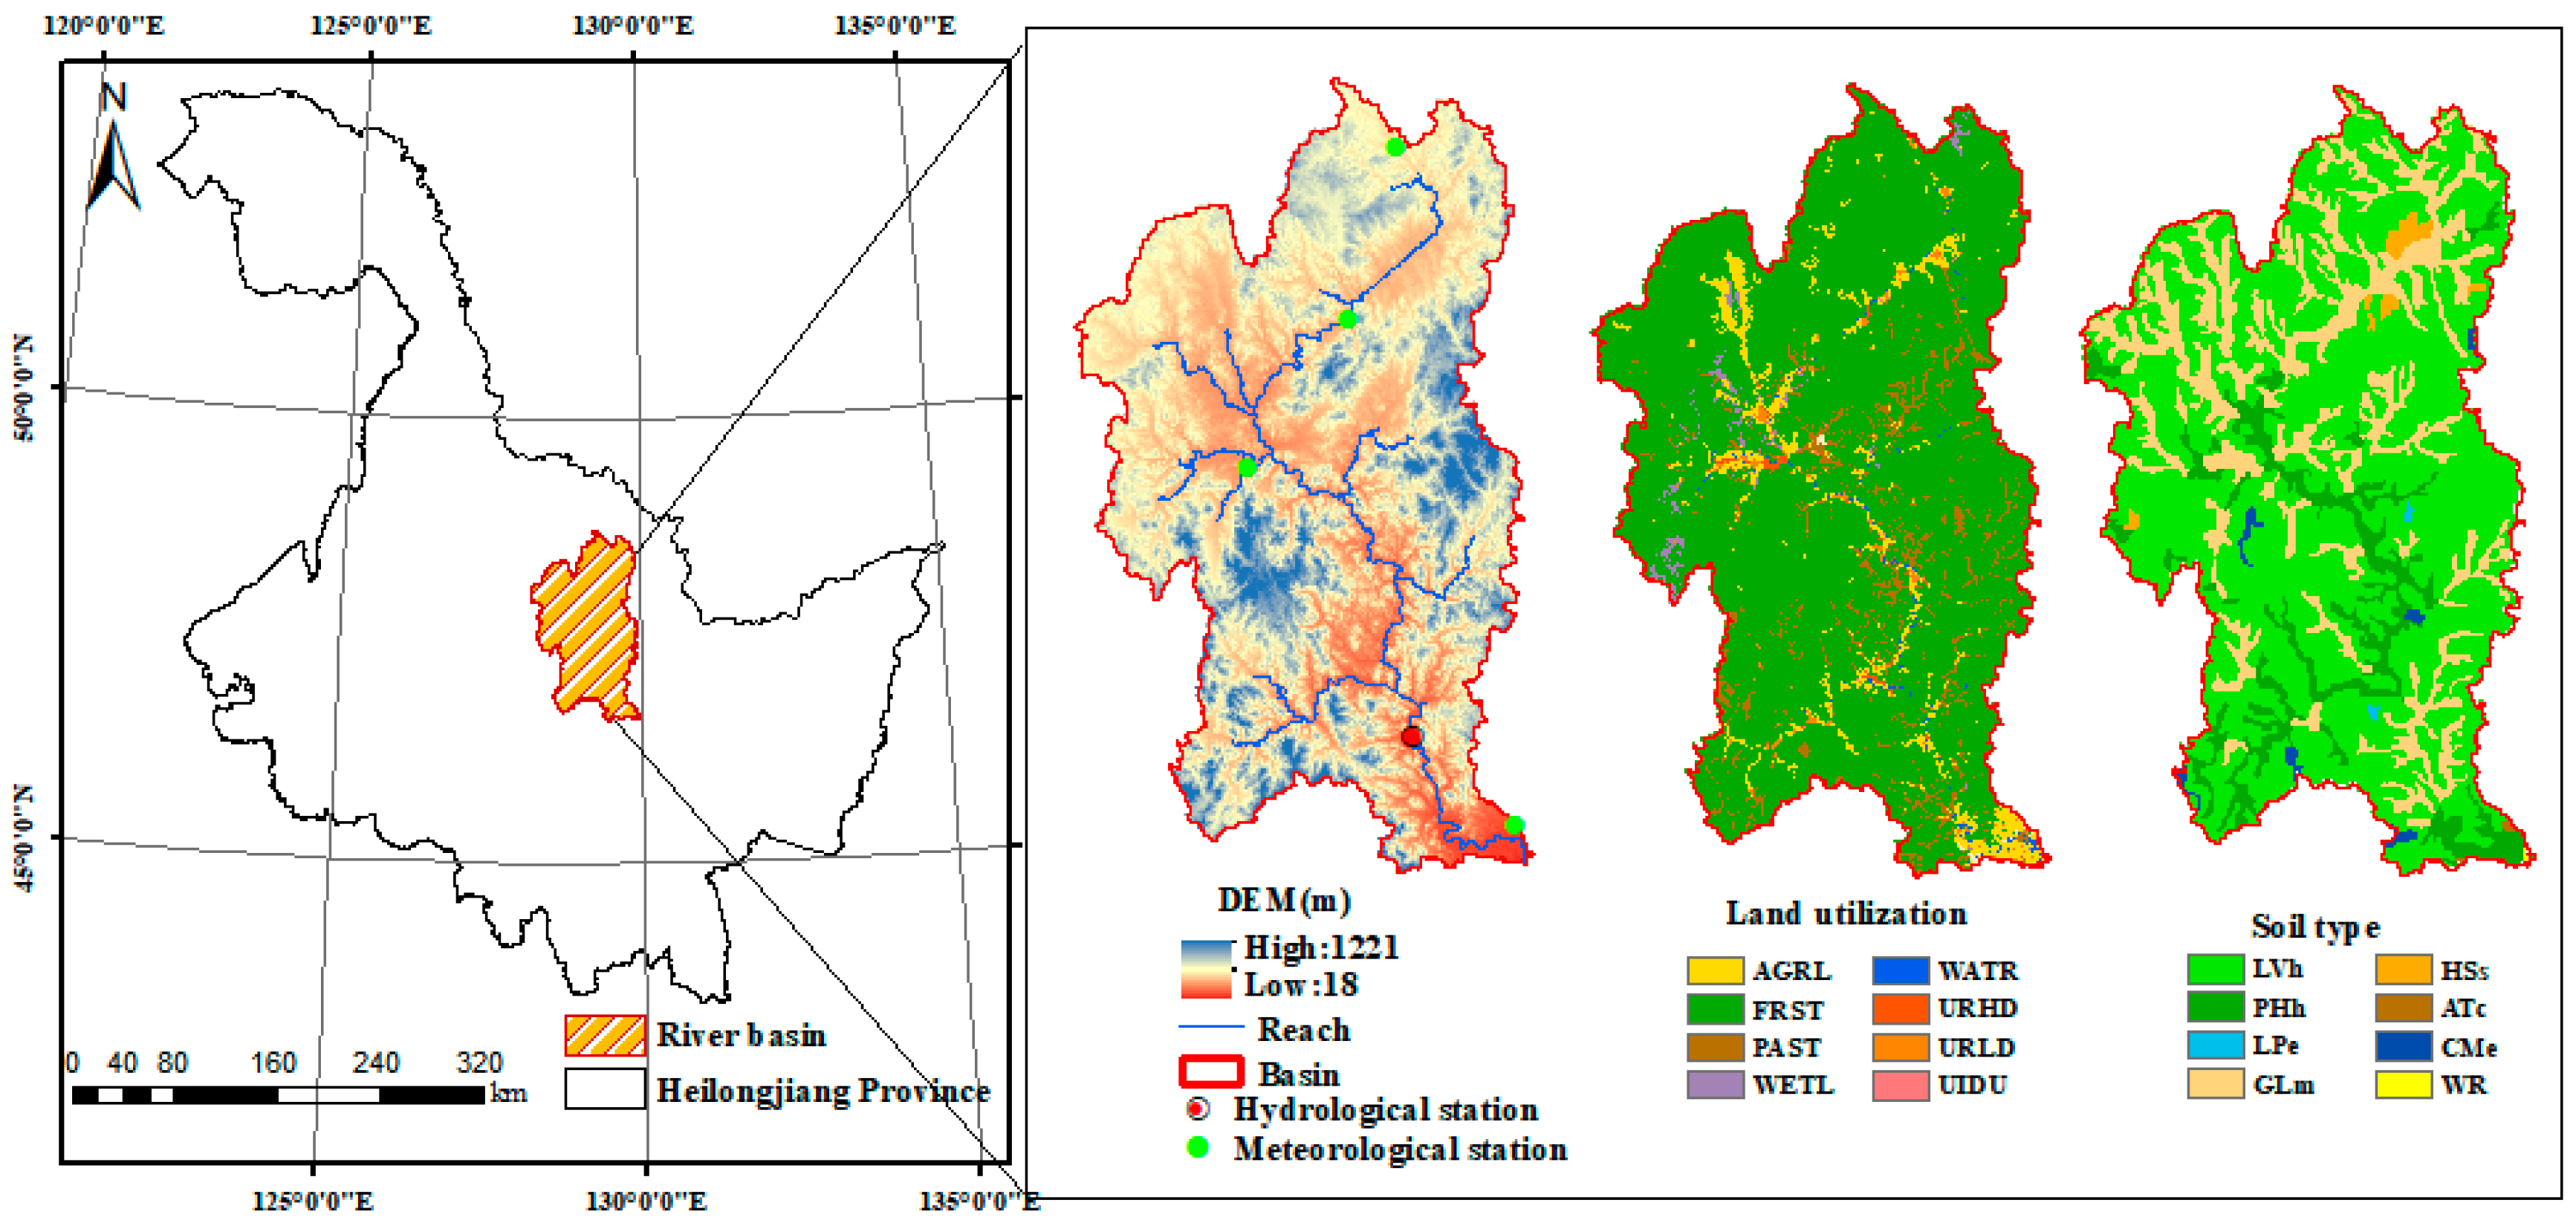
Figure 1. Geospatial overview of the Tangwang River Basin study area.
Water 16 02082 g001
Figure 2. Sub-basin delineation map of the Tangwang River Basin.
Water 16 02082 g002
Figure 3. Measured Flow and Baseflow Segmentation Results for the Tangwang River Basin.
Water 16 02082 g003
Figure 4. Typical Annual Total Runoff and Baseflow Ratio Process Lines.
Water 16 02082 g004
Figure 5. Boxplot of snowmelt runoff in the Tangwang River Basin by time period, 2001–2022.
Water 16 02082 g005
Figure 6. Changes in precipitation and spatial distribution during the snowmelt runoff period in the Tangwang River Basin, 2025–2047.
Water 16 02082 g006
Figure 7. Map of multi-year average daily precipitation during snowmelt runoff in the Tangwang River Basin for the historical base period and future scenarios.
Water 16 02082 g007
Figure 8. Variations in the Tangwang River Basin’s annual mean maximum and minimum air temperatures, as well as the mean air temperature during snowmelt runoff.
Water 16 02082 g008
Figure 9. Spatial and temporal variability of annual mean, annual maximum and minimum, and average temperatures during snowmelt runoff in the Tangwang River Basin.
Water 16 02082 g009
Figure 10. Changes in multi-year mean daily air temperatures in the Tangwang River Basin during snowmelt runoff for the historical base period and future scenarios.
Water 16 02082 g010
Figure 11. Future Land Use Change Map for the Tangwang River Watershed.
Water 16 02082 g011
Figure 12. Land use transfer transformation dynamics within Tangwang River Basin.
Water 16 02082 g012
Figure 13. Sensitivity map of SWAT model parameters.
Water 16 02082 g013
Figure 14. Periodic and validation period simulation results of runoff simulation rates and linear relationships in the Tangwang River Basin.
Water 16 02082 g014
Figure 15. Periodic and validation period simulation results of runoff simulation rates and linear relationships in the Tangwang River Basin.
Water 16 02082 g015
Figure 16. Future Scenario Monthly Runoff Map for the Tangwang River Watershed.
Water 16 02082 g016
Figure 17. Distribution of runoff volume during historical and future scenario snowmelt runoff periods for each sub-basin of the Tangwang River.
Water 16 02082 g017
Figure 18. Historical base period and future monthly runoff scenarios.
Water 16 02082 g018
Table 1. Land use classification and percentage share [35].
AbbreviationLand Use CategoryPercentage (%)
AGRLAgricultural Land5.53
FRSTForest86.49
PASTPasture5.47
WATRWater Body0.49
URHDResidential—High Density0.23
URLDResidential—Low Density0.80
UIDUIndustrial Land0.05
WETLWetland0.94
Table 2. Classification and percentage of soil types.
AbbreviationSoil Type after ReclassificationPercentage (%)
LVhHaplic Luvisols67.84
PHhHaplic Phaeozems9.07
LPeEutric Leptosols0.11
GLmMollic Gleysols21.23
HSsTerric Histosols0.84
ATcCumulic Anthrosols0.06
CMeEutric Cambisols0.81
WRWater bodies0.03
Table 3. Tangwang River Basin Box Plot Statistical Values.
Statistical ValueStart DateEnd Date
Maximum Values27 April19 May
Upper Quartile19 April14 May
Upper Quartile8 April11 May
Lower Quartile4 April2 May
Minimum Value31 March21 April
Outlier11 April8 May
Table 4. Different land use area ratios.
Land Use Type20202030 (SSP1,2-6)2050 (SSP1,2-6)2030 (SSP2,4-5)2030 (SSP2,4-5)2030 (SSP5,8-5)2050 (SSP5,8-5)
AreaPercentAreaPercentAreaPercentAreaPercentAreaPercentAreaPercentAreaPercent
(km2)(%)(km2)(%)(km2)(%)(km2)(%)(km2)(%)(km2)(%)(km2)(%)
AGRL601.550.03519.640.03229.990.01667.140.03611.050.03659.410.03543.450.03
FRST19,490.40.9619,610.30.9619,757.170.9719,450.550.9519,470.930.9619,249.070.9419,237.760.94
PAST151.750.0144.93045.82068.53066.23065.8060.790
URHD98.140165.20.01298.040.01153.850.01182.810.01365.780.02489.020.02
BARR6.8204.0804.0804.0804.0804.0804.080
WATR27.26027.23027.22027.23027.22027.23027.220
Table 5. Land use changes and dynamics within the study area.
Land Use Type2020–2030 (SSP1,2-6)2020–2030 (SSP2,4-5)2020–2030 (SSP5,8-5)2030–2050 (SSP1,2-6)2030–2050 (SSP2,4-5)2030–2050 (SSP5,8-5)2020–2050 (SSP1,2-6)2020–2050 (SSP2,4-5)2020–2050 (SSP5,8-5)
Area ChangeSingle LUD Index (%)Area ChangeSingle LUD Index (%)Area ChangeSingle LUD Index (%)Area ChangeSingle LUD Index (%)Area ChangeSingle LUD Index (%)Area ChangeSingle LUD Index (%)Area ChangeSingle LUD Index (%)Area ChangeSingle LUD Index (%)Area ChangeSingle LUD Index (%)
(km2)(km2)(km2)(km2)(km2)(km2)(km2)(km2)(km2)
AGRL−81.91−1.3665.591.0957.860.96−289.65−5.57−56.09−0.84−115.96−1.76−371.560.49.50.32−58.1−1.93
FRST119.90.06−39.85−0.02−241.33−0.12146.870.0720.380.01−11.31−0.01266.77−0.93−19.47−0.02−252.64−0.26
PAST−106.82−7.04−83.22−5.48−85.95−5.660.890.2−2.3−0.34−5.02−0.76−105.930.41−85.52−11.27−90.96−11.99
URHD67.066.8355.715.68267.6527.27132.848.0428.961.88123.233.37199.90.3584.6817.26390.8879.66
BARR−2.73−4.01−2.73−4.01−2.73−4.01000000−2.731.13−2.73−8.02−2.73−8.02
WATR−0.03−0.01−0.03−0.01−0.03−0.01−0.010.01−0.010.01−0.010.01−0.04−0.03−0.04−0.03−0.04−0.03
CLUD Index (%)0.090.060.160.140.030.060.460.10.39
Table 6. Swat model parameters and their best values.
Parameter NameStart DateOptimum Value
r__CN2.mgtSCS-CN for moisture condition II−0.16
v__GW_DELAY.gwGroundwater delay time 2.8
v__GWQMN.gwMinimum aquifer depth for groundwater return flow 4.04
v__GW_REVAP.gwGroundwater re-evaporation coefficient0.18
v__ESCO.hruSoil evaporation compensation factor0.88
v__CH_N2.rteManning’s “n” value for main flow channel0.15
v__CH_K2.rteEffective hydraulic conductivity in main channel alluvium125.02
r__SOL_AWC.solSoil available water capacity0.99
r__SOL_K.solSoil hydraulic conductivity−0.17
v__SFTMP.bsnSnowfall temperature2.90
v__SMFMX.bsnMaximum snowmelt factor for June 2110.32
v__SMFMN.bsnMaximum snowmelt factor for December 2120.29
v__TIMP.bsnSnow pack temperature lag factor0.78
v__SURLAG.bsnSurface runoff lag coefficient18.80
r__SOL_Z.solSoil layer depth from surface to bottom0.09
r__CANMX.hruMaximum canopy storage 77.71
v__ALPHA_BF.gwBaseflow alpha factor 0.12
v__SMTMP.bsnSnow melt base temperature5.83
v__SLSUBBSN.hruAverage slope length multiplicative factor47.50
r__BIOMIX.mgtBiological mixing efficiency0.03
v__TLAPS.subTemperature lapse rate 6.89
v__REVAPMN.gwThreshold depth of water in shallow aquifer required to allow re-evaporation to occur432.57
r__SOL_ALB.solMoist soil albedo multiplicative factor0.77
v__EPCO.hruPlant uptake compensation factor0.14
v__ALPHA_BNK.rteAlpha factor for bank storage baseflow0.91
v__SNOCOVMX.bsnThreshold depth of snow at 100% coverage71.67
Note: The parameter modification method v_ is assignment conversion and r_ is multiplication by (1 + rate value).
Table 7. Multi-year average runoff in the Tangwang River Basin for the historical baseline period and multiple future scenarios.
1980–2014
Historical Base Period
2025–2045 Future Climate Scenarios
SSP1,2-6SSP2,4-5SSP5,8-5
Multi-year Average Runoff (m3/s)402.84408.26405.35377.27
Value Of Change5.422.51−25.57
Rate Of Change1.35%0.62%−6.35%
Disclaimer/Publisher’s Note: The statements, opinions and data contained in all publications are solely those of the individual author(s) and contributor(s) and not of MDPI and/or the editor(s). MDPI and/or the editor(s) disclaim responsibility for any injury to people or property resulting from any ideas, methods, instructions or products referred to in the content.