Article

Simulation and Risk Assessment of Flood Disaster at the Entrance to a Rail Transit Station under Extreme Weather Conditions—A Case Study of Wanqingsha Station of Guangzhou Line 18

1
School of Earth Sciences and Engineering, Sun Yat-sen University, Zhuhai 519080, China
2
Southern Marine Science and Engineering Guangdong Laboratory (Zhuhai), Zhuhai 519080, China
3
Guangzhou Metro Design and Research Institute Co., Ltd., Guangzhou 510010, China
*
Author to whom correspondence should be addressed.
Water 2024, 16(14), 2024; https://doi.org/10.3390/w16142024
Submission received: 27 May 2024 / Revised: 9 July 2024 / Accepted: 15 July 2024 / Published: 17 July 2024

Abstract

:
With the rapid development of urbanization and underground transportation, as well as the frequent occurrence of extreme weather conditions such as extreme rainfall, flooding disasters for rail transit are becoming severe, and need to be urgently clarified in terms of the mechanism causing them. In this study, a comprehensive model for water damage at the entrance to a rail transit station is proposed, emphasizing the entire process of extreme weather–surface ponding–underground intrusion. The model is validated by the inundation process of Line 5 of the Zhengzhou Metro during the “7.20” event and further applied to Wanqingsha Station of Guangzhou Metro Line 18 in China to determine the surrounding water depth, distribution, total water inflow volume, and water damage time under different rainfall intensities, rain patterns and protection scenarios. It was found that when rainfall reaches the level of a 1-in-2000-years event, the surface water begins to invade the internal rail transit system through the rail transit entrances. When facing extreme rainfall akin to the “7.20” event in Zhengzhou, the rail transit system in Wanqingsha Station meets a heightened risk of water damage, resulting in significantly deeper water levels compared to 1-in-5000-year rainfall event in Guangzhou and exceeds the height of the subway entrances. Analysis of the water intrusion process reveals that, as rainfall intensity escalates, the total inflow water volume into the rail transit system increases while escape time diminishes. Moreover, under identical rainfall intensity, pre-type rainfall yields the highest total water inflow, whereas mid-type rainfall exhibits the shortest escape time. Enhancing the protection conditions can markedly attenuate surface water intrusion into the subterranean rail transit system, thereby enhancing the evacuation time for individuals within the system.

1. Introduction

Multiple extreme weather factors related to climate change are interacting globally, exacerbating flood risks for numerous coastal cities [1]. With the ongoing warming of the global climate and rapid urbanization, the intensity and frequency of natural disasters are synchronously increasing, amplifying the vulnerability of socio-economic systems. Underground infrastructure projects exhibit greater susceptibility to flooding. Major cities such as New York, Tokyo, Shanghai and Guangzhou have constructed multiple rail transit networks, which are generally located underground and constitute relatively confined places with a limited number of ventilation shafts and entrances directly connected to the outside world. As a semi-enclosed space that is highly susceptible to flooding, the water rises much faster than on the surface when a flood occurs and, in the absence of timely and effective warnings, the time to evacuate and escape will be very limited. This not only results in direct economic losses such as equipment damage and casualties, but also causes indirect losses that are difficult to estimate due to the persistence of post-disaster damage. For instance, following heavy rainfall averaging 60 mm per hour in June 1996, multiple subway lines in Fukuoka were submerged, resulting in severe casualties and property losses [2]; in July 2016, Wuhan Station in Wuhan was submerged [3], and Changpan Station of Guangzhou Metro Line 6 was flooded in May resulting in a direct economic loss around RMB 543.8 million (USD 82,000,000) [4]; in April 2019, Chegongmiao Station of Shenzhen Metro Line 1 experienced flooding, leading to 11 deaths and a two-hour shutdown of Line 1 [5]; in July 2021, extreme rainfall led to severe urban flooding in Zhengzhou, inundating Subway Line 5 and resulting in 14 deaths [6]; in September 2021, Hurricane “Ida” caused backflow in the New York subway, resulting in a total subway shutdown and nine fatalities [7]. Flood disasters in rail transit occur frequently, and the impact of climate change will exacerbate the frequency of extreme weather and urban flood events. Therefore, addressing flood risk in rail transit systems is deemed an urgent issue.
Numerical simulation, as an effective tool for analyzing urban floods, has spurred the development of various models for the hydrological and hydraulic responses of urban drainage systems, such as the Storm Water Management Model (SWMM) [8], InfoWorks [9] and MOUSE [10]. These models differ in the complexity of their control equations for surface runoff, coupling methods [11,12,13,14], rainwater transport handling [15,16,17,18], etc. However, modeling an urban flood process often demands copious information and extensive modeling efforts, typically focusing on specific urban areas, which challenges the direct analysis of the flooding process near the subway. Employing existing models to predict potential flood risks near subway entrances will entail considerable redundant work, further leading to inaccurate predictions. Hence, a more effective calculation model is needed to simulate the flood process near the subway entrance based on the existing urban flood calculation methods.
Findings from the on-site survey indicate that subway station entrances are the initial areas of the rail transit system susceptible to flooding during heavy rainfall [19]. The vulnerability of subway station entrances to water damage directly impacts the safety of subway lines. Research on flood risks for subway systems commenced in the early 1990s in Japan. Herath and Dutta [20] developed an urban flood model that incorporated underground spaces; Toka [21] proposed a “reservoir model” using multiple interconnected reservoirs to represent a three-dimensional model of underground spaces; Ishigaki [22] conducted experiments on surface flooding processes for two scenarios, with and without underground spaces, using a 1:100 scale model of central Tokyo. Research on rail transit system flooding analysis in other areas started later and lacked studies on surface–underground coupled flood risk assessments focusing on subway entrances. Quan [19] reproduced the flooding events in the main urban area of Shanghai under three different conditions using a simplified urban flooding model and evaluated subway flooding risks based on the frequency of flooding occurrence; Ozaki [23] analyzed inundation events of underground infrastructure using three types of rainfall models; Li [24] studied the impact of a 1-in-100-years rainfall event on subway passenger flow using Shanghai as an example; Lyu [12] analyzed the distribution of flood risks in the Guangzhou subway system combining GIS and SWMM; Sun [25] developed the Subway Travel Risk Index (STRI) by considering flood probability, subway travel exposure index and population vulnerability index to model the risk of subway travel in Shenzhen; Marttello and Whittle [26] evaluated the risk of water damage to coastal rail transit systems by analyzing flood losses under a projected sea level rise.
Although research on subway system flood disasters is continuously developing, studies on flooding events affecting subway systems are relatively scarce, and there is a dearth of research on the correlation between climate change and harm to subway systems [27]. Therefore, this paper combines extreme weather conditions for systematic research, constructs a model of the rail transit system water damage process under extreme weather conditions, and formulates reliable flood risk assessments to enhance the rail transit system’s ability to withstand future flood disasters. In particular, the surface ponding process and water intrusion process around Exit A of Wanqingsha Station of Line 18 of the Guangzhou Metro were investigated under different extreme rainfall conditions. The differences in water inflow volume and the disaster time within the rail transit system were evaluated under different rainfall intensities and patterns. In Section 2, the calculation process of the model is described, and the reliability of the model is verified by the ‘7.20 Metro Line 5 flooding event’ in Zhengzhou. In Section 3, the study area and parameter selection of this study are explained. In Section 4, the risk of water damage at Exit A of Wanqingsha Station under extreme rainfall conditions is analyzed. Finally, the discussion and conclusions are presented.

2. Methodology

This paper proposes a new calculation model for rail transit water damage aimed at simulating the flooding process around subway station entrances, as well as surface flooding intrusion into the rail transit system through the entrance under extreme weather conditions. The model consists of two parts: the ponding model and the inundation model at the rail transit station entrance, as depicted in Figure 1. The ponding model incorporates the Horton infiltration model, the equivalent drainage model, the tide–storm surge–river boundary model (Figure 1b), the reservoir model (Figure 1c) and the simplified runoff model, which are primarily utilized to calculate the depth and distribution of water around the entrances to the rail transit system under composite extreme weather conditions (including rainfall, typhoons, storm surges and river damming). The inundation model (Figure 1d) is primarily employed to determine the unit discharge, total water inflow volume and time of water damage from the surface into the underground through the rail transit entrance under specific ponding water depth conditions.

2.1. Ponding Model around Rail Transit Station Entrances

The model utilizes a grid-based flow algorithm, which divides sub-catchments based on topography, building distribution and land types surrounding subway entrances. The topographic data utilized in this study were sourced from the Geospatial Data Cloud “http://www.gscloud.cn/ (accessed on 30 September 2023)”, while land types were derived from remote sensing image data. The hydrological responses of these subdivided areas are treated as independent, facilitating the capture of spatial parameter variation effect on flow development. Urban areas typically comprise various surface types. In this study, surfaces are classified into three main categories: pervious surfaces, impervious surfaces with depression storage and impervious surfaces without depression storage. Sub-catchments typically consist of multiple surface types, each representing a distinct form of flow production. In this study, hydrological processes within the sub-catchment are computed by partitioning the computational grid based on the various surface types. The hydrological characteristics across the entire study area are represented by overlaying the hydrological responses of each sub-catchment.

2.1.1. Introduction to Sub-Models

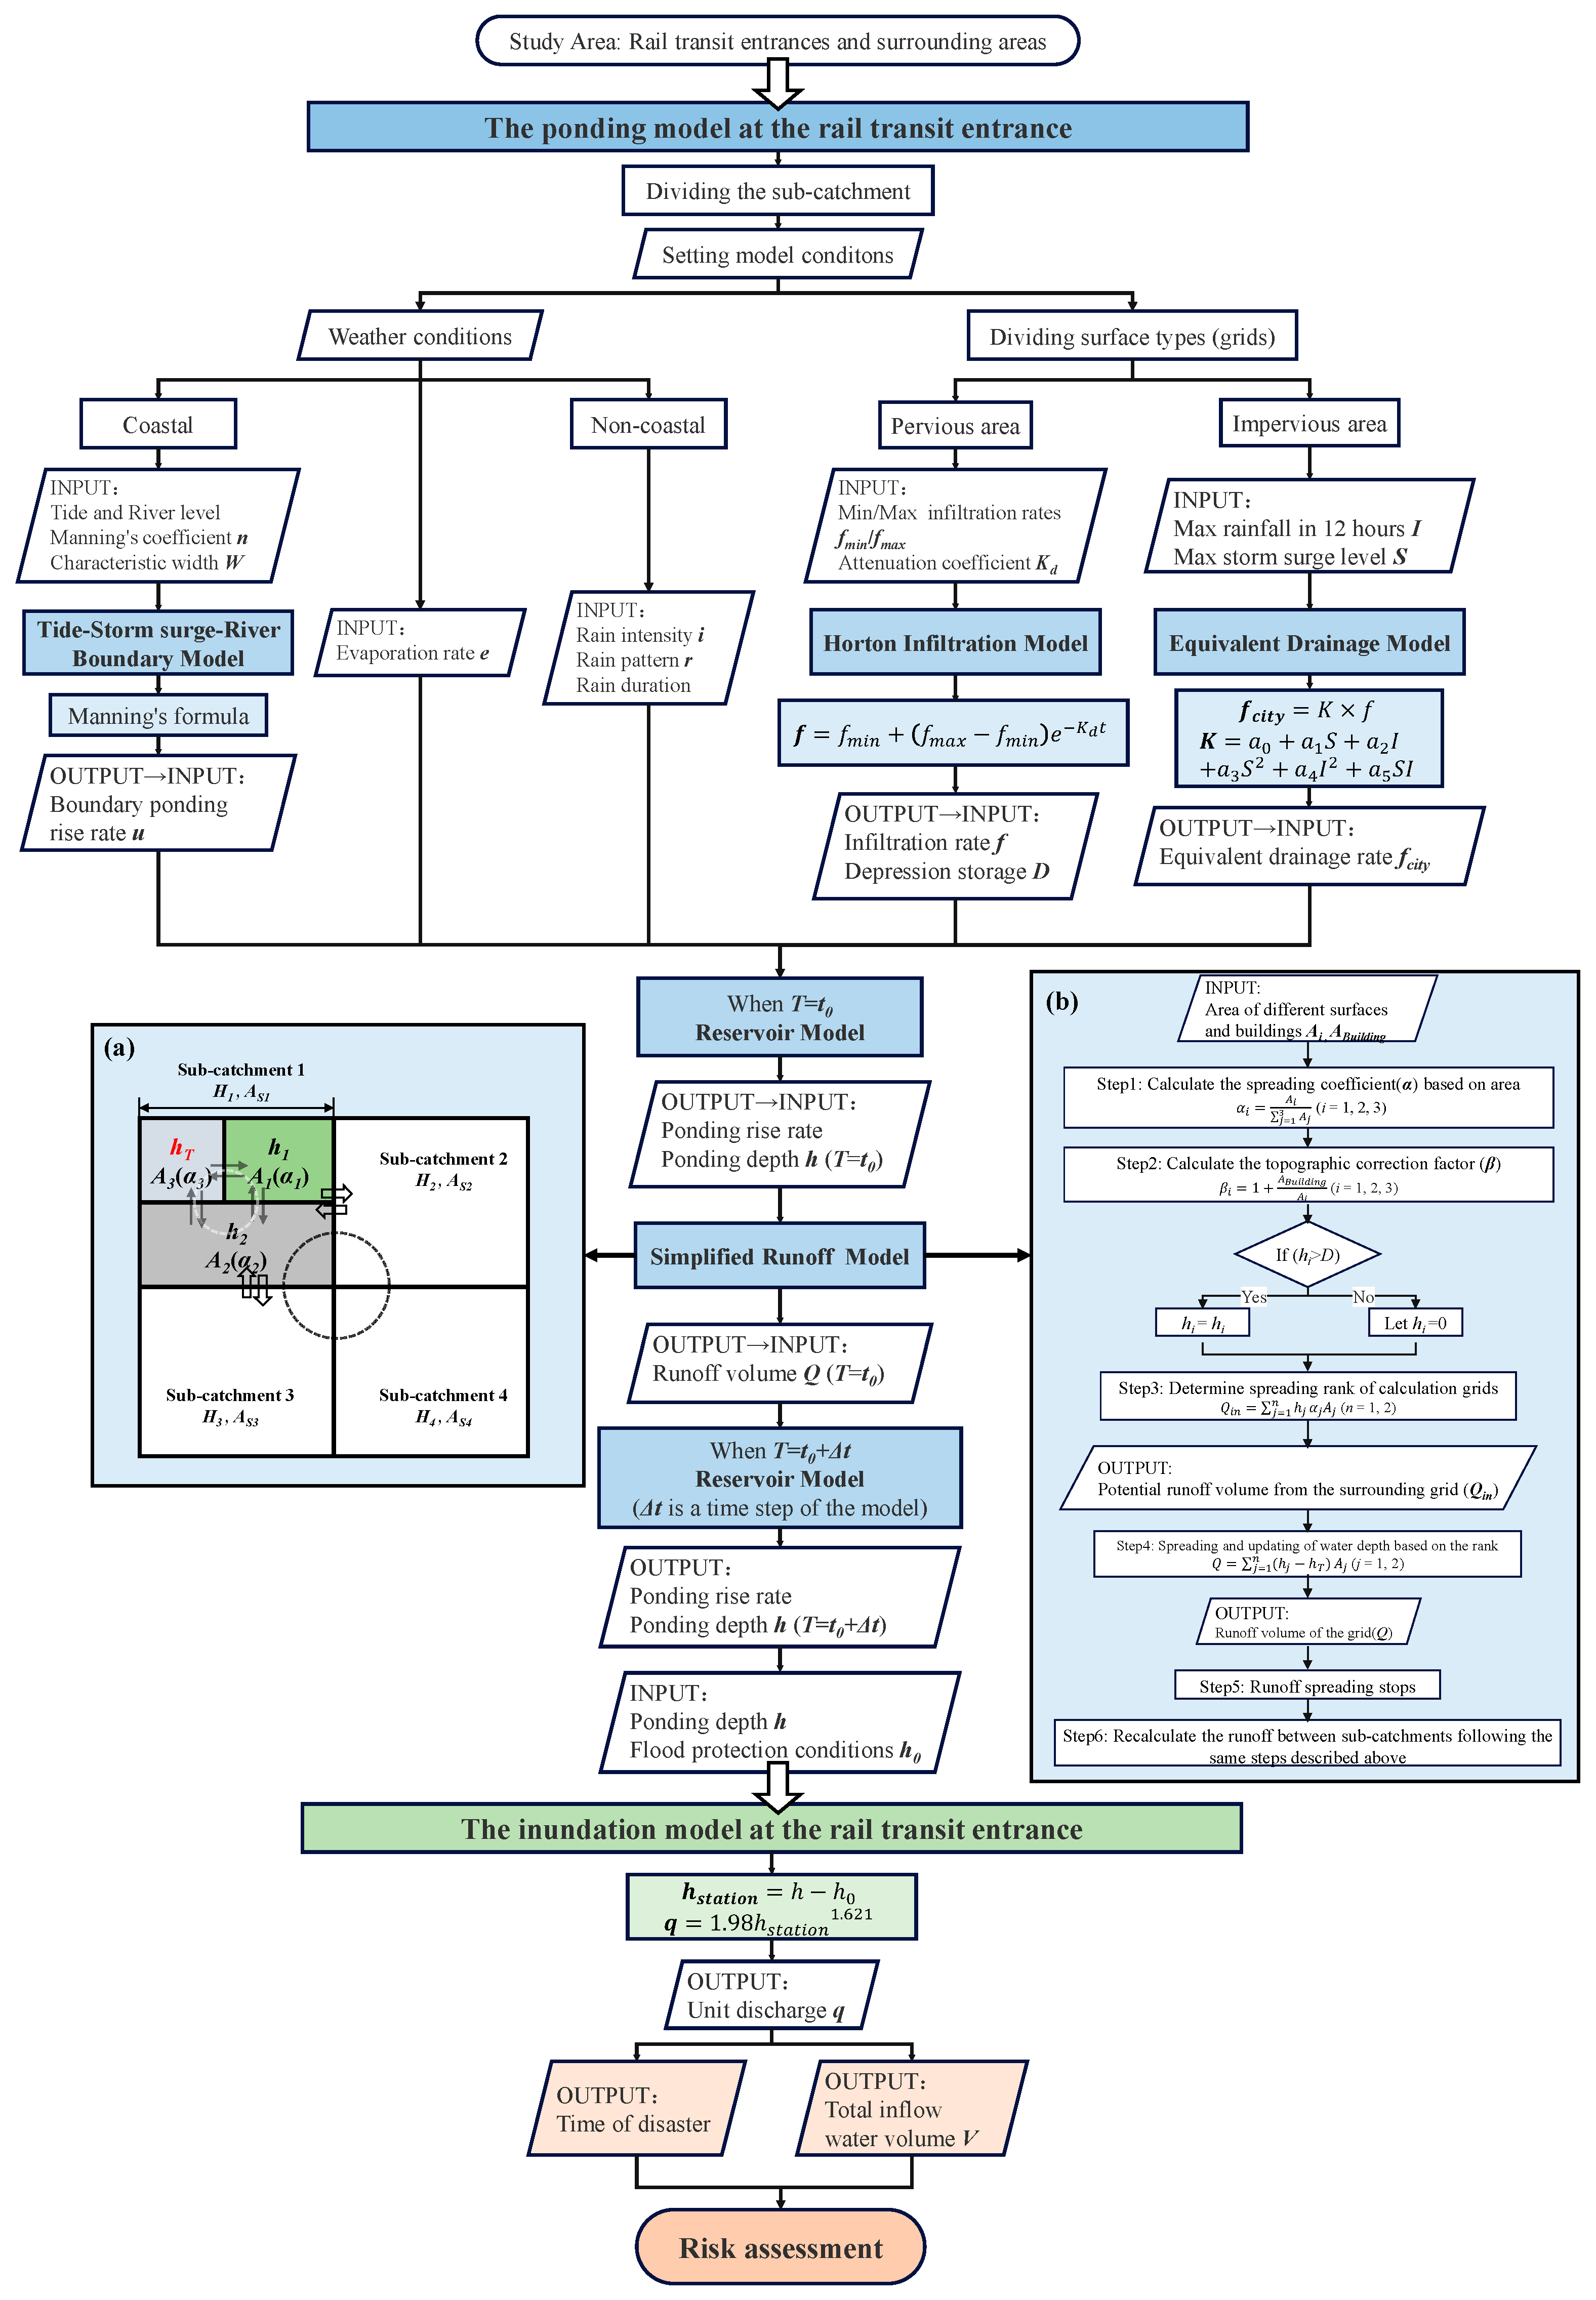
The computational flow of the model is depicted in Figure 2. Specifically, the ponding model encompasses the computation of flow production and confluence. An appropriate method for calculating infiltration, surface depression storage and surface evaporation following rainfall events is crucial for accurately determining flow production. In this study, the reservoir model is adopted, wherein the sub-catchment area is conceptualized as a reservoir with a defined storage capacity. The inflow to the reservoir comprises rainfall within the sub-catchment area, water exchange at the river–sea boundary and flow from other sub-catchment areas. The outflow from the reservoir encompasses evaporation, infiltration and surface runoff, as illustrated in Figure 1c. For each individual reservoir, the inflow, outflow and storage capacity adhere to the law of conservation of mass, ensuring water balance, which is crucial for accurately calculating water yield.
Specifically, the Horton infiltration model is employed to calculate the soil infiltration rate (f) for pervious surfaces in the study area [28]. For impervious surfaces, to enhance the modeling process of the drainage network and account for the impact of coupled rainfall and storm surge on drainage efficiency, the equivalent drainage rate (fcity) of urban man-made surfaces is derived by simulating drainage capacity equivalently through enhanced infiltration, which is achieved using the equivalent drainage model proposed by Qiang et al. [1]. To address the impact of coupled extreme weather in coastal cities, the astronomical tide–storm surge–river boundary model utilizes Manning’s formula to compute the water volume process (accumulation rise rate u) due to the river and storm surge damming under various breach sizes. When inundation depths vary among different grids/sub-catchments, water exchange occurs between these zones. The runoff diffusion (Q) between sub-catchments is computed using the simplified runoff model proposed in this paper, as depicted in Figure 2a,b. Here, A1, A2 and A3 represent the pervious area, depressed impervious area and undepressed impervious area, respectively.

2.1.2. Coupling of Waterlogging Processes

The ponding model computes the water ponding process around the entrance by integrating the five sub-models mentioned above. The process of computing water depth and distribution through these sub-models is explained below. In the study area, the rainfall intensity (i), evaporation rate (e) and infiltration rate (f), calculated by the Horton model, the equivalent drainage rate (fcity), calculated by the equivalent drainage model at T = t0 and the runoff volume (Q), calculated by the simplified runoff model at T = t0 + ∆t (where T = 0, the runoff volume is 0; ∆t is a computational step set by the model), are input into the reservoir model to compute the ponding rise rate in each computational grid at T = t0 (Equations (1) and (2)). By integrating the ponding rise rate within a calculation step, the ponding depth is output (Equation (3)). Subsequently, the ponding depth at T = t0, the depression storage and the building area in each computational grid are input into the simplified runoff model to compute the runoff volume between each calculation grid and each sub-catchment at T = t0. Finally, utilize the runoff volume at T = t0 as an input parameter, update the above input parameters, and input them into the reservoir model to calculate the water ponding rate and depth for the next calculation step, serving as the output of the model at T = t0 + ∆t.
Rate of ponding water rise:
(a) For a pervious surface
h t = i + ( u ) f e + ( Q / A i ) t
(b) For an impervious surface
h t = β × ( i + ( u ) f c i t y e + ( Q / A i ) t )
Ponding depth:
h | T = t 0 + t = t 0 t 0 + t h t d t
where h is the depth of the ponding water, m; i is the rainfall intensity, m/s; u is the rate of ponding rise at the river–storm surge boundary, m/s; f is the infiltration rate, m/s; β is the topographic correction coefficient; fcity is the equivalent drainage rate, m/s; e is the rate of evaporation, m/s; Q is the runoff volume, m3; Ai is the area corresponding to different types of land, m2; and ∆t is the computational step.

2.2. Inundation Model

Following the computation of the waterlogging process using the ponding model, the ponding depth serves as an input parameter for inundation model at the rail transit entrance. This model calculates the waterlogging intrusion process by incorporating the input protection height. The total inflow water volume and disaster duration are determined based on the calculated unit discharge.
The depth of inundation surrounding metro stations serves as a basis for calculating the risk of water intrusion into the rail transit system (Figure 1d). As the specification for urban rail transit engineering projects (GB 55033-2022) [29] and the metro design code (GB 50157-2013) [30], waterproofing measures for metro station entrances primarily comprise step heightening, anti-flooding baffles, drainage systems and anti-flooding doors. Based on on-site investigations conducted along Line 18 in Guangzhou, it was found that most subway station entrances are only equipped with 0.3~0.45 m steps and anti-flooding doors. Consequently, Equation (4) is proposed to compute the inundation depth around subway stations.
        h s t a t i o n = h h 0
where hstation is the inundation depth of the entrance of the subway station, m; h is the surface flood depth, m; h0 is the height of the entrance defense, m.
The calculation of water intrusion to the subway station is conducted by Ishigaki’s equation [22], which describes the relationship between inundation depth and intrusion flow at the entrance. This equation is based on a model of a real-size staircase, and is represented by Equation (5).
      q = 1.98 h s t a t i o n 1.621
where q is the unit discharge, m3/s/m.
In this section, the construction of the model for assessing water damage in the rail transit system under extreme weather conditions is described. The details for the flood risk assessment, which is based on the unit discharge, total inflow water volume and the disaster time calculated by the model, is provided in Section 4.2.

2.3. Model Validation

From 19 to 21 July 2021, an unprecedented amount of rainfall occurred in Zhengzhou, China. On the 20th, the maximum daily rainfall at the Zhengzhou National Meteorological Station (ZNMS) was 624.1 mm, which was close to the average annual rainfall in Zhengzhou City and 3.4 times the maximum since the station was established. Between 16:00 and 17:00 on 20 July, ZNMS recorded an hourly rainfall of 201.9 mm, breaking China’s historical hourly rainfall record. Caused by the extreme rainfall, severe flooding occurred in and around the Wulongkou parking lot of Zhengzhou Metro Line 5 on the 20th. A number of temporary barriers collapsed, and the surrounding floodwaters converged into Zhengzhou Metro Line 5 through the breached wall, ultimately leading to 14 deaths [31]. To validate the proposed model, this paper utilizes the tunnel entrance of Metro Line 5 in the Wulongkou parking lot in Zhengzhou and its surrounding area as a case study. A rail transit water damage calculation model is established based on this issue, wherein the water damage process of the rail transit station in this area aligns with the calculation process of “extreme rainfall-surface ponding-ponded water intrusion into the rail transit system” as the model. The model incorporates various parameters and inputs, including the rainfall process in Zhengzhou from 8:00 a.m. on 20 July to 8:00 a.m. on 21 July 2021, as depicted in a 24 h rainfall calendar (Figure 3a). Additionally, data regarding infiltration parameters in Zhengzhou [32], the drainage processes [33], the evaporation rates, the depression storage volume and the height of the collapsed retaining wall at the tunnel entrance [31] are integrated into the model. During the extreme rainstorm event, the flooding process around the Wulongkou parking lot and the water intrusion process into Metro Line 5 through the tunnel entrance are calculated, and the results are presented in Figure 3.
The distribution of extreme rainfall and the process of ponding rise at the entrance of the tunnel of Metro Line 5 during the specified period are illustrated in Figure 3a. The actual ponding rise process and the maximum intrusion flow rate are sourced from news reports on public websites (e.g., Google and Baidu) and from previous research [33,34,35]. Upon comparing the simulation results with the actual process (Figure 3a), it was observed that before 20:00 on the 20th, the simulation results align with the actual water accumulation process. To further validate the accuracy of the model, the root mean square error (RMSE) between the 12 simulated and actual values for the period was calculated, as shown in Equation 6. The results show that the RMSE is 0.03809, which is less than 0.1, indicating that the error is small and that the model can accurately predict the depth of surface ponding. However, after 20:00, the actual water accumulation process and the final depth of water accumulation surpass the simulation results. This discrepancy may stem from the ponding model’s inability to consider the collapsing effect of the retaining wall around the tunnel at 18:00, which impacts the rising process around the entrance. Consequently, the simulated water depth gradually becomes smaller than the actual water depth over time. To address this, the inundation model can simulate the collapse of the tunnel’s peripheral retaining wall by adjusting the height of the protection (h0). After updating the results, it is evident from Figure 3b that the flow rate of water intrusion rises rapidly after 18:00, with the simulation results of the maximum water intrusion flow rate aligning closely with the actual flow rate. Additionally, the spatial distribution of the simulated water in the area around the Wulongkou parking lot is depicted in Figure 3c. The simulated water depth on the southwest side of the Lantian Road and Huanbao Road intersection is 0.96 m (corresponding to a field investigation depth of 1.2 m). Additionally, the simulated water depth of the Wulongkou nullah on the northeast side of the intersection is 0.8 m (matching a field investigation depth of 1.0 m). The simulated water depth at specific locations corresponds well with field investigation data.
RMSE = 1 n i = 1 n ( y i y ^ i ) 2
where RMSE is the root mean square error; yi is the actual value, ŷi is the predicted value and n is the sample size.
In summary, based on the findings from the investigation of flooding during the “7.20” heavy rainstorm, the study employs a waterlogging analysis model to calculate surface flooding, subway intrusion flow and the spatial distribution of the flooding for comparative analysis. Overall, the proposed rail transit water damage model demonstrates a high level of reasonability and credibility. It can effectively be utilized for analyzing water damage in rail transit systems.

3. Study Area and Parameters

3.1. Study Area

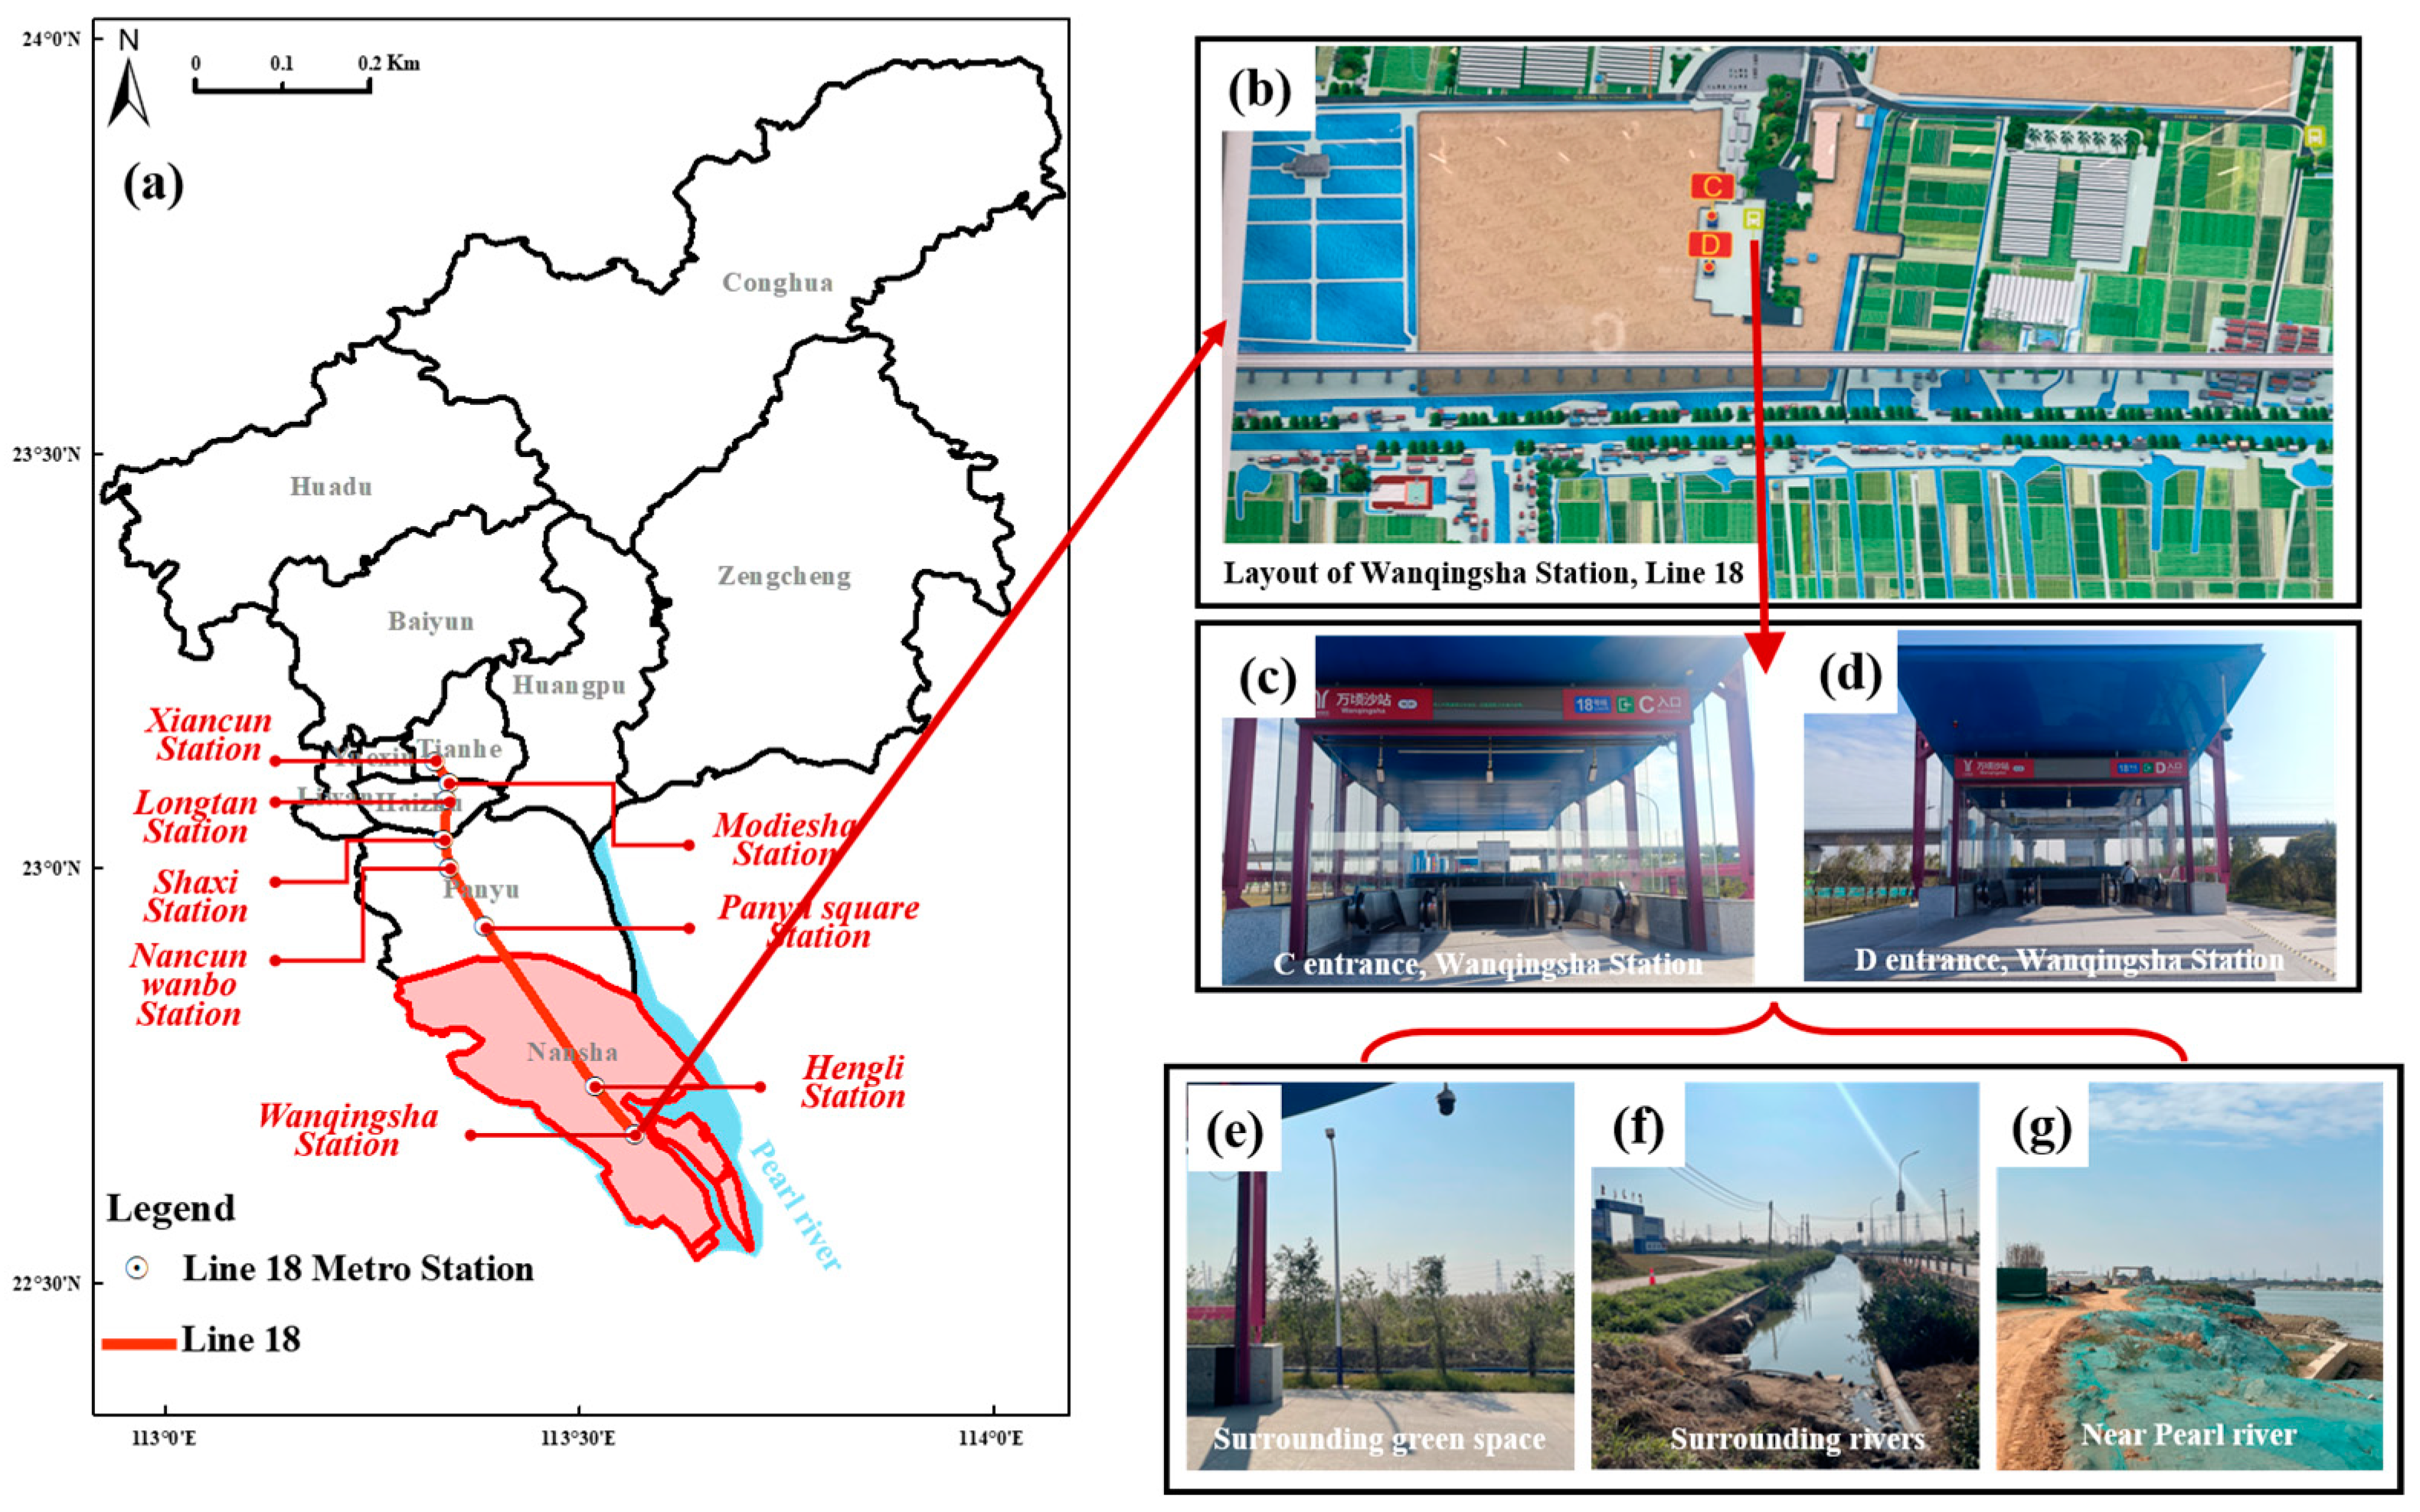
Guangzhou, situated in the Pearl River Delta, China, is a coastal city positioned between latitude 22°50′ N and longitudes 112°50′ E~114°20′ E. The city spans a total area of 7434.4 square kilometers, encompassing four districts in the city center and seven districts in the suburbs (Figure 4a). Remarkably, Guangzhou ranks among the top three first-tier cities in China for metro operations and also stands as one of the most flood-prone coastal cities [36]. Guangzhou Metro Line 18 stands as China’s inaugural fully underground urban express line, boasting a speed of 160 km/h [37]. Stretching from Xiancun Station to Wanqingsha Station (Figure 4a). Wanqingsha Station, located in Nansha District, features four entrances, labeled as A, B, C and D in Figure 4b, and is closely surrounded by numerous waterways (Figure 4e–g). Given its proximity to the Pearl River Delta, Wanqingsha Station is susceptible to direct impacts from tropical cyclones, which occur frequently from June to November each year. This paper focuses on Wanqingsha Station as the subject of a study on rail transit flooding disasters, and aims to assess the risk of rail transit flooding under extreme weather conditions and offer valuable insights for the future extension of Line 18.
In this study, the rail transit water damage model is established around Exit A of Wanqingsha Station of Guangzhou Metro Line 18 with a simulation scale of 6450 m2. Four sub-catchments are established around the entrance, with the area of the sub-catchments ranging from 1237.9 to 2009.6 m2, and each sub-catchment is further divided into calculation grids based on terrain and surface type.

3.2. Extreme Rainfall Conditions

Precipitation serves as a key external factor influencing flooding occurrences. The Chicago rain pattern is commonly employed to construct the rainfall distribution, aiding in the calibration of peak rainfall intensity and precipitation volume before and after the peak for various reappearing periods [38]. According to the technical report on the study of preparation and design of heavy rainfall patterns in Guangzhou published by the Guangzhou Municipal Water Affairs Bureau [39], the Guangzhou rainstorm intensity equation can be expressed as:
i = 43.301 × ( 1 + 0.555 lg P ) ( t + 29.342 ) 0.841
where, i is the design rainfall intensity, mm/min; P is the reappearing period, a; t is the rainfall duration, min.
Considering the temporal variability of rainfall, the coefficient r for the peak location of rainfall can elucidate the proportion of time when precipitation peaks occur relative to the total calendar time, expressed as:
r = t m a x t
where, r is the rain peak location coefficient; tmax is the moment when the precipitation peak occurs, min.
In this paper, the rainfall intensity from a 1-in-500-years to a 1-in-5000-years event for 24 h is used, i.e., P in Equation (7) takes the values of 500, 1000, 2000, 3000, 4000, and 5000. Additionally, three distinct rainfall peak scenarios, denoted as pre-type, mid-type and late-type, are characterized by r values of 0.25, 0.5 and 0.75, respectively. Consequently, a total of 18 rainfall scenarios are devised for simulation, reflecting the combination of six different rainfall intensities and three rain patterns.

3.3. Model Parameter Selection

Table 1 gives the range of values and profile of the parameters required in this study.

4. Results

4.1. Inundation Extent and Depth

The rail transit water damage model was established around Exit A of Wanqingsha Station of Guangzhou Line 18. Entrance A of Wanqingsha Station was first divided into four sub-catchments, and the computational grids were further divided according to the land types within each sub-catchment. To compare the differences in ponding processes under different rainfall conditions, through simulations involving various rainfall intensities and patterns, the depth and rate of water ponding around the subway station entrance was quantitatively characterized. Subsequently, the risk of water damage at Wanqingsha Station was assessed under extreme rainfall conditions.
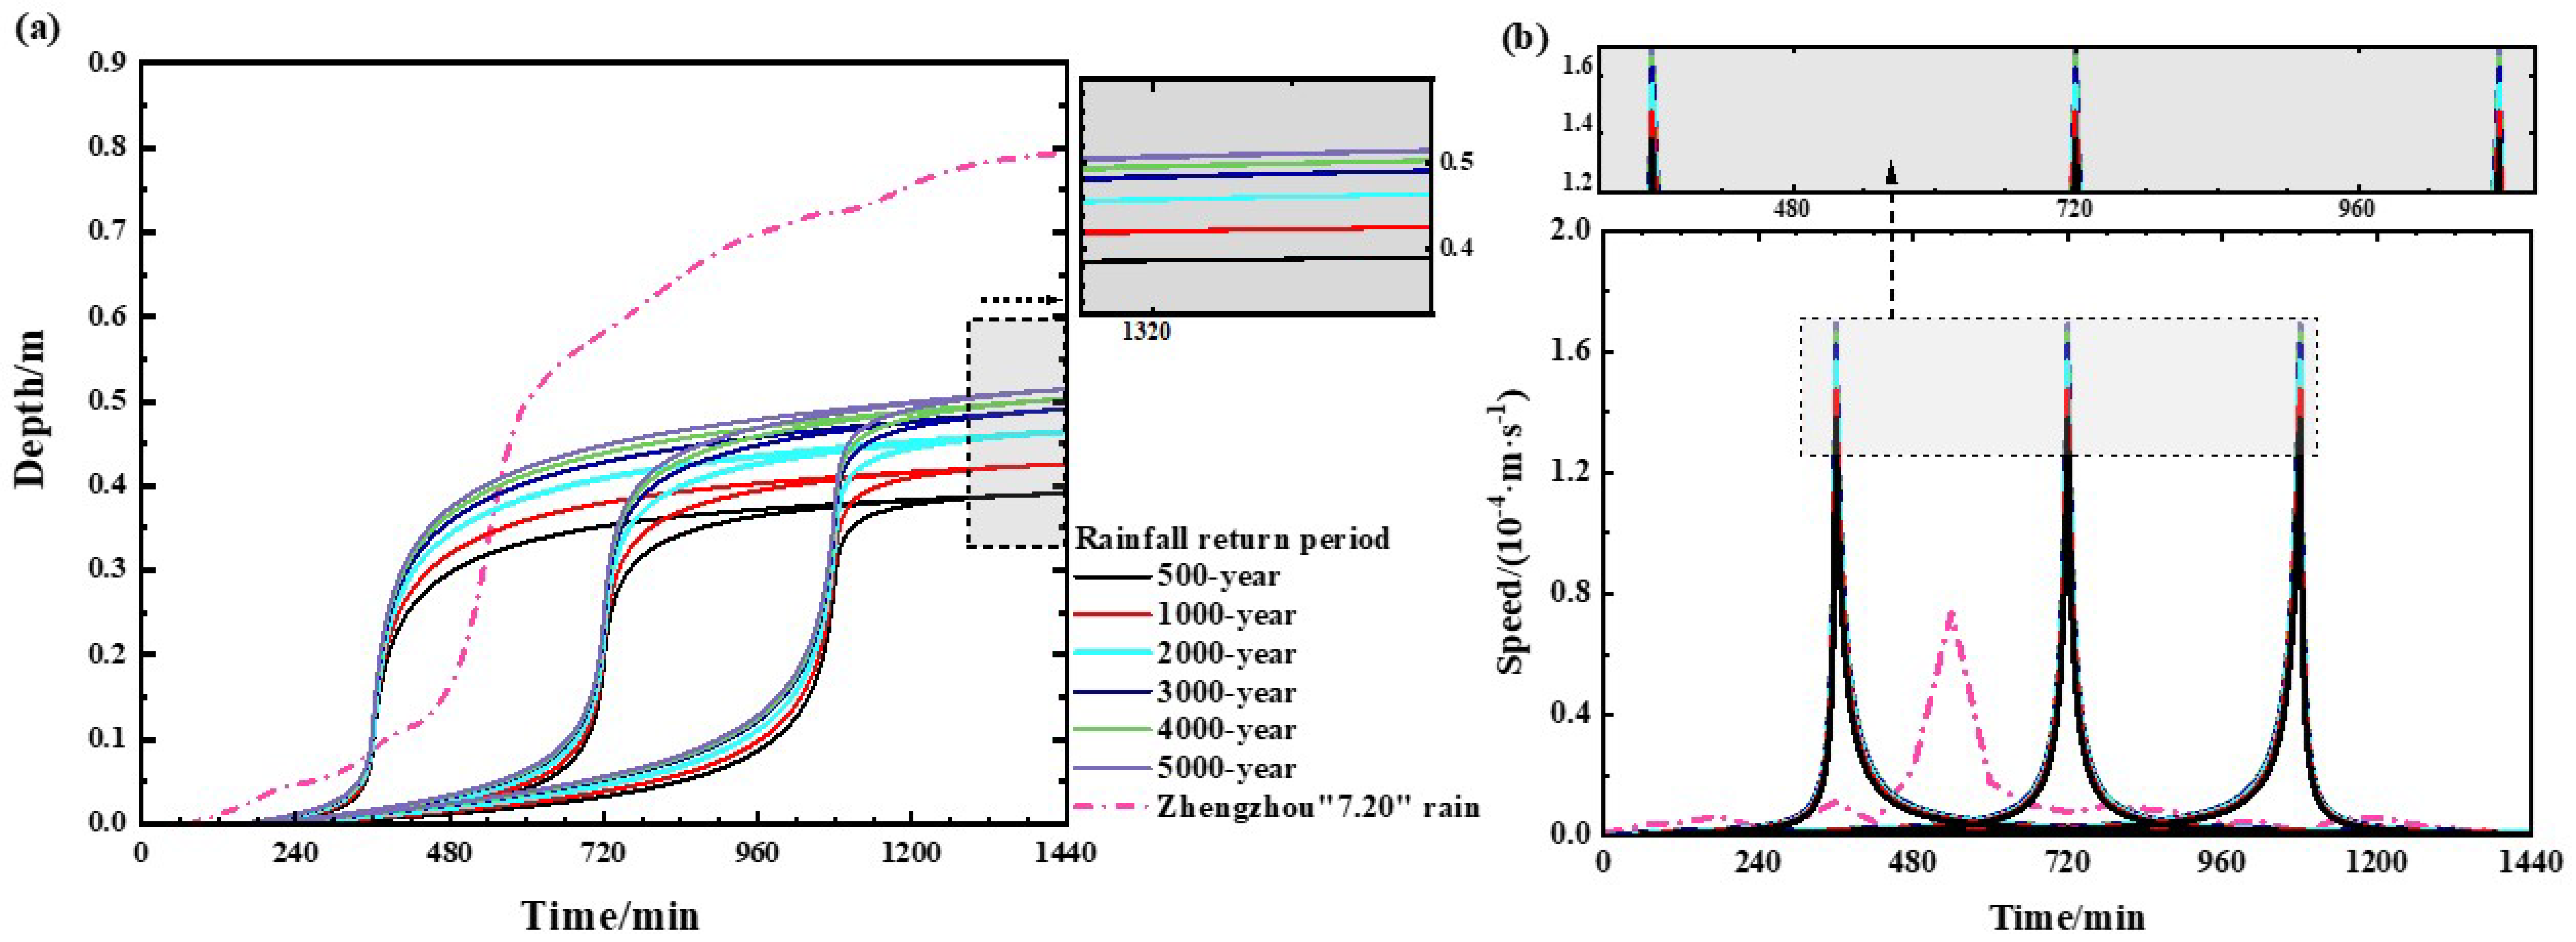
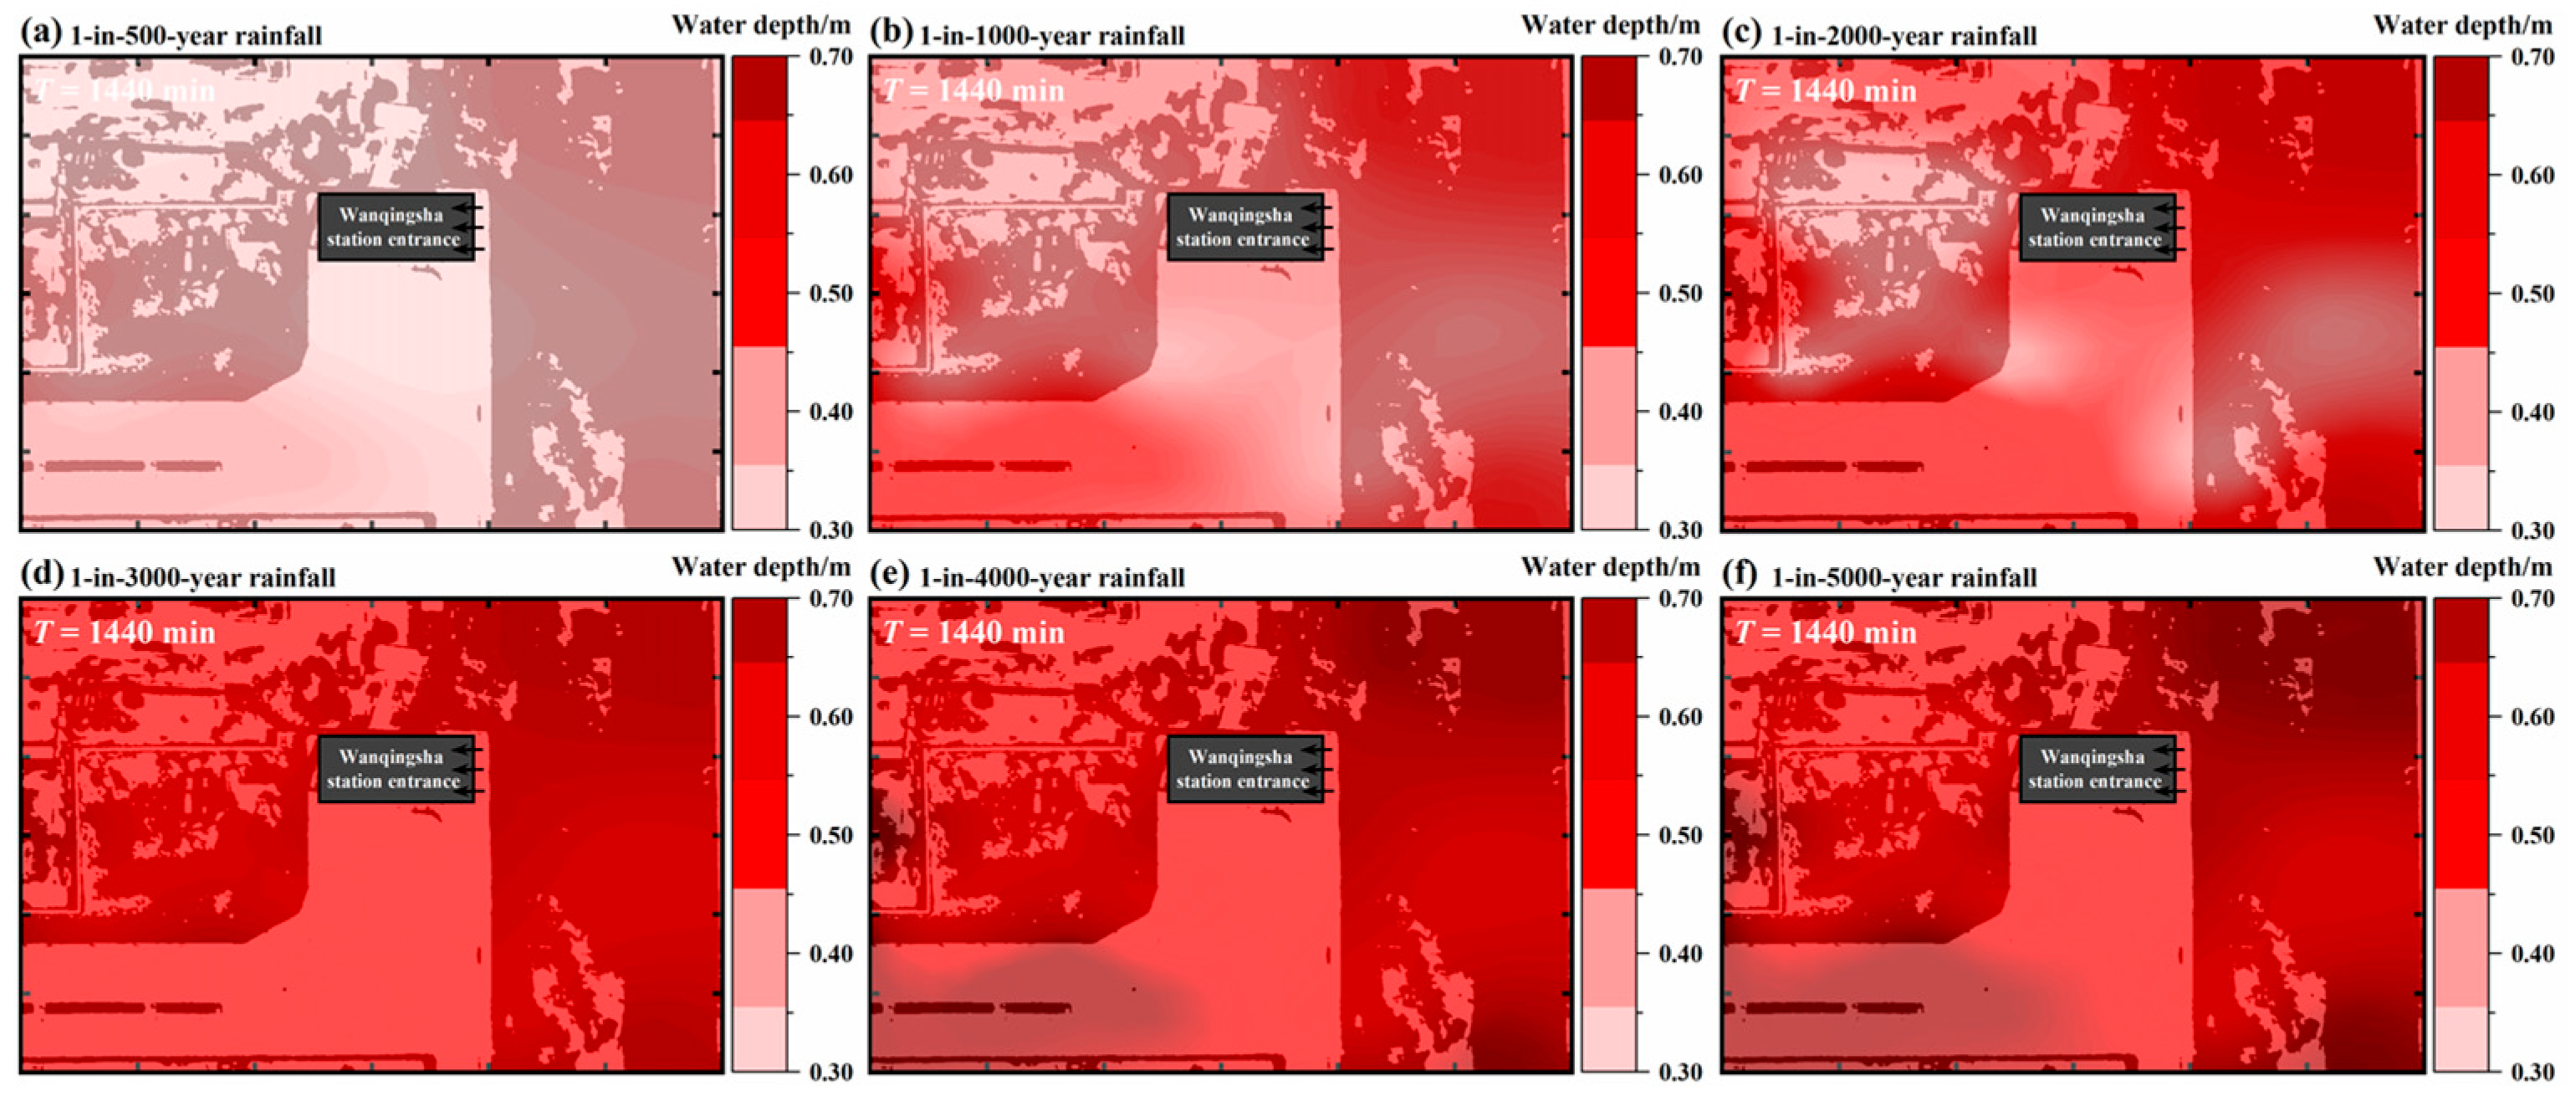
The “Operational provisions on short-term proximity weather forecasting” by the China Meteorological Administration (CMA) defines precipitation with a 1 h amount equal to or exceeding 20 mm as short-term heavy precipitation [43]. In compliance with these regulations, rainfall with a return period of 500-year or more is adopted as the criterion for extreme rainfall in this study. As outlined in Section 3.2, a total of 18 rainfall scenarios are devised. Simultaneously, the extreme rainfall event of “7.20” in Zhengzhou is applied within the study area to evaluate the resilience of the Guangzhou rail transit entrance to water damage caused by extreme rainfall. As depicted in Figure 5, when rainfall attains the level of a 1-in-500-year event, the water depth at the subway entrance measures 0.39 m, still below the height of the entrance steps (0.45 m). Moreover, under various rainfall patterns, although there are notable differences in the water ponding process, the disparities in both the depth and rate of ponding are minimal (Figure 5). For instance, under the conditions of a 1-in-500-year rainfall event, ponding depths are 0.390 m, 0.3911 m and 0.3913 m for pre-type, mid-type and late-type rainfall, respectively, demonstrating slight variations. However, as the reappearing period escalates, such as during a 1-in-2000-year rainfall event, ponding depths at the subway entrance range from 0.46 m to 0.47 m (Figure 6c), surpassing the step height and initiating water intrusion into the subway system. In scenarios of 1-in-3000-years, 1-in-4000-year and 1-in-5000-year rainfall events, ponding depths at the entrance reach 0.49 m, 0.50 m and 0.51 m, respectively, with negligible alteration in neighboring ponding distribution (Figure 6d–f), and minor differences in the maximum ponding rise rate. It is evident that beyond a certain reappearing period threshold, further increases do not significantly augment ponding depths and rates around subway entrances. To ascertain the water damage risk in the rail transit system under extreme rainfall conditions, the waterlogging process at subway entrances during the “7.20” extreme rainfall event in Zhengzhou (Figure 5) is examined. At this juncture, even though the maximum ponding rise rate is much lower than in the other scenarios, the water depth at subway entrances notably increases to 0.794 m, surpassing the depth during a 1-in-5000-year rainfall conditions, as well as the current defense height of the subway entrances.
Based on the simulation findings regarding the extent and depth of water accumulation around rail transit station entrances under various rainfall intensities and patterns, it is evident that the rail transit system remains susceptible to flood intrusion, particularly under the influence of extreme rainfall events. Furthermore, despite the existing rainfall intensity standards in Guangzhou City, flooding does not pose significant water damage risk to the rail transit system in the region, rail transit entrances begin exhibiting signs of waterlogging in the presence of a rainfall reappearing period exceeding 1-in-2000-years events (protection height of 0.45 m). Although different rainfall patterns exert minimal influence on the final extent and depth of waterlogging around rail transit entrances, pre-type rainfall patterns tend to reach maximum waterlogging depths the earliest. While current waterproofing measures effectively deter flooding from rainfall events with reappearing periods of less than 1-in-2000-years, they prove inadequate in preventing surface intrusion into the rail transit system during extreme rainfall events akin to Zhengzhou’s “7.20”.

4.2. Volume and Duration of Water Intrusion

To analyze the risk of water intrusion to the rail transit system under various scenarios, calculations are performed to determine the unit discharge and total inflow water volume of floodwater intruding into the underground through the rail transit entrance under different rainfall intensities, patterns and protection conditions. Guided by the safe escape criteria proposed by TODA [44], different unit discharges are assessed; that is, a unit discharge of q = 0.05 m3/s/m indicates a “safe situation for escape”, q = 0.28 m3/s/m denotes a “critical situation for escape”, and q = 0.60 m3/s/m signifies an “extreme situation for escape”. Moreover, considering the “Japan trial law for evacuation safety in the event of water encroachment in underground spaces” [45], the time at which surface water reaches 0.1 m is designated as the “time to realize the disaster” [46,47]. The time of disaster is determined by integrating these two criteria to assess water damage at a rail transit station entrance under various conditions.

4.2.1. Impact of Extreme Rainfall

The findings from Section 4.1 indicate that the water accumulation around subway entrances, calculated solely under existing rainfall intensity in Guangzhou, scarcely surpasses the step height, thus averting flooding inside the subway system. To visually compare and analyze the flood risk induced by various rainfall intensities and types on the rail transit system, an assumption is made wherein the step height at the subway entrance is set to 0 m. Subsequently, calculations of the subway’s inflow water volume under different rainfall conditions are presented in Figure 7a,b, along with the corresponding time of disaster depicted in Figure 8a,b. Additionally, considering actual protection conditions, the rail transit system’s inflow water volume when the rainfall reappearing period exceeds 1-in-2000-years is computed, as illustrated in Figure 7c.
In Figure 7a, the unit discharge q and total water inflow volume V of the rail transit system are depicted for various rainfall patterns under 1-in-500-years conditions. Notably, the maximum value of q remains consistent, though variations exist in the q changing process under different rainfall patterns. Specifically, under the same rainfall intensity, pre-type rainfall yields the largest total inflow water volume V of 95,180.6 m3, while post-type rainfall results in the smallest volume of 39,194.3 m3, a difference of up to 55,986.3 m3. Figure 7b presents the unit discharge q and total water inflow volume V of floodwater under different rainfall intensities. It is observed that both q and V increase with the rise in rainfall intensity. The most notable increment in total water inflow volume is 14,590.43 m3 occurring from 1-in-1000-year to 1-in-2000-year rainfall. However, the increment is only 4821.24 m³ when the return period is increased from 4000 to 5000 years. Figure 7c illustrates a significant decrease in total inflow water volume after the height of the subway entrance is elevated. Taking the 1-in-2000-year rainfall as an example, the surface water under this scenario just exceeds the existing protection condition, and the total inflow water volume rapidly decreases from 122,772 m3 to 52 m3, which basically does not pose a threat. In summary, the volume of surface floodwater intrusion into the rail transit system through subway entrances rises with increasing rainfall intensity, and the increase gradually decreases. Under identical rainfall intensity conditions, pre-type rainfall induces the largest floodwater intrusion, and with the rainfall peak shifting forward, the economic losses suffered within the rail transit system will increase as a result. Additionally, elevating the height of entrance steps effectively diminishes the risk of water damage to rail transportation caused by rainfall. The reduction in water damage amounts to 122,720 m³ under the condition of a 1-in-2000-year rainfall. This indicates that the existing protection standard can alleviate most of the current risk of water damage caused by rainfall.
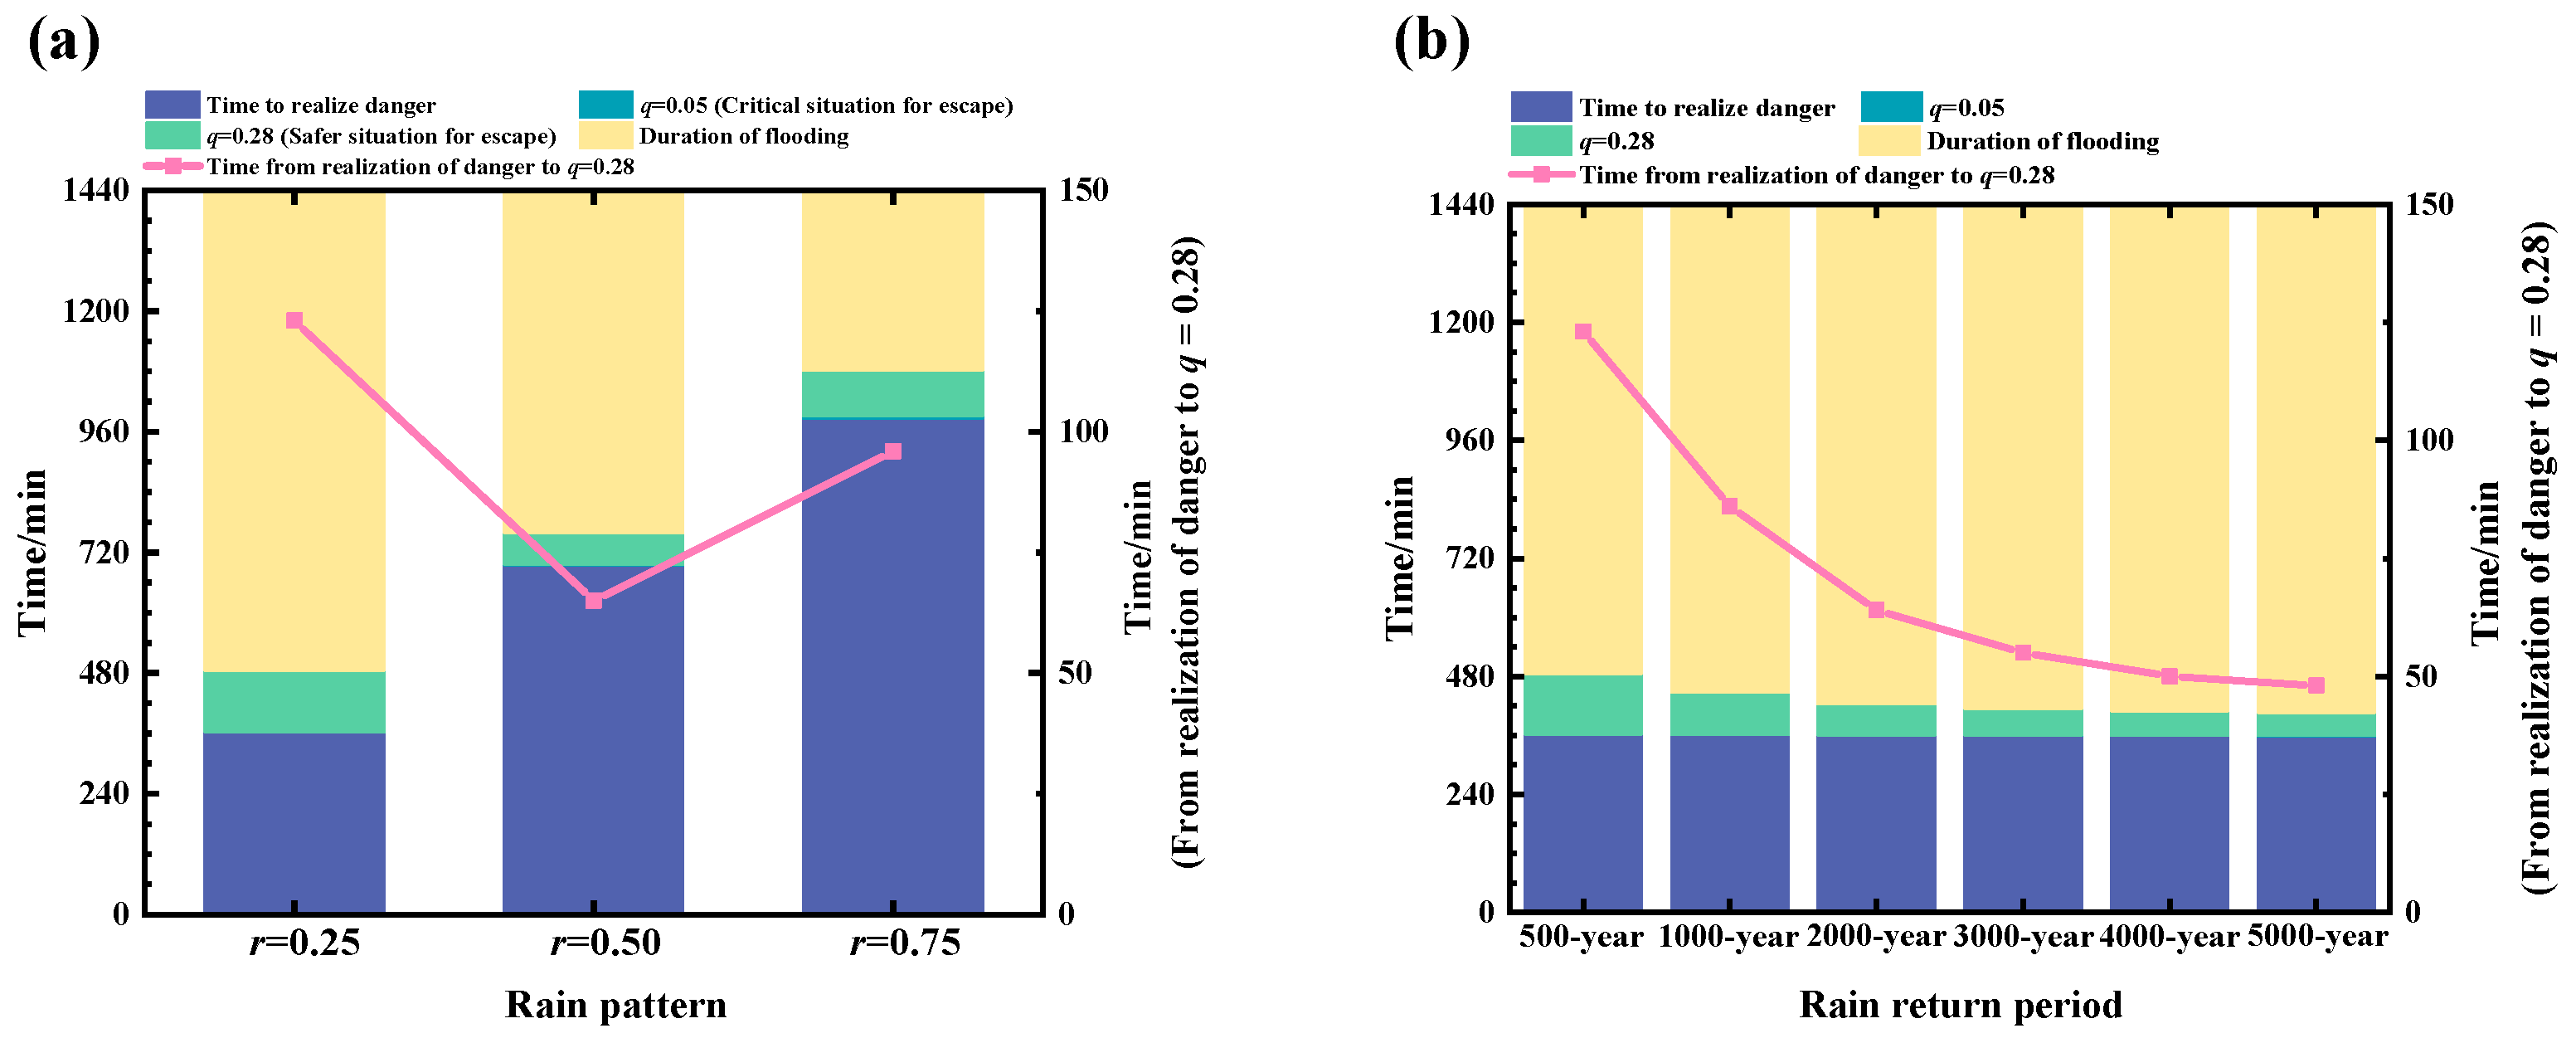
Figure 8 illustrates the variations in the time of water disaster onset within the subway system for different rainfall intensities and patterns. Previous studies have established that individuals within the subway system are unable to escape when the unit discharge at the subway entrance reaches 0.28 m3/s/m [22,44]. Hence, the time interval from “realizing the disaster” to “q = 0.28 m3/s/m” is designated as the limit escape time, while the duration from “realizing the disaster” to “q = 0.05 m3/s/m” is considered the safe escape time. In Figure 8a, the water disaster times under different rainfall types for a 1-in-500-year reappearing period conditions are depicted. It is evident that pre-type rainfall exhibits the longest escape time of 123 min, yet it also results in the lengthiest duration of water damage within the metro system, consequently leading to the greatest economic losses within the system, consistent with the earlier conclusion. Conversely, mid-type rainfall demonstrates the shortest escape time of 63 min, thereby posing the most significant threat to the lives and safety of individuals within the metro system. Figure 8b displays the trend of water damage time with increasing rainfall intensity. It is observed that the escape time diminishes with escalating rainfall intensity, and when the rainfall reappearing period increases from 500 years to 5000 years, the escape time decreases by 75 min. Meanwhile the duration of water damage in the rail transit system also increases.

4.2.2. Protection Conditions

As the specifications for urban rail transit projects (GB 55033-2022) and the subway design guidelines (GB 50157-2013), the step height of subway station entrances for waterproofing typically ranges from 0.3 to 0.45 m (0.15 m per step). The height of the stairs used to calculate the water intrusion to the rail transit in this study is initially set at 0.45 m (equivalent to three steps), based on on-site investigations at Wanqingsha Station of Guangzhou’s Line 18. In addition, protection designs ranging from 0 to 5 steps (0~0.75 m) are also considered in order to evaluate the risk of water damage to the rail transit system under various defense conditions.
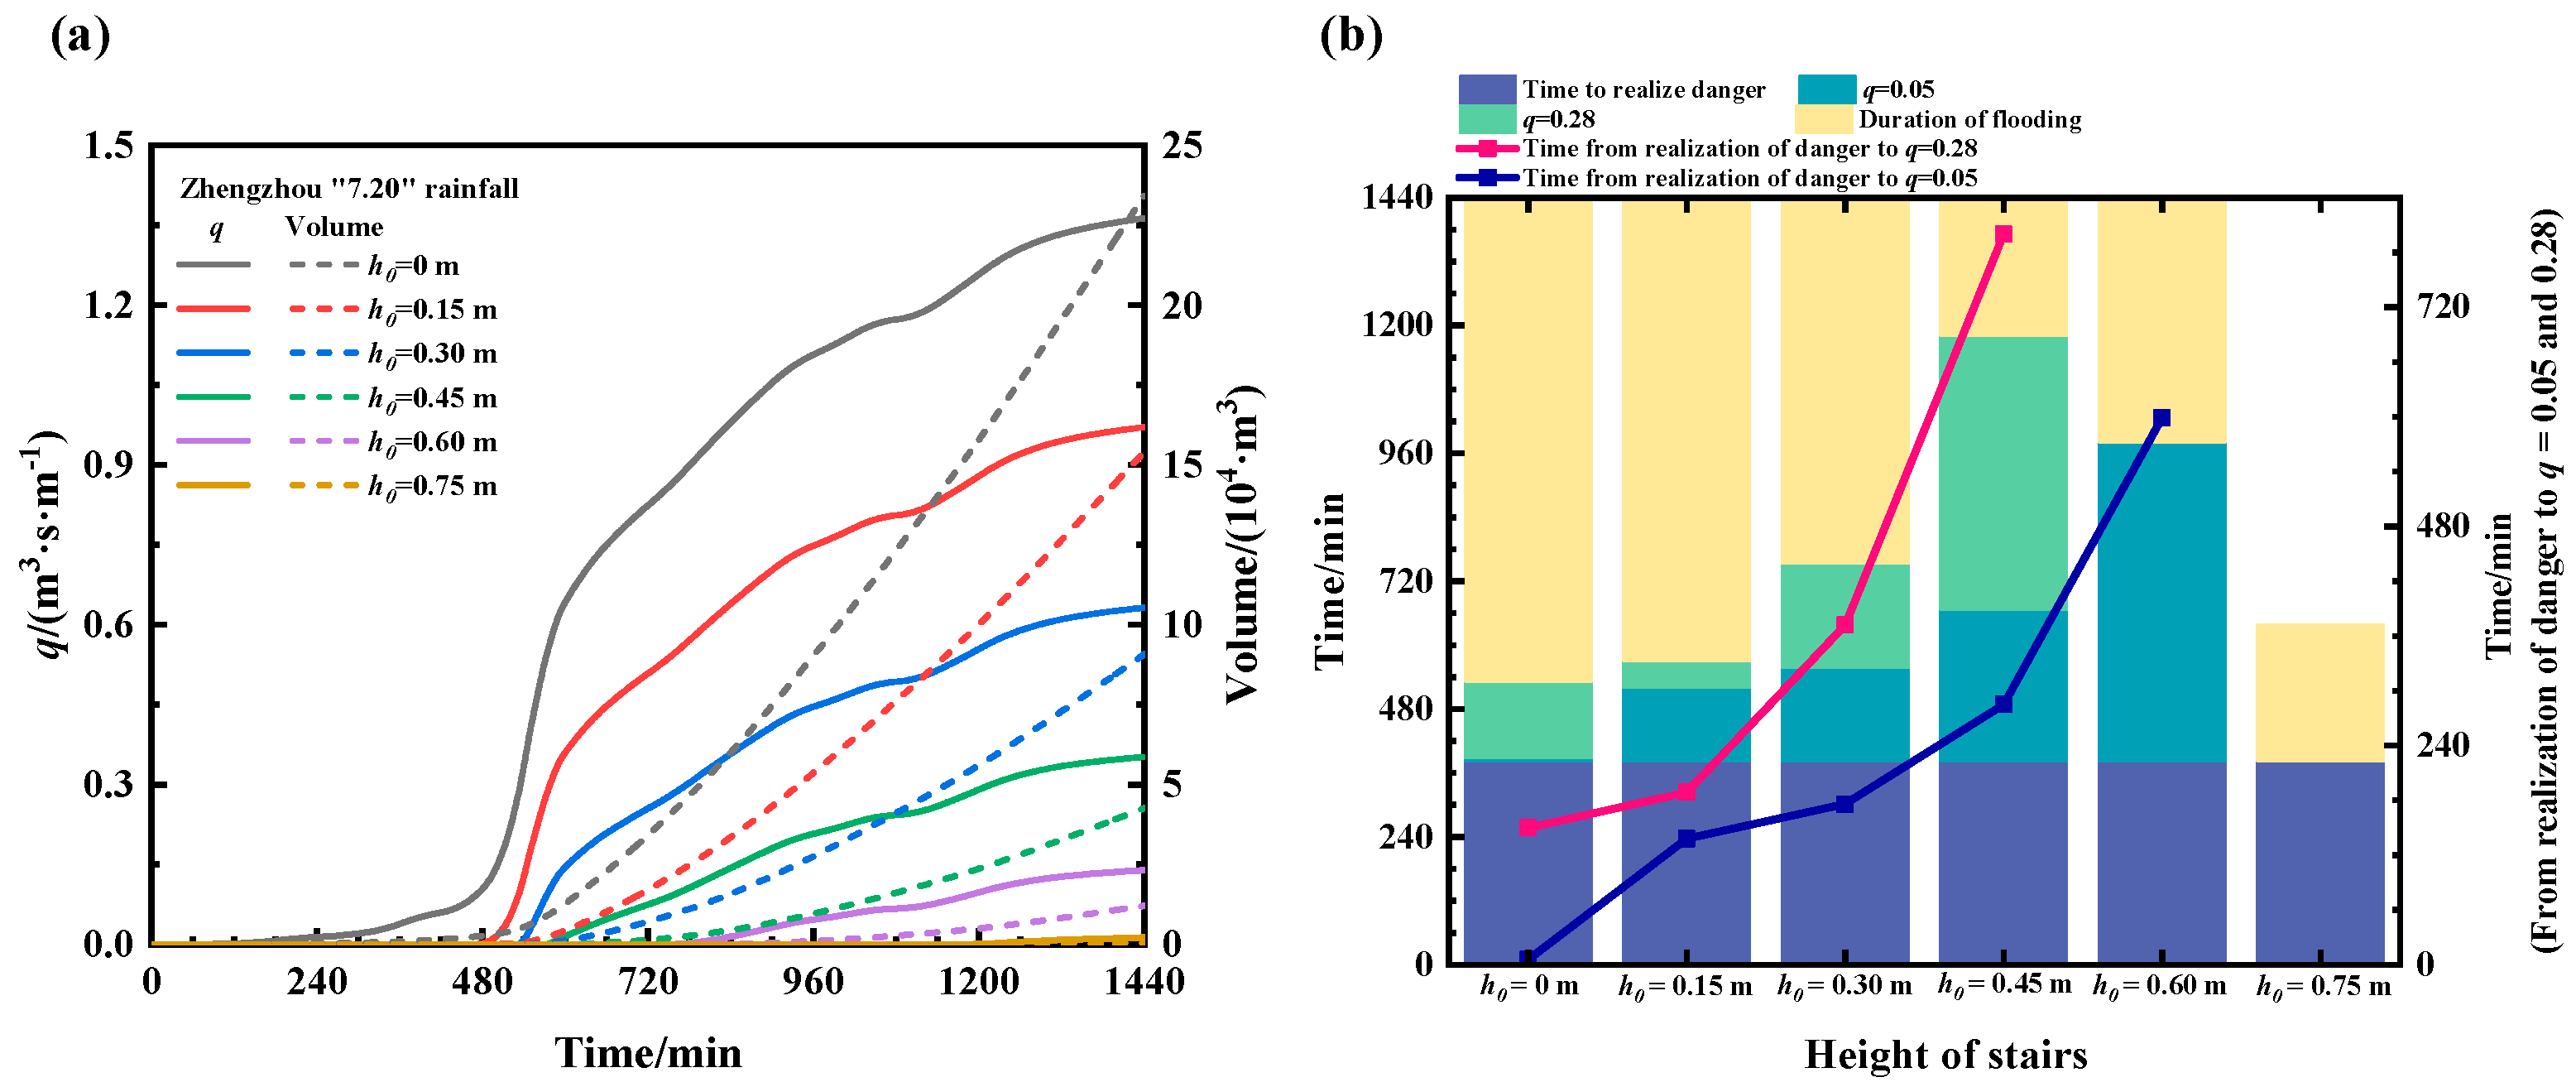
Figure 9a illustrates the flood intrusion unit discharge and total inflow water volume for different protection conditions. It is clear to see that the intrusion water volume into the subway system gradually diminishes with increasing protection conditions. Notably, the largest decrease in intrusion water volume occurs when the protection height increases from 0 m to 0.15 m, amounting to 80,256.44 m3, after which it gradually decreases with each additional step. Furthermore, Figure 9b showcases the significant increase in safe escape time inside the subway system as the protection height escalates. For instance, when the protection height rises from 0 m to 0.15 m, the safe escape time substantially increases by 132 min. This trend continues, with the limit of the escape time notably increasing as the protection height reaches 0.45 m (800 min). Notably, when the protection height reaches 0.6 m, safe escape time is significantly enhanced, with no situations where escape becomes impossible (q < 0.28 m3/s/m). Additionally, at a protection height of 0.75 m, q no longer exceeds 0.05 m3/s/m, leading to a significant reduction in water damage duration and the risk of water damage within the rail transit system is effectively mitigated. Increasing protection height not only substantially reduces total inflow water volume inside the subway system, but also extends the escape time for individuals within the subway system. However, augmenting the height or number of steps at subway entrances may impact commuting efficiency, congestion and construction costs. Hence, future rail transit system designs should consider the simultaneous interaction of various factors to reasonably determine subway entrance step height and develop more effective water damage prevention and control measures to mitigate rail transit water damage risk.

5. Discussion

5.1. Model Evaluation and Limitations

In this study, a new model is proposed to simulate the water damage process around the entrance of rail transit under extreme weather conditions. The model considers rainfall, storm surge, infiltration, drainage, surface runoff and other processes to simulate the ponding and intrusion process around rail transit entrances. By applying the model to Line 5 of the Zhengzhou “7.20” subway, the simulated depth of surface water and the volume of water intrusion are compared with the actual data to verify the feasibility of the model. The comparison shows that the model can effectively simulate the water damage process under extreme rainfall conditions. Although the calculated inundation depths and validation results exhibit some discrepancies, this can be attributed to the uncertainties associated with various assumptions about parameter values, data quality and modeling conditions. For example, the model currently does not correctly account for changes in the ponding process caused by the collapse of retaining walls, whereas most rail transit entrances are surrounded by small hydraulic structures, which are often not accurately identified by the topographic data. Other factors such as the value of the infiltration rate parameter in the area also affect the simulation of the infiltration and drainage processes [48], which can have an impact on the accuracy of the simulation results. Overall, the simulation results provide relatively reliable predictions of rail transit water damage risk.

5.2. Water Damage Processes around Rail Transit Entrance under Extreme Rainfall Conditions

The simulation results for Wanqingsha Station of Guangzhou Line 18 show the water damage process under different rainfall intensities and rainfall patterns. The water damage process under different rainfall intensity scenarios is consistent: the higher the rainfall intensity, the greater the inundation depth and total water intrusion, the shorter the escape time, and the longer the duration of the water damage. The water damage process under different rainfall patterns has significant differences. Under mid-type rainfall conditions, the people inside the rail transit system have the shortest escape time, leading to a high risk of casualties and the greatest safety evacuation requirements [22]. In pre-type rainfall conditions, people inside the rail transit system have the longest escape time, but this scenario causes the largest total water intrusion and the longest duration of the disaster. The combination of these factors makes it difficult to drain water from inside the rail transit system, leading to long-term immersion of internal equipment, increased difficulty and time for dewatering, and significant disruption of rail transit system operations [49].

5.3. Water Damage Protection Measures

Simulations of the water damage process around rail transit station entrances under different protection conditions show that increasing the height of steps at entrances can effectively mitigate the risk of water damage within the rail transit system. However, the strategy of increasing the height of steps is not always effective, and appropriate protective measures need to be implemented for different disaster scenarios. For example, when dealing with mid-type rainfall, well-designed evacuation measures are significantly more important than simply increasing the height of subway entrances; excessively high steps can also reduce evacuation efficiency [50]. Additionally, total water intrusion into the rail transit system increases as the peak rainfall position advances. Heavy rainfall over a short period can overload the drainage system, reducing its efficiency. Moreover, a premature rise in surface water levels can lead to prolonged high levels of water intrusion into the subway, causing significant surface water ingress into the rail transit system. For this scenario, real-time rainfall monitoring equipment and water level sensors should be installed at the entrances of subway stations to keep abreast of rainfall and water accumulation. Moreover, if the peak rainfall trend advances, timely adjustment of subway station entrance operations can mitigate susceptibility to water intrusion. Additionally, based on on-site research findings from Guangzhou Line 18, most entrances lacked adequate drainage facilities. Upgrading the drainage facilities in and around the subway entrances will effectively reduce the amount of water intrusion and the duration of water damage.

6. Conclusions

In this study, a comprehensive model is proposed to quantify the rail transit water damage, which combines the ponding model with the inundation model surrounding the rail transit entrance. This integrated model can assess the water damage risk in rail transit systems under the influence of various extreme weather conditions, which is validated by a case study using the “7.20” event in Zhengzhou, China. Taking Wanqingsha Station of Guangzhou Metro Line 18 as the research area, the main conclusions are as follows.
(1) The proposed model to address the water damage under extreme weather conditions for rail transit station entrances incorporates several key components: a simplified runoff model to calculate water exchange between grids and sub-catchments; a Horton model to determine the infiltration, coupled with an equivalent drainage model to simulate drainage processes in urban areas; a reservoir model to compute the rainfall flow production process; an inundation model to estimate the water intrusion volume and the time of water damage when floodwater intrudes into the underground through the rail transit station entrance.
(2) The depth and extent of water ponding around the entrance of Wanqingsha Station of Guangzhou Metro Line 18, China are obtained under different extreme weather conditions, such as different rainfall scenarios spanning from 500 to 5000-year reappearing periods, three rainfall types, as well as the extreme rainfall conditions observed during Zhengzhou’s “7.20” event. It was found that, under the existing rainfall intensity in Guangzhou City, there is no significant potential risk of water damage at the rail transit station entrance. However, in the face of extreme rainfall events akin to Zhengzhou’s “7.20”, a heightened risk of water damage to the rail transit system emerges. Additionally, distinct differences are observed in the ponding process around subway entrances due to different rainfall types, although their impact on the final distribution and depth of water is minor.
(3) With the same rainfall type, the total inflow water volume to the rail transit system increases as rainfall intensity rises. The inflow volume increased from 95,180.6 m³ under 500 year rainfall conditions to 143,250.6 m³ under 5000 year rainfall conditions, and reached 234,637 m³ under the condition of the “7.20” rainfall event (without protection). Meanwhile, the escape time decreases significantly, with a maximum difference of 75 min. Specifically, under the same rainfall intensity, the rainfall type will have a significant impact on the risk of water damage inside the rail transit system. Among them, the largest total inflow water volume is observed during pre-type rainfall events, surpassing the 55,986.3 m³ recorded during late-type rainfall events, which exhibit the smallest inflow volume. Although the inflow volume caused by pre-type rainfall is the largest, the escape time inside the system is the longest, while the shortest escape time occurs during mid-type rainfall events, this being only 65 min.
(4) The effect of protection level on the water damage of the rail system is examined under the “7.20” rainfall conditions. As the level of protection increases, the total inflow water volume to the rail transit system decreases significantly from 234,637 m3 at 0 m to 434.5 m3 at 0.75 m; however, the rate of decline decreases gradually as the step height increases. The height of protection significantly impacts the escape time inside the rail transit system, with an increase from 0.3 m to 0.45 m resulting in a 428 min increase. With further increases in protection level, it is almost no longer possible to escape. Nonetheless, increasing the height of protection necessitates consideration of various interacting factors, such as commuting efficiency and construction costs.

Author Contributions

Conceptualization, Y.G. and Y.J.; methodology, Y.G. and Y.J.; software, Y.J.; validation, Y.G., Q.Y. and X.L.; formal analysis, Y.J.; investigation, Y.G. and Q.Y.; resources, Y.G.; data curation, Y.G.; writing—original draft preparation, Y.J.; writing—review and editing, Y.G., Q.Y., X.L., K.S. and L.S.; visualization, Y.J.; supervision, Y.G.; project administration, Y.G.; funding acquisition, Y.G. All authors have read and agreed to the published version of the manuscript.

Funding

This research was funded by National Key R&D Program of China (2022YFC3005203).

Data Availability Statement

The data presented in this study are available on request from the corresponding author. The data are not publicly available due to privacy.

Conflicts of Interest

The authors declare no conflicts of interest.

References

  1. Qiang, Y.; Zhang, L.; He, J.; Xiao, T.; Huang, H.; Wang, H. Urban Flood Analysis for Pearl River Delta Cities Using an Equivalent Drainage Method upon Combined Rainfall-High Tide-Storm Surge Events. J. Hydrol. 2021, 597, 126293. [Google Scholar] [CrossRef]
  2. Scientific Research—Objective Japan—Interview with the Institute for Disaster Prevention, Kyoto University. Available online: https://www.keguanjp.com/kgjp_keji/kgjp_kangzai/pt20170111135119.html (accessed on 21 October 2023). (In Chinese).
  3. Common Concern. Flood Situation—Wuhan, Hubei: Aerial Photographs of More than a Hundred Places Flooded across Wuhan. Available online: https://tv.cctv.com/2016/07/06/VIDEs7WZzC5vW1KsAAZQlKPK160706.shtml (accessed on 21 October 2023). (In Chinese).
  4. Water Backs up into Station at MTR Changjian Station. Available online: https://www.sohu.com/a/www.sohu.com/a/74752490_119890 (accessed on 21 October 2023). (In Chinese).
  5. Revealed! Chegongmiao Subway Station in Shenzhen Was Flooded, Why It Resumed Operation in 50 minutes? Available online: https://static.nfapp.southcn.com/content/201706/13/c481003.html (accessed on 21 October 2023). (In Chinese).
  6. NetEase 21 Investigation. Bottom Zhengzhou Subway Line 5 Accident: Backed up Rainwater Washed out the Water Retaining Wall, Missed Effective Warning. Available online: https://www.163.com/dy/article/GFHKOBJV05199NPP.html (accessed on 21 October 2023). (In Chinese).
  7. Zhu, Y.-H. Record-Breaking Rainstorms Are Sweeping through New York, Turning Subway Stations into “Flooded Caves”. Available online: https://news.sina.com.cn/w/2021-09-02/doc-iktzqtyt3709258.shtml (accessed on 21 October 2023). (In Chinese).
  8. Rossman, L.A.; Dickinson, R.E.; Schade, T.; Chan, C.; Burgess, E.H.; Huber, W.C. SWMM5: The USEPA’s newest tool for urban drainage analysis. In Proceedings of the 10th International Conference on Urban Drainage, Copenhagen, Denmark, 21–26 August 2005; pp. 1–8. [Google Scholar]
  9. Wallingford Software. InfoWorks CS, 11; Wallingford Software: Wallingford, UK, 2010; Help File.
  10. Danish Hydraulic Institute. MOUSE, Ver. 1999; Danish Hydraulic Institute: Hørsholm, Denmark, 1999; User Manual and Tutorial.
  11. Lyu, H.-M.; Zhou, W.-H.; Shen, S.-L.; Zhou, A.-N. Inundation Risk Assessment of Metro System Using AHP and TFN-AHP in Shenzhen. Sustain. Cities Soc. 2020, 56, 102103. [Google Scholar] [CrossRef]
  12. Lyu, H.-M.; Shen, S.-L.; Yang, J.; Yin, Z.-Y. Inundation Analysis of Metro Systems with the Storm Water Management Model Incorporated into a Geographical Information System: A Case Study in Shanghai. Hydrol. Earth Syst. Sci. 2019, 23, 4293–4307. [Google Scholar] [CrossRef]
  13. Lyu, H.-M.; Shen, S.-L.; Zhou, A.; Yang, J. Perspectives for Flood Risk Assessment and Management for Mega-City Metro System. Tunn. Undergr. Space Technol. 2019, 84, 31–44. [Google Scholar] [CrossRef]
  14. Lyu, H.-M.; Sun, W.-J.; Shen, S.-L.; Arulrajah, A. Flood Risk Assessment in Metro Systems of Mega-Cities Using a GIS-Based Modeling Approach. Sci. Total Environ. 2018, 626, 1012–1025. [Google Scholar] [CrossRef]
  15. Ogato, G.S.; Bantider, A.; Abebe, K.; Geneletti, D. Geographic Information System (GIS)-Based Multicriteria Analysis of Flooding Hazard and Risk in Ambo Town and Its Watershed, West Shoa Zone, Oromia Regional State, Ethiopia. J. Hydrol. Reg. Stud. 2020, 27, 100659. [Google Scholar] [CrossRef]
  16. Wu, J.; Yang, R.; Song, J. Effectiveness of Low-Impact Development for Urban Inundation Risk Mitigation under Different Scenarios: A Case Study in Shenzhen, China. Nat. Hazards Earth Syst. Sci. 2018, 18, 2525–2536. [Google Scholar] [CrossRef]
  17. Xu, K.; Ma, C.; Lian, J.; Bin, L. Joint Probability Analysis of Extreme Precipitation and Storm Tide in a Coastal City under Changing Environment. PLoS ONE 2014, 9, e109341. [Google Scholar] [CrossRef]
  18. Zheng, F.; Westra, S.; Sisson, S.A. Quantifying the Dependence between Extreme Rainfall and Storm Surge in the Coastal Zone. J. Hydrol. 2013, 505, 172–187. [Google Scholar] [CrossRef]
  19. Quan, R.; Zhang, L.; Liu, M.; Lu, M.; Wang, J.; Niu, H. Risk Assessment of Rainstorm Waterlogging on Subway in Central Urban Area of Shanghai, China Based on Scenario Simulation. In Proceedings of the 2011 19th International Conference on Geoinformatics, Shanghai, China, 24–26 June 2011; IEEE: Shanghai, China, 2011; pp. 1–6. [Google Scholar]
  20. Herath, S.; Dutta, D. Modeling of Urban Flooding Including Underground Space. In Proceedings of the Second International Conference of Asia-Pacific Hydrology and Water Resources Association, Singapore, 5–9 July 2004; pp. 55–63. [Google Scholar]
  21. Toda, K.; Kuriyama, K.; Oyagi, R.; Inoue, K. Inundation analysis of complicated underground space. Proc. Hydraul. Eng. 2003, 47, 877–882. [Google Scholar] [CrossRef]
  22. Ishigaki, T.; Toda, K.; Baba, Y.; Inoue, K.; Nakagawa, H. Experimental study on evacuation from underground space by using real size models. Proc. Hydraul. Eng. 2006, 50, 583–588. [Google Scholar] [CrossRef]
  23. Ozaki, T.; Asano, N.; Ishigaki, T.; Toda, K. Characteristics of underground mall inundation by flush flood in short time heavy rainfall. J. Japan Soc. Civil Eng. Ser. B1 (Hydraul. Eng.) 2014, 70, I_1417–I_1422. [Google Scholar] [CrossRef]
  24. Li, M.; Kwan, M.-P.; Yin, J.; Yu, D.; Wang, J. The Potential Effect of a 100-Year Pluvial Flood Event on Metro Accessibility and Ridership: A Case Study of Central Shanghai, China. Appl. Geogr. 2018, 100, 21–29. [Google Scholar] [CrossRef]
  25. Sun, D.; Wang, H.; Lall, U.; Huang, J.; Liu, G. Subway Travel Risk Evaluation during Flood Events Based on Smart Card Data. Geomat. Nat. Hazards Risk 2022, 13, 2796–2818. [Google Scholar] [CrossRef]
  26. Martello, M.V.; Whittle, A.J. Estimating Coastal Flood Damage Costs to Transit Infrastructure under Future Sea Level Rise. Commun. Earth Environ. 2023, 4, 1–10. [Google Scholar] [CrossRef]
  27. Forero-Ortiz, E.; Martínez-Gomariz, E.; Cañas Porcuna, M. A Review of Flood Impact Assessment Approaches for Underground Infrastructures in Urban Areas: A Focus on Transport Systems. Hydrol. Sci. J. 2020, 65, 1943–1955. [Google Scholar] [CrossRef]
  28. Horton, R.E. The Role of Infiltration in the Hydrologic Cycle. Eos Trans. Am. Geophys. Union 1933, 14, 446–460. [Google Scholar] [CrossRef]
  29. GB 55033-2022; Project Code for Engineering of Urban Rail Transit (GB 55033-2022). Academy of Urban Planning and Design & Ministry of National Quality Standard Monitoring Bureau: Beijing, China, 2022.
  30. GB 50157-2013; Code for Design of Metro (GB 50157-2013). Beijing Municipal Planning Commission & Ministry of National Quality Standard Monitoring Bureau: Beijing, China, 2013.
  31. State Council Disaster Investigation Group. Report on the Investigation of the “7–20” Extremely Heavy Rainstorm Disaster in Zhengzhou, Henan Province; State Council Disaster Investigation Group: Zhengzhou, China, 2022. (In Chinese) [Google Scholar]
  32. Ma, L.J.; Wang, C.T.; Wang, W.J.; Zhang, L.L.; Huang, H.P.; Zhang, S.T. Regional runoff characteristics in Zhengzhou City based on SCS-CN model. Bull. Soil Water Conserv. 2022, 42, 203–209+381. (In Chinese) [Google Scholar] [CrossRef]
  33. Zang, W.B.; Chai, F.X.; Liu, C.J.; Yi, Y.M.; He, X.L.; Zheng, J.W. Analysis of waterlogging in Wulongkou parking lot and subway tunnel flooding of “7·20” extreme rainstorm in Zhengzhou City in 2021. Chin. Flood Drought Manag. 2022, 32, 16–22. (In Chinese) [Google Scholar] [CrossRef]
  34. Guo, X.; Cheng, J.; Yin, C.; Li, Q.; Chen, R.; Fang, J. The Extraordinary Zhengzhou Flood of 7/20, 2021: How Extreme Weather and Human Response Compounding to the Disaster. Cities 2023, 134, 104168. [Google Scholar] [CrossRef]
  35. Yang, H.; Zhao, L.; Chen, J. Metro System Inundation in Zhengzhou, Henan Province, China. Sustainability 2022, 14, 9292. [Google Scholar] [CrossRef]
  36. Hallegatte, S.; Green, C.; Nicholls, R.J.; Corfee-Morlot, J. Future Flood Losses in Major Coastal Cities. Nat. Clim. Chang. 2013, 3, 802–806. [Google Scholar] [CrossRef]
  37. Guangzhou Metro. Guangzhou Metro Annual Report 2022; Guangzhou Metro: Guangzhou, China, 2023. (In Chinese) [Google Scholar]
  38. Liao, D.; Zhu, H.; Zhou, J.; Wang, Y.; Sun, J. Study of the Natural Rainstorm Moving Regularity Method for Hyetograph Design. Theor. Appl. Climatol. 2019, 138, 1311–1321. [Google Scholar] [CrossRef]
  39. Guangzhou Municipal Water Affairs Bureau. Technical Report on the Preparation of Stormwater Intensity Formula and Design of Stormwater Rainfall Patterns in Guangzhou Municipality; Guangzhou Municipal Water Affairs Bureau: Guangzhou, China, 2022. (In Chinese) [Google Scholar]
  40. Wu, G.; Xiao, Z.T.; Chen, J.M.; Chen, Y.Q.; Liu, S.T.; Yu, Z.S.; Lie, G.W.; Jia, C.J. Surface soil infiltration characteristics of urban green space with different function in Guangzhou city. For. Environ. Sci. 2023, 39, 1–7. (In Chinese) [Google Scholar]
  41. Du, J.H.; Fang, Z.; Lin, Z.B. Soil infiltration characteristics of typical green space in Guangzhou City. Acta Ecol. Sin. 2021, 41, 9869–9877. (In Chinese) [Google Scholar]
  42. Zeng, P. Application Research of Machine Learning Technology in Rapid Forecast of Urban Flood. Master’s Thesis, China Institute of Water Resources and Hydropower Research, Beijing, China, 2020. (In Chinese). [Google Scholar]
  43. CMA (China Meteorological Administration). Operational Regulations for Short-Range Approaching Weather Forecasting. 2022. Available online: https://www.cma.gov.cn/zfxxgk/gknr/tfsjyd/tfsjydqk/ (accessed on 7 September 2023).
  44. Toda, K.; Oyagi, R.; Inoue, K.; Aihata, S. On the Inundation Process in the Underground Space in Urban Flooding. Kyoto Daigaku Bōsai Kenkyūjo Nenpō 2004, 47, 293–302. [Google Scholar]
  45. Japan Association for Building Disaster Prevention. Trial Draft of the Evacuation Safety Verification Method for Inundated Underground Spaces; Japan Association for Building Disaster Prevention: Tokyo, Japan, 2001. (In Japanese) [Google Scholar]
  46. Shen, R.Z. Study on the Flood Invasion Mechanism and Countermeasures for Flood Control in Underground Space. Master’s Thesis, Tianjin University, Tianjin, China, 2012. (In Chinese). [Google Scholar]
  47. Mo, W.L. Numerical Simulation on the Flooding in Subway Station and Discussion on Its Flood Prevention Measures. Master’s Thesis, Zhejiang University, Hangzhou, China, 2010. (In Chinese). [Google Scholar]
  48. Ren, X.; Hong, N.; Li, L.; Kang, J.; Li, J. Effect of Infiltration Rate Changes in Urban Soils on Stormwater Runoff Process. Geoderma 2020, 363, 114158. [Google Scholar] [CrossRef]
  49. Aoki, Y.; Yoshizawa, A.; Taminato, T. Anti-inundation measures for underground stations of Tokyo Metro. Procedia Eng. 2016, 165, 2–10. [Google Scholar] [CrossRef]
  50. Francksen, N.C.; Ackermans, T.M.A.; Holzer, D.; Ebner, S.A.; Maganaris, C.N.; Hollands, M.A.; Karamanidis, K.; Roys, M.; O’Brien, T.D. Negotiating Stairs with an Inconsistent Riser: Implications for Stepping Safety. Appl. Ergon. 2020, 87, 103131. [Google Scholar] [CrossRef]
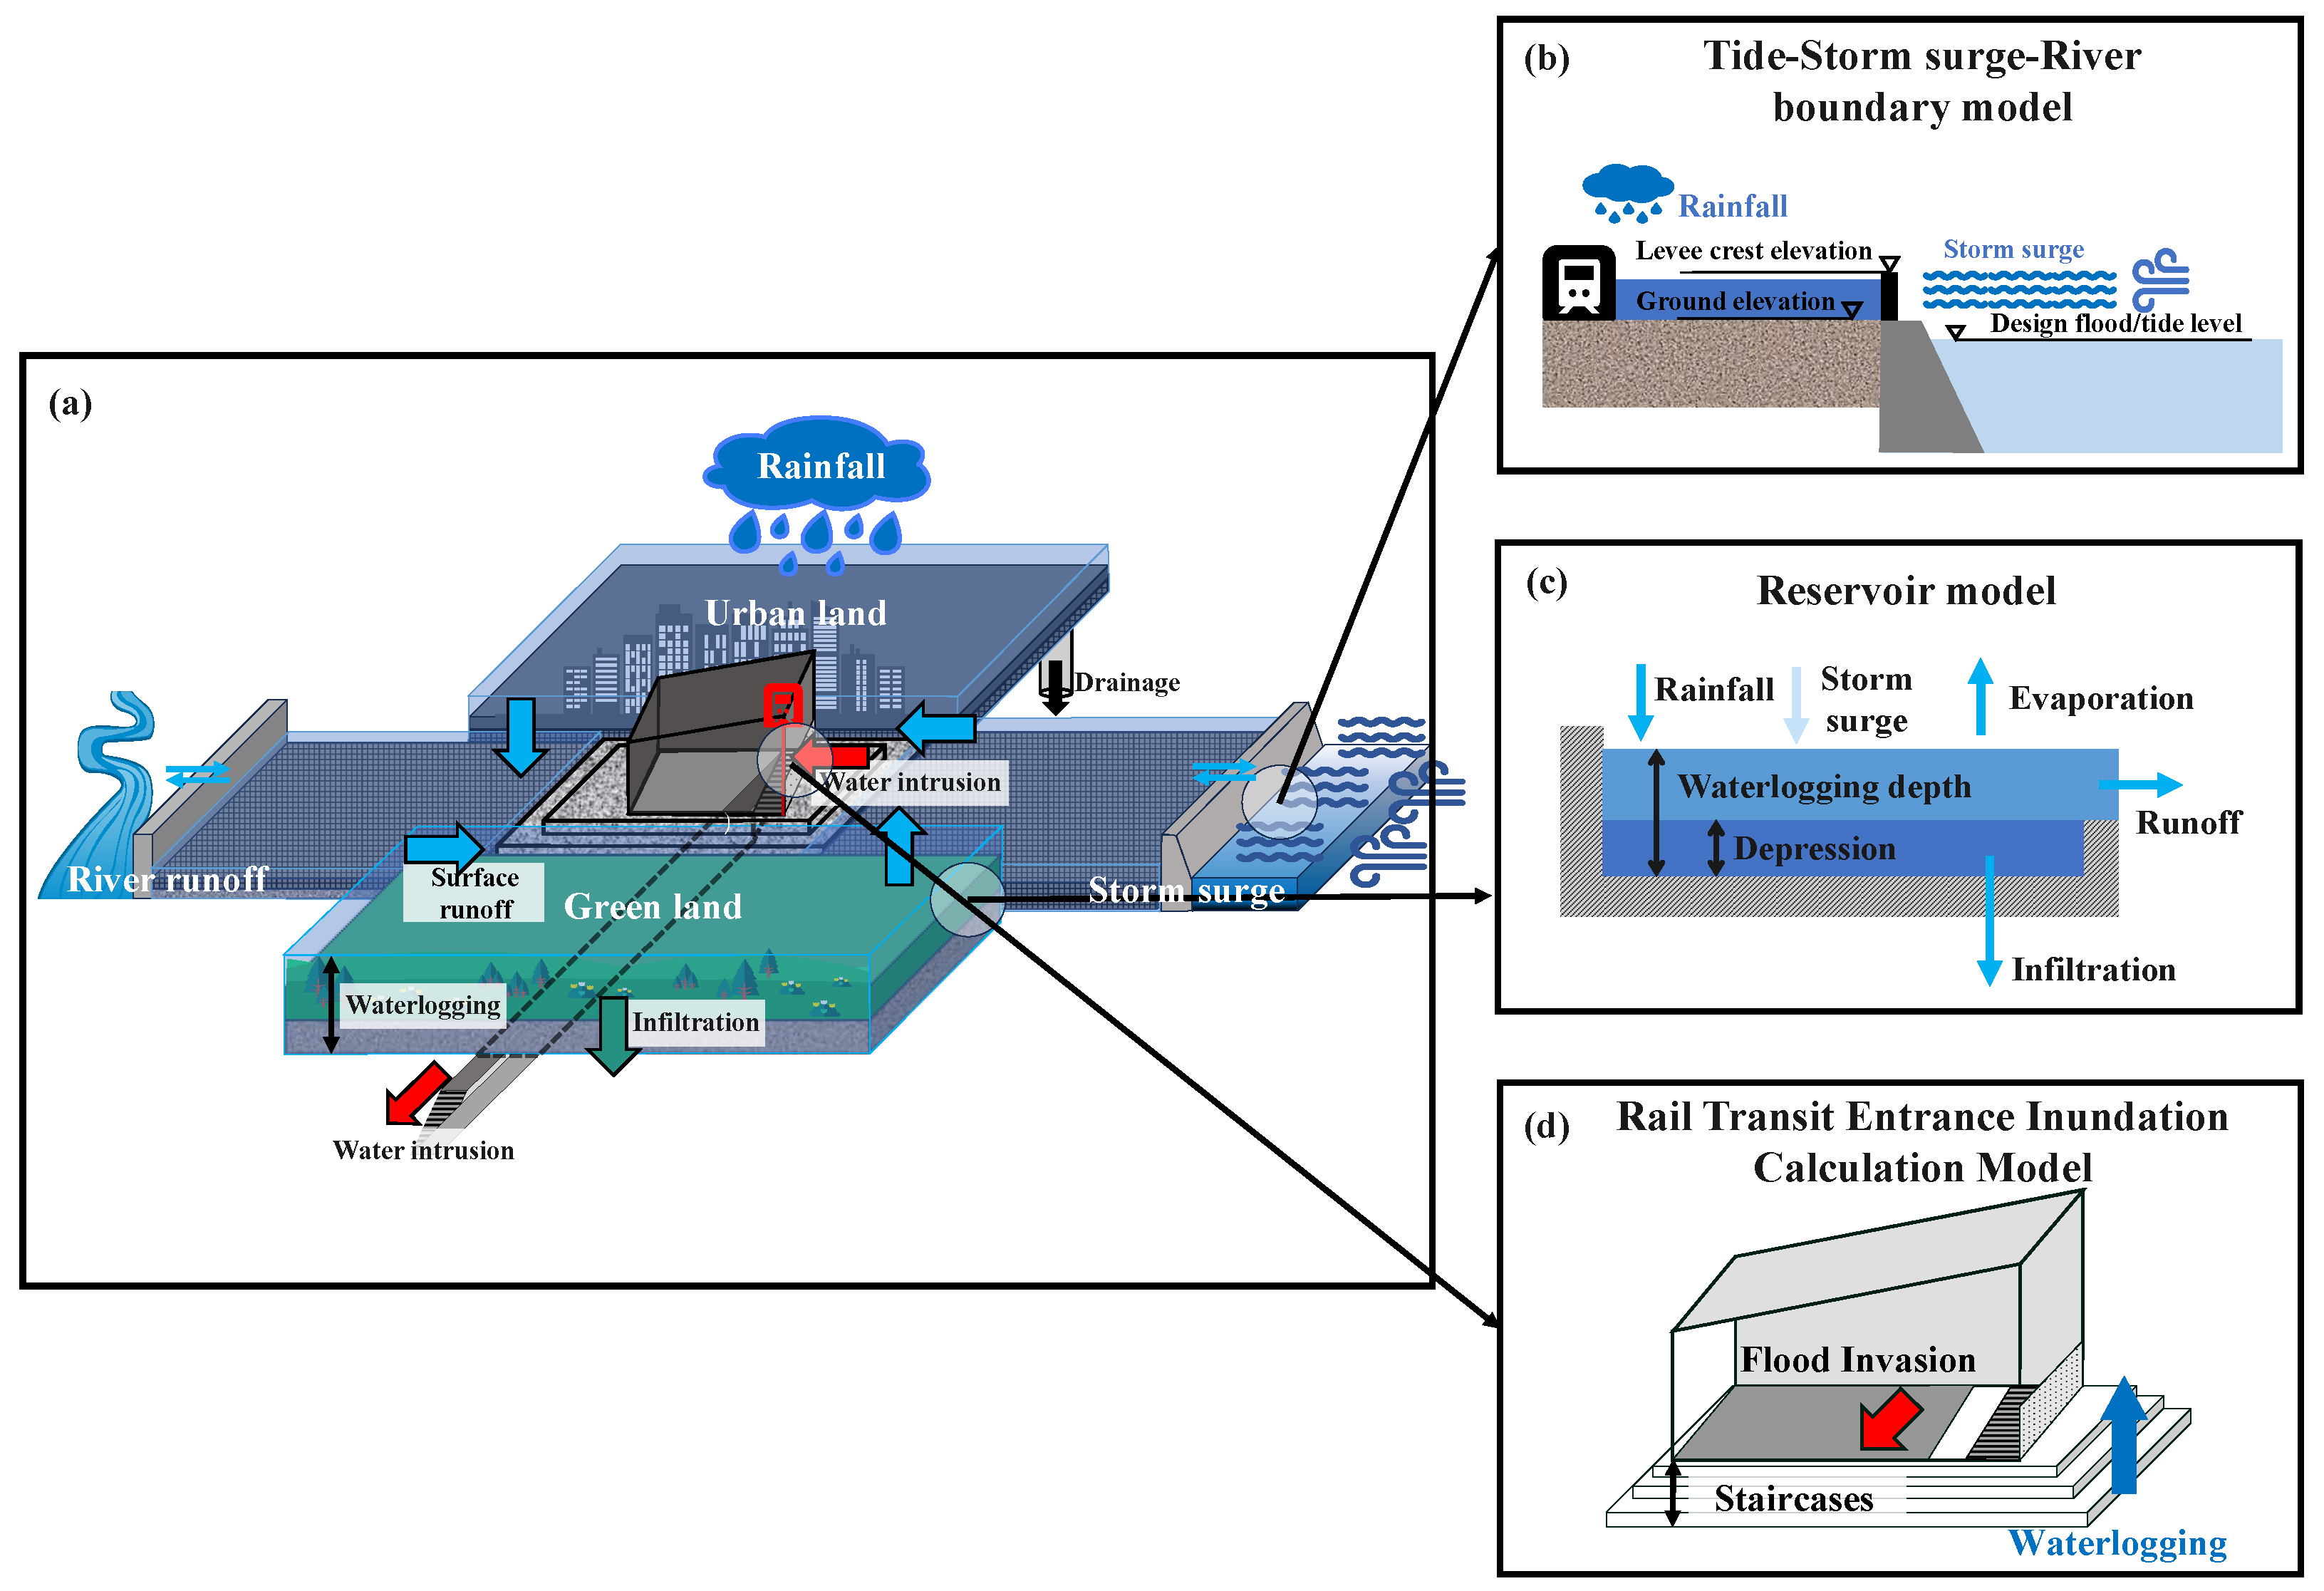
Figure 1. Rail transit water damage calculation model schematic: (a) overall model; (b) tide–storm surge–river boundary model; (c) reservoir model; (d) rail transit entrance inundation calculation model.
Water 16 02024 g001
Figure 2. Flowchart of calculation model for water damage surrounding rail transit station entrance: ponding model (blue); inundation model (green); risk assessment of water damage (orange). Sub-modeling formulas and processes of ponding model (light blue): (a) schematic of simplified runoff model; (b) flowchart of simplify runoff modeling; inundation modeling formulas (light green); risk assessment indicators (light orange).
Water 16 02024 g002
Figure 3. Water damage process around Wulongkou parking lot of Metro Line 5 during the “7.20” rainfall event: (a) the rainfall process and the process of ponding at the entrance to Metro Line 5; (b) the intrusion process of floodwater into Metro Line 5; (c) the spatial distribution of water around the Wulongkou parking lot.
Water 16 02024 g003
Figure 4. Distribution map of Guangzhou Metro Line 18 and Wanqingsha Station: (a) administrative divisions of Guangzhou and route of Metro Line 18; (b) geographic location of Wanqingsha Station; (c,d) entrance to Wanqingsha Station; (eg) surrounding environment of Wanqingsha Station.
Water 16 02024 g004
Figure 5. Ponding process at the entrance of Wanqingsha Station under different rainfall conditions: (a) ponding rise height; (b) ponding rise rate.
Water 16 02024 g005
Figure 6. Ponding distribution map around Wanqingsha Station under different rainfall conditions.
Water 16 02024 g006
Figure 7. Unit discharge q and total inflow volume V of flooding at the rail transit station entrance under different rainfall conditions: (a) for different rainfall patterns; (b) for different rainfall intensities without protection; (c) for different rainfall intensities with protection.
Water 16 02024 g007
Figure 8. Time of rail transit system water damage under different rainfall conditions: (a) for different rainfall patterns; (b) for different rainfall intensities.
Water 16 02024 g008
Figure 9. Total inflow water volume and time of water damage under different protection conditions for rail transit entrance: (a) unit discharge and total inflow water volume; (b) time of water damage.
Water 16 02024 g009
Table 1. Model parameter values form.
Model TypeParameter NameParameter DescriptionValues in This Paper
Reservoir modelNon-permeable surface ponding depth D (mm)Sourced from the American Society of Civil Engineers (ASCE)2.54
Permeable surface ponding depth D (mm)5
Rate of evaporation e (m/s)-Average evaporation rate of Guangzhou City in Sept-Dec
Simplified runoff modelArea of different surface Ai (m2)-Value according to actual division
Horton infiltration modelMaximum infiltration rate fmaxSandy soil: 127 mm/hLoamy soil: 76 mm/hClayey soil: 25.4 mm/h63.74 [40,41]
Minimum infiltration rate fminSaturated hydraulic conductivity of soil8.34
Decay coefficient KdEmpirical range 2~73 [42]
Equivalent drainage modelInfiltration adjustment factor KAffected by storm surge and rainfall[a0, a1, a2, a3, a4, a5]
= [−2.05, 1.95, 5.9 × 10⁻³, −4.44 × 10⁻¹, −1.03 × 10⁻⁶, 3.03 × 10⁻⁴] [1]
Inundation model for rail transit entranceEntrance protection height h0Based on the urban rail transit project specification (GB 55033-2022) and the height of Guangzhou Metro Line 18 off-station line0~0.45~0.75 m
Disclaimer/Publisher’s Note: The statements, opinions and data contained in all publications are solely those of the individual author(s) and contributor(s) and not of MDPI and/or the editor(s). MDPI and/or the editor(s) disclaim responsibility for any injury to people or property resulting from any ideas, methods, instructions or products referred to in the content.