Article

Salinity Intrusion Modeling Using Boundary Conditions on a Laboratory Setup: Experimental Analysis and CFD Simulations

by
Dayana Carolina Chalá
1,
Claudia Castro-Faccetti
1,
Edgar Quiñones-Bolaños
1 and
Mehrab Mehrvar
2,*
1
Environmental Modeling Research Group, Faculty of Engineering, University of Cartagena, Cartagena de Indias, Bolivar 130005, Colombia
2
Department of Chemical Engineering, Toronto Metropolitan University, 350 Victoria Street, Toronto, ON M5B 2K3, Canada
*
Author to whom correspondence should be addressed.
Water 2024, 16(14), 1970; https://doi.org/10.3390/w16141970
Submission received: 28 May 2024 / Revised: 3 July 2024 / Accepted: 5 July 2024 / Published: 11 July 2024

Abstract

:
Salinity intrusion is one of the most pressing threats to unconfined coastal aquifers, and its simulation is of great importance for groundwater research and management. This study compared the performances of two computational fluid dynamics (CFD) software applications, ANSYS Fluent 2022 R2 and COMSOL Multiphysics 5.6, in simulating the transport of saltwater in a pilot-scale experimental setup, which was built to recreate two boundary conditions of unconfined aquifers with homogeneous stratigraphy. The experiments were performed until the saline wedge reached a quasi-steady-state condition. Sequential photographs and image analysis were required to record the movement of the saline toe and the saline wedge location. The maximum toe length was achieved under the head-controlled boundary condition, with a toe length of 1.6 m after 7 h of the experiment, and 1.65 m and 1.79 m for the COMSOL and ANSYS Fluent simulations, respectively. The findings evidence that the flux-controlled condition produced a better representation of the saline wedge than the head-controlled condition, indicating good agreement between the CFD simulations and the experimental data. Recommendations for future research include CFD simulations of real coastal aquifers and coupling fluid dynamics with other processes such as land subsidence.

1. Introduction

Salinity intrusion is a significant threat to coastal aquifers, and it is commonly studied using various experimental, numerical, and in situ approaches. Salinity intrusion dynamics in groundwater are described by the following three main governing equations: the groundwater flow equation based on Darcy’s law, density-dependent flow, and the solute transport equation based on Fick’s law [1]. Over the years, diverse methods have been applied to solve these equations, including analytical methods [2,3,4,5,6,7], experimental approximations [8,9], statistical models [10,11], and numerical models [12,13]. The latter includes a broad range of algorithms, such as SEAWAT [14,15], FEFLOW [16], SUTRA [17,18,19], and MODFLOW-SWI [20], among others. These methods vary in their numerical approaches, employing finite difference, finite element, finite volume, or a combination of them. To solve these governing equations numerically, it is necessary to establish initial conditions and boundary conditions based on the nature of the salinity intrusion process. Other approaches explore the application of neural network algorithms and machine learning [21,22,23], as well as the use of computational fluid dynamics (CFD), to predict the transport of salinity and the mixing zone over time, from models of a real or hypothetical aquifers [24,25,26,27].
Over the past decades, CFD has demonstrated its applicability and accuracy in simulating fluid transport processes, contaminant transport, and heat transfer and in recreating complex porous media [28,29,30,31]. Additionally, it has been used to simulate viscous fingering processes in porous cavities and flow dynamics in open and enclosed cavities [6,32,33]. Only some studies consider CFD for simulating groundwater dynamics, and to this day it is not commonly associated with solving hydrogeological problems. CFD produces quantitative predictions of fluid flow based on the conservation laws that govern fluid motion [34]. Its main emphasis is on finding numerical solutions to differential equations governing the transport of mass, momentum, and energy in moving fluids [35]. It is frequently used alongside experiments and field data. It allows for a relatively faster description of fluid flow without extensive training, as required by neural network algorithms, and more robust models while meeting accuracy requirements for the results. It also allows for faster sensitivity assessments with the parametric sweep option, modifying initial values and boundary conditions, and it can improve time optimization, especially when experiments require changing laboratory materials or techniques. In situ approaches to assess salinity intrusion are effective to develop an understanding of the general dynamics of aquifers; however, the higher costs and greater lengths of time required by efforts make them less convenient for small-scale projects that can be replicated in experimental setups.
Two of the most common commercial CFD software applications are COMSOL Multiphysics and ANSYS Fluent. COMSOL Multiphysics is a general-purpose simulation software used in all fields of engineering, and scientific research [36]. It brings coupled multiphysics and single-physics modeling capabilities. There are many advantages to the use of COMSOL, such as its ability to mesh multiple physical elements in a single model [24]. ANSYS Fluent is also general-purpose software that offers a modern, user-friendly interface that streamlines the CFD process from pre- to postprocessing within a single workflow window, and it offers a free license for students [37]. Both allow for solving differential equations numerically and with high versatility. The user-friendly interfaces, coupled with the advances in meshing and the integration of boundary conditions with space and time variations, make them suitable platforms for hydraulic and hydrogeological modeling. Various studies have included comparisons of COMSOL and ANSYS, evaluating their computational uncertainties, discrepancies in results, allocations of memory, and computation times. The comparisons vary from the simulation of river dynamics [38], fluid dynamics on bubbles [39], heat transfer [40,41], and vibration in complex structures [42]. All of them agree that both platforms offer good results compared to the analysis of physical dynamics, except in the case of ANSYS Fluent in the simulation of small bubble dynamics [39]. Up to now, there has not been a study that compares the numerical capabilities of COMSOL and ANSYS Fluent in simulating solute transport dynamics in sand.
A comparison between the performances of FEFLOW, a finite element numerical algorithm, and Open Foam, a CFD software application, in the simulation of heat transfer in a porous medium suggests the use of CFD as an alternative to an FEM because it is computationally efficient and accurate [43]. CFD models permit the coupling of various physics using a single simulation, with the option of editing the governing equations used by the model. They enable the inclusion of additional coefficients or variables that are usually fixed in conventional algorithms, this is important for the assessment of simultaneous dynamics, such as coupling temperature gradients with a laminar or turbulent flow and mass transfer dynamics with soil mechanic processes. These advantages make CFD more computationally demanding than other software that applies numerical algorithms based on a single physical process.
The configuration of the numerical model and accurate selection of the boundary conditions can significantly affect the formation of the saline wedge and movement of the saline toe [44,45]. Integral frameworks that model salinity intrusion require the selection of boundary conditions that better represent the aquifers [46]. Ketabchi et al. modified the landward boundary condition and compared the head-controlled condition with the flux-controlled condition with a numerical model using the saturated–unsaturated density-dependent flow and transport code SUTRA [47]. They found that the flux-controlled landward boundary condition better represented the form of the saline wedge and considered the influence of the surface discharge through the upper part of the coastal aquifer. Ranjbar et al. used the numerical model MODFLOW-2000 to solve groundwater flow equations and compared coastal aquifer cases in the literature based on the freshwater-side boundary condition [48]. The comparisons between the flux-controlled and head-controlled boundaries showed that the transient movement controlled by the head-controlled condition of freshwater and seawater could lead to a relative overestimation of the salinity intrusion.
Assumptions of boundary conditions when studying salinity intrusion usually consider both sides of an aquifer to be head-controlled (HC), or a head-controlled seaside condition and a flux-controlled (FC) landside condition. In cases such as the simulation of tides and waves, the seaside boundary is assumed to be head-controlled, with equations representing the amplitude and frequency of the tidal cycles and a flux-controlled boundary to describe the groundwater flux discharge. According to Suk et al., the seaside boundary condition can apply either the Dirichlet boundary condition or the Cauchy boundary condition to reduce the overestimation of the saline wedge when the flow moves toward the aquifer [49]. Other studies suggest that the identification of the stagnation point in the seaside boundary condition is key to understanding the solute transport dynamics [50,51]. With the availability of CFD software, salinity intrusion simulations and the influence of the boundary conditions can be explored, creating an alternative to reduce modeling times and increase the robustness of solving such problems. To the extent of the authors’ knowledge, there are few studies that apply CFD platforms to solve salinity intrusion problems in coastal homogeneous aquifers while also analyzing the influence of the selected boundary conditions.
The primary objective of this study is to evaluate the performance of Multiphysics platforms and an experimental setup for simulating salinity intrusion, with a focus on analyzing two boundary conditions at the landward side. The numerical model undergoes a calibration process through comparison with experimental results, specifically in a pilot-scale setup. While the initial calibration ensures accuracy under controlled conditions, it is essential to acknowledge the limitations stemming from the absence of real-life data beyond the laboratory experiments. Despite lacking real-life data beyond experiments, this study is crucial for assessing multiphysics platforms in simulating salinity intrusion, selecting boundary conditions, and gaining insights for groundwater dynamics studies.
The simulation targets salinity intrusion in a pilot-scale setup with an initial constant seawater concentration of 35 g/L of NaCl. A homogeneous two-dimensional costal aquifer is simulated to analyze the effect of the boundary condition to the transient dynamic of the saline wedge. The experimental results are compared to the solution of the governing equations applying COMSOL Multiphysics and ANSYS Fluent. This study includes the application of COMSOL and ANSYS Fluent to simulate groundwater dynamics considering an experimental setup and hypothetical conditions for a two-dimensional model. The study compares the performances of the two CFD platforms in simulating the experimental results and recreating two boundary conditions (i.e., HC and FC). In addition, memory and processing times are compared to ensure the analysis of the software capabilities when selecting the best platform for future multiphysics groundwater simulations.

2. Review of CFD Modeling of Fluid Transport in Porous Media

CFD tools have been used to simulate various transport processes in porous media, with applications ranging from oil exploration and gas to water management. Previous studies demonstrated that groundwater flow can be successfully simulated using COMSOL Multiphysics or ANSYS Fluent [2,25,31,52,53]. However, a comparison of the performances of both platforms in the simulation of salinity intrusion dynamics has not been performed. In addition, the study of the influence of boundary conditions on the simulated results using COMSOL Multiphysics and ANSYS Fluent will bring better insight into the software applications’ capabilities and their influence on simulated salinity intrusion profiles.
Table 1 summarizes studies in which CFD was used to simulate groundwater flow and fluid transport in soil. Some include the application of basic model features, such as hypothetical aquifers or reservoirs, while others consider the real characteristics and dimensions of the aquifers or simulate experimental setups.
Table 1. Studies that apply CFD models to simulate fluid transport in soil.
Simulation CharacteristicsAssessed Processes
CFD PlatformsBasic model features aDimension bFluidSalinity intrusionBoundary conditions cExtraction of groundwaterGeometry dGeometric proportionsGeology eHydraulics fReference
OPENFOAM, MIN3PHYP3DWater-HC, FC--3:5H, UNCOR[54]
COMSOLHYP2DWater-HC, FC, C-SS, FB11:19HeVS[55]
ANSYS-Fluent, MARUNHYP, EXP2DWaterHC, FC-BS, FS1:4H, UNCOW[30]
COMSOLHYP2DWater-HC-3:20He, L, CO-[56]
COMSOLREAL2DWater-HC-1:225H, CO [52]
COMSOLHYP, REAL2DWater-HC-3:20He, L, CO-[57]
COMSOLHYP2DWaterHC--1:3H, He-[27]
MATLAB, COMSOLREAL2DWaterHC--H, UNCO-[12]
COMSOLREAL3DWater-HCSS, BS-H, UNCOW[24]
ANSYS-FluentREAL2DGas-HC--6:25H, FTemp[25]
ANSYS-FluentREAL2DWater-HC-SS, FB80:367H, FTemp[53]
STAR-CCM
+ v15.04
HYP, REAL2DOil, Water-HCSS, FB914:13925H, He, LW[58]
RST2DEXP2DWaterHC-FB1:2H-[59]
COMSOL, ANSYS-FluentHYP, EXP2DWaterFC, HC-FB1:2.5H, UNCO-This Study
Notes: a HYP: hypothetical aquifer, EXP: pilot-scale aquifer, REAL: real aquifer. b 2D: two-dimensional, 3D: three-dimensional. c FC: flux-controlled, HC: head-controlled, C: Cauchy. d SS: surface slope, FS: flat surface, BS: bed slope, FB: flat bottom. e H: homogeneous geology, He: heterogeneous geology, L: layered stratigraphy, CO: confined aquifer, UNCO: unconfined aquifer, F: faults. f R: recharge, W: wells, Temp: temperature variation, VS: variable-saturated. ✓ considered condition.
Most of the studies consider two-dimensional simulations and vary from groundwater to gas and oil reservoirs. Studies on oil and gas reservoirs over the last twenty years have informed the development of CFD models for such conditions [60,61,62]. Some studies that explore salinity intrusion dynamics using CFD include Oz et al. [9] and, more recently, Zhao et al. [63].
Boundary conditions vary from head-controlled to flux-controlled simulations, and, in some cases, the Cauchy boundary [55]. Few studies include both boundary conditions. The geometry for real-world case simulations is usually approximated to flat-bottomed slopes [30,46]. Geometric proportions of the simulated domains vary from real aquifers that extend kilometers [53,58] to hypothetical studies and experimental setups that extend a couple of meters [27,30,54]. This flexibility in geometrical proportions evidences the versatility of CFD and experimental setups in simulating a wide scale of subterranean processes. The geology of the reviewed aquifers varies from sedimentary aquifers to rock aquifers. Regarding fluid dynamics, the simulations explored aquifer recharge [54], pumping with wells [24,58], temperature-driven flux [25,53], constant freshwater head, and fluids through a variable-saturated porous media [55].
COMSOL Multiphysics simulations and ANSYS Fluent simulations are flexible with respect to the geometric proportions of the model. One advantage of COMSOL over other platforms is its advanced mesh function, which can divide the geometry into triangular subsections to better fit the topography or stratigraphic curves [24]. The latest versions of Fluent are also capable of adapting the mesh to fit the geometry. Üner and Dogan and Şen and Düşünür-Doğan used ANSYS Fluent and adapted the mesh to improve the definition of the simulated aquifer faults [25,53]. The application of CFD platforms have gained research attention since they can solve equations that describe simultaneous dynamics [25]. However, a comparison between CFD platforms for the simulation of salinity intrusion continues to require further attention. This study allows for a better identification of the potential applications of both platforms to couple and solve salinity intrusion equations.

3. Materials and Methods

3.1. Details of Experimental Setup

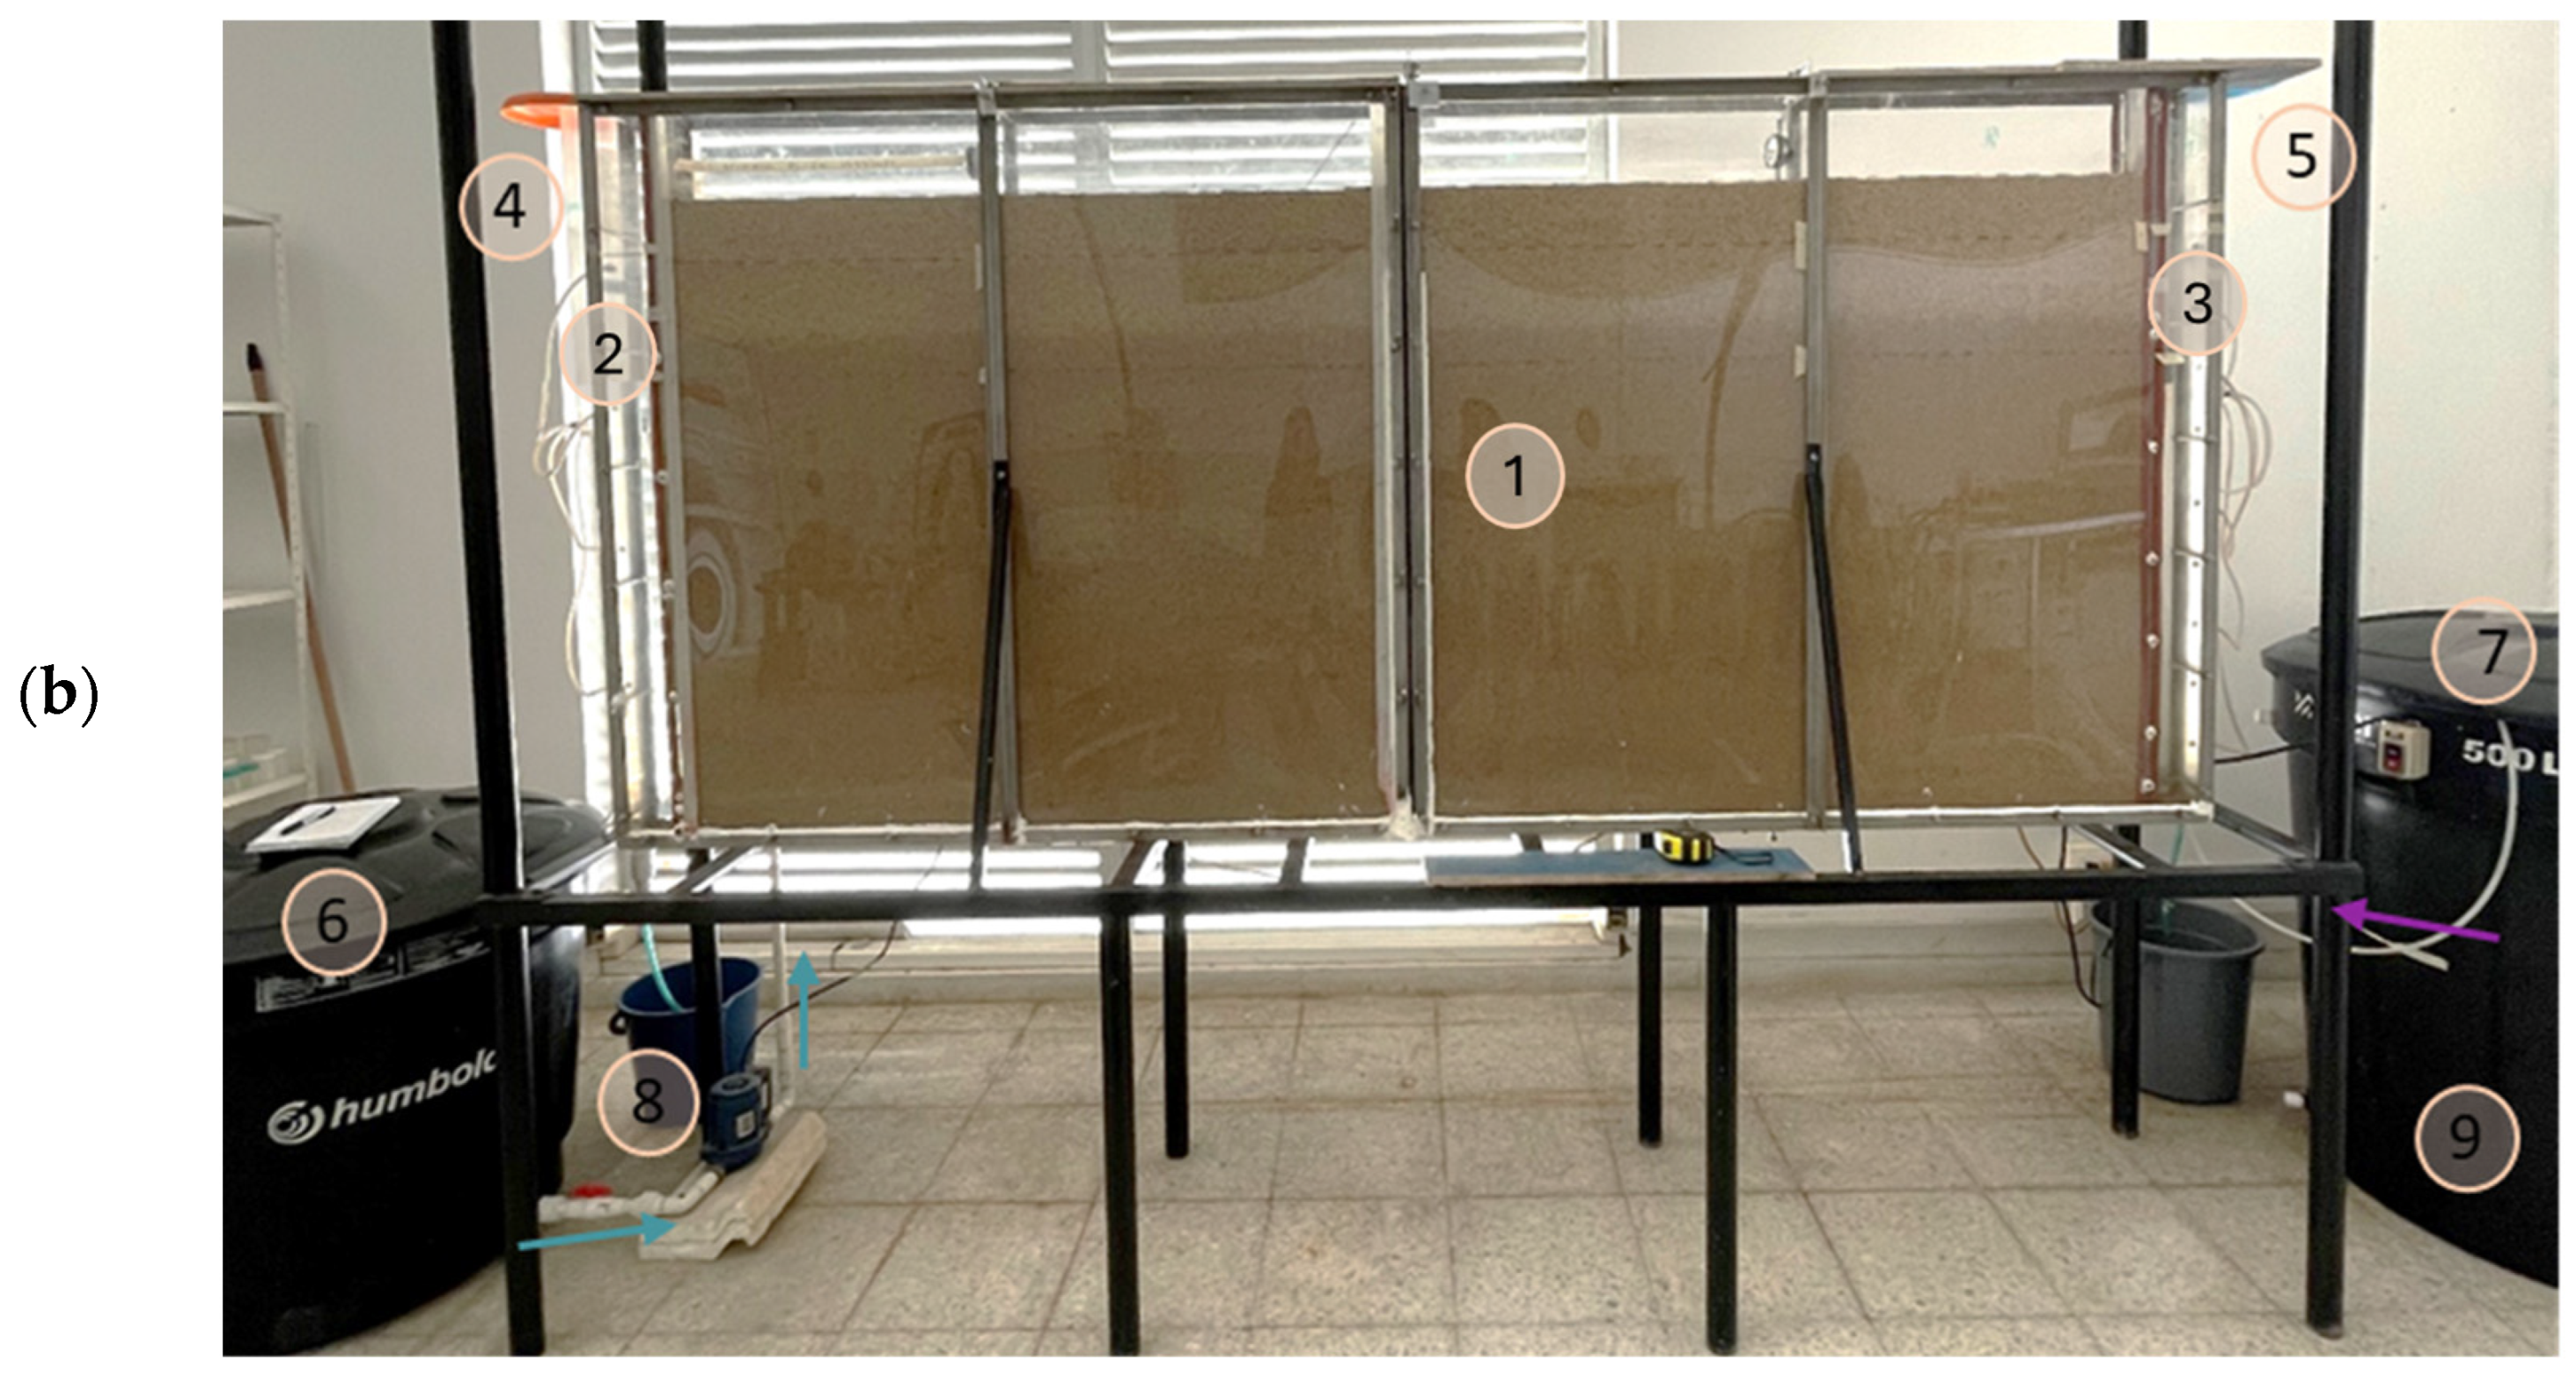
The experimental setup consisted of a rectangular flow tank 1.25 m in height that was divided into three compartments, two side chambers (fresh and saltwater), and two side reservoirs of water (fresh and saltwater). Figure 1 presents a schematic diagram of the experimental setup. It shows (1) the main compartment with a 2.50 m length where the porous media is stored, (2) the left-side compartment of 0.1 m filled with freshwater; and (3) the right-side compartment of 0.1 m filled with saltwater. The side compartments were separated from the central compartment by a fine mesh screen with holes of 0.074 mm in size, also called mesh No. 200, to prevent sand from escaping the central compartment.
The two chambers located on each side of the flow tank are the (4) freshwater chamber and (5) saltwater chamber. The chambers control the water level inside the lateral and central compartments. The chambers were designed to overflow when the water level of each boundary was reached, and the excess water was redirected to the two side reservoirs. The side reservoirs are the (6) freshwater reservoir, located on the left, and (7) the saltwater reservoir, on the right side. Each reservoir is connected to a pump, the (8) freshwater pump directs the flow to the freshwater chamber and the chamber directs it to the left compartment of the tank, while the (9) saltwater-submerged pump (Altamira/Marine pump 100A/1/2/HP, Bombeo, Bogota, Colombia) directs the flow to the right compartment with a flux of 8.1 m3/h, allowing the saltwater side to fill up from the bottom and overflow at the top, sending the excess water to the saltwater chamber.
Freshwater and saltwater constant-head-controlled reservoirs supply freshwater and saltwater to the chambers. The saltwater was prepared in a 500 L tank with NaCl and red food dye (Allura red 40, Mesa Hermanos, Bogota, Colombia) for visualizing the salinity intrusion. The saltwater was fed directly into the saltwater chamber using a submergible rust-resistant pump. The saltwater inlet has a valve that alleviates the flow going directly to the chamber, and two other valves that control the saltwater inlet from the pump to the chamber. The freshwater supply uses the freshwater pump that supplies water from the freshwater reservoir to the freshwater head-controlled tank.
Prior to the construction of the experimental setup, a thorough literature review was conducted to identify the adequate dimensions, considering the type and quantity of experiments, and the available space at the facilities [64]. This review narrowed the ratio of the length vs. height to be used in the setup. The experimental setup is part of a larger project that can simulate land subsidence and various driving forces in the same system. Therefore, large horizontal and vertical dimensions are required to visualize the saline wedge and its interaction with other variables. Additionally, a scale comparison simulation was previously performed to verify that the selected dimensions for the experimental setup did not alter the dynamic of the saline wedge.
Similarly, a numerical simulation followed the integrated framework to model salinity intrusion [46]. Experimental setups to recreate salinity intrusion vary from the small scale to the large scale, with several geometric proportions, from 1:2 to 1:225 [18,65,66,67], as well as others, as included in Table 1. Moreover, to further ensure that the scale of the experimental setup did not compromise the numerical results, a numerical simulation of the head-controlled scenario was also performed at scales of 1:7 and 3:7, following the approach of Torres et al. [68].

3.2. Experimental Simulation

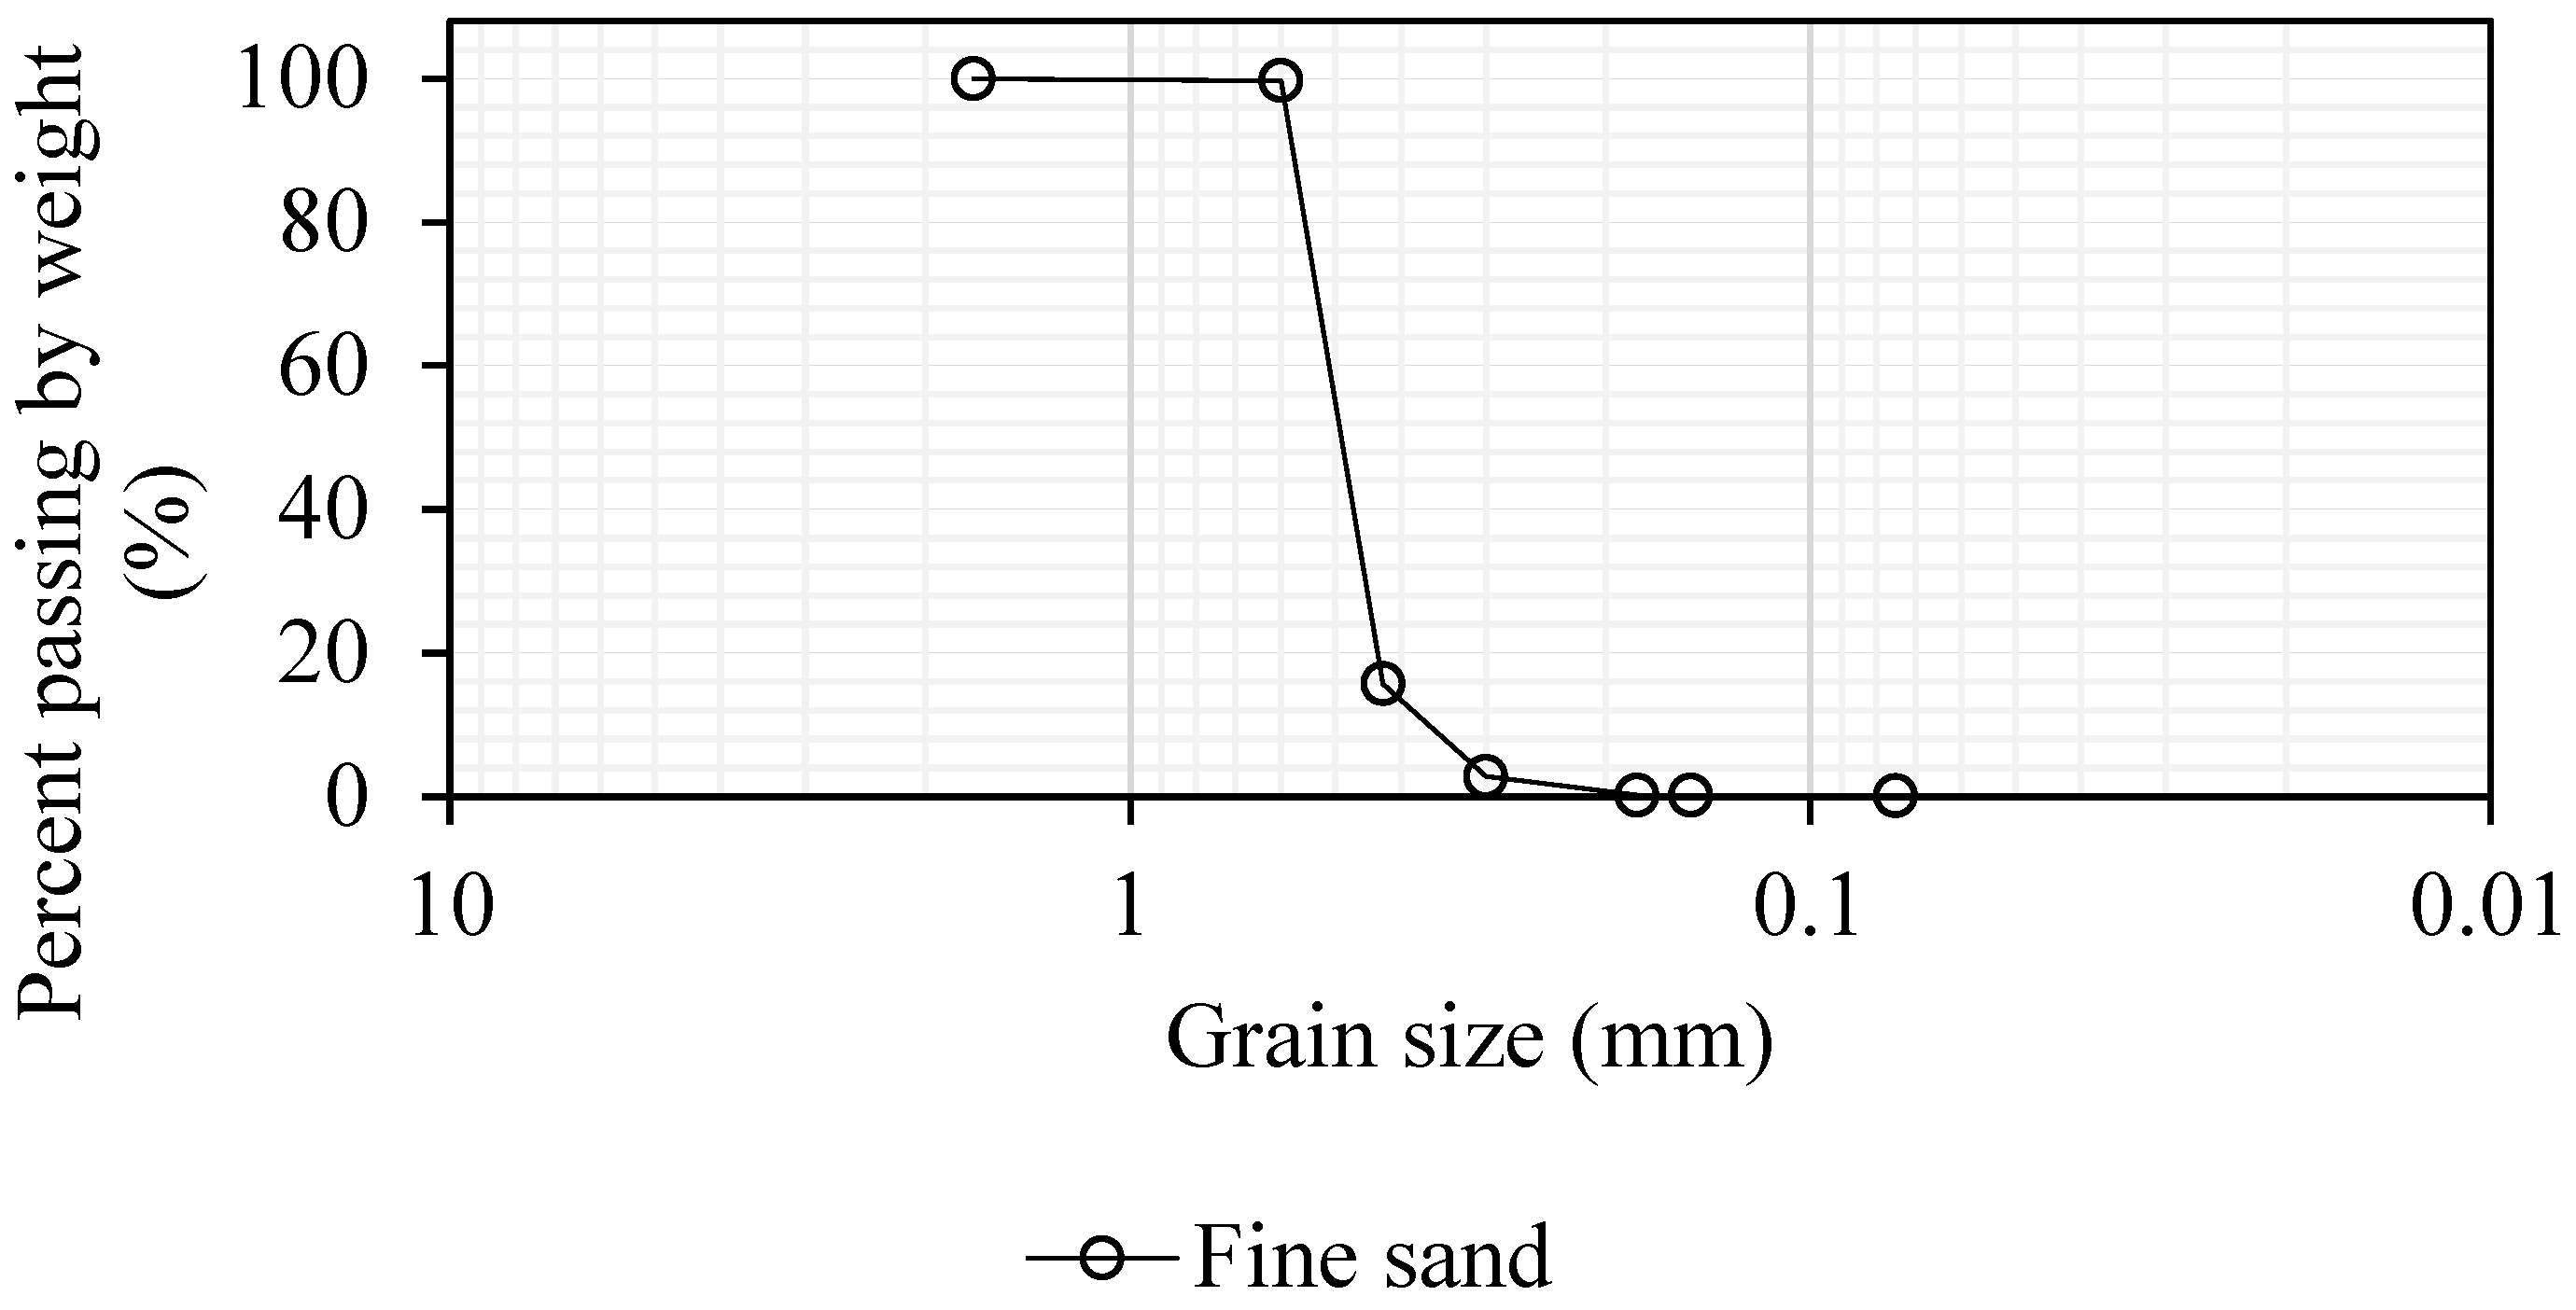
The experimental simulation encompassed the following five main stages: conceptualization, start of the experiment, experimental procedures, and data analysis of the results. The first stage was the conceptualization of the model; it included selecting the porous media, geometry, stratigraphy, initial values, and detailed assumptions considered for each experimental assessment. It was followed by start of the experiment, including the application of a packing technique, and adjustments of the hydraulic head and the concentration of NaCl. The grain distribution of the porous media is presented in Figure 2, and details of the experimental procedure are described in Table 2.
The packing of the sand was performed following Weber’s methodology [69]. It consists in filling the main compartment with 10 cm of water, followed by 10 cm of sand using a PVC tube connected to a funnel located just above the water’s surface when filling. After the first layer of sand is filled, 10 cm more of water is added, and later the next layer of 10 cm of sand is added as well. This method prevents air entrapment, and the previous sieve of sand reduces variations in the grain size.
The two boundary conditions were set up at the beginning of the experiment, the hydraulic head-controlled boundary condition was set with the side chambers, guaranteeing that the 0.01 m difference on the hydraulic head was maintained during the experiment. The freshwater head was maintained at 1.01 m and the saltwater head at 1 m. The flux-controlled boundary condition was set with a freshwater influx of 15.7 cm3/s.

4. Computational Methods

The computational design for the domain was based on the experimental setup. The groundwater flow, solute transport, and salinity intrusion dynamics have been thoroughly explained in previous research. The design includes the application of Darcy’s law, Fick’s law, and the continuity equations.
ρ S h h f t + ε ρ c c t = ρ K h f
Equation (1) describes the groundwater flow in terms of the hydraulic head, where ρ [ML−3], S h [L−1], hf [L], ε [-], c [ML−3], t, K [LT−1], and ρ f [ML−3] are the density of the fluid, specific storage in terms of the hydraulic head, groundwater head, porosity, concentration of salinity, time, hydraulic conductivity of the fresh groundwater, and initial fluid density, respectively.
c t = D x 2 c x 2 + D y 2 c y 2 c v x x + c v y y
Equation (2) describes the rate of increase in the concentration per unit volume of porous media, considering that the main drivers are the contribution of dispersion to the changes in the solute mass and the advection of solute mass into or out of the control volume, where D x [L2T−1] and D y [L2T−1] are the dispersion tensors in the x and y directions, and v x [LT−1] and v y [LT−1] are the average fluid velocities in the x and y directions.
ρ = ρ f + ρ s ρ f c s c f c
Equation (3) describes the density change in the function of the concentration inside the control volume, where ρ s [ML−3] is the density of the saltwater, estimated to be 1026 kg/m3; c s [ML−3] is the concentration of the salinity in saltwater of 35 kg/m3; and c f [ML−3] is the concentration of the salinity in freshwater of 0 kg/m3.
The governing equations of salinity intrusion were adapted to the software interfaces to maintain consistent input and compare the simulated results.

4.1. COMSOL Multiphysics

4.1.1. Fluid Properties

COMSOL applies simplified equations of fluid transport in porous media considering Darcy’s law. It utilizes a comprehensive graphical user interface (GUI) that facilitates the selection of governing equations and their application to a previously specified control volume.
v = K x h f x K y h f y
Equation (4) is a summarized version of Darcy’s law, and it is applied by COMSOL to describe the groundwater flow dynamics without concentration changes, where v [LT−1], K x [LT−1], K y [LT−1], h f x , and h f y are the flux velocity vector through the porous medium, saturated hydraulic conductivities in the x and y directions, assuming anisotropy in a homogeneous aquifer, and the hydraulic gradients in the x and y directions, respectively.
v = k μ P
In terms of pressure, Equation (5) is applied, where k [L2], μ [ML−1T], and P [ML−1T2] are the permeability of the solid matrix, fluid viscosity, and fluid pressure, respectively.
ρ S p t + ε ρ C C t ρ · k μ p ρ g = 0
COMSOL applies Equation (1) to describe the fluid dynamics in terms of pressure; therefore, Equation (1) takes the form of Equation (6), where S [L−1], p [ML−1T2], k [L2], μ [ML−1T], and g [LT−2] are the specific storage, fluid pressure, permeability of the solid matrix, fluid viscosity, and gravitational acceleration vector, respectively.

4.1.2. Solute Transport

COMSOL applies Equation (2) to describe solute transport. For the initial values of the concentration, 0 mol/m3 is the initial value for the concentration of the salinity of freshwater and 1 mol/m3 as a normalized concentration of the salinity of saltwater. This is a common approach in simulating solute transport with COMSOL. With the concentration and the density difference, the coefficient beta was calculated to act as the coefficient of density changes in the groundwater due to gradients in the initial concentrations and density. This approach is also applied in codes such us SUTRA and SEAWAT [70]. To ensure that the concentration of 35 kg/m3 NaCl from the experiment was applied to the simulation, the saltwater density was initially set to 1026 kg/m3. Equation (3) was applied to calculate a variable density for the concentration changes inside the control volume.

4.2. ANSYS Fluent

4.2.1. Fluid Properties

ANSYS Fluent uses the general equation of mass conservation and momentum conservation to represent the groundwater flow dynamics.
( ρ v ) t + · ρ v v = P + · τ + F
In contrast to COMSOL, ANSYS Fluent starts with an expanded description of the groundwater flow, as described by Equation (7), and allows for adjusting the equation depending on the model characteristics, where τ [ML−1T2] and F [ML−1T2] are the external source and sink of the momentum, respectively.
ε   ρ t + · ρ v = 0
To describe the dynamics of this experimental setup, Equation (7) was modified considering that the velocity of the porous media is very slow compared to a turbulent flow. Therefore, the derivative term that includes density and velocity tends to zero, which similarly occurs to the acceleration term, neglecting the first and second terms of the equation. Another consideration is that there is no shear stress, neglecting the second term on the right side. The mentioned adjustments are reflected in Equation (8).
Replacing Equations (3) and (5) in Equation (8), the mass conservation is modified, and it also takes the form of Equation (1).

4.2.2. Solute Transport

Dispersion is the main driver of solute transport for both software applications. The governing equations used by ANSYS Fluent and COMSOL are based on Fick’s law and the mass conservation equation of the concentration of solute in the fluid.
c t = · D ¯ c · v c + F
The equations are coupled to produce a second Fick’s law augmented with the transport term as expressed in Equation (9), where D ¯ [L2T−1] and F [ML−3T] are the dispersion tensor and an external source or sink of the concentration. Neglecting external sources or sinks of the concentration and applying this definition to a two-dimensional control volume, Equation (9) takes the form of Equation (2).

4.3. Conditions for the Numerical Simulation Applying CFD

The groundwater flow of Equation (1) was solved considering the no-flow boundary conditions at the top and bottom boundaries, while the lateral boundaries exhibited two different conditions to compare the salinity intrusion dynamic. On the freshwater side, one scenario assumed a head-controlled boundary, while another assumed a flux-controlled boundary. On the seawater side, the boundary was set as a head-controlled boundary for both cases. However, applying the flux-controlled boundary using COMSOL Multiphysics on the freshwater side does not yield information on the pressure within the domain, which can lead to unstable models that do not converge. Applying the velocity boundaries on the freshwater side provides no information on the pressure within the domain, which means that it can generate estimates of the pressure change instead of the pressure field.
To solve this issue, a point constraint was introduced, which arbitrarily fixed the pressure at a point within the domain in the COMSOL setup.
p = p 0 ρ g H
The initial values set for COMSOL Multiphysics and ANSYS Fluent include the initial pressure as a function of a variable density, as described in Equation (10). The initial values were set as 0 m/s and 0 Pa for the velocities and pressure, respectively. A volume force was applied as the consideration of the gravity effect.
p f = p 0 ρ f g H
p s = p 0 ρ s g H
where ρ is the variable density, g is the gravity constant, and H is the elevation resulting from the total geometry height and the water table location. The pressure boundary conditions for the freshwater side set for both cases are a function of the constant density of freshwater ( ρ f ) and the constant density of seawater ( ρ s ) on the seaward side. The expression representing such boundary conditions are Equations (11) and (12).
ε · ρ v = ρ s v 0
For the flux-controlled seaward boundary condition case, the expression representing the boundary condition is a function of the flux velocity inlet, expressed as Equation (13). The parameters considered for the numerical simulation of the experimental setup for the specified head-controlled and flux-controlled boundary conditions are listed in Table 3.
The parameters in Table 3 were chosen on the basis of the characteristics of the performed salinity intrusion experiment and the commonly applied parameters used in the literature to represent a homogeneous unconfined aquifer. Additionally, the specific characteristics of the sand used to represent the porous media in the setup were considered. The density of the tap water used in the experiments was measured at 995 kg/L. This same value was, therefore, used for the numerical simulations.

5. Results and Discussion

5.1. Experimental Response

The experiment was designed to explore the response of the saline wedge and the toe location using two different freshwater-side boundary conditions. The experiment was configured using fine silica sand with an average particle diameter of 0.39 mm and 0.43 porosity, to recreate the fully saturated porous medium. The two boundary conditions were the head-controlled and flux-controlled boundary condition, and the beginning of the experiments started with a fully saturated aquifer with freshwater. For the head-controlled case, the seawater-side head was maintained as 1 m and the freshwater side as 1.01 m, creating a hydraulic pressure difference of 206.29 Pa. During the first three hours of the experiment, a one-centimeter lens was observed on the top of the seaside boundary. This lens has been observed in previous experiments and it corresponds to freshwater outflow through the seaside boundary. To address this outflow and guarantee a constant water level on the sea side, the experimental setup included the right-side chamber.
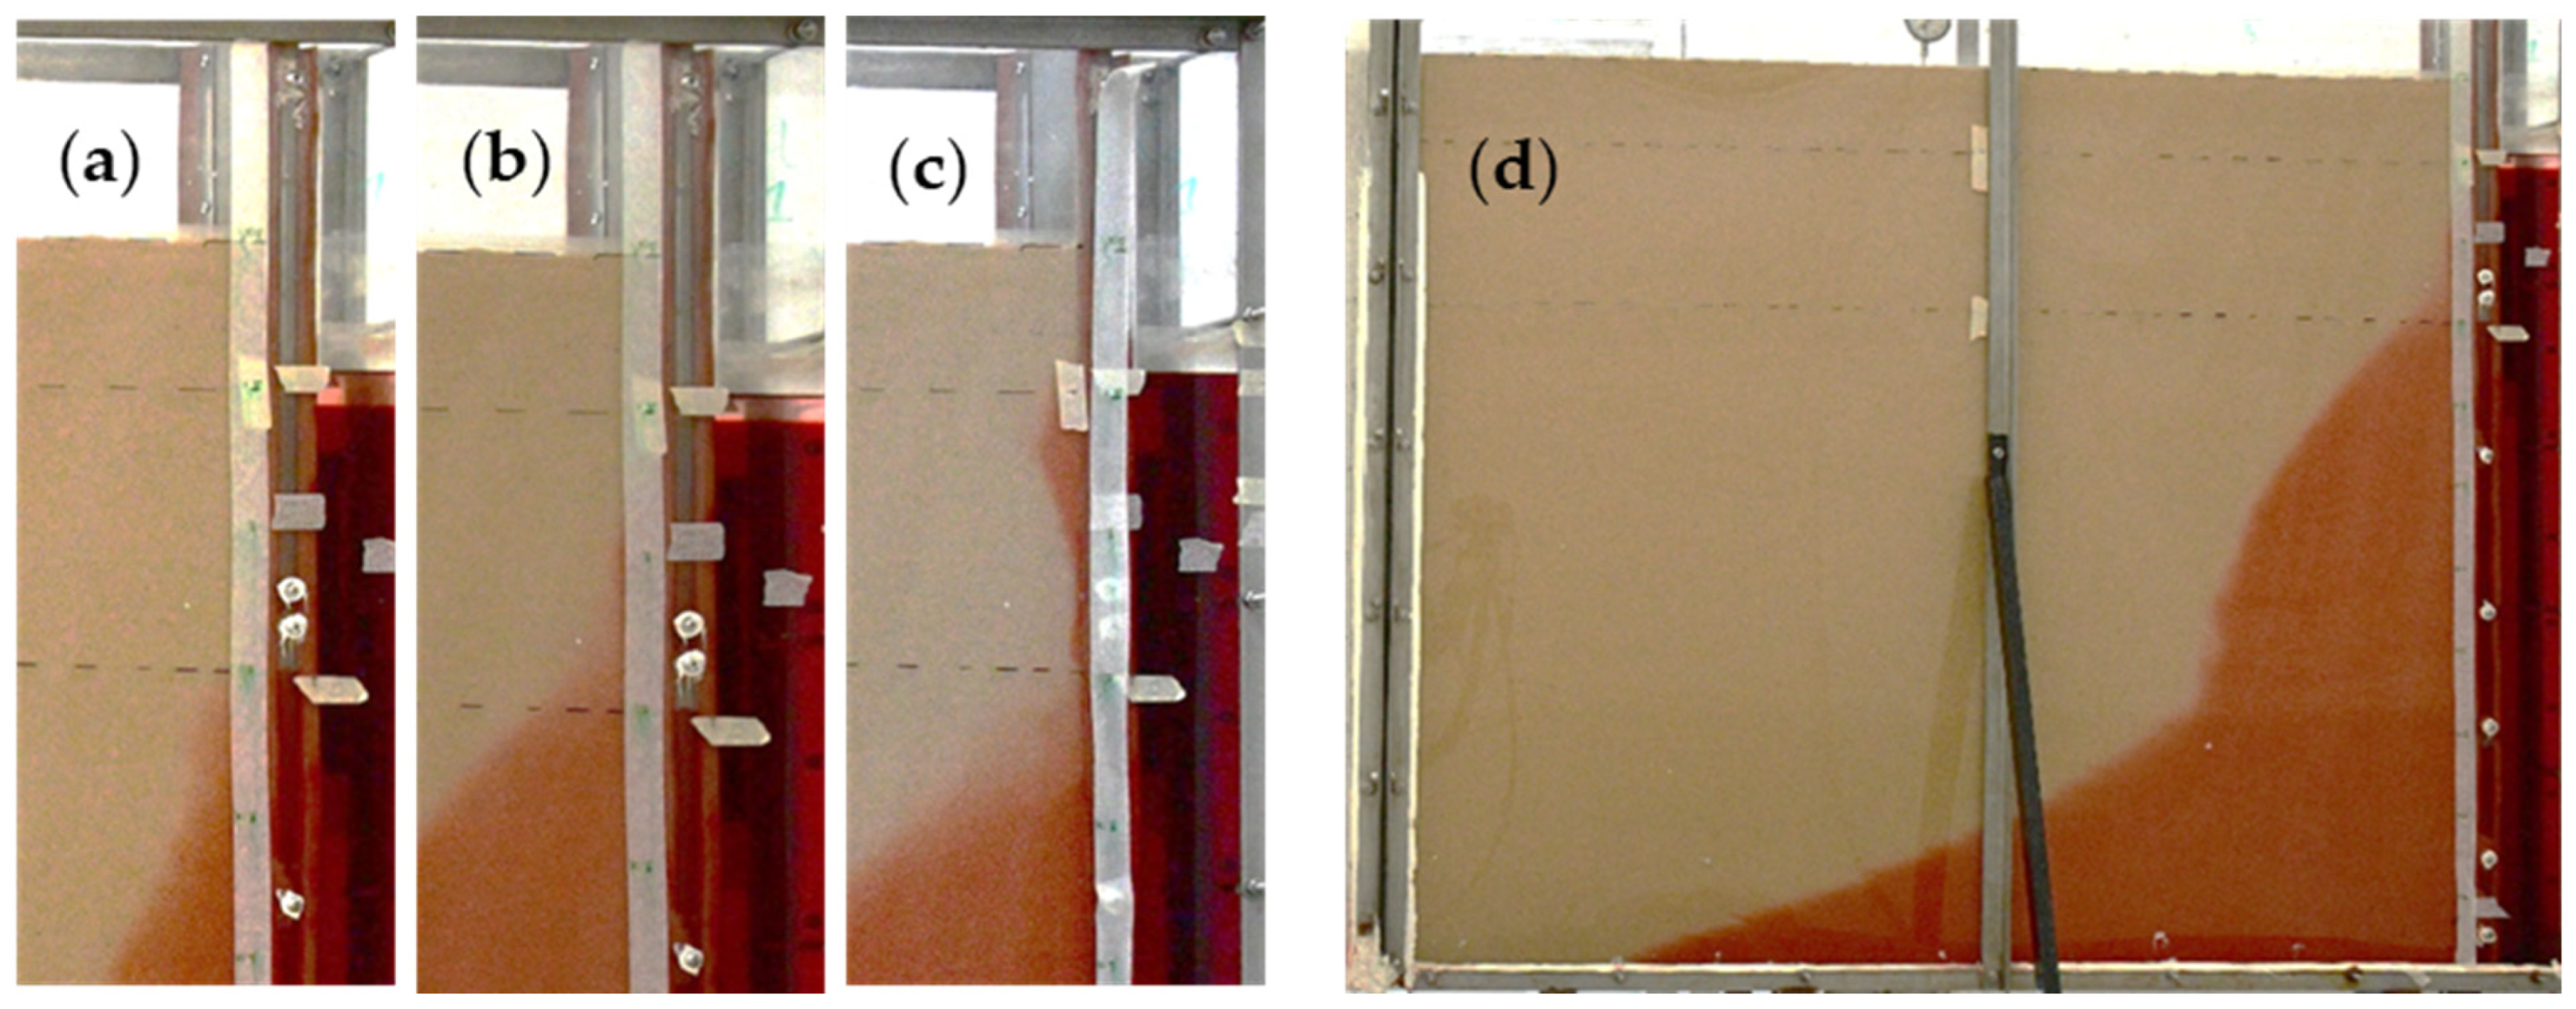
This control and reduction in the freshwater outflow lowers the hydraulic gradient toward the saltwater side, and allows further intrusion of the saline wedge [71]. On the saltwater compartment, the 1 cm lens could potentially lower the seawater density, water pressure, and the initial geometry of the saline wedge [72,73]. Figure 3 depicts the saline wedge movement during the first three hours, while the 1 cm lens was still visible in the saltwater compartment.
The final location of the saline toe after it reached a quasi-steady state took 7 h and had a length of 1.6 m for the head-controlled condition. The definition of the quasi-steady state’s position followed the approach of Robinson et al. and Ahmed et al. [18,74]. A quasi-steady-state condition is said to be achieved when no significant movement is observed at the toe of the saltwater wedge; the period of no movement for this study was 30 min. The flow-controlled condition, on the other hand, allows for the head at the freshwater-side boundary to increase when salinity intrusion occurs [73]. The consequent increase in the inland head maintains the pressure gradient and reduces the rate of salinity intrusion. It was evidenced during the experiment that the saline wedge under the flux-controlled condition was more stable than with the head-controlled condition, and the freshwater lens was observed on the top of the sea side but not for a significant amount of time. The quasi-steady-state toe location for the flux-controlled condition was at 1.15 m. It is important to highlight that even when pilot-scale studies consider head-controlled conditions, this approach is not defined for variable density systems; instead, the pressure difference is recommended as an equivalent to the hydraulic head [73]. In order to avoid complications with in situ measurements, flux-controlled conditions and flux measurements are preferred [19,75,76].

5.2. Convergence Criteria and Mesh Sensitivity in COMSOL and ANSYS Fluent

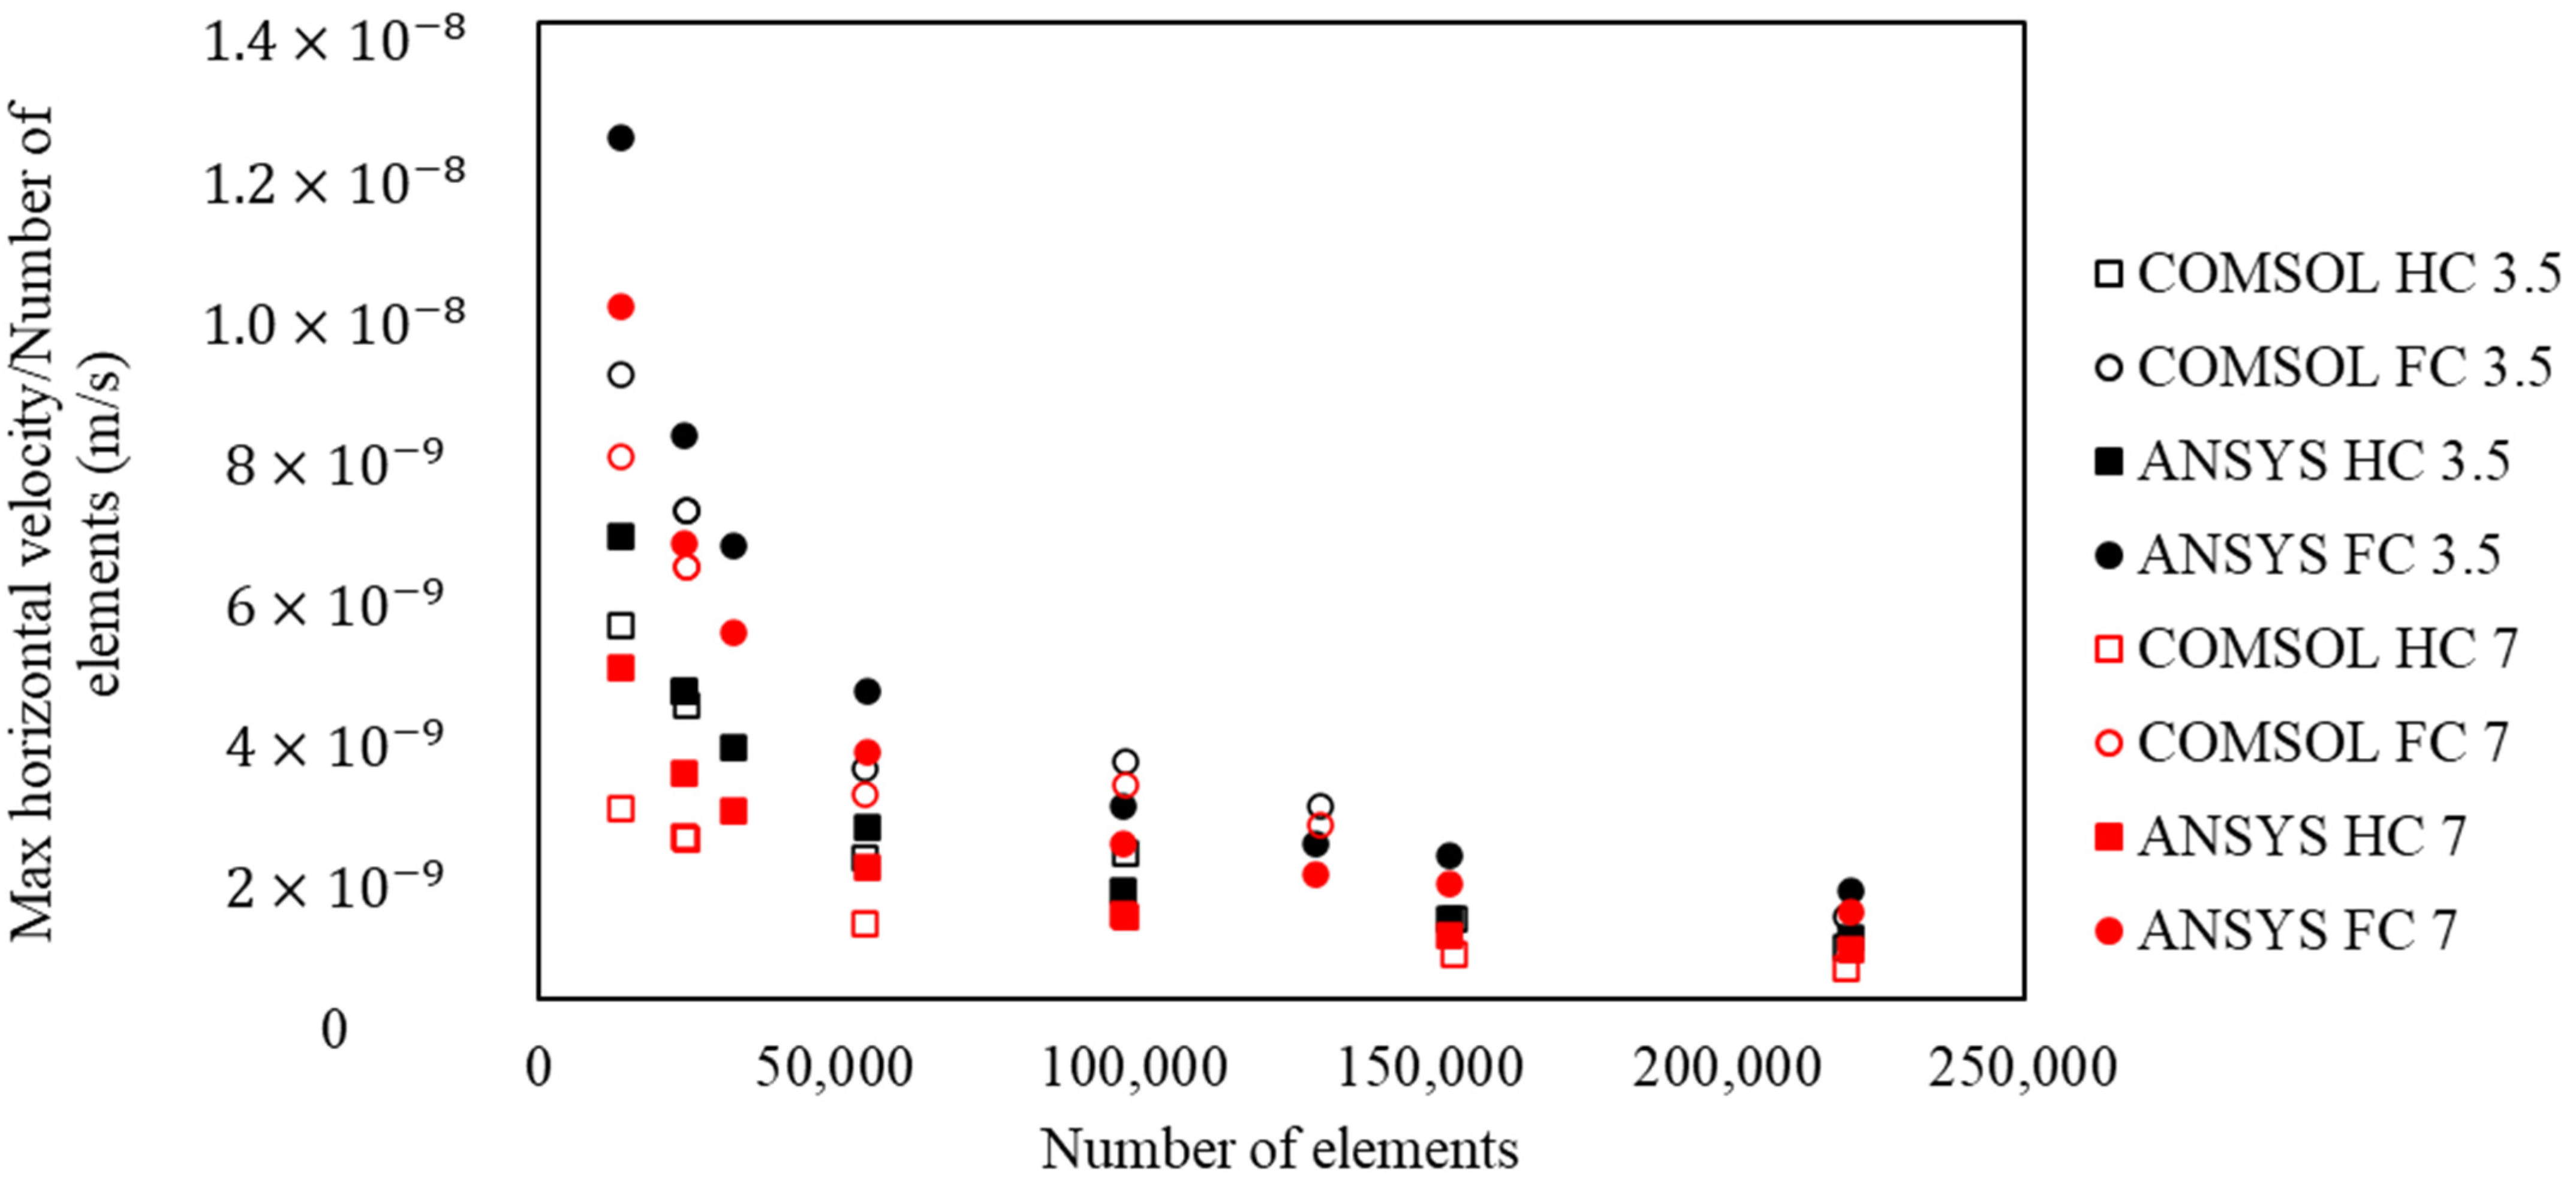
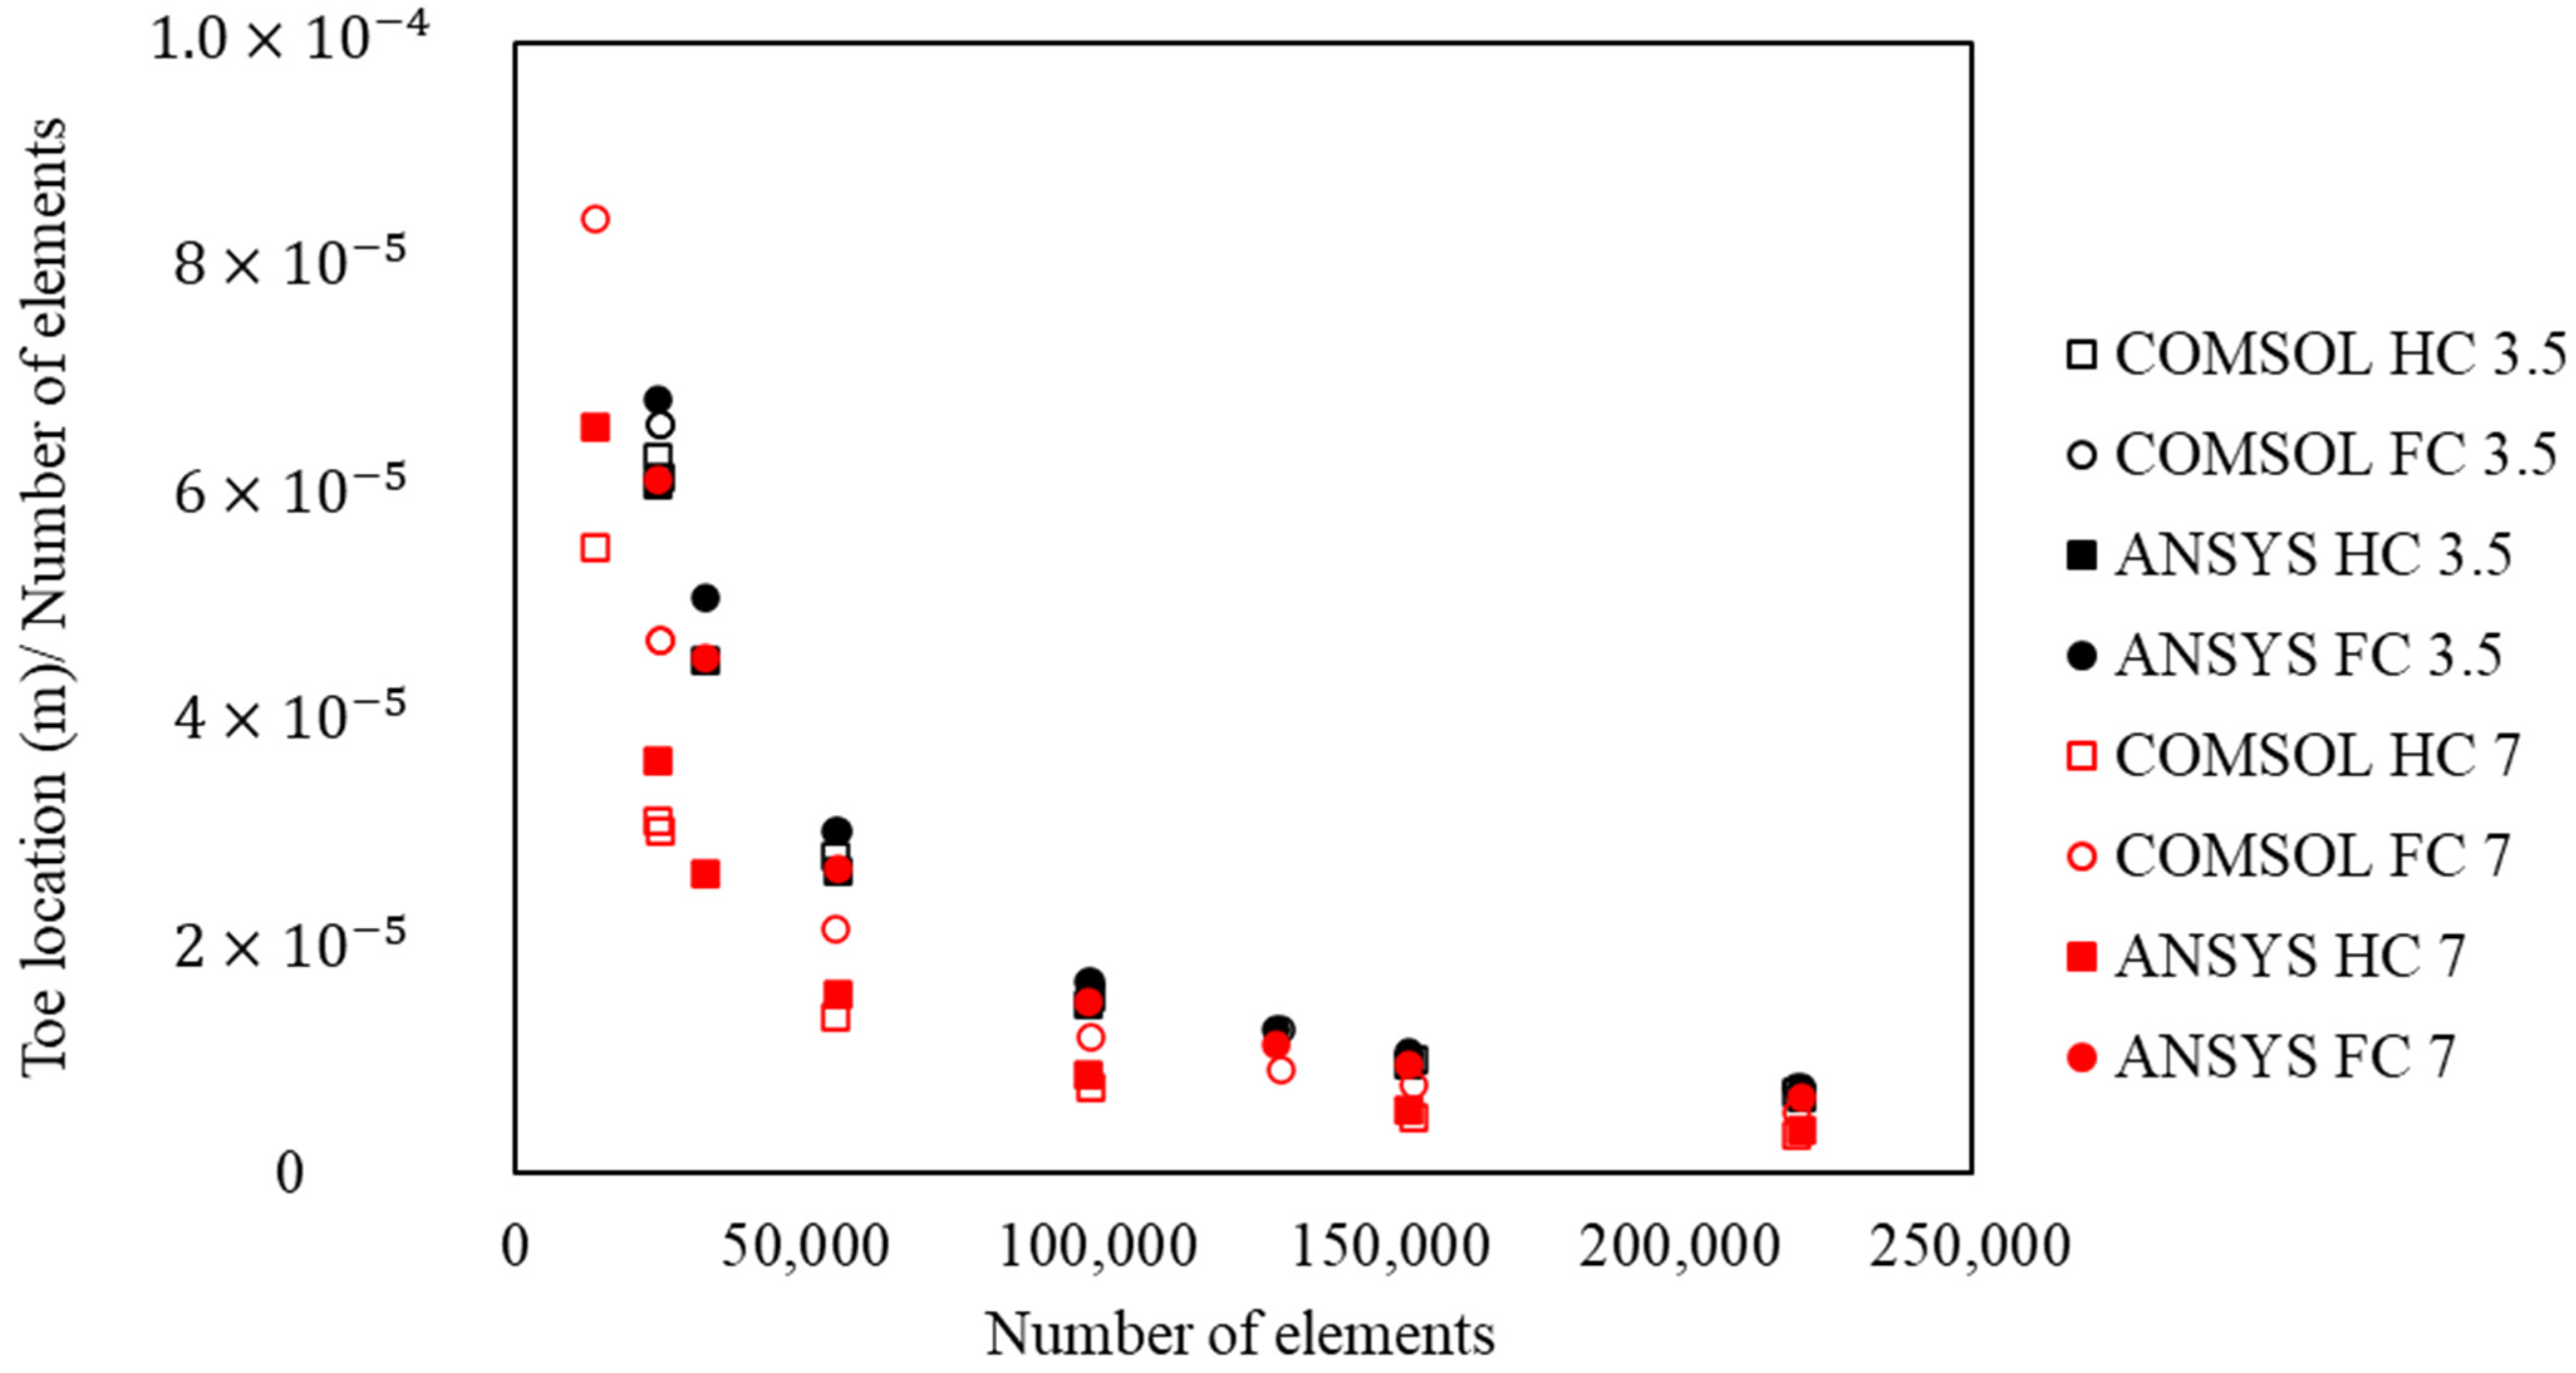
For the mesh sensitivity, the maximum horizontal velocity and the concentration profile were analyzed. To eliminate variations induced by the mesh, identical meshes were used in COMSOL and ANSYS Fluent. The Courant number was considered as a target to select the time step and the element size of the selected mesh. Every simulation had the same parameters, except for the mesh size and boundary conditions. The results of the two boundary conditions, the head-controlled condition and the flux-controlled condition, were compared. Seven different meshes were considered for COMSOL and ANSYS. The finest mesh had a total of 220,000 elements and an element size of 0.005 m; the coarser mesh had a total of 13,930 elements and an element size of 0.01 m. For the head-controlled condition, the mesh that allowed for the independence of the results was the one with 154,000 elements and an element size of 0.006 m; when the mesh was imported into COMSOL and to ANSYS Fluent, the amount of data changed to adjust the software applications’ discretization, resulting in a total of 154,030 elements for COMSOL and 153,222 elements for ANSYS Fluent. The toe location and the average and horizontal velocities were analyzed with the changes of meshes, reaching a close agreement between COMSOL and ANSYS with a mesh of approximately 154,000 elements. The mesh sensitivity results from the horizontal velocity and estimated toe location are presented in Figure 4 and Figure 5, respectively.
For the various meshes, the value of the maximum horizontal velocity changed, and the slope of the change in the velocity decreased after mesh 6 with 154,000 elements. The results with the coarse meshes show instability until the number of elements of the mesh increased to more than 55,000.
For the flux-controlled condition, the selected mesh had 131,000 elements and an element size of 0.0065 m. Figure 4 shows the variation in the horizontal velocity in the domain with each mesh after seven hours and three and half hours, respectively. The average error of the velocity between COMSOL and ANSYS Fluent was 0.0019%, and it did not substantially affect the formation of the saline wedge or the toe location. Figure 5 presents the results for the toe location after 3.5 h and 7 h of the simulation. It was evidenced that the results for the toe location with both software applications achieved better agreement when the mesh was refined with more than 55,000 elements. The discrepancies in the toe location results at 3.5 h of simulation was 3.5% under the head-controlled condition with a mesh of 154,000 elements and 0.8% under the flux-controlled condition with a mesh of 131,000 elements. A summary of the characteristics of the selected meshes for the head-controlled and flux-controlled conditions is provided in Table 4.
The mesh with 131,000 elements for the flux-controlled condition and 154,000 elements for the head-controlled condition provided the best balance between computational cost and accuracy. Finer meshes generally improve a solution’s accuracy but at a significantly increased computational cost. The selected mesh densities were found to sufficiently capture the key features of the flow field without excessive computational expense.

5.3. Spatial and Temporal Discretizations

The physics of COMSOL allow for the design of stable meshes. The mesh definition with COMSOL was established once the toe location and velocity were not affected by the mesh size. The time step for COMSOL was set as an adaptable time step, which allowed for the model to adjust to the completed number of iterations and identify the remaining steps to reach a converged solution. COMSOL also allows for a parametric sweep that facilitates the postprocessing of the simulation, creating plots for various experimental times and for previously assigned conditions. This saves time and computer memory and generates acceptable results.
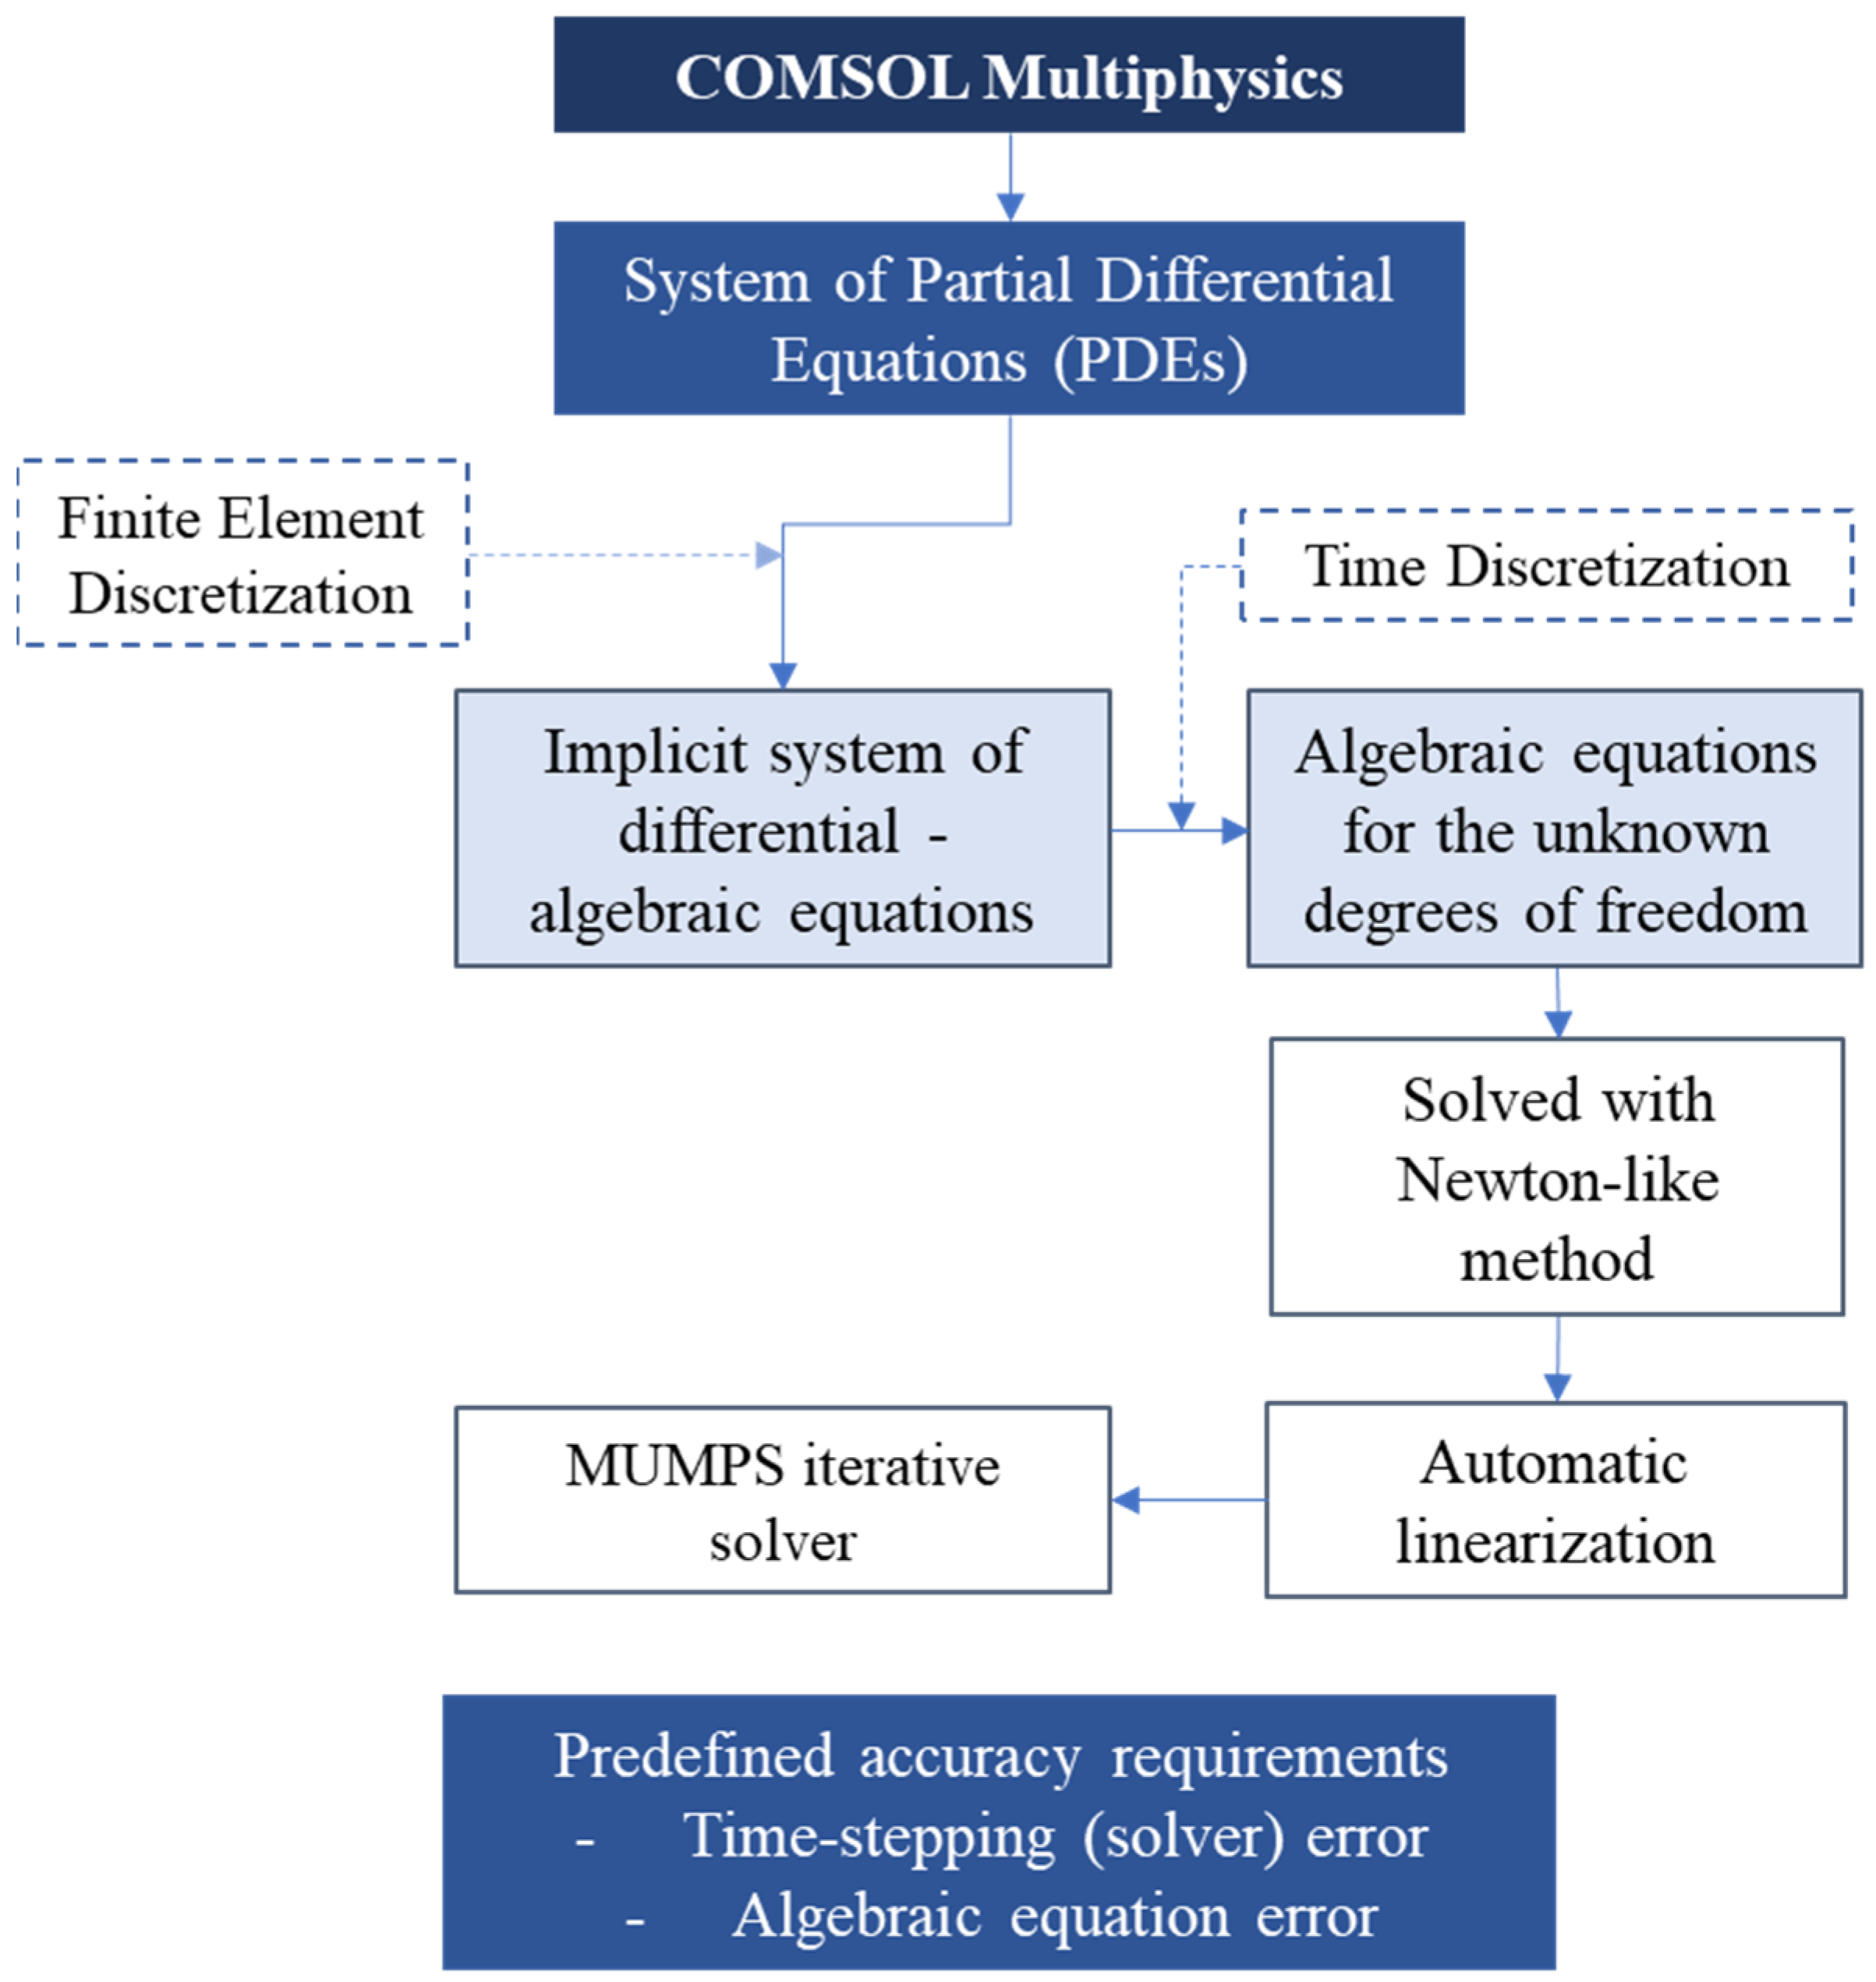
The time step selected was 1 s, and the total simulation required 25,200 time steps with a maximum of 20 iterations per time step. It was evidenced that both results were very close; however, the ANSYS simulation with the manual time step required 18 GB of memory compared to the 0.19 GB required by the free time step simulation applied by COMSOL. Some of the model characteristics considered by COMSOL Multiphysics and ANSYS Fluent are presented in Table 5, and the discretization scheme used by COMSOL Multiphysics is presented in Figure 6.

5.4. Head-Controlled Boundary Conditions

Experimental and numerical simulations considering a head-controlled boundary condition show a longer saline toe and larger saline wedge. Previous studies attributed this to the assumption that both the freshwater side and saltwater side maintain a constant hydraulic head. However, a recent study by Laabidi and Bouhlila included an approach that relates the location of the saline wedge to the stability of the bottom of the freshwater lens, also known as the stagnation point [77]. Additionally, aquifers characterized by a constant hydraulic head boundary have been shown to strongly depend on the hydraulic conductivity of the aquifer. Slight changes in the hydraulic conductivity generate an increase in the inland movement of the saltwater intrusion toe [71,78].
For pilot-scale applications, guaranteeing a constant hydraulic head on the sea side with constant density is a common approach to simulating head-controlled aquifers. Nevertheless, for large-scale systems, maintaining such conditions can be challenging, and it could restrict the dynamic nature of the sea side, considering that the hydraulic head is not defined in variable density systems [79].
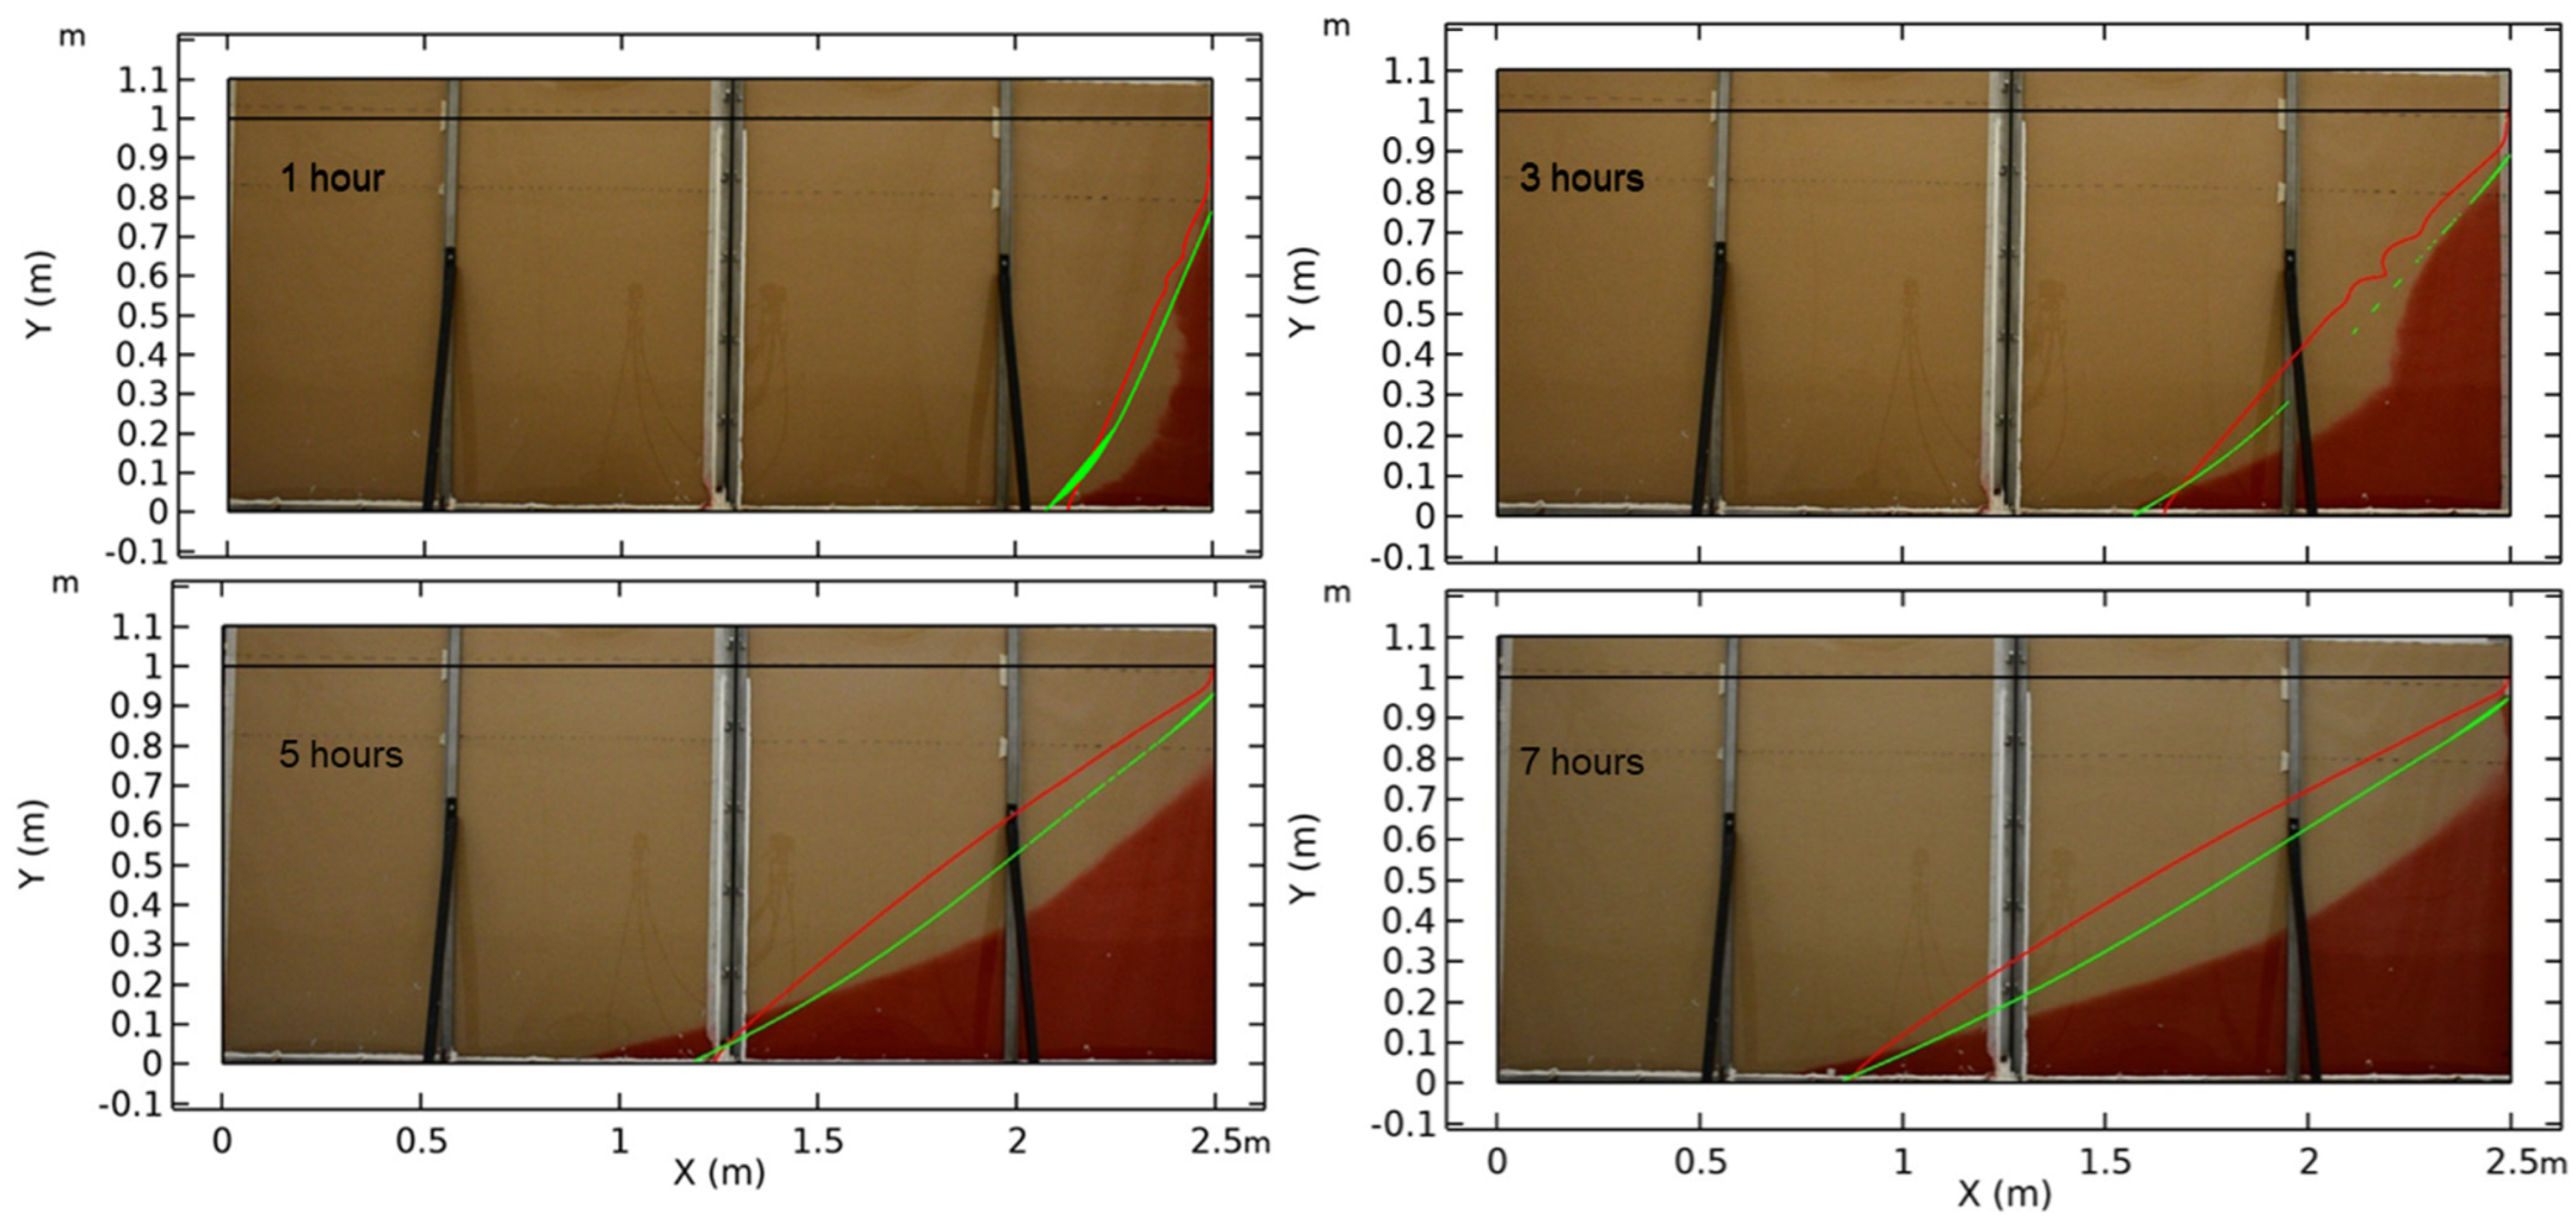
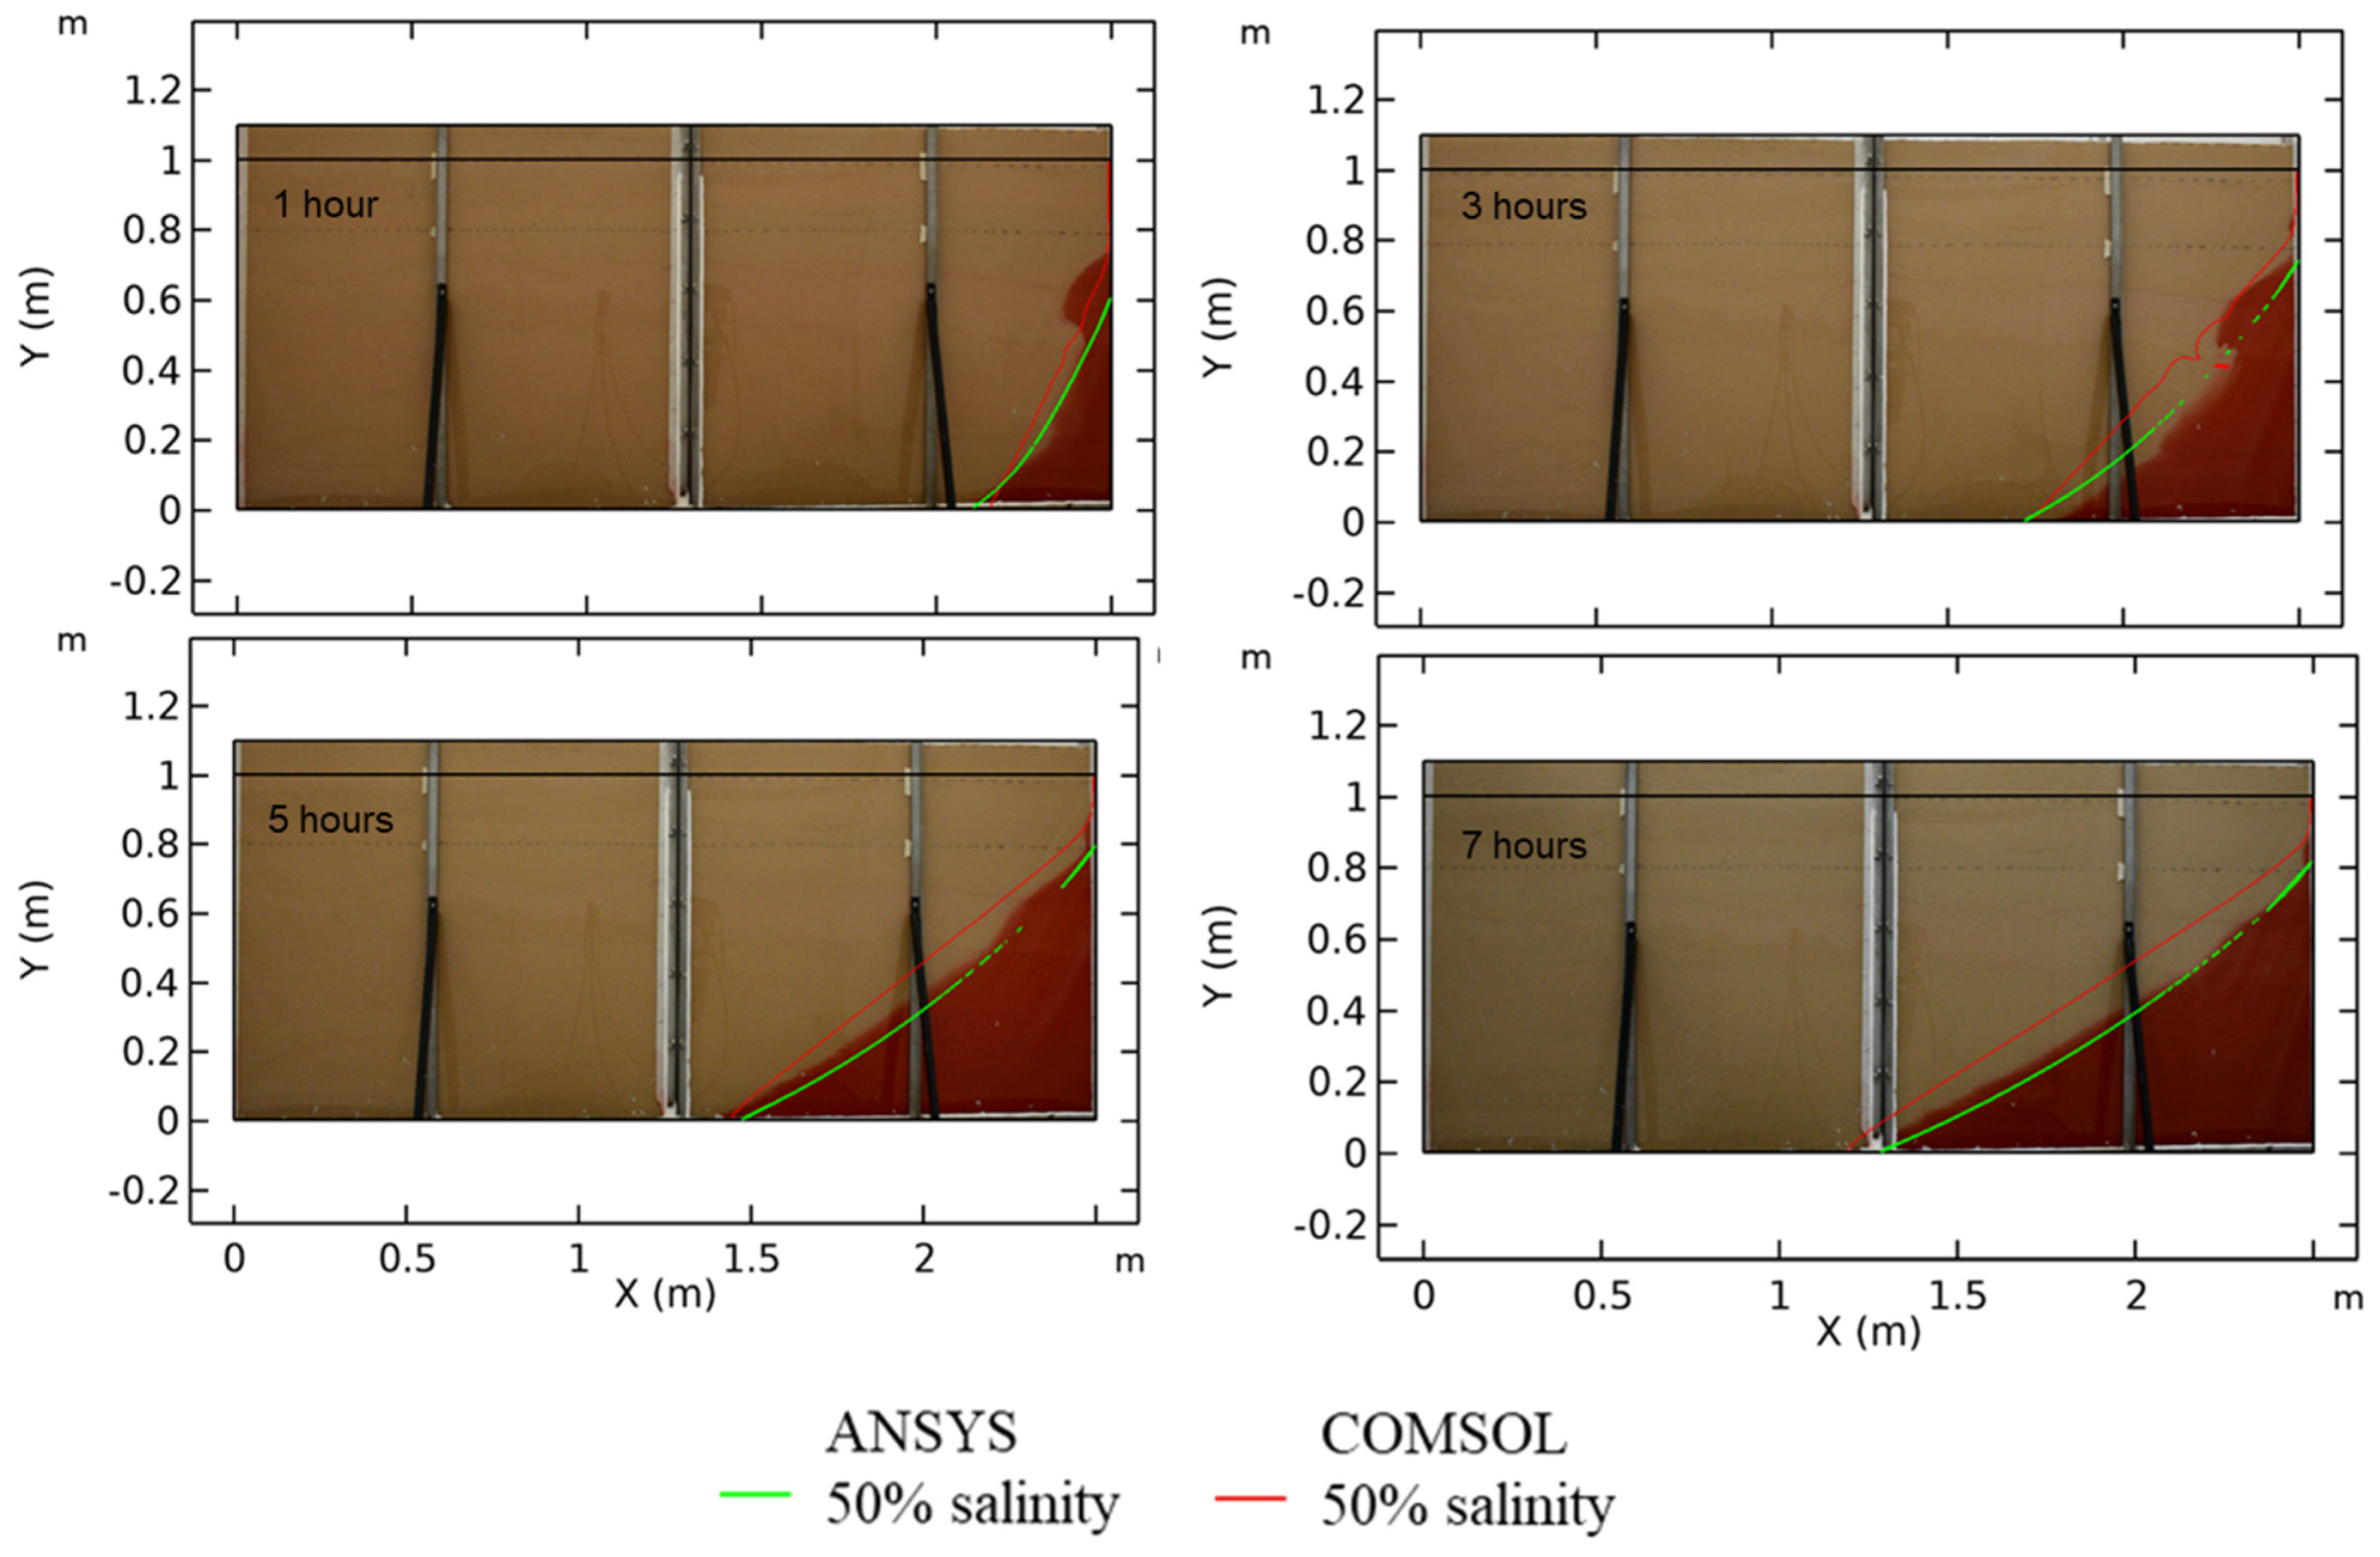
The photographs captured at 1, 3, 5, and 7 h (Figure 7) after the red dye injection illustrate the movement of the tracer from the seawater boundary to the freshwater boundary. The experimental data indicate that it took seven hours for the plume to travel through the flow domain and reach a quasi-steady-state condition. The saltwater wedge generated by ANSYS Fluent is represented by a solid light-green line, depicting 50% salinity, while the COMSOL wedge is depicted by a solid red line, representing 50% salinity. As part of the simulation study, the dispersion parameters αL and αT were adjusted within an expected range to match the observed plume’s spreading levels. A qualitative analysis suggests that the dispersivity values of αL = 0.01 m and αT = 0.001 m approximate the solute transport pattern and toe location. These values align with the recommended range provided by previous studies [80].
Figure 7 shows that the concentration gradient at the beginning of the experiment created instability in the intrusion of salinity along the seawater side. However, comparing the location of the 50% salinity concentration, the location of the saline toe coincided with the COMSOL simulation’s results and was close to ANSYS Fluent’s location for the saline toe. Similarly happens for the toe location after three and seven hours.
The experimental saline wedge after five hours and seven hours, when it was close to achieving a quasi-steady state, showed a similar form as saline wedges reported in studies with medium–fine sands [81,82].
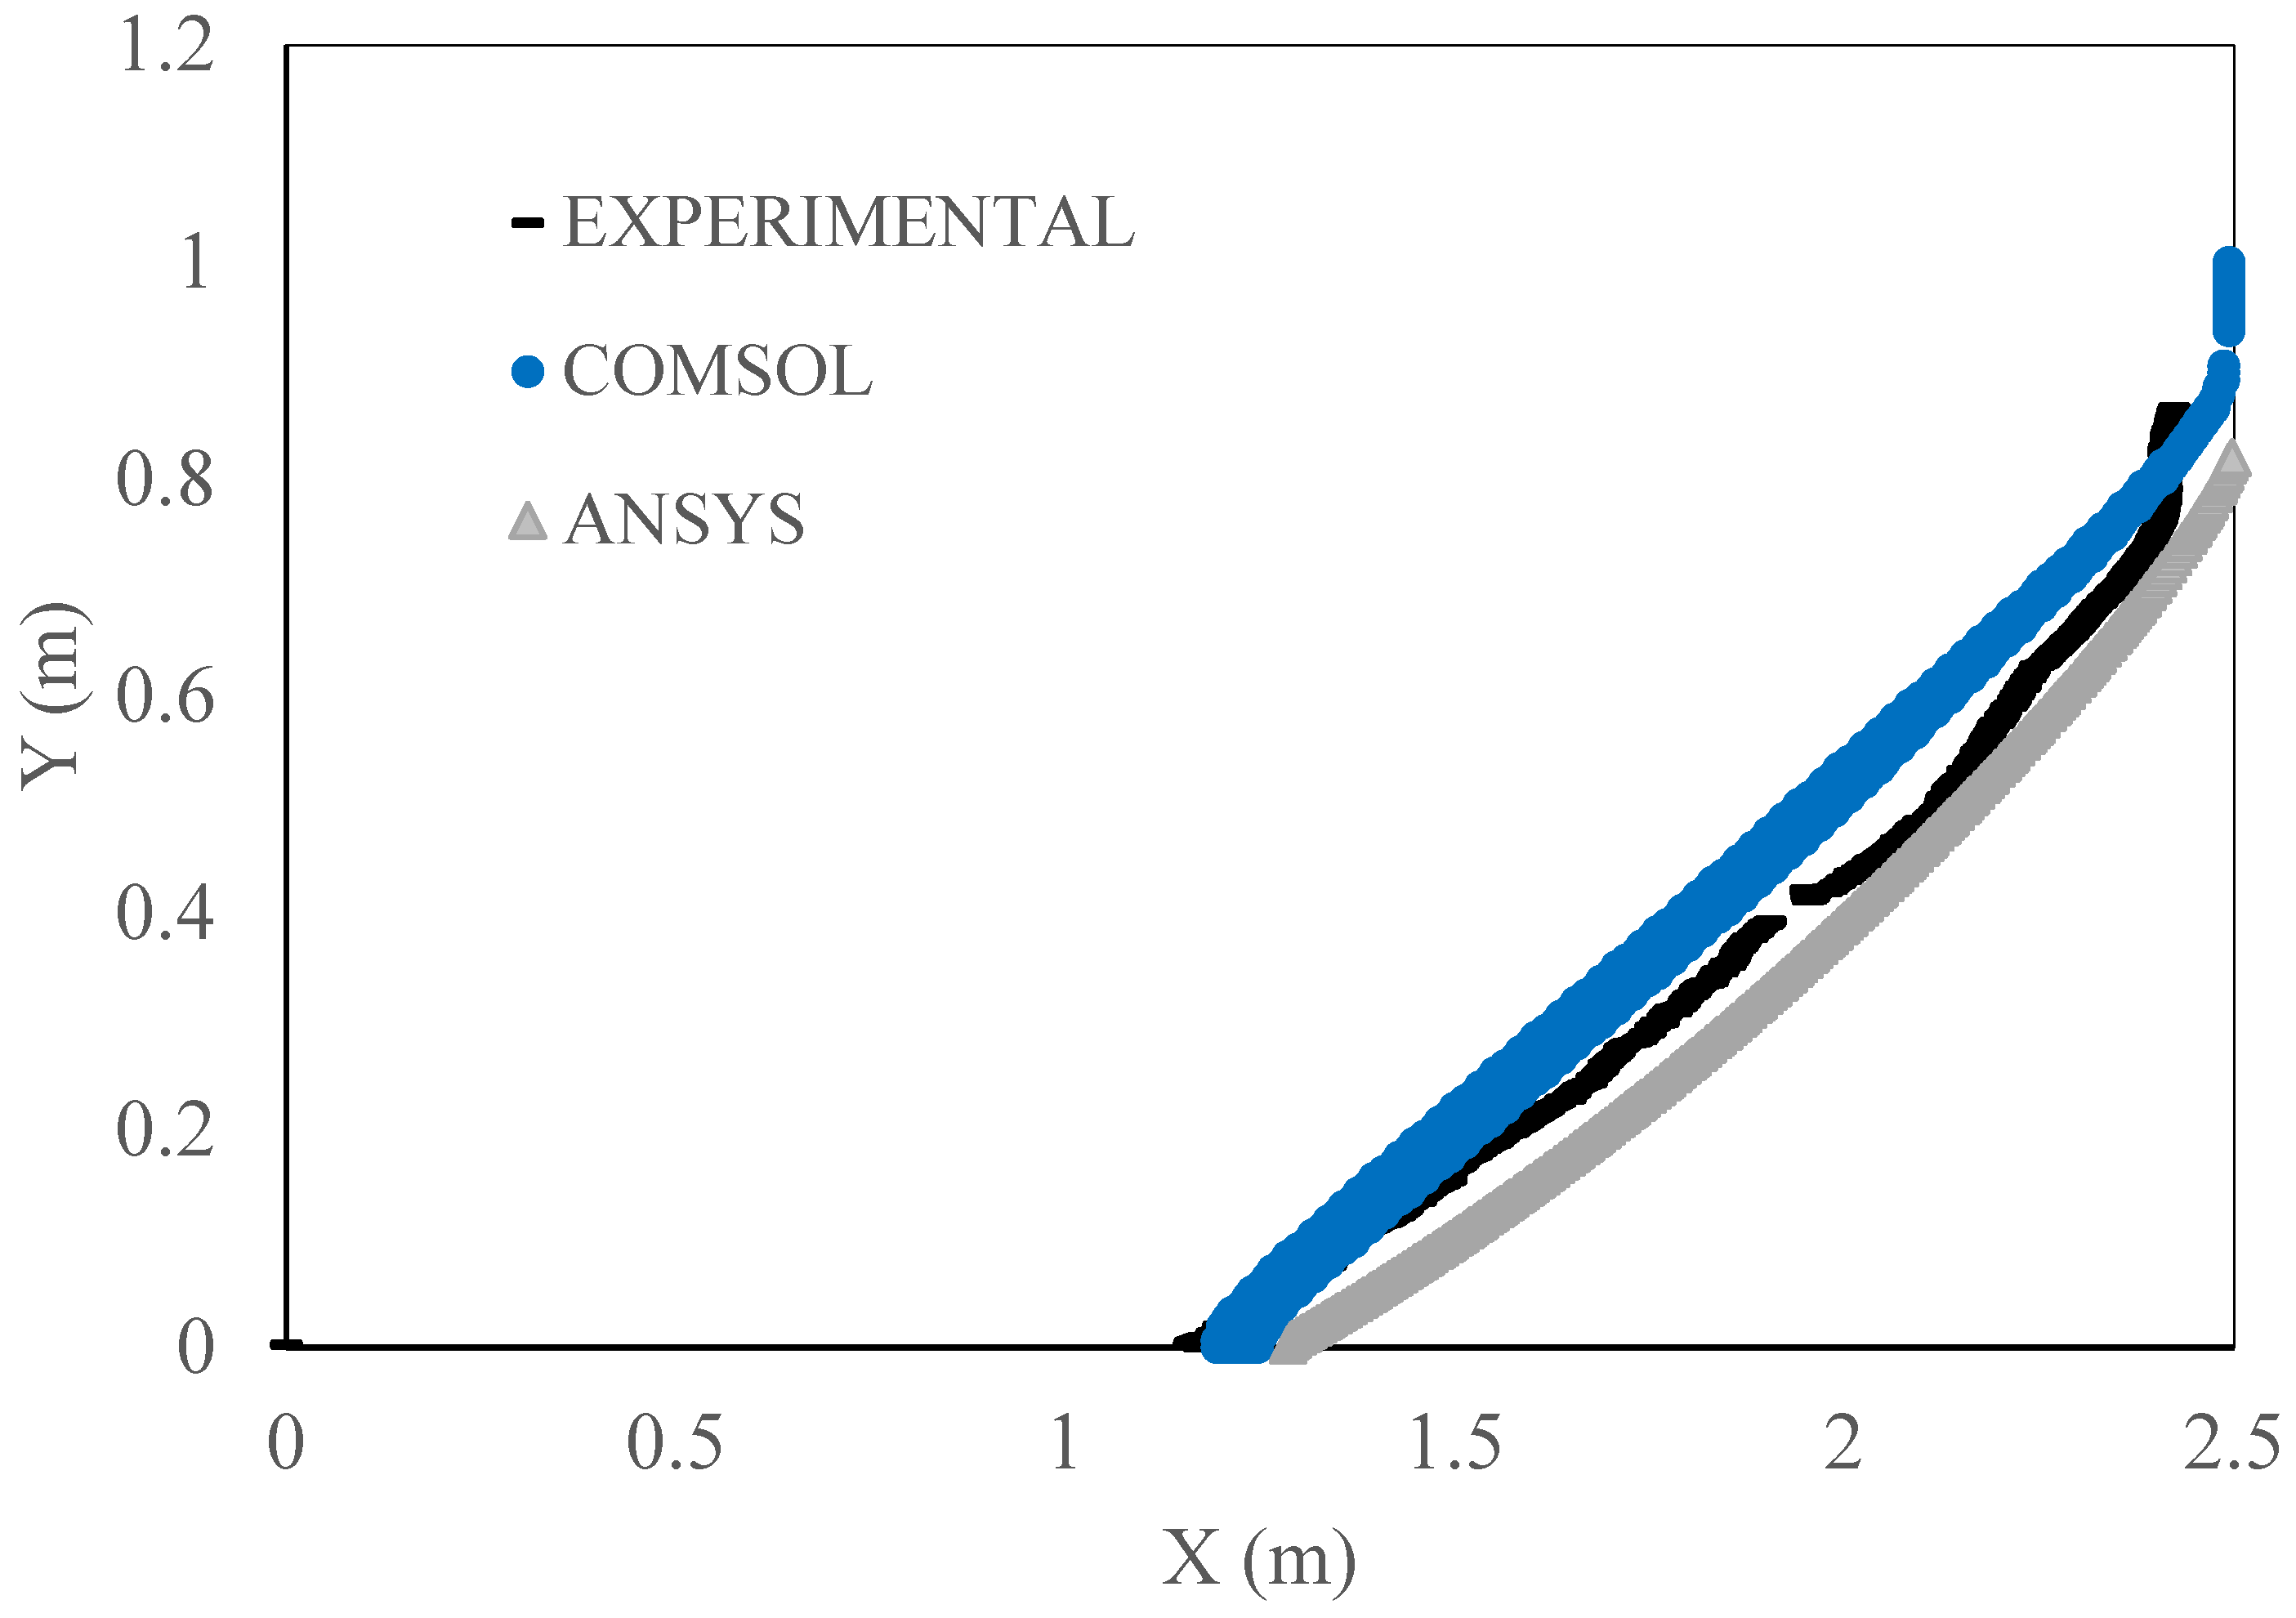
Figure 8 illustrates that the location of the saline wedge after seven hours in the experimental simulation exhibited better agreement with ANSYS Fluent’s results than with those of COMSOL Multiphysics. The saline wedge generated by COMSOL was longer and showed a wider area for the 50% salinity concentration in the main compartment. The 50% salinity contour was used to illustrate the location of the saltwater–freshwater interface, assuming a sharp interface. This approximation has been widely applied in previous numerical models [7,83,84,85]. As observed in Figure 7, the experimental saline wedge is the transition point at which a contrast between the red dye and no dye is observed. Image analysis was applied to identify the concentration gradient in the transition zone at the quasi-steady state and determine the 50% concentration of the experimental salinity distribution; this analysis followed Etsias et al.’s methodology [21], and it is depicted with the black delineation of the saline wedge, as presented in Figure 8. More detailed image analyses include the use of image optimization and machine learning techniques to improve the observation of the mixing zone [21,86]. Figure 8 depicts the 50% salinity contour for the COMSOL simulation and the ANSYS simulation, and for the experimental data, the saline wedge shows the location where the 50% salinity concentration contour can be observed via photographic analysis. The average absolute error between the COMSOL simulation and the experimental results was a difference of 0.28, and between ANSYS Fluent and the experimental result it was, on average, 0.18. The root mean square error between the COMSOL and experimental results was 0.23, and between ANSYS and the experimental result it was 0.17.
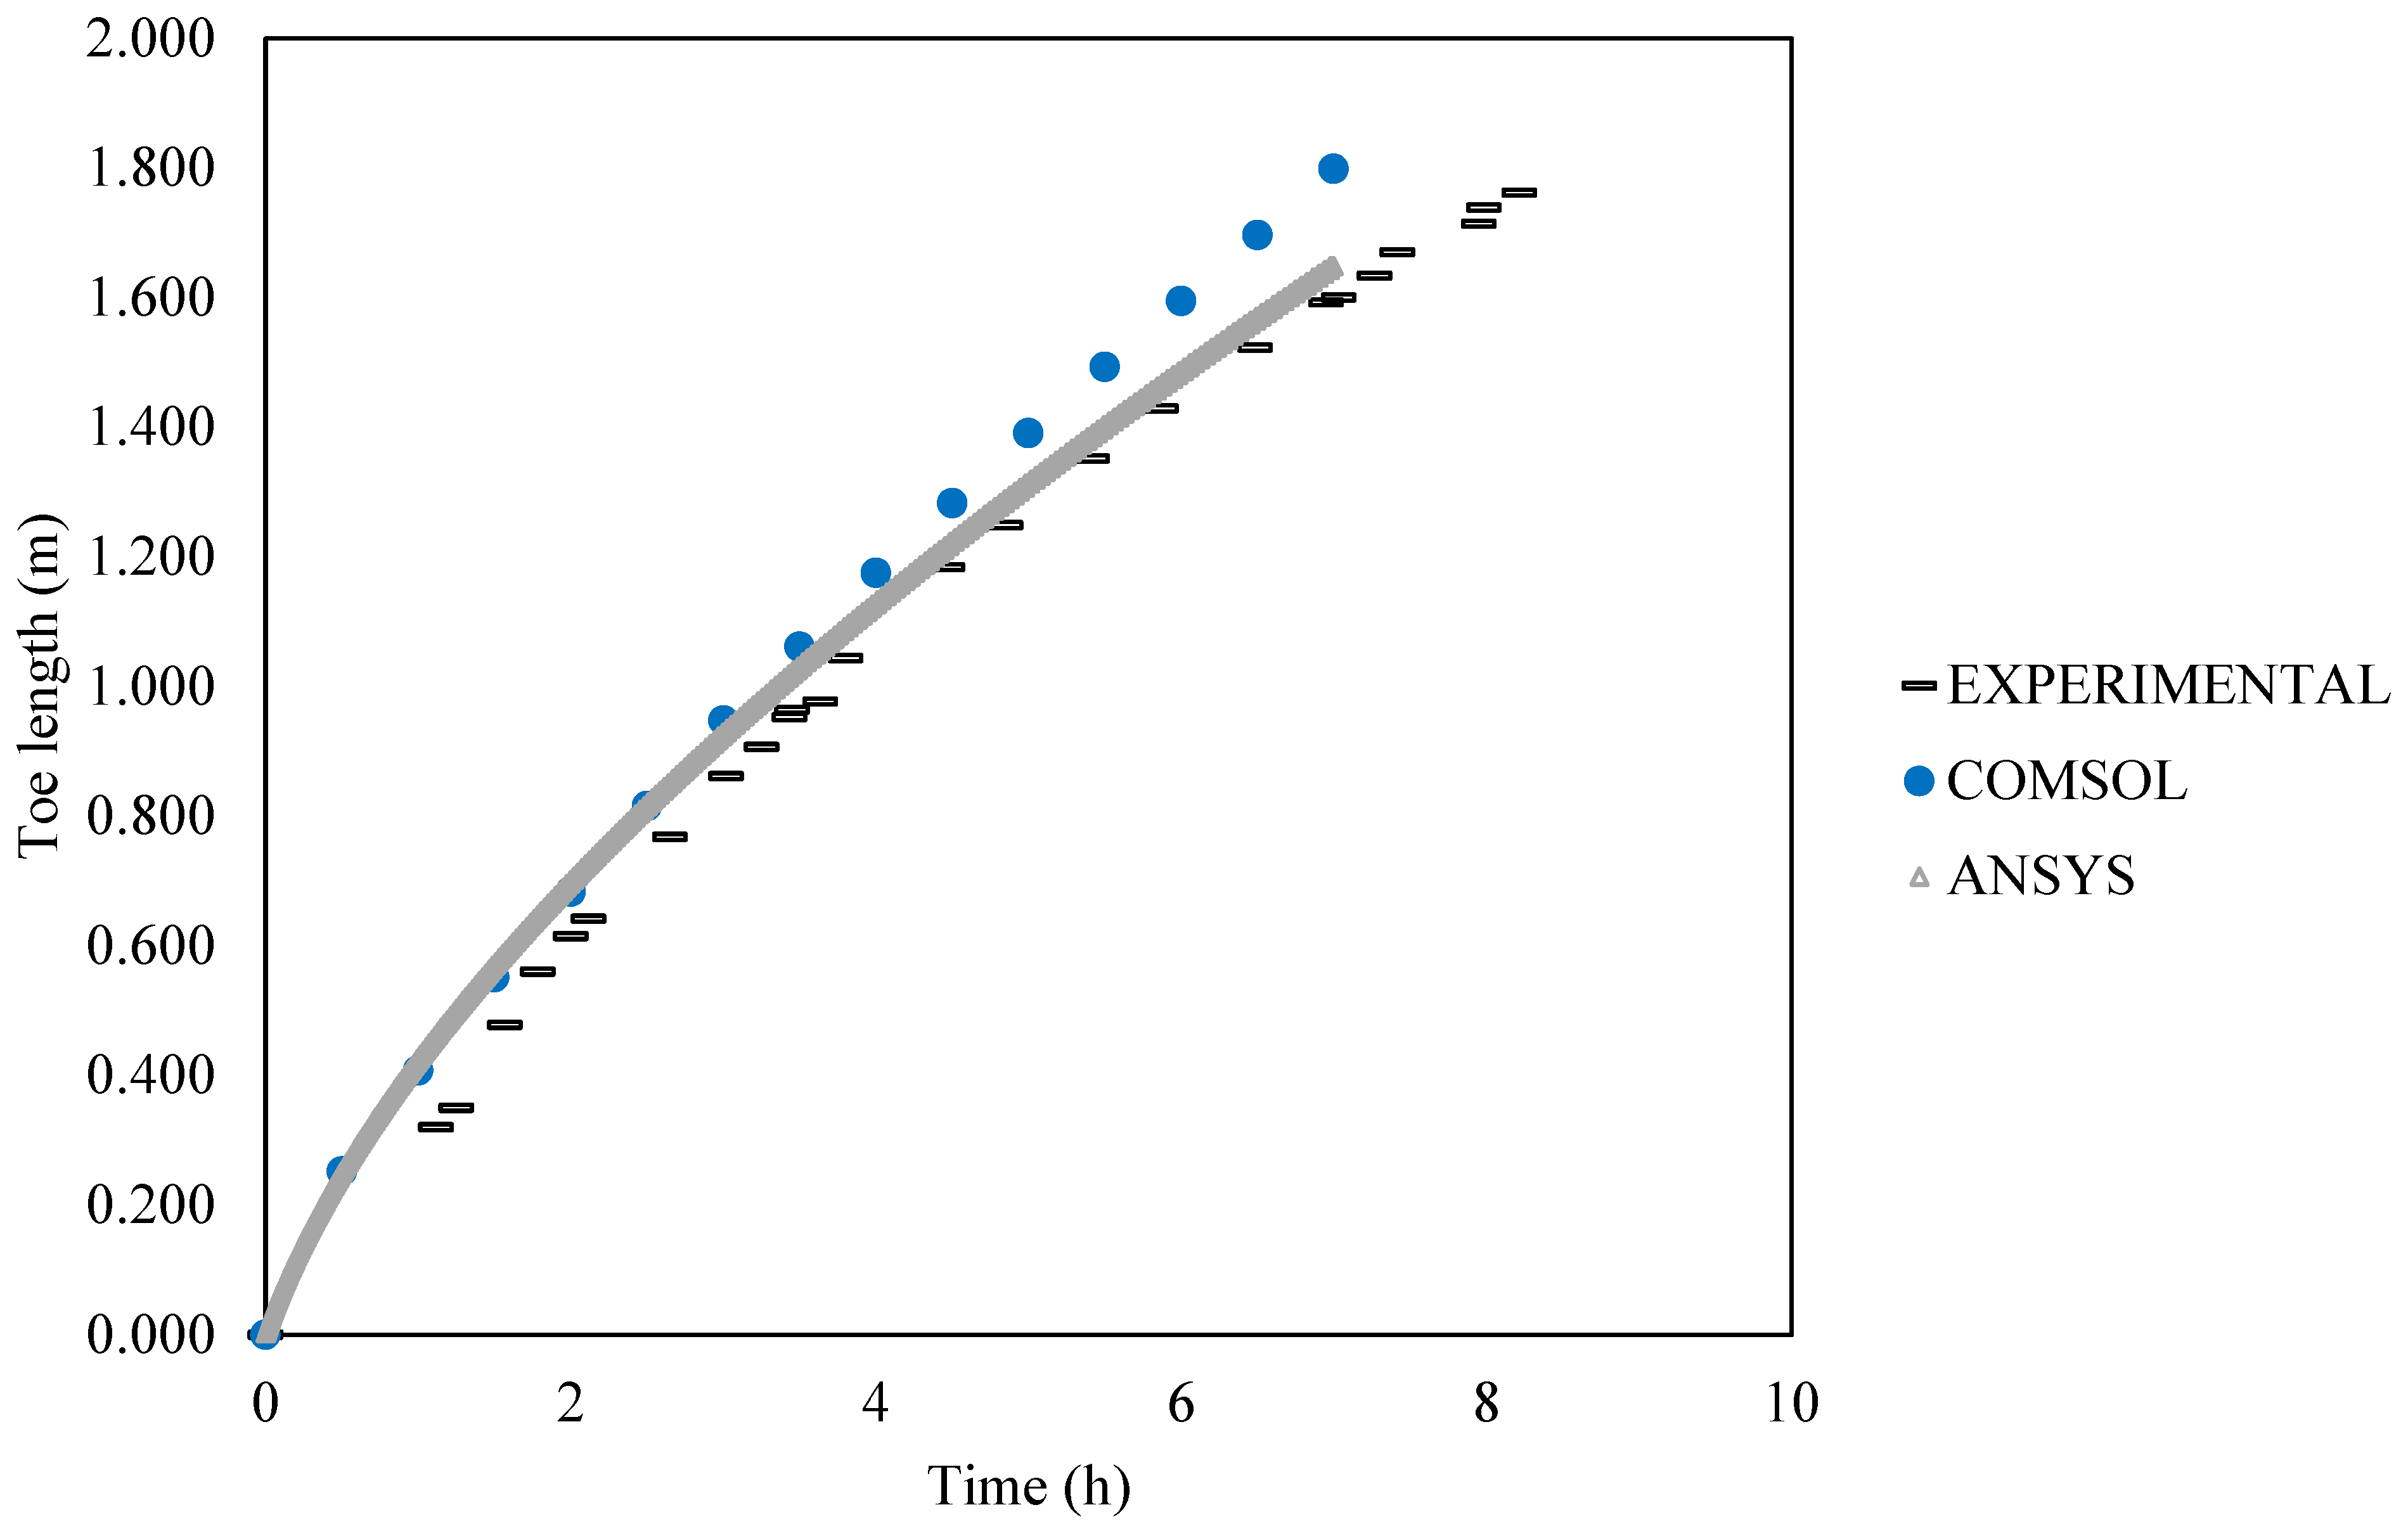
Figure 9 illustrates the trajectory of the saline toe from the seaside boundary at the beginning of the salinity intrusion experiment until the saline wedge reached a quasi-steady state for the experimental data and up to seven hours for the numerical simulations. The values were generated with the resulting location of the toe length over time. The Y-axis shows the location in meters, from 0 m (the saltwater side of the compartment) to the maximum length reached by the saline wedge. The same procedure was followed for the flux-controlled boundary condition.
A comparison of the toe locations over time of the experimental results with COMSOL and ANSYS Fluent revealed a close correlation of the locations estimated by COMSOL and the experimental results during the first four hours of the experiment and between ANSYS Fluent and the experimental results during the last four hours. The maximum toe length predicted by the ANSYS Fluent simulation was 1.65 m, while the toe lengths predicted by the COMSOL simulation and observed in the experimental results were 1.79 m and 1.60 m, respectively, after seven hours. The mean absolute error between the ANSYS simulation and the experimental data for the toe lengths was 5 cm, and between the COMSOL simulation and the experimental result it was 11.1 cm.

5.5. Flux-Controlled Boundary Condition

The displacement of the saline wedge over time for the flux-controlled condition is presented in Figure 10 after 1, 3, 5, and 7 h of the experiment. It shows an initial formation of the wedge followed by a horizontal intrusion at a height of 0.7 cm on the sea side and a continued horizontal movement of the saline toe. After three hours, the horizontal intrusion at 0.7 m displaced vertically downward and mixed with the main saline wedge after five hours. The saline wedge displacements after one hour and three hours show the formation of an upper saline plume, which is associated with the recirculation of salinity and is usually related to wave- and tide-induced events [87,88,89,90]. However, some experiments with large-scale setups also report saltwater circulation under quasi-steady-state conditions for the saline wedge and at the beginning of the experiments [91].
Figure 10 provides a comparison of the experiment’s images and the numerical simulations with COMSOL Multiphysics and ANSYS Fluent. The COMSOL numerical model failed to capture the salinity circulation after one hour, and ANSYS Fluent captured a location close to the transition zone for the overall observed experimental salinity distribution. The numerical approximation denotes a limitation of the numerical conceptualization with Darcy’s equation model to replicate the initial saline wedge dynamics. To avoid the formation of instabilities at the beginning of large-scale salinity intrusion experiments, some authors recommend the design of gates that temporary separate the saturated sand from the seaside boundary [19,92]. Other authors wait for the formation of a quasi-steady-state saline wedge, which can take from close to five hours [83] to 17 h [93] and up to 24 continuous hours [19]. This research and its simulations also considered the wedge to be quasi-stabilized once no displacements by the toe occurred over two consecutive intervals of image captures. The initial form of the wedge did not affect the final seawater wedge form and the movement of the saline toe.
Small-scale salinity intrusion simulations consider the injection of seawater into the sea side, where freshwater was initially situated. This initial injection in some studies results in the mixing of seawater and the movement of freshwater toward the landside [83,94]. Researchers incorporate techniques to reduce the injection time and avoid mixing with the freshwater, such using smaller gates [95] and designing syringe-like injection techniques [89]. Figure 10 depicts a more stable saline wedge reaching a quasi-steady state, which agrees with the numerical models and the form of the saline wedge observed by other authors [59,83,95].
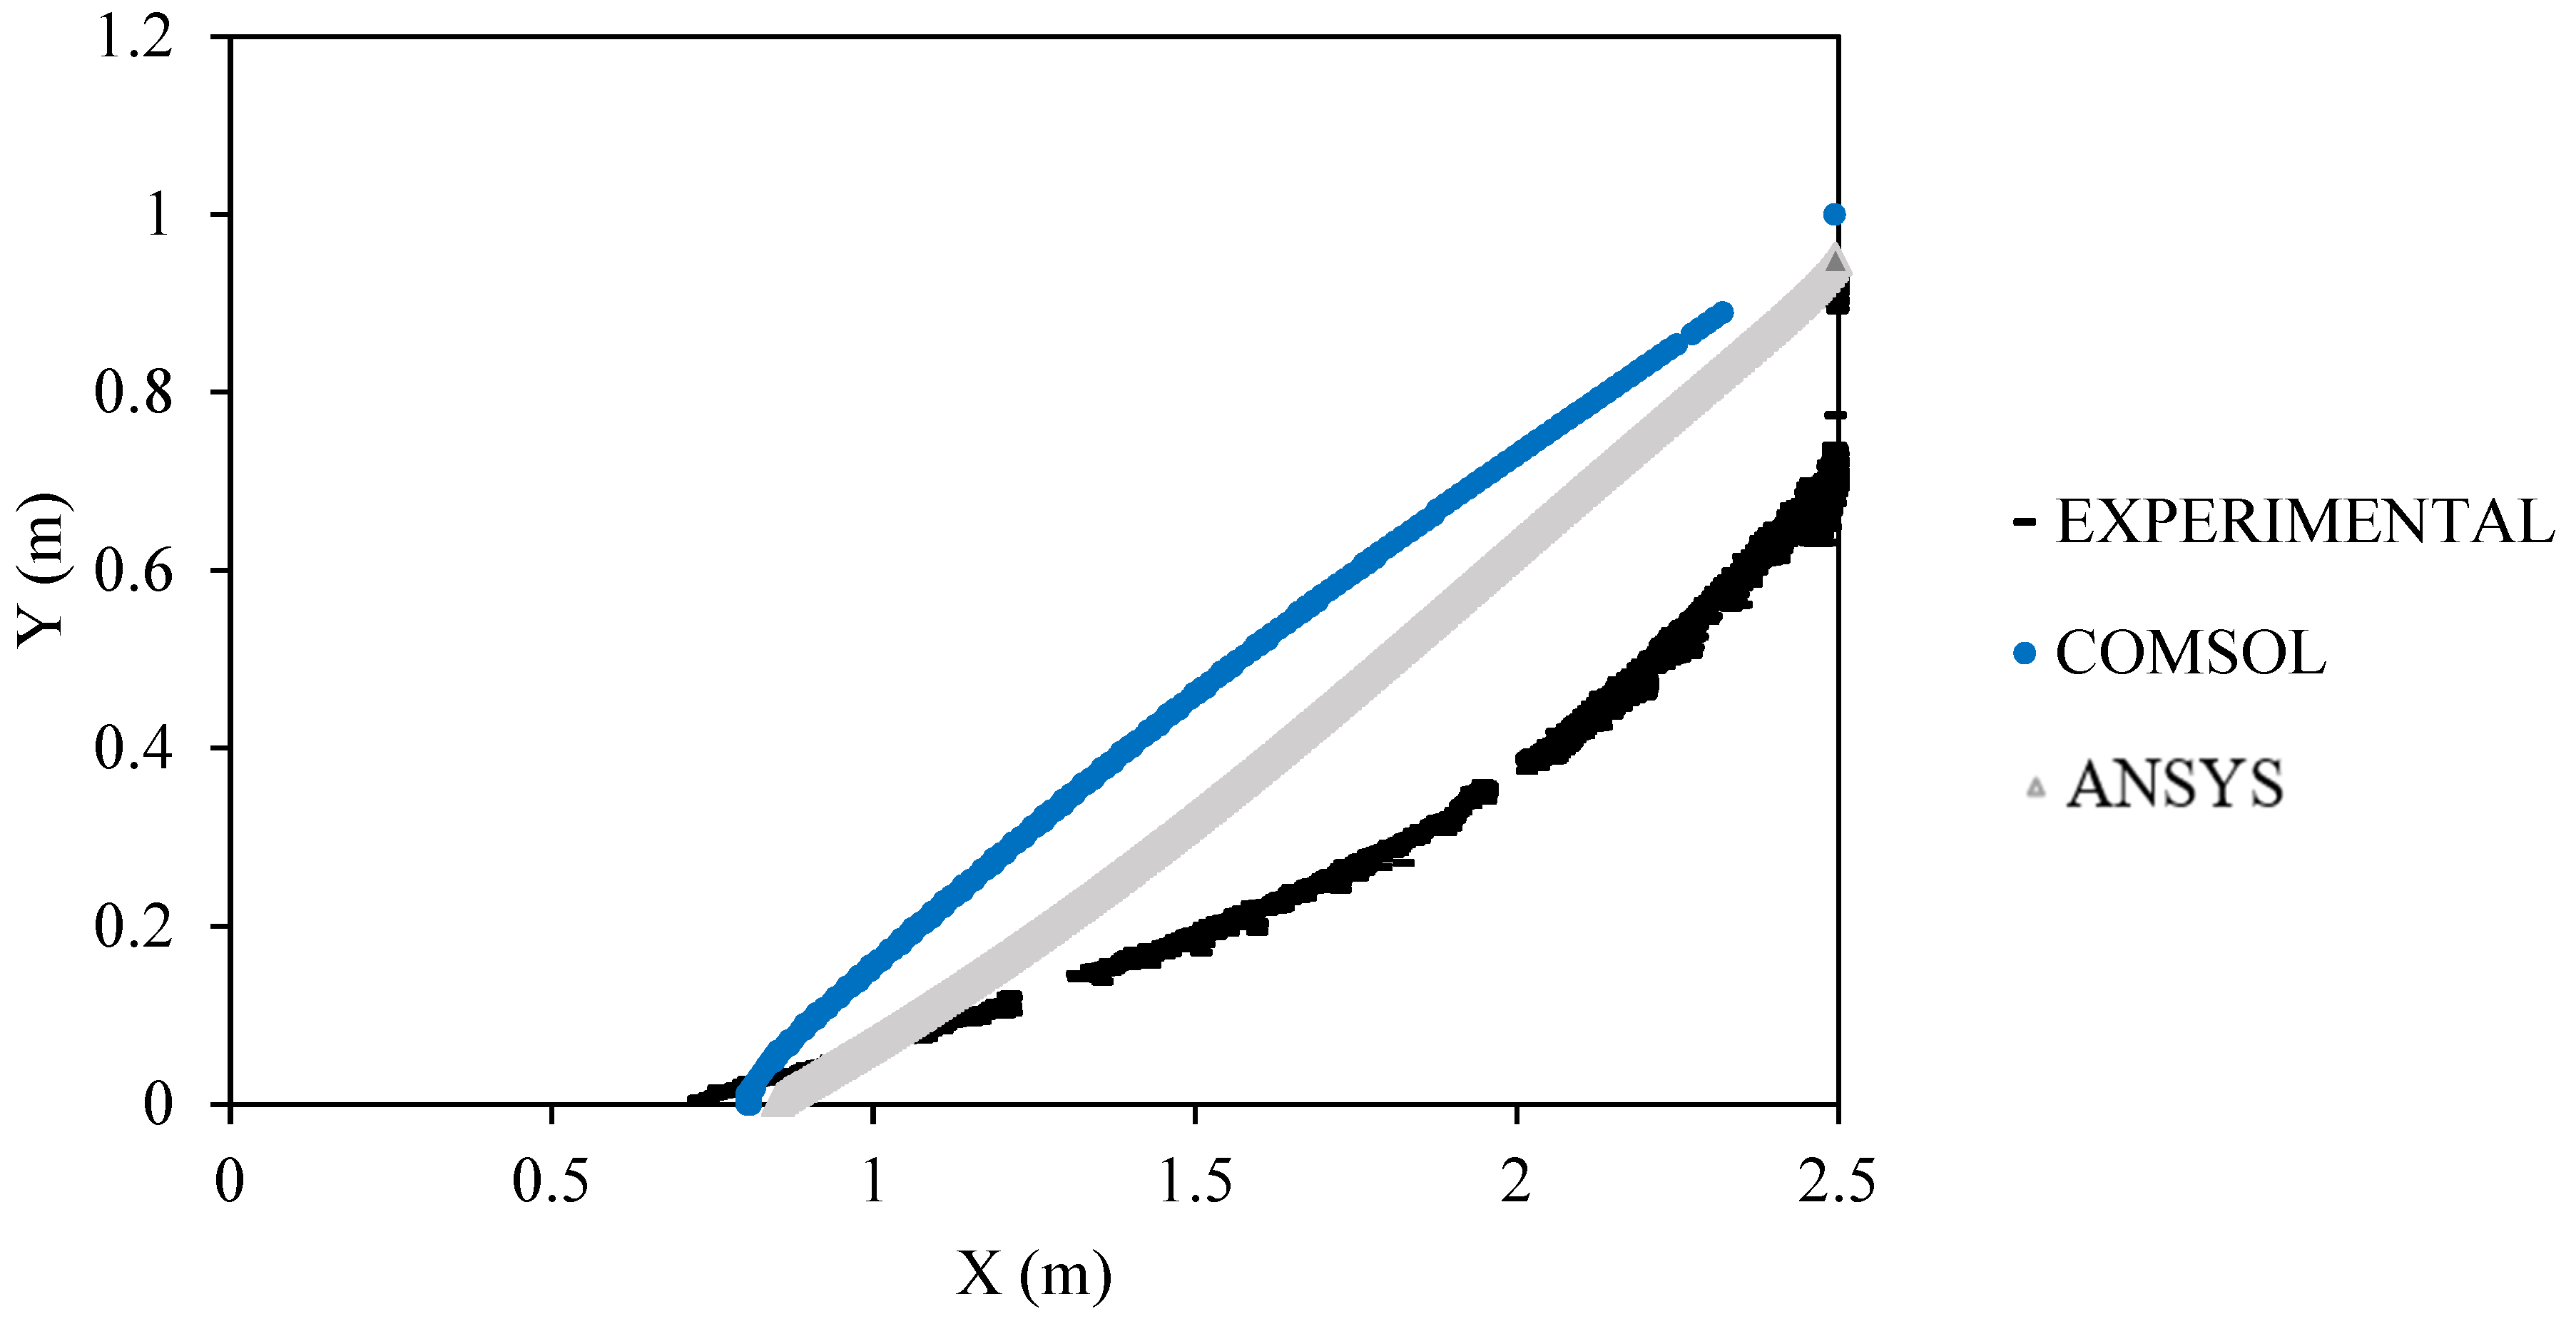
Figure 11 shows the correlation between the experimental results and simulations. The flux-controlled boundary condition demonstrated an acceptable correlation between the experiment and simulations conducted with both ANSYS Fluent and COMSOL Multiphysics. The experimental results were compared to the simulated results for the saline wedge and toe length over a period of seven hours, in which a quasi-steady-state saline wedge formed. The flux-controlled boundary condition better represented the dynamics of the seaside boundary and the concentration profile of the saltwater intrusion [49].
The quasi-steady-state location of the saline wedge after seven hours under the flux-controlled condition showed good correlation between the experimental results and the simulation. Both COMSOL and ANSYS Fluent represent the saline wedge. Figure 11 shows the location of the saline wedge estimated with ANSYS Fluent and COMSOL and observed in the experiment. The mean absolute error between the COMSOL-simulated result and the experimental data was 0.062 and between ANSYS Fluent and the experimental data it was 0.053. The root mean square error between the COMSOL and experimental results was 0.07, and between the ANSYS and experimental results it was 0.054.
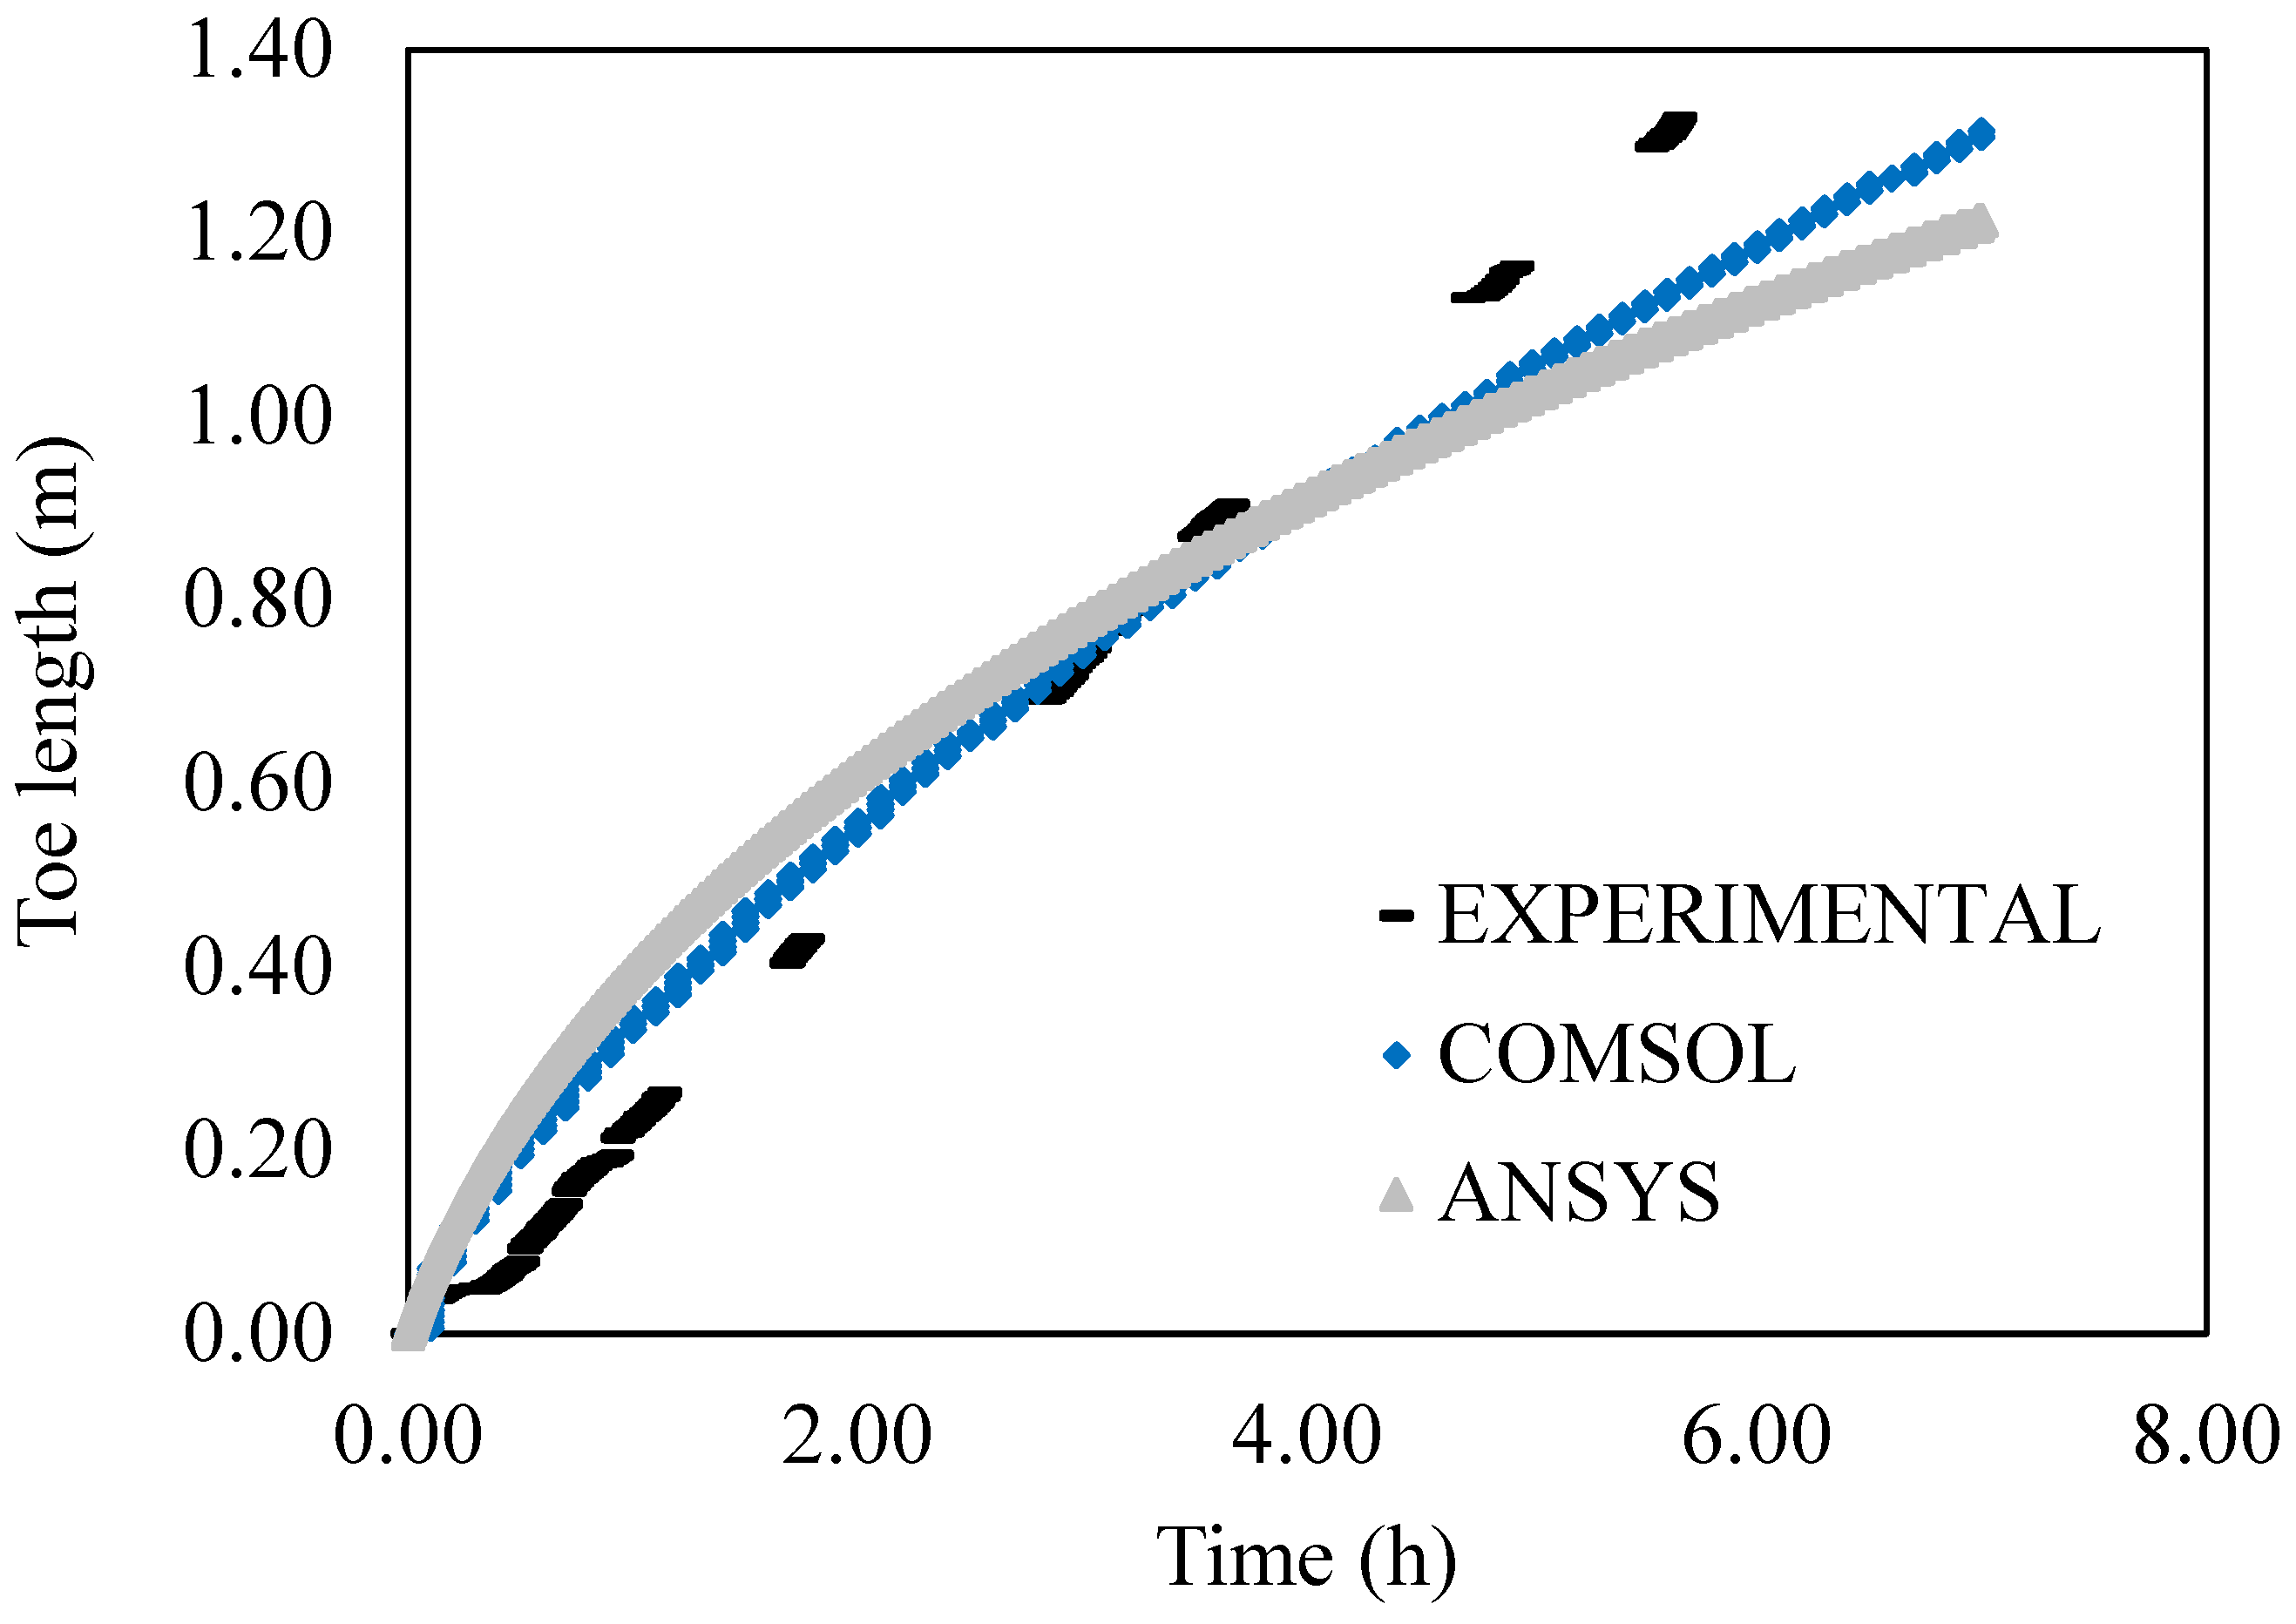
The movement of the saline toe under the flux-controlled condition shows a correlation between the results of the ANSYS Fluent and COMSOL Multiphysics simulations and the experimental data. Figure 12 depicts the location of the saline toe over time with a linear displacement of approximate 20 cm per hour. The experimental results and the COMSOL simulation demonstrate a closer approximation of the total toe lengths and the displacement over time. In contrast, ANSYS Fluent presented a shorter toe length than the experimental data and the toe lengths simulated by COMSOL. The mean absolute error between the simulated values with ANSYS Fluent and the experimental data for the toe locations was 0.12 m, and between COMSOL and the experimental toe locations it was 0.16 m.
A summary of the statistical errors for the simulated saline wedge locations after reaching a quasi-steady-state position is presented in Table 6.
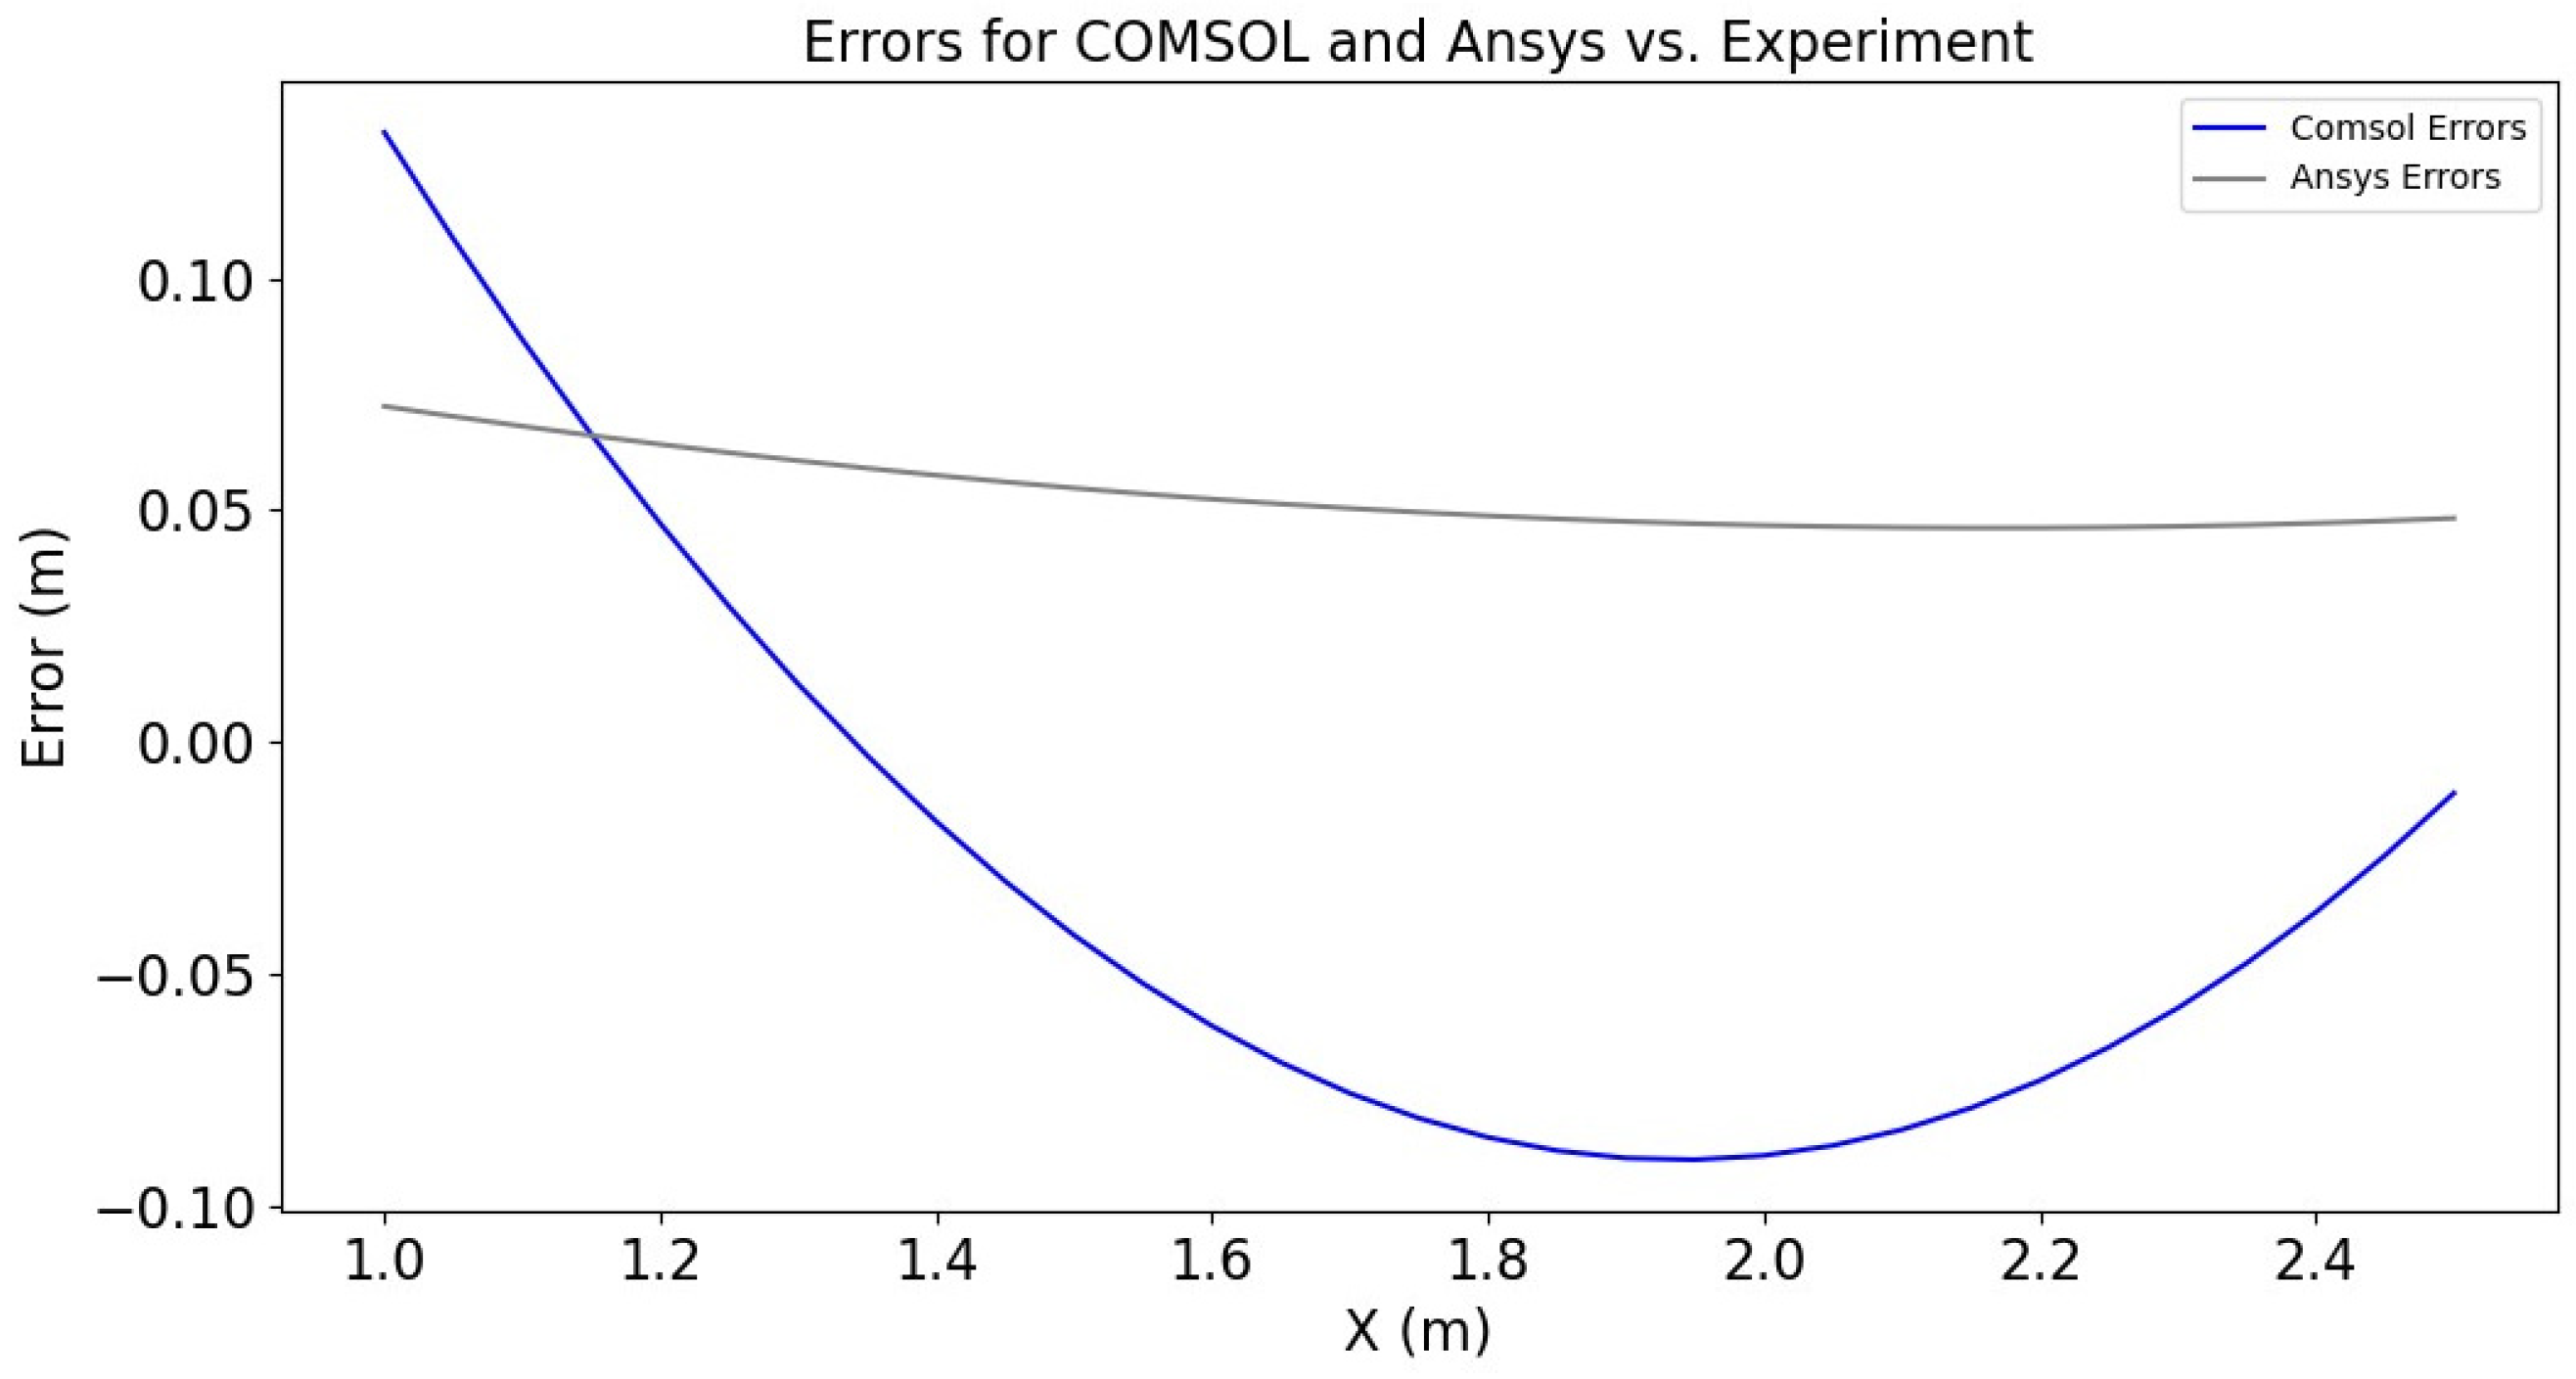
The average error along the length of the experimental setup with the hydraulic head condition is depicted in Figure 13, and the flux-controlled condition is depicted in Figure 14. There was a higher deviation between the experimental and simulation results for the head-controlled scenario compared to that of the flux-controlled scenario. This is attributed to the limitations of the numerical simulation in adjusting to the changes in pressure that can occur with a saltwater-side boundary condition. Numerical models that apply a seaside head-controlled boundary condition have shown a tendency to overestimate the location of the saline wedge, similar to the results obtained in this study [48].

6. COMSOL and ANSYS Fluent Performances

Both COMSOL Multiphysics and ANSYS Fluent demonstrate an ability to replicate the salinity intrusion process in an experimental setup. However, there are discrepancies in the results. The standard deviation between the results of ANSYS Fluent and COMSOL in the estimation of the toe location with the head-controlled case was 4.7%, and for the flux-controlled case it was 3.8%. Other studies comparing COMSOL and ANSYS Fluent show evidence of model output uncertainty inherent in the model solution for each CFD platform. Steiner et al. estimated the computational error of COMSOL using the L2 norm function [41], reporting 1.52%, and an error for ANSYS of 1.50%; a more detailed explanation of the application of the L2 norm can be found in Trott et al. [96]. The disagreement in the simulations between platforms varies from solver error to experimental discrepancy. Depending on the dynamics simulated, COMSOL or ANSYS Fluent can obtain better solutions to numerical models [39]. Solution times are another point of comparison between the platforms. For this study, ANSYS Fluent required approximately eight hours to complete the simulation with the finer mesh, and COMSOL required a maximum of 45 min for the simulation with the finer mesh. Depending on the robustness of the model, ANSYS Fluent can take hours compared to COMSOL to complete a simulation [40]. However, when COMSOL runs a simulation considering a manually set temporal discretization, the length of time to compute the solution increases and could be equal to the time required by ANSYS Fluent.
To reduce errors, the simulations were performed with the same mesh for ANSYS Fluent and for COMSOL Multiphysics. In this study, ANSYS Fluent exhibited greater sensitivity to spatial and temporal discretizations compared to that of COMSOL for the specific simulation conditions applied. This observation was based on the cases and conditions tested. The observed differences were likely due to the specific boundary conditions, mesh configurations, and solver settings used in the simulations. In this study, the best correlation between the platforms was obtained with the mesh with 131,000 elements for the flux-controlled condition and the mesh with 154,000 elements for the head-controlled condition. The head-controlled simulation with COMSOL using the finer mesh with 154,000 elements and 156,778 degrees of freedom reached a minimum linear error of 1.3 × 10 14 after 28 steps and 21 min, and the Minimum lineal residual was 9.7 × 10 14 .

7. Conclusions

This study evaluated the performances of Multiphysics platforms and assessed the landward boundary condition to model salinity intrusion employing an experimental setup. It explored the resulting saline wedge and toe position under two different scenarios under a freshwater boundary condition using a pilot-scale sandbox setup. It also compared the numerical results of COMSOL Multiphysics and ANSYS Fluent with the experimental findings. This study is novel in the following two important ways: first, it explores and benchmarks the application of ANSYS Fluent and COMSOL for salinity intrusion models, and second, it analyzes the influence of the boundary conditions on the transport patterns and location of the saline toe.
The key findings of this study include the following:
  • ANSYS Fluent and COMSOL software demonstrated good agreement with the experimental results, indicating the potential for CFD to replicate solute transport dynamics.
  • Pilot-scale experiments allow for visualizing the saline wedge dynamics and toe displacement over time. Both the experimental and numerical results show that the boundary condition greatly affected the toe location over time.
  • The flux-controlled boundary condition evidenced a better representation of the saline wedge compared to the experiment than the head-controlled boundary condition. This study also corroborates that the head-controlled boundary condition overestimated the location of the saline wedge compared to the experiment, agreeing with previous findings in the literature.
  • Darcy’s law equation and the presented numerical modeling were limited to the stability of the seaside boundary, and they do not represent circulating salinity cells when concentration gradients are formed in the boundary condition. To improve the agreement of the simulated scenarios, the concentration boundary condition can be studied as being time- and space-dependent. Future research could lead to improvements in monitoring concentration gradients of seaside boundary conditions in real and controlled groundwater studies.
  • In this study, ANSYS Fluent was more sensitive to spatial and temporal discretizations than COMSOL. However, the simulation times with COMSOL can be faster using the automatic time-step size rather than the default time-step scheme in ANSYS Fluent.
The simulation results obtained using the CFD tools and the experimental setup provide an important step toward improving the robustness and coupling capabilities in simulating the distribution of saltwater with other dynamics in porous media. CFD has the potential of coupling fluid dynamics with other physics related to soil and air. It could include assessments that consider soil dynamics, such as land subsidence and salinity intrusion, using COMSOL or ANSYS Fluent. Future work by the present authors will explore the simulation of both physics in an unconfined coastal aquifer.

Author Contributions

This article was a collaborative effort. The conceptualization was led by research supervisors E.Q.-B. and M.M., while the extensive experimentation and analysis were carried out by D.C.C. and C.C.-F., guided by both supervisors. D.C.C. and C.C.-F. took the lead in drafting the manuscript, with contributions and feedback from all authors during critical revisions. All authors have read and agreed to the published version of the manuscript.

Funding

The financial support from the Canadian Queen Elizabeth II Diamond Jubilee Scholarship Program-QES (Canada), the Emerging Leaders of the Americas program (ELAP), the University of Cartagena (Colombia), Toronto Metropolitan University Faculty of Engineering and Architectural Science Dean’s Research Fund (Canada), Minciencias (Ministry of science, technology, and innovation, Colombia), OCAD, and the fund for science, technology, and innovation of the General royalties’ system in Colombia (FCTel-SGR) through the Convocatoria 8 and project BPIN 2020000100372 is greatly appreciated.

Data Availability Statement

Data are contained within the article.

Conflicts of Interest

The authors declare no conflicts of interest. The funders had no role in the design, execution, interpretation, or writing of this manuscript.

References

  1. Bear, J. Modeling Phenomena of Flow and Transport in Porous Media. In Theory and Applications of Transport in Porous Media; Hassanizadeh, S.M., Ed.; Springer Nature: Haifa, Israel, 2018; p. 761. ISBN 9783319728254. [Google Scholar]
  2. Shao, Q.; Fahs, M.; Hoteit, H.; Carrera, J.; Ackerer, P.; Younes, A. A 3-D Semianalytical Solution for Density-Driven Flow in Porous Media. Water Resour. Res. 2018, 54, 10094–10116. [Google Scholar] [CrossRef]
  3. Koussis, A.D.; Mazi, K.; Riou, F.; Destouni, G. A Correction for Dupuit-Forchheimer Interface Flow Models of Seawater Intrusion in Unconfined Coastal Aquifers. J. Hydrol. 2015, 525, 277–285. [Google Scholar] [CrossRef]
  4. Lu, C.; Xin, P.; Kong, J.; Luo, J. Analytical Solutions of Seawater Intrusion in Sloping Confined and Unconfined Coastal Aquifers. J. Am. Water Resour. Assoc. 2016, 5, 2. [Google Scholar] [CrossRef]
  5. Zhang, J.; Lu, C.; Werner, A.D. Analytical and Experimental Investigation of the Impact of Land Reclamation on Steady-State Seawater Extent in Coastal Aquifers. Water Resour. Res. 2021, 57, e2020WR029028. [Google Scholar] [CrossRef]
  6. Abd-Elaty, I.; Zeleňáková, M.; Krajníková, K.; Abd-Elhamid, H.F. Analytical Solution of Saltwater Intrusion in Costal Aquifers Considering Climate Changes and Different Boundary Conditions. Water 2021, 13, 995. [Google Scholar] [CrossRef]
  7. Knight, A.C.; Werner, A.D.; Irvine, D.J. Combined Geophysical and Analytical Methods to Estimate Offshore Freshwater Extent. J. Hydrol. 2019, 576, 529–540. [Google Scholar] [CrossRef]
  8. Chang, S.W.; Clement, T.P. Laboratory and Numerical Investigation of Transport Processes Occurring above and within a Saltwater Wedge. J. Contam. Hydrol. 2013, 147, 14–24. [Google Scholar] [CrossRef]
  9. Oz, I.; Shalev, E.; Yechieli, Y.; Gavrieli, I.; Gvirtzman, H. Flow Dynamics and Salt Transport in a Coastal Aquifer Driven by a Stratified Saltwater Body: Lab Experiment and Numerical Modeling. J. Hydrol. 2014, 511, 665–674. [Google Scholar] [CrossRef]
  10. Mahmoodzadeh, D.; Karamouz, M. Seawater Intrusion in Heterogeneous Coastal Aquifers under Flooding Events. J. Hydrol. 2019, 568, 1118–1130. [Google Scholar] [CrossRef]
  11. Ketabchi, H.; Jahangir, M.S. Influence of Aquifer Heterogeneity on Sea Level Rise-Induced Seawater Intrusion: A Probabilistic Approach. J. Contam. Hydrol. 2021, 236, 103753. [Google Scholar] [CrossRef]
  12. Kumar, S.S.; Deb Barma, S.; Amai, M. Simulation of Coastal Aquifer Using MSim Toolbox and COMSOL Multiphysics. J. Earth Syst. Sci. 2020, 129, 66. [Google Scholar] [CrossRef]
  13. Abdoulhalik, A.; Ahmed, A.A. Transient Investigation of Saltwater Upconing in Laboratory-Scale Coastal Aquifer. Estuar. Coast. Shelf Sci. 2018, 214, 149–160. [Google Scholar] [CrossRef]
  14. Zamrsky, D.; Karssenberg, M.E.; Cohen, K.M.; Bierkens, M.F.P.; Oude Essink, G.H.P. Geological Heterogeneity of Coastal Unconsolidated Groundwater Systems Worldwide and Its Influence on Offshore Fresh Groundwater Occurrence. Front. Earth Sci. 2020, 7, 339. [Google Scholar] [CrossRef]
  15. Zeynolabedin, A.; Ghiassi, R.; Pirooz, M.D. Investigating Island Groundwater Salinity, Using Vulnerability Index and Numerical Methods. Water Sci. Technol. Water Supply 2020, 20, 2804–2814. [Google Scholar] [CrossRef]
  16. Malott, S.; O’Carroll, D.M.; Robinson, C.E. Dynamic Groundwater Flows and Geochemistry in a Sandy Nearshore Aquifer over a Wave Event. Water Resour. Res. 2016, 52, 5248–5264. [Google Scholar] [CrossRef]
  17. Etsias, G.; Hamill, G.A.; Águila, J.F.; Benner, E.M.; McDonnell, M.C.; Ahmed, A.A.; Flynn, R. The Impact of Aquifer Stratification on Saltwater Intrusion Characteristics. Comprehensive Laboratory and Numerical Study. Hydrol. Process. 2021, 35, e14120. [Google Scholar] [CrossRef]
  18. Ahmed, A.; Robinson, G.; Hamill, G.; Etsias, G. Seawater Intrusion in Extremely Heterogeneous Laboratory-Scale Aquifer: Steady-State Results. Water 2022, 14, 1069. [Google Scholar] [CrossRef]
  19. Crestani, E.; Camporese, M.; Belluco, E.; Bouchedda, A.; Gloaguen, E.; Salandin, P. Large-Scale Physical Modeling of Salt-Water Intrusion. Water 2022, 14, 1183. [Google Scholar] [CrossRef]
  20. Coulon, C.; Pryet, A.; Lemieux, J.-M.; Yrro, B.J.F.; Bouchedda, A.; Gloaguen, E.; Comte, J.-C.; Dupuis, J.C.; Banton, O. A Framework for Parameter Estimation Using Sharp-Interface Seawater Intrusion Models. J. Hydrol. 2021, 600, 126509. [Google Scholar] [CrossRef]
  21. Etsias, G.; Hamill, G.A.; Benner, E.M.; Águila, J.F.; McDonnell, M.C.; Flynn, R.; Ahmed, A.A. Optimizing Laboratory Investigations of Saline Intrusion by Incorporating Machine Learning Techniques. Water 2020, 12, 2996. [Google Scholar] [CrossRef]
  22. Lal, A.; Datta, B. Application of the Group Method of Data Handling and Variable Importance Analysis for Prediction and Modelling of Saltwater Intrusion Processes in Coastal Aquifers. Neural Comput. Appl. 2021, 33, 4179–4190. [Google Scholar] [CrossRef]
  23. Roy, D.K.; Datta, B. Saltwater Intrusion Prediction in Coastal Aquifers Utilizing a Weighted-Average Heterogeneous Ensemble of Prediction Models Based on Dempster-Shafer Theory of Evidence. Hydrol. Sci. J. 2020, 65, 1555–1567. [Google Scholar] [CrossRef]
  24. Whetsler, B. A Groundwater Model of the San Luis Obispo Valley Basin Using COMSOL Multiphysics; California Polytechnic State University: San Luis Obispo, CA, USA, 2020; Volume 7. [Google Scholar]
  25. Şen, E.; Düşünür-Doğan, D. Finite Volume Modeling of Bathymetry and Fault-Controlled Fluid Circulation in the Sea of Marmara. Turk. J. Earth Sci. 2021, 30, 628–638. [Google Scholar] [CrossRef]
  26. Zamora, P.B.; Cardenas, M.B.; Lloren, R.; Siringan, F.P. Seawater-Groundwater Mixing in and Fluxes from Coastal Sediment Overlying Discrete Fresh Seepage Zones: A Modeling Study. J. Geophys. Res. Ocean. 2017, 122, 6565–6582. [Google Scholar] [CrossRef]
  27. Mozafari, B.; Fahs, M.; Ataie-Ashtiani, B.; Simmons, C.T.; Younes, R. On the Use of COMSOL Multiphysics for Seawater Intrusion in Fractured Coastal Aquifers. E3S Web Conf. 2018, 54, 20. [Google Scholar] [CrossRef]
  28. Broecker, T.; Teuber, K.; Gollo, V.S.; Nützmann, G.; Lewandowski, J.; Hinkelmann, R. Integral Flow Modelling Approach for Surface Water-Groundwater Interactions along a Rippled Streambed. Water 2019, 11, 1517. [Google Scholar] [CrossRef]
  29. Hojo, L.Y.C.P.; de Paula Rezende, R.V.; Lautenschlager, S.R.; Sabogal-Paz, L.P. Household Slow Sand Filters Operating in Continuous and Intermittent Flows: Computational Fluid Dynamics Simulation and Validation by Tracer Experiments. Chem. Eng. Sci. 2022, 247, 117058. [Google Scholar] [CrossRef]
  30. Geng, X.; Boufadel, M.C.; Xia, Y.; Li, H.; Zhao, L.; Jackson, N.L.; Miller, R.S. Numerical Study of Wave Effects on Groundwater Flow and Solute Transport in a Laboratory Beach. J. Contam. Hydrol. 2014, 165, 37–52. [Google Scholar] [CrossRef] [PubMed]
  31. Tabrizinejadas, S.; Fahs, M.; Ataie-Ashtiani, B.; Simmons, C.T.; Di Chiara Roupert, R.; Younes, A. A Fourier Series Solution for Transient Three-Dimensional Thermohaline Convection in Porous Enclosures. Water Resour. Res. 2020, 56, e2020WR028111. [Google Scholar] [CrossRef]
  32. Zhang, T.; Gan, Q.; Zhao, Y.; Zhu, G.; Nie, X.; Yang, K.; Li, J. Investigations into Mining-Induced Stress-Fracture-Seepage Field Coupling Effect Considering the Response of Key Stratum and Composite Aquifer State Key Laboratory of Mining Response and Disaster Prevention and Control in Deep Coal Mines. Rock Mech. Rock Eng. 2019, 52, 4017–4031. [Google Scholar] [CrossRef]
  33. Koohbor, B.; Fahs, M.; Ataie-Ashtiani, B.; Belfort, B.; Simmons, C.T.; Younes, A. Uncertainty Analysis for Seawater Intrusion in Fractured Coastal Aquifers: Effects of Fracture Location, Aperture, Density and Hydrodynamic Parameters. J. Hydrol. 2019, 571, 159–177. [Google Scholar] [CrossRef]
  34. Hu, H. Applied Computational Fluid Dynamics. In Fluid Mechanics; Elsevier: Amsterdam, The Netherlands, 2012; pp. 421–472. ISBN 9789535102717. [Google Scholar]
  35. Date, A.W. Introduction to Computational Fluid Dynamics; Cambridge University Press: Cambridge, UK, 2005; ISBN 9788578110796. [Google Scholar]
  36. The COMSOL Product Suite COMSOL Multiphysics. Available online: https://www.comsol.com/products (accessed on 18 October 2022).
  37. Ansys Inc. ANSYS Fluent User’s Guide; Ansys Inc.: Canonsburg, PA, USA, 2013. [Google Scholar]
  38. Ren, J.; Wang, X.; Zhou, Y.; Chen, B.; Men, L. An Analysis of the Factors Affecting Hyporheic Exchange Based on Numerical Modeling. Water 2019, 11, 665. [Google Scholar] [CrossRef]
  39. Crha, J.; Basařová, P.; Ruzicka, M.C.; Kašpar, O.; Zednikova, M. Comparison of Two Solvers for Simulation of Single Bubble Rising Dynamics: Comsol vs. Fluent. Minerals 2021, 11, 452. [Google Scholar] [CrossRef]
  40. Salvi, D.; Boldor, D.; Ortego, J.; Aita, G.M.; Sabliov, C.M. Numerical Modeling of Continuous Flow Microwave Heating: A Critical Comparison of COMSOL and ANSYS. J. Microw. Power Electromagn. Energy 2010, 44, 187–197. [Google Scholar] [CrossRef] [PubMed]
  41. Steiner, T.R. High Temperature Steady-State Experiment for Computational Radiative Heat Transfer Validation Using COMSOL and ANSYS. Results Eng. 2022, 13, 100354. [Google Scholar] [CrossRef]
  42. Brunner, D.; Khawaja, H.; Moatamedi, M.; Boiger, G. CFD Modelling of Pressure and Shear Rate in Torsionally Vibrating Structures Using ANSYS CFX and COMSOL Multiphysics. Int. J. Multiphys. 2018, 12, 349–358. [Google Scholar] [CrossRef]
  43. Hegde, C.; Rühaak, W.; Sass, I. Evaluation of Modelling of Flow in Fractures. In Proceedings of the International Conference on Advances in Civil Engineering, AETACE, Delhi, India, 13–14 December 2013; p. 10. [Google Scholar]
  44. Ketabchi, H.; Jahangir, M.S. Probabilistic Numerical Assessment of Seawater Intrusion Overshoot in Heterogeneous Coastal Aquifers. Stoch. Environ. Res. Risk Assess. 2019, 33, 1951–1968. [Google Scholar] [CrossRef]
  45. Michael, H.A.; Russoniello, C.J.; Byron, L.A. Global Assessment of Vulnerability to Sea-Level Rise in Topography-Limited and Recharge-Limited Coastal Groundwater Systems. Water Resour. Res. 2013, 49, 2228–2240. [Google Scholar] [CrossRef]
  46. Chala, D.C.; Quiñones-Bolaños, E.; Mehrvar, M. An Integrated Framework to Model Salinity Intrusion in Coastal Unconfined Aquifers Considering Intrinsic Vulnerability Factors, Driving Forces, and Land Subsidence. J. Environ. Chem. Eng. 2022, 10, 106873. [Google Scholar] [CrossRef]
  47. Ketabchi, H.; Mahmoodzadeh, D.; Ataie-Ashtiani, B.; Simmons, C. Sea-Level Rise Impacts on Seawater Intrusion in Coastal Aquifers: Review and Integration. J. Hydrol. 2016, 535, 235–255. [Google Scholar] [CrossRef]
  48. Ranjbar, A.; Cherubini, C.; Saber, A. Investigation of Transient Sea Level Rise Impacts on Water Quality of Unconfined Shallow Coastal Aquifers. Int. J. Environ. Sci. Technol. 2020, 17, 2607–2622. [Google Scholar] [CrossRef]
  49. Suk, H.; Chen, J.S.; Park, E.; Han, W.S. Two-Dimensional Semi-Analytical Solution of Land-Derived Solute Transport under Tidal Fluctuations Considering Variable Boundary Conditions on the Seaward Boundary. J. Hydrol. 2022, 606, 127441. [Google Scholar] [CrossRef]
  50. Abarca, E. Seawater Intrusion in Complex Geological Environments; Technical University of Catalinia, UPC: Barcelona, Spain, 2006. [Google Scholar]
  51. Laabidi, E.; Bouhlila, R. A New Technique of Seawater Intrusion Control: Development of Geochemical Cutoff Wall. Environ. Sci. Pollut. Res. 2021, 28, 41794–41806. [Google Scholar] [CrossRef] [PubMed]
  52. Liu, L.; Liu, X. Future Groundwater Extraction Scenarios Based on COMSOL Multiphysics for the Confined Aquifer at Linfen Basin, Shanxi Province, China. Cogent Eng. 2017, 4, 1404178. [Google Scholar] [CrossRef]
  53. Üner, S.; Dogan, D.D. An Integrated Geophysical, Hydrological, Thermal Approach to Finite Volume Modelling of Fault-Controlled Geothermal Fluid Circulation in Gediz Graben. Geothermics 2021, 90, 102004. [Google Scholar] [CrossRef]
  54. Trauth, N.; Schmidt, C.; Maier, U.; Vieweg, M.; Fleckenstein, J.H. Coupled 3-D Stream Flow and Hyporheic Flow Model under Varying Stream and Ambient Groundwater Flow Conditions in a Pool-Riffle System. Water Resour. Res. 2013, 49, 5834–5850. [Google Scholar] [CrossRef]
  55. Shao, W.; Bogaard, T.; Bakker, M. How to Use COMSOL Multiphysics for Coupled Dual-Permeability Hydrological and Slope Stability Modeling. Procedia Earth Planet. Sci. 2014, 9, 83–90. [Google Scholar] [CrossRef]
  56. Zhou, X.L.; Huang, K.Y.; Wang, J.H. Numerical Simulation of Groundwater Flow and Land Deformation Due to Groundwater Pumping in Cross-Anisotropic Layered Aquifer System. J. Hydro-Environ. Res. 2017, 14, 19–33. [Google Scholar] [CrossRef]
  57. Zhou, X.-L.; Wang, J.-H. Improvement of Students’ Understanding about the Phenomena of Groundwater Pumping by Using Computer Software. Comput. Appl. Eng. Educ. 2018, 26, 1792–1803. [Google Scholar] [CrossRef]
  58. Pinilla, A.; Asuaje, M.; Pantoja, C.; Ramirez, L.; Gomez, J.; Ratkovich, N. CFD Study of the Water Production in Mature Heavy Oil Fields with Horizontal Wells. PLoS ONE 2021, 16, e0258870. [Google Scholar] [CrossRef] [PubMed]
  59. Oz, I.; Shalev, E.; Yechieli, Y.; Gvirtzman, H. Saltwater Circulation Patterns within the Freshwater-Saltwater Interface in Coastal Aquifers: Laboratory Experiments and Numerical Modeling. J. Hydrol. 2015, 530, 734–741. [Google Scholar] [CrossRef]
  60. Tian, J.; Qi, C.; Sun, Y.; Yaseen, Z.M.; Pham, B.T. Permeability Prediction of Porous Media Using a Combination of Computational Fluid Dynamics and Hybrid Machine Learning Methods. Eng. Comput. 2021, 37, 3455–3471. [Google Scholar] [CrossRef]
  61. Afzali, S.; Rezaei, N.; Zendehboudi, S.; Chatzis, I. Computational Fluid Dynamic Simulation of Multi-Phase Flow in Fractured Porous Media during Water-Alternating-Gas Injection Process. J. Hydrol. 2022, 610, 127852. [Google Scholar] [CrossRef]
  62. Feng, Q.; Cha, L.; Dai, C.; Zhao, G.; Wang, S. Effect of Particle Size and Concentration on the Migration Behavior in Porous Media by Coupling Computational Fluid Dynamics and Discrete Element Method. Powder Technol. 2020, 360, 704–714. [Google Scholar] [CrossRef]
  63. Zhao, J.; Zhu, L.; Li, J. Numerical Experiment on Salt Transport Mechanism of Salt Intrusion in Estuarine Area. Water 2022, 14, 770. [Google Scholar] [CrossRef]
  64. Chalá, D.; Mieles, M.; Mehrvar, M.; Quiñones, E. Diseño y Construcción de Un Acuífero Costero a Escala de Laboratorio Para Simular Procesos de Intrusión Salina y Recarga Natural. In Proceedings of the XXIV Seminario Nacional de Hidráulica e Hidrología, Online, 28–30 June 2021; De Ingeniería De Recursos Hídricos, C.T.P., Ed.; Sociedad Colombiana de Ingenieros: Barranquilla, Colombia, 2021; pp. 718–731. [Google Scholar]
  65. Etsias, G.; Hamill, G.A.; Thomson, C.; Kennerley, S.; Aguila, J.; Benner, E.M.; Mcdonnell, M.C.; Ahmed, A.A.; Flynn, R. Laboratory and Numerical Study of Saltwater Upconing in Fractured Coastal Aquifers Georgios. Water 2021, 13, 3331. [Google Scholar] [CrossRef]
  66. Lu, C.; Chen, Y.; Zhang, C.; Luo, J. Steady-State Freshwater-Seawater Mixing Zone in Stratified Coastal Aquifers. J. Hydrol. 2013, 505, 24–34. [Google Scholar] [CrossRef]
  67. Abdelgawad, A.M.; Abdoulhalik, A.; Ahmed, A.A.; Moutari, S.; Hamill, G. Transient Investigation of the Critical Abstraction Rates in Coastal Aquifers: Numerical and Experimental Study. Water Resour. Manag. 2018, 32, 3563–3577. [Google Scholar] [CrossRef]
  68. Torres, C.; Borman, D.; Matos, J.; Neeve, D. CFD Modeling of Scale Effects on Free-Surface Flow over a Labyrinth Weir and Spillway. J. Hydraul. Eng. 2022, 148, 04022011. [Google Scholar] [CrossRef]
  69. Weber, S. Impact of Saltwater Inundation Event on Freshwater Supply in a Coastal Aquifer: Sand Flume Experiments; University of Western Ontario: London, ON, Canada, 2012. [Google Scholar]
  70. Voss, C. A Finite-Element Simulation Model for Saturated-Unsaturated, Fluid-Density-Dependent Groundwater Flow with Energy Transport or Chemically-Reactive Single-Species Solute Transport; Water-Resources Investigations Report 84-4369; University of Michigan Library: Ann Arbor, MI, USA, 1984; Volume 84, pp. 1–409. [Google Scholar]
  71. Werner, A.D.; Simmons, C.T. Impact of Sea-Level Rise on Sea Water Intrusion in Coastal Aquifers. Ground Water 2009, 47, 197–204. [Google Scholar] [CrossRef]
  72. Jasechko, S.; Perrone, D.; Seybold, H.; Fan, Y.; Kirchner, J.W. Groundwater Level Observations in 250,000 Coastal US Wells Reveal Scope of Potential Seawater Intrusion. Nat. Commun. 2020, 11, 3229. [Google Scholar] [CrossRef] [PubMed]
  73. Post, V.; Kooi, H.; Simmons, C. Using Hydraulic Head Measurements in Variable-Density Ground Water Flow Analyses. Ground Water 2007, 45, 664–671. [Google Scholar] [CrossRef] [PubMed]
  74. Robinson, G.; Moutari, S.; Ahmed, A.A.; Hamill, G.A. An Advanced Calibration Method for Image Analysis in Laboratory-Scale Seawater Intrusion Problems. Water Resour. Manag. 2018, 32, 3087–3102. [Google Scholar] [CrossRef]
  75. Werner, A.D.; Bakker, M.; Post, V.E.A.; Vandenbohede, A.; Lu, C.; Ataie-Ashtiani, B.; Simmons, C.T.; Barry, D.A. Seawater Intrusion Processes, Investigation and Management: Recent Advances and Future Challenges. Adv. Water Resour. 2013, 51, 3–26. [Google Scholar] [CrossRef]
  76. Costall, A.R.; Harris, B.D.; Teo, B.; Schaa, R.; Wagner, F.M.; Pigois, J.P. Groundwater Throughflow and Seawater Intrusion in High Quality Coastal Aquifers. Sci. Rep. 2020, 10, 9866. [Google Scholar] [CrossRef] [PubMed]
  77. Laabidi, E.; Bouhlila, R. Simulating the Effects of Model Parameters on Stagnation Points Position during Seawater Intrusion. Environ. Sci. Pollut. Res. 2022, 29, 71511–71517. [Google Scholar] [CrossRef]
  78. Report on Flooding and Salt Water Intrusion; Office of Resilience: Norfolk, VA, USA, 2016.
  79. Etsias, G.; Hamill, G.A.; Campbell, D.; Straney, R.; Benner, E.M.; Águila, J.F.; McDonnell, M.C.; Ahmed, A.A.; Flynn, R. Laboratory and Numerical Investigation of Saline Intrusion in Fractured Coastal Aquifers. Adv. Water Resour. 2021, 149, 103866. [Google Scholar] [CrossRef]
  80. Abarca, E.; Prabhakar Clement, T. A Novel Approach for Characterizing the Mixing Zone of a Saltwater Wedge. Geophys. Res. Lett. 2009, 36, L06402. [Google Scholar] [CrossRef]
  81. Robinson, G.; Hamill, G.A.; Ahmed, A.A. Automated Image Analysis for Experimental Investigations of Salt Water Intrusion in Coastal Aquifers. J. Hydrol. 2015, 530, 350–360. [Google Scholar] [CrossRef]
  82. Chang, S.W.; Clement, T.P. Experimental and Numerical Investigation of Saltwater Intrusion Dynamics in Flux-Controlled Groundwater Systems. Water Resour. Res. 2012, 48, 9527. [Google Scholar] [CrossRef]
  83. Mehdizadeh, S.S.; Vafaie, F.; Abolghasemi, H. Assessment of Sharp-Interface Approach for Saltwater Intrusion Prediction in an Unconfined Coastal Aquifer Exposed to Pumping. Environ. Earth Sci. 2015, 73, 8345–8355. [Google Scholar] [CrossRef]
  84. Ranjan, P.; Kazama, S.; Sawamoto, M. Numerical Modelling of Saltwater-Freshwater Interaction in the Walawe River Basin, Sri Lanka. In Proceedings of the IAHS-AISH Publication, Perugia, Italy, 2–13 July 2007; IAHS Publishing: Wallingford, UK, 2007; Volume 312, pp. 306–314. [Google Scholar]
  85. Werner, A.D. Correction Factor to Account for Dispersion in Sharp-Interface Models of Terrestrial Freshwater Lenses and Active Seawater Intrusion. Adv. Water Resour. 2017, 102, 45–52. [Google Scholar] [CrossRef]
  86. Castro-Alcalá, E.; Fernaàndez-Garcia, D.; Carrera, J.; Bolster, D. Visualization of Mixing Processes in a Heterogeneous Sand Box Aquifer. Environ. Sci. Technol. 2012, 46, 3228–3235. [Google Scholar] [CrossRef] [PubMed]
  87. Bakhtyar, R.; Brovelli, A.; Barry, D.A.; Robinson, C.; Li, L. Transport of Variable-Density Solute Plumes in Beach Aquifers in Response to Oceanic Forcing. Adv. Water Resour. 2013, 53, 208–224. [Google Scholar] [CrossRef]
  88. Anwar, N.; Robinson, C.; Barry, D.A. Influence of Tides and Waves on the Fate of Nutrients in a Nearshore Aquifer: Numerical Simulations. Adv. Water Resour. 2014, 73, 203–213. [Google Scholar] [CrossRef]
  89. Kuan, W.K.; Jin, G.; Xin, P.; Robinson, C.; Gibbes, B.; Li, L. Tidal Influence on Seawater Intrusion in Unconfined Coastal Aquifers. Water Resour. Res. 2012, 48, 17–31. [Google Scholar] [CrossRef]
  90. Rakhimbekova, S.; O’Carroll, D.M.; Andersen, M.S.; Wu, M.Z.; Robinson, C.E. Effect of Transient Wave Forcing on the Behavior of Arsenic in a Nearshore Aquifer. Environ. Sci. Technol. 2018, 52, 12338–12348. [Google Scholar] [CrossRef] [PubMed]
  91. Dalai, C.; Munusamy, S.B.; Dhar, A. Experimental and Numerical Investigation of Saltwater Intrusion Dynamics on Sloping Sandy Beach under Static Seaside Boundary Condition. Flow Meas. Instrum. 2020, 75, 101794. [Google Scholar] [CrossRef]
  92. Bouzaglou, V.; Crestani, E.; Salandin, P.; Gloaguen, E.; Camporese, M. Ensemble Kalman Filter Assimilation of ERT Data for Numerical Modeling of Seawater Intrusion in a Laboratory Experiment. Water 2018, 10, 397. [Google Scholar] [CrossRef]
  93. Guo, Q.; Huang, J.; Zhou, Z.; Wang, J. Experiment and Numerical Simulation of Seawater Intrusion under the Influences of Tidal Fluctuation and Groundwater Exploitation in Coastal Multilayered Aquifers. Geofluids 2019, 2019, 2316271. [Google Scholar] [CrossRef]
  94. Goswami, R.R.; Clement, T.P. Laboratory-Scale Investigation of Saltwater Intrusion Dynamics. Water Resour. Res. 2007, 43, W04418. [Google Scholar] [CrossRef]
  95. Noorabadi, S.; Sadraddini, A.A.; Nazemi, A.H.; Delirhasannia, R. Laboratory and Numerical Investigation of Saltwater Intrusion into Aquifers. J. Mater. Environ. Sci. 2017, 8, 4273–4283. [Google Scholar] [CrossRef]
  96. Trott, D.W.; Gobbert, M.K. Conducting Finite Element Convergence Studies Using COMSOL 4.0. In Proceedings of the COMSOL Conference, Boston, MA, USA, 7–9 October 2010; Volume 2, pp. 1–6. [Google Scholar]
Figure 1. (a) Schematic diagram of the experimental setup for the beginning of a simulation; (b) photograph of the actual experimental setup.
Water 16 01970 g001aWater 16 01970 g001b
Figure 2. Grain distribution of the fine sand.
Water 16 01970 g002
Figure 3. Seawater boundary in the head-controlled case: (a) after 1 h; (b) after 3 h; (c) after 5 h; (d) right half of the experimental setup after 3 h.
Water 16 01970 g003
Figure 4. Mesh convergence estimating the maximum horizontal velocity after three and a half hours (black symbols) and seven hours (red symbols) with ANSYS Fluent under head-controlled and flux-controlled conditions and COMSOL Multiphysics under head-controlled and flux-controlled conditions.
Water 16 01970 g004
Figure 5. Mesh convergence estimating the toe location after three and a half hours (black symbols) and seven hours (red symbols) with ANSYS Fluent under head-controlled and flux-controlled conditions and COMSOL Multiphysics under head-controlled and flux-controlled conditions.
Water 16 01970 g005
Figure 6. COMSOL Multiphysics discretization scheme. Source: Authors.
Water 16 01970 g006
Figure 7. Saline wedge HC boundary for the COMSOL Multiphysics and ANSYS Fluent simulations.
Water 16 01970 g007
Figure 8. Saline wedge after 7 h under seaward head-controlled boundary conditions.
Water 16 01970 g008
Figure 9. Simulation of the toe length over time in a head-controlled experiment.
Water 16 01970 g009
Figure 10. Saline wedge FC boundary for the COMSOL Multiphysics and ANSYS Fluent simulations.
Water 16 01970 g010
Figure 11. Saline wedge after 7 h with a seaside flux-controlled boundary.
Water 16 01970 g011
Figure 12. Simulation of the toe length over time in a flux-controlled experiment.
Water 16 01970 g012
Figure 13. Error distribution for the head-controlled condition.
Water 16 01970 g013
Figure 14. Error distribution for the flux-controlled condition.
Water 16 01970 g014
Table 2. Details of the experimental procedures for salinity intrusion.
Experimental StagesDetailed ProcedureDescription
1. Conceptualization
-
Selection of the porous media
-
Selection of the geometry
-
Selection of the stratigraphy
-
Initial values and assumptions
-
Fine silica sand
-
Rectangular geometry, without surface or bottom slopes
-
Homogeneous stratigraphy
-
Freshwater from the tap, with a density of 990 kg/m3 and 0 kg/m3 NaCl
2. Start
-
Packing technique
-
Adjustments of the hydraulic head and concentration of NaCl.
-
Packing the main compartment with water and soil with 10 cm layers
-
Hydraulic head difference of 1 cm
-
Preparation of the solution of freshwater from the tap and NaCl with a concentration of 35 kg/m3 and 1 kg/m3 of food dye
3. Procedure
-
Salinity intrusion
-
Continuous photography and sampling
4. Data analysis of results
-
Output data
-
Maps of the concentration
-
Image analysis
-
Numerical model with ANSYS Fluent and COMSOL Multiphysics
Table 3. Parameters of the numerical model.
NameValueDescription
L1.1 mBasin depth
h f 1.01 mFreshwater head
h s 1 mSaltwater head
ρ f 995 kg/m3Freshwater density
ρ s 1026 kg/m3Saltwater density
c f 0 mol/m3Zero salt concentration
c s 1 mol/m3Salt concentration
β 26 kg/molIncrease in density due to salt concentration
p 0 0 PaReference pressure
p f 9848.5 PaFreshwater relative pressure
p s 10,054.8 PaSaltwater relative pressure
μ 0.001 Pa·sDynamic viscosity
ε 0.43Porosity
κ 2.03 ×   10 10 m2Permeability
D1 ×   10 9 m2/sMolecular diffusion
Pe1.33 ×   10 5 Peclet number
Κ 0.0002 m/sHydraulic conductivity
α l 0.001 mLongitudinal dispersivity
α t 1 ×   10 4 mTransversal dispersivity
v 0 1 ×   10 5 m/sInitial flux velocity
Table 4. Characteristics of the selected meshes for the head-controlled and the flux-controlled conditions.
DescriptionHead-ControlledFlux-Controlled
Number of elements154,000131,000
Element size0.006 m0.0065 m
Minimum element quality0.18760.2152
Average element quality0.74490.7445
Ratio of elements to area0.082730.105
Table 5. Numerical model characteristics for the COMSOL and ANSYS Fluent simulations.
DescriptionCOMSOLANSYS
Time stepInitial 1 s 1 s
Temporal discretizationAutomatic step sizeFirst-order implicit time integration
Step schemeBackward differentiation formulaSecond order upwind scheme
Required memory0.19 GB18 GB
Order of lineal and residual errors×10−14×10−7
Table 6. Errors in the results for the experimental vs. simulated saline wedges under head-controlled and flux-controlled boundary conditions.
Boundary ConditionHCFC
ErrorCOMSOL vs. Exp. ANSYS vs. Exp.COMSOL vs. Exp.ANSYS vs. Exp.
MAE0.230.160.060.05
RMSE0.250.170.070.05
Disclaimer/Publisher’s Note: The statements, opinions and data contained in all publications are solely those of the individual author(s) and contributor(s) and not of MDPI and/or the editor(s). MDPI and/or the editor(s) disclaim responsibility for any injury to people or property resulting from any ideas, methods, instructions or products referred to in the content.