Article

Study on the Spatiotemporal Distribution Characteristics of Meiofauna in Baiyangdian Lake and Its Influencing Factors

1
Key Laboratory of Exploration and Utilization of Aquatic Genetic Resources of the Ministry of Education, Engineering Research Center of Environmental DNA and Ecological Water Health Assessment, Shanghai Ocean University, Shanghai 201306, China
2
Ocean College, Hebei Agricultural University, Qinhuangdao 066000, China
3
Key Laboratory of Marine Living Resources and Environment in Hebei Province, Hebei Ocean and Fisheries Science Research Institute, Qinhuangdao 066200, China
*
Authors to whom correspondence should be addressed.
These authors contributed equally to this work.
Water 2024, 16(14), 1959; https://doi.org/10.3390/w16141959
Submission received: 3 June 2024 / Revised: 7 July 2024 / Accepted: 9 July 2024 / Published: 11 July 2024
(This article belongs to the Special Issue Freshwater Ecosystems—Biodiversity and Protection)

Abstract

:
Baiyangdian Lake, the largest freshwater shallow lake on the North China Plain, plays a pivotal role in maintaining the regional ecological balance and biodiversity. Meiofauna are integral components of Baiyangdian Lake; however, their community characteristics and relationship with environmental factors have not yet been studied. The aim of the following study was to evaluate the density, spatiotemporal patterns, and habitat response dynamics of meiofauna in Baiyangdian Lake. A field investigation was conducted at 33 sites spanning various habitats, including aquatic plant-dominant, trench, and pelagic areas, across the spring, summer, and autumn seasons of 2021. The results revealed that the meiofauna in Baiyangdian Lake primarily comprise freshwater nematodes (91.78%), ostracods, and copepods, with a mean abundance of 69.40 ± 35.20 ind. 10 cm−2, peaking in the spring, followed by summer and autumn. The mean biomass was 164.95 ± 99.39 dwt. 10 cm−2, with that of ostracods being the most substantial and that of copepods being the least, with both of them exhibiting seasonal fluctuations. Notably, in the summer, the abundance of meiofauna was positively correlated with the water depth and negatively correlated with ammonia nitrogen levels (R² = 0.13 and R² = 0.24, respectively; p < 0.05 and p < 0.01; n = 33). The results of our study indicate that the distribution and abundance of meiofauna are significantly affected by environmental factors, with the water depth and ammonia nitrogen levels being potential key determinants. The results of the present study are conducive to evaluating the health status of the Baiyangdian ecosystem, protecting biodiversity, and studying the impacts of anthropogenic activities and environmental changes on the lake, and can also provide scientific support for its ecological restoration and governance as well as the assessment of ecological service functions.

1. Introduction

Meiofauna are crucial to ecosystems, linking material cycles and energy flows and serving as key indicators of environmental changes [1]. Initially, the nesting and feeding activities of meiofauna can alter the transportation of particles and microorganisms as well as the transfer of organic matter, thereby modifying the physical, chemical, and biological properties of sediments [2]. Meanwhile, their activities significantly influence the service processes of benthic ecosystems, such as sediment stability, biogeochemical cycles, and waste emissions, and also exert a direct or indirect positive or negative impact on the dynamics of food webs [1]. Furthermore, owing to the characteristics of meiofauna, such as its short life cycle (3–5 generations per year), stable feeding types, and sensitivity to disturbances such as pollution, meiofauna have emerged as an important indicator organism for marine environmental quality [3]. In particular, free-living nematodes, owing to their biological and ecological traits, can act as indicators of ecosystem health [4]. At present, significant progress has been made in research on the environmental indication of meiofauna. For instance, scholars in countries such as Poland, Japan, Switzerland, and Spain have utilized meiofaunal assemblages to indicate environmental changes, such as water acidification, anoxic events, water depth variations, and an altered water nutrient status [5,6,7,8,9,10]. However, studies on freshwater meiofauna in China, which started in the 1970s, remain limited, with only occasional reports on species [11] and descriptions of community characteristics [12,13,14,15,16,17]. Research on the distribution of meiofauna and their response to environmental changes remains limited.
Meiofauna can function as environmental indicator organisms because meiofaunal assemblages and spatiotemporal distribution are substantially influenced by environmental changes [18]. The distribution of meiofauna is notably influenced by environmental factors, such as transparency, chlorophyll a (Chl a), water depth, water temperature, dissolved oxygen (DO), ammonia nitrogen (NH3-N), nitrate nitrogen, and redox potential, and thus displays a high degree of spatial and temporal variability [19,20,21,22,23,24,25,26]. Meiofaunal assemblages may constitute a useful bioindicator of a lake’s trophic state [6,10,26,27]. For example, when comparing three lakes with different trophic statuses (oligo-, meso-, and eutrophic), Schroeder discovered the highest meiofaunal abundances in the mesotrophic lake [10]. Kurashov compared meio- and macrofaunal productions in lakes with varying trophic states and demonstrated that meiofaunal production was highest in the littoral zone of eutrophic lakes and was twice as high as the production of benthic macroinvertebrates in the shallow zone of a mesotrophic lake [28]. The density of the numerically dominant nematodes declined upon nutrient enrichment, whereas ostracods became more abundant. Other taxa, including copepods, attained a maximum at intermediate nutrient levels or, in the case of oligochaetes, were nearly unaffected by nutrient enrichment [29].
Baiyangdian Lake is the largest freshwater lake in the North China Plain [30]. Its ecosystem health and biodiversity are crucial for the regional ecological environment and the maintenance of ecological balance [30]. Over the past 12 years, the habitat of Baiyangdian Lake has undergone continuous degradation, leading to a decrease in macrofauna diversity, with pollution-tolerant species becoming dominant [31,32,33]. However, research on meiofauna, which play a significant role in ecosystem dynamics and serve as important environmental indicators, remains largely explored [34].
We hypothesized that differences in the spatiotemporal distribution of meiofauna are caused by different environmental factors and that, therefore, differences in the distribution of meiofauna can indicate changes in environmental factors in the study waters. Based on the above scientific hypotheses, we analyzed the physical and chemical factors of Baiyangdian Lake water, the species composition, quantity distribution and assemblage of meiofauna, and their relationships. Our study results will be beneficial for assessing the health status of the Baiyangdian Lake ecosystem, determining how to protect its biodiversity, studying the impact of human activities and environmental changes, and providing scientific support for its ecological restoration and governance, as well as the evaluation of ecological service functions.

2. Materials and Methods

2.1. Study Sites

In the following study, 33 sampling sites (Figure 1, Table 1) were set up across Baiyangdian Lake according to different habitat types, such as aquatic plant-dominant areas (abbreviated as S), trench areas (abbreviated as H), and pelagic areas (abbreviated as K), for data collection across the spring (April), summer (July), and autumn (October) in 2021 to investigate and measure the meiofauna and physicochemical factors of the water body. Sample collection and processing were carried out with reference to the method of Ristau et al. (2012) [29].

2.2. Environmental Parameters

Field measurements of the physicochemical factors of water quality, namely the depth (m), temperature (°C), pH, and DO (mg L−1) of the water at each station, were taken using a portable multi-parameter water quality meter (YSI ProPlus, YSIInc., Yellow Springs, OH, USA). Turbidity FTU (FNU) was measured using a portable suspended solids monitor (Hach TSS Portable 2100Q, HACH, Loveland, CO, USA). Petroleum hydrocarbon TPHs (µg L−1) were measured using a portable oil meter (Oil Tech121A, Environ., Boston, MA, USA). The water body Chl a was measured using a hand-held chlorophyll meter (Chloro Tech 121A, Environ., Boston, MA, USA). Transparency (represented by Secchi disk depth, SDD) (m) was measured using a Secchi disk (Shanghai Biaozhuo Scientific Instrument Co., Ltd., Shanghai, China).
After the collection of the water samples, the pH, dissolved oxygen (DO), Chl a, ammonia nitrogen (NH3-N), TN, TP, and COD values were analyzed in the laboratory based on “Surface Water Environmental Quality Standard GB 3838-2002” [35].
The calculation formula of the comprehensive trophic level index (TLI) of the water body is as follows [36,37]:
T L I = i = 1 m ω i × T L I ( i )
ω i = r i j 2 i = 1 m r i j 2
In the formula, TLI(i) represents the trophic level index of the i-th indicator; Wi represents the relevant weight of the trophic level index of the i-th indicator; rij represents the correlation coefficient between the i-th indicator and the reference parameter Chl a; and m represents the number of evaluation indicators [37].
We evaluated the study area regarding the comprehensive trophic level index (Table 2).

2.3. Meiofauna Analyses

In April, July, and October 2021, sediment from each station was collected using a Peterson mud sampler (with a sampling area of 1/16 m2) and carefully placed on a tray. A modified sampling tube (15 cm in length and 2.6 cm in inner diameter) was used to collect core samples of 0–5 cm [38]. Three parallel samples were collected at each station, and the parallel samples were mixed and placed in a sampling bottle, which was immediately fixed with 75% ethanol solution and returned to the laboratory.
Sample staining: During this stage, 5 mL of Rose Bengal staining solution (0.1 g of Rose Bengal dye dissolved in 100 mL of distilled water) was added to the sample, shaken well, and allowed to stand for 24 h [39].
Sample rinsing: The stained sample was placed on a set of sieves composed of an upper layer with a 500 μm aperture and a lower layer with a 42 μm aperture and was slowly rinsed with filtered running water. The sieve was gently tapped and oscillated to remove ethanol and fine sediments until the filtrate was clear [40].
Sample sorting and counting: The sample was transferred to a Petri dish with equally wide parallel lines drawn on it and then sorted and counted by taxon under a dissecting microscope (Nikon SMZ800, Melville, NY, USA). The sorted samples were added to 75% ethanol-fixing solution for preservation and labeled appropriatey.

2.4. Data Analysis

The abundance calculation formula is as follows:
X = 10aπ × (d/2)2
The abundance of meiofauna is expressed in units of “ind. 10 cm−2”, which represents the number of meiofauna per 10 cm2. It was used to calculate the abundance of a certain type of meiofauna in a sample. “X” represents abundance, “d” represents the inner diameter of the sampler in “d” cm, and “a” represents the number of organisms obtained in the experiment.
The estimation of biomass “B” utilizes a method of multiplying the empirical value of the average dry weight of individuals in each group by the abundance of each group [41,42,43]. The empirical values of the average dry weight for the different groups of meiofauna in the present study were derived from previous studies [42,44,45,46], measured in units of μg dwt. 10cm−2 (Table 3).
Linear regression analysis and plotting of the correlations between the measured environmental factors and benthic organisms were performed using Origin 2021. The environmental factors were analyzed using the R studio 4.3.0 FactoMineR and Factoextra packages, and PCA plots were generated using ggplot2 and corrplot.

3. Results

3.1. Physical and Chemical Parameters of the Water Body

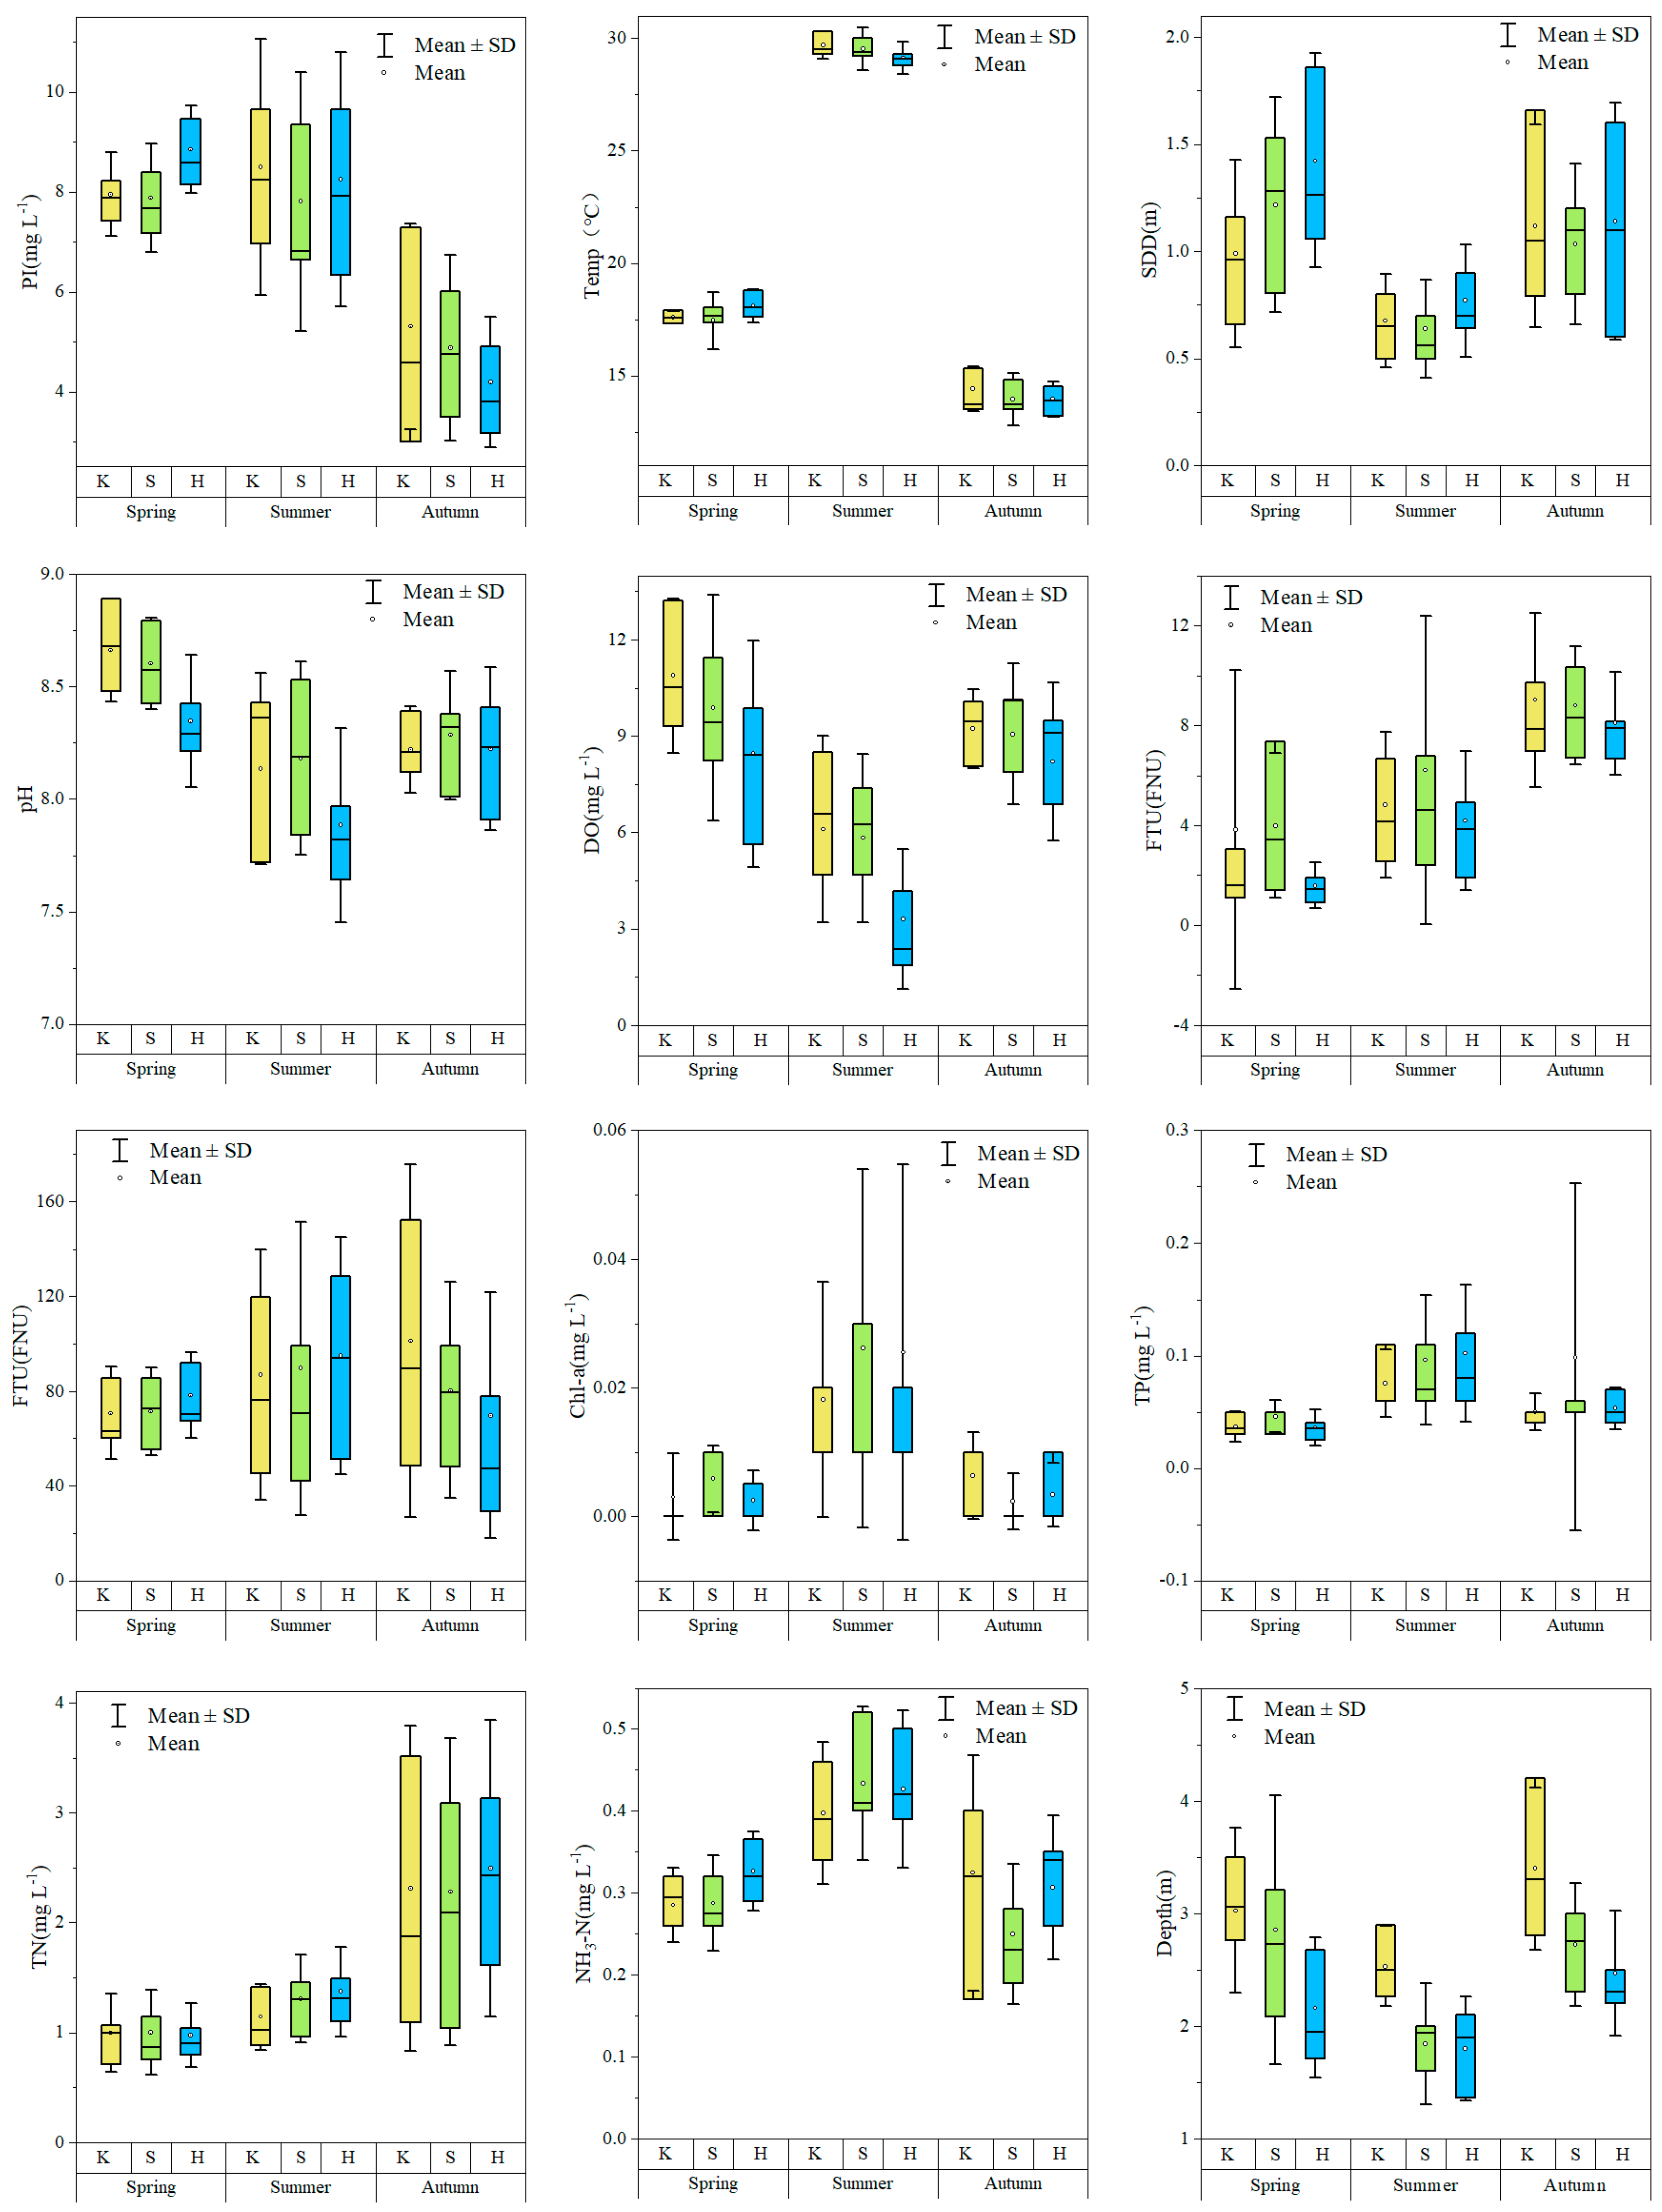
The various environmental factors of the water in the three different habitats (pelagic areas abbreviated as K, aquatic plant-dominant areas abbreviated as S, and trench area abbreviated as H) across the different seasons are presented in Figure 2.
The PCA results showed that in the spring (Figure 3a), Dim1 explained 26.9% of the environmental variability, whereas Dim2 explained 17.9%, with them jointly explaining 44.8% of the environmental variability. There was a certain clustering phenomenon of the meiofaunal groups in the different habitats. Although there was a more significant overlap when the habitats in the trench, pelagic, and aquatic plant-dominant areas clustered, the trench area showed a separation phenomenon compared to the pelagic and aquatic plant-dominant areas, with higher habitat overlap. This finding suggests that in the spring, the habitat difference between the pelagic and aquatic plant-dominant areas is relatively small; in comparison, there were significant differences between the trench, pelagic, and aquatic plant-dominant areas. In addition, DO contributed the most to Dim1, showing a negative correlation. Total nitrogen, water depth, and Chl a contributed significantly to Dim1 and were negatively correlated, except for Chl a. Turbidity contributed the most to Dim2, showing a negative correlation. Total phosphorus, water depth, water temperature, and petroleum hydrocarbons contributed significantly to Dim2, among which total phosphorus was negatively correlated, and the other factors were positively correlated.
In the summer (Figure 3b), Dim1 explained 39.6% of the environmental variability, while Dim2 explained 24.6%, with them jointly explaining 64.2% of the environmental variability. After clustering the habitats in the trench, pelagic, and aquatic plant-dominant areas at a confidence interval of 95%, there was a large overlap, indicating a relatively small habitat difference. Among them, Chl a contributed the most to Dim1 and was positively correlated. In addition, transparency contributed significantly to Dim1 and was negatively correlated. DO was found to make the greatest contribution to Dim2 and was positively correlated; in comparison, ammonia nitrogen contributed significantly to Dim2 and was negatively correlated.
In the autumn (Figure 3c), Dim1 explained 34.7% of the environmental variability, while Dim2 explained 19.1%, with them jointly explaining 53.8% of the environmental variability. Similar to the observations made in the summer, there was a large overlap between the habitats and a small difference. The permanganate index contributed significantly to Dim1 and was positively correlated, while transparency and total nitrogen contributed significantly to Dim1 and were negatively correlated. Transparency contributed significantly to Dim2 and was positively correlated; in comparison, turbidity contributed significantly to Dim2 and was negatively correlated.
In the spring, data from a total of 30 sampling sites were collected, with only one station being slightly eutrophic, 2 sites being poor in nutrients, and the other 27 sites reaching a medium nutrient level. In the summer, data from a total of 33 sites were collected, with 6 sites being moderately eutrophic, 19 sites being slightly eutrophic, and 8 sites reaching a medium nutrient level. In the autumn, data from a total of 33 sites were collected, with 5 sites being slightly eutrophic and the other 28 sites all reaching a medium nutrient level. Throughout the year (excluding the winter), Baiyangdian Lake had poor to medium nutrient levels, accounting for 67.71%. Among the seasons, the spring showed higher levels compared to the autumn, which, in turn, showed higher levels than the summer.

3.2. Distribution of the Meiofaunal Assemblages

Surveys of meiofauna at various sites in Baiyangdian Lake were conducted in the spring, summer, and autumn. The main groups identified were freshwater nematodes (hereinafter referred to as nematodes), ostracods, and copepods. In terms of abundance, nematodes emerged as the most dominant group in all seasons followed by ostracods, with copepods exhibiting the lowest numbers (Table 4).
The abundance of meiofauna showed seasonal variations, with spring > summer > autumn. The mean abundance of meiofauna was 69.40 ± 35.20 ind. 10 cm−2, and there were also differences across the sites (Figure 4). In the spring, the mean abundance of nematodes at each station was 84.95 ± 39.19 ind. 10 cm−2, with the highest abundance in the Mengjiadian aquatic plant-dominant area (water inlet) at 973.63 ind. 10 cm−2, followed by 231.79 ind. 10 cm−2 in the Badadian trench area, 174.00 ind. 10 cm−2 in the Wangjiazhai pelagic area, 168.34 ind. 10 cm−2 in the Julongdian aquatic plant-dominant area, 101.13 ind. 10 cm−2 in the Badadian pelagic area, and no meiofauna in the Chiyudi reed or Julongdian trench areas. In the summer, the mean abundance of nematodes at each station was 74.01 ± 20.44 ind. 10 cm−2, with the highest abundance in the Shiyihdian aquatic plant-dominant area at 479.28 ind. 10 cm−2, followed by 410.81 ind. 10 cm−2 in the Shaochedian trench area, 290.83 ind. 10 cm−2 in the Mengjiadian pelagic area, 170.23 ind. 10 cm−2 in the Shiyihdian trench area, and 168.97 ind. 10 cm−2 in the Shaochedian aquatic plant-dominant area, whereas no meiofauna were found in the Yangjiaodian aquatic plant-dominant area. In the autumn, the mean abundance of nematodes at each station was 27.25 ± 5.81 ind. 10 cm−2, with the highest abundance in the Badadian pelagic area at 108.04 ind. 10 cm−2, followed by 103.02 ind. 10 cm−2 in the Mengjiadian pelagic area, 87.31 ind. 10 cm−2 in the Shiyihdian trench area, 54.02 ind. 10 cm−2 in the Dayaquan aquatic plant-dominant area, and 101.13 ind. 10 cm−2 in the Badadian pelagic areas, whereas no meiofauna were found in the Yangjiaodian aquatic plant-dominant or Baiyangdian Lake lotus areas.
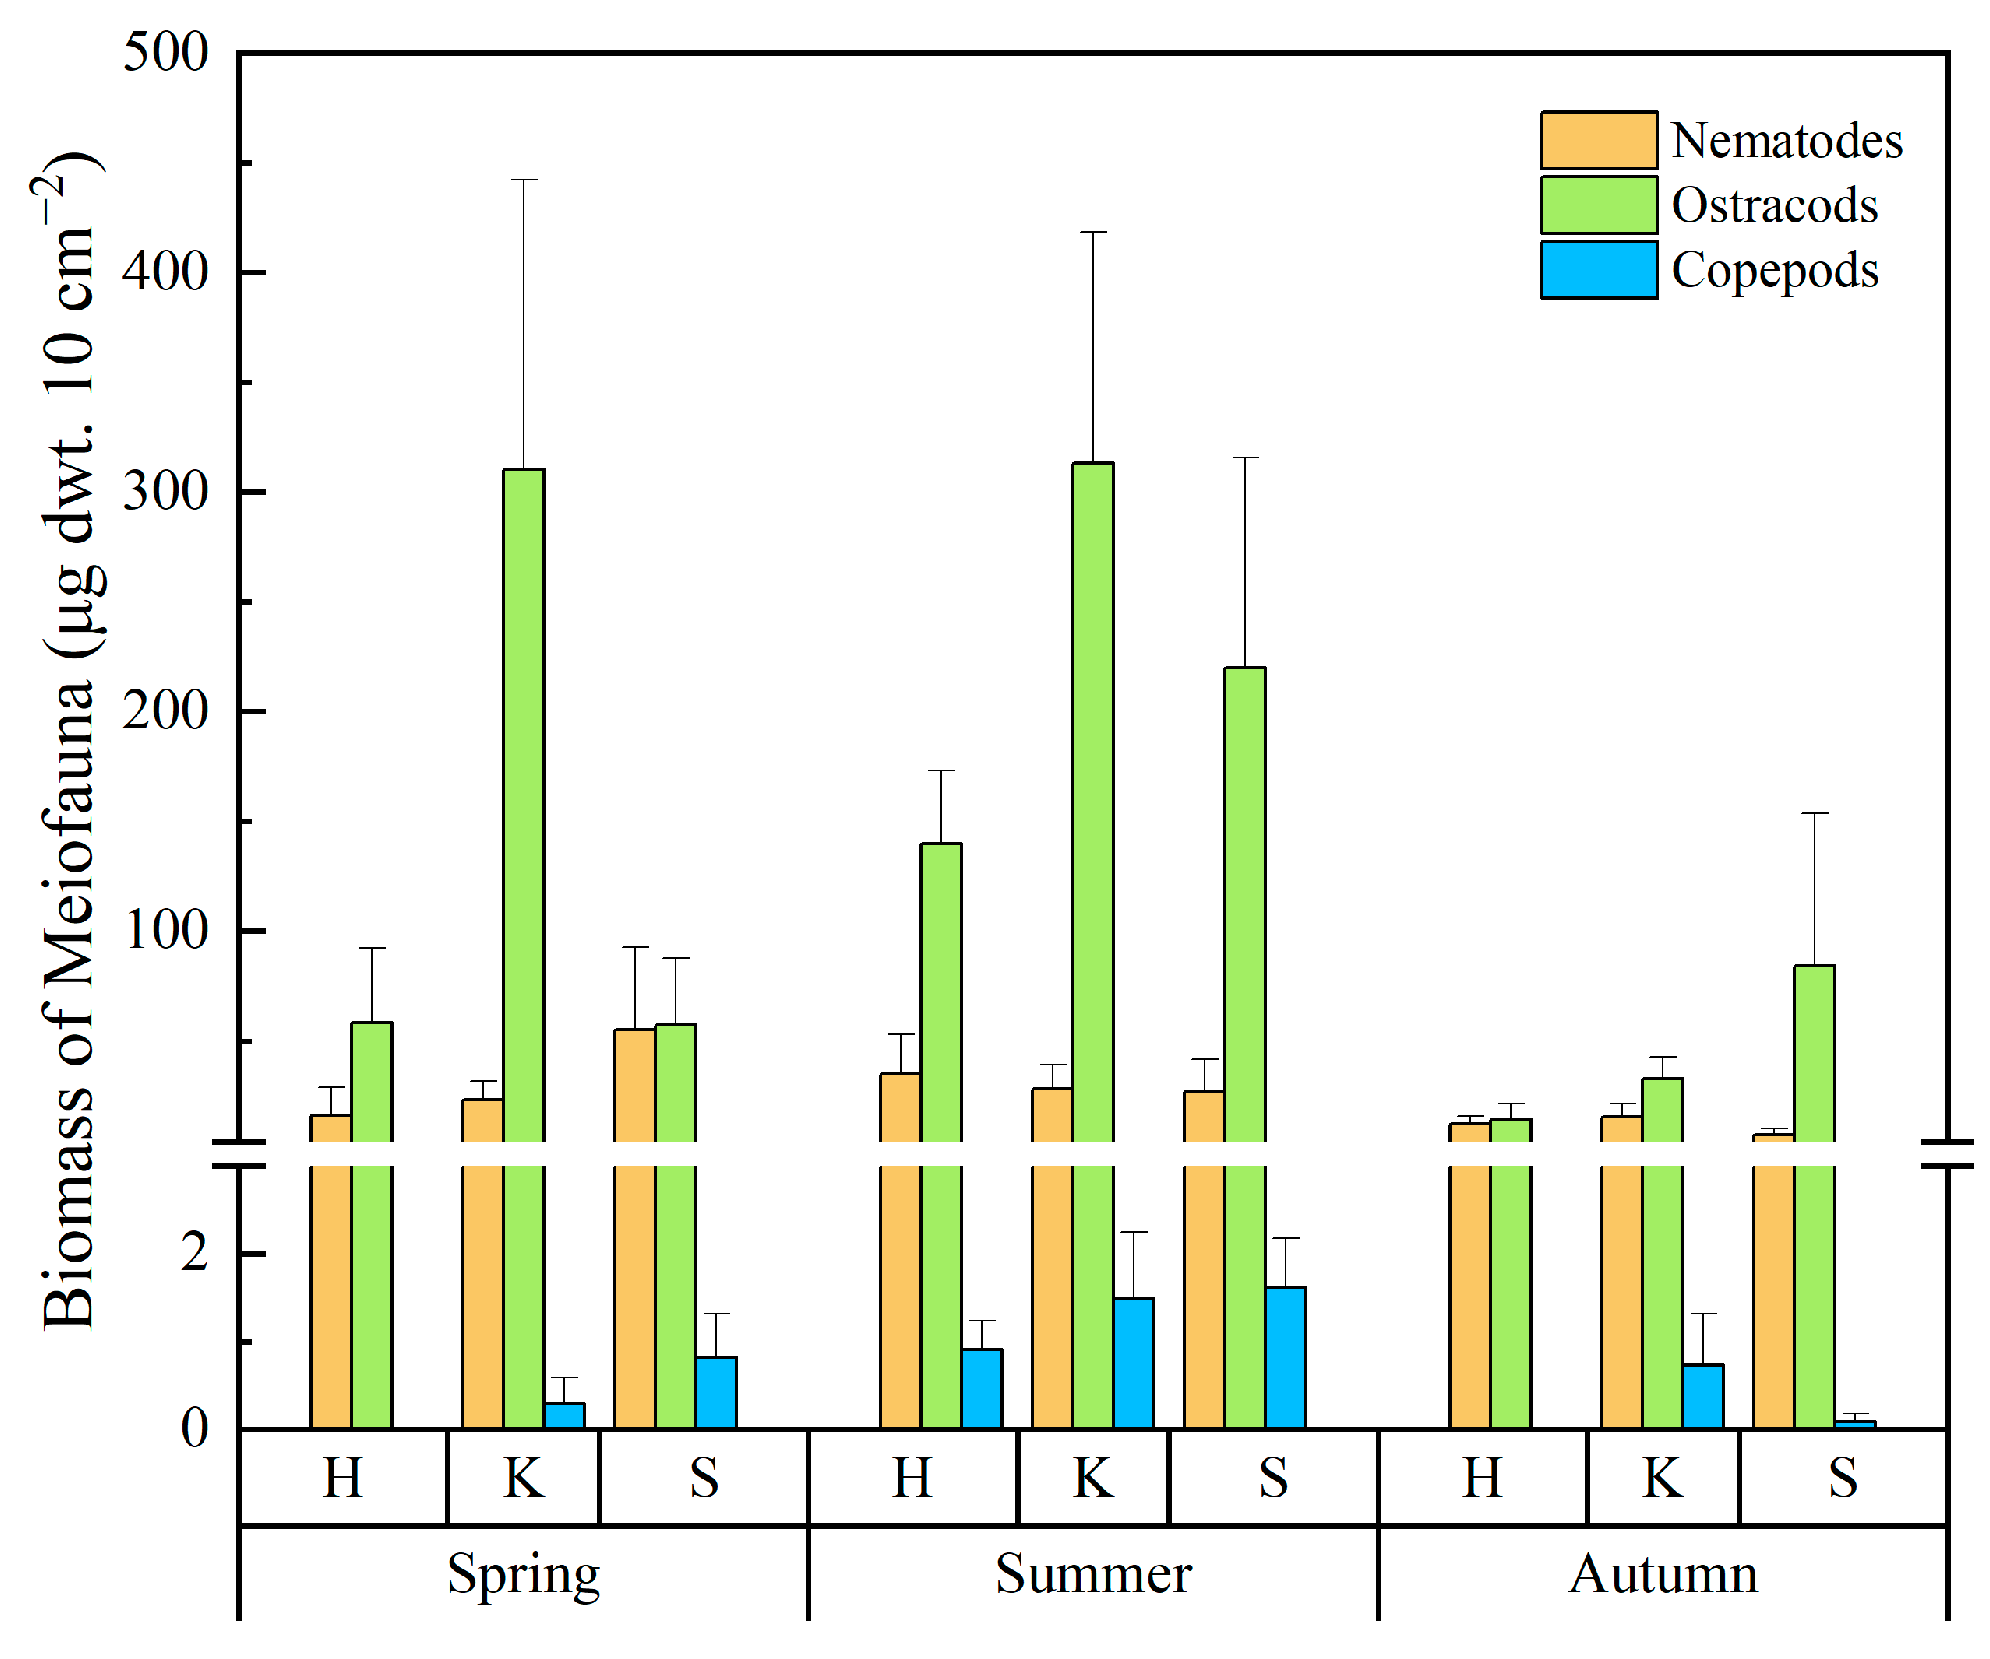
The mean biomass of meiofauna was 164.95 ± 99.39 dwt. 10 cm−2, following the order of ostracods > nematodes > copepods. The biomass level across different seasons followed the order of summer > spring > autumn (Figure 5). In the spring, the biomass levels of nematodes and ostracods in the aquatic plant-dominant area were the highest at 76.71 and 1.00 μg dwt. 10 cm−2, respectively. The biomass levels of nematodes and copepods in the trench area were the lowest at 16.19 and 0 μg dwt. 10 cm−2, respectively. The biomass levels of ostracods in the aquatic plant-dominant area were the lowest at 81.66 μg dwt. 10 cm−2. In the summer, the biomass levels of ostracods were the highest in the pelagic area at 313.28 μg dwt. 10 cm−2 and the lowest in the trench area at 139.73 μg dwt. 10 cm−2. In comparison, the biomass levels of nematodes and copepods were similar in the trench, pelagic, and aquatic plant-dominant areas. In the autumn, the biomass levels of ostracods and copepods in the trench area were the lowest at 14.29 and 0 μg dwt. 10 cm−2, respectively. Moreover, the biomass levels of nematodes and copepods in the pelagic area were the highest at 15.48 and 0.73 μg dwt. 10 cm−2, respectively. The biomass levels of ostracods in the aquatic plant-dominant area were the highest at 109.42 μg dwt. 10 cm−2; in comparison, the biomass levels of nematodes were the lowest at 9.4 μg dwt. 10 cm−2. According to the above analysis, the season has a certain influence on the biomass of meiofauna, with the highest biomass levels of ostracods and copepods occurring in the summer and the lowest levels occurring in the autumn. The biomass levels of nematodes followed the order of spring > summer > autumn.

3.3. Relationships between Meiofauna and Physicochemical Parameters

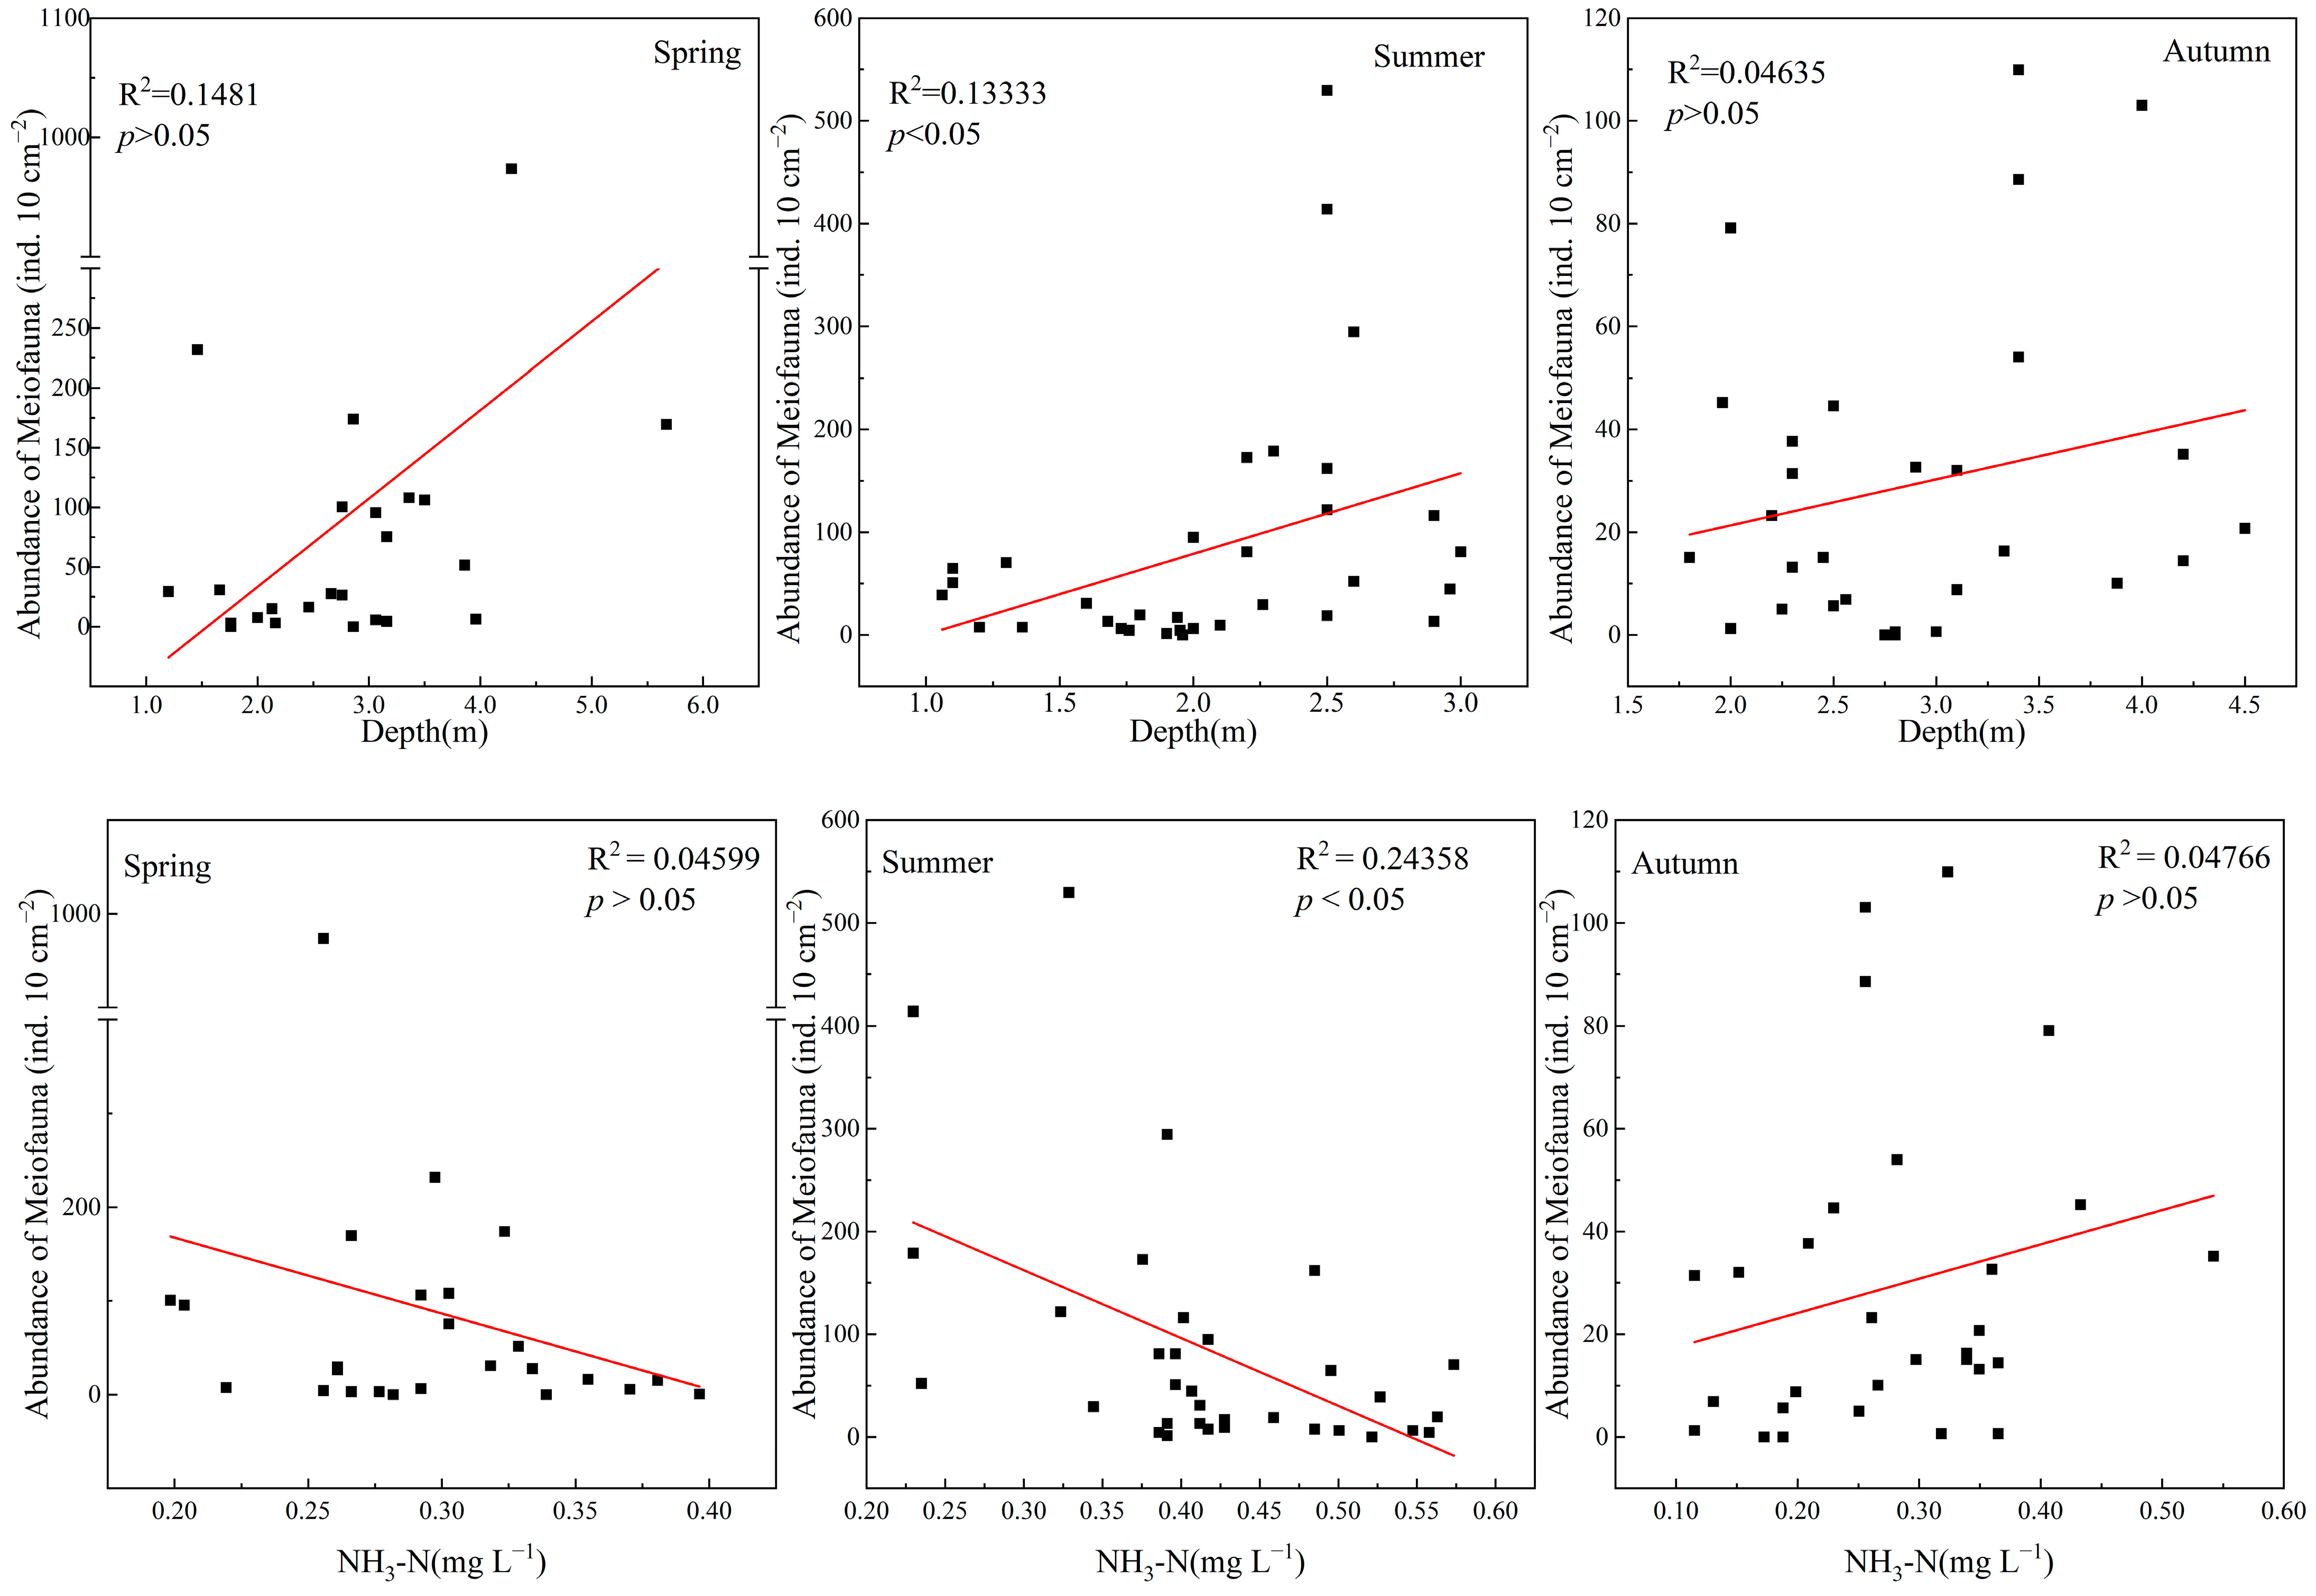
Correlation analysis was conducted to study the abundance of meiofauna across different seasons and 12 environmental factors (Table 5, Figure 6). In the spring, the abundances of meiofauna, nematodes, and ostracods did not show significant correlations with the various environmental factors. The abundance of copepods was significantly positively correlated with total nitrogen (p < 0.01) and significantly negatively correlated with water temperature (p < 0.01). In the summer, the total abundance of meiofauna was significantly positively correlated with water depth (R2 = 0.13, p < 0.05, n = 33) and significantly negatively correlated with ammonia nitrogen (R2 = 0.24, p < 0.01, n = 33). The abundance of ostracods was significantly positively correlated with dissolved oxygen (DO) (p < 0.05). In the autumn, the total abundances of meiofauna, nematodes, and ostracods was not significantly correlated with the various environmental factors. The abundance of copepods was significantly positively correlated with water depth and turbidity (p < 0.05, p < 0.01). The abundances of meiofauna and nematodes in each season were not significantly correlated with the comprehensive trophic status index (TLI) (p > 0.05).

4. Discussion

4.1. Spatiotemporal Distribution of Meiofauna in Baiyangdian Lake

In the present study, our results revealed that in Baiyangdian Lake, meiofaunal assemblages only include nematodes, ostracods, and copepods, and nematodes are also the predominant group. Nematodes outnumber other multicellular animals on the ocean floor and in inland waters and soils, making them essential components of nearly all ecosystems on Earth [1,47,48]. Nematodes exhibit significant ecological dominance, comprising the majority of the meiofaunal assemblage. The majority of the current knowledge on freshwater nematode ecology is based on research in European freshwater bodies only. In recent years, the relative importance of nematodes in freshwater habitats has attracted growing attention; however, the study of nematode ecology in freshwater lakes remains particularly limited [1,19,49,50,51,52,53]. In China, Jihua Wu first reported the annual qualitative and quantitative research results for nematodes in East Lake, Wuhan City, indicating that nematodes are a distinct dominant group and have a close relationship with the total phosphorus in the sediment [54]. In addition, among the investigated meiofaunal groups in Chinese water bodies such as Biandan Pond, Honghu Lake, East Lake, Dongchang Lake, Weishan Lake, and Dongtang Sun Lake, free-living nematodes are the most dominant group in terms of abundance [12,13,14,15,17,55].
Further analysis revealed that the abundance of meiofauna, particularly the dominant group of nematodes, exhibited a seasonal pattern, with the highest abundance in the spring, followed by summer, and the lowest in the autumn. Across different habitat types, the pelagic areas had the highest abundance followed by the trench areas, with the lowest abundance observed in the aquatic plant-dominant areas. This distribution is consistent with the findings of Traunspurger et al. (2020) [56], which suggest that habitats rich in periphyton support a higher meiofaunal diversity and abundance, whereas oligotrophic lakes have a lower biomass. Additionally, the results of the study by Peters [57] also indicate that in the littoral zone communities of lakes, meiofauna are abundant, with nematodes being the primary component.
In terms of biomass, in the present study, a mean biomass of 164.95 ± 99.39 μg dwt. 10 cm−2 was recorded for meiofauna, with the highest values observed in the summer, followed by spring, and the lowest values observed in the autumn. Ostracods exhibited the greatest biomass, whereas copepods showed the lowest. Similar findings were reported in a study on Lake Obersee [24], where oligochaetes contributed most to the biomass, and nematodes contributed most to benthic abundance.
Notably, in this study, nematodes in Baiyangdian Lake accounted for an impressive 91.55% of the total abundance of meiofauna, with their abundance peaking in the spring at 93.86%, followed by autumn at 92.91%, and the lowest abundance in the summer at 88.56%. This phenomenon suggests that the abundance of nematodes directly influences the overall abundance of meiofauna. Furthermore, in the summer, the total abundance of meiofauna was positively correlated with the water depth, which may be attributed to the better tolerance of meiofauna to low-oxygen environments. Under hypoxic conditions, the predation pressure may be reduced, favoring reproduction in deeper habitats [58,59]. Additionally, in comparison to the summer meiofauna survey results from Weishan Lake in China [15], we found that in Baiyangdian Lake, ostracods, rather than nematodes, had the highest biomass across all three seasons, which differs from the findings of the above study conducted in Weishan Lake. Concurrently, sampling research on meiofaunal abundance in Dongchang Lake during the summer and autumn by Huang Yong and colleagues [14] showed significant differences compared to the results of the present study. In their study, Wu (1999) [54], for the first time, reported the annual qualitative and quantitative research results of nematodes in East Lake, indicating that nematodes are a distinctly dominant group and have a close relationship with the total phosphorus content in sediment.
In summary, the findings of the present study demonstrate that nematodes dominate the meiofaunal assemblages in Baiyangdian Lake in terms of abundance, and their diversity is closely associated with seasonal and environmental factors. In mesotrophic or slightly eutrophic lakes, the distribution and abundance of meiofauna are influenced not only by the level of nutrient enrichment but also by other environmental factors, such as aquatic plant-dominant growth and dissolved oxygen (DO) levels in the water [24,56,57,60].

4.2. The Characteristics of the Meiofauna Community and Their Relationships with Environmental Factors

The results of the present study indicated that in the summer, the total abundance of meiofauna showed a significant positive correlation with the water depth (p < 0.05) and a significant negative correlation with the ammonia nitrogen concentration (p < 0.01). These findings suggest that water depth may be a key environmental factor affecting the distribution and abundance of meiofauna in the summer, while increased ammonia nitrogen levels may exert pressure on their survival. The results of the present study are similar to those of Ardeshir (2014) and Bianca et al. (2015) on the relationship between meiofaunal community and water depth; that is, in shallow lakes, the abundance of nematodes increased with increasing trophic levels and water depth [6,61].
For the specific meiofaunal groups of ostracods and copepods, we observed differences in their responses to environmental factors across seasons. Particularly in the summer, the abundance of ostracods was positively correlated with dissolved oxygen (DO) levels (p < 0.05); in comparison, copepods showed a significant positive correlation with total nitrogen levels in the spring (p < 0.01) and a significant negative correlation with water temperature (p < 0.01). The above results indicate that different groups of meiofauna may have distinct adaptive strategies to specific environmental factors.
A correlation analysis was conducted between the biomass of meiofauna and the various groups across different seasons and the total lake index (TLI), a comprehensive measure of trophic status. No significant correlations were found (p > 0.05). This finding contrasts with some results in the existing literature [62,63], which suggest that oligotrophic lakes often support greater biomass in lake habitats, while the opposite is true for eutrophic lakes. In these studies, the biomass of nematodes is considered a reflection of abundance, and biomass is reported to vary with increasing lake depths, indicating that depth may be an important factor influencing biomass. Furthermore, the environmental factors that affect the abundance of nematodes, the abundance of meiofauna, and the biomass of meiofauna also include the pH value of bottom water, the silt–clay content of sediments, and the organic matter content [64,65,66]. The total abundance of meiofauna in Baiyangdian Lake showed no significant correlation with water-related environmental factors in the spring and autumn. However, the cluster analysis results showed evident seasonal differences, which might be caused by factors such as a sedimentary environment.
Additionally, we observed significant differences in the water-related environmental factors across the various habitat types, which may be associated with the physical characteristics and biological processes of the habitats. For instance, the environmental factor values in the trench areas were lower, whereas ammonia nitrogen levels were higher in the aquatic plant-dominant areas. These differences could potentially lead to variations in the biomass of meiofauna across different habitats.
The results of the present study reveal the assemblages of meiofauna and their correlation with water-related environmental factors and show differences in different seasons and habitats. In the future, in-depth studies can be conducted on the interaction relationships of these differences with environmental factors (such as meteorology, hydrology, and sediment environment), food resources, and other organisms in the ecosystem, as well as the specific impact mechanisms on them, to provide more information for an in-depth understanding of the structure and function of shallow lake ecosystems and offer references for assessing the health and biodiversity of lake ecosystems.
In the design of our study, we adopted conventional methods for this type of research. These methods can reflect the correlation between environmental factors and the distribution of meiofauna to a certain extent; however, using such methods may lead to the neglect of the influence of sediments on them. Moreover, in recent studies, we found that some scholars have begun to pay attention to this issue. In future studies, we will continuously improve our research methods.

5. Conclusions

The results of the present study suggest that the meiofaunal community exhibits distinct seasonal variations in Baiyangdian Lake. The primary groups of meiofauna were nematodes, ostracods, and copepods, with their abundances characterized by the highest levels in the spring and the lowest levels in the autumn. Water depth and ammonia nitrogen are potential key factors affecting meiofaunal distribution and abundance. Our research results provide important information on the ecology of meiofauna in large, shallow lakes in China.

Author Contributions

L.W. and W.Z.: Writing—review and editing and Funding acquisition. Y.C.: Writing—original draft. J.M.: Monitoring environmental data and Funding acquisition. Z.P.: Formal analysis. F.M.: Data curation. J.L.: Visualization and Investigation. H.D.: Software and Validation. All authors have read and agreed to the published version of the manuscript.

Funding

This research was funded by the Project of Shanghai Science and Technology Commission (19DZ1204504), the Key R&D Projects in Hebei Province (20373603D), the Fundamental Research Funds for Hebei Province Universities (KY2021011), and Hebei Provincial Natural Science Foundation Outstanding Youth Fund Project (C2023204161).

Institutional Review Board Statement

The study presented in this article involves the investigation of meiofauna, specifically small benthic invertebrates, in Baiyangdian Lake. Given the nature of the study and the organisms involved, which are non-vertebrate and do not possess a centralized nervous system capable of experiencing pain or distress, the research does not fall under the purview of Institutional Review Board (IRB) regulations that govern the ethical treatment of animals in research.

Informed Consent Statement

Not applicable.

Data Availability Statement

Data are contained within the article.

Acknowledgments

We would like to express our gratitude to Yao Li, Xiaolong Hou from the Hebei Ocean and Fisheries Science Research Institute, and Jiale Han, Xinchao Ping, and Leyu Fan from Ocean College, Hebei Agricultural University, for their support and assistance with this article. We also would like to express our sincere gratitude to the anonymous reviewers for their valuable insights and constructive feedback, which significantly contributed to the improvement and refinement of this manuscript. Their expertise and meticulous attention to detail have been instrumental in enhancing the quality and clarity of our work.

Conflicts of Interest

The authors declare no conflicts of interest.

Correction Statement

This article has been republished with a minor correction to the Funding statement. This change does not affect the scientific content of the article.

References

  1. Rundle, S.D.; Robertson, A.L.; Schmid-Araya, J.M. Freshwater Meiofauna: Biology and Ecology; Backhuys Publishers: Leiden, The Netherlands, 2002. [Google Scholar]
  2. Moens, T.; Beninger, P.G. Meiofauna: An inconspicuous but important player in mudflat ecology. In Mudflat Ecology; Springer: Cham, Switzerland, 2018; pp. 91–147. [Google Scholar]
  3. Kennedy, A.D.; Jacoby, C.A. Biological indicators of marine environmental health: Meiofauna—A neglected benthic component? Environ. Monit. Assess. 1999, 54, 47–68. [Google Scholar] [CrossRef]
  4. Ridall, A.; Ingels, J. Suitability of free-living marine nematodes as bioindicators: Status and future considerations. Front. Mar. Sci. 2021, 8, 685327. [Google Scholar] [CrossRef]
  5. Itaoka, M.; Tamai, K. Effect of eutrophication on the structure of meiobenthic communities in Hiroshima Bay. Benthos Res. 1993, 1993, 19–28. [Google Scholar] [CrossRef]
  6. Kazemi-Dinan, A.; Schroeder, F.; Peters, L.; Majdi, N.; Traunspurger, W. The effect of trophic state and depth on periphytic nematode communities in lakes. Limnologica 2014, 44, 49–57. [Google Scholar] [CrossRef]
  7. Ristau, K.; Spann, N.; Traunspurger, W. Species and trait compositions of freshwater nematodes as indicative descriptors of lake eutrophication. Ecol. Indic. 2015, 53, 196–205. [Google Scholar] [CrossRef]
  8. Höckelmann, C.; Moens, T.; Jüttner, F. Odor compounds from cyanobacterial biofilms acting as attractants and repellents for free-living nematodes. Limnol. Oceanogr. 2004, 49, 1809–1819. [Google Scholar] [CrossRef]
  9. Gaudes, A.; Sabater, S.; Vilalta, E.; Muñoz, I. The nematode community in cyanobacterial biofilms in the river Llobregat, Spain. Nematology 2006, 8, 909–919. [Google Scholar]
  10. Ristau, K.; Traunspurger, W. Relation between nematode communities and trophic state in southern Swedish lakes. Hydrobiologia 2011, 663, 121–133. [Google Scholar] [CrossRef]
  11. Wu, J.H.; Liang, Y.L.; Sun, X.D. Newly recorded species of free-living nematodes from china (Chromadorida Enoplida & Araeolaimida). Acta Hydrobiol. Sin. 1997, 21, 312–321, (In Chinese with English Abstract). [Google Scholar]
  12. Wu, J.H.; Liang, Y.L. A comparative study of benthic nematodes in two Chinese lakes with contrasting sources of primary production. Hdrobiologia 1999, 411, 31–37. [Google Scholar] [CrossRef]
  13. Wu, J.H.; Fu, C.Z.; Liang, Y.L.; Chen, J.K. Distribution of the meiofauna community in a eutrophic shallow lake of China. Arch. Hydrobiol. 2004, 159, 555–575. [Google Scholar] [CrossRef]
  14. Huang, Y.; Wu, X.Q.; Wang, X.Y.; Qi, G.L.; Cheng, B. Studies on the Meiofauna community in Dongchang Lake of Liaocheng. J. Liaocheng Univ. (Nat. Sci.) 2008, 21, 68–72+78, (In Chinese with English Abstract). [Google Scholar]
  15. Li, J.J.; Huang, Y. Studies on the Meiofauna Community in Weishan Lake. J. Liaocheng Univ. (Nat. Sci.) 2009, 22, 51–54, (In Chinese with English Abstract). [Google Scholar]
  16. Yan, F.G. Community Characteristics and Ecological Role of Meiofaunan in Shallow Lakes; Institute of Hydrobiology, Chinese Academy of Sciences: Wuhan, China, 2012; (In Chinese with English Abstract). [Google Scholar]
  17. Yan, F.G.; Wang, H.J.; Wang, H.Z.; Zhang, T.L.; Li, W. Community characteristics of Meiofaunan in an algae-dominated shallow lakes, with discussion on the ecological role. Acta Hydrobiol. Sin. 2010, 34, 634–638, (In Chinese with English Abstract). [Google Scholar] [CrossRef]
  18. Schratzberger, M.; Ingels, J. Meiofauna matters: The roles of meiofauna in benthic ecosystems. J. Exp. Mar. Biol. Ecol. 2018, 502, 12–25. [Google Scholar] [CrossRef]
  19. Strayer, D.L. The benthic micrometazoans of Mirror lake. New Hampshire. Arch. Hydrobiol. Suppl. 1985, 72, 287–426. [Google Scholar]
  20. Tinson, S.; Laybourn-Parry, J. The distribution and abundance of benthic cyclopoid copepods in Esthwaite Water, Cumbria. Hydrobiologia 1986, 131, 225–234. [Google Scholar] [CrossRef]
  21. Traunspurger, W. Distribution of benthic nematodes in the littoral of an oligotrophic lake (Konigssee, National Park Berchtesgaden, FRG). Arch. Hydrobiol. 1996, 135, 393–412. [Google Scholar] [CrossRef]
  22. Traunspurger, W. Distribution of benthic nematodes in the littoriprofundal and profundal of an oligotrophic lake (Konigssee, National Park Berchtesgaden, FRG). Arch. Hydrobiol. 1996, 135, 557–575. [Google Scholar] [CrossRef]
  23. Bergtold, M.; Traunspurger, W. The benthic community in the profundal of Lake Brunnsee: Seasonal and spatial patterns. Arch. Hydrobiol. 2004, 160, 527–554. [Google Scholar] [CrossRef]
  24. Michiels, I.C.; Traunspurger, W. A three years study of seasonal dynamics of a zoobenthos community in a eutrophic lake. Nematology 2004, 6, 655–669. [Google Scholar] [CrossRef]
  25. Michiels, I.C.; Traunspurger, W. Seasonal variation of biodiversity and assemblage structure in freshwater nematodes. Arch. Hydrobiol. 2005, 163, 183–194. [Google Scholar] [CrossRef]
  26. Schroeder, F.; Traunspurger, W.; Pettersson, K.; Peters, L. Temporal changes in periphytic meiofauna in lakes of different trophic states. J. Limnol. 2012, 71, 216–227. [Google Scholar] [CrossRef]
  27. Schroeder, F.; Peters, L.; Traunspurger, W. Temporal variations in epilithic nematode assemblages in lakes of different productivities. Fundam. Appl. Limnol. 2012, 181, 143–157. [Google Scholar] [CrossRef]
  28. Kurashov, E.A. The role of meiobenthos in lake ecosystems. Aquat. Ecol. 2022, 36, 447–463. [Google Scholar] [CrossRef]
  29. Ristau, K.; Faupel, M.; Traunspurger, W. The effects of nutrient enrichment on a freshwater meiofaunal assemblage. Freshw. Biol. 2012, 57, 824–834. [Google Scholar] [CrossRef]
  30. Zhuang, C.; Ouyang, Z.; Xu, W.; Bai, Y.; Zhou, W. Impacts of human activities on the hydrology of Baiyangdian Lake, China. Environ. Earth Sci. 2011, 62, 1343–1350. [Google Scholar] [CrossRef]
  31. Sun, X.Q.; Li, H.C.; Liao, C.Y.; Deng, J.Z.; Sun, H.M.; Yan, M.X.; Wang, H.W. Investigation of benthic invertebrates and analysis of water environment in Baiyangdian Lake. Hebei Fish. 2019, 308, 40–44+50, (In Chinese with English Abstract). [Google Scholar]
  32. Liu, J.G.; Zhao, D.D.; Ye, B. Eeological aributes, restorlion, and prteeion of the Baivangdian in Xiong’an New Area. Aela Eeologica Sin. 2019, 39, 3019–3025, (In Chinese with English Abstract). [Google Scholar]
  33. Huang, X.; Wang, F.; Wu, D.; Kong, F.Q.; Wang, Q. The community structure of macrobenthos and its response to environmental factors in Baiyangdian Lake. Hebei Fish. 2023, 12, 33–40, (In Chinese with English Abstract). [Google Scholar] [CrossRef]
  34. Semprucci, F.; Losi, V.; Moreno, M. A review of Italian research on free-living marine nematodes and the future perspectives on their use as Ecological Indicators (EcoInds). Mediterr. Mar. Sci. 2015, 16, 352–365. [Google Scholar] [CrossRef]
  35. The State Environmental Protection Administration. The Water and Wastewater Monitoring Analysis Method Editorial Board. Water and Wastewater Monitoring Analysis Method, 4th ed.; China Environmental Science Press: Beijing, China, 2002; pp. 38–47. [Google Scholar]
  36. Wang, M.C.; Liu, X.Q.; Zhang, J.H. Evaluate method and classification standard on lake eutrophication. Environ. Monit. China 2002, 5, 47–49, (In Chinese with English Abstract). [Google Scholar]
  37. Zhao, Q. Traceable Model of Water Quality and the Control Countermeasures of Eutrophication in Shihou Lake; China University of Geosciences Beijing: Beijing, China, 2012; (In Chinese with English Abstract). [Google Scholar]
  38. Guo, Y.Q.; Zhang, Z.N.; Mu, F.H. Large-scale Patterns of Meiofaunal Abundance in the Bohai Sea. Acta Ecol. Sin. 2002, 22, 1463–1469. [Google Scholar]
  39. Cao, Y.K. Study on the Biodiversity and Taxonomy of Free-Living Marine Nematodes in the Xiamen Island, China; Jimei University: Xiamen, China, 2012; (In Chinese with English Abstract). [Google Scholar]
  40. Somerfield, P.J.; Warwick, R.M. Meiofauna in Marine Pollution Monitoring Programmes: A Laboratory Manual; Ministry of Agriculture, Fisheries and Food, Directorate of Fisheries Research Technical Series: London, UK, 1996.
  41. Juario, J.V. Nematode species composition and seasonal fluctuation of a sublittoral meiofauna community in the German Bight. Veröff. Inst. Meeresforsch. Bremerh. 1975, 15, 283–337. [Google Scholar]
  42. Zhang, Z.N.; Zhou, H.; Yu, Z.Z.; Han, J. Abundance and biomass of the benthic in the northern soft-bottom of the Jiaozhou Bay. Oceanol. Limnol. Sin. 2001, 32, 139–147, (In Chinese with English Abstract). [Google Scholar]
  43. Liu, H.B. Studies on Community Structure and Biodiversity of Meiofauna in Taiping Bay, Qingdao, China; Ocean University of China: Qingdao, China, 2007. [Google Scholar]
  44. Xu, M.; Liu, Q.H.; Zhang, Z.N.; Liu, X.S. Response of free-living marine nematodes to the southern Yellow Sea cold water mass. Mar. Pollut. Bull. 2016, 105, 58–64. [Google Scholar] [CrossRef] [PubMed]
  45. Widbom, B. Determination of average individual dry weights and ash-free dry weights in different sieve fractions of marine meiofauna. Mar. Biol. 1984, 84, 101–108. [Google Scholar] [CrossRef]
  46. Zhao, M.H.; Liu, X.S. Taxa composition and distribution patterns of meiofauna in the intertidal zones of Shandong Peninsula. J. Liaocheng Univ. (Nat. Sci.) 2021, 34, 100–110, (In Chinese with English Abstract). [Google Scholar]
  47. Danovaro, R.; Gambi, C.; Lampadariou, N.; Tselepides, A. Deep-sea nematode biodiversity in the Mediterranean basin: Testing for longitudinal, bathymetric and energetic gradients. Ecography 2008, 31, 231–244. [Google Scholar] [CrossRef]
  48. Van Den Hoogen, J.; Geisen, S.; Routh, D.; Ferris, H.; Traunspurger, W.; Wardle, D.A.; De Goede, R.G.M.; Adams, B.J.; Ahmad, W.; Andriuzzi, W.S.; et al. Soil nematode abundance and functional group composition at a global scale. Nature 2019, 572, 194–198. [Google Scholar] [CrossRef]
  49. Strayer, D.; Likens, G.E. An energy budget for the zoobenthos of Mirror Lake, New Hampshire. Ecology 1986, 67, 303–313. [Google Scholar] [CrossRef]
  50. Traunspurger, W. The biology and ecology of lotic nematodes. Freshw. Biol. 2000, 44, 29–45. [Google Scholar] [CrossRef]
  51. Traunspurger, W. Nematoda. In Encyclopedia of Inland Waters; Likens, G.E., Ed.; Academic: London, UK; Boston, MA, USA, 2009; pp. 372–383. [Google Scholar]
  52. Traunspurger, W.; Michiels, I.C.; Abebe, E. Composition and distribution of free-living freshwater nematodes: Global and local perspectives. In Freshwater Nematodes: Ecology and Taxonomy; Eyualem Abebe, A., Andràssy, I., Traunspurger, W., Eds.; CABI: Wallingford, UK, 2006; pp. 46–76. [Google Scholar]
  53. Giere, O. Meiobenthology. The Microscopic Motile Fauna of Aquatic Sediments; Springer: Berlin/Heidelberg, Germany, 2009; 527p. [Google Scholar]
  54. Wu, J.H. Studies of Freshwater and Soil Nematodes of China; Institute of Hydrobiology, Chinese Academy of Sciences: Wuhan, China, 1999; (In Chinese with English Abstract). [Google Scholar]
  55. Wieser, W. Benthic studies in Buzzards Bay II. The Meiofauna 1. Limnol. Oceanogr. 1960, 5, 121–137. [Google Scholar] [CrossRef]
  56. Traunspurger, W.; Wilden, B.; Majdi, N. An overview of meiofaunal and nematode distribution patterns in lake ecosystems differing in their trophic state. Hydrobiologia 2020, 847, 2665–2679. [Google Scholar] [CrossRef]
  57. Peters, L.; Traunspurger, W. Species distribution of free-living nematodes and other meiofauna in littoral periphyton communities of lakes. Nematology 2005, 7, 267–280. [Google Scholar] [CrossRef]
  58. Thiel, H.J. Benthos in Upwelling Regions. Upwelling Ecosystems; Springer: Berlin/Heidelberg, Germany, 1978; pp. 124–138. [Google Scholar]
  59. Josefson, A.B.; Widbom, B. Differential response of benthic macrofauna and meiofauna to hypoxia in the Gullmar Fjord basin. Mar. Biol. 1988, 100, 31–40. [Google Scholar] [CrossRef]
  60. Bruce, C.C. Freshwater Meiofauna: Biology and Ecology. Q. Rev. Biol. 2002, 77, 469. [Google Scholar]
  61. Kreuzinger-Janik, B.; Schroeder, F.; Majdi, N.; Traunspurger, W. Depth-Related Effects on a Meiofaunal Community Dwelling in the Periphyton of a Mesotrophic Lake. PLoS ONE. 2018, 10, e0137793. [Google Scholar] [CrossRef] [PubMed]
  62. Abebe, E.; Mees, J.; Coomans, A. Nematode communities of Lake Tana and other inland water bodies of Ethiopia. Hydrobiologia 2001, 462, 41–73. [Google Scholar] [CrossRef]
  63. Michiels, C.I.; Traunspurger, W. Benthic community patterns and the composition of feeding types and reproductive modes in freshwater nematodes. Nematology 2005, 7, 21–36. [Google Scholar] [CrossRef]
  64. Liu, X.S.; Xu, M.; Zhang, J.H.; Mou, G.; Liu, D.; Li, X. Abundance and biomass of deep-sea meiofauna in the northern South China Sea. J. Trop. Oceanogr. 2014, 33, 52–59. [Google Scholar]
  65. Cai, L.Z.; Fu, S.J.; Yang, J.; Zhou, X.P. Distribution of meiofaunal abundance in relation to environmental factors in Beibu Gulf, South China Sea. Acta Oceanol. Sin. 2012, 31, 92–103. [Google Scholar] [CrossRef]
  66. Pavlyuk, O.N.; Trebukhova, J.A. Meiobenthos in Nha Trang Bay of the South China Sea (Vietnam). Ocean Sci. J. 2006, 41, 139–148. [Google Scholar] [CrossRef]
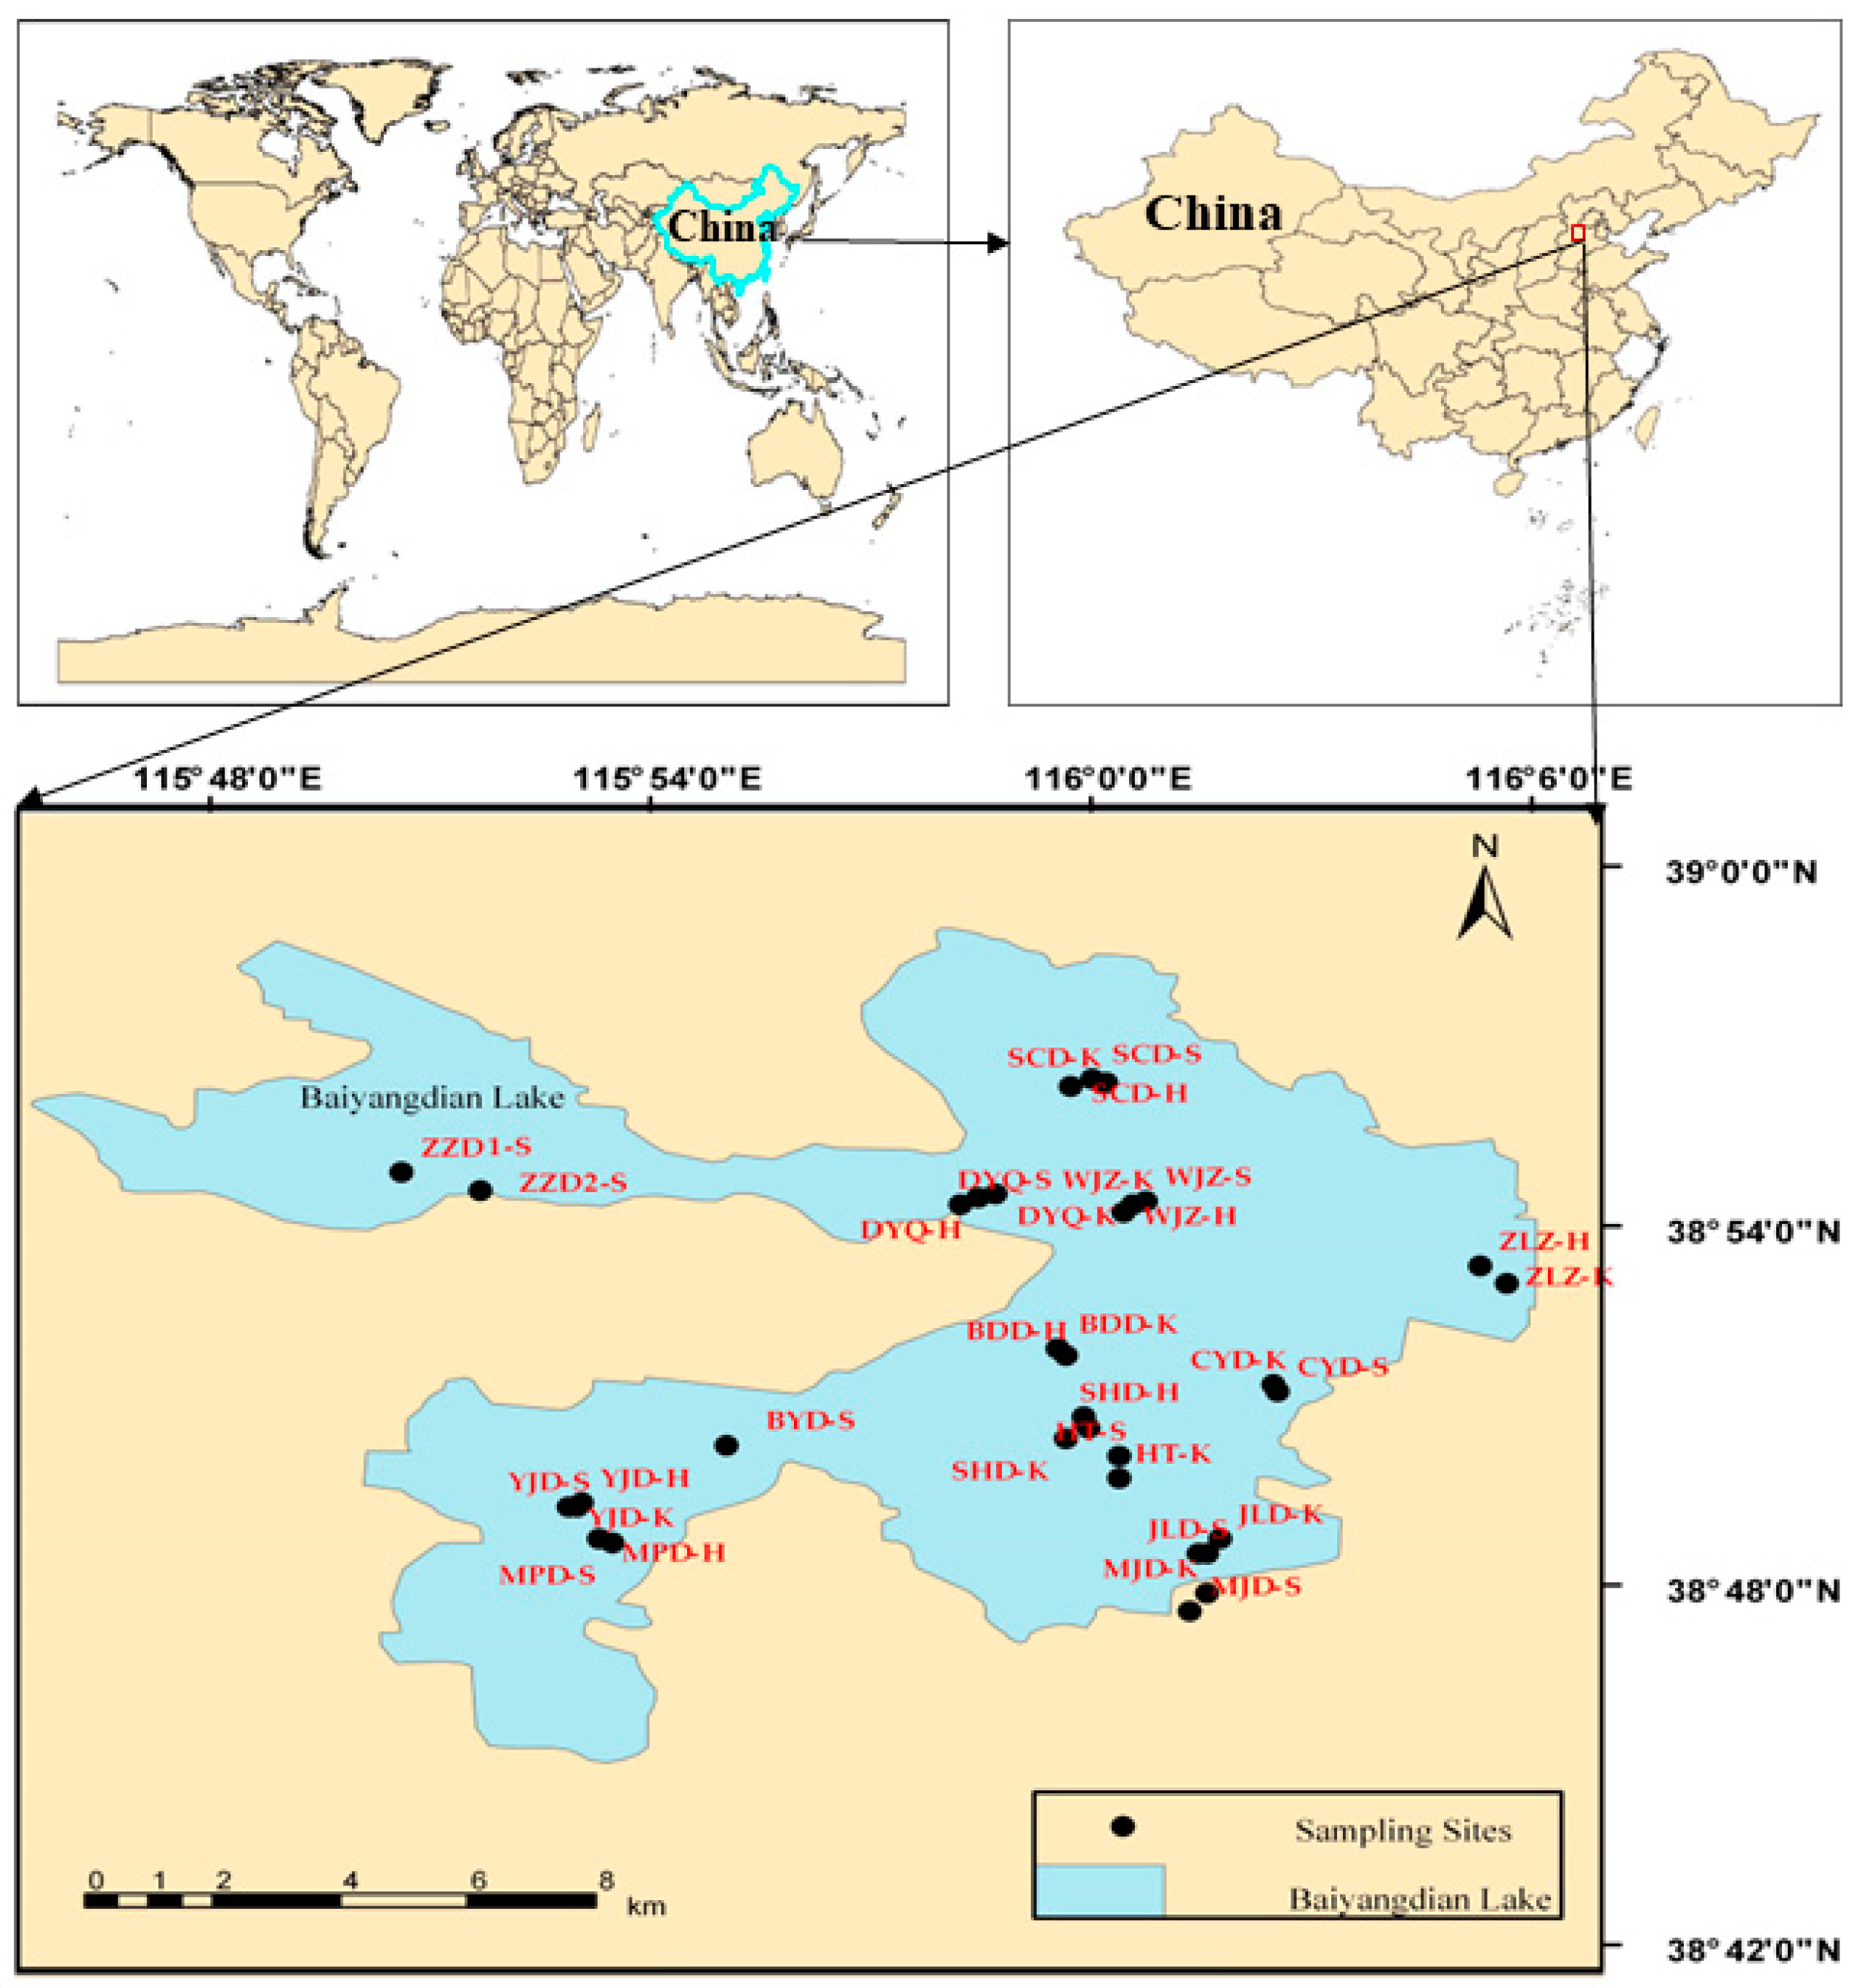
Figure 1. Sampling sites and study area (note: 33 sampling sites were set up across Baiyangdian Lake according to different habitat types, such as aquatic plant-dominant areas (abbreviated as S), trench areas (abbreviated as H), and pelagic areas (abbreviated as K)).
Water 16 01959 g001
Figure 2. Boxplots of the water-related environmental factors in the different seasons and habitats of Baiyangdian Lake.
Water 16 01959 g002
Figure 3. Evolution of the complement system: (a) spring, (b) summer, and (c) autumn.
Water 16 01959 g003
Figure 4. Seasonal variation in the abundance of meiofauna in Baiyangdian Lake.
Water 16 01959 g004
Figure 5. Seasonal variation in the biomass of meiofauna in Baiyangdian Lake.
Water 16 01959 g005
Figure 6. Diagrams showing the relationship between the abundance of meiofauna, ammonia nitrogen, and the water depth of Baiyangdian Lake across different seasons.
Water 16 01959 g006
Table 1. List of site names, locations, habitat types, and abbreviations of the 33 sampling sites.
Sampling Site NameLongitude (°) Latitude (°)Habitat TypeAbbreviations
Mapengdian115.88638.814Aquatic plant-dominant areasMPD-S
Mapengdian115.88338.815Trench areasMPD-H
Yangjiaodian115.87638.824Pelagic areasYJD-K
Yangjiaodian115.87838.824Aquatic plant-dominant areasYJD-S
Yangjiaodian115.87938.825Trench areasYJD-H
Baiyangdian 115.91238.841Aquatic plant-dominant areasBYD-S
Houtang116.00138.838Aquatic plant-dominant areasHT-S
Houtang116.00138.832Pelagic areasHT-K
Julongdian 116.01938.811Trench areasJLD-H
Julongdian 116.02138.811Aquatic plant-dominant areasJLD-S
Julongdian 116.02438.815Pelagic areasJLD-K
Mengjiadian 116.02138.8Pelagic areasMJD-K
Mengjiadian 116.01738.795Aquatic plant-dominant areasMJD-S
Badadian 115.98938.866Trench areasBDD-H
Badadian 115.98738.868Pelagic areasBDD-K
Shihoudian 115.98938.843Pelagic areasSHD-K
Shihoudian 115.99438.846Aquatic plant-dominant areasSHD-S
Shihoudian 115.99338.849Trench areasSHD-H
Dayaquan115.96938.91Trench areasDYQ-H
Dayaquan115.97338.911Pelagic areasDYQ-K
Dayaquan115.96538.908Aquatic plant-dominant areasDYQ-S
Zaolinzhuang116.08938.886Pelagic areasZLZ-K
Zaolinzhuang116.08338.891Trench areasZLZ-H
Chiyudian 116.03638.858Pelagic areasCYD-K
Chiyudian 116.03738.856Aquatic plant-dominant areasCYD-L
Shaochedian 115.9938.941Trench areasSCD-H
Shaochedian 115.99838.942Pelagic areasSCD-K
Shaochedian 115.99538.943Aquatic plant-dominant areasSCD-S
Wangjiazhai116.00238.906Trench areasWJZ-H
Wangjiazhai116.00438.908Pelagic areasWJZ-K
Wangjiazhai116.00738.909Aquatic plant-dominant areasWJZ-S
Zaozhadian1115.83838.917Aquatic plant-dominant areasZZD1-S
Zaozhadian2115.85638.912Aquatic plant-dominant areasZZD2-S
Table 2. The corresponding relationship between the TLI and nutrition category [37].
CategoryOligotrophicMesotrophicLightly
Eutrophic
Moderately
Eutrophic
Severely
Eutrophic
Extremely
Eutrophic
TLI<3030 ≤ TLI ≤ 5050 < TLI ≤ 6060 < TLI ≤ 7070 < TLI ≤ 80TLI > 80
Note: within the same trophic state, the higher the index value, the greater the degree of eutrophication.
Table 3. Empirical values of the individual average dry weights for different meiofauna groups.
GroupIndividual Dry Weight (μg)
Nematodes0.40
Ostracods26.00
Copepods1.86
Table 4. Various groups of meiofauna by abundance across the different seasons.
GroupItemSpringSummerAutumn
NematodesAbundance (ind. 10 cm−2)84.95 ± 39.1974.01 ± 20.4427.25 ± 5.81
Relative proportion of abundance (%)93.8688.5692.91
Biomass (dwt. 10 cm−2)33.98 ± 15.6829.60 ± 8.180.11 ± 2.32
Relative proportion of biomass (%)19.6511.380.21
OstracodsAbundance (ind. 10 cm−2)5.32 ± 1.908.81 ± 2.011.95 ± 1.20
Relative proportion of abundance (%)5.8910.556.65
Biomass (dwt. 10 cm−2)138.49 ± 49.30229.14 ± 52.2350.69 ± 31.27
Relative proportion of biomass (%)80.1088.0999.78
CopepodsAbundance (ind. 10 cm−2)0.23 ± 0.120.74 ± 0.180.13 ± 0.09
Relative proportion of abundance (%)0.250.890.44
Biomass (dwt. 10 cm−2)0.42 ± 0.221.38 ± 0.340.24 ± 0.17
Relative proportion of biomass (%)0.240.530.00
Table 5. Correlation coefficient between the abundance of meiofauna and environmental factors of Baiyangdian Lake in the spring, summer, and autumn.
Environmental FactorSeason
SpringSummerAutumn
NematodesOstracodsCopepodsTotalNematodesOstracodsCopepodsTotalNematodesOstracodsCopepodsTotal
Depth0.3710.2430.0330.3840.349 *0.302−0.2930.365 *0.231−0.1130.387 *0.215
Temp0.140−0.006−0.519 **0.1070.0990.284−0.0530.1230.2170.127−0.0150.245
SDD−0.3510.2300.175−0.3480.1730.083−0.0090.176−0.118−0.2820.264−0.174
pH0.2360.0960.3050.2480.1140.215−0.2250.1290.0570.075−0.0190.072
DO0.2180.1040.0630.2240.2880.367 *−0.2570.3120.1400.107−0.0490.163
FNU0.184−0.232−0.0500.181−0.012−0.142−0.045−0.0250.0870.2720.682 **0.155
TPHs0.040−0.1510.0600.054−0.309−0.283−0.294−0.3290.088−0.112−0.0460.064
Chl-a−0.071−0.1590.118−0.072−0.177−0.074−0.221−0.1810.261−0.076−0.1640.245
TP0.160−0.2990.2800.160−0.162−0.320−0.182−0.1890.1340.005−0.0140.136
TN−0.2540.2680.622 **−0.219−0.067−0.182−0.220−0.085−0.2330.1360.083−0.205
NH3-N−0.206−0.131−0.274−0.206−0.482 **−0.2820.126−0.494 **0.248−0.1550.0510.218
CODMn−0.287−0.174−0.395−0.289−0.2160.072−0.160−0.2040.147−0.105−0.0410.126
Notes: Depth: water depth; Temp: water temperature; SDD: Secchi disk depth (transparency); pH: pH value (acidity and alkalinity value); DO: dissolved oxygen; FTU: turbidity; TPHs: total petroleum hydrocarbons; Chl-a: chlorophyll-a; TP: total phosphorus; TN: total nitrogen; NH3-N: ammonia nitrogen; CODMn: permanganate index. The symbol * indicates significant correlation at the 0.05 level (two sides), and ** indicates significant correlation at the 0.01 level (two sides).
Disclaimer/Publisher’s Note: The statements, opinions and data contained in all publications are solely those of the individual author(s) and contributor(s) and not of MDPI and/or the editor(s). MDPI and/or the editor(s) disclaim responsibility for any injury to people or property resulting from any ideas, methods, instructions or products referred to in the content.