1. Introduction
Landslides are one of the most devastating geohazards and pose a significant risk to communities and infrastructure worldwide. Among the various triggers, such as earthquakes, snowmelt, volcanic, or human activity, the rainfall infiltration, especially during extraordinary intense and prolonged rainfall events, is the most frequent triggering factor for landslide activation. With the climate-induced changes becoming more and more evident, extraordinary rainfall events and extreme weather conditions are increasingly becoming more and more “ordinary” phenomena. It is, therefore, not surprising that more and more landslide studies are pointing to the link between the changes in precipitation characteristics caused by climate change and the frequency and magnitude of rainfall-induced landslides [
1,
2,
3,
4,
5].
While the physical mechanisms that describe how an intense rainfall can affect the stability of shallow landslides by reducing soil suction during the transient rainfall infiltration process [
6,
7,
8,
9,
10,
11,
12,
13], or how the groundwater level rise associated with prolonged and intense rainfall can cause slope failure due to increased pore water pressure (e.g., [
1,
14,
15,
16,
17]) are known, predicting the exact location and timing of landslide activation remains a major challenge for the landslide scientific community. The complexity of the problem arises from the fact that there are many factors and processes that influence the stability state of a slope, most of them being interrelated and essentially inseparable. For example, a type of material forming a slope and conditions to which a slope has been exposed in the past shape its mechanical behavior and hydraulic properties. The hydro-mechanical (HM) response of a soil would also be affected by the geomorphologic and stratigraphic conditions of a slope, as well as by the presence of the vegetation. The type and density of the latter would affect the slope stability condition not only through the mechanical root reinforcement but would also impact the hydraulic conditions within the slope by affecting the amount of the rainfall infiltrating through the surficial layer (the canopy interception and the transpiration). The latter affects soil moisture distribution, i.e., the pore pressure distribution within a slope, and thus also impacts the mechanical response and stability conditions of a slope. The HM response would also be affected by the possible presence and dynamics of the desiccation cracks, which are again influenced by the soil composition, moisture conditions, temperature, and the presence of vegetation. Temperature changes affect both the mass transfer, i.e., hydraulic processes, as well as the mechanical behavior of involved materials. Even if not considering other relevant factors that have important repercussions on the HM response of a slope, such as the hydraulic hysteresis phenomena or dynamic and time-dependent nature changes in material properties and boundary conditions, the number of attributing variables is already significantly increased. As a possible solution, more and more studies have recognized the need for an interdisciplinary approach to understand and mitigate the hazards posed by rainfall-induced landslides (e.g., [
4,
18,
19,
20]). Indeed, a comprehensive approach that would encompass all phenomena-related aspects, from the causes and governing mechanisms of rainfall-induced landslides to the impact and development of effective risk management strategies and land-use policies to mitigate landslide hazards, requires integration of expertise coming from various fields, such as geology and geomorphology, hydrology and hydrogeology, geotechnical engineering and environmental sciences, climatology and meteorology, ecology and social sciences, as well as urban planning and landslide protection strategies and policies.
The soil–water characteristic curve (SWCC), which relates soil moisture to soil suction, represents a fundamental feature in unsaturated soil mechanics. In the context of the stability of slopes exposed to rainfall infiltration, it can be considered as a means of providing the link between the hydrological conditions in a slope and its mechanical aspects, i.e., slope stability. In other words, it enables the coupling between the hydraulic response of a slope, which is usually reflected in transient, seepage-induced soil moisture changes resulting from the complex interaction between the surface soil in the unsaturated part of a slope, the atmosphere, and the vegetation, and the mechanical response, i.e., how the soil moisture changes affect stress conditions, the deformations, and the available shear strength of a slope. In general, these changes can be caused by both positive (downward) and negative (outward) net fluxes, depending on the interplay between evapo(transpi)rational demands and rainfall conditions on a slope. Due to hysteresis effects, modeling such processes typically requires defining sets of hydraulic parameters representative of drying and wetting processes, i.e., defining the drying and wetting branches of the SWCC. Possible hydraulic paths that a soil can undergo depending on the acting boundary conditions should be constrained by the main drying and wetting branches of the SWCC. Together with the hydraulic conductivity function (HCF) and the rainfall properties, the SWCC plays the decisive role in the transient rainfall infiltration process and, thus, has a major influence on the stability of slopes exposed to rainfall.
However, direct measurement of SWCC using conventional laboratory methods can be challenging, expensive, time-consuming, and include a great number of uncertainties (e.g., [
21,
22,
23,
24,
25,
26,
27]). This is particularly present for fine-grained soils, where the unsaturated soil property functions cover a wide range of soil suction that these types of soil may typically exhibit, and where the measurements to determine SWCC typically require the combination of different techniques and equipment [
28,
29,
30]. On the other hand, measurements in uniformly graded, coarse-grained soils, such as sand and gravels, can be challenging due to the typically highly nonlinear and steep shape of the SWCC, where only a few kPa of soil suction can distinguish between saturated and residual soil moisture conditions [
31,
32]. This study encompasses the latter type of soil: a uniformly graded, fine sand that has been extensively used in 1
g small-scale physical landslide modeling.
This study presents some of the preliminary results and experiences on the possible use of physical slope model tests with specifically designed boundary conditions, to determine the soil–water retention properties of the in-slope built sandy soil. The 30 cm-deep and 35 degrees inclined slope model, instrumented with the soil moisture and pore water pressure sensors, was subjected to increasing and decreasing simulated rainfall intensities. The tests started with the initial, relatively low gravimetric water content achieved during the construction of the slope model. The lowest rainfall intensity was applied first and kept constant until no further changes in soil moisture and suction were observed, i.e., until the steady state was reached. In the following steps, the rainfall intensities were increased, and the steady-state soil moisture and soil suction data were determined in the same way. Once steady-state conditions were reached for the highest applied intensity, the rainfall intensity was reduced to obtain the steady-state data that can be used to account for possible hydraulic hysteresis effects, i.e., differences in the hydraulic response of the monitored points when the same rainfall intensity was achieved by increasing or decreasing the simulated rainfall loads. The steady-state condition pore water pressure and soil moisture data obtained for monitored points under increasing and decreasing simulated rainfall conditions were utilized to obtain the best-fit parameters of the van Genuchten model [
33], representative of a soil material undergoing the drying and wetting processes. In contrast to the most commonly used laboratory methods for the determination of SWCC, the proposed approach thus allows the determination of the drying and wetting branches of the SWCC of the soil material lying on the slope by direct measurements of the soil suction. The preliminary results indicated that the presented approach is not only useful for the hydraulic characterization of the soil, but that the experimentally obtained data could also be valuable in the investigation of hydraulic hysteresis effects on soil moisture and pore water pressure conditions within the slope model, thus improving the understanding of how hydraulic hysteresis phenomena influence the stability condition of a slope under various rainfall patterns. While the study considers the soil type that undergoes negligible volumetric deformations during changes in moisture content, some suggestions and discussions on possible improvements and generalization of the proposed method are provided as well.
2. Method
The experimental setup included the platform for testing slope models exposed to simulated rainfall under 1×
g loading conditions, the rainfall simulator, and the comprehensive monitoring system that allows the hydraulic and mechanical response of the model to be monitored. The platform itself was developed as part of a four-year research project, “Physical modeling of landslide remediation constructions behavior under static and seismic actions (ModLandRemSS)” [
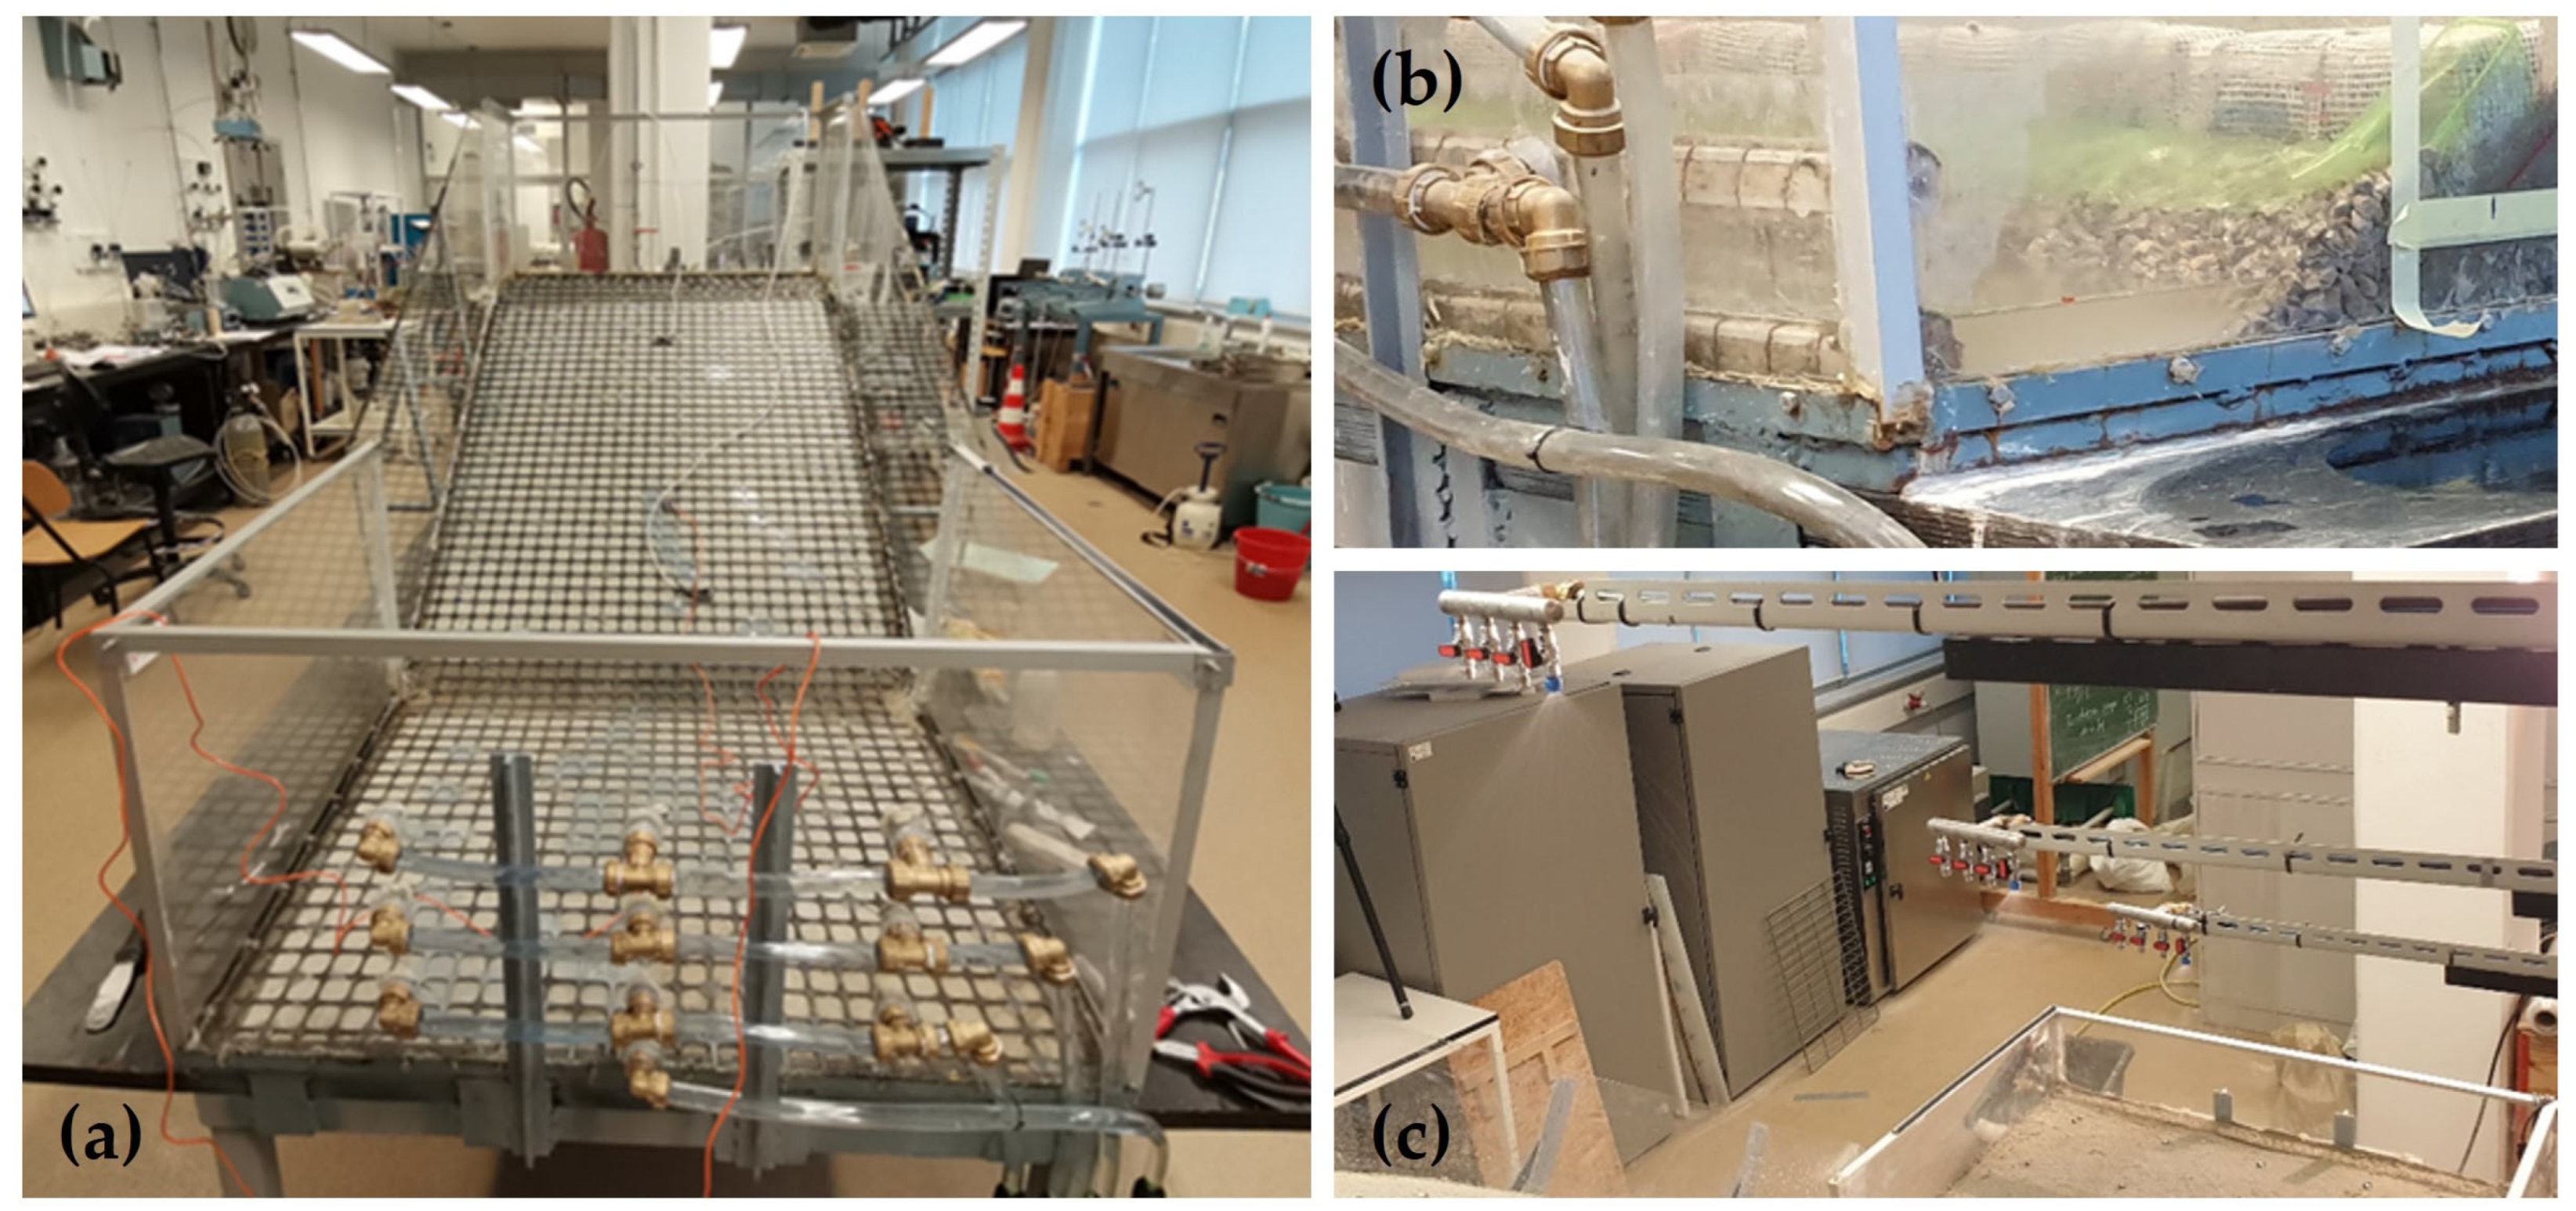
34]. It consists of steel elements, i.e., steel plates, beams, and columns, which form the structure of the platform, and transparent side walls made of Plexiglass. The flume itself is 1.0 m wide, while the upper, inclined, and lower segments of the platform are 0.3, 1.4, and 0.8 m long. The geogrid is usually attached to impermeable steel plates that form the rough base of the platform to prevent slippage of the installed soil material along the steel base. The rotating hinge connections between the plates and the adjustable height of the steel columns supporting the upper part of the slope allow construction of slope models with desired inclination angles, which can range from less than 20 to more than 45 degrees. The 50 cm-high, transparent Plexiglass side walls make it possible to observe the progress of the wetting front and to follow the movements on the side of the model. A three-level drainage system inserted through the front-facing Plexiglass wall in the lower part of the flume allows to control the water level in the model during the test and fast drainage of the flume after the test has been completed. The rainfall simulator consists of three independent sprinkler branches that deliver water from the main controlling unit. Each of the branches is equipped with four different axial-flow, full-cone nozzles, allowing the system to generate different rainfall patterns and a wide range of intensities depending on the working pressure and spray nozzle(s) used. More details about the platform and the rainfall simulator, as well as the examples of different studies conducted with the platform, can be found elsewhere [
34,
35,
36,
37].
Figure 1 shows some details of the platform, including the empty platform with the geogrid attached to the bottom steel plate, the drainage elements, and the sprinkler branches equipped with different nozzles.
2.1. Model Build-Up and Instrumentation
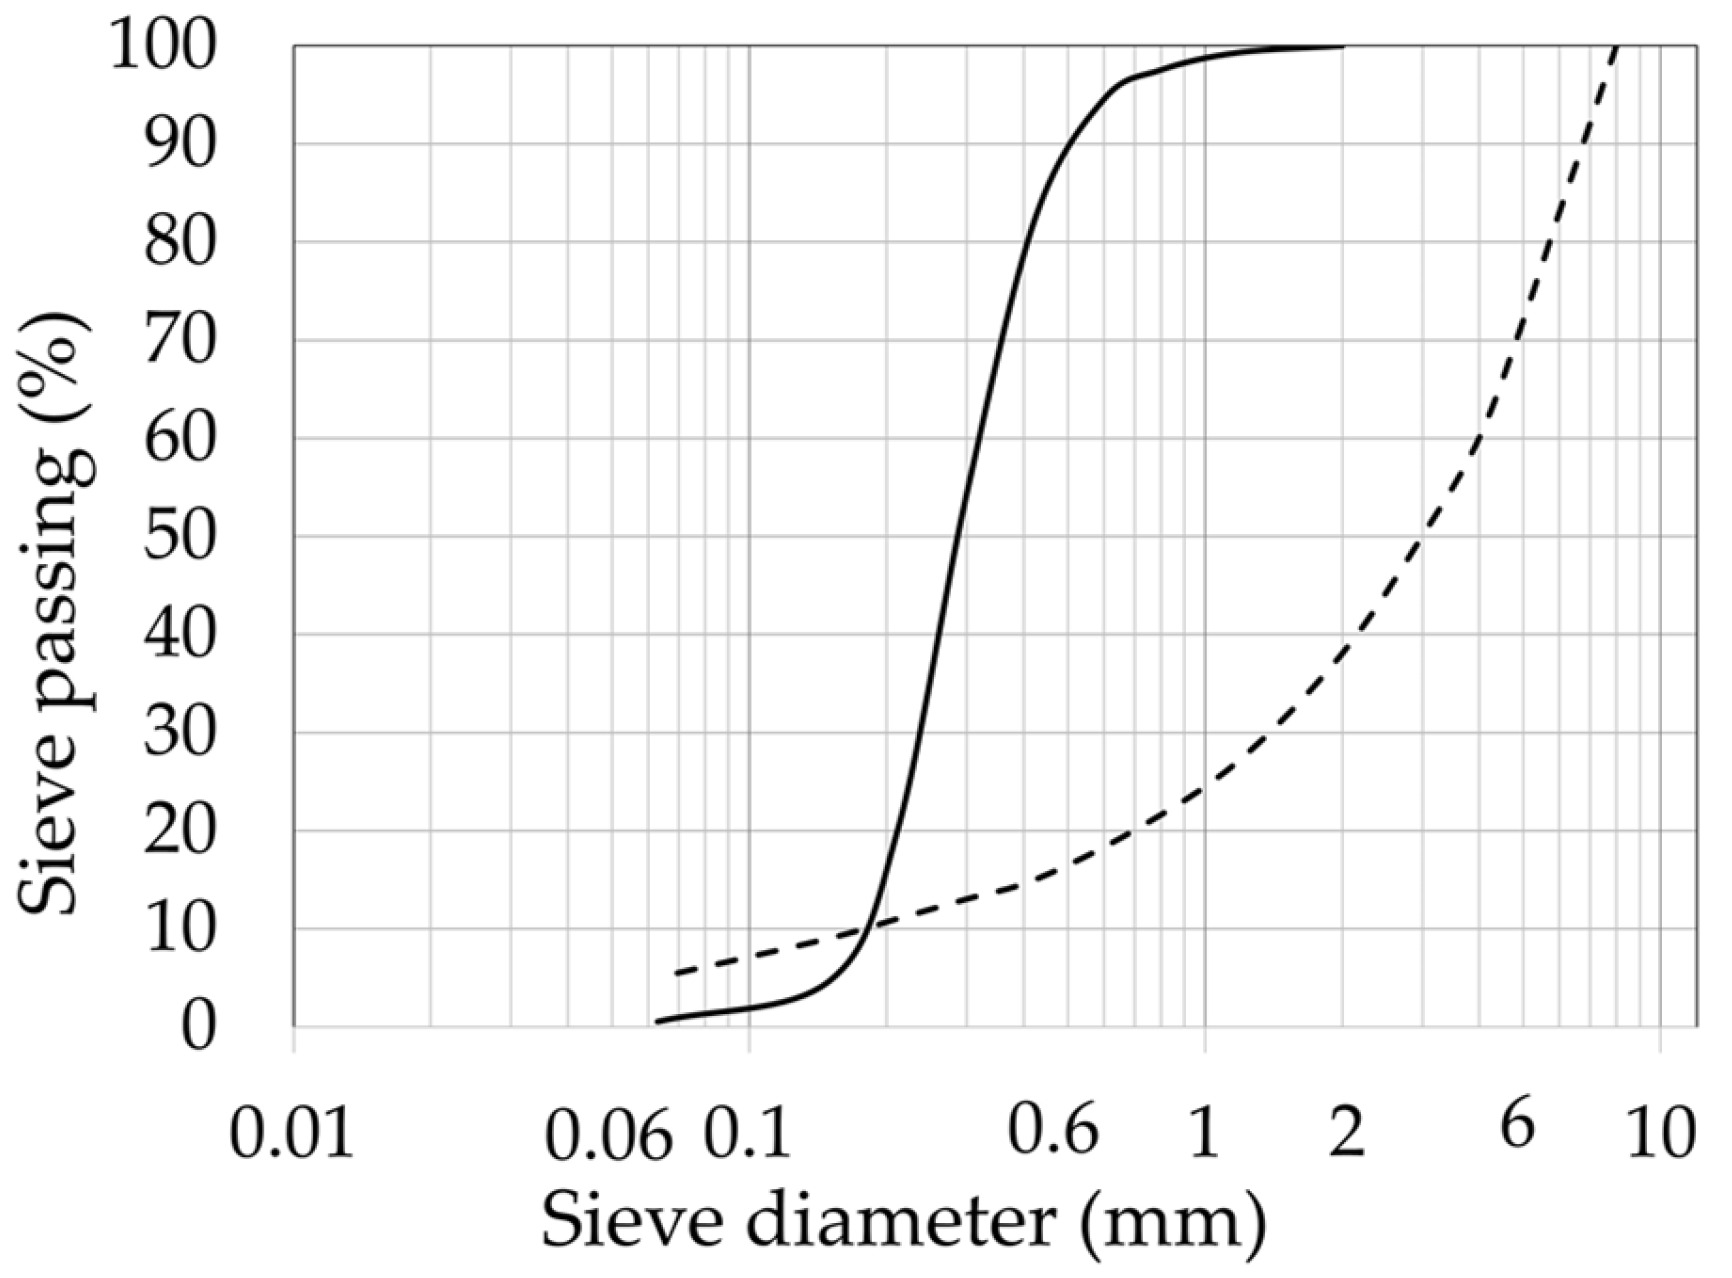
The soil considered in this study, a uniformly graded, fine sand with the basic soil properties presented in
Table 1, was used for the construction of two slope models, as explained in the following section. In both cases, the dry sandy soil was thoroughly mixed with tap water to achieve the targeted gravimetric water content of 2%. The predefined mass of soil was then placed in the platform and compacted in 5 layers using the Ladd’s under-compaction method [
38] to create the 30 cm-high sandy slope model with the most homogeneous conditions possible in terms of initial porosity and moisture content.
Table 1 shows that the targeted initial porosity of 0.44 corresponded to 50% of the relative density of the sandy soil used in the study. Compaction was carried out in such a way that the number of finished (i.e., compacted) soil layers increased from the lower to the upper part of the slope, so that the stability of the model during construction was ensured.
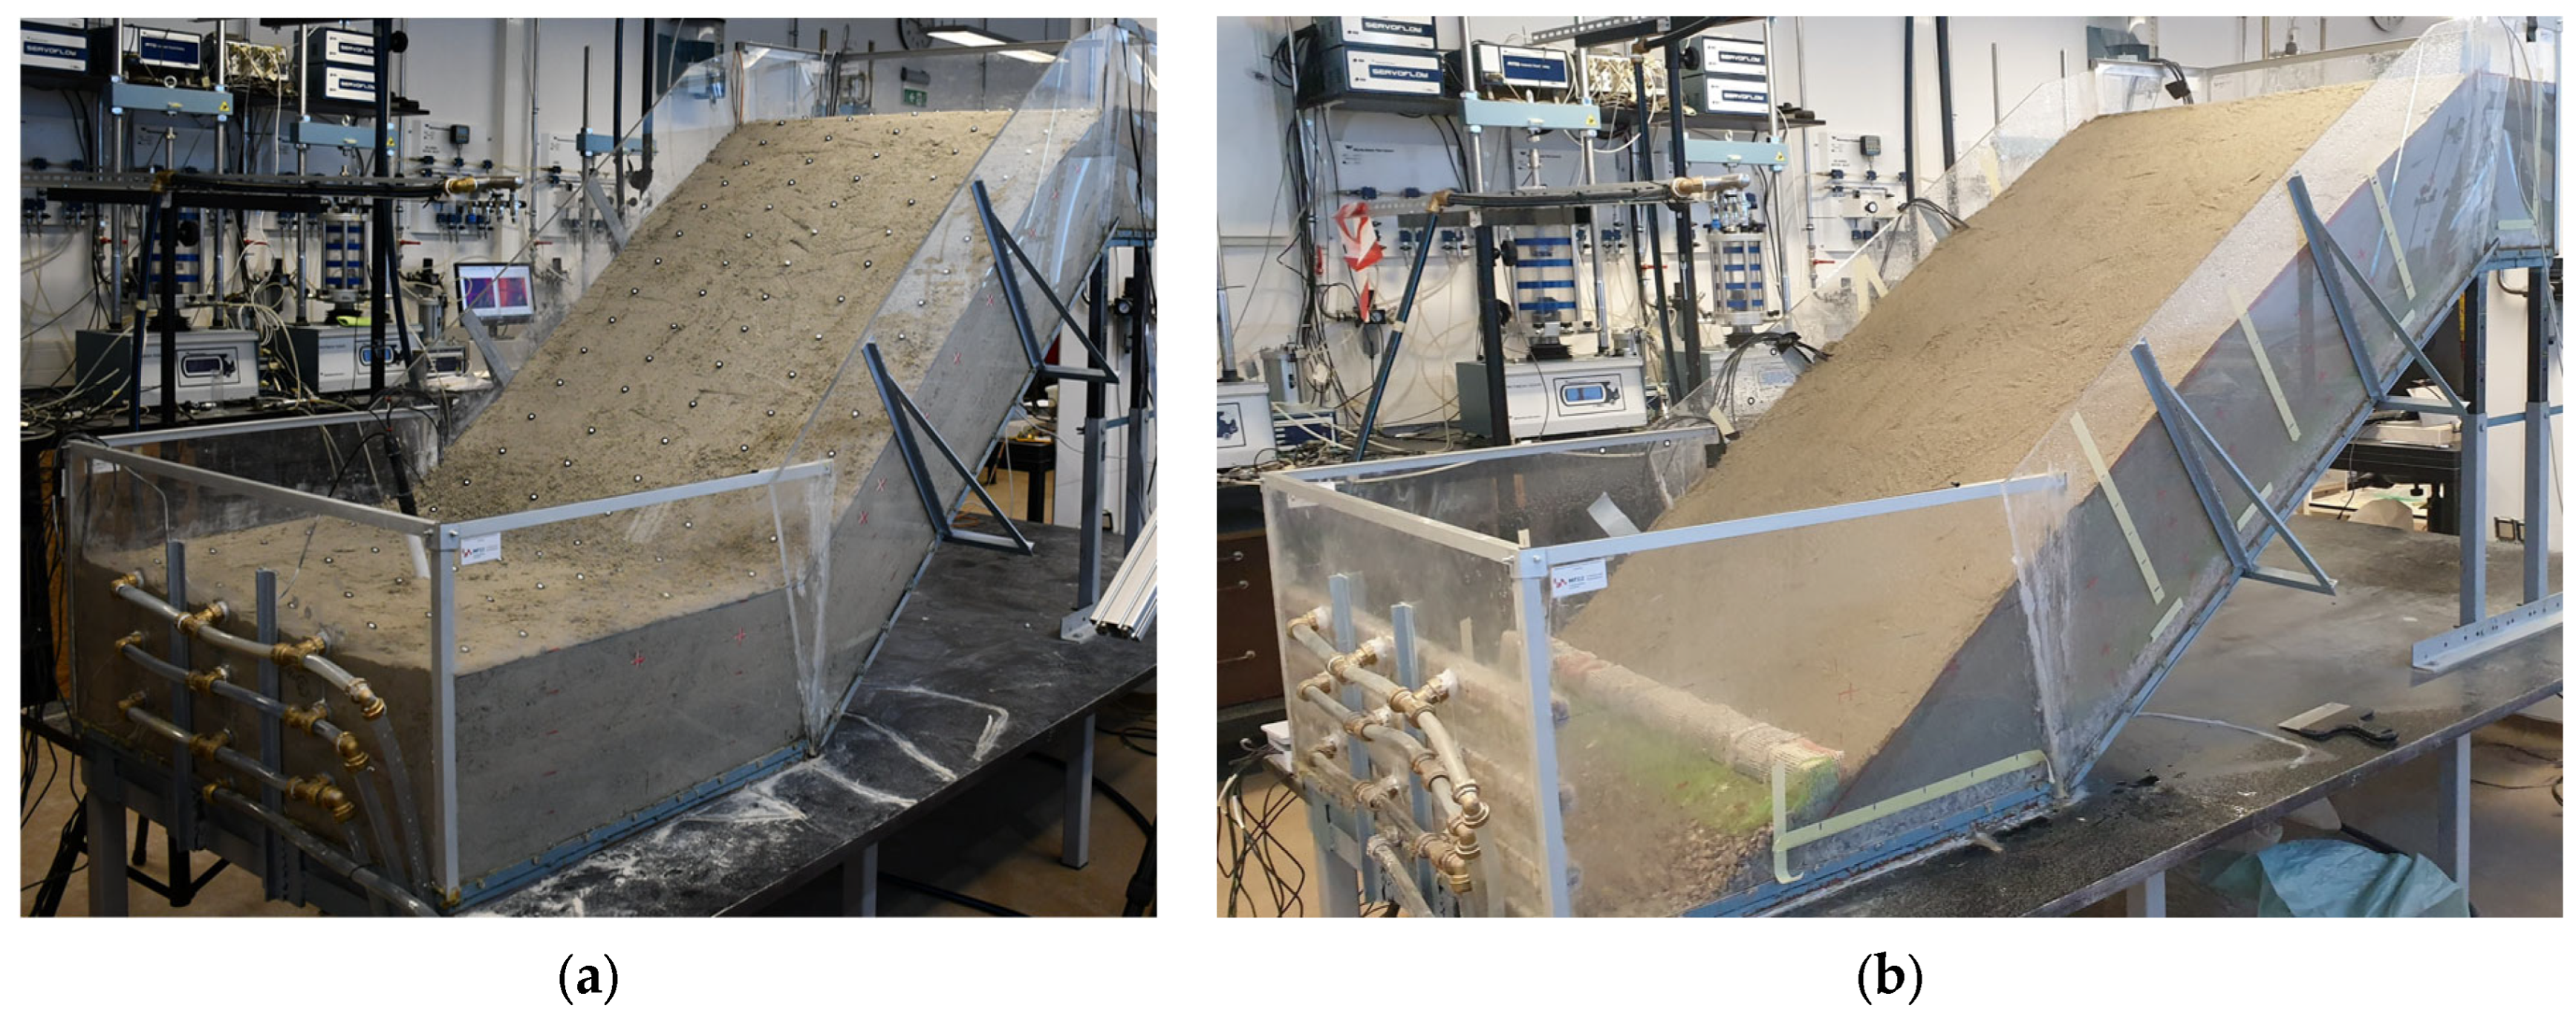
The first slope model was built directly on the impermeable steel plates, with the slope’s toe extending to the end of the flume, as can be seen in
Figure 2a. However, the rise of the water table in the lower part of the slope during the prolonged period of infiltration resulted in most of the monitored points being submerged or taking too long to reach steady-state conditions for the applied rainfall intensity. This was particularly evident at higher rainfall intensities in the later phase of the test. Therefore, considering the specific objective of the study, the second model was built in the same way as the first model, but with 5 cm of gravel placed on the impermeable bottom of the flume below the sandy material. In this way, the drainage conditions in the model were improved, and it was found that the monitored points were able to provide data on the hydraulic response under partially saturated conditions for different rainfall intensities. A foil of geosynthetic was placed on top of the gravelly layer to separate the materials and prevent a washout of fine sandy material into the coarser gravel material during the infiltration and flow process. Additionally, the geometry of the model was modified to avoid or postpone the rise in the groundwater level and saturation of the monitored points in the inclined part of the model. As can be seen in
Figure 2b, the foot of the slope was omitted and the inclined part was extended to the bottom of the flume, so that the geometry of the second slope model was more akin to an “infinite slope model”. As will be discussed later, this proved to be advantageous for the purpose of the investigation of hydraulic properties of the tested material, as it allowed a longer test duration and the achievement of steady-state conditions for the monitored points, even at a relatively high rainfall intensity. The gabion wall was installed at the bottom of the slope to prevent the toe of the slope from eroding during the testing period. The two slope models at the start of the test are shown in
Figure 2. As it was noticed before, only the results of the second model, i.e., “the infinite slope” model, are presented in this paper. The grain size distribution curves of the embedded sandy and gravelly material are shown in
Figure 3.
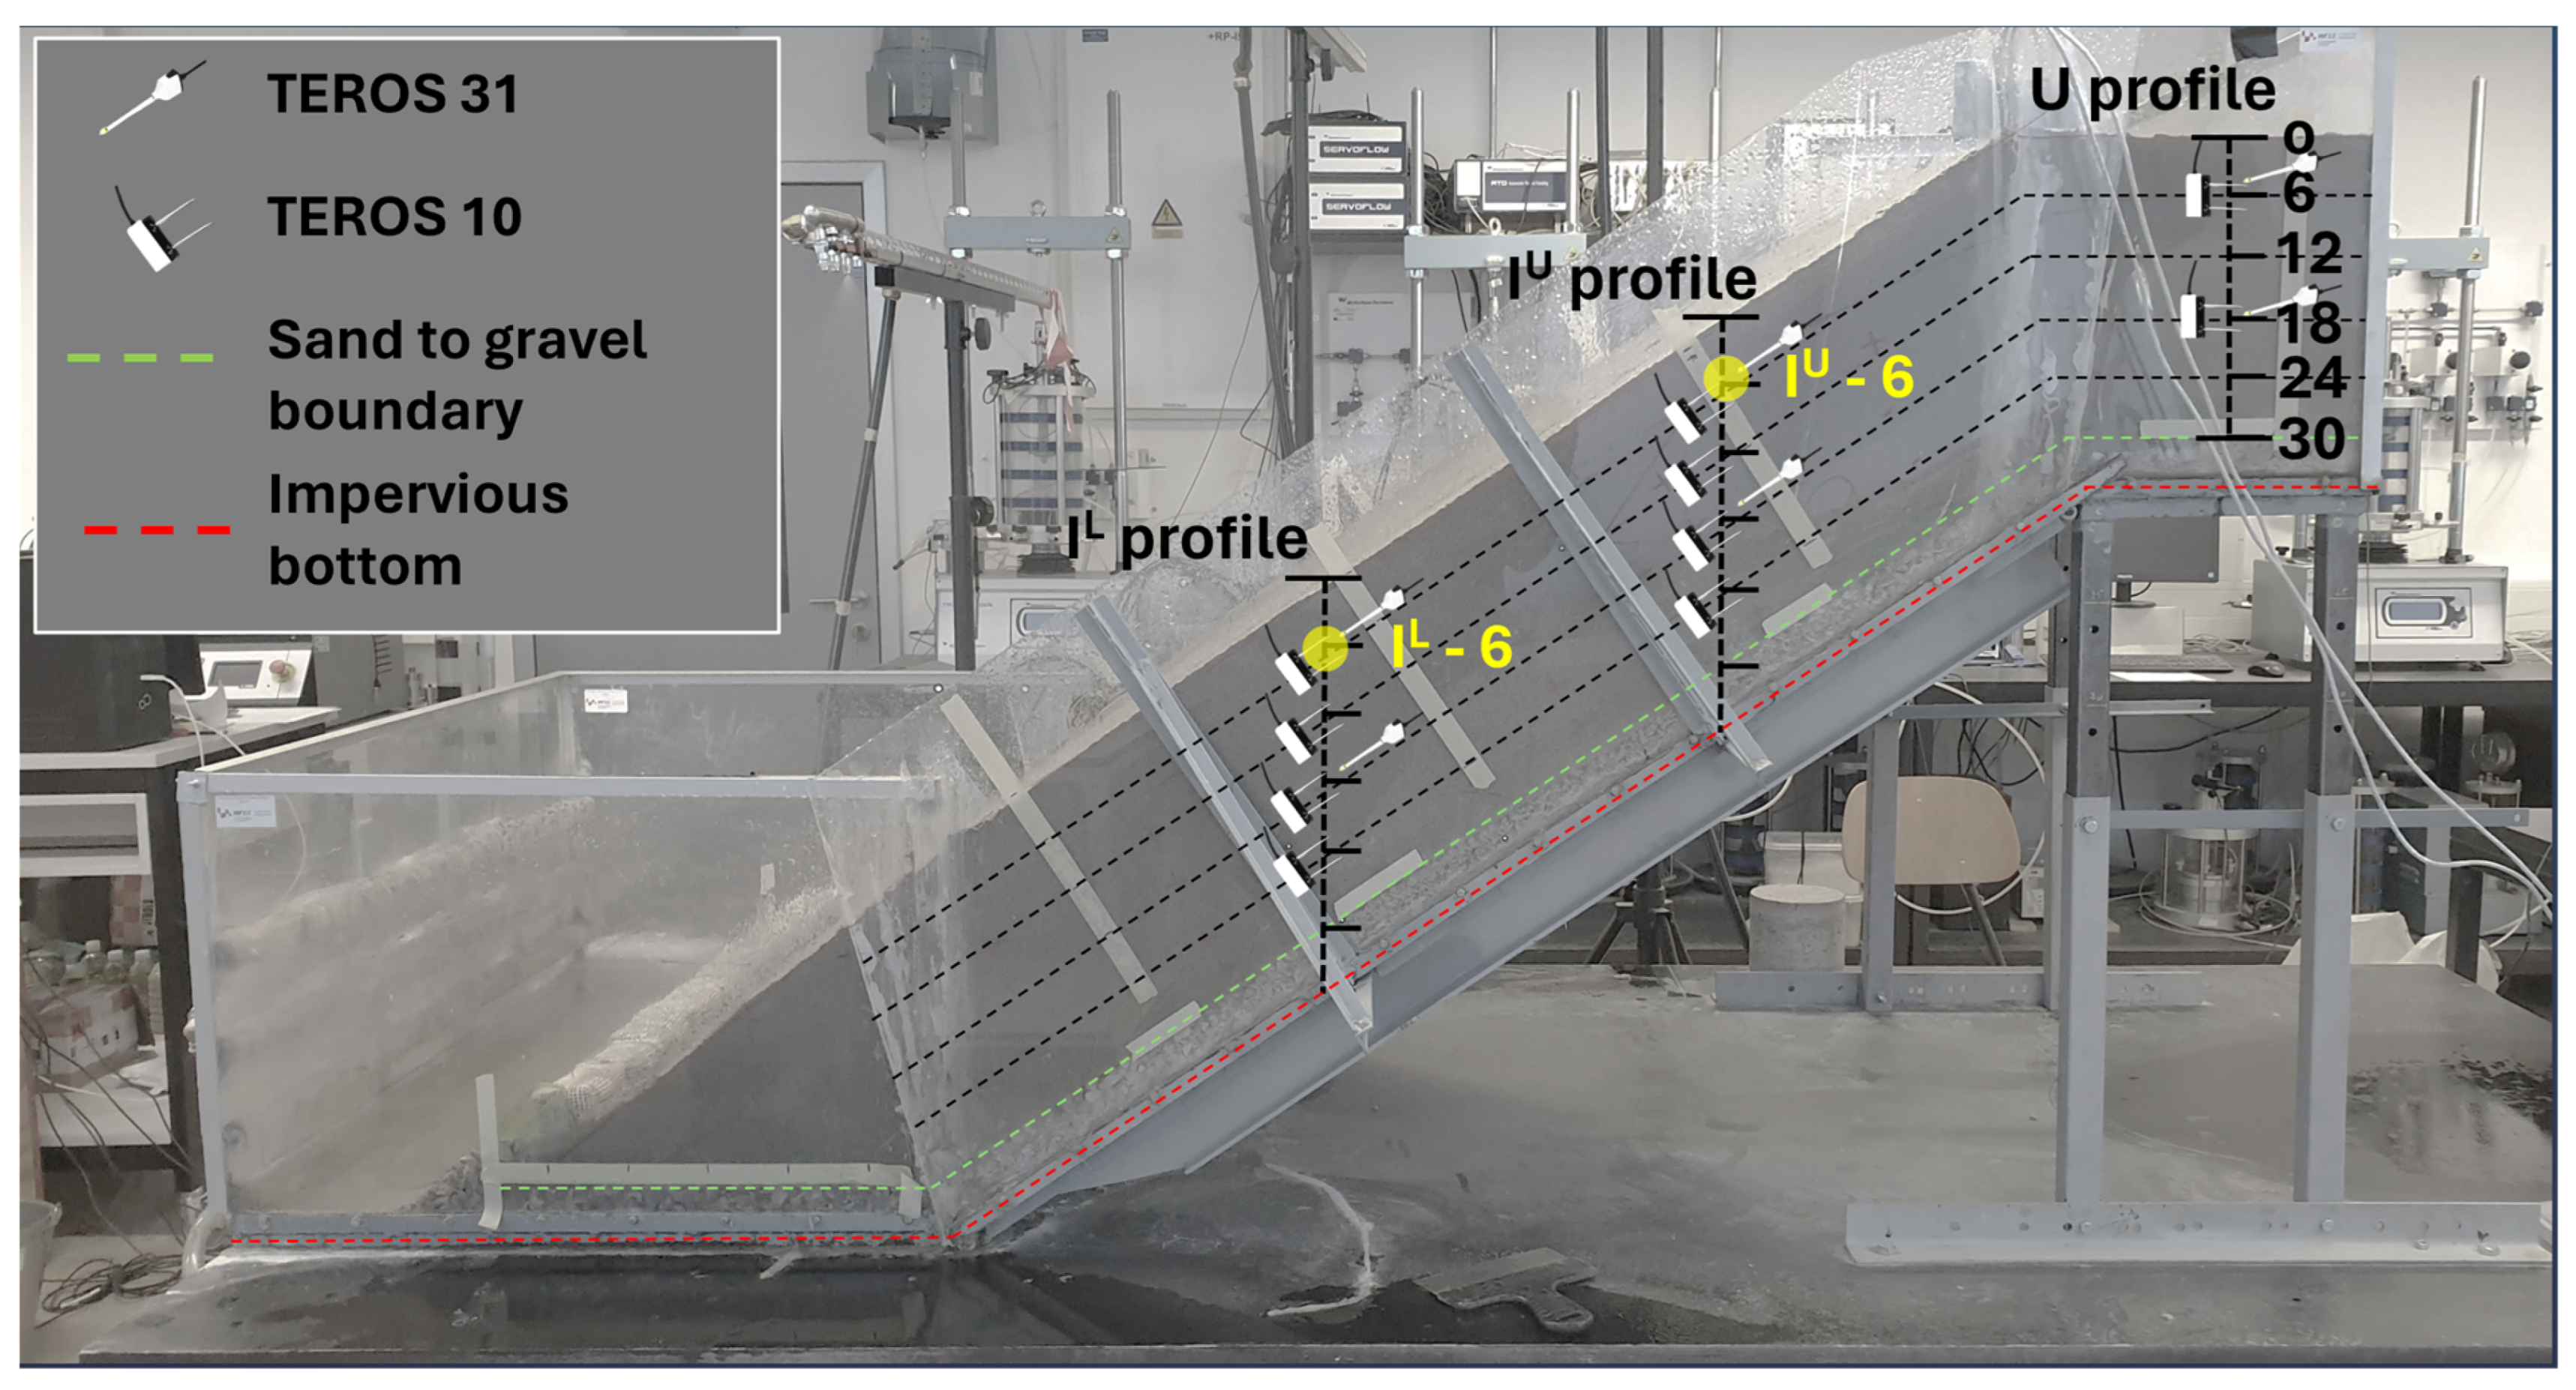
After the construction of the slopes was completed, slope models were instrumented to monitor their hydraulic and mechanical response during and after the artificial rainfall events. Changes in soil moisture were monitored using TEROS 10 and TEROS 12 theta probes, while TEROS-31 mini-tensiometers (METER Group AG, Munich, Germany) enabled the measurement of pore water pressure in the positive and negative domains (i.e., soil suction). A central part of the slope model was vertically cut at three different locations, where three measurement profiles were established: one for the upper part (U-profile), and two profiles along the inclined part of the model: one in its upper part (I
U-profile) and one in its lower part (I
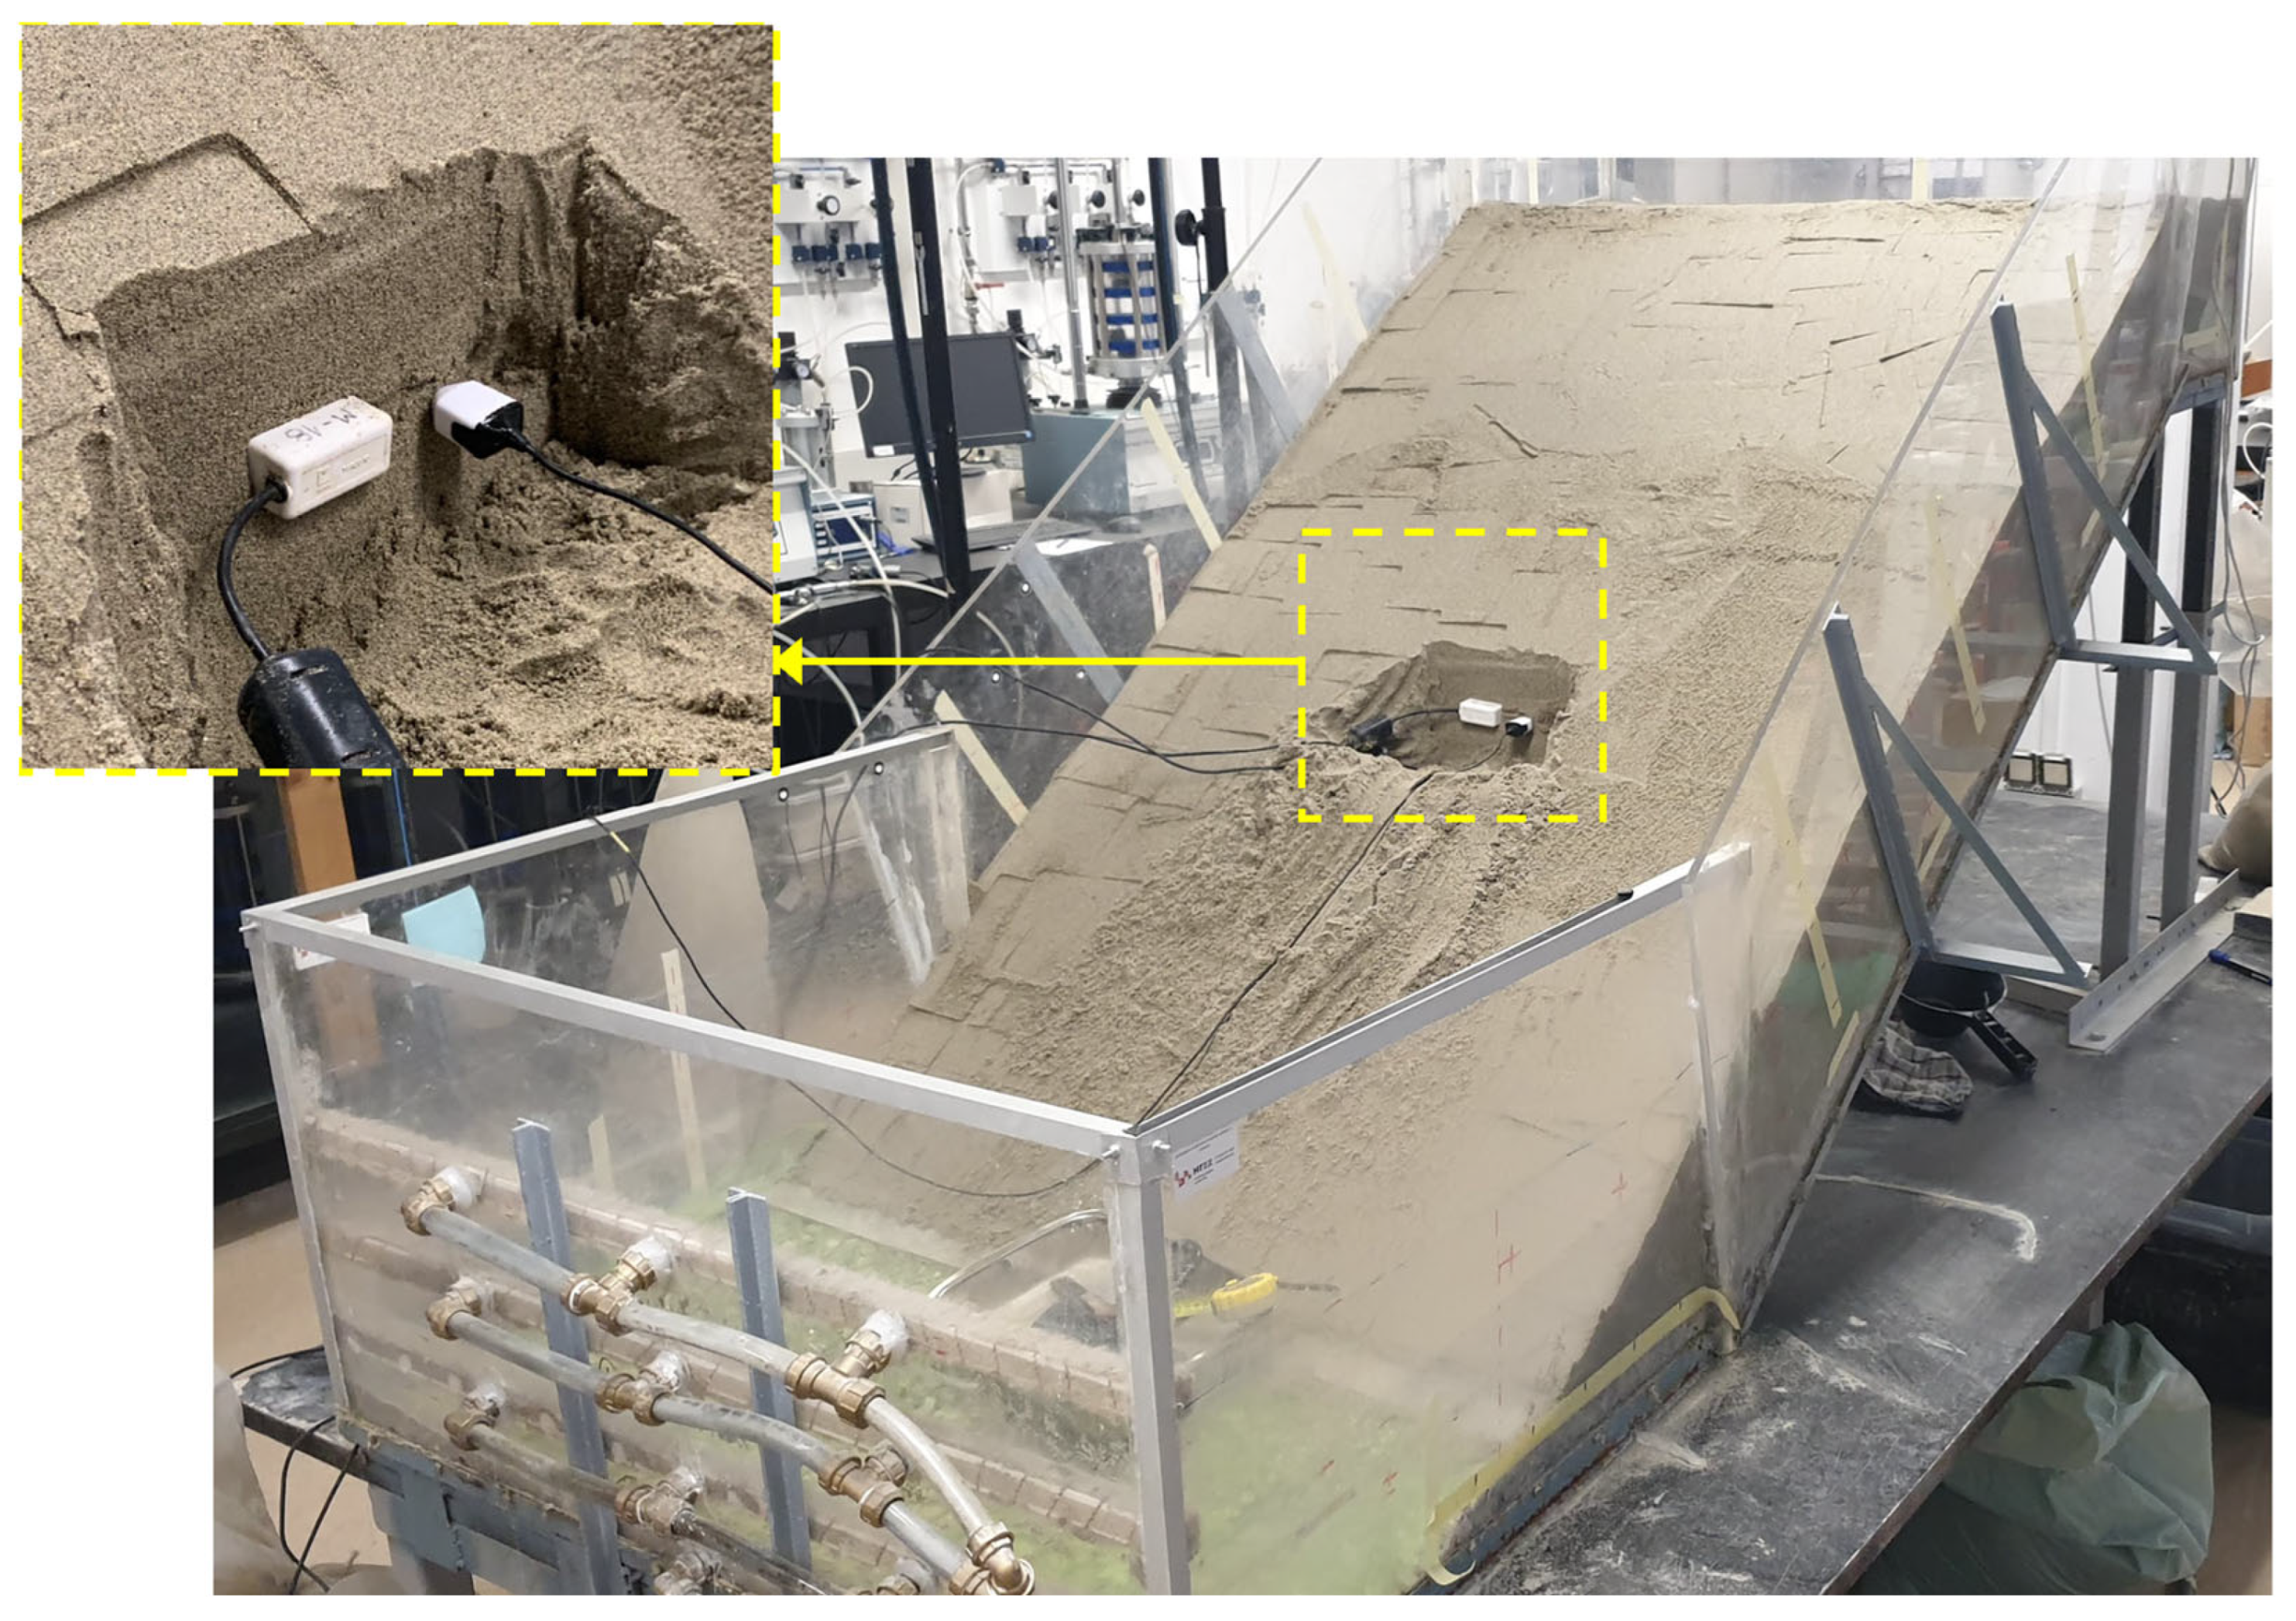
L-profile). The positions of the profiles in the inclined part of the model were set to one-third of the inclined section length. After a vertical cut was made (
Figure 4), the sensors were pushed into the slope model at depths corresponding to the junction of the layers formed during the construction phase of the model, i.e., every 6 cm perpendicular to the slope surface. When instrumenting the model, care was taken to disturb the soil material in the slope as little as possible, while ensuring good hydraulic contact between the sensor unit and the surrounding soil was achieved. In this way, a total of 18 sensors were installed along three measurement profiles located in the center of the width of the slope model, as shown in
Figure 5.
A range of measurement techniques, such as photogrammetric equipment for multi-temporal landslide analysis of image sequences obtained from a pair of high-speed stereo cameras, terrestrial laser scanning, structure-from-motion (SfM) photogrammetry surveys, as well as accelerometers, strain gauges, etc. (for more details, see [
39,
40]), can be used to monitor the surface displacements within the slope model. Although these techniques are usually crucial to investigate different aspects of landslide-triggering mechanisms or different stages of landslide activity, this is not the case for the study presented here. Due to the specific aim of this study, i.e., the investigation of the unsaturated hydraulic properties of the soil, which undergoes negligible volumetric deformations during the rainfall infiltration [
32], where the stability of the slope and the absence of larger shear deformations is the condition required for the proper data analysis, the geodetic and geotechnical parts of the monitoring related to the displacements of the model essentially represent a tool that only verifies the condition of negligible soil deformations during the test. In this case, no coupling between pore water pressure and soil deformations is required. Therefore, pins with marker points were placed on the surface of the model, and the continuous monitoring of the 3D coordinates of the reference points was performed during the tests using the optical non-contact 3D measurement system, ARAMIS 4M (GOM mbH, Braunschweig, Germany), for the first model only (
Figure 2a). While further details on this measurement system can be found elsewhere [
31,
35,
40], the results on the mechanical response of the models are irrelevant for the study at hand and thus were excluded from this presentation.
Once the slope model was built and instrumented with the described monitoring equipment, the model was covered with nylon to prevent the soil moisture being lost through evaporation until the test was started. All sensors were connected to corresponding data logging units and appropriate recording intervals were selected.
2.2. Testing Conditions
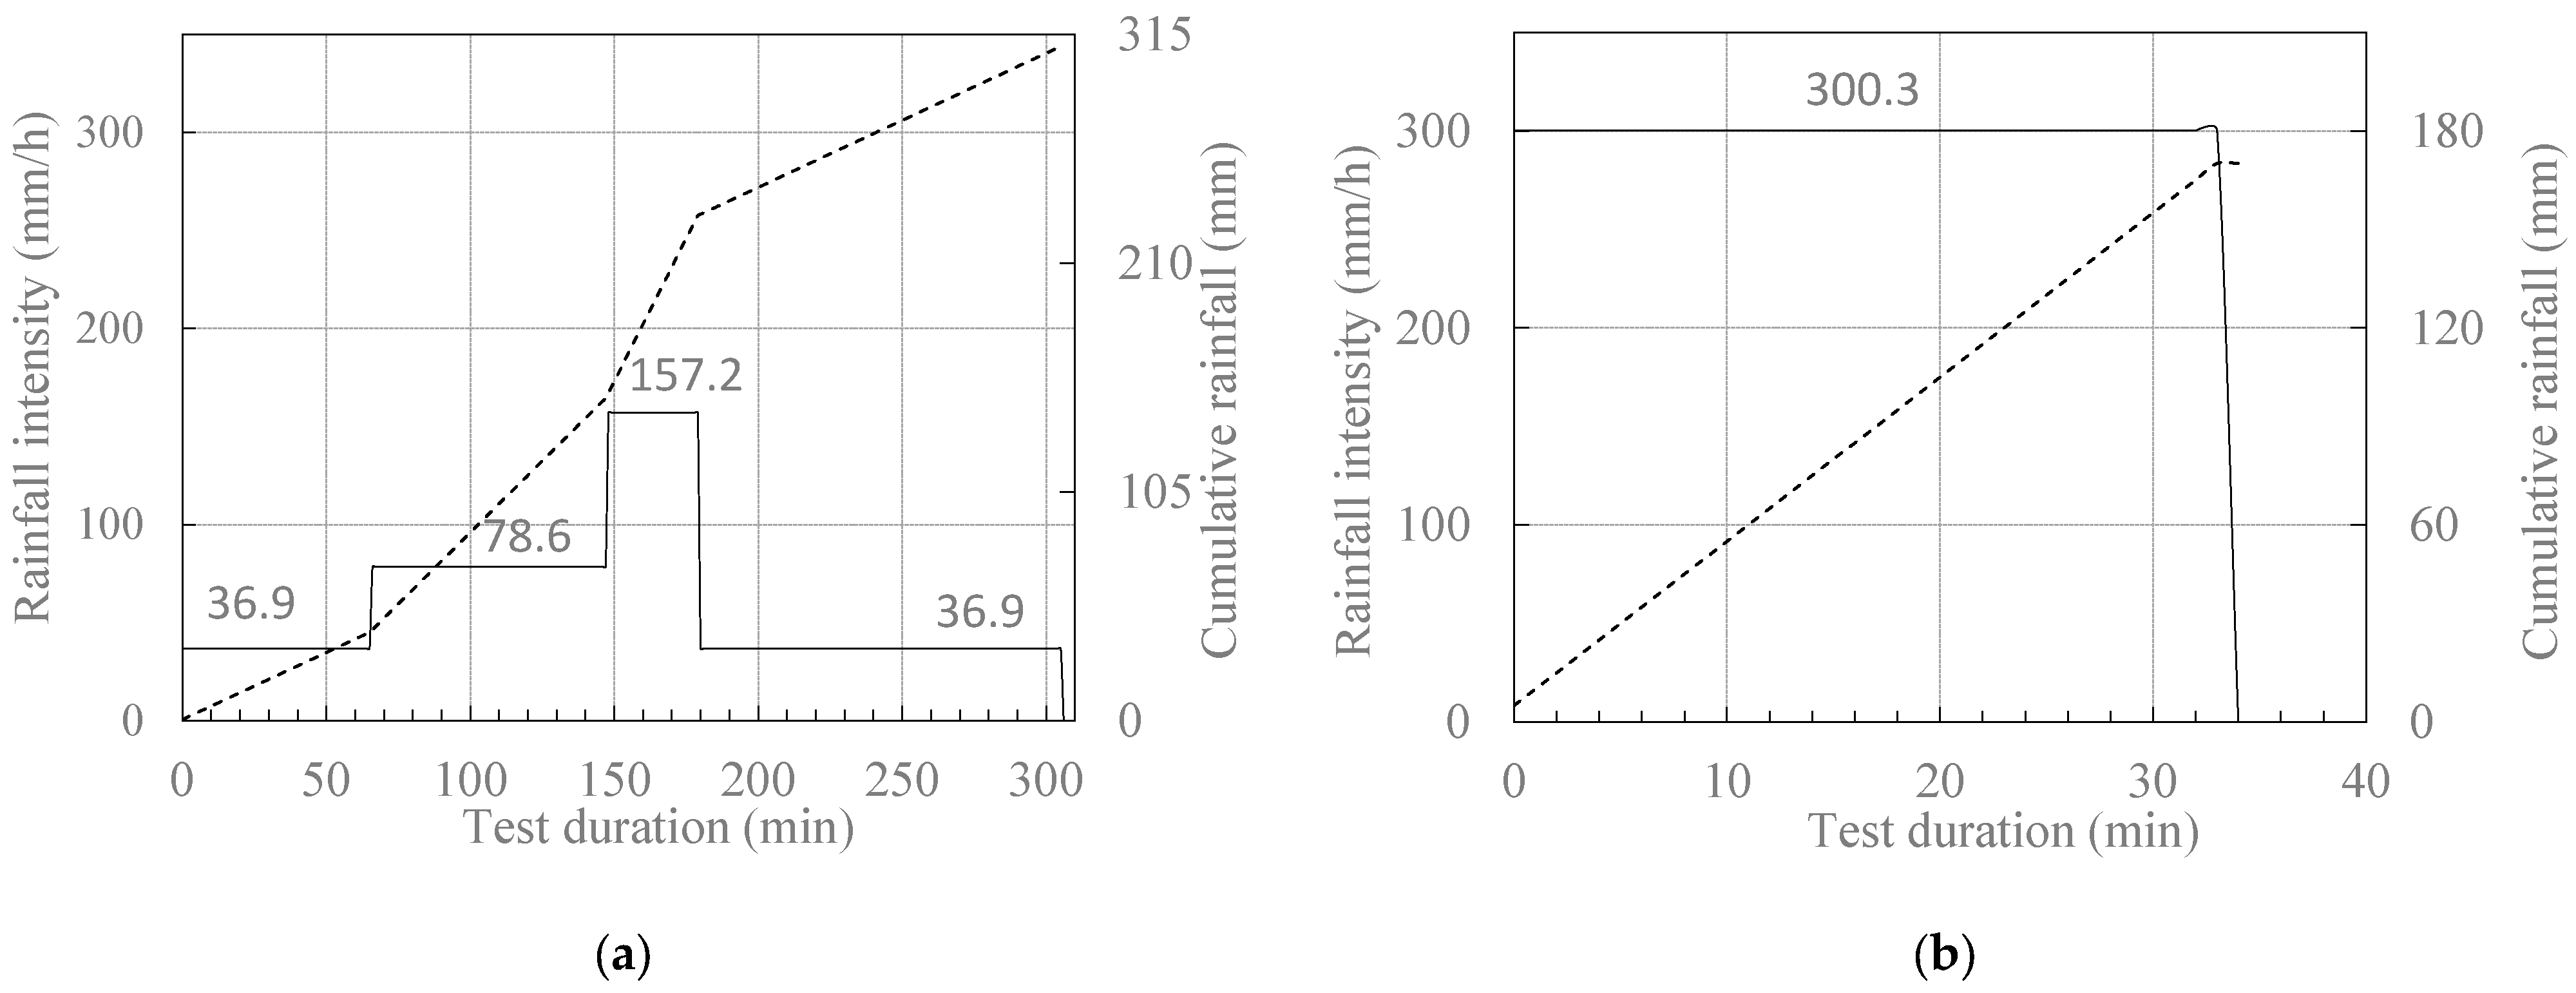
The initial soil moisture distribution and pore water pressure conditions within the slope model were obtained from the data collected by the hydraulic monitoring equipment along the three measurement profiles described previously. The test was started by opening of the sprinkler nozzles on all three sprinkler branches to obtain the predefined rainfall intensity. From this point onwards, the slope model was subjected to a series of increasing and decreasing rainfall intensities. Each rainfall intensity was held constant until the sensors at the monitored points indicated no further changes in pore water pressure or soil moisture, i.e., until steady-state conditions were established. Considering the specific purpose of the study and the fact that the rapid drainage of the sandy slope model was desirable, all drainage valves were kept open to prevent (or delay) groundwater-level rise and consequent build-up of pore water pressure in the model, i.e., to maintain the rainfall infiltration through the model under partially saturated conditions. The rainfall conditions briefly described in the following text can be followed and are summarized in
Figure 6.
Starting from relatively dry, i.e., near residual soil moisture conditions for the soil material under consideration, the first rainfall intensity of 36.9 mm/h was kept constant for 66 min. As no further changes in pore water pressure and volumetric water content were observed, the working pressure and nozzle opening were combined in a way that the rainfall intensity was approximately doubled in the next test phase. The rainfall intensity of 78.6 mm/h was maintained until the 148th minute of the test. Again, steady-state conditions were established under the applied (constant) rainfall conditions, so that the intensity of the simulated rainfall was again approximately doubled to 157.2 mm/h and kept constant until the 180th minute of the test. Finally, the rainfall intensity was reduced to the initial value, i.e., 36.9 mm/h, and kept constant until hydraulic equilibrium was reached at the monitored points. The first stage of the test was declared finished after 306 min, when the rainfall simulation was stopped (
Figure 6a). However, the collection of data from the hydraulic monitoring system continued during the drainage stage of the slope in the following weeks. Finally, an additional, i.e., the second, stage of the test was conducted a few weeks later to test the model’s response to an extremely high rainfall intensity (
Figure 6b). In this case, the rainfall intensity of 300.3 mm/h was maintained for 34 min, when the test was stopped at the first signs of slope failure occurrence.
The particular configuration of rainfall intensities chosen in this study was not based on rainfall conditions that could be considered representative of particular field conditions or the study area. Rather, the idea was that the wide range of rainfall intensities applied would provide data that would hopefully cover as wide a range of the SWCC as possible. On the one hand, the minimum rainfall intensities were intended to provide the data relevant for hydraulic characterization in the area where the SWCC approaches residual soil moisture conditions. On the other hand, in the region of the SWCC where the soil approaches saturated or near-saturated conditions, care was taken to ensure that the applied high rainfall intensities did not cause erosion of the slope material or that no surficial runoff occurred so that all of the applied rainfall infiltrated into the soil and, thus, the boundary conditions were precisely controlled during the experiment.
3. Results and Discussion
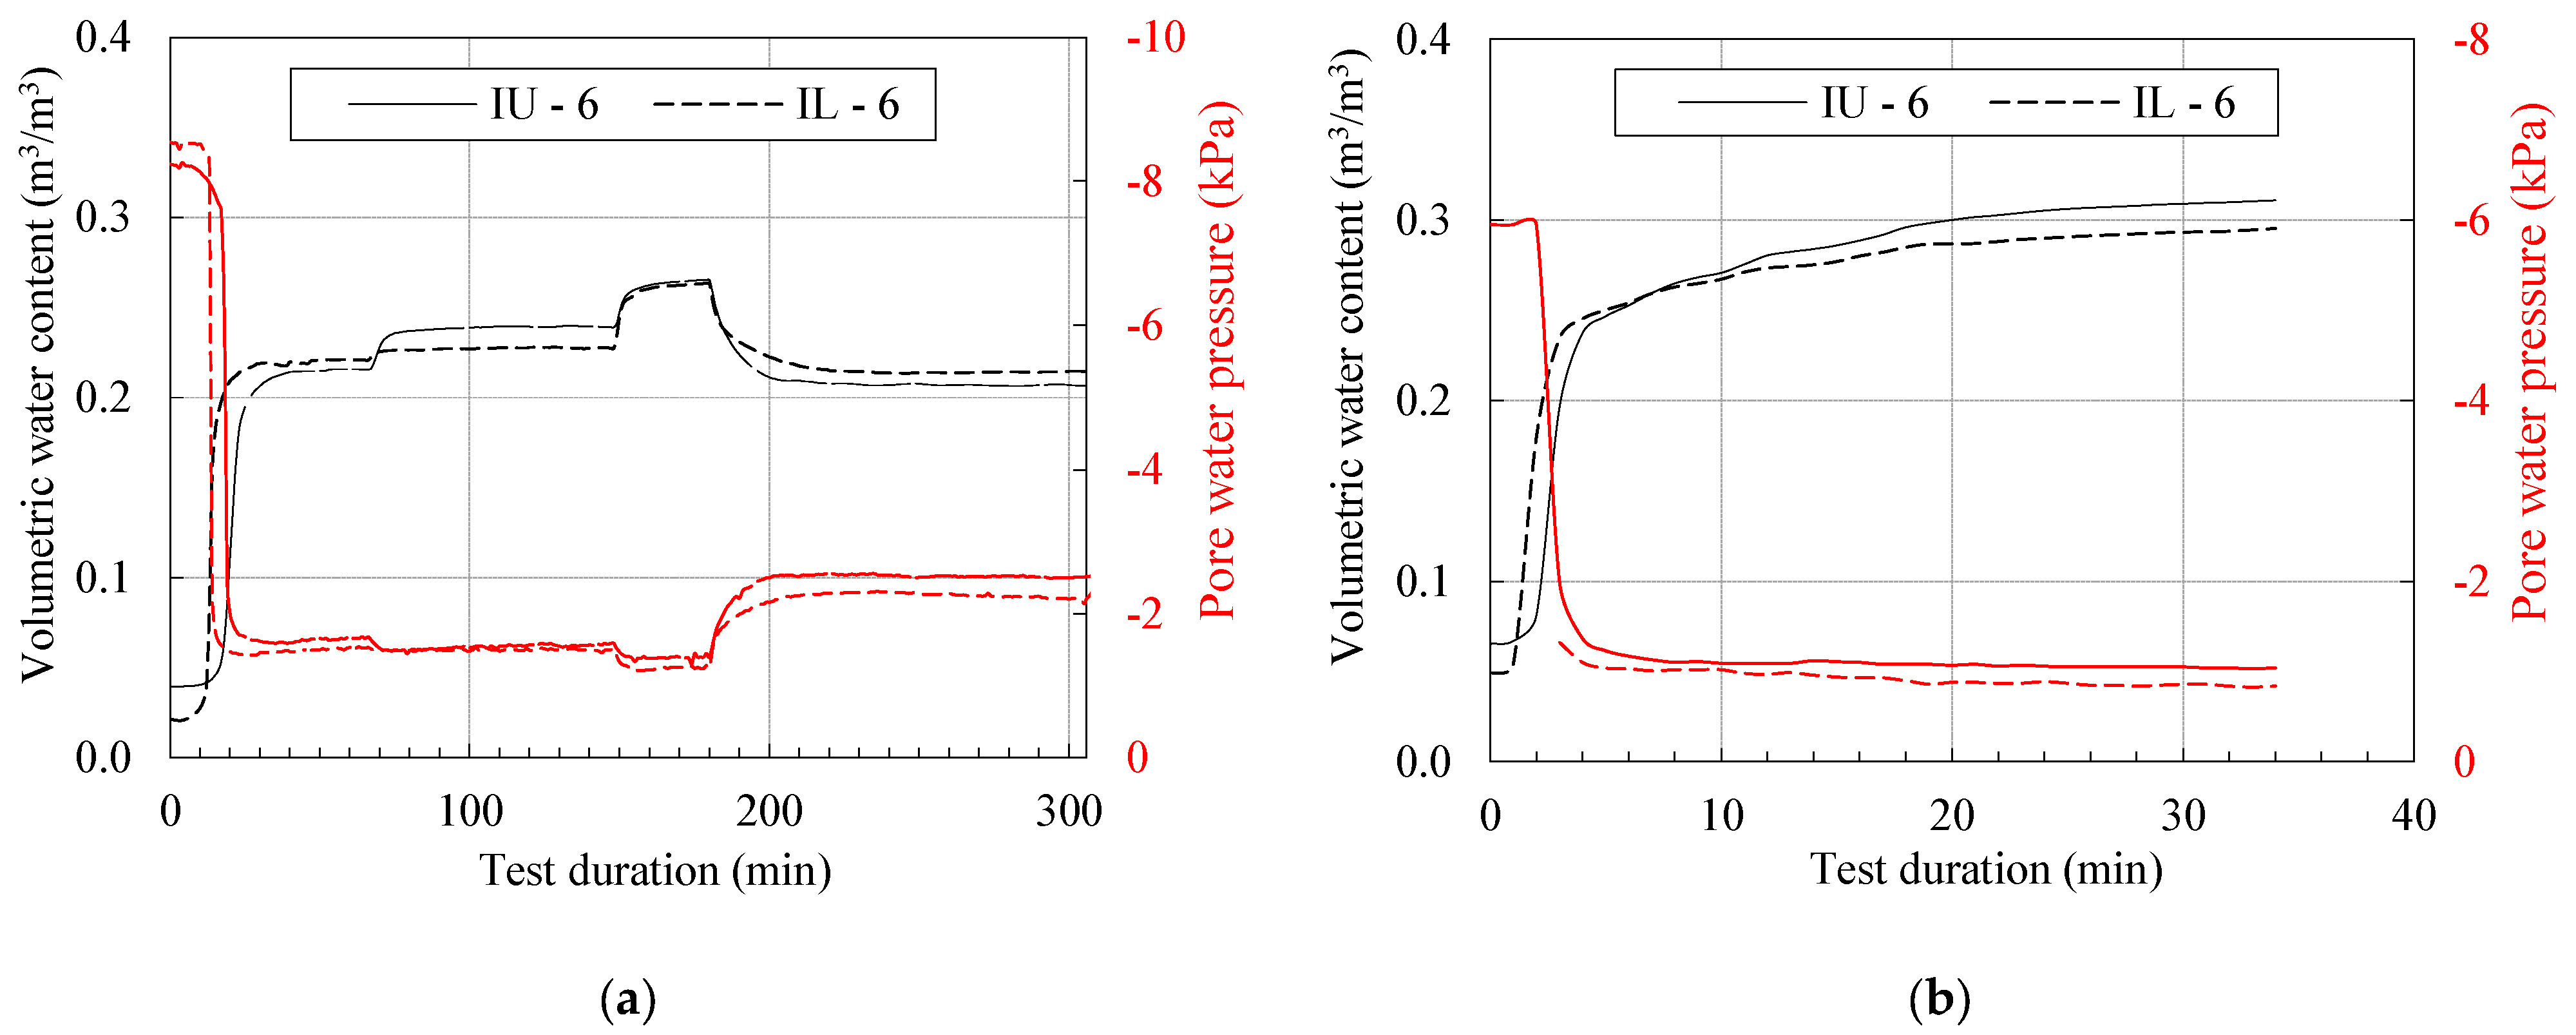
Figure 7 shows the hydraulic response of the slope model in terms of the measured volumetric water content and pore water pressure values (i.e., matric suction in this case) for the I
U-6 and I
L-6 monitored points (locations indicated in
Figure 5). Once the wetting front passed the monitored points and steady-state conditions were reached under constant flux applied at the model surface, relatively uniform conditions of soil moisture and suction prevailed along the entire measurement profile. Thus, only the uppermost measurement points along the inclined part of the slope were considered in the determination of the SWCC in order to simplify the interpretation of the collected data. However, it is worth mentioning that the use of multiple soil moisture sensors (four per measurement profile) would allow the reconstruction of the wetting front advancement and a better analysis of soil moisture conditions in different parts of the model, even if this is not relevant for the present study. The latter could be useful if the test results are used to investigate phenomena or research topics that were not addressed in this study. The obtained results indicated some interesting results that are analyzed and discussed in the following text.
The first observation was made regarding the wetting front advancement after the start of rainfall simulation for the two test stages and the difference in the response when comparing the soil moisture and pore water pressure. After the onset of rainfall, it took just over 10 min in the first test stage for the wetting front to reach the monitored points and for the theta probes and mini-tensiometers to register changes in volumetric water content and soil suction. The measured values of the soil moisture sensors indicated a rather diffuse response in terms of the soil moisture, while the time to reach equilibrium was more than 20 min. On the other hand, the mini-tensiometers pointed to an abrupt drop in soil suction and a much shorter time to obtain constant readings. While the transient soil moisture change extended over more than 15 min, it took only 4 to 6 min to achieve constant soil suction, instead. In any case, from the 40th minute of the test, both monitored points appeared to reach hydraulic equilibrium and constant readings for both soil moisture and soil suction. In the next phase of the test, the increase in soil moisture and pore water pressure seemed to be immediate with the increase in rainfall intensity from 36.9 to 78.6 mm/h, and steady-state conditions were established much faster for both monitored points. A very similar response was observed for the test period around the 148th minute when the rainfall intensity was further increased to 157.2 mm/h. It is interesting to note that despite the increase in rainfall intensity from 37 to 157 mm/h, soil suction remained almost unchanged, with the difference between the steady-state conditions for the two rainfall intensities being less than 0.3 kPa. With the same increase in rainfall intensity, the volumetric water content increased from about 0.22 to 0.26.
While both the soil moisture and soil suction data indicated that the second test stage was initiated with a slightly higher soil moisture content (measured values for
in
Figure 7a,b), the time necessary for the wetting front to reach the monitored points was much shorter than in the first test stage. In this case, the sensors observed changes in soil moisture and soil suction as early as 1 or 2 min after the start of the rainfall initiation. Although not directly related to the aim of the study, this is an interesting observation that indicates the potential usefulness of the experimental setup in studying the influence of the initial soil moisture distribution within the soil profile or, in other words, the influence of the antecedent rainfall conditions on the hydraulic response of a slope to a rainfall event.
Another interesting observation was made in relation to the drying response of the monitored points, which was induced by the reduction in rainfall intensity from the 180th minute of the test. With the reduction in rainfall intensity from 157 to 37 mm/h, the response appeared to be much slower, both in terms of soil moisture and the change in soil suction. Both instrumented points approached equilibrium conditions over the following 20 min or more. In contrast to the equilibrium conditions for volumetric water content, for which the way in which the boundary conditions were imposed appeared to be irrelevant, soil suction was evidently higher for the same rainfall intensity when the steady-state conditions were reached by reducing the rainfall intensity rather than increasing it.
The data from the second stage of the test provided an interesting insight into the hydraulic response of the soil when exposed to the extremely high rainfall intensity of 300 mm/h. After allowing the slope model to drain freely for an extended period, the second stage of the test began with relatively dry conditions, although the soil suction value appeared to be slightly lower than in the previous case, as discussed earlier. Again, similar considerations could be made regarding the diffuse nature of the changes in soil moisture and the abrupt changes in soil suction as before, although it is unclear whether the equilibrium volumetric water content conditions were reached by the end of the test, as it appeared to increase slowly but steadily even after the 20th minute of the rainfall application. However, an important observation was that even with a rainfall intensity of 300 mm/h, the negative pore water pressure, i.e., soil suction, was still maintained at the monitored points.
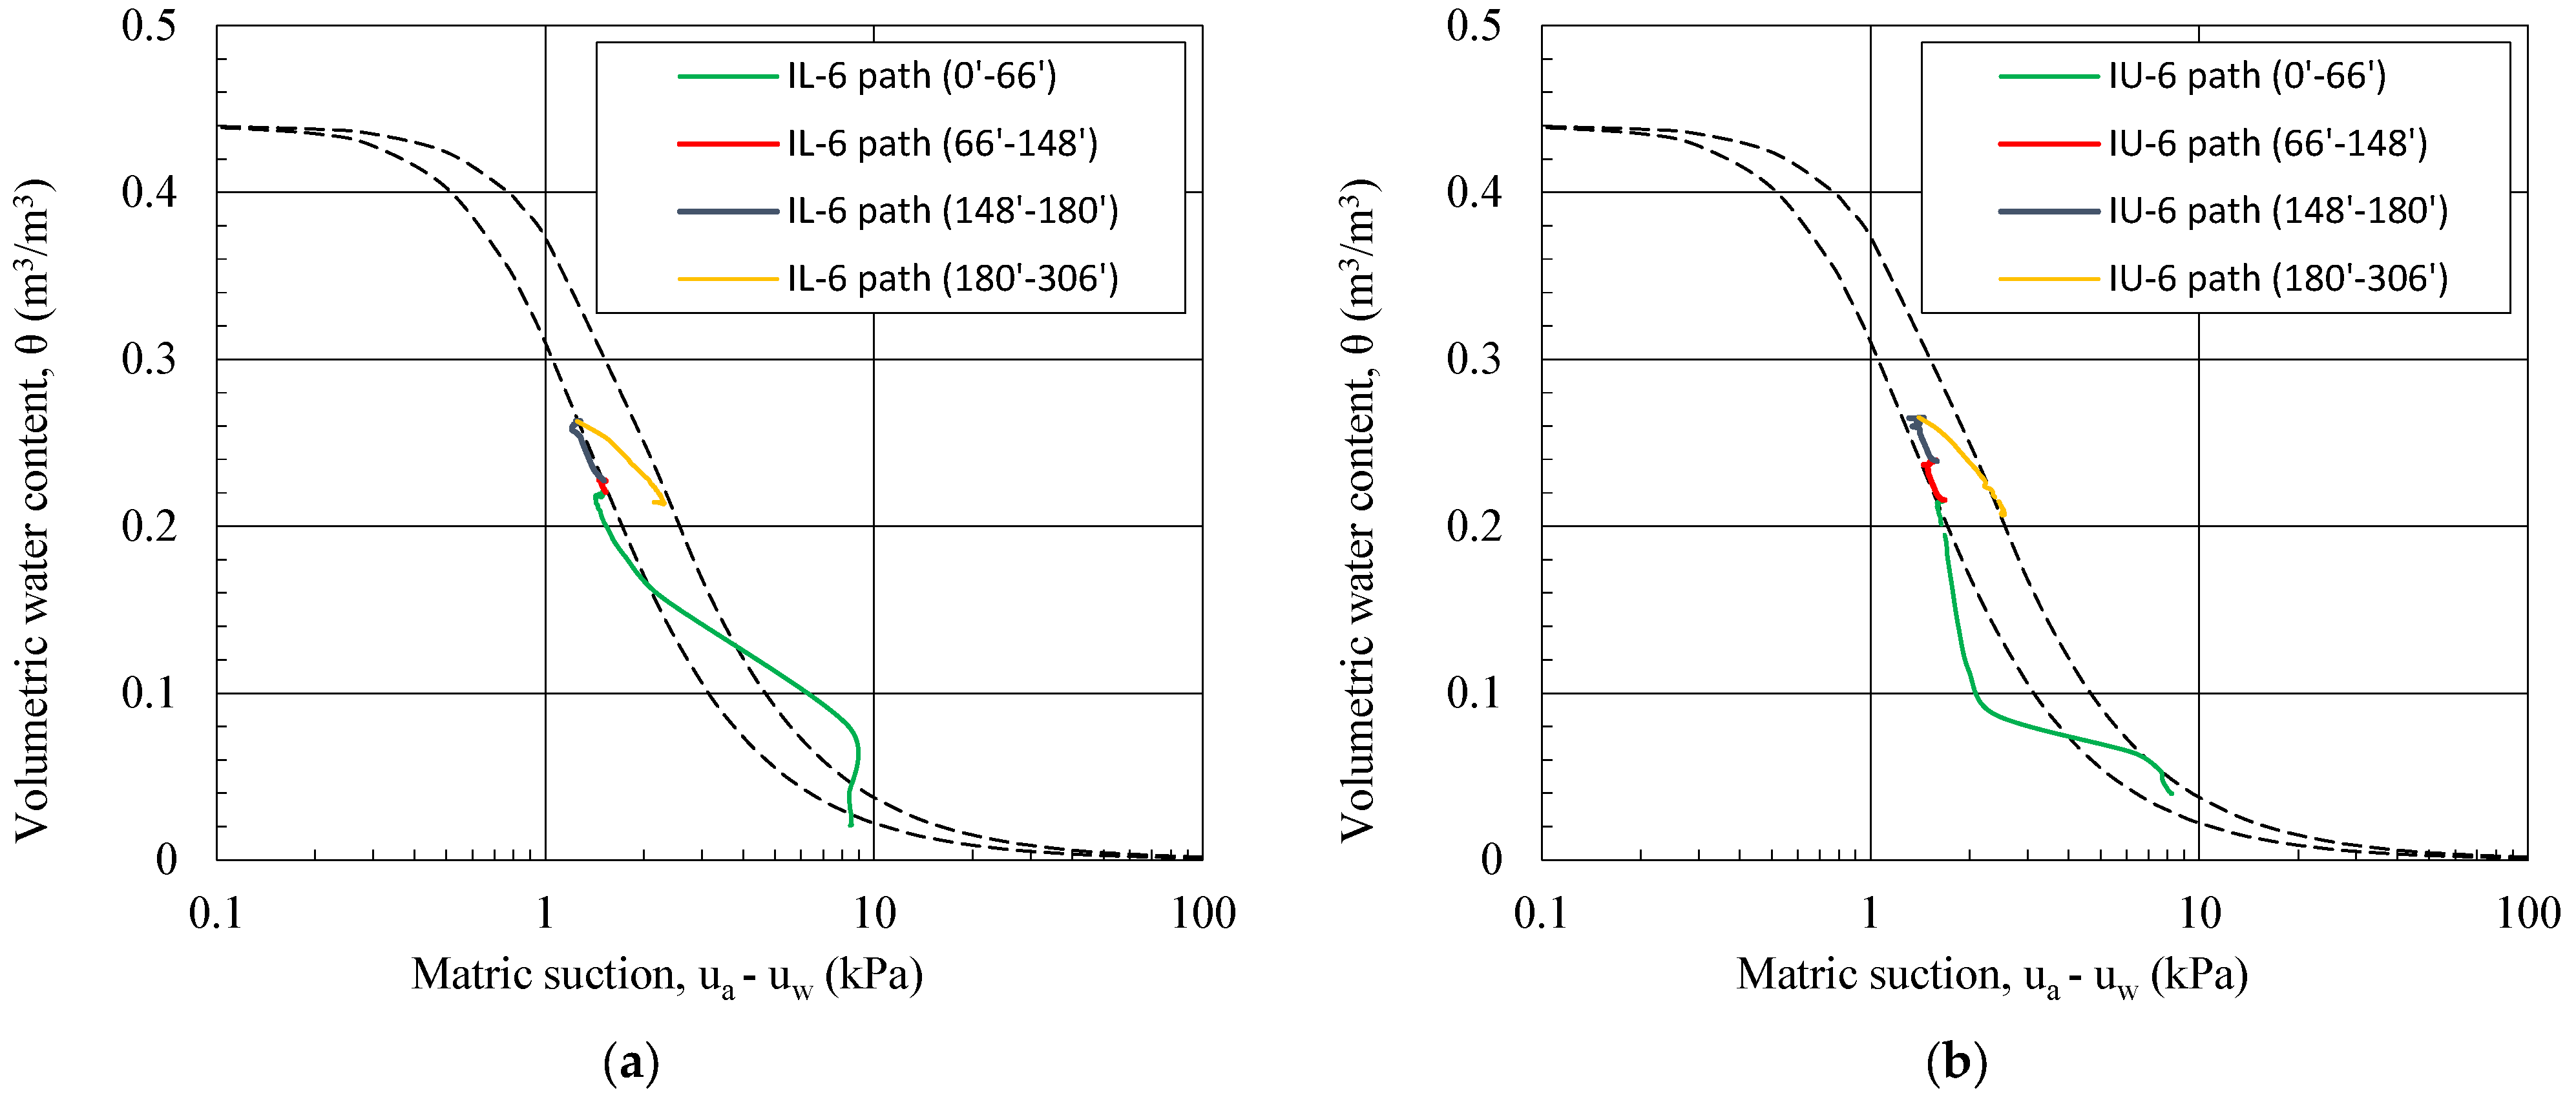
All steady-state pairs of volumetric water content and soil suction determined for different rainfall intensities are presented in
Figure 8, where the soil suction values are provided in logarithmic form—a plane typically used to represent SWCCs. The same figure shows the drying and wetting branches of SWCC obtained by fitting the model parameters of van Genuchten [
33] to experimentally determined data. The best-fit model parameters of the equation shown below were obtained by nonlinear regression, assuming that the saturated volumetric water content was equal to the porosity of the soil. It was confirmed that the target initial porosity of 0.44 was met very closely for all three measurement profiles after the test (the measured values ranged from 0.43 to 0.45). The SWCC equation read:
where
and
represent the saturated and residual volumetric water content, while
,
, and
are the SWCC parameters related to the air-entry value and the slope of the transition zone, respectively. As suggested by van Genuchten [
33],
was set to be
. The best-fit parameters’ values of the SWCC drying and wetting are listed in
Table 2.
Using continuous 1 min measurements of soil moisture and soil suction at the monitored points, the hydraulic paths that were followed during the first stage of the test, together with the obtained SWCC branches, are shown in
Figure 9. The results indicated a rather complex hydraulic response in the SWCC plane, with the hydraulic paths following or going beyond the ranges defined by the drying and wetting curves. Interestingly, the initial responses for both monitored points appeared to fall outside of the SWCC area in the early stage of the test. Once steady-state conditions were established under the initial rainfall intensity of 37 mm/h, the hydraulic response closely followed the wetting branch of the SWCC when the rainfall intensity was monotonically increased during the test. As the rainfall intensity was decreased, a complex hydraulic response was recorded, in which the hydraulic paths exhibited a short transition zone and then approached the drying branch of the SWCC. While a detailed discussion of the possible causes for such response, as well as the issue of hydraulic hysteresis, is beyond the scope of this paper, it is worth noting that these preliminary results suggest another possible application of the applied approach, namely, the investigation of the hydraulic hysteresis phenomenon and the effects of different rainfall patterns and rainfall conditions on the hydraulic response of soil and slope models. As soil moisture and pore water pressure (in this case, matric suction) influenced the effective stresses and the available shear strength of the soil, they could also be a useful tool to investigate how different rainfall conditions affect the stability of slopes in general.
4. Conclusions
In this study, some preliminary results and experiences were presented on the possible use of physical slope models to determine the SWCC of the uniformly graded sand. This study involved a 35-degree inclined slope of 30 cm thickness, equipped with soil moisture (theta probes) and pore water pressure (mini tensiometers) sensors and subjected to various simulated rainfall conditions. While the results obtained suggest that the approach could be useful to study different aspects of the hydraulic response of slopes exposed to rainfall, the experiences and observations made during the experimental work also highlighted possible improvements and questions to be addressed in the future research activities. For example, regarding the data obtained for the type of soil used, i.e., a relatively permeable, uniformly graded sand, the application of an even wider range of rainfall intensities would be desirable, as this would allow the determination of steady-state conditions under a wider range of soil moisture and suction values. Furthermore, the study considered a soil that undergoes negligible volumetric deformation in response to changes in soil moisture (i.e., soil suction). If the approach is to be generalized and applied to fine-grained types of soil, where hydromechanical coupling would be required to obtain an adequate hydraulic characterization, the method should also take into account the volumetric deformations occurring at different stages of the test. Additional considerations need to be made to distinguish between the different possible SWCCs that the approach could yield, depending on initial soil moisture conditions or hydraulic conditions to which a soil is generally exposed during the test. In general, the drying and wetting branches of SWCC defined by the approach considered in this study are those relevant to the physical model test itself. Therefore, the approach could be particularly useful for similar studies where downscaled slope model tests are used to investigate various rainfall infiltration-related phenomena, e.g., landslides.
These preliminary results suggested that the physical slope model tests could be useful not only for the hydraulic characterization of a soil, but also for the investigation of a number of phenomena related to rainfall-induced landslides, such as an influence of antecedent rainfall, different rainfall patterns, and the effects of hydraulic hysteresis on the stability of slopes exposed to rainfall. In this study, a uniformly graded sand with a relatively steep SWCC was investigated, where the saturated and residual conditions were separated by a few kPa of soil suction. Although the differences in the soil suction values and the soil moisture were in a relatively narrow range, they were not negligible when the confining pressure was low, as it is in the 1 g small-scale slope models considered in this study or in shallow landslides occurring on man-made or natural slopes.
Rainfall to which slopes are exposed in the field is much more complex and exhibits strong temporal and spatial variations [
17]. The aforementioned aspects, as well as possible differences between the hydraulic characterizations obtained with the proposed method and the conventional laboratory measurements typically performed with devices that implement the axis-translation technique to measure or control the soil suction, as well as how the angle of inclination may affect the hydromechanical conditions of the soil slope, are some of the aspects that should be further investigated by rainfall-induced landslides to improve the understanding and modeling capabilities and to mitigate the hazards posed.
