1. Introduction
As a renewable and clean energy source, hydropower occupies a very important position in the energy structure of every country because of its huge developed potential and obvious advantages, such as predictability and high energy density [
1,
2]. As the main equipment for developing hydropower resources, designing new hydro turbines or optimizing traditional hydro turbines is one of the research directions that scholars have been interested in to broaden the source of hydropower and improve energy efficiency.
As one kind of traditional hydro turbine, the Francis turbine is composed of a runner, volute, guide vanes, and draft tube. This kind of hydro turbine is widely used in various types of hydroelectric power generation platforms because of its compact structure, wide water head range, and the ability to maintain high efficiency under both design and off-design conditions [
3,
4,
5,
6]. The volute is one of the diversion components of Francis turbines, and its main functions are to divert the water flow uniformly into the downstream component and to enable the water to flow with a certain velocity moment. The flow inside the volute is three-dimensional, with complex viscous vortices, which tend to produce large energy losses inside the volute. In addition, the functions of the volute determine that it has a certain influence on the operation of downstream components, and this influence is more obvious in the hydro turbine without guide vanes. A study indicates that different volute designs have a certain impact on the efficiency of centrifugal hydraulic turbines [
7]. Therefore, it is necessary to optimize the volute for improving the hydro turbine performance.
With the rapid development of computational fluid dynamics (CFD), the optimization study of volutes using CFD has been widely adopted. Wang et al. [
8] investigated the effects of volute sectional shape (symmetrical circular, asymmetrical circular, and symmetrical pear-shaped) on the centrifugal turbine performance through CFD simulations. In the research process, it was found that different sectional shapes have significant effects on the streamlined distribution of the volute axial section. Yang et al. [
9] analyzed the effects of different aspect ratio distribution regimes for the same sectional shape on the turbocharger turbine performance under pulsating flow conditions through experiments and CFD simulations. Bian et al. [
10] optimized the geometric parameters (global spread angle, corner radius factor, outlet size factor) of a trapezoid section volute using the Bayesian optimization algorithm through CFD simulations, which resulted in a significant improvement of the flow loss inside the volute and the flow distortion at the volute outlet. Furthermore, the outlet size factor was found to be the most influential of the three optimization factors on the optimization objective. Similarly, Yuan et al. [
11] investigated the effects of outlet width, outlet radius, and sectional angle of a pear-shaped section volute on the internal energy loss and outlet airflow angle of the volute.
In addition, scholars have also conducted optimization studies on the sectional size, design method, and tongue. Shrestha et al. [
12] optimized the section radius of a circular section volute for improving the flow uniformity and head loss inside the volute. Baloni et al. [
13] pointed out that the flow inside the volute designed by the constant mean velocity method is more uniform. Morabito et al. [
14] optimized the volute tongue for pumps running in turbine mode with CFD simulations to improve the maximum efficiency by 3.9%. The above analysis shows that the use of CFD for conducting volute optimization is feasible and that volute optimization can improve equipment performance. However, there are few studies on the systematic study of volute optimization for Francis turbines.
In our previous work, a Francis turbine without guide vanes was designed to control water pressure inside the pipeline and recover excess water energy in the water supply system (WSS) of high-rise buildings. The basic hydraulic parameters of this hydro turbine were determined as a design water head of 30 m (net head) and a design flow rate of 10 m3/h. In this study, the optimization study of the volute through CFD simulations was systematically conducted for improving the hydro turbine performance to recover more water energy within a proper water head. In Step 1, an initial volute was designed based on the equal mean velocity method. In Step 2, the effects of the volute sectional shape on the Francis turbine performance were studied. In Step 3, the effects of the volute design method on the Francis turbine performance were investigated. In Step 4, the optimization study of the outlet width, inlet diameter, and inlet height for the volute was conducted through the orthogonal design of experiments. In Step 5, the optimization study of the tilt angle and stretch length for the volute tongue was conducted.
2. Theoretical Design Methods and Research Content
2.1. Theoretical Design Methods of the Volute
The theoretical design of the volute is to design the molded line of the volute based on an assumed flow behavior inside the volute. In the design process, the fluid inside the volute is assumed to be an incompressible ideal fluid. The fluid flows freely without friction and enters the downstream component uniformly along the circumferential direction. Common theoretical design methods of the volute are the method based on the assumption of equal mean velocity and the method based on the assumption of equal velocity moment, which are widely used in the design of the volute in various turbomachinery [
15,
16].
- (1)
Equal mean velocity method
In this method, the design of the volute is conducted based on the assumption that the circumferential component
of the mean velocity on each volute section is constant.
The molded line of the volute designed by this method is an Archimedean spiral, and the main design steps of the equal mean velocity method for a circular section volute are as follows.
Step 1, according to the assumption that the fluid inside the volute enters the downstream component uniformly along the circumferential direction, the flow rate
(m
3/h) through the section of the volute can be calculated as follows,
where
is the angle between the volute end and the section (°), and
is the total flow rate into the hydro turbine (m
3/h).
Step 2, according to
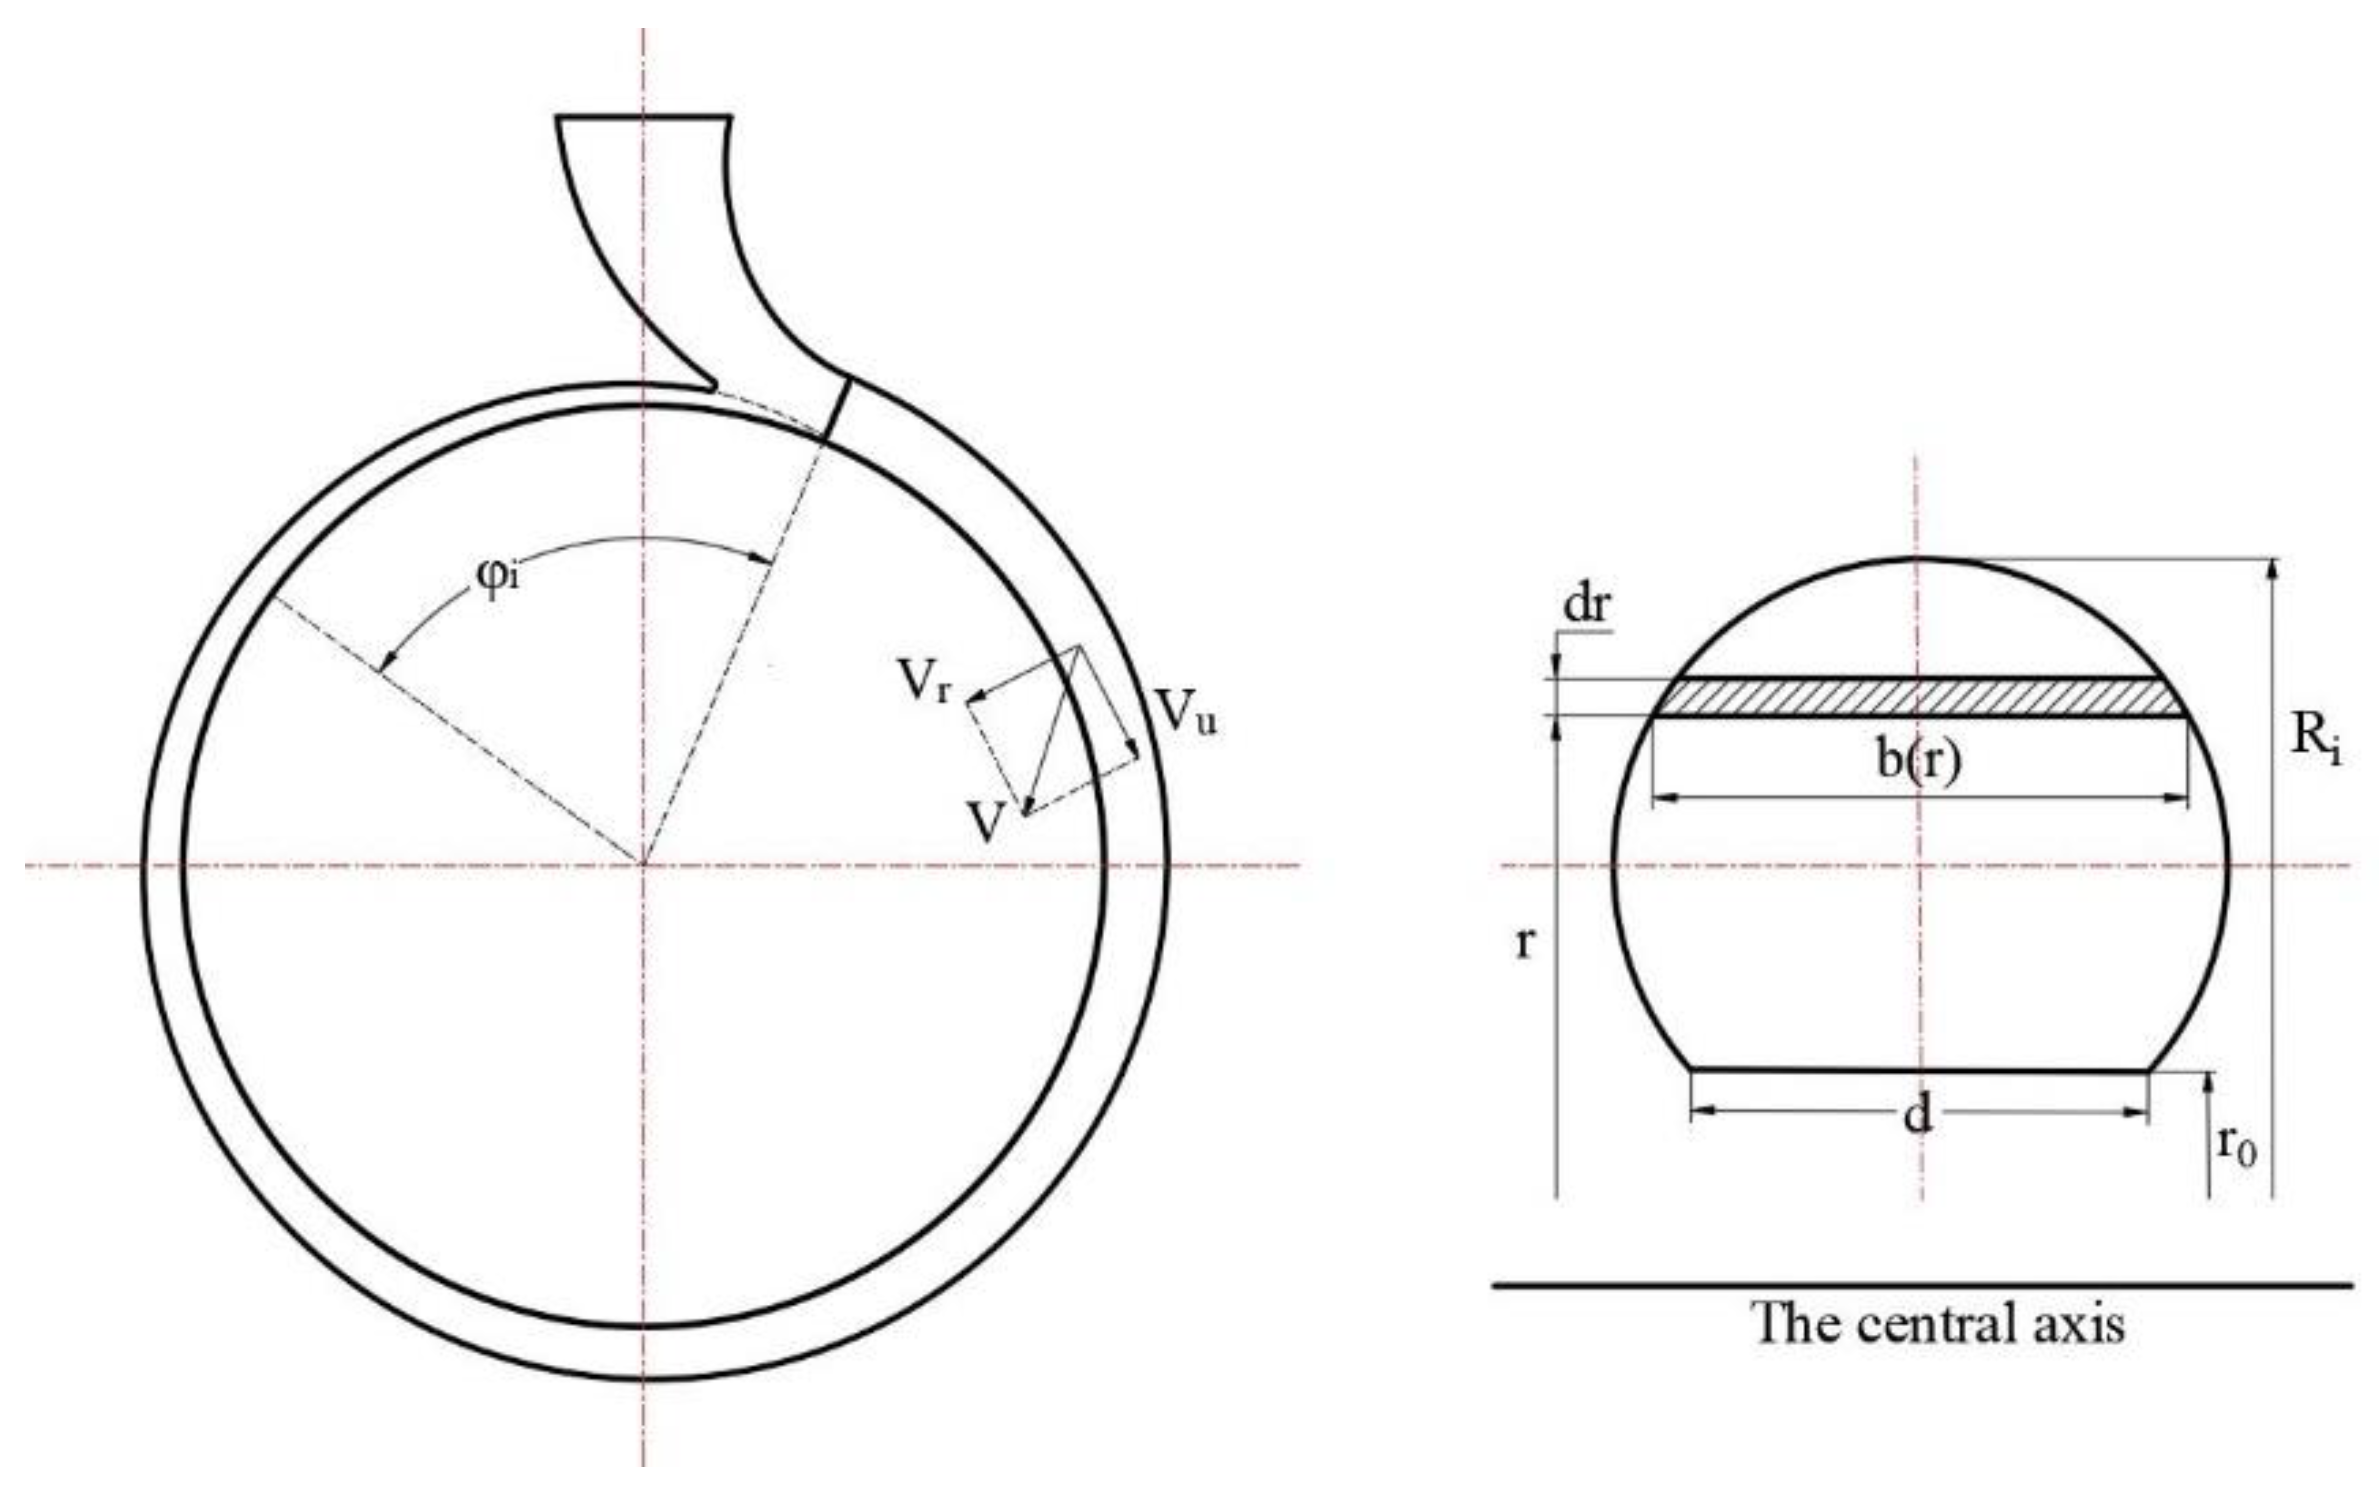
Figure 1,
can also be calculated as follows,
where
is the length of a micro area (m),
is the outer radius of the section (m), and
is the outlet radius of the volute (m).
Step 3, combining Equations (2) and (3), yields the following relationship:
Based on Equation (4), the molded line of the volute can be obtained after determining the volute section shape. In addition, the outlet width
(m) and
are known quantities in the calculation process.
can be determined by referring to the method provided in the relevant material [
16].
- (2)
Equal velocity moment method
In this method, it is assumed that the fluid makes axisymmetric potential flow inside the volute and that the fluid velocity moment is constant [
17].
The molded line of the volute designed by this method is a logarithmic spiral, and the main design steps of the equal velocity moment method for a circular section volute are as follows.
Step 1, bring Equation (5) into Equation (3),
where
is the distance from a micro area to the central axis (m).
Step 2, combining Equations (2) and (6) yields the following relationship:
Based on Equation (7), the molded line of the volute can be obtained after determining the volute section shape. In addition,
can be determined using the boundary conditions of the volute inlet section [
16].
2.2. Research Content
In the design process of the volute, it is very important to determine the optimal distribution of
along the circumferential direction, which can have a significant influence on the turbine performance [
9]. The
is the ratio of volute sectional area and its centroid distance to the rotational center, and different sectional shapes, different design methods, and different outlet widths of the same sectional shape affect its distribution. Therefore, the sectional shape, design method, and outlet width should be optimized. In addition, optimization of the volute inlet parameters and tongue was also conducted in this study to further improve the hydro turbine performance.
2.2.1. Sectional Shapes and Design Methods of the Volute
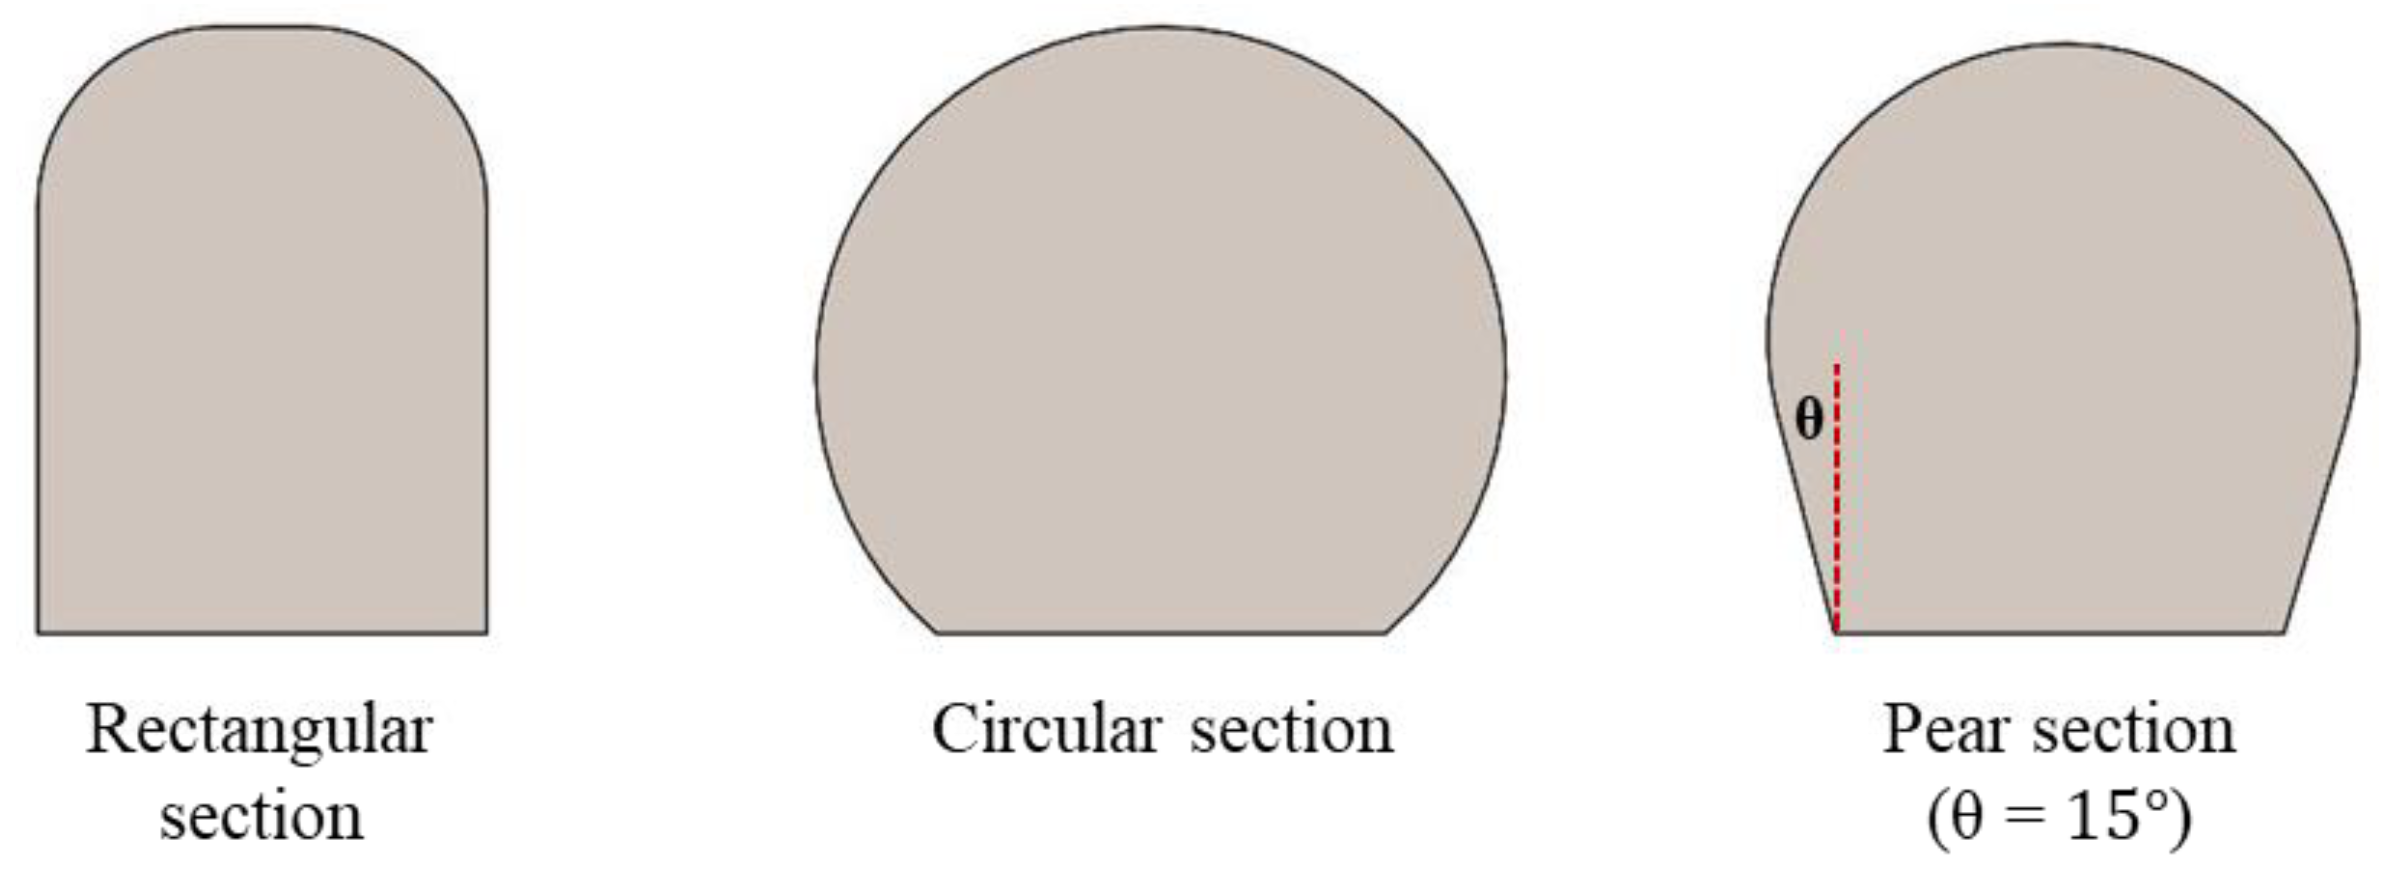
In order to investigate the effects of the volute sectional shapes on the turbine performance, several commonly used volute sectional shapes (rectangular, round, and pear, as shown in
Figure 2) were adopted in this work. In the design process of the volute, the equal mean velocity method was used to avoid the influence of different sectional areas on the results.
Based on the optimization results of the sectional shape, the effects of different volute design methods on the hydro turbine performance were investigated. In this study, three design methods for the volute were adopted, including the two typical design methods presented in
Section 2.1 and a custom design method that makes the
change linearly along the circumferential direction.
2.2.2. The Orthogonal Design of Experiments
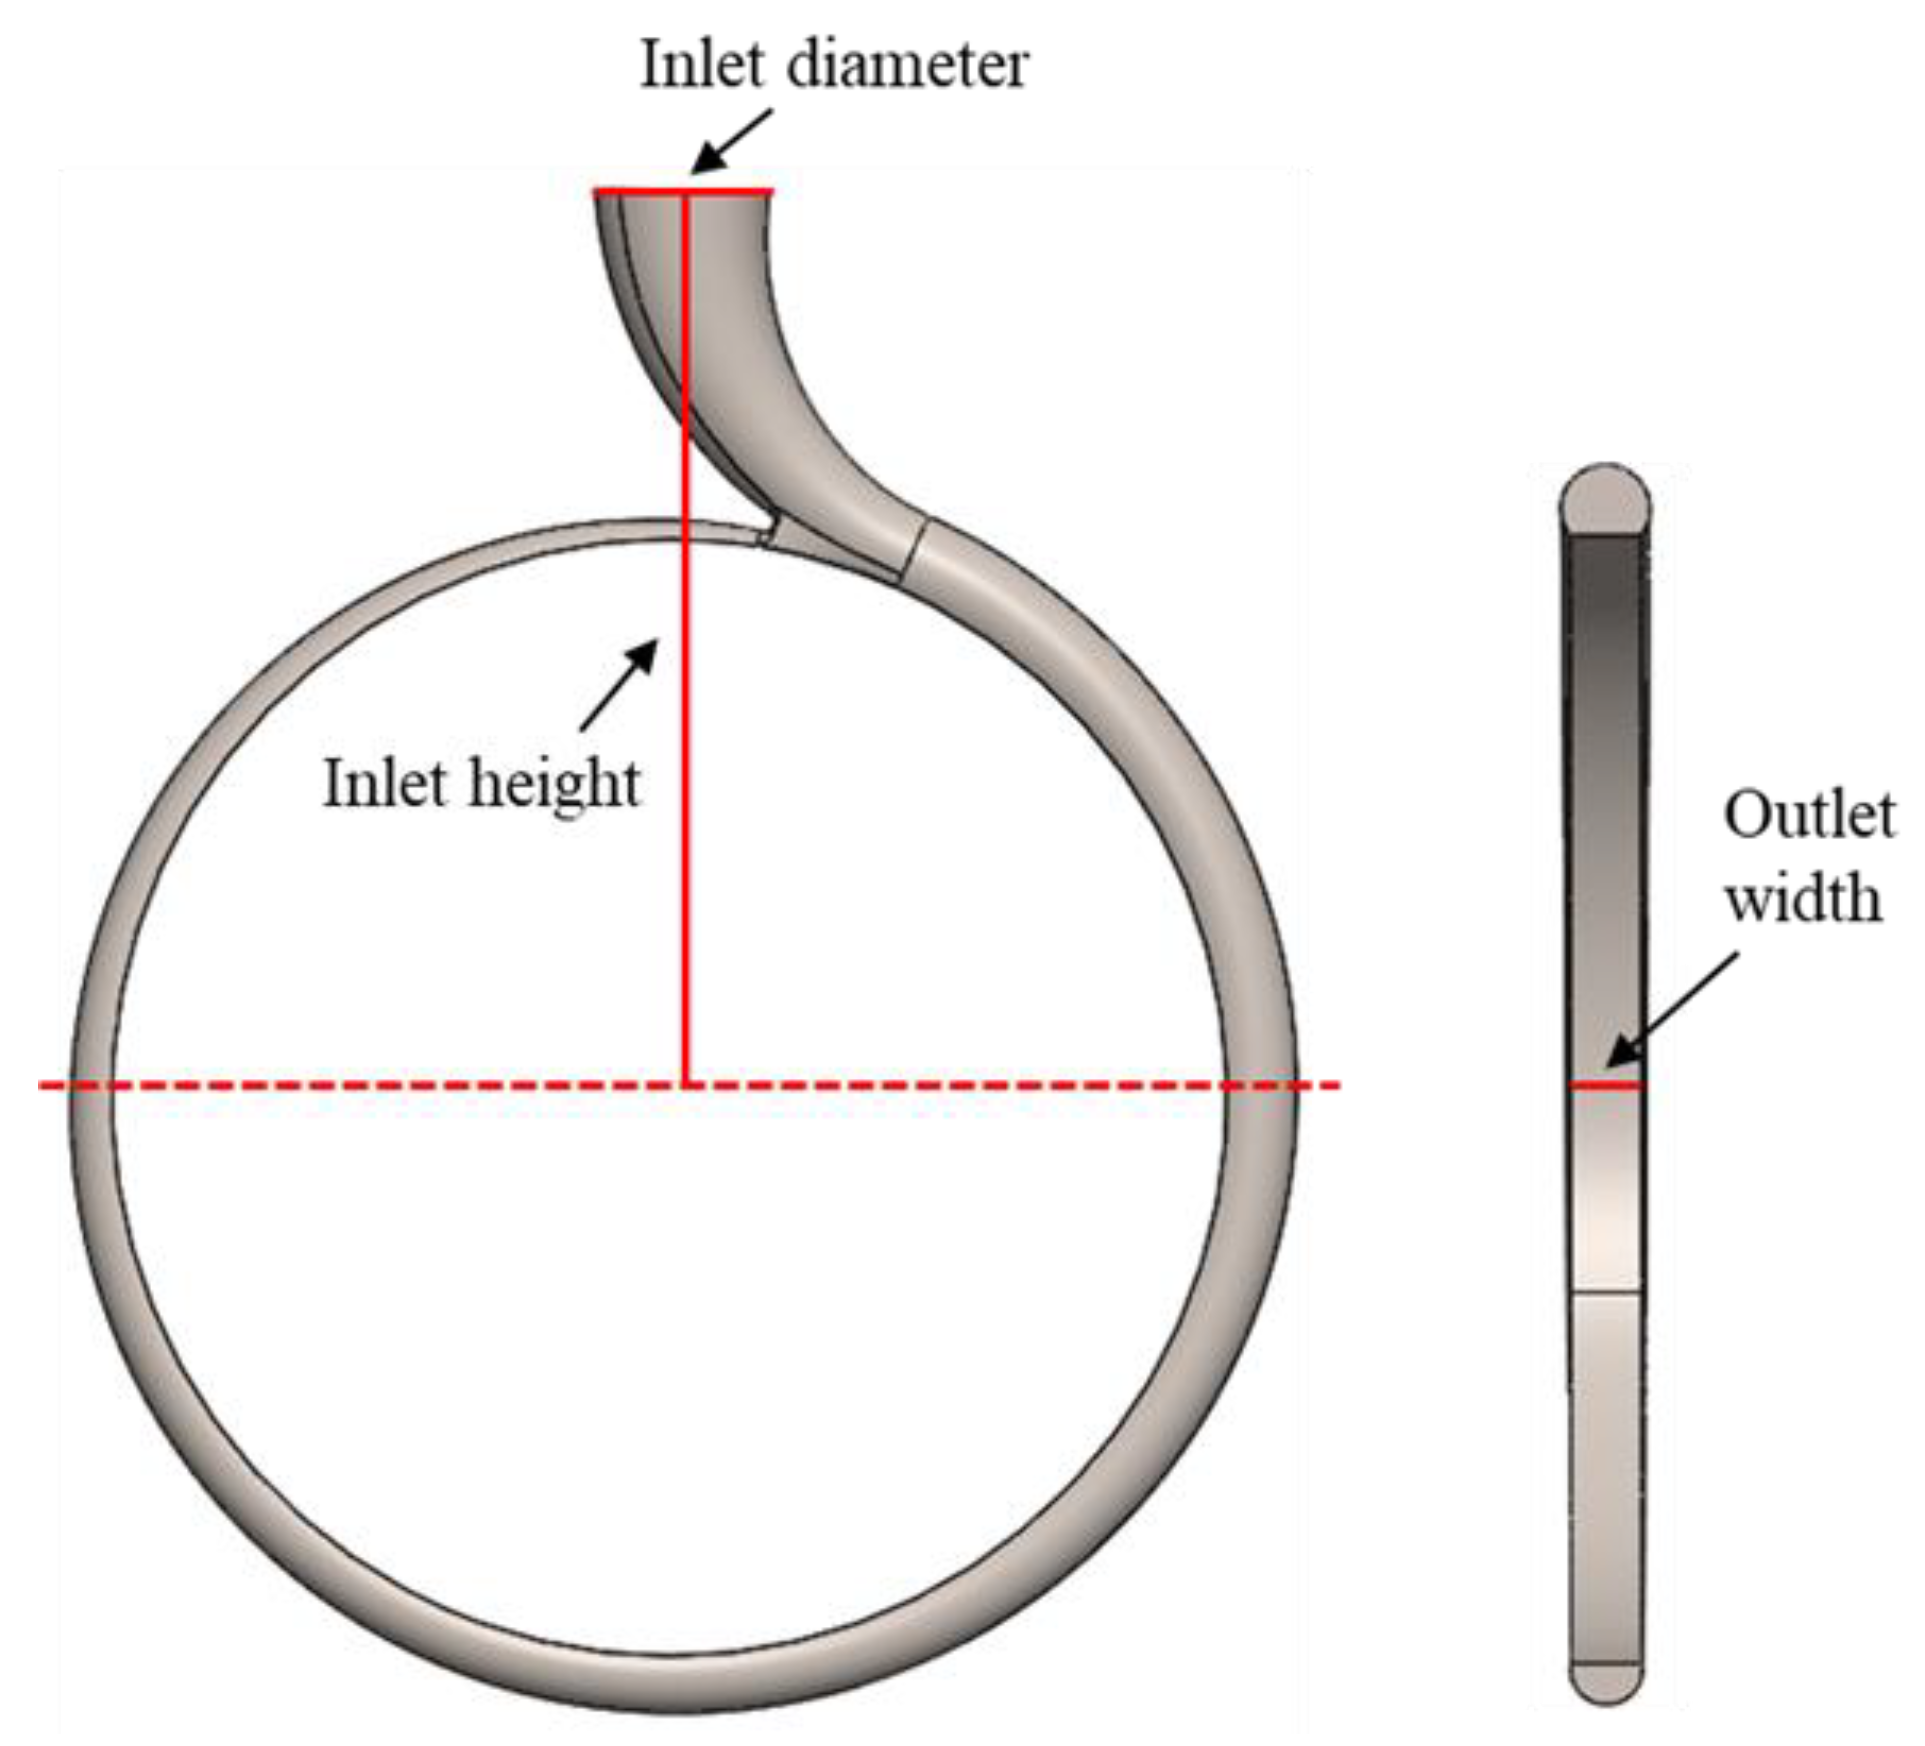
The orthogonal design of experiments is a scientific method that makes sufficient use of standardized orthogonal tables to schedule multi-factor and multi-level experiments and analyze the test results, resulting in a decrease in experiment times and the rapid discovery of optimal schemes. In this work, the effects of the volute inlet parameters as well as the outlet width on the Francis turbine performance were investigated by the orthogonal design of experiments. Three optimization factors are presented in
Figure 3: outlet width (A), inlet diameter (B), and inlet height (C). Each factor was divided into four levels according to its characteristics. The different levels of the volute outlet width were chosen to be between 1.25 and 2 times the runner inlet width [
18]. The orthogonal table
was selected, and the values taken for different levels of different factors are presented in
Table 1.
2.2.3. The Optimization of the Volute Tongue
The tongue is an important area that connects the volute to the runner. A study indicates that the tongue interferes with the movement of water flow, causing significant flow distortion in some areas of the volute outlet, which affects the equipment performance [
14]. Therefore, it is necessary to conduct an optimization study of the volute tongue. The design parameters of the tongue mainly include the position angle and the shape parameters. For the shape parameters of the tongue, Alemi [
19] and Morabito [
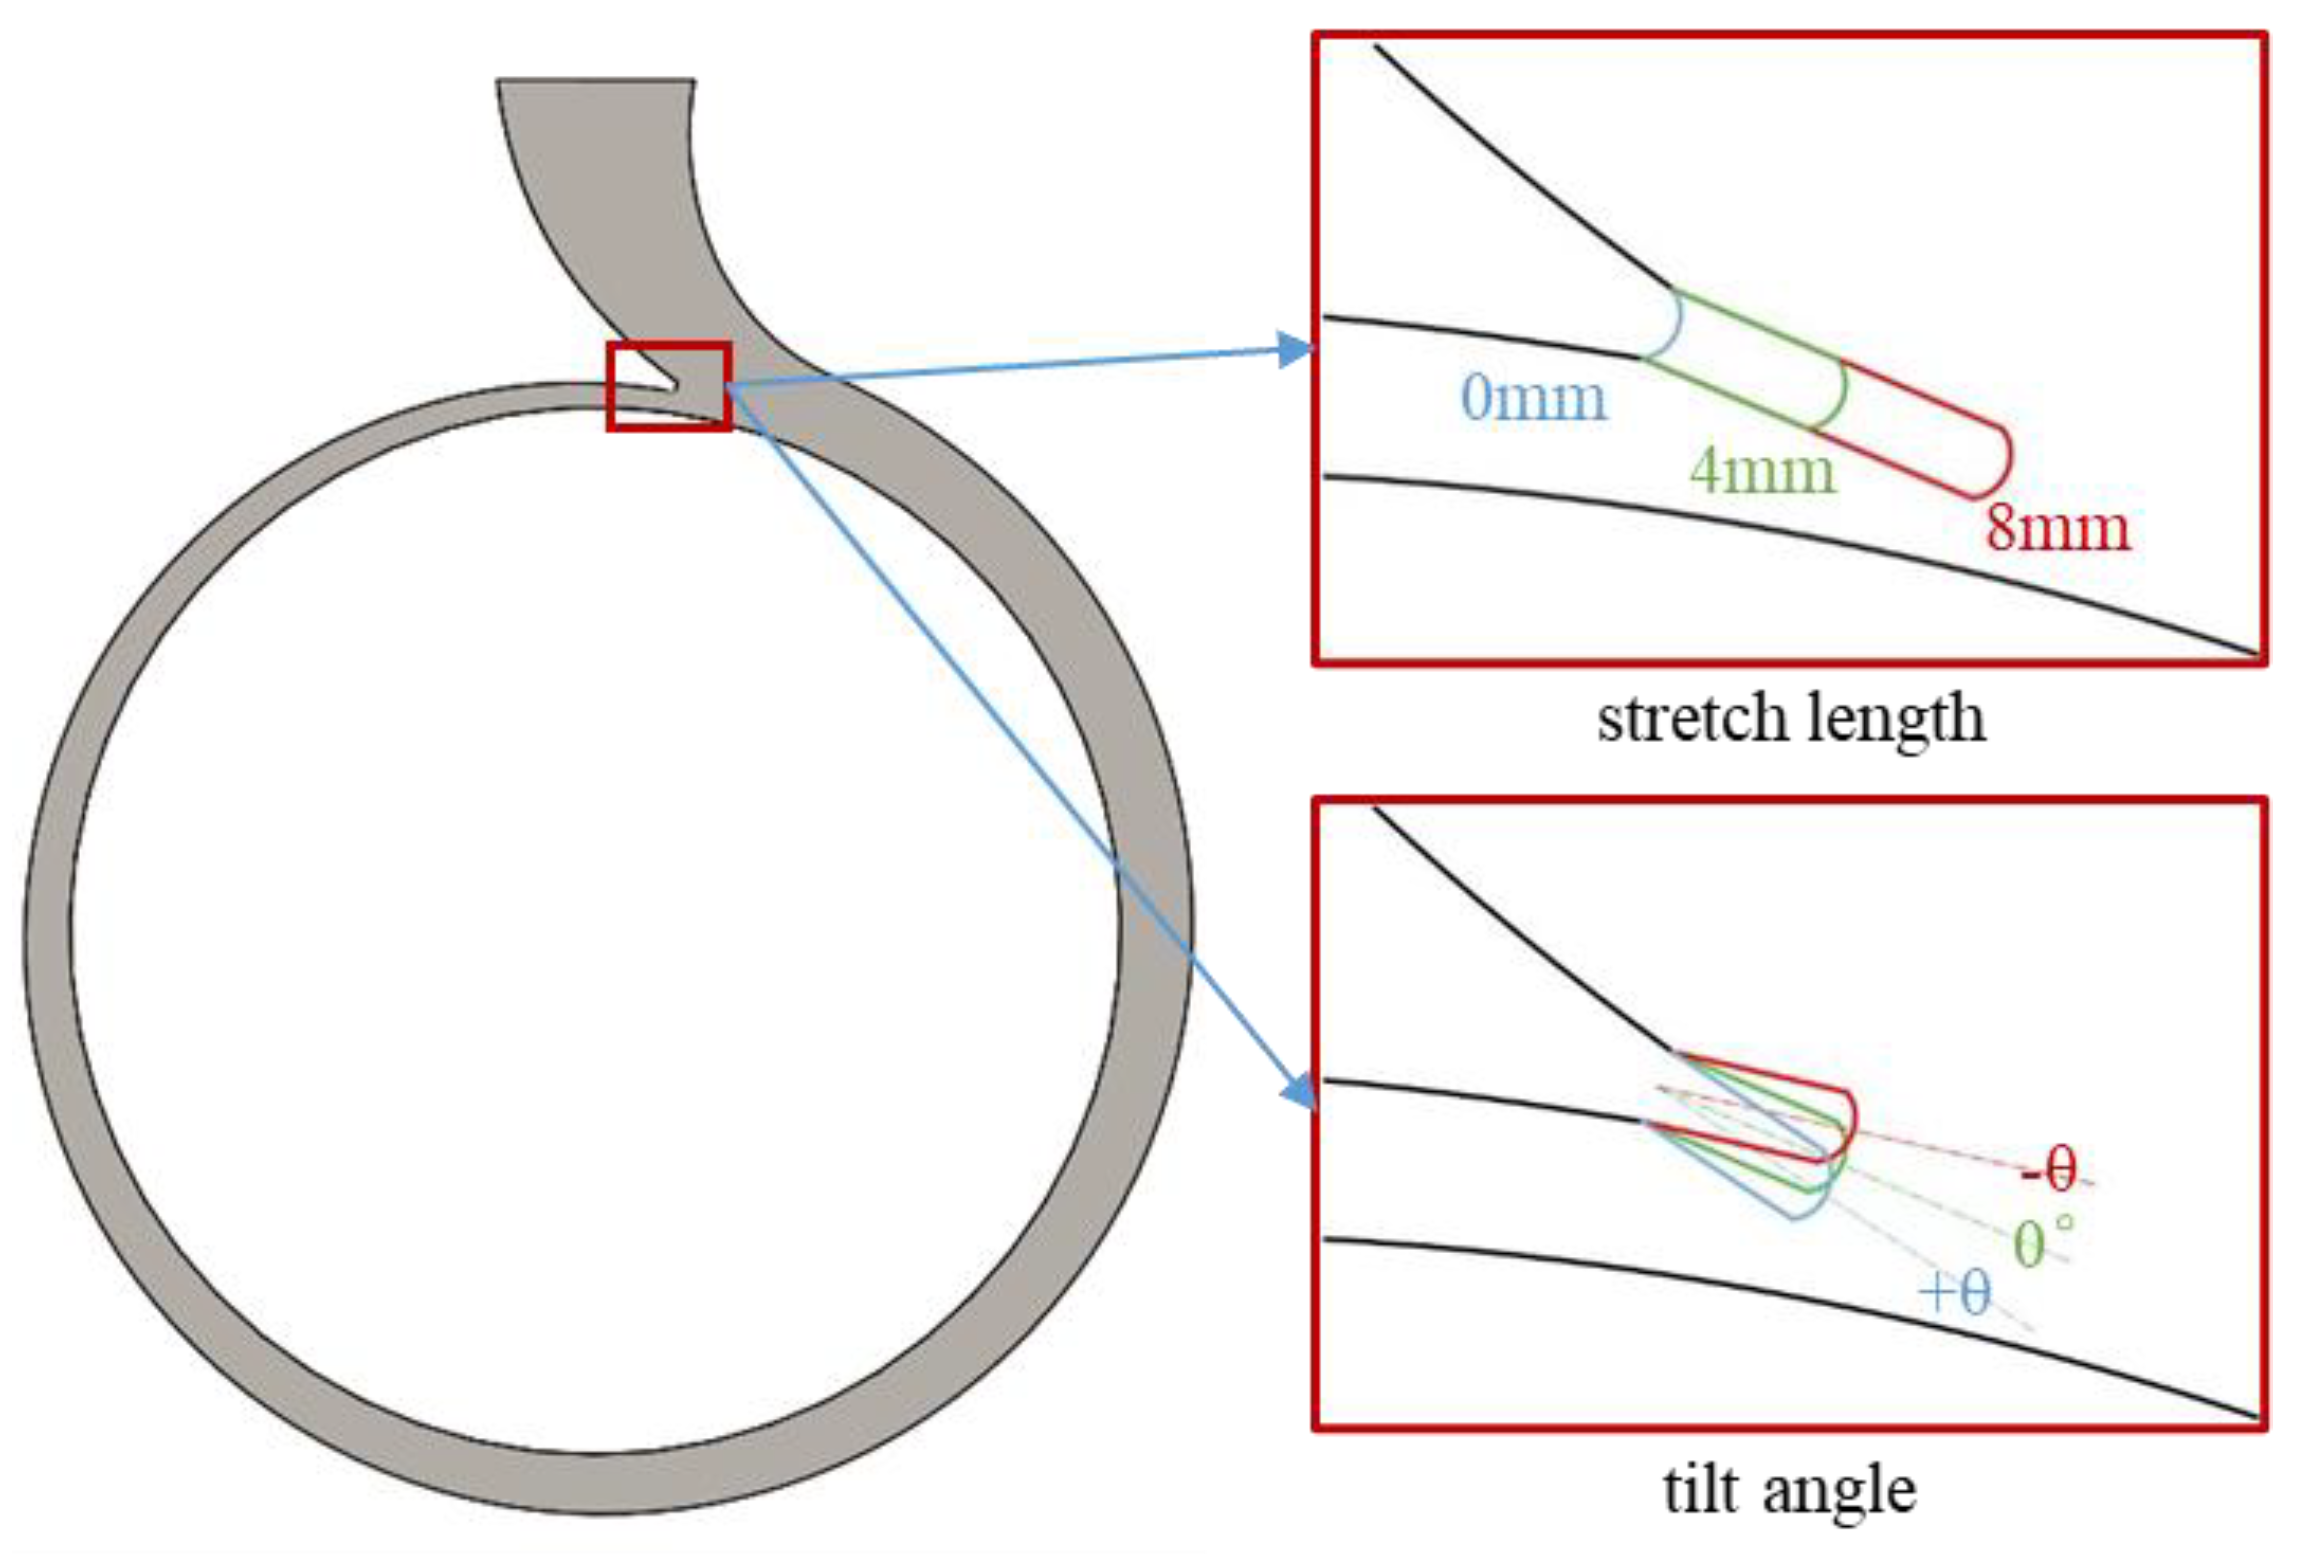
14] pointed out that the stretch length and tilt angle have significant effects on the performance of pumps running in turbine mode. Based on the findings of existing studies, this research focuses on the effects of the stretch length and tilt angle on the Francis turbine performance.
Figure 4 presents the optimization schemes of the stretch length and the tilt angle. For the stretch length, two values of 4 mm and 8 mm were taken. When the stretch length is 4 mm, the tilt angle takes a value every 4° in the range of −8° to 24°. When the stretch length is 8 mm, due to the limitations of the model’s geometry, the tongue’s tilt angle is selected at intervals of 4° within the range of −8° to 8°. As shown in
Table 2, 14 volute models were established.
3. Research Methods
3.1. Numerical Simulation
3.1.1. Grid Generation
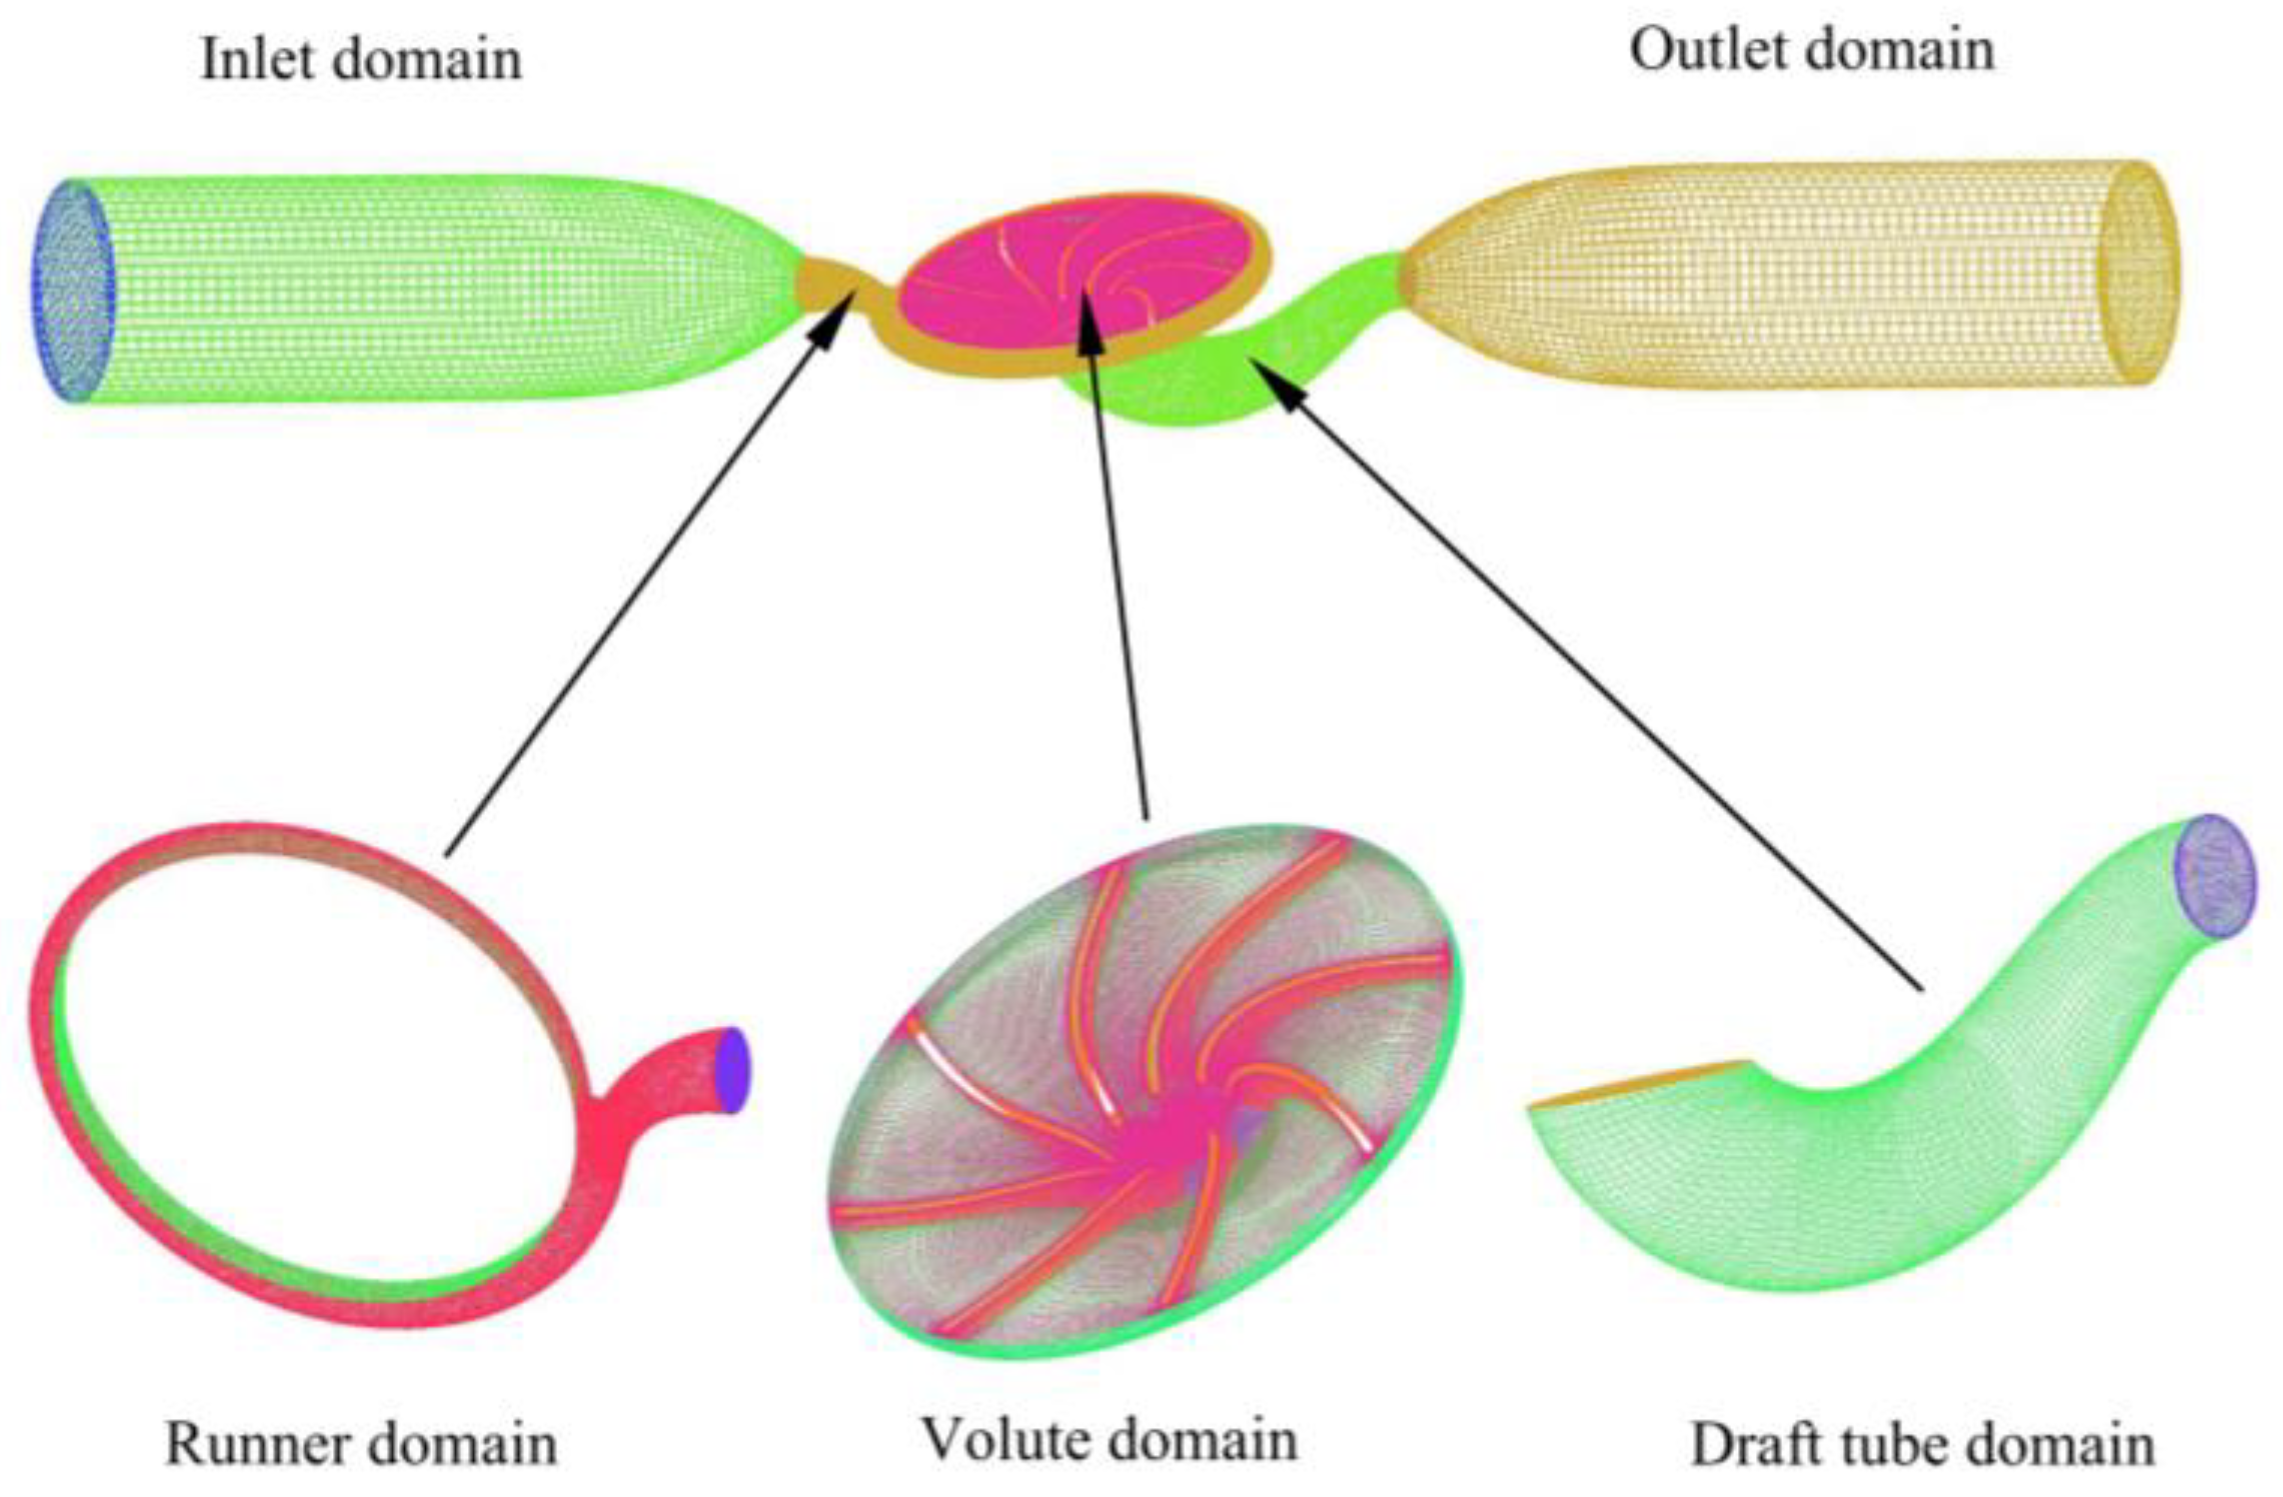
The hydro turbine model in this study includes five components: inlet pipeline, volute, runner, draft tube, and outlet pipeline. The flow channel of the runner was constructed in BladeGen, and the flow channels of other components were created in SolidWorks. In the meshing, the mesh model of the runner flow channel was generated in Ansys Turbogrid 2020 and the mesh models of other flow channels were generated in ICEM 2020. In addition, the mesh type of the volute flow channel was a tetrahedral mesh due to its sharp shape [
20], and the mesh type of other flow channels was a hexahedral mesh. The total mesh model generated in ICEM 2020 is shown in
Figure 5.
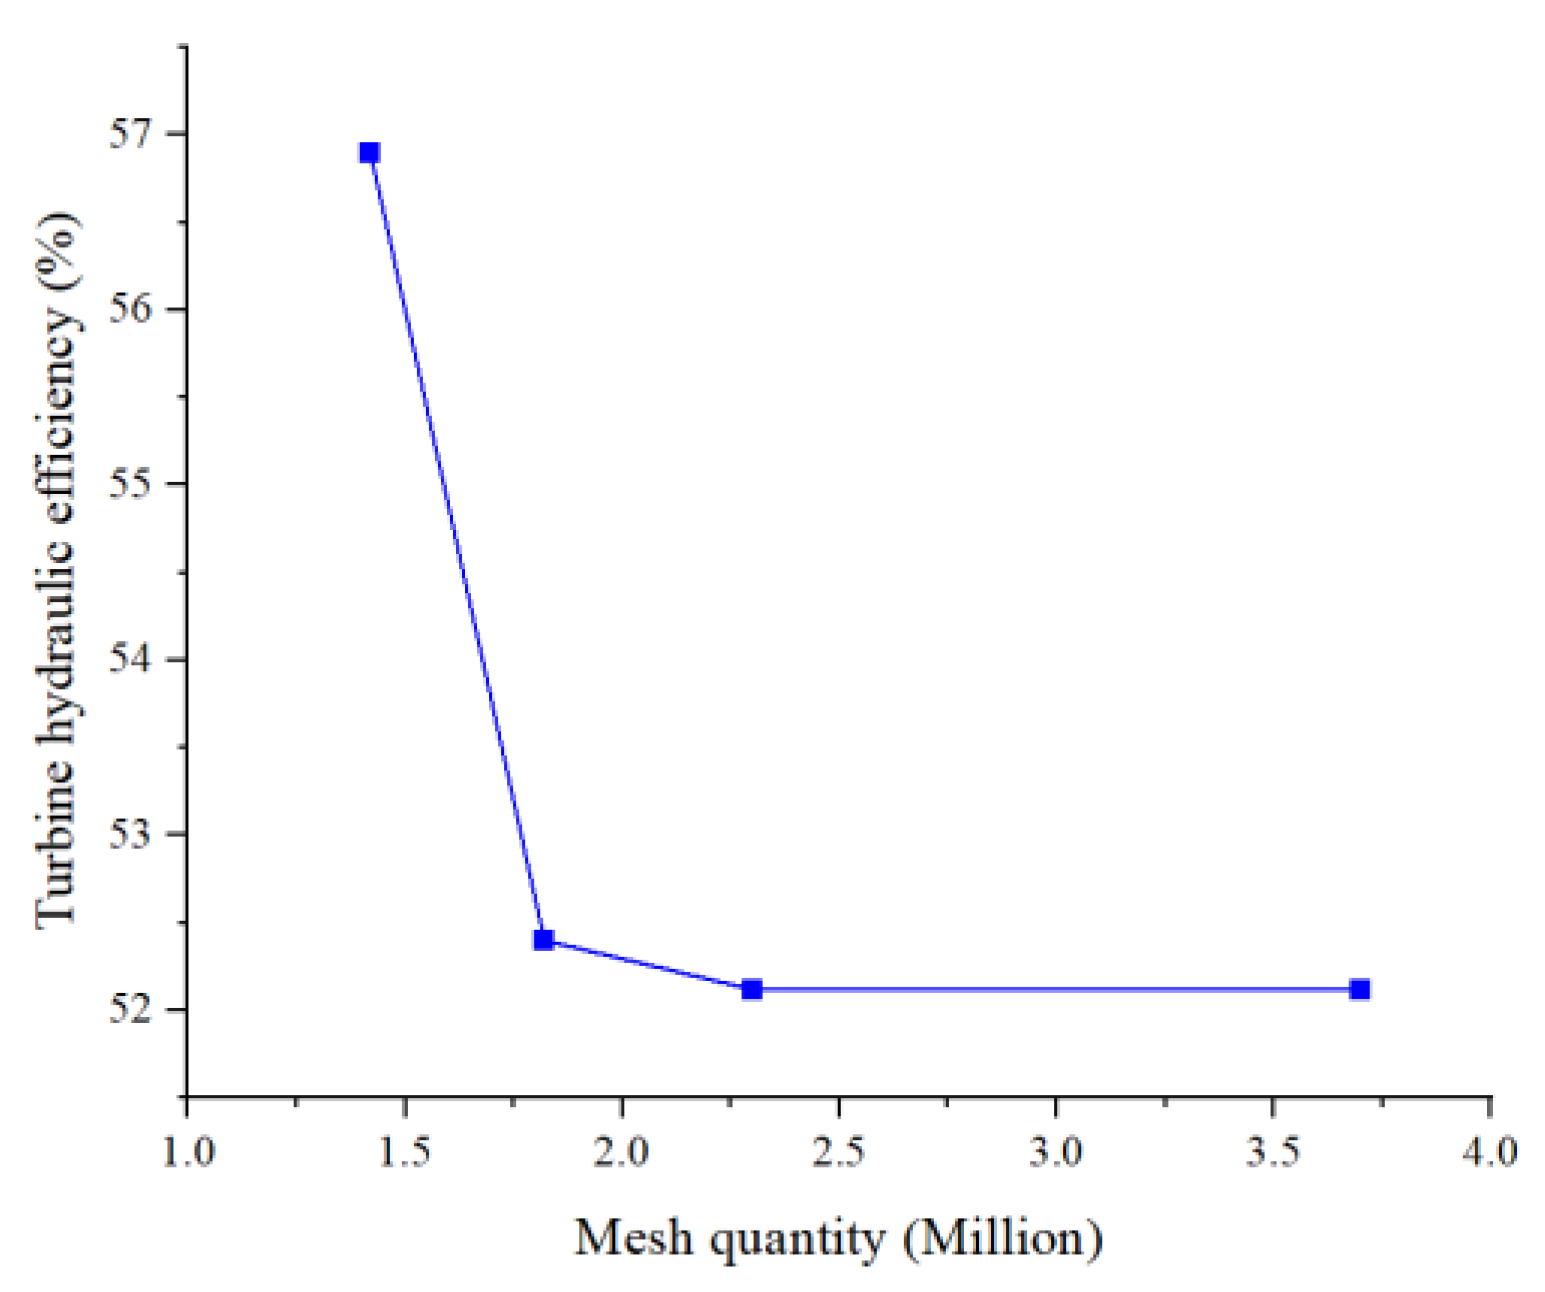
To avoid the impact of different mesh quantities on simulation results and to determine the optimal mesh quantity that balances accuracy and computational efficiency, it was necessary to conduct a mesh independence test. In this study, seven sets of mesh schemes with different quantities of mesh elements were established for the turbine computational domain. The specific mesh quantities are 1.42 million, 1.82 million, 2.29 million, 2.83 million, 3.22 million, 3.71 million, and 4.10 million. Using the turbine hydraulic efficiency as the standard for the mesh independence test, the independence test results are shown in
Figure 6. It can be observed that when the mesh quantity exceeds 1.82 million, the impact of different mesh quantities on the simulated turbine hydraulic efficiency becomes negligible. Therefore, this study determined that the ideal mesh quantity should be 1.82 million.
3.1.2. Simulation Settings
The three-dimensional incompressible turbulent flow inside a hydro turbine can be described by the following equations [
21,
22],
where
is the time-averaged velocity,
is the fluctuating velocity due to turbulence, and
is the Reynolds shear stress.
In the simulation, the SST
k-ω model was chosen to make the solution equations closed. This turbulence model can predict the near-wall flow more accurately [
22], and it is widely used in the numerical simulation of Francis turbines [
23,
24,
25]. The flow velocity was determined as the inlet boundary condition, and the pressure (0 Pa) was set as the outlet boundary condition. The frozen rotor method was chosen to achieve the interaction between the rotating domain (runner domain) and the stationary domain (other domains) [
26]. Furthermore, all wall roughness was set to 100 μm, the advection scheme was set to high resolution, and the residual target was 10
−5 in CFX 2020.
3.2. Lab Tests
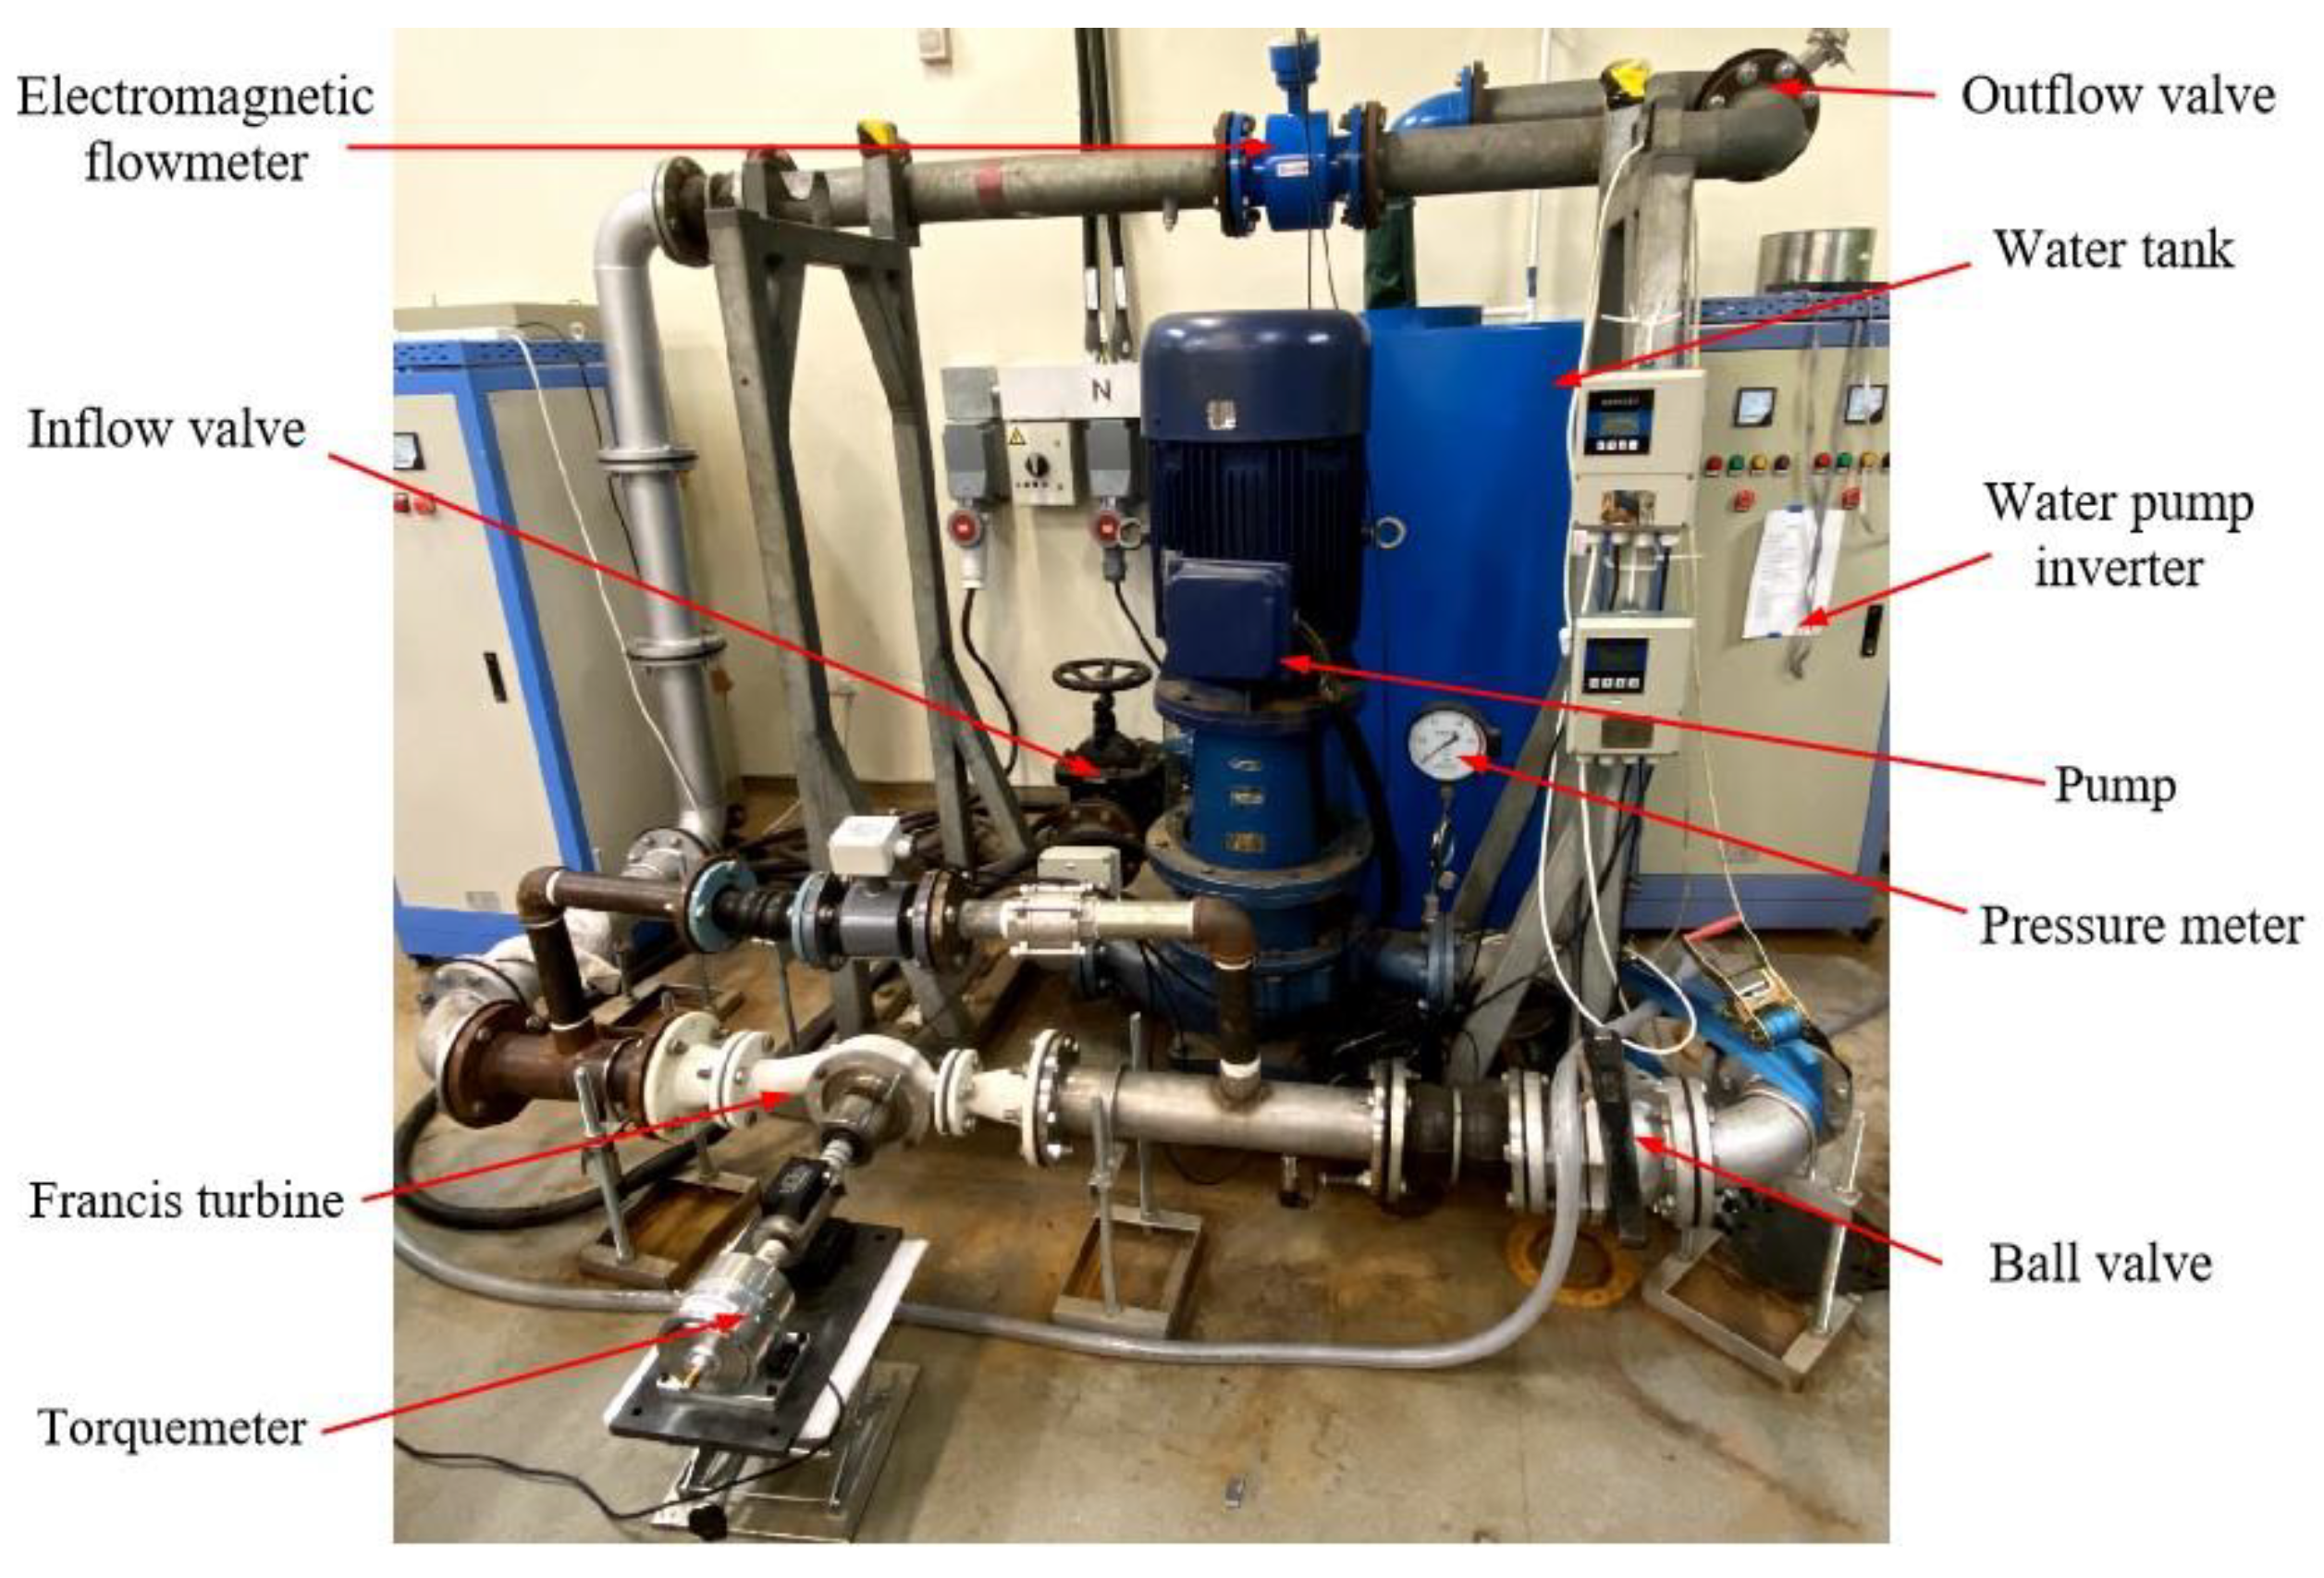
After the theoretical design and preliminary optimization, a prototype hydro turbine was obtained. To test the actual performance of this prototype and to verify the reliability of the simulation results, a hydraulic test platform was built.
Figure 7 is a schematic diagram of the hydraulic test platform, which includes a power pump, pressure meter, a prototype, pressure sensors, an electromagnetic flow meter, a water tank, water pipelines, and globe valves. In the lab test, the required flow rate and water head can be obtained by adjusting the frequency of the pump and the opening of the valves. The real-time flow rate inside the pipeline can be tested by the electromagnetic flowmeter. In addition, pressure sensors were used to test the pressure at the inlet and outlet of the hydro turbine. To measure the output power of the hydro turbine, a set of torque meters was used to measure the shaft power of the turbine under different flow rates; then, a 24 V three-phase permanent magnet alternating generator was used to convert the output mechanical energy from the hydro turbine into electrical energy. After rectification, the alternating current from the generator was converted into direct current. Finally, the generated electrical energy was consumed through a 22 Ω resistance, and the output electrical energy can be calculated by measuring the voltage through the resistance. The constructed hydraulic test rig is presented in
Figure 8. The diameter of the water pipeline is 100 mm, which is consistent with the actual use scenario of the hydro turbine.
3.3. Data Analysis
Water head, power output, and efficiency are important indicators of hydro turbine performance. The water head of a hydro turbine is the water head reduction in the water flow flowing through the hydro turbine. Based on the inlet and outlet pressures of the hydro turbine measured in the simulation or experiment, the water head reduction
(m) can be calculated as follows,
where
is the hydro turbine inlet pressure (Pa),
is the hydro turbine outlet pressure (Pa),
is the density of water (kg/m
3), and
g is the acceleration of gravity (m/s
2).
In the lab test, the electrical energy converted by the generator was measured directly. The theoretical available power
(W) can be calculated as follows:
Then, the efficiency
of converting water energy to electrical energy in the lab test can be calculated as follows,
where
is the electrical energy obtained in the lab tests (W).
To compare the simulation results with the experimental results, the simulated output electrical energy and the simulated efficiency of converting water energy to electrical energy should be calculated. The hydro turbine efficiency includes hydraulic efficiency
, leakage efficiency
, disc friction efficiency
, and mechanical efficiency
. In the simulation, through recording the simulated output torque
(N.m) of the runner, the simulated output shaft power
(W) of the hydro turbine can be calculated as follows,
where
is the rotation speed (rpm). Because the numerical model used is a simplified model, the simulation results are the result of considering only the hydraulic losses. Therefore, the simulated hydraulic efficiency
can be calculated as follows:
In addition, the simplified model being without the gap between the rotor and stator parts leads to the neglect of leakage losses and disc friction losses that occur in the gap region. Casartelli et al. [
27]. indicated that this simplification has no effect on the prediction of the head drop and makes the turbine efficiency higher. So, to make the simulation results more accurate, in this study, leakage losses and disc friction losses were predicted by the existing method [
28].
The mechanical efficiency
is mainly used to consider the mechanical losses caused by bearings and shaft seals. The difference in mechanical efficiency is relatively small under different working conditions, and the mechanical efficiency can be predicted by referring to the method provided in the relevant material [
15,
29]. In addition, the output shaft power of the hydro turbine is converted into electrical energy by the generator, and the conversion efficiency
of the generator should also be considered. Based on the above analysis, the simulated efficiency
of converting water energy to electrical energy can be calculated as follows:
The theoretical available power was obtained by Equation (11). Knowing , the simulated output electrical energy (W) can be calculated.
4. Results and Discussion
4.1. Validation of Simulation Results
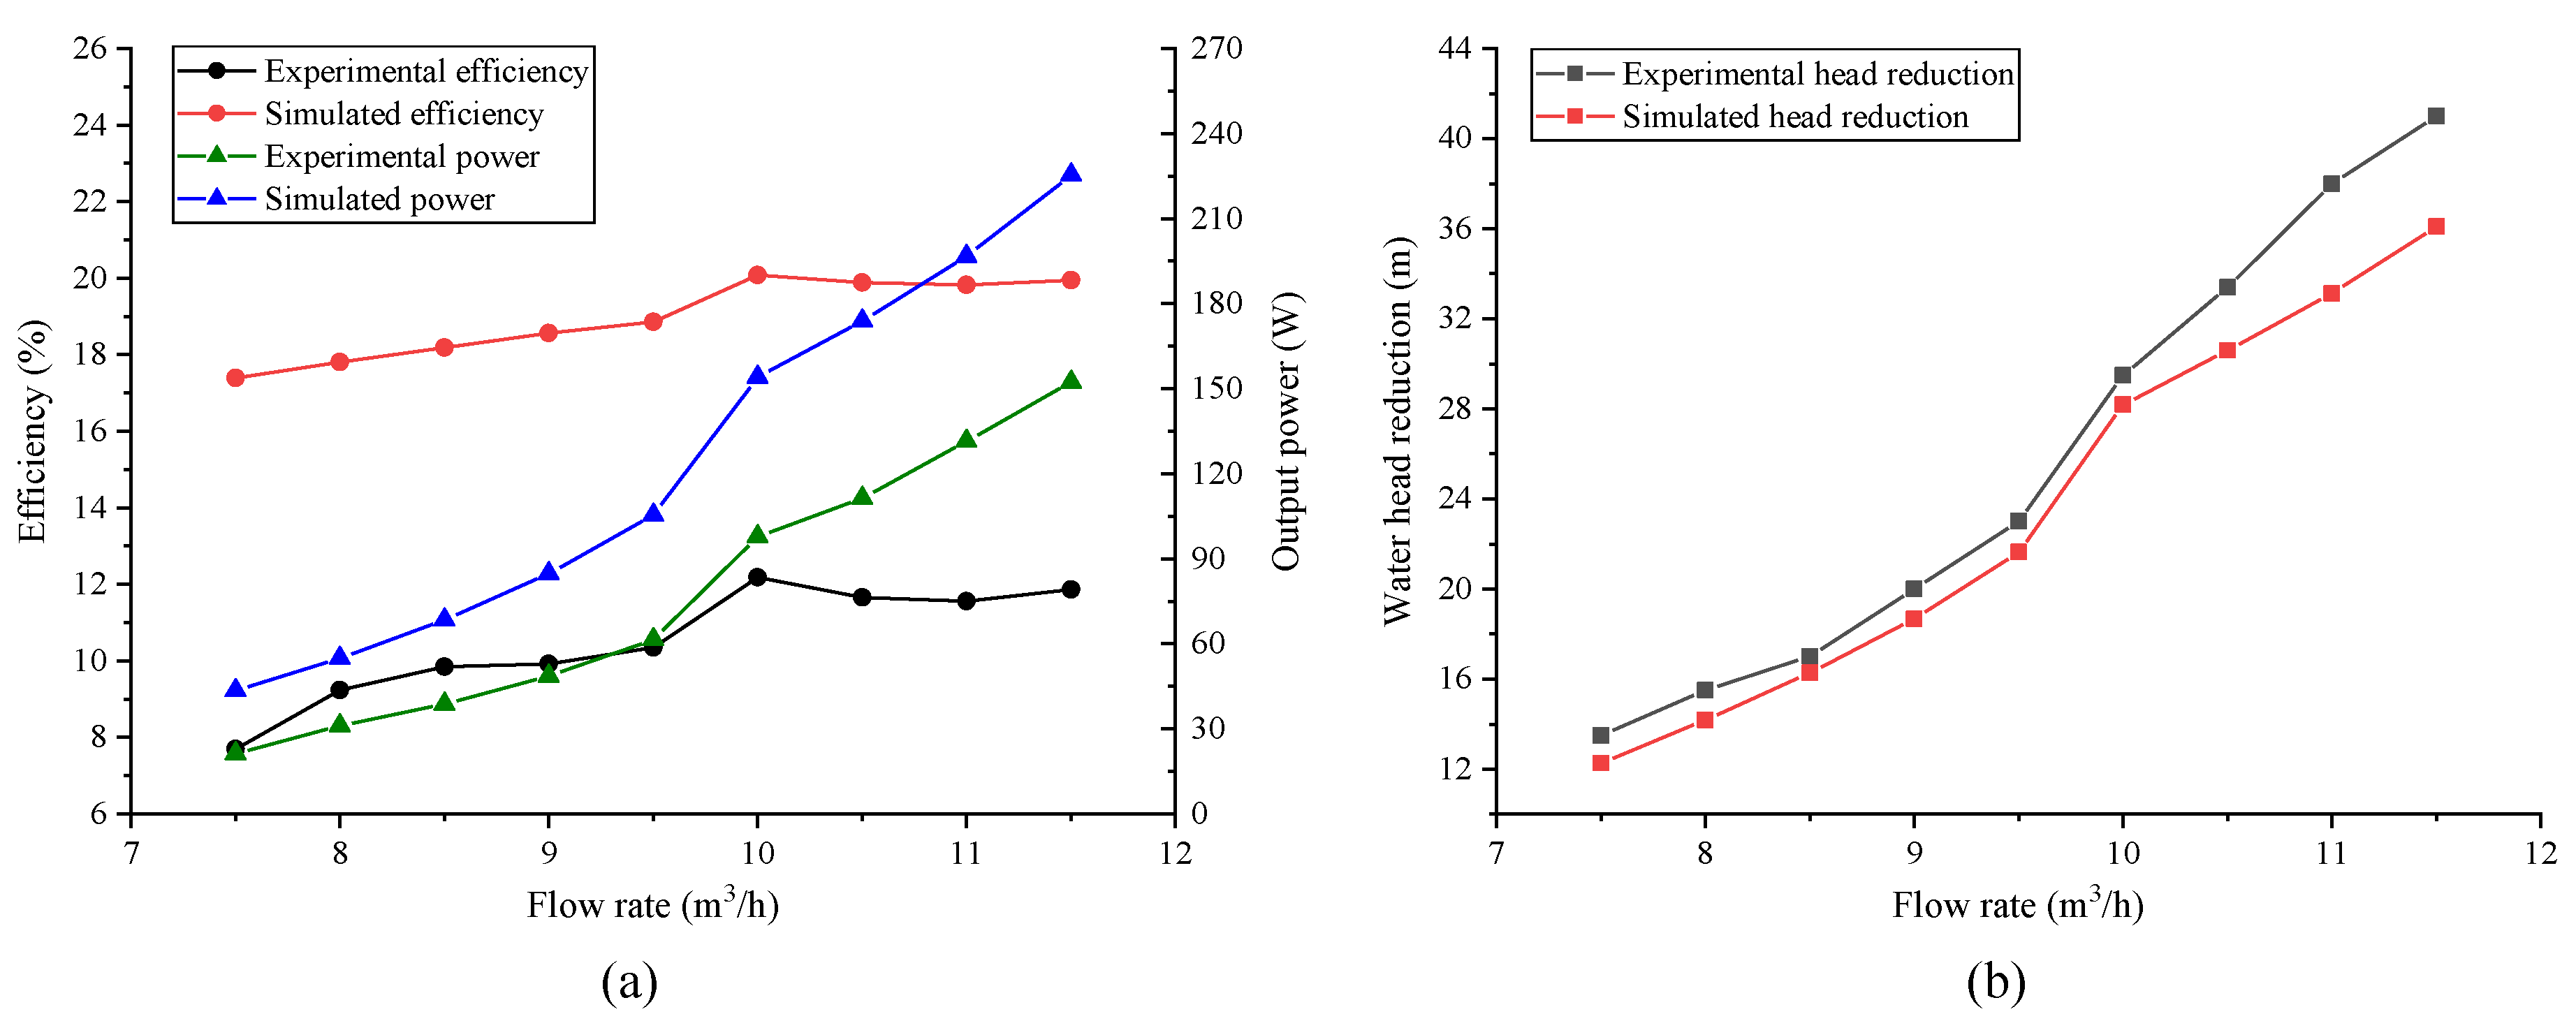
After the theoretical design and preliminary optimization, a prototype hydro turbine was obtained. The performance of this prototype was tested on the hydraulic test platform, and the simulation and test results are compared in
Figure 9. In addition, leakage losses, disc friction losses, mechanical losses, and generator conversion losses were taken into account in the simulated results.
As shown in
Figure 9, the changing trends of the simulation and test results are consistent at different conditions, and the best efficiency points (BEPs) are both at 10 m
3/h. In addition, in the whole flow rate range, it can be found that the simulated results of the water head reduction are lower than the tested results, and the simulated results of the output power and efficiency are higher than the tested results. The possible reasons for this phenomenon are as follows: (1) the turbulence model used is not accurate enough to predict the turbulence and eddies inside the hydro turbine; (2) the methods of loss prediction used are semi-empirical tools, and the predicted losses could be lower; (3) these effects, which result from manufacturing errors in the prototype, differences between test conditions and simulated conditions, and measurement errors, are inevitable.
Regardless of differences between the simulated results and test results, the changing trends of the hydro turbine performance can be accurately predicted by CFD simulations, so the numerical model can be used for subsequent studies. In addition, considering that the simulation results of the water head reduction are smaller than the test results, it is necessary to maintain the simulated water head reduction within 28.5 m to prevent excessive reduction from impacting the normal water supply. In our previous work, the optimization study of the runner was completed. In this work, the optimization study of the volute was conducted based on the optimization results of the runner.
4.2. The Optimization Study of the Volute
4.2.1. Different Sectional Shapes
Three volutes were constructed with rectangular, circular, and pear-shaped sections, while the other parameters of these volutes were kept consistent. The effects of volute sectional shape on turbine performance under different conditions were investigated through CFD simulations, and the simulated results are shown in
Figure 10.
As shown in
Figure 10a,b, the changing trends of output power and water head reduction corresponding to different sectional shapes are consistent at different flow rates, with the circular section being the largest, the pear-shaped section being slightly smaller than the circular section, and the rectangular section being the smallest. In addition, the water head reduction in the circular section at the design condition is 27.22 m. Although the water head reduction in the circular section is the highest, it is still within a reasonable range (<28.5 m). From
Figure 10c, it can be found that the BEP of the hydro turbine corresponding to both circular and rectangular sections is at 10 m
3/h, which is consistent with the design condition. However, the BEP of the pear-shaped section is at higher flow rates. In addition, the efficiency of the circular section is significantly higher than the other two sections in the whole flow rate range. Based on the above analysis, the circle was determined as the optimal sectional shape and would be used for further optimization study of the volute.
To investigate the causes of the effects of different section shapes on the hydro turbine performance, further analysis was performed.
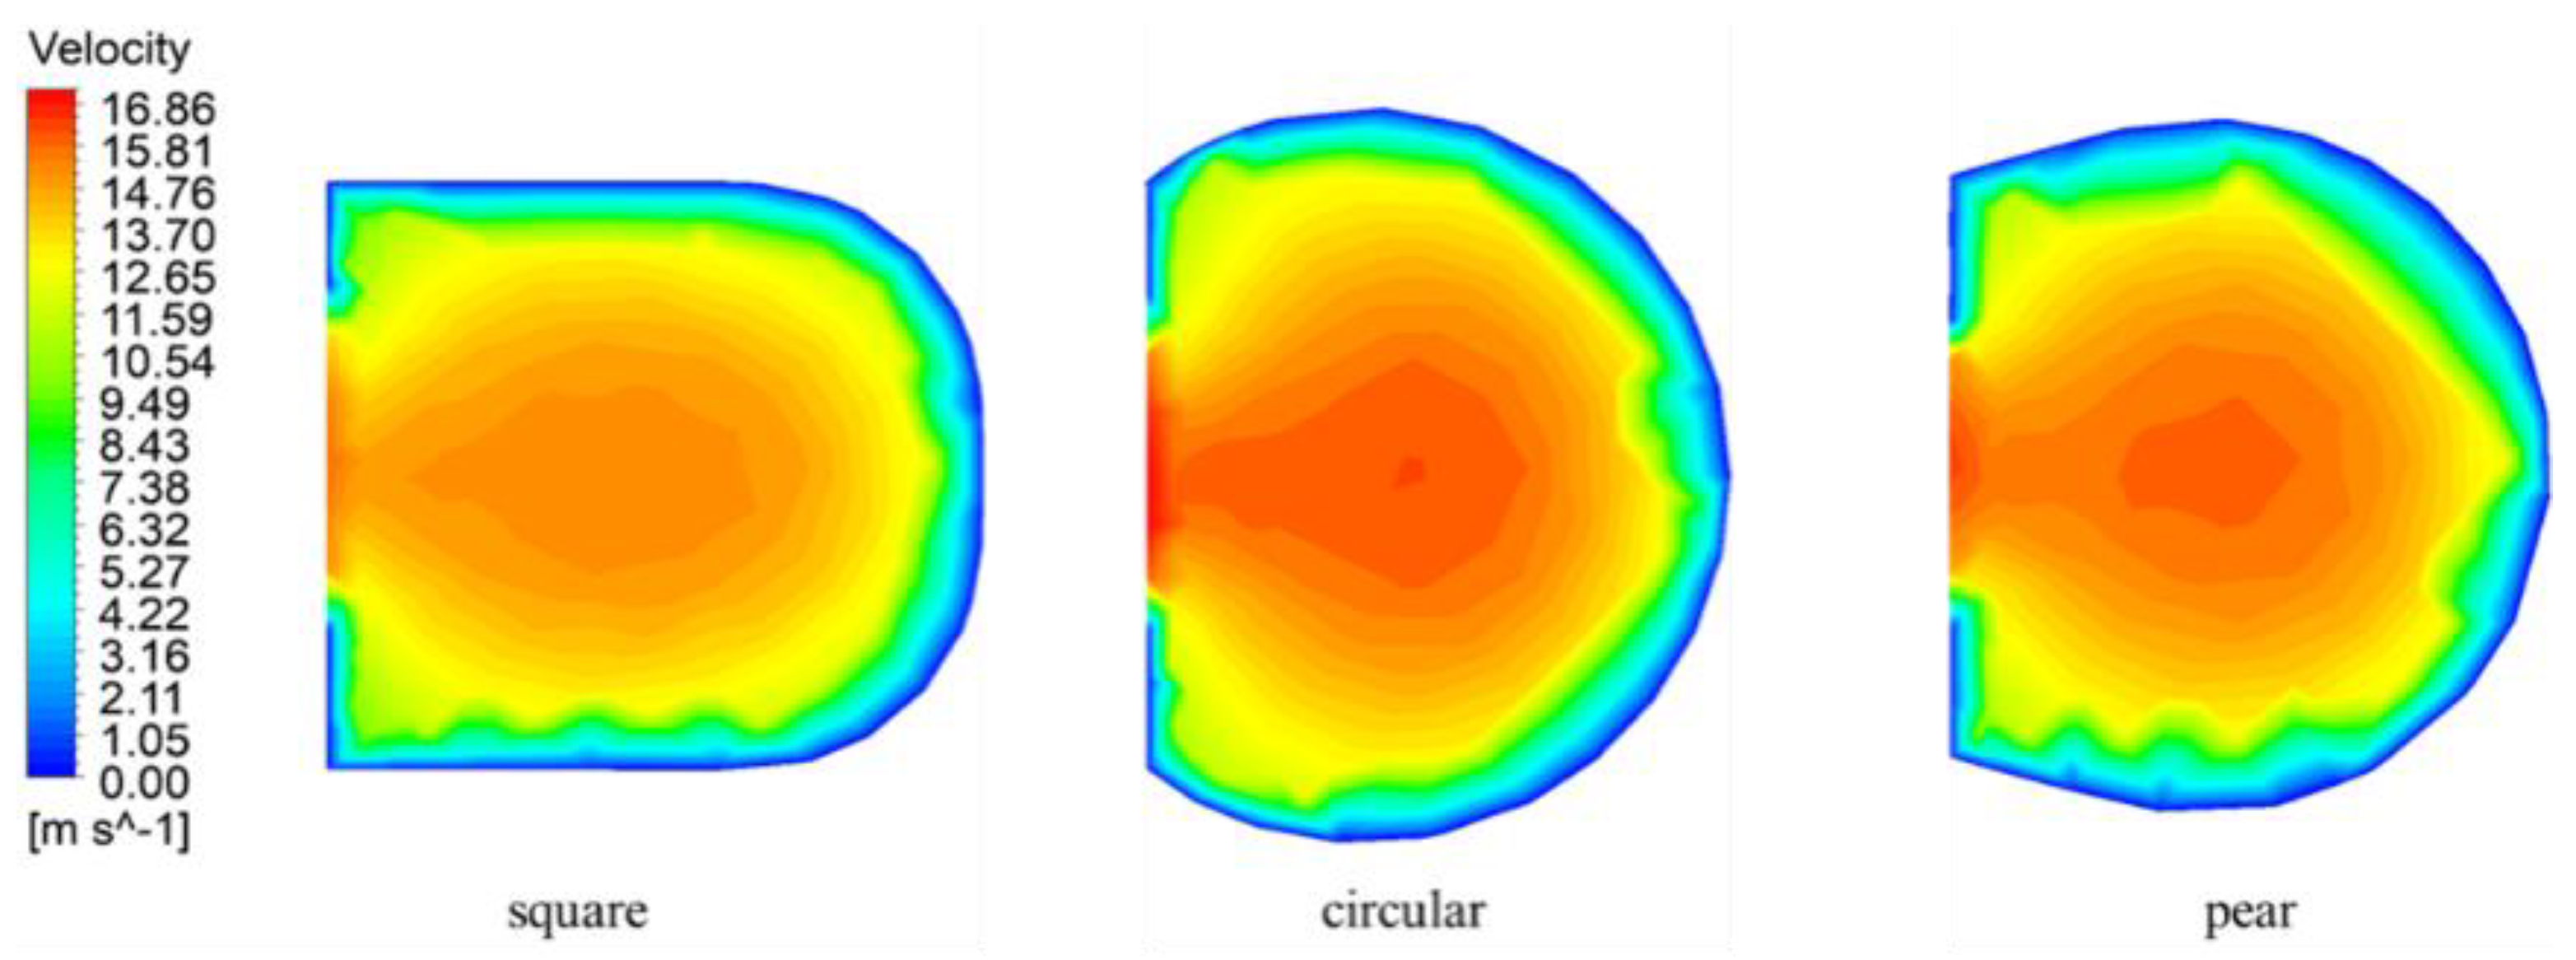
Figure 11 presents the sectional velocity clouds of different volutes at
for the design condition. It can be found that the high-velocity region of the circular section is the largest among the three sectional shapes. In addition, the low-velocity region exists near the wall in the different sectional shapes. Further, the low-velocity region is largest for the pear-shaped section and smallest for the rectangular section, which indicates that the rectangular section has a better ability to inhibit the development of the boundary layer than the circular and pear-shaped sections. From
Figure 11, it is also found that the flow velocity at the axial outlet of the circular section is the highest and most uniformly distributed among the three cross-sectional shapes. Based on the above analysis, the circular section could better enhance the flow velocity inside the volute and make the flow velocity distribution at the volute outlet more uniform, which can significantly improve the work capacity of the runner.
4.2.2. Different Design Methods
According to three design methods proposed in
Section 2.2.1, three volute models were established, while other parameters of these volutes were kept consistent. The effects of the volute design method on turbine performance under different conditions were investigated through CFD simulations, and the simulated results are shown in
Figure 10.
As shown in
Figure 12a,b, the changing trends of output power and water head reduction corresponding to different design methods are consistent in the whole flow rates range, with method 1 being the largest, method 2 being slightly smaller than method 1, and method 3 being the smallest. In addition, the water head reduction corresponding to the three design methods at the design condition is less than 28.5 m. From
Figure 12c, it can be found that the efficiencies corresponding to these three design methods are quite close at lower flow rates. At higher flow rates, the efficiency of method 1 is significantly higher than that of methods 2 and 3. Furthermore, the BEPs of the hydro turbines corresponding to both method 1 and method 2 are at 10 m
3/h, which is consistent with the prediction. However, the BEP of the hydro turbine corresponding to method 3 is at a higher flow rate. Based on the above analysis, method 1 was determined to be the optimal design method.
4.2.3. The Orthogonal Design of Experiments
In the orthogonal design of the experiments, the optimization study of outlet width, inlet diameter, and inlet height for the volute was conducted using the water head reduction and efficiency as performance indicators.
Table 3 displays trial schemes and simulation results at the design condition.
(1) Intuitive Analysis
As can be seen from
Table 3, the water head reduction in scheme 4 is the highest at 32.27 m, and the water head reduction in scheme 10 is the lowest at 24.89 m. There is a large difference between the maximum and minimum values of water head reduction. From the work that has been conducted, it can be found that a larger water head reduction always corresponds to higher output power, even though the efficiency may not be the highest. So, to avoid excessive water head reduction affecting the normal water supply and to recover more water energy, the simulated result of water head reduction should be kept between 26.5 and 28.5 m. In addition, the efficiency of scheme 11 is the highest at 23.10%, and the efficiency of scheme 10 is the lowest at 20.25%. There is a large difference between the maximum and minimum efficiency values. Taking into account the water head reduction and efficiency, the performance of scheme 11 is optimal among the 16 trial schemes.
(2) Range analysis
The relationships between the different factor levels and performance indicators are given in
Figure 13, with the factor level as the horizontal coordinate and the mean of the performance indicators as the vertical coordinate.
It can be found that the range order of water head reduction is RC > RB > RA, and the range order of efficiency is RA > RC > RB. This shows that the order of factors affecting the water head reduction is CBA, and the order of factors affecting the efficiency is ACB. For the individual factors, as the volute outlet width (A) increases, the water head reduction shows a decreasing trend, while the efficiency decreases significantly. As the volute inlet diameter (B) increases, the water head reduction consistently decreases, and the efficiency shows an overall upward trend. As the volute inlet height (C) increases, the water head reduction increases significantly, and the efficiency is first increased and then decreased. The analysis results show that these factors have an impact on the hydro turbine performance, and the effect of outlet width and inlet height is the greatest. In addition, there are not many optimization studies of volute inlet height, and the results of this study show that it is necessary to optimize the volute inlet height.
Based on the above analysis, a model with the highest efficiency was first selected, and then the feasibility of this model was verified by its water head reduction. The factor combination of the model is A1B4C2, with an outlet width of 6.25 mm, an inlet diameter of 30 mm, and an inlet height of 130 mm.
(3) The validation of the optimization model
The optimization model was constructed in SolidWorks. The performance of this model at the design condition was obtained through CFD simulation, as shown in
Table 4. This model has an efficiency of 23.14%, which is a higher efficiency than the 16 trial schemes, and a 1.48% increase in efficiency compared with the pre-optimization model. In addition, the water head reduction of this model is 26.74 m, which is slightly lower than the water head reduction of scheme 11, but is still within the proper range. Based on the above analysis, this model is identified as the final optimization model, and the existence of a model with better performance is not excluded.
To further validate the performance of the optimized model, this model was simulated at different flow rates.
Figure 14 presents the performance of the hydro turbine before and after the orthogonal optimization. It can be found that the water head reduction of the optimized model in the whole flow range is lower than that of the pre-optimized model, and the output power is higher than that of the pre-optimized model, which finally leads to a significant improvement in the efficiency. This result shows that the performance of the hydro turbine is greatly improved in both design and off-design conditions through the orthogonal design of the experiments.
4.2.4. The Optimization of the Volute Tongue
In this work, the effects of two shape parameters (stretch length and tilt angle) of the volute tongue on the hydro turbine performance were investigated. As shown in
Table 2, 14 hydro turbine models were generated. The performance of different models at the design condition was obtained by CFD simulations, and the results are presented in
Figure 13.
As shown in
Figure 15a,b, the output power and water head reduction are continuously decreasing with the increase in the tilt angle at different stretch lengths. The output power and water head reduction corresponding to the larger stretch length are significantly greater than the smaller stretch length in the limited angle range. In addition, only when the stretch length is 4 mm and the tilt angle is greater than 8° is the water head reduction less than 28.5 m. From
Figure 15c, it can be found that the efficiency shows a continuously increasing trend with the increase in the tilt angle in the limited angle range when the stretching length is 8 mm. However, when the stretching length is 4 mm, the changing trend of efficiency is wavy. The highest efficiency is observed when the tilt angle is 12°. In addition, a larger stretch length corresponds to lower efficiency in a limited tilt angle range. Based on the above analysis, considering a proper water head reduction and higher efficiency, it was determined that the optimal combination of parameters is 4 mm stretch length and 12° tilt angle. The optimal model has an output power of 176 W, a water head reduction of 27.72 m, and an efficiency of 23.35% at the design condition.
To validate the performance of the optimal model, the model at different flow rates was simulated, and the performance of the hydro turbine before and after the tongue optimization is compared in
Figure 16. As shown in
Figure 16a,b, the output power and water head reduction in the optimized model are significantly higher than the pre-optimized model in the whole flow rate range. From
Figure 16c, it can be found that tongue optimization has no significant effect on the hydro turbine efficiency. Based on the above analysis, although the tongue optimization has not significantly improved the efficiency of the hydro turbine, the optimized model can recover more water energy within the proper water head reduction. Therefore, the optimized results of the tongue can be adopted.
5. Conclusions
In this paper, to improve the performance of a pico Francis turbine used in the WSS of high-rise buildings, an optimization study of the volute was systematically performed through CFD simulations based on an experimentally validated numerical model.
(1) Compared with rectangular and pear-shaped sections, the circular section could better enhance the flow velocity inside the volute and make the flow velocity distribution at the volute outlet more uniform, which can significantly improve the work capacity of the runner.
(2) At lower flow rates, the different volute design methods had no significant effect on the turbine efficiency. At higher flow rates, the equal mean velocity method corresponds to the highest efficiency. Furthermore, two typical methods allow the BEP of the turbine to appear at the anticipated location, while the BEP of the turbine corresponding to the outer radius linear method appears at a higher flow rate.
(3) The results of range analysis show that the water head reduction increases significantly with the increase in the inlet height, and there is an optimal inlet height for the highest efficiency. In addition, the efficiency can be significantly improved by reducing the outlet width of the volute. Compared with the model before optimization, the orthogonal design of the experiments significantly enhances the turbine performance under both design and off-design conditions, with a 1.48% increase in efficiency at the design condition.
(4) In the tongue optimization, the water head reduction and the output power continuously decrease with the increase in the tilt angle. In addition, a larger stretch length corresponds to greater output power, a larger water head reduction, and lower efficiency in the limited angle range. Although tongue optimization has not significantly improved the efficiency, it can make the output power increase within the proper water head reduction.
(5) Based on the results, there is still space for performance improvement of the developed pico Francis turbine. Future research will focus on the stator–rotor interaction inside the turbine to achieve optimal matching between the volute and runner, thereby enhancing the overall efficiency of the turbine.
In this work, within a proper water head reduction, the optimized model increased the output power by 18.65% and efficiency by 2.1% at the design condition. This study provides a reference for performance improvement of Francis turbines as pico-pipeline turbines.
Author Contributions
Conceptualization, J.D. and J.H.; Methodology, H.K.; Software, H.K.; Validation, J.D.; Formal analysis, Q.X.; Investigation, J.H.; Resources, J.D.; Data curation, Q.X. and Z.G.; Writing—original draft, H.K.; Writing—review & editing, J.D.; Supervision, J.D. All authors have read and agreed to the published version of the manuscript.
Funding
This research was funded by the Wuxi Science and Technology Development Fund Project (Grant No.: K20221010) and the research funds from Jiangsu Key Laboratory of Advanced Food Manufacturing Equipment and Technology (No. FM-202104, FMZ202206).
Data Availability Statement
The data presented in this study are available on request from the corresponding author due to privacy reasons.
Conflicts of Interest
Author Zhan Ge was employed by the company Xuzhou XCMG Excavating Machinery Co., Ltd., Author Jinkuang Huang was employed by the State Grid Jinan Power Supply Company. The remaining authors declare that the research was conducted in the absence of any commercial or financial relationships that could be construed as a potential conflict of interest.
References
- Maldar, N.R.; Ng, C.Y.; Oguz, E. A review of the optimization studies for Savonius turbine considering hydrokinetic applications. Energy Convers. Manag. 2020, 226, 113495. [Google Scholar] [CrossRef]
- Sun, X.; Wang, X.; Liu, L.; Fu, R. Development and present situation of hydropower in China. Water Policy 2019, 21, 565–581. [Google Scholar] [CrossRef]
- Elbatran, A.H.; Yaakob, O.B.; Ahmed, Y.M.; Shabara, H.M. Operation, performance and economic analysis of low head micro-hydropower turbines for rural and remote areas: A review. Renew. Sustain. Energy Rev. 2015, 43, 40–50. [Google Scholar] [CrossRef]
- Liu, X.; Luo, Y.; Karney, B.W.; Wang, W. A selected literature review of efficiency improvements in hydraulic turbines. Renew. Sustain. Energy Rev. 2015, 51, 18–28. [Google Scholar] [CrossRef]
- Coelho, B.; Andrade-Campos, A. Efficiency achievement in water supply systems—A review. Renew. Sustain. Energy Rev. 2014, 30, 59–84. [Google Scholar] [CrossRef]
- Muhirwa, A.; Cai, W.-H.; Su, W.-T.; Liu, Q.; Binama, M.; Li, B.; Wu, J. A review on remedial attempts to counteract the power generation compromise from draft tubes of hydropower plants. Renew. Energy 2020, 150, 743–764. [Google Scholar] [CrossRef]
- Su, X.; Liu, H.; Qi, J.; Wang, R.; Yang, Z.; Zhu, Z.; Song, M.; Xue, L. Comparative study on the flow characteristics of large-discharge and low-head hydraulic turbines with different discharge structures. J. Taiwan Inst. Chem. Eng. 2024, 156, 105274. [Google Scholar] [CrossRef]
- Wang, Y.; Tan, X.; Wang, N.; Huang, D. Aerodynamic design and numerical study for centrifugal turbine with different shapes of volutes. Appl. Therm. Eng. 2018, 131, 472–485. [Google Scholar] [CrossRef]
- Yang, M.; Martinez-Botas, R.; Rajoo, S.; Yokoyama, T.; Ibaraki, S. An investigation of volute cross-sectional shape on turbocharger turbine under pulsating conditions in internal combustion engine. Energy Conv. Manag. 2015, 105, 167–177. [Google Scholar] [CrossRef]
- Bian, C.; Zhang, S.; Yang, J.; Liu, H.; Zhao, F.; Wang, X. Bayesian Optimization Design of Inlet Volute for Supercritical Carbon Dioxide Radial-Flow Turbine. Machines 2021, 9, 218. [Google Scholar] [CrossRef]
- Yuan, Z.; Zheng, Q.; Wang, L.; Yue, G. Influence of Structural Factors on the Performance of He-Xe Mixture Gas Volute. J. Mech. Eng. 2021, 57, 192. [Google Scholar]
- Shrestha, U.; Choi, Y.-D. A CFD-Based Shape Design Optimization Process of Fixed Flow Passages in a Francis Hydro Turbine. Processes 2020, 8, 1392. [Google Scholar] [CrossRef]
- Baloni, B.D.; Channiwala, S.A.; Mayavanshi, V.K. Pressure recovery and loss coefficient variations in the two different centrifugal blower volute designs. Appl. Energy 2012, 90, 335–343. [Google Scholar] [CrossRef]
- Morabito, A.; Vagnoni, E.; Di Matteo, M.; Hendrick, P. Numerical investigation on the volute cutwater for pumps running in turbine mode. Renew. Energy 2021, 175, 807–824. [Google Scholar] [CrossRef]
- Gülich, J.F. Centrifugal Pumps; Springer International Publishing: Cham, Switzerland, 2020; ISBN 978-3-030-14787-7. [Google Scholar]
- Zuo, G. Hydroturbine; China Water and Power Press: Beijing, China, 1995. [Google Scholar]
- Wang, T.; Wang, C.; Kong, F.; Gou, Q.; Yang, S. Theoretical, experimental, and numerical study of special impeller used in turbine mode of centrifugal pump as turbine. Energy 2017, 130, 473–485. [Google Scholar] [CrossRef]
- Yahya, S.M. Turbines Compressors and Fans, 4th ed.; Mc Graw Hill: Noida, India, 2010. [Google Scholar]
- Alemi Arani, H.; Fathi, M.; Raisee, M.; Nourbakhsh, S.A. The effect of tongue geometry on pump performance in reverse mode: An experimental study. Renew. Energy 2019, 141, 717–727. [Google Scholar] [CrossRef]
- Li, X.-B.; Binama, M.; Su, W.-T.; Cai, W.-H.; Muhirwa, A.; Li, B.; Li, F.-C. Runner blade number influencing RPT runner flow characteristics under off-design conditions. Renew. Energy 2020, 152, 876–891. [Google Scholar] [CrossRef]
- Jiyun, D.; Hongxing, Y.; Zhicheng, S.; Xiaodong, G. Development of an inline vertical cross-flow turbine for hydropower harvesting in urban water supply pipes. Renew. Energy 2018, 127, 386–397. [Google Scholar] [CrossRef]
- Du, J.; Yang, H.; Shen, Z. Study on the impact of blades wrap angle on the performance of pumps as turbines used in water supply system of high-rise buildings. Int. J. Low-Carbon Technol. 2018, 13, 102–108. [Google Scholar] [CrossRef]
- Khanal, K. A methodology for designing Francis runner blade to find minimum sediment erosion using CFD. Renew. Energy 2016, 87, 307–316. [Google Scholar] [CrossRef]
- Feng, J.; Luo, X.; Zhu, G.; Wu, G. Investigation on disk friction loss and leakage effect on performance in a Francis model turbine. Adv. Mech. Eng. 2017, 9, 168781401772379. [Google Scholar] [CrossRef]
- Muhirwa, A.; Li, B.; Su, W.-T.; Liu, Q.-Z.; Binama, M.; Wu, J.; Cai, W.-H. Investigation on mutual traveling influences between the draft tube and upstream components of a Francis turbine unit. Renew. Energy 2020, 162, 973–992. [Google Scholar] [CrossRef]
- Kim, S.-J.; Choi, Y.-S.; Cho, Y.; Choi, J.-W.; Kim, J.-H. Effect of blade thickness on the hydraulic performance of a Francis hydro turbine model. Renew. Energy 2019, 134, 807–817. [Google Scholar] [CrossRef]
- Casartelli, E.; Cimmino, D.; Staubli, T.; Gentner, C. Interaction of leakage flow with the main runner-outflow in a Francis turbine. In Proceedings of the HYDRO, Villach, Austria, 17–20 October 2005. Paper No. 04.03. [Google Scholar]
- Guan, X. Modern Pumps Theory and Design; China Astronautic Publishing House: Beijing, China, 2011. [Google Scholar]
- Giosio, D.R.; Henderson, A.D.; Walker, J.M.; Brandner, P.A.; Sargison, J.E.; Gautam, P. Design and performance evaluation of a pump-as-turbine micro-hydro test facility with incorporated inlet flow control. Renew. Energy 2015, 78, 1–6. [Google Scholar] [CrossRef]
Figure 1.
Plan and section of the volute.
Figure 1.
Plan and section of the volute.
Figure 2.
Different shapes of the volute section.
Figure 2.
Different shapes of the volute section.
Figure 3.
Schematic representation of optimization factors.
Figure 3.
Schematic representation of optimization factors.
Figure 4.
The optimization schemes of the stretch length and the tilt angle.
Figure 4.
The optimization schemes of the stretch length and the tilt angle.
Figure 5.
Total mesh model.
Figure 5.
Total mesh model.
Figure 6.
Mesh independence tests.
Figure 6.
Mesh independence tests.
Figure 7.
Schematic diagram of the hydraulic test platform.
Figure 7.
Schematic diagram of the hydraulic test platform.
Figure 8.
The hydraulic test platform.
Figure 8.
The hydraulic test platform.
Figure 9.
Simulated and tested performance of the prototype: (a) output power and efficiency, (b) water head reduction.
Figure 9.
Simulated and tested performance of the prototype: (a) output power and efficiency, (b) water head reduction.
Figure 10.
Different sectional shapes: (a) output power, (b) water head reduction, and (c) efficiency.
Figure 10.
Different sectional shapes: (a) output power, (b) water head reduction, and (c) efficiency.
Figure 11.
Sectional velocity clouds of volutes with different section shapes at the design condition.
Figure 11.
Sectional velocity clouds of volutes with different section shapes at the design condition.
Figure 12.
Different design methods: (a) output power, (b) water head reduction, and (c) efficiency.
Figure 12.
Different design methods: (a) output power, (b) water head reduction, and (c) efficiency.
Figure 13.
Relationship between factor levels and performance indicators: (a) water head reduction, (b) efficiency.
Figure 13.
Relationship between factor levels and performance indicators: (a) water head reduction, (b) efficiency.
Figure 14.
The performance of the hydro turbine before and after the orthogonal optimization: (a) output power, (b) water head reduction, and (c) efficiency.
Figure 14.
The performance of the hydro turbine before and after the orthogonal optimization: (a) output power, (b) water head reduction, and (c) efficiency.
Figure 15.
Different stretch lengths and tilt angles: (a) output power, (b) water head reduction, and (c) efficiency.
Figure 15.
Different stretch lengths and tilt angles: (a) output power, (b) water head reduction, and (c) efficiency.
Figure 16.
The performance of the hydro turbine before and after the tongue optimization: (a) output power, (b) water head reduction, (c) efficiency.
Figure 16.
The performance of the hydro turbine before and after the tongue optimization: (a) output power, (b) water head reduction, (c) efficiency.
Table 1.
Different factors and levels.
Table 1.
Different factors and levels.
| Levels | Factor |
|---|
| A | B | C |
|---|
| Outlet Width (mm) | Inlet Diameter (mm) | Inlet Height (mm) |
|---|
| 1 | 6.25 | 22 | 120 |
| 2 | 7.5 | 25 | 130 |
| 3 | 8.75 | 28 | 140 |
| 4 | 10 | 30 | 150 |
Table 2.
Different volute models.
Table 2.
Different volute models.
| Number | Stretch Length (mm) | Tilt Angle () |
|---|
| 1 | 4 | −8 |
| 2 | 4 | −4 |
| 3 | 4 | 0 |
| 4 | 4 | 4 |
| 5 | 4 | 8 |
| 6 | 4 | 12 |
| 7 | 4 | 16 |
| 8 | 4 | 20 |
| 9 | 4 | 24 |
| 10 | 8 | −8 |
| 11 | 8 | −4 |
| 12 | 8 | 0 |
| 13 | 8 | 4 |
| 14 | 8 | 8 |
Table 3.
Trial schemes and simulation results for the design condition.
Table 3.
Trial schemes and simulation results for the design condition.
| Number | Factor | Water Head Reduction (m) | Efficiency (%) |
|---|
| A | B | C |
|---|
| 1 | 4(10) | 2(25) | 3(140) | 28.34 | 21.26 |
| 2 | 2(7.5) | 4(30) | 1(120) | 25.55 | 21.49 |
| 3 | 2(7.5) | 3(28) | 4(150) | 31.56 | 22.29 |
| 4 | 3(8.75) | 1(22) | 4(150) | 32.27 | 21.55 |
| 5 | 2(7.5) | 1(22) | 3(140) | 31.49 | 22.16 |
| 6 | 1(6.25) | 4(30) | 3(140) | 29.32 | 22.63 |
| 7 | 3(8.75) | 3(28) | 3(140) | 28.01 | 21.91 |
| 8 | 1(6.25) | 2(25) | 4(150) | 32.62 | 22.26 |
| 9 | 3(8.75) | 2(25) | 1(120) | 25.72 | 20.54 |
| 10 | 4(10) | 3(28) | 1(120) | 24.89 | 20.25 |
| 11 | 1(6.25) | 3(28) | 2(130) | 27.13 | 23.10 |
| 12 | 3(8.75) | 4(30) | 2(130) | 25.67 | 21.99 |
| 13 | 4(10) | 1(22) | 2(130) | 27.44 | 21.10 |
| 14 | 4(10) | 4(30) | 4(150) | 29.06 | 21.58 |
| 15 | 2(7.5) | 2(25) | 2(130) | 27.82 | 22.81 |
| 16 | 1(6.25) | 1(22) | 1(120) | 27.04 | 22.18 |
Table 4.
The performance of the optimization model at the design condition.
Table 4.
The performance of the optimization model at the design condition.
| Outlet Width (mm) | Inlet Diameter (mm) | Inlet Height (mm) | Water Head Reduction (m) | Efficiency (%) |
|---|
| 6.25 | 30 | 130 | 26.74 | 23.14 |
| Disclaimer/Publisher’s Note: The statements, opinions and data contained in all publications are solely those of the individual author(s) and contributor(s) and not of MDPI and/or the editor(s). MDPI and/or the editor(s) disclaim responsibility for any injury to people or property resulting from any ideas, methods, instructions or products referred to in the content. |
© 2024 by the authors. Licensee MDPI, Basel, Switzerland. This article is an open access article distributed under the terms and conditions of the Creative Commons Attribution (CC BY) license (https://creativecommons.org/licenses/by/4.0/).
