1. Introduction
Water-soluble mining for underground salt rock has been practiced for many years [
1]. Water-soluble mining utilizes the solubility of salt deposits in water, employing a method where freshwater is injected through boreholes or mine shafts to dissolve the valuable components of underground deposits. The resultant solution is then extracted to the surface for processing [
2].The control over the formation and movement of dissolution cavities proves challenging, often leading to significant calamities in mining regions, including surface brine outbreaks, subsidence, and collapses [
3,
4]. As the duration of mining activities extends, the frequency of extensive surface subsidence incidents has increased [
5,
6,
7]. Research into the mechanisms behind surface subsidence in salt mining areas has yielded insightful conclusions [
8,
9,
10,
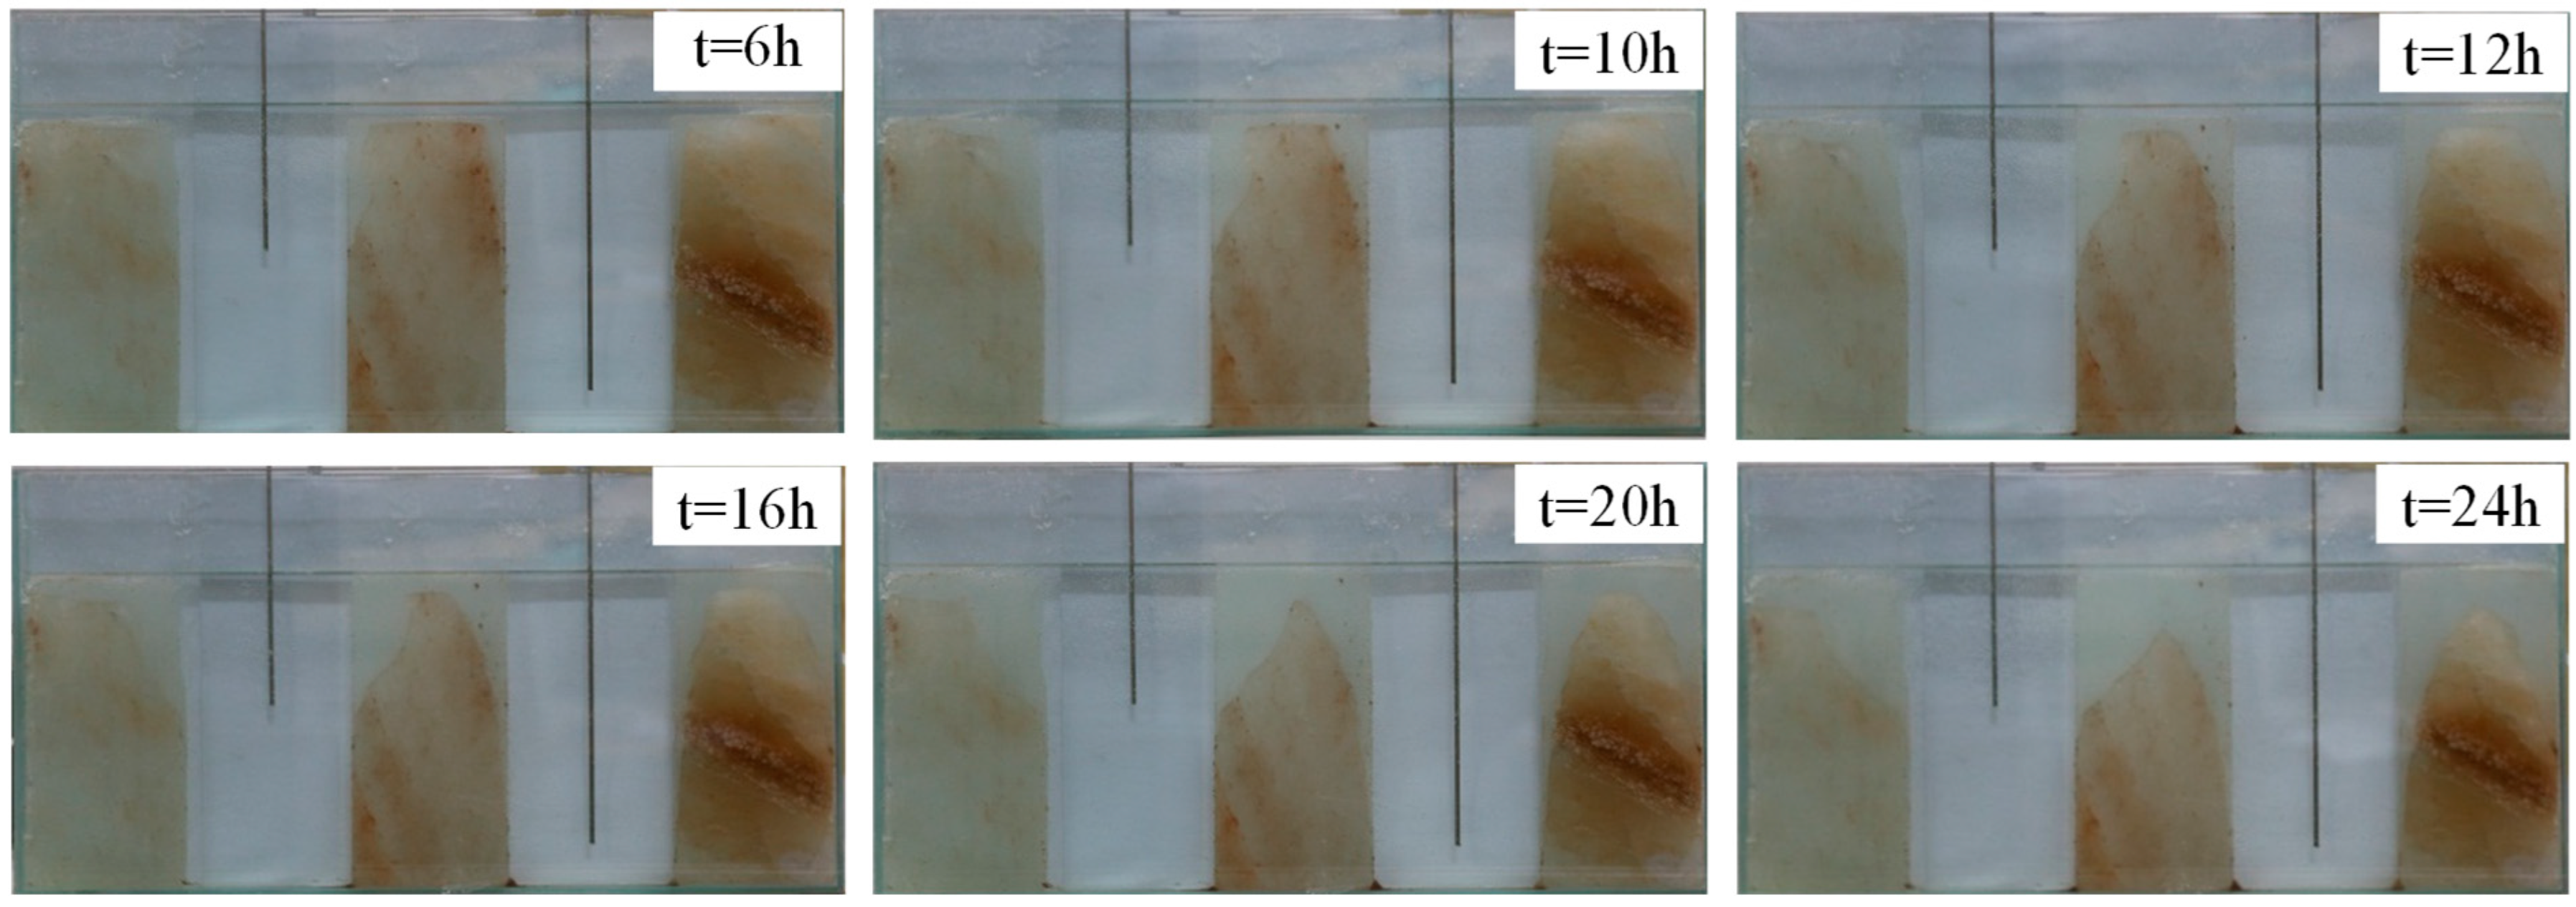
11]. The extraction of salt rock results in the gradual enlargement of underground dissolution cavities, occasionally evolving into a network of interconnected cavities across wells. Such mining-induced subsidence adversely impacts and damages both subterranean and surface structures, culminating in urban collapses that bear considerable economic costs and potentially human casualties. Furthermore, the ascent and spread of brine from salt rock disrupt the hydrological balance, leading to soil salinization and extensive ecological damage, as depicted in
Figure 1.
Numerous scholars have achieved significant research results regarding the stability and failure mechanisms of dissolution cavity roofs [
12,
13,
14]. They have also conducted studies on the mechanism of surface subsidence calamities induced by mining activities in salt rock areas.
Liu et al. utilized two-dimensional seismic exploration technology to study the underground structure of the salt mine area to predict and analyze salt mine collapse incidents [
15]. Luo et al. discussed preventive methods for subsidence over mined-out areas during the mining process and proposed effective measures such as rational mining sequence and the use of fill materials to stabilize mined-out areas to reduce the risk of collapse [
16]. Le et al. revealed key factors causing ground subsidence through detailed analysis of geological structures and mining activities and proposed corresponding preventive measures [
17]. Jones et al. effectively predicted and monitored ground subsidence events using radar interferometry, providing an important monitoring method for the prevention of geological disasters [
18]. Zhang et al. proposed a ground subsidence prediction model, detailing and analyzing various factors affecting subsidence [
19,
20]. Liu et al. studied the subsidence and deformation patterns of the overburden above rock salt cavities, analyzed factors affecting stability, and revealed the response characteristics and stability failure mechanisms of the overburden during mining [
21,
22,
23]. Li et al. used viscoelastic models and the Mogi model to study surface subsidence caused by underground salt cavern storage and successfully applied these to real case analyses to assess and predict subsidence behavior [
24,
25]. Ren et al. applied the probabilistic integral method in a three-dimensional predictive model for stratified transfer of subsidence under complex mining conditions, specifically for studying surface subsidence caused by water-soluble mining in salt rocks, enabling detailed analysis of the stratified impact of different mining activities on surface subsidence [
26,
27].
Yang et al. summarized three mechanisms of salt mine collapse through experimental research, numerical experiments, and the construction of subsidence models [
28]. Qiu conducted a study on the stability and instability conditions of the roof of dissolution cavities, as well as instability estimation, using the Dongxing salt mine in Dingyuan County, Anhui Province, as an example [
29]. Xiao et al. studied the mechanism of surface subsidence in the Yunying Basin salt rock deposit, using an erosion–gravity subsidence–compaction model [
30]. Dong et al. conducted a correlation analysis of the impact of surface subsidence using the Pearson correlation coefficient method and verified the reliability of this method [
31]. Zhu et al. mitigated surface subsidence by analyzing monitoring data and appropriately optimizing feedback information from monitoring [
32]. Peck, through the study of numerous cases of surface subsidence caused by subway tunnel construction, established data models and summarized the formation mechanism of surface subsidence troughs [
33].
Due to the operation of the Guangzhou Metro Line 3 North Extension Segment situated on the western side of the Longgui Salt Mine area, there was an urgent need to investigate the mechanism of surface subsidence induced by hydrological connectivity within the Longgui Salt Mine of Guangzhou. Significant surface subsidence, characterized by rapid subsidence rates and primarily manifested through the deformation of shallow foundations such as ground or pavement cracking and wall fissures, was observed during the mining operations. Monitoring data have revealed that both the rate and total amount of surface subsidence in the mining area have reached relatively high levels. Through the collection of geological, hydrological, and mining data [
34,
35,
36,
37], alongside the execution of safety surveys and assessments to evaluate the integrity of brine well casings and understand the sealing status, this research aimed to delineate the independence of salt cavities and to explore the hydraulic connections between the salt cavities and the overlying aquifers, thereby laying a foundation for predicting subsidence.
With the increasing exploitation of salt rock resources, the research on land subsidence and the prediction of salt cavern space becomes more and more urgent. Due to the particularity of water-soluble mining, the exploration of underground space and the settlement of the ground are uncertain, which also has a significant impact on the safety of surrounding buildings, railways, highways, etc. Therefore, it is of great significance to carry out relevant research.
2. Engineering Geology of the Mining Area
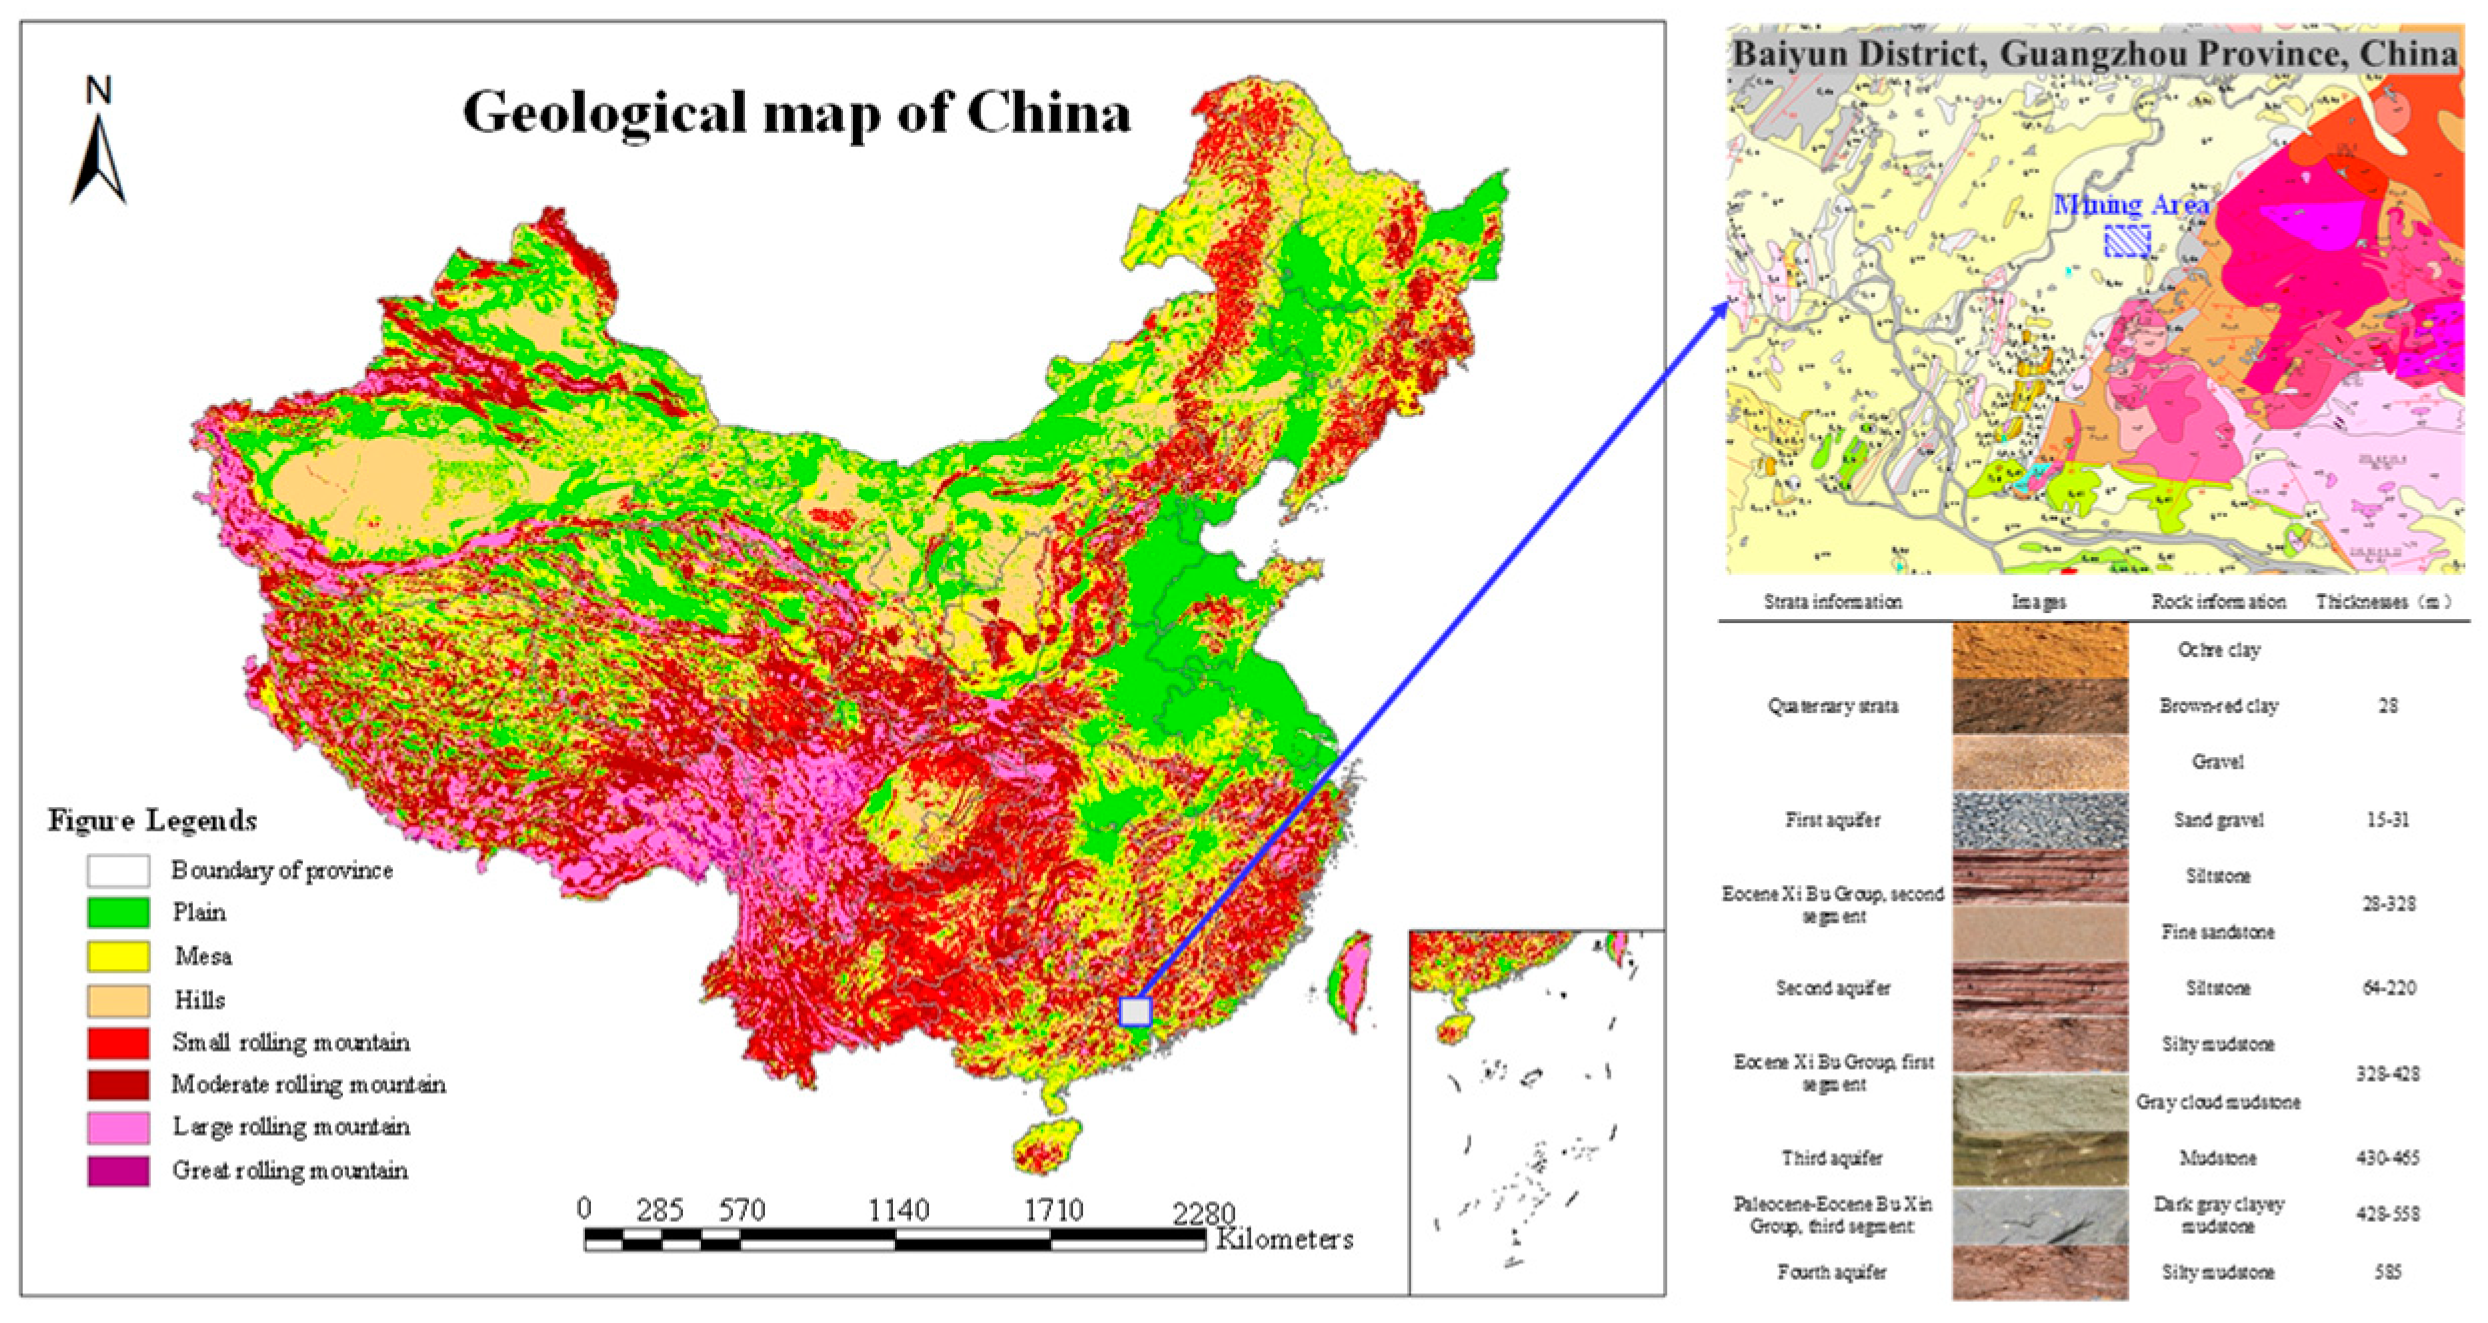
The Longgui nitrate salt mine, situated approximately 18 km from the northern outskirts of Guangzhou, is depicted in
Figure 2. The mine extends in the northeast direction, spanning 5.95 km in length and 2.25 km in width, encompassing an area close to 9 km
2. The salt-bearing sections vary in thickness from 50 to 150 m, topped by salt-solution mud conglomerates from different stratigraphic levels. Utilizing water-soluble techniques, the mine targets rock salt and co-occurring anhydrous sodium nitrate between 470 and 575 m in elevation, over a 2.35 km
2 distribution area. Two decades of mining have culminated in the formation of underground cavities totaling a volume of 909 × 10
4 m
3.
Classified as ancient inland lake facies deposits, the salt mine predominantly featured sodium sulfate-type rock salt, consisting mainly of mudstone, siltstone, and their interlayers. Rock salt deposits were primarily located in the southern depression, referred to as the southern mining section; distribution in the northern depression was also noted, known as the northern mining section. Eight salt-bearing layers developed within the mine included five halite layers and three anhydrous sodium sulfate layers.
Salt layers, appearing stratified and pseudo-stratified, were deposited in the third segment of the Lower Tertiary Bu Xin Group. “Saddle”-shaped halite layers in the southern mining section were distributed east–west, generally extending in a northeast direction. The thickness at the center of the southern concavity can reach up to 196 m, while the thinnest part between the southern and northern depressions is merely 9 m.
Mainly composed of Lower Tertiary strata, the region of the Longgui nitrate mine was covered by Quaternary strata. The horizontal inclination of the strata is 0°. Through geological exploration drilling, stratigraphy from top to bottom in the area was revealed as follows:
For the Quaternary strata, approximately 28 m thick, the top was composed of ochre clay, grayish-white medium to coarse sand, and gravel; the upper middle part included brownish-red to ochre gravelly clay; and the lower part featured grayish-white intermixed with ochre clay-rich coarse sand and gravel.
Lower Tertiary strata included the following:
The Eocene Xi Bu Group second segment was approximately 300 m thick, with its upper part made of brownish-red and grayish-brown clayey, containing gray fine sandstone, medium sandstone, and siltstone, interbedded with grayish-white coarse sandstone, medium sandstone, and fine sandstone containing gravel. The lower part consisted of reddish-brown and grayish-brown clayey siltstone, and brownish-gray and grayish-brown clayey fine sandstone and siltstone.
The Eocene Xi Bu Group first segment was approximately 100 m thick; the upper part is silty mudstone. The lower part is dark gray mudstone, and the lower part is gray cloud mudstone.
The Paleocene–Eocene Bu Xin Group third segment was approximately 130 m thick, with its upper part made up of dark gray clayey mudstone. Mudstone, purer and finer, was soft and contained clay, with very fine horizontal lamination. At well depths of 465–480 m, the formation consisted of dark gray clayey conglomerate mudstone. The lower part of the well, from 480 to 550 m, was a concentrated well section of the salt layer. Salt layers appeared intercalated with grayish-black clayey mudstone.
Within the range of the mine, no large bodies of surface water were present; rock layers of the deposit exhibited weak water-bearing properties, with four aquifers identified from top to bottom. The first aquifer consisted of a Quaternary surficial granular aquifer, with a thickness of 15 to 31 m. The second aquifer was the upper part of the Xi Bu Group second segment fractured sandstones, buried at depths of 1.7 to 233.64 m and thickness ranging from 64 to 220 m. The third aquifer was close to the salt layer or directly above the salt layer, composed of the upper part of the Bu Xin Group third segment mudstone, fractured mudstone, and clayey mudstone, forming a fractured brine zone. The fourth aquifer lay beneath the basin’s base, in Permian Xiasha limestone karstic limestones, with depths generally below 585 m. Stratigraphically, two aquicludes were identified, sequentially separating the second, third, and fourth aquifers. Where the third aquifer was absent, both layers combined into a single aquiclude. The first aquiclude was located from the lower part of the Xi Bu Group second segment to the upper part of the Bu Xin Group third segment, situated between the second and third aquifers, with thicknesses ranging from 208.2 to 452.26 m. The second aquiclude stretched from the salt layer top of the Bu Xin Group third segment to the bottom of one segment, with thicknesses between 86.64 and 291.32 m.
Figure 3 depicted the distribution of the Longgui nitrate mining area and its hydrogeological map.
Characterized by numerous and irregular salt strata, the mine’s geological framework is notably delicate. Predominantly composed of five salt layers, the third aquifer, which comes into direct contact with the primary mining layer, is predominantly made up of mudstone conglomerates. Its fractured cap makes the water system exceedingly prone to connectivity. The delicate equilibrium is easily compromised under the perturbations of water-soluble mining, potentially leading to ground fissures and subsidence. Latest drilling endeavors and controlled source audio-frequency magnetotelluric (CSAMT) assessments have highlighted the third aquifer’s heightened susceptibility to collapse.
Controlled Source Audio-frequency Magnetotellurics (CSAMT) stations were positioned near the subsidence center of Area I, penetrating wells 1, 3, and 5 [
38,
39,
40]. In CSAMT, the L44 line results showed a large-scale low-resistance area within the 300–500 m range, speculated to be caused by the infiltration of brine into cavities and the diffusion of low-concentration brine within aquifers following the collapse of certain aquicludes and water-bearing layers.
Recent borehole findings revealed significant fracture zones commencing around 460 m in the ZK-6 well within the Longgui nitrate salt-mining vicinity. The interpreted CSAMT results and core retrieval at this depth, as illustrated in
Figure 4, precisely align with the third aquifer’s domain. The extraction and analysis of cores infer the extensive development of macroscopic fractures within the third aquifer and its notably poor mechanical integrity. As the salt cavities reach the ceiling, this aquifer could emerge as a primary conduit for brine proliferation, significantly raising the odds of extensive collapse.
4. Analysis of Settlement Law in Mining Area
4.1. Establishment of Three-Dimensional Numerical Model
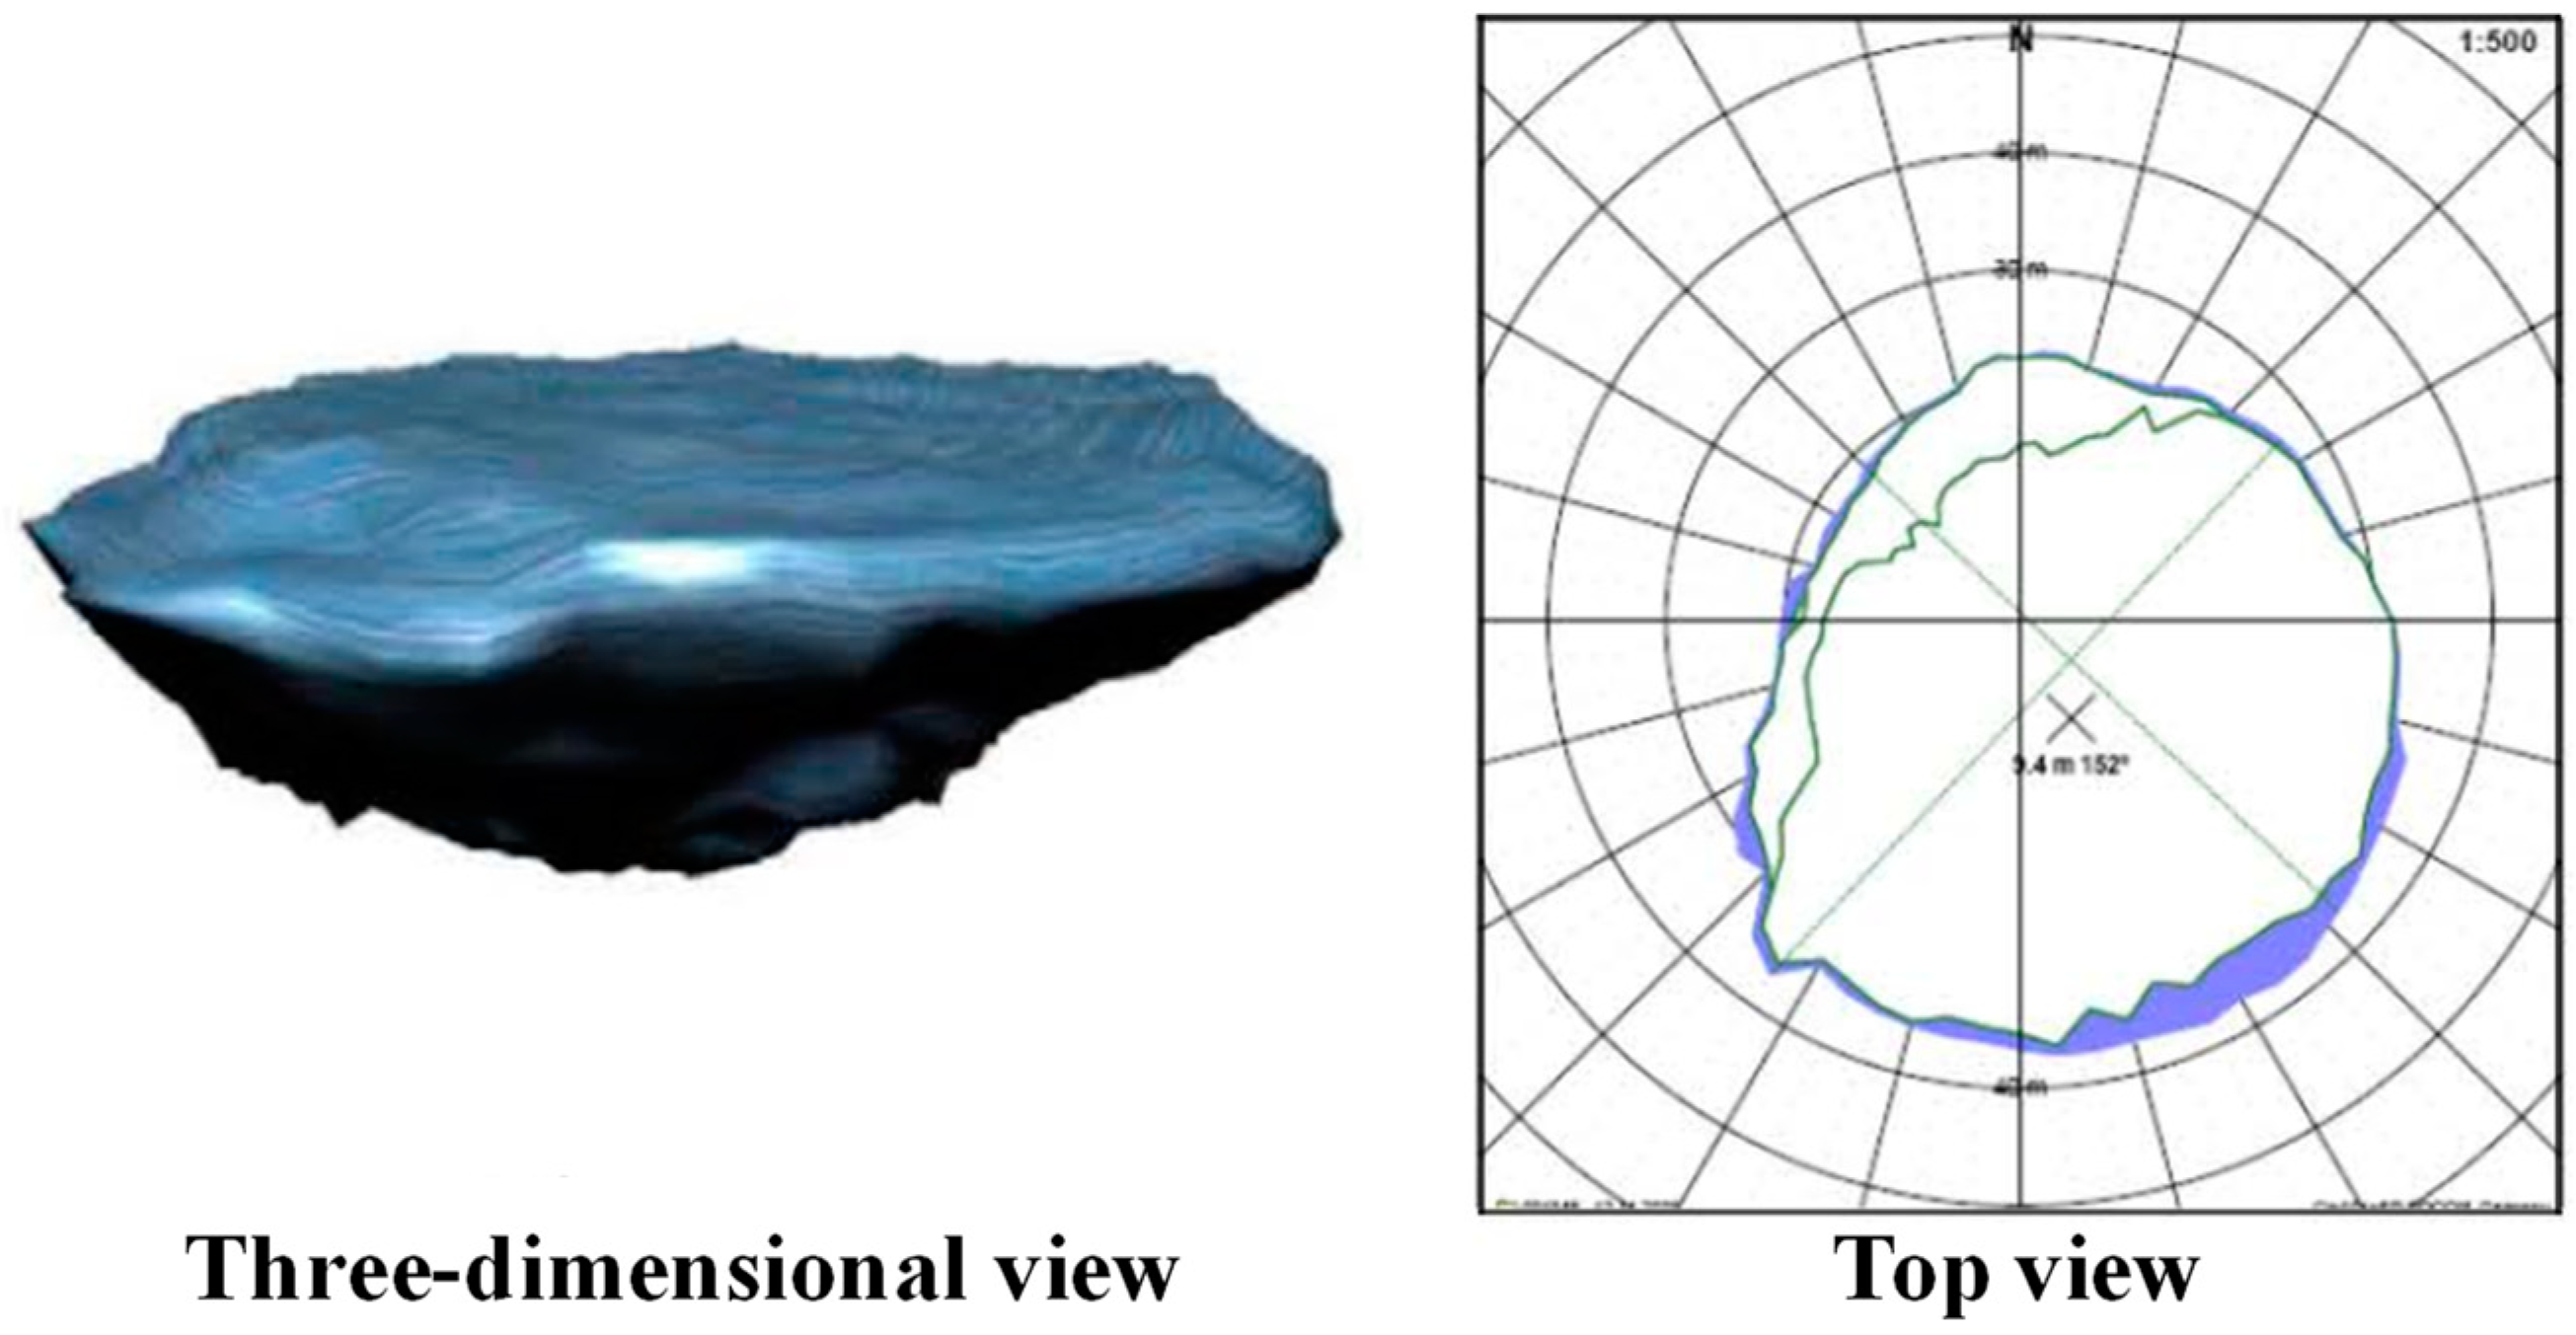
In the Guangdong Nonferrous Engineering Survey and Design Institute, “Surface Deformation Monitoring Report of Ground collapse Danger Zone in Longgui Nitro Salt Mine (Goaf), Guangzhou”. Based on sonar cavity survey data, employing an oil cushion to mitigate upward dissolution was found to shape the salt cavities into a three-dimensional form, as depicted in
Figure 7. Similarly, the caprock of the Longgui nitrate salt mine has been observed to inhibit upward dissolution, with salt cavities expanding extensively laterally at the interface between mudstone and salt rock, resulting in a similar three-dimensional shape.
Hence, informed by sonar survey data and insights from “small cavities merging into large ones” dissolution simulation experiments, the cavities were modeled as inverted cones. The dimensions and height of these cavities were meticulously modeled to match the mined volume within each well group and the thickness of the extracted salt layers.
Utilizing the engineering geological conditions of the region, a finite element three-dimensional analysis model for the salt cavity clusters within the Longgui nitrate salt mine area was developed using ANSYS 18.0 software. The model utilized tetrahedral elements, with the salt cavity and its encompassing strata meshed through ANSYS’s free meshing technique. To accurately analyze deformation around the cavities, the mesh density was increased in their vicinity. For strata not containing cavities, a mapped meshing technique employing hexahedral elements was used. The model was then imported into FLAC3D for computational analysis via interface software. This numerical simulation’s three-dimensional geological model was constructed based on aquifer and aquiclude characteristics, simplified and synthesized as necessary. The computational model for this three-dimensional analysis, encapsulated within a rectangular prism of 2300 m length, 1400 m width, and 764 m height, had its top at an elevation of 0 m and its base at −764 m.
Considering that the numerical model established in this simulation is very large, and that the thin, muddy interlayer in the salt layer has limited influence on the inversion and prediction of the overall settlement but has a great influence on the calculation accuracy of the numerical simulation, and only the mudstone interlayer in the salt layer is generalized in the adjacent salt layer in the calculation process.
Due to the small formation dip, all the models are simplified to horizontal formation, so the formation dip is set to 0° in this simulation. So the horizontal ground stress is as follows:
In the formula, σH and σh are two horizontal ground stresses; σv is the vertical ground stress; and λ is the coefficient of side pressure.
Considering that salt rock is in the plastic flow state, the initial geostress field of the calculation model adopts the triaxial isobaric gravity stress field.
The elastoplastic constitutive model is calculated using the classical molar Coulomb strength theory. Assuming that the compressive stress is negative, the yield function of the Moore–Coulomb strength condition is as follows:
In the formula, , c is the cohesive force, and is the friction angle.
The tensile failure yield function is as follows:
In the formula, σt is the formation of tensile strength.
For the constitutive model of salt rock creep, most of its constitutive equations are based on the creep mechanism of metal materials combined with its form to study the creep mechanism of salt rock, and it is found that the stable creep strain rate constitutive equation of salt rock is a power function of the stress deflection acting on salt rock. The creep strain rate constitutive equation of the stable creep stage can be expressed as follows:
Given the drag on nitrate mining strata previously measured, limited rock mechanics parameters cannot meet the settlement calculation in the region, so the parameter inversion of the subsidence is mainly based on China’s other conditions similar to the empirical parameters of salt mine area, for example, the Jintan salt mine and the Huaian salt mine. With the empirical parameters of the above two salt mines as the original parameters and the monitoring data of ground subsidence over the past years as the core basis, the settlement results were calculated and adjusted many times, so as to approximate the real state of ground subsidence in the reverse performance of the Longgui salt mine, as shown in
Table 1.
The XY plane served as the horizontal plane of the model’s coordinate system, with the vertical direction aligned along the
Z-axis [
41]. The bottom surface of the prism was constrained in the Z direction to simulate support, while the four longitudinal faces were subjected to simply supported constraints against normal movement, essentially treating the exterior geological bodies as rigid, immovable entities. The three-dimensional geological model of the Longgui nitrate-salt mine area can be seen in
Figure 8.
During the period from 1993 to 2005, when the mine was largely in an aggregate mining phase, and by the end of 2005, when all mining operations had ceased, a single-phase excavation approach was adopted for wells 1–7. However, as large-scale mining progressed into the secondary mining area, the pattern of surface subsidence became increasingly complex and uneven. The single-phase excavation method no longer sufficed for the nuanced needs of subsequent inversion analyses. Consequently, a stratified excavation approach, informed by historical brine extraction records, was necessitated for the secondary mining area to more accurately replicate the surface subsidence trends at each mining phase. This stratified approach entailed phased excavation based on each mine’s brine extraction records over various periods.
4.2. Reversal and Prediction of Subsidence Patterns in Mining Areas
Monitoring data from the “Guangzhou Baiyun District Longgui Nitrate Salt Mine Surface Subsidence Investigation and Monitoring Report” indicate that between 1993 and 2002, subsidence in the mining area was minimal [
42], with the maximum recorded subsidence being 51 mm. After 2003, coinciding with the commencement of large-scale mining in Mining Area II, subsidence in Mining Area I significantly accelerated. This acceleration persisted even after mining in Area I ceased in 2005. The year 2003 marked a pivotal point where the subsidence rate in Mining Area I surged, indicating a broader intensification of subsidence across the mining region.
From 2010 onwards, subsidence in Mining Area II began to notably accelerate. Between 2010 and 2012, subsidence rates at several monitoring points increased from 1–4 mm/year to 97–127.5 mm/year. Furthermore, in 2014 and 2015, the subsidence rates at a monitoring point located at the subsidence epicenter soared to 329.9 mm/year and 320.7 mm/year, respectively. This rapid surface subsidence around the wellheads strongly suggests extensive deformation of the salt cavities. The onset of noticeable acceleration and significantly higher subsidence rates in Mining Area II, compared to Area I, followed the collapse of wellhead roofs in wells 15, 16, 17, and adjacent well groups in 2011. By 2016, the Longgui nitrate salt-mining area ceased all operations. Post-closure monitoring data revealed that while subsidence rates in Mining Area I slightly decreased, the change was minimal. Conversely, subsidence rates in Mining Area II significantly decelerated, implying a notable increase in cavity pressure within Area II, primarily due to the cessation of brine pumping operations.
Time series graphs of subsidence monitoring points for Mining Areas I and II are presented in
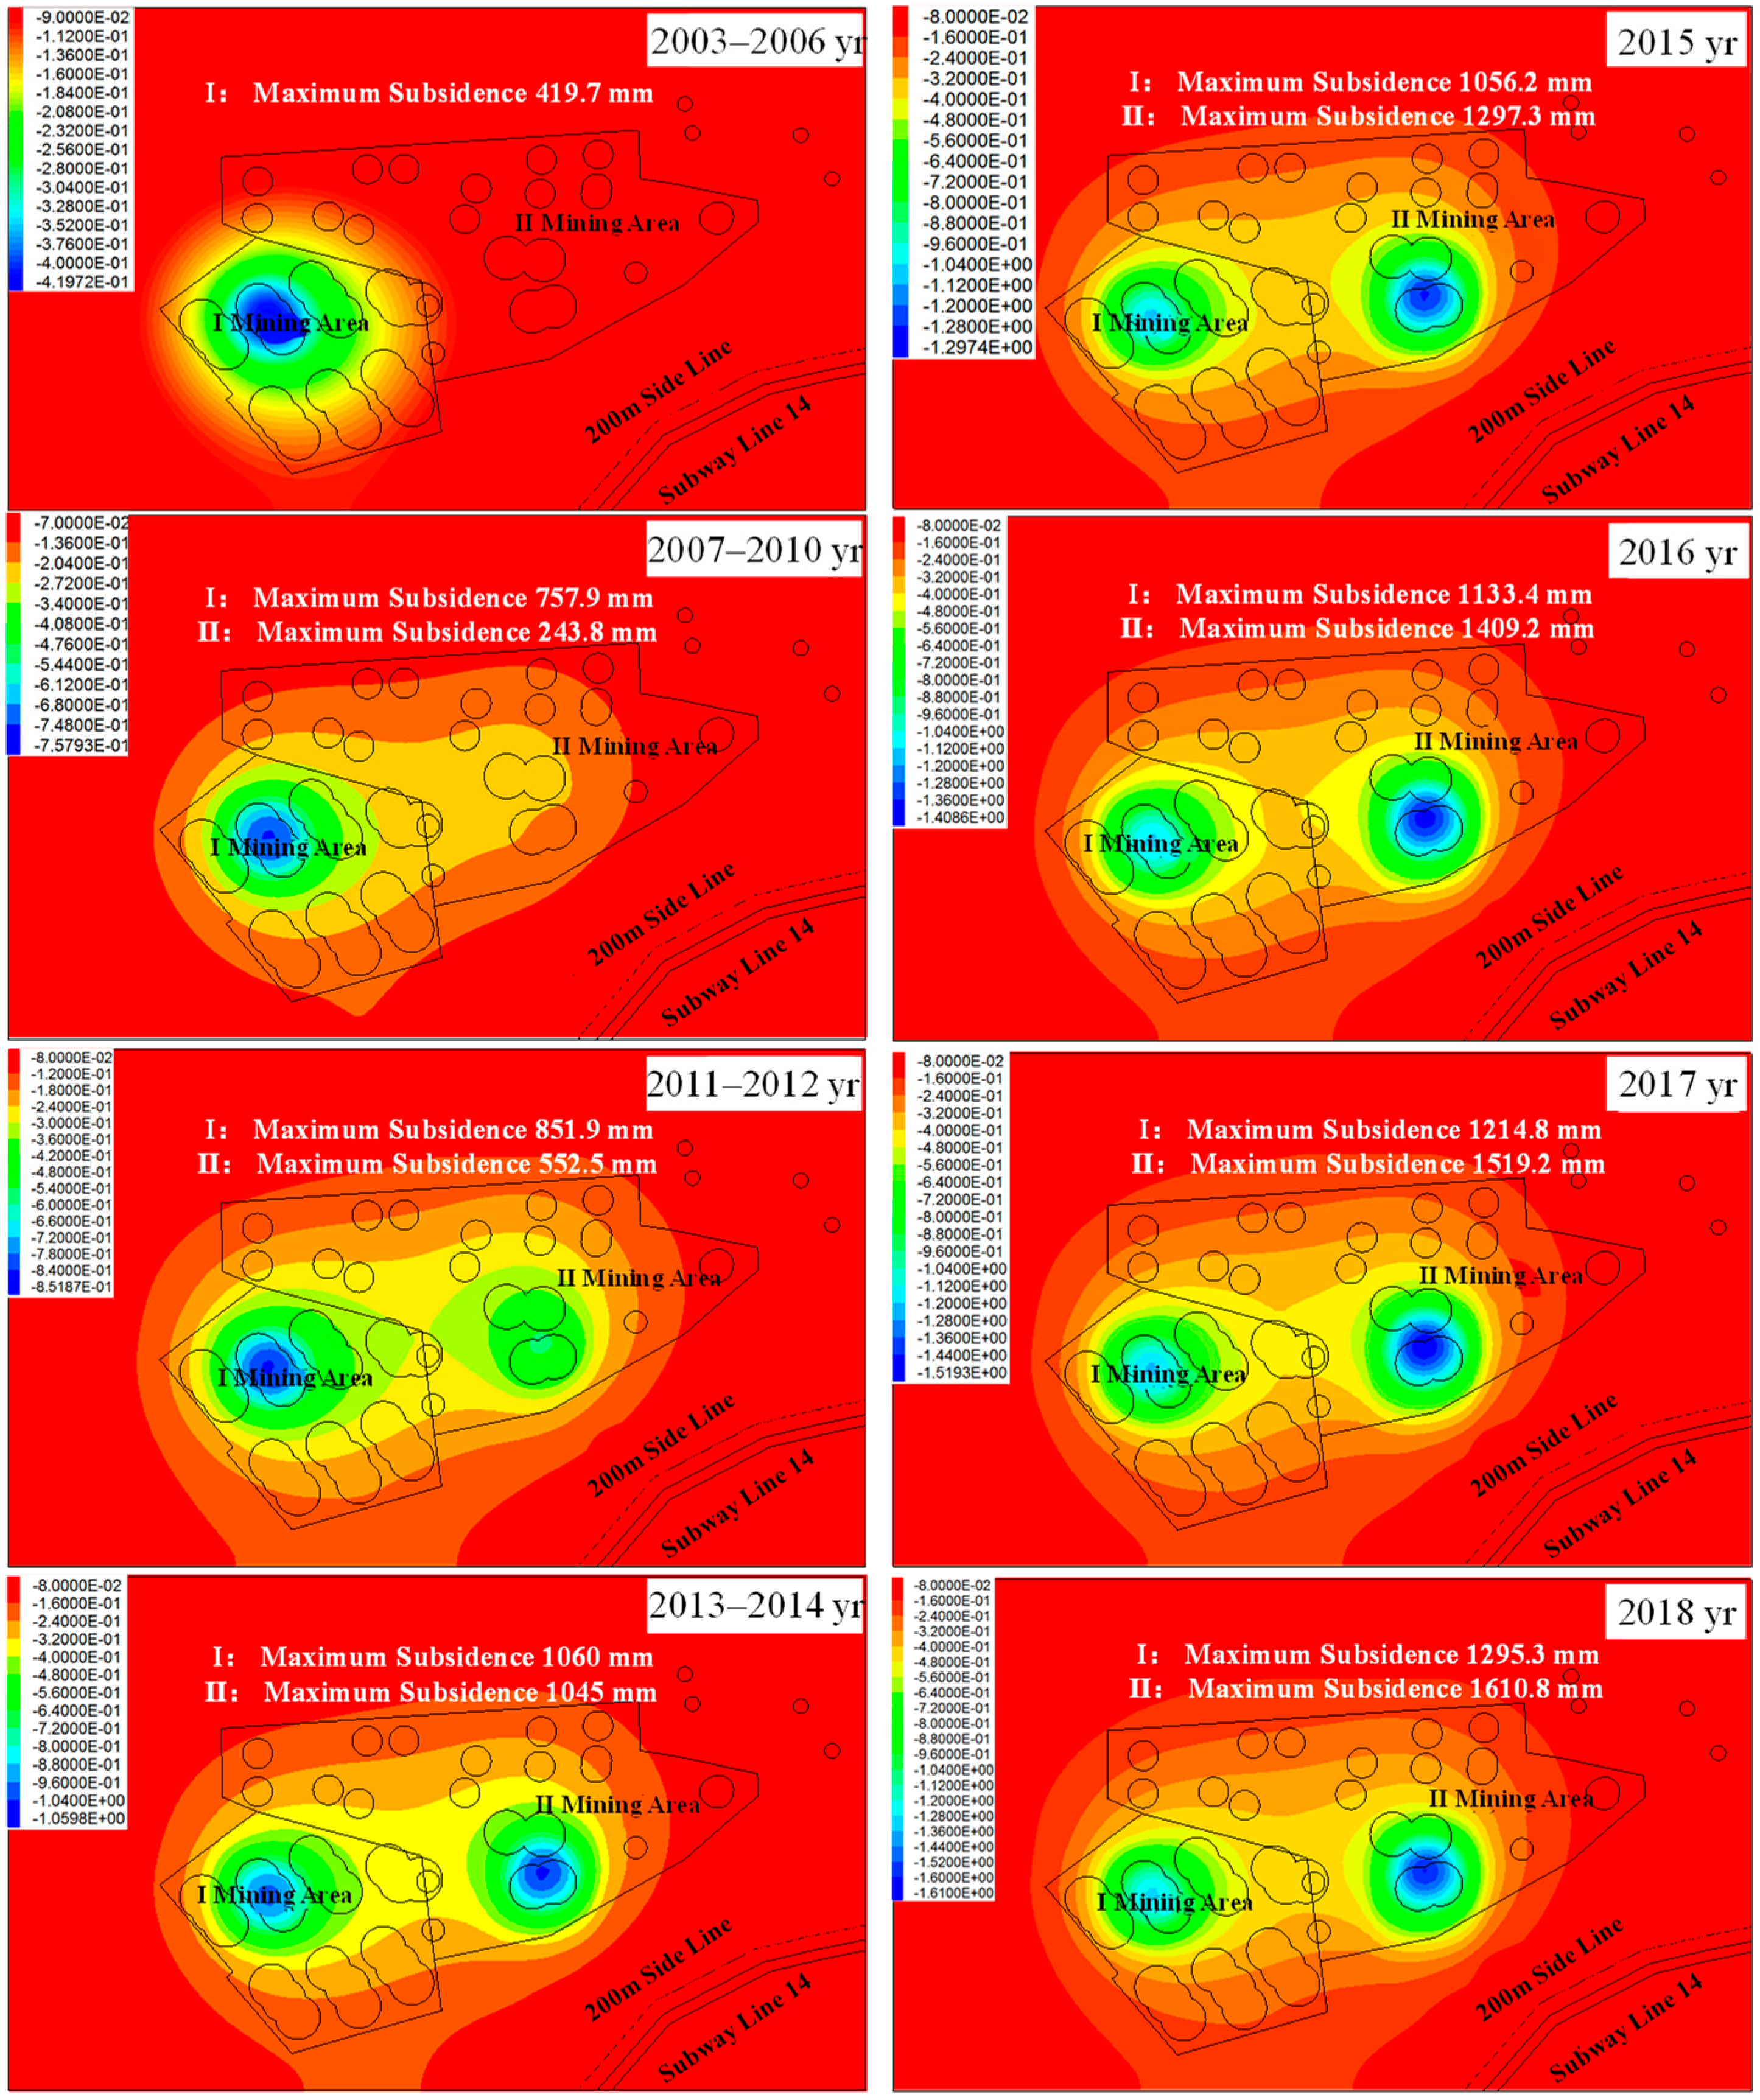
Figure 9, and surface vertical displacement cloud maps for both areas are shown in
Figure 10. It was observed that post-mining, the subsidence rate in Mining Area I remained largely unchanged, while significant reductions in subsidence rates were noted near specific monitoring points in the subsidence center of Mining Area II between 2016 and 2017. The subsidence rate at monitoring point 16-2 in Mining Area II decreased to 117 mm/year, marking a significant slowdown from the pre-cessation rate of 329.9 mm/year. Numerical inversion results confirmed this trend, showing a decrease in the subsidence rate at monitoring point 16-2 in Mining Area II to 113 mm/year, aligning with field data.
The comparison of numerical inversion results across different well groups showed consistency in subsidence center locations, maximum subsidence values, and surface subsidence data, affirming the inversion process’s validity.
Field monitoring data, extending up to 2019, have underpinned an analysis and forecast of subsidence trends from 2019 through 2025, grounded in the validated inversion approach previously delineated.
Figure 11 illustrates the temporal variation of ground surface vertical displacement across Mining Areas I and II. The data, captured in vertical displacement cloud maps, indicate that within the span from 2019 to 2025, the peak subsidence value in Mining Area I is projected to reach 1367.6 mm, while in Mining Area II, it is expected to ascend to 1879.5 mm. This signifies an increase of 72.3 mm for Area I and 268.7 mm for Area II, relative to the measurements at the close of 2018, across this six-year timeframe. The corresponding annual subsidence rates are calculated to be 12.05 mm/year for Area I and 44.78 mm/year for Area II. Despite a significant reduction in the subsidence rates in the vicinity of Wells 15, 16, and 17 within Mining Area II, post-closure, these locales continue to exhibit the highest subsidence rates across the entire mining domain.
5. Analysis of Surface Subsidence Impact on Surrounding Subways
5.1. Evaluation Indices of Surface Subsidence
Given the significance of surface subsidence on adjacent subway systems and noting the absence of specific quantitative criteria for surface subsidence within existing rail transit regulations, as well as the shortfall of standardized protocols for the geological engineering evaluation in salt mine void areas, the safety assessment for Metro Line 14 has been conducted with reference to the “Code for Investigation of Geotechnical Engineering in Coal Mine Goaf Areas”. According to the guidelines of this standard, the assessment of site stability categories is based on the evaluation of surface movement and deformation figures. Primary criteria include the rate of surface subsidence and the actual subsidence values, alongside a comprehensive consideration of additional factors as outlined in
Table 2 for a holistic determination.
The corresponding evaluation indicators are as follows:
Surface inclined deformation refers to the ratio of the relative vertical movement between adjacent points to the horizontal distance between the two adjacent points. It reflects the slope along a certain direction, usually denoted by
i. The schematic diagram of surface movement and deformation analysis is shown in
Figure 12. As shown in the figure, points 2 and 3 represent two adjacent points, with a subsidence difference of (
W3 −
W2). The inclined deformation between points 2 and 3 is calculated as follows:
In the formula, W3 and W2 represent the subsidence values of surface points 2 and 3, respectively. Positive values are taken for subsidence, and negative values are taken for uplift. l2–3 represents the horizontal distance between points 2 and 3.
Inclination can be understood as the average slope between two points. In this example, on the inclined section, the slope pointing downhill is positive, and the slope pointing uphill is negative.
- 2
Curvature Deformation
Surface curvature deformation refers to the ratio of the difference in slope between two adjacent line segments to the horizontal distance between the midpoints of the two line segments. It reflects the degree of curvature on the cross-section of the observation line.
The three adjacent measurement points, 2, 3, and 4, as depicted in
Figure 12, form two line segments, 2–3 and 3–4. According to Equation (1), the inclination values
i2–3 and
i3–4 are, respectively, calculated for these segments. However, the inequality
l2–3 ≠
l3–4 causes the surface to bend, resulting in curvature deformation. Curvature is expressed in
K as follows:
In the formula, i2–3 and i3–4, respectively, represent the average slope between points 2 and 3 and between points 3 and 4 on the surface; l2–3 and l3–4 represent the horizontal distance between points 2–3 and 3–4, respectively.
Curvature can be positive or negative. In this case, on the subsidence curve, convex upward is considered positive, while concave downward is considered negative.
- 3
Horizontal deformation
Horizontal deformation refers to the ratio of the horizontal movement difference between adjacent points to the horizontal distance between the two points. It reflects the horizontal movement difference per unit length between adjacent measurement points, known as horizontal deformation. Typically denoted by
ε, it is calculated according to the following formula:
In the formula, U3 and U2 represent the horizontal displacement values of surface points 2 and 3, respectively.
Horizontal deformation can be positive or negative. A positive value indicates stretching deformation (referred to as tension), while a negative value indicates compression deformation (referred to as compression).
5.2. Arrangement of Monitoring Points and Contour Maps of Subsidence near Monitoring Points
In light of the guidelines specified, the existence of salt mine voids adjacent to Subway Line 14 necessitates an extension of the monitoring perimeter. The instrument used in this monitoring is a total-station -type electronic tachometer. To address this, along the axis of Subway Line 14 towards Mining Area II, three sets of monitoring stations have been strategically positioned. Each set on the same cross-section is spaced 70 m apart, ensuring a comprehensive control span of 140 m. The locations of cross-sections 1–8 are depicted in
Figure 13. The spacing between the cross-sections of monitoring stations is set at 100 m. Specifically, Group C monitoring stations are precisely aligned with the axis of Subway Line 14. Progressing towards Mining Area II, Group B and Group A monitoring stations follow in succession, as illustrated in
Figure 13.
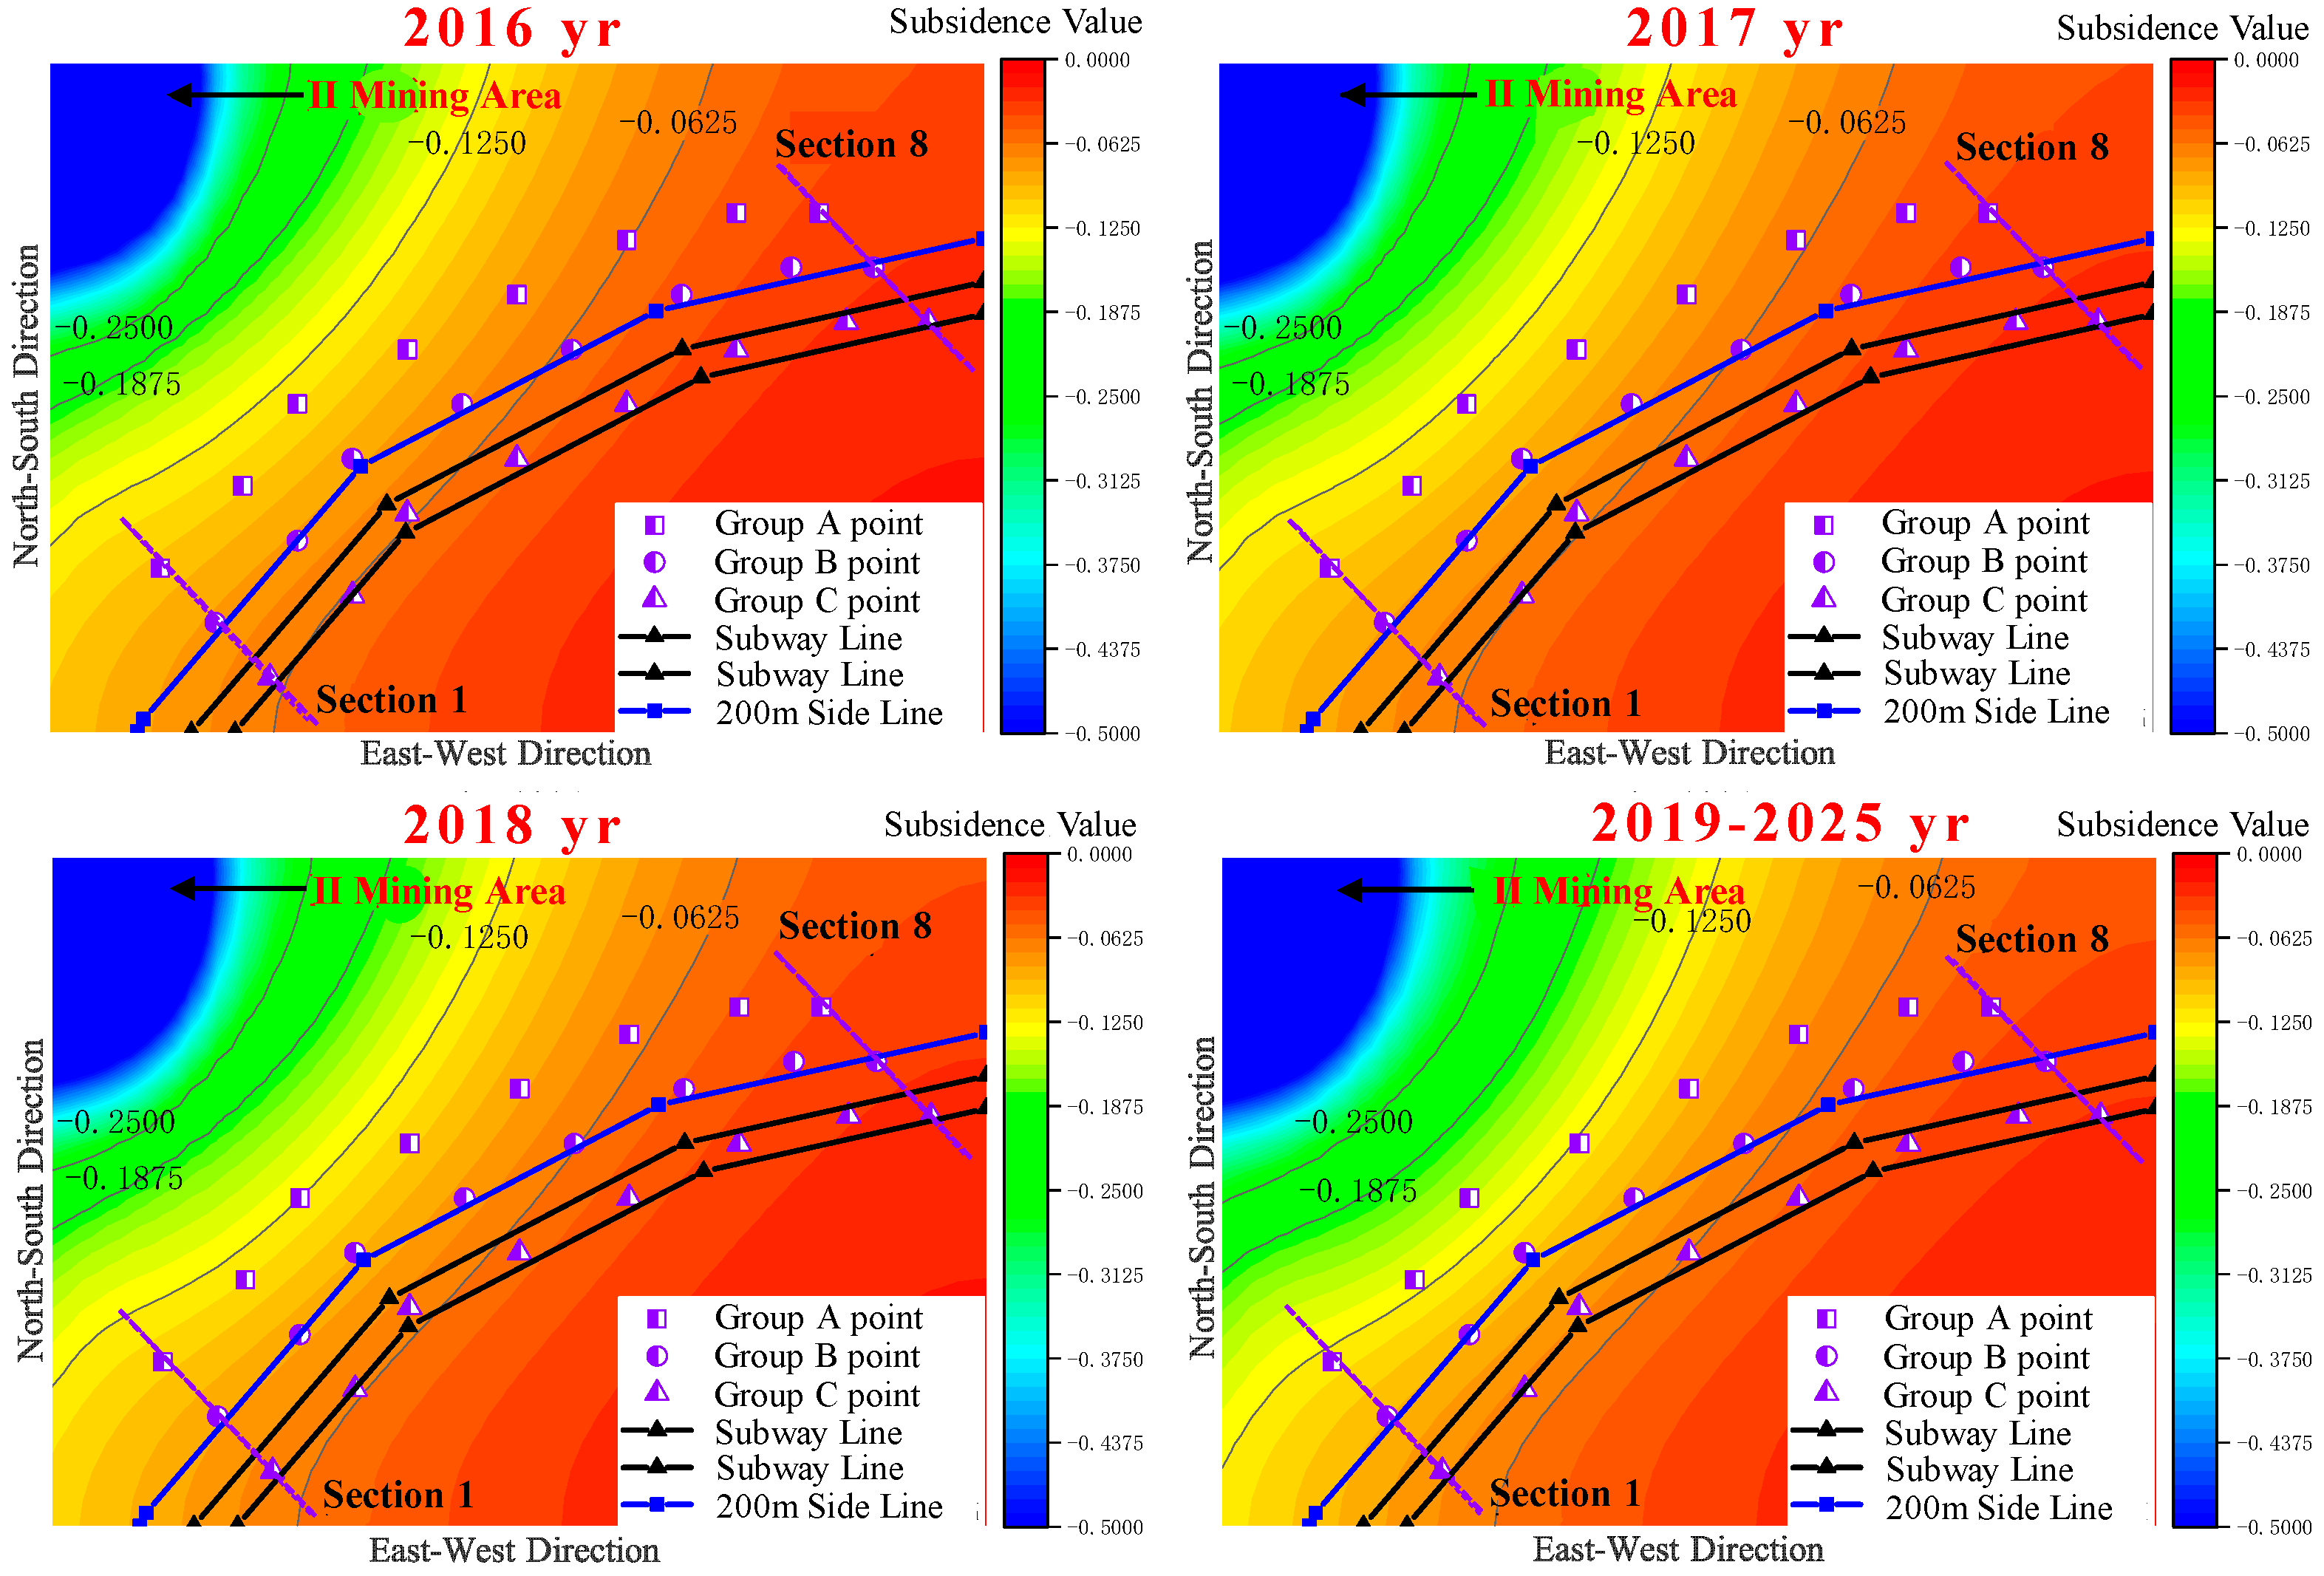
The local subsidence cloud maps near the monitoring stations of Subway Line 14 from 2016 to 2025 are presented in
Figure 14. The evolution depicted in these local subsidence cloud maps indicates an expanding influence of subsidence from Mining Area II over time, with the maximum gradient of the subsidence basin oriented in the northwest direction.
5.3. Impact Assessment of Surrounding Subways
Drawing upon the specifications outlined in the “Code for Investigation of Geotechnical Engineering in Coal Mine Goaf”, this study applies the method for evaluating site stability levels based on deformation indicators, as detailed in
Table 1. This comprehensive approach takes into account the deformation indicators of cross-sections 1–8 and monitoring points along the alignment of Subway Line 14, leading to the following assessments regarding subsidence on both the cross-sectional and longitudinal profiles of the subway:
For the cross-section of Subway Line 14, from 2016 to 2025, none of the consecutive six-month periods on cross-sections 1–8 showed cumulative subsidence values exceeding 30 mm. The average subsidence velocity (Vw) remained below 1.0 mm/day, tilt deformation (Δi) was less than 3 mm/m, and horizontal deformation (Δε) did not surpass 2 mm/m. Thus, based on these indicators, the sections were classified within the “stable” evaluation range. Nevertheless, the curvature deformation values (ΔK) across these sections almost uniformly exceeded 0.6 × 10⁻³/m, indicating an “unstable” evaluation range. The only exceptions were section 7 in 2016 and section 8 from 2016 to 2018, which fell into the “basically stable” range (0.2 × 10⁻³/m to 0.6 × 10⁻³/m). Consequently, taking a holistic view, sections 1–6 are deemed “unstable”, section 7 is “basically stable” for the year 2016 and “unstable” for the years 2017 to 2025, and section 8 transitions from “basically stable” (2016–2018) to “unstable” (2019–2025).
In terms of the alignment of Subway Line 14, a set of C-group monitoring points deployed along the subway’s trajectory from 2016 to 2025 consistently recorded cumulative subsidence values below 30 mm, with average subsidence velocities (Vw) under 1.0 mm/day, tilt deformations (Δi) beneath 3 mm/m, and horizontal deformations (Δε) lower than 2 mm/m. These measurements align with the “stable” status. However, for the period from 2016 to 2025, the curvature deformation (ΔK) between sections KC6-C7-C8 of the C-group monitoring points ranged from greater than 0.2 × 10⁻³/m to less than 0.6 × 10⁻³/m, positioning them within the “basically stable” category. Therefore, after a comprehensive analysis, the stability level along the subway’s trajectory is evaluated as “basically stable”.
6. Conclusions
1. Mining operations within the Longgui nitrate salt mine were conducted at depths ranging from 470 to 575 m, placing them squarely within the zone where subsidence calamities, including collapses induced by salt mining, frequently occur within depths of less than 500 m.
2. The underlying mechanism of surface subsidence at the Longgui nitrate salt mine has been revealed: hydraulic connections existed between adjacent salt cavities, with the upper sections of the pillars between these cavities being submerged in brackish water over prolonged periods. This led to a gradual dissolution process between the pillars and the caprock, resulting in the pillars ceasing to support the caprock. This process ultimately facilitated the transformation of smaller cavities into significantly larger ones, thereby precipitating surface subsidence.
3. An inversion and prediction of the subsidence patterns within the mining area were conducted, revealing that the positions of subsidence centers, the peak values of subsidence, and the surface subsidence data for each well group in both Mining Areas I and II closely align with the inversion results. It is estimated that by 2050, the maximum subsidence value will reach 1553 mm in Mining Area I and 2096 mm in Mining Area II. Since the volume shrinkage rate within the calculation period has not yet reached the compaction critical point, the subsidence rate after well sealing is expected to remain essentially constant. When corroborated field monitoring data, these conclusions are deemed to be well founded and reasonable.
4. Through numerical analysis, the degree to which ground subsidence in the mining area affects nearby subway systems was assessed. Despite the site’s classification as “basically stable” in terms of stability, there remains a strong recommendation for the implementation of a thorough and methodical monitoring technology strategy during subway operations. This strategy should include the establishment of a forecasting and early warning system for surface subsidence.
5. The subsidence prediction outcomes of this study represent a reasonable extrapolation based on the currently available data. The possibility of completely severing the connection between the brine in the salt cavity groups and the first and second aquifers after sealing the wells, and the potential for large-scale collapses at the tops of some salt cavities, still requires ongoing monitoring and research. This includes continuous comparisons between current and future observed subsidence and predicted values to further validate the predictive outcomes.

