Article

Ship-Forced Sediment Transport: A New Model for Propeller Jet Flow

by
Carola Colangeli
1,*,
Georgios Leftheriotis
2,
Athanassios Dimas
2 and
Maurizio Brocchini
1
1
Department of Civil Engineering, Università Politecnica delle Marche, 60127 Ancona, Italy
2
Department of Civil Engineering, University of Patras, 26500 Patras, Greece
*
Author to whom correspondence should be addressed.
Water 2024, 16(12), 1647; https://doi.org/10.3390/w16121647
Submission received: 10 April 2024 / Revised: 30 May 2024 / Accepted: 3 June 2024 / Published: 8 June 2024
(This article belongs to the Section Water Erosion and Sediment Transport)

Abstract

:
A numerical model is presented for ship-induced sediment transport, focusing on the fundamental role of propeller jet flow. The new module has been implemented in the open-source numerical model FUNWAVE in order to reproduce the effect of the propeller on sediment transport. Numerical simulations have been performed for both stationary and moving vessel cases, as well as for different values of propeller revolution speed. Numerical results are presented for the propeller-induced velocity field and the resulting morphological evolution of the seabed. Qualitative similarities are observed between the numerical results and literature experimental findings, showing the ability of the model to mimic complex morphodynamic processes induced by ship propellers. Compared to stationary vessel cases, smaller scour depths are generated in moving vessel cases. It is concluded that the effect of the propeller provides a major contribution to the mobilization and suspension of seabed sediment, and it should not be neglected in numerical models for ship-induced sediment transport.

1. Introduction

In harbour environments and navigation channels, where the ship-to-bed clearance is minimal, it is important to focus on the effects caused by the ship’s propeller jet, the traditional propulsion system for ships. The ship’s rotating propeller, generally characterized by three or more blades, provides a thrust drawing in water, accelerating and discharging it downstream, resulting in a jet/wash and causing multiple effects. First, the jet can erode the seabed, generating significant bed scour. Secondly, it enhances the resuspension and transport of sediments on the seabed, also observed by Hammack et al. [1], which can accumulate and eventually reduce the required draught for navigation and affect port functionality. In addition, if scouring occurs close to marine structures, it can also affect and compromise their stability. Therefore, for a proper harbor design, it is necessary to evaluate propeller-induced velocities on the seabed. This has been more essential in recent years due to the ever-increasing size of the ships and the requirement of more powerful propulsion systems, which potentially lead to more severe damage.
For an accurate analysis of seabed sediment dynamic processes, also over different timescales, numerical modelling represents a useful tool for port authorities and operators to guarantee operational activities and correct management of the port. An existing numerical model is that proposed by Wang et al. [2], who focused on the computation of the propeller wash-induced resuspended sediment mass at a specific area through empirical expressions and ship traffic information, making the approach, though useful, limited and difficult to apply in wide areas where ship traffic is continuous and extensive. Moreover, the contribution of wash-induced resuspended sediments is added as a source term into an uncoupled model simulation to predict far-field movements of resuspended sediments without modifying the hydrodynamics (e.g., flow velocities) or the morphological evolution of the seabed. (e.g., bed scour). Other numerical methods, like those proposed by the US Army Engineer Research and Development Center [1,3], are capable of simulating a coupled representation of both propeller wash effects and sediment transport processes, including the formulation of ship-generated bed shear stress [4] into the computational codes of sediment transport. In the work of Hammack et al. [1], both the effects induced by the bow and the propeller on the bed shear stress are considered. Their results clearly underline the primary role of the propeller, confirming the necessity to conduct deeper analyses on this contribution. Although the propeller jet sediment transport processes are coupled, these modelling efforts are still incomplete since they do not take into account the impacts of the propeller-induced momentum in the hydrodynamic computation. As a result, the sediment’s resuspension in the water column is due to ambient currents only, which present less sediment advection and dispersion than the actual propeller-induced flow field.
Recently, due to the ever-increasing computational efficiency of computers, computational fluid dynamics (CFD) have gained more traction in studying complex fluid dynamics problems. However, the application of CFD models is on a case-by-case basis, and it is recommended that the appropriate solver be chosen according to the problem to be investigated [5]. Regarding the scour induced by the propeller wash, the CFD Ansys Fluent and OpenFOAM software packages have been recently applied by researchers, the former for determining the velocities and the turbulence within the wash [6], the latter for predicting the scour depth and extent [7]. In both cases, the numerical results were in good agreement with the experimental tests and presented reduced computational costs. Srse et al. [8] numerically investigated the impact of sea traffic on the port of Koper in Slovenia, utilizing the hydrodynamic (HD) and mud transport (MT) modules of MIKE 3 FM. The dynamic ship data were first calculated using the Full Mission Bridge Simulator, and then the data were included in MIKE 3 FM. It was found that the propeller-induced jet reached velocities up to 1.5 m/s, and its intensity was affected by the propeller dimension, the revolution speed, the distance between the propeller and the bed level, and the type of ship manoeuvrer (departure or arrival). Craig et al. [9] developed a numerical model to simulate the sediment transport processes induced by ship traffic. The numerical approach included a fully coupled hydrodynamic and sediment transport model, as well as propeller-induced effects. They calibrated their model against field data of measured flow velocities and erosion depths. It was found that the incorporation of the propeller effect in the numerical model led to better representation of the sediment resuspension. Moreover, the maximum scour was affected by the rotational speed of the propeller, the power of the ship engine, and the distance between the propeller and the bed level.
The present work aims to lay the foundations for the implementation of a new module for the prediction of the ship propeller-induced sediment transport processes and the resulting bed scour in the widespread open-source model FUNWAVE, which is a fully non-linear Boussinesq wave model [10]. The specific model is a modified version of FUNWAVE, which is largely used in the literature to study sediment mobilization and transport by ships. The primary objective of the present work is to provide an additional propeller module to the FUNWAVE model in order to enable researchers to conduct an in-depth analysis of the hydro-morphodynamic phenomena occurring in port environments. Thus, it will be possible to account for wave and ship interactions, simulate multiple vessels, and evaluate propeller momentum effects on sediment transport and resuspension processes and the morphological evolution of the seabed with satisfactory accuracy and acceptable computational cost.
The rest of the paper is structured as follows. A description of the implementation of new formulae for the effect of the ship propeller is provided in Section 2, as well as an overview of the numerical setup. The most important results, which provide fundamental data for the investigation, are given in Section 3 and discussed in Section 4. Conclusions are finally provided in Section 5.

2. Materials and Methods

The main objective of the present work is to present the importance of including the impact of the propeller jet in the calculations of ship-induced sediment mobilization and transport, as well as the corresponding seabed morphological evolution. This is achieved by the implementation of a proper formulation for the propeller jet, applied to the vessel and sediment modules of FUNWAVE. Moreover, the effect of the propeller on the hydro-morphodynamics is presented and discussed.
The FUNWAVE model was initially developed by Kirby et al. [11] based on Wei et al. [12]. Recently, in 2012, Shi et al. [10] presented the FUNWAVE-TVD version, the total variation diminishing (TVD) version of the fully non-linear Boussinesq wave model. The development of the present version was due to the need for modeling surf zone-scale flow processes in a Boussinesq model framework and modelling Tsunami waves on both a global/coastal scale for prediction of coastal inundation and a basin scale for wave propagation. This version provides many theoretical and numerical improvements, including a more complete set of fully non-linear Boussinesq equations (citation), the Monotonic Upwind Scheme for Conservation Laws (MUSCL)-TVD solver with adaptive Runge–Kutta time stepping, the shock-capturing wave breaking scheme, Lagrangian tracking, and the option for parallel computation.
The effect of the propeller is modelled as an additional velocity distribution on the seabed, where the propeller is ideally located at the stern of the ship. The following subsections describe all steps of the numerical approach.
Step 1:
Definition of the ship and propeller characteristics
In FUNWAVE, ship wakes and waves are modelled as a pressure source. In particular, according to the shape of the vessel, it is possible to choose between four types of pressure source functions. Currently, the ship propeller effect in FUNWAVE is implemented only for the first type of source function, which imitates pressure disturbance. The interested reader can refer to the FUNWAVE documentation for a more detailed description [10].
Through an input file related to the vessel, it is possible to provide the ship’s characteristics, such as the location, the heading, the speed of the vessel, and the vessel’s length L, width B, and draught P. Moreover, the type of pressure function and the shape parameters are specified, which provide the submerged volume of the vessel. The propeller characteristics are added in the input file, specifying the propeller diameter D p , the revolution speed n, the dimensionless thrust coefficient C t (parameter expressing the efficiency of the propeller in converting power into thrust), and the bed clearance h p , which is the distance between the propeller axis and the seabed.
Step 2:
Computation of the efflux velocity and the propeller-induced near-bed velocity
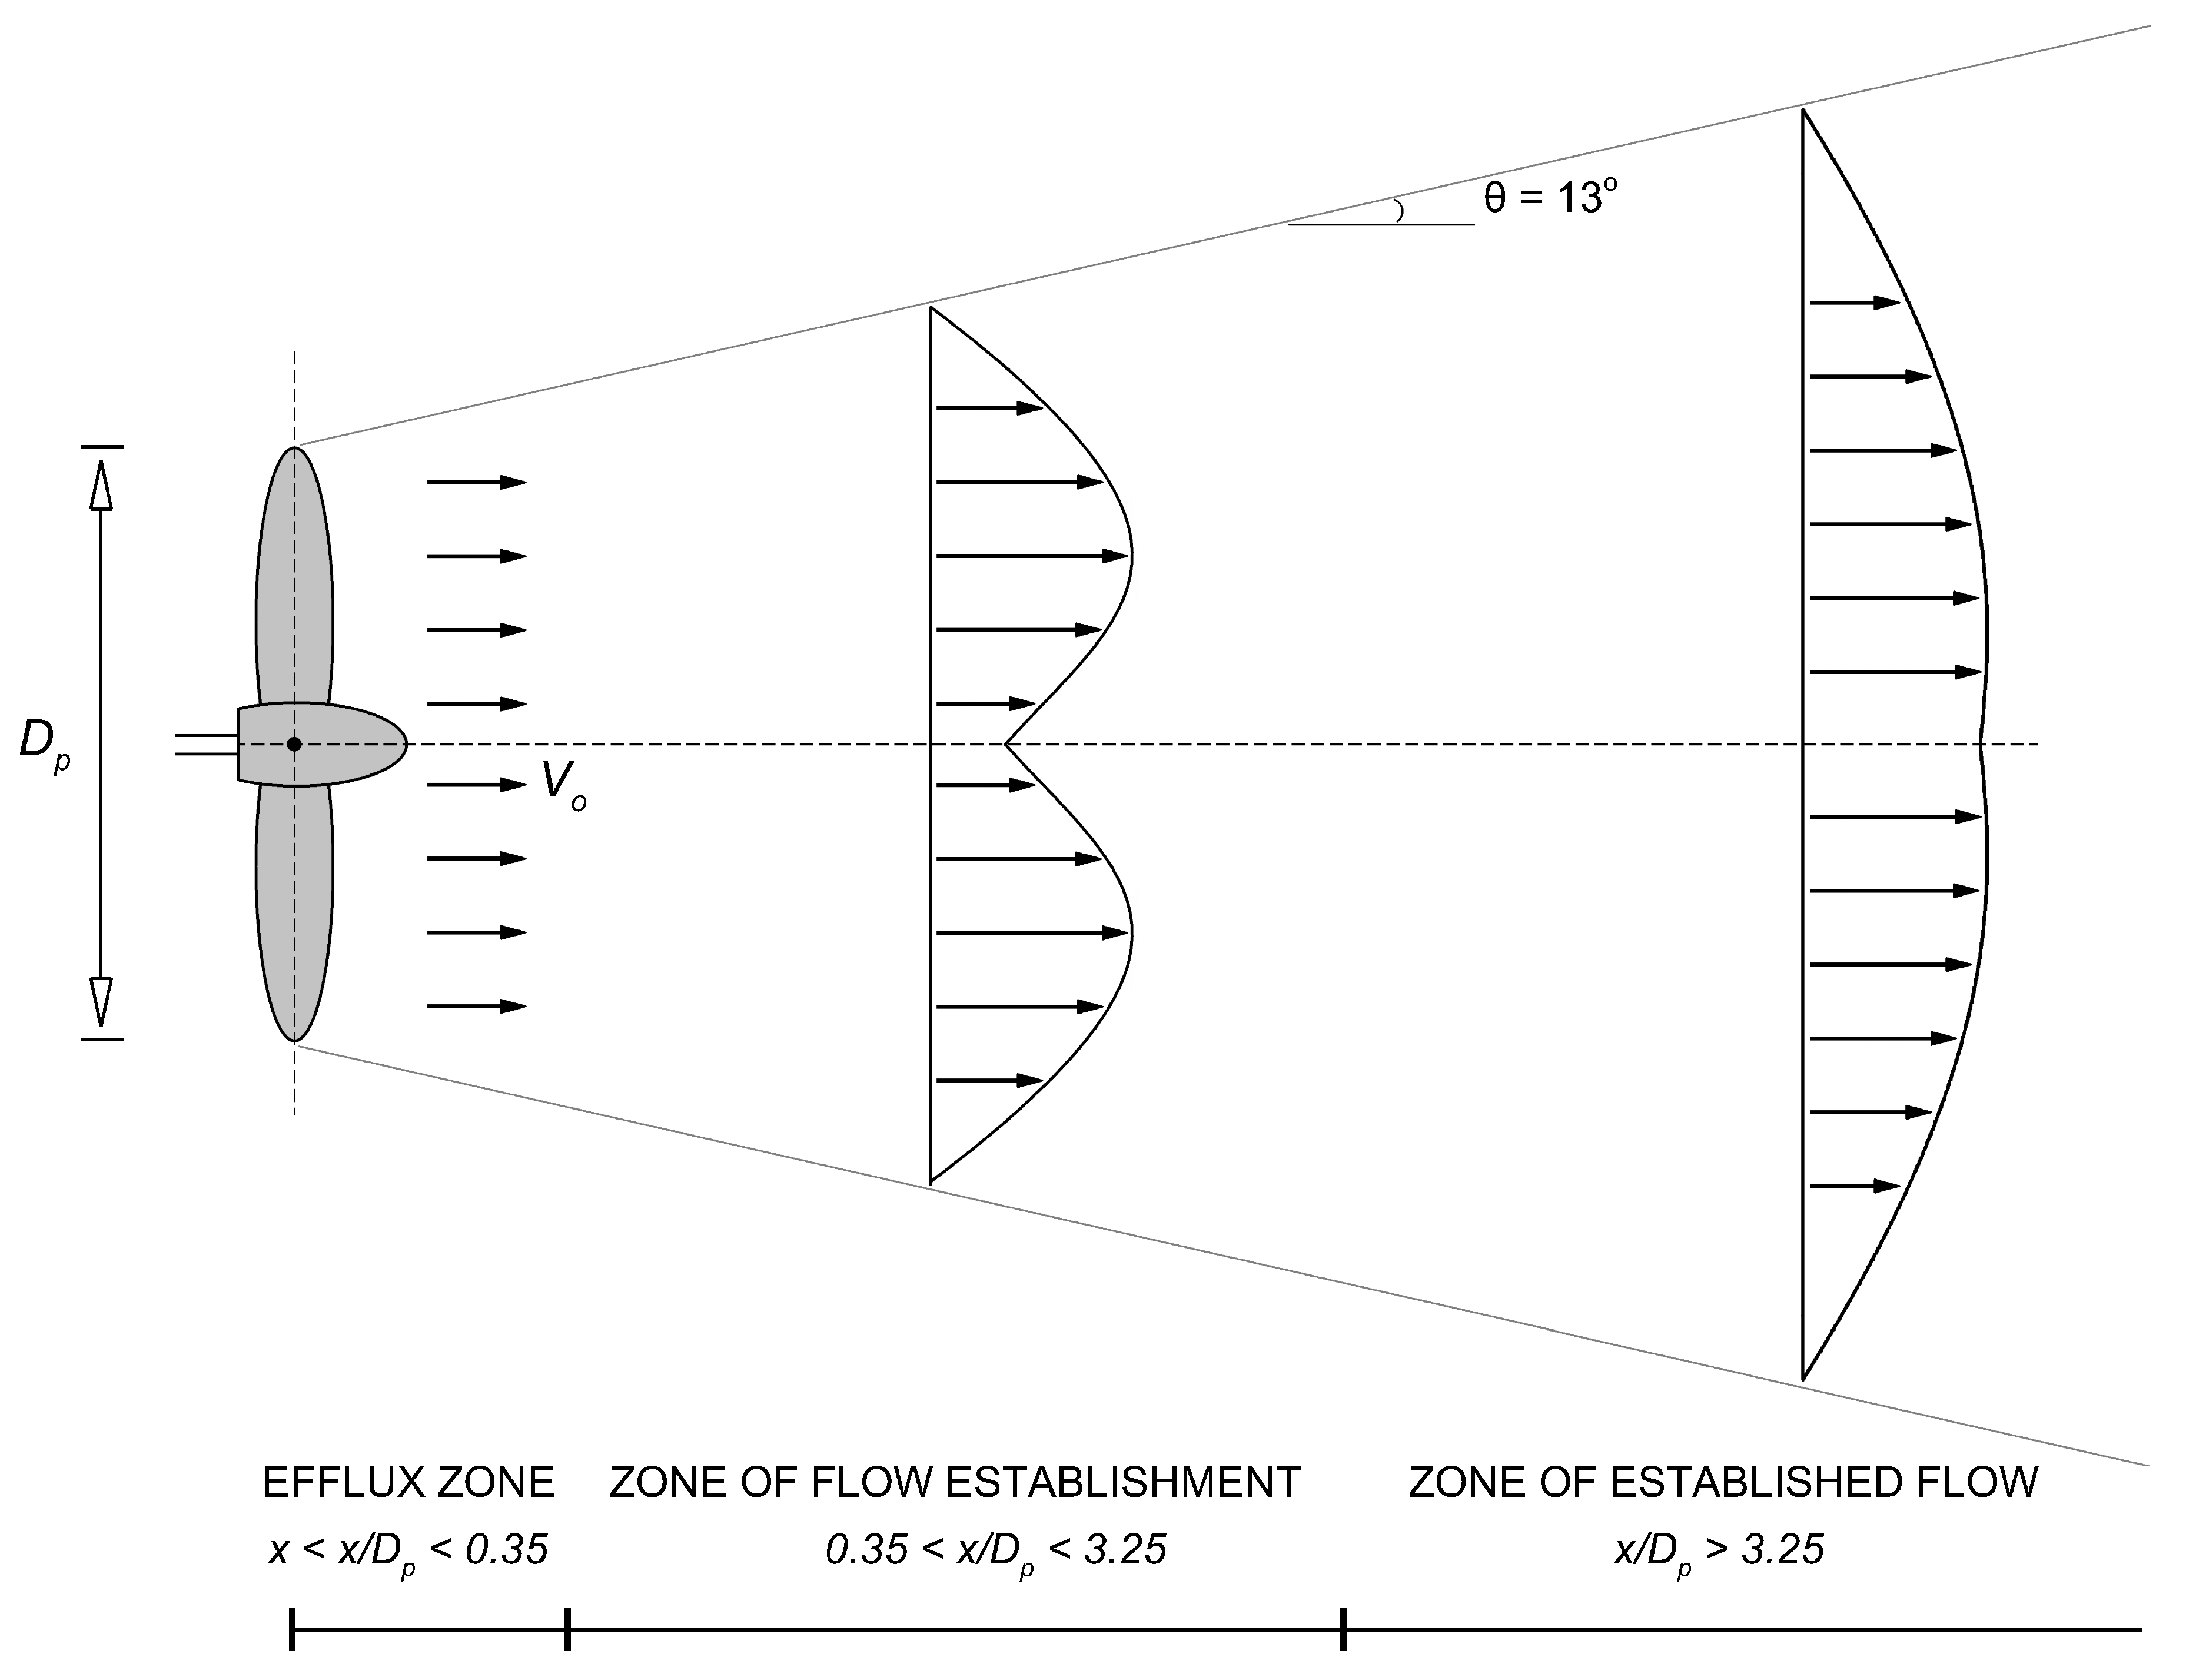
The prediction of the velocity field behind a propeller is essentially based on the magnitude of the efflux velocity, V 0 , defined as the maximum axial velocity at the face of the propeller. From the efflux velocity, it is possible to evaluate the velocity in different sections. The literature [13,14] suggests that for a propeller-free jet, where the diffusion is not bounded, the flow region behind the propeller can be conventionally divided into three distinct zones: the efflux zone, the zone of flow establishment (ZFE), and a zone of established flow (ZEF), as presented in Figure 1.
Each of these zones is characterized by different expressions of the axial velocity. The efflux zone is the area closest to the propeller, where the axial velocity reaches a maximum value equal to the efflux velocity. All the other values are derived from this maximum value in relation to the distance from the propeller. The ZFE, where the jet is generated and becomes established, is such that the axisymmetric velocity is lower at the central axis due to the presence of the propeller hub [13]. Moving away from the central axis (like for a wake), the influence of the propeller hub decreases, resulting in an increase in the axial velocity, which reaches a maximum value at a radial distance of R m 0 = 0.67 ( R p R h ) , where R p and R h are, respectively, the radius of the propeller and the radius of the propeller hub [15]. At a larger radial distance, the velocity tends to decrease, presenting a double-peaked distribution. In the ZEF, the lateral trend of the axial velocity at a cross-section follows a Gaussian normal distribution [14] with maximum values at the rotational axis. Then, like in typical free jets [16], it decays linearly with the distance x from the efflux plane.
In this model, the efflux velocity is first computed according to the Equation proposed by Fuehrer and Römisch [17]:
V 0 = 1.59 n D p C t .
Therefore, given the efflux velocity, both the longitudinal and transversal components of the axial velocity at the seabed level can be computed according to the following new Equation proposed in this work for the propeller-induced velocity field the on the seabed:
U p ( x , y ) = V 0 exp ( 2 y 2 + h p 2 D p 2 ) in the ZFE where x D p 2 c p V 0 1 2 c p D p x exp ( 1 2 c p 2 y 2 + h p 2 x 2 ) in the ZEF where x D p 2 c p ,
where x and y are, respectively, the distances in the longitudinal and transversal directions from the propeller, which is located at the stern of the vessel and c p is a model constant equal to 0.17 for ducted and 0.19 for non-ducted propellers [18]. Such values of c p depend on the presence of a non-rotating nozzle. In the case of ducted propellers, the propeller is housed within a cylindrical or elliptical duct. This design contributes to an improvement in the propeller efficiency by reducing tip vortex losses and increasing the thrust at lower speeds. To the best of the authors’ knowledge, the present study is one of the earliest and few to be specifically devoted to investigating and implementing the propeller-induced velocity field directly on the seabed.
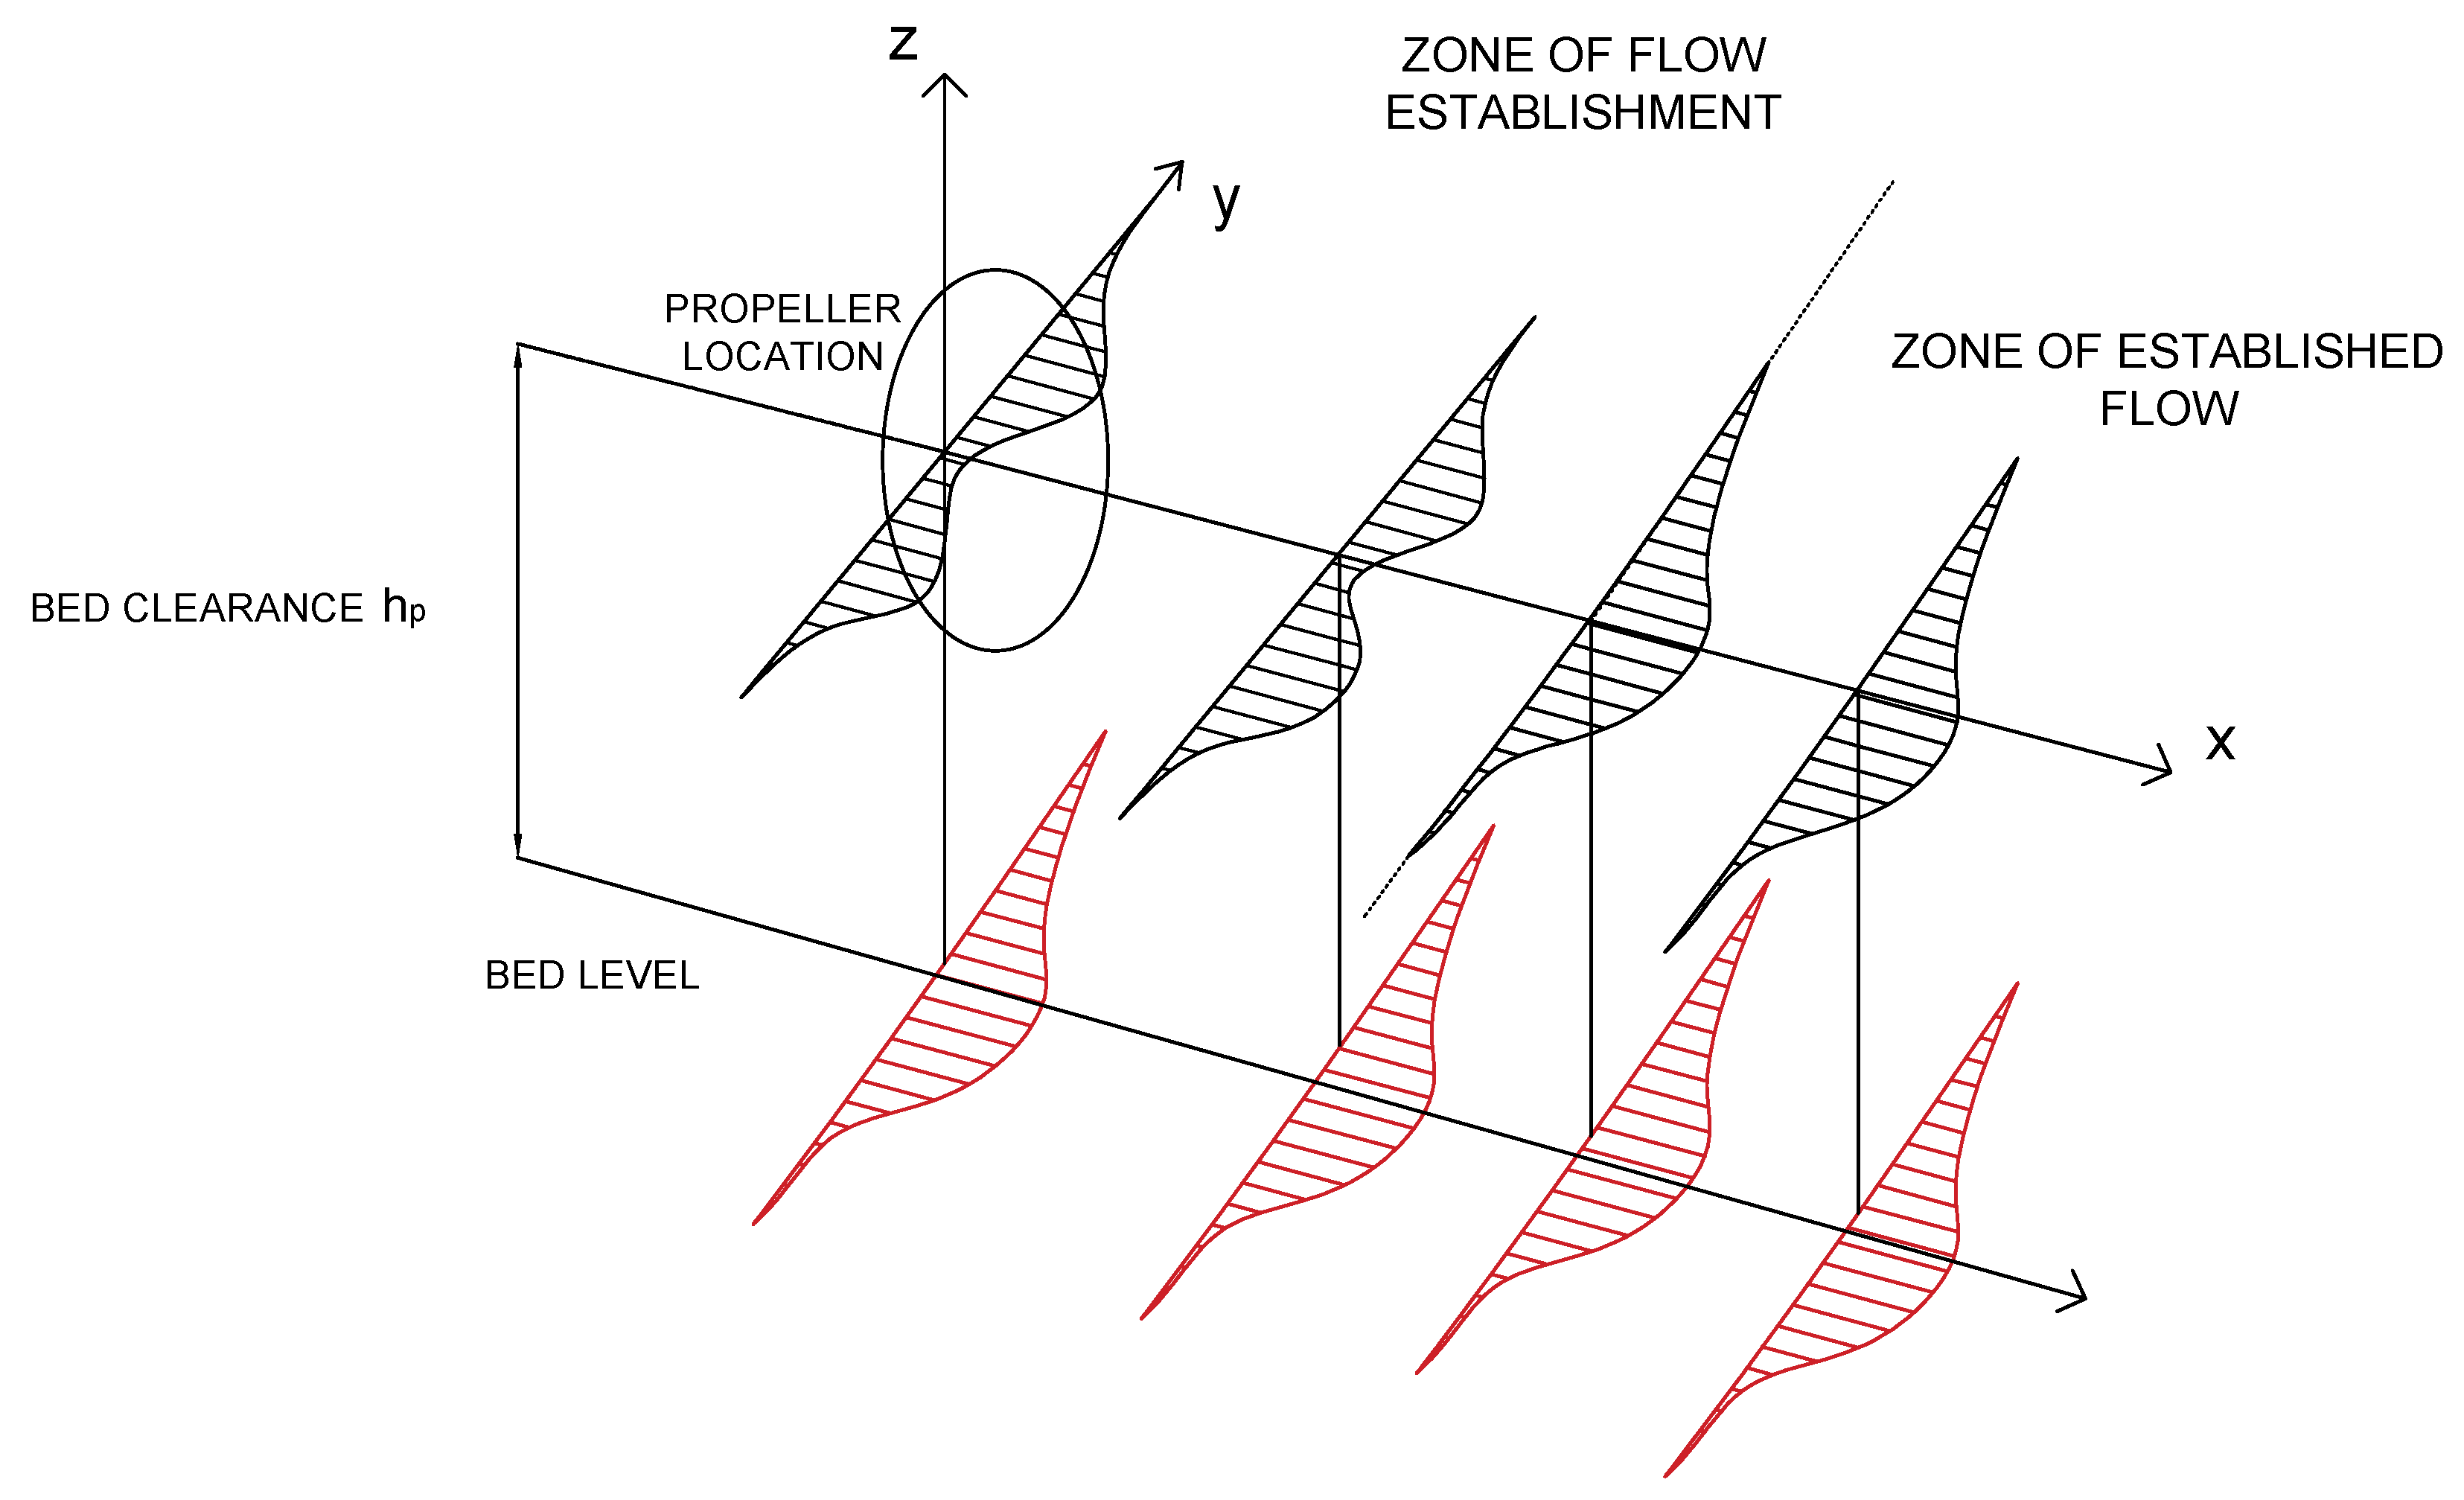
Since FUNWAVE is a depth-averaged numerical model, the present approach aims to evaluate the propeller-induced velocity field only at the bed level by projecting on the bed the typical propeller-induced velocity profile along the entire water column. A simplified three-dimensional (3D) sketch of the near-bed propeller-induced velocity distribution is provided in Figure 2. The velocity profile behind the propeller jet and along the propeller axis is presented in black, while the propeller-induced velocity projected on the bed level is shown in red.
More precisely, Equation (2) represents the near-bed velocity at a distance from the seabed equal to the Nikuradse roughness coefficient, k s = 2.50 d 50 , where d 50 is the median sediment diameter, which is also the case in the computation of the shear velocity in the sediment transport module of FUNWAVE [10]. The formulation of the near-bed velocity in the ZFE, in Equation (2), is partially derived from the Equation suggested by PIANC [19], which is valid for a 3D model, and then adapted to the horizontally two-dimensional FUNWAVE model. Accordingly, the proposed near-bed velocity in the ZEF depends, at all locations, on the magnitude of the efflux velocity V 0 . The term D p / x plays a major role in the reduction in the efflux velocity. The near-bed velocity is inversely proportional to x, which means that the propeller effect decreases with increasing distance. In the exponential term, the radial distance r in the original formulation proposed in PIANC [19] is substituted by the sum of y 2 + h p 2 . This accounts for the dependence of the near-bed velocity on the distance from the propeller along the cross-flow direction (y), and on the bed clearance ( h p ), confirming that the smaller the distance from the propeller, the stronger the propeller effect on the near-bed velocity. Moreover, the closer the propeller is to the bed level, the higher its contribution is to the near-bed velocity field.
Step 3:
Computation of the propeller-induced friction velocity
The calculated values of the propeller-induced velocity field on the seabed U p are transferred from the vessel module to the sediment transport module, properly modified to take into account the propeller contribution. The sediment transport module of FUNWAVE is based on the quasi-steady flow assumption, and it is considered appropriate for predicting sediment transport in depth-limited regions like the swash zone and seabed–ship hull water region. Both suspended and bed load transport are computed for both cohesive and non-cohesive sediment fractions. The suspended sediment transport is obtained by solving a depth-averaged advection–diffusion equation for the sediment concentration (3):
( c ¯ H ) t + h · ( c ¯ H ( u ff + u 2 ¯ ) ) = h · ( ϵ s H ( h c ¯ ) ) + E D
where c ¯ is the non-dimensional depth-averaged sediment concentration normalized by the sediment density, H = h + η is the total water depth, given by the sum of the still water depth h and the water surface elevation η , and ϵ s is the horizontal sediment diffusion coefficient evaluated by the formulation proposed by Elder [20], taken equal to ϵ s = 5.93 u c H , where u c is the shear velocity. The term H ( u α + u 2 ¯ ) = M represents the flow rate per unit width. The horizontal velocity is expressed as follows: with u α + u 2 ¯   u α being the velocity at the reference level z = z α and u 2 ¯ being the depth-averaged O ( μ 2 ) contribution. In addition, E represents the erosion rate, evaluated by van Rijn’s pickup function [21]:
E = 0.015 d 50 a τ b τ c r τ c r 1.5 d * 0.3 w f , τ b > τ c r ,
where a represents the reference elevation, defined as a function of the total water depth ( a = 0.01 H ), w f is the settling velocity, and d * is the dimensionless grain size:
d * = d 50 ( s 1 ) g ν 2 1 3 ,
with s representing the specific gravity of the sediment, and ν is the water kinematic viscosity. The bed shear stress, τ b , and the critical shear stress, τ c r , are defined as follows:
τ b = ρ w 0.4 1 + ln ( k s / 30 h ) 2 U c 2 ,
τ c r = ρ w ( s 1 ) g d 50 θ c r ,
where θ c r is the critical Shields parameter, approximately equal to 0.05, U c is the depth-averaged total velocity, and ρ w is the water density.
In Equation (3), D represents the sediment deposition rate, calculated following Cao [22]:
D = γ c ¯ w s ( 1 γ c ¯ ) m o ,
where γ = m i n [ 2 , ( 1 ( 1 n s ) / c ¯ ) ] , n s is the sediment porosity, and m o is a constant equal to 2.0. The bed load sediment transport is calculated using the Meyer-Peter and Muller formulation [23].
q b = 8 [ ( τ b τ c r b ) / ρ w ] 3 / 2 g ( s 1 ) .
The morphological evolution of the bed is calculated by the morphological module on the basis of the sediment continuity equation using a time-averaged pickup and deposition rate:
d Z b d t = 1 1 n s ( D ¯ E ¯ · q b ¯ ) .
In the previous equation, d Z b represents the time-averaged depth changes with positive values for erosion and negative values for deposition, E ¯ and D ¯ are, respectively, the time-averaged pickup and deposition rates averaged over the morphological time step d t m o r p h , and q b ¯ is the bed load flux vector averaged over the same time interval.
Regarding propeller implementation, the friction velocity due to the propeller rotation is computed as follows:
u c p ( x , y ) = U p C f 2 ,
where C f = 0.01 D p / h p is a friction coefficient proposed by Maynord [4].
Therefore, the total shear velocity is obtained using the principle of superposition. The propeller contribution calculated by Equation (11) is added to the original shear velocity computed in the sediment transport module using Van Rijn’s formulation. Thus, the total shear velocity is expressed as follows:
u c ( x , y ) = ϵ s 1 + ln 30 H k s U c + U p C f 2 ,
where the first term of the right-hand side is the original shear velocity and the second term is the additional shear velocity from the propeller.
Step 4:
Computation of the propeller-induced bed shear stress
The additional contribution to the bed shear stress due to the propeller effect is introduced in the definition of the total bed shear stress. As suggested by Blaauw and van de Kaa [18], the propeller-induced bed shear stress is estimated, imposing that the mean bed shear stress is proportional to the square of the velocity at the bottom through the friction coefficient C f . Subsequently, the new total bed shear stress is given as follows:
τ ( x , y ) = ρ w ϵ s 1 + ln 30 H k s 2 + ρ w 1 2 C f U p 2 ,
where the first term of the right-hand side is the original bed shear stress and the second term is the propeller-induced bed shear stress.
The main stages of the numerical implementation in the ship wake and sediment transport modules of FUNWAVE are summarized as follows: (1) computation of both longitudinal and transversal components (defined as vectors) of the axial velocity induced by the propeller for each single vessel (vessel module); (2) computation of the friction velocity induced by the ship’s propellers (vessel module); (3) coupling between the vessel and the sediment module through the definition of the new friction velocity, also including the contribution of the ship propeller (sediment transport module); (4) computation of the new bed shear stress, accounting for the ship propeller effect (sediment transport module). In the case of multiple vessels, the same procedure is adopted for each one.

Limitations and Improvements

The present numerical model is valid under the following assumptions, which can explain some discrepancies between the numerical results and experimental findings in the literature. First, since FUNWAVE is a depth-averaged numerical model, it is not fully capable of reproducing the 3D characteristics typically occurring during the scouring processes induced by ship propellers [24].
Moreover, a number of simplifications have been made to model the effect of the propeller jet flow. Specifically, the choice of different equations for the estimation of the efflux velocity used in the model. The equation here, for instance, refers to a single propeller without a rudder or bow thruster and does not take into account the number of blades.
In addition, for a better representation of the propeller wash, the propeller contribution should be included in the hydrodynamic equations as an additional momentum flux at the propeller location. Finally, the model is not yet capable of reaching an equilibrium state since the hydrodynamics have not been coupled with the propeller effect, causing unrealistic erosion on the seabed. Therefore, further adjustments must be carried out to couple the hydrodynamic and propeller modules.
3. Results

3.1. Numerical Runs Overview

Numerical simulations with one single stationary and moving vessel in a narrow channel have been performed to study the influence of the propeller implementation on sediment transport and bed morphodynamics.
The computational domain is considered 1000 m long and 100 m wide to provide enough free space between the ship and the domain boundaries, with a spatial resolution of 0.5 m in both the x and y directions. A sponge layer of 10 m is applied on all boundaries to simulate absorbing boundary conditions and avoid undesired reflections. Due to the nature of the focal processes, no waves or external currents are included in the numerical runs. The water depth is considered uniform and equal to 5.0 m. The bathymetry is characterized by a flat seabed of coarse sand (non-cohesive) with a medium grain size of 0.5 mm. The values of the main morphodynamic parameters are as follows: the critical bed Shields parameter, θ c r = 0.047 , the sediment porosity n s = 0.47, the settling velocity w f = 0.0125 m/s, the slope of the repose angle tan ϕ = 0.7 (corresponding to a repose angle of 35°), and the density ratio s = 2.68. A morphological step (ratio between the morphology updating step to the flow model time step) of 10 is applied, as is recommended for ship–wake applications [10]. The duration of the numerical runs is 10 min, with an output interval of 10 s. The adaptive time step is automatically computed by FUNWAVE on the basis of the Courant–Friedrichs–Levy (CFL) number restriction, which is set to 0.1.
The dimensions of the vessel are presented in Table 1 and correspond to the typical dimensions of a military vessel. The value of the dimensionless thrust coefficient C t is derived from the Wageningen B-series [25] and taken equal to 0.5 for the stationary vessel case and 0.48 for the moving vessel case. The value of the bed clearance is chosen to reduce the propeller-induced vibrations on the hull (minimum value suggested equal to 0.3 D p ) and also to satisfy the range of validity of the Maynord approach (maximum ratio D p h p equal to 1.2) [4]. Considering the limited under keel clearance, the deep draught option is activated (see [10]), using the combined shock capturing and friction method with the default values for both the viscosity and friction coefficients.
The numerical runs for the stationary and moving vessel are presented in Table 2 and Table 3, respectively. For the stationary vessel cases characterized by zero advance velocity, the revolution number and the bed clearance on the morphology are varied to investigate their influence. For moving vessel runs, the revolution speed is adequately chosen to obtain the required vessel speeds, between 2 and 4 knots, which are commonly adopted in most navigation channels.
In the literature, the majority of the studies have been traditionally conducted at no speed advance, i.e., in bollard pull conditions, considering that the most relevant velocities at the bottom are reached when the ship is stationary. In addition, the stationary vessel condition provides a more conservative answer in a design context; hence, it is preferred. Even though it was confirmed that the propeller jet contribution on the bed topography decreases at the increase in the speed advance [26], simulating the case of the moving vessel might be of particular interest since it occurs when the ship leaves/approaches the moorings (in still water conditions in this study, considering that no additional forcing has been included).

3.2. Numerical Results on the Ship Propeller Effect: The Stationary Vessel Case

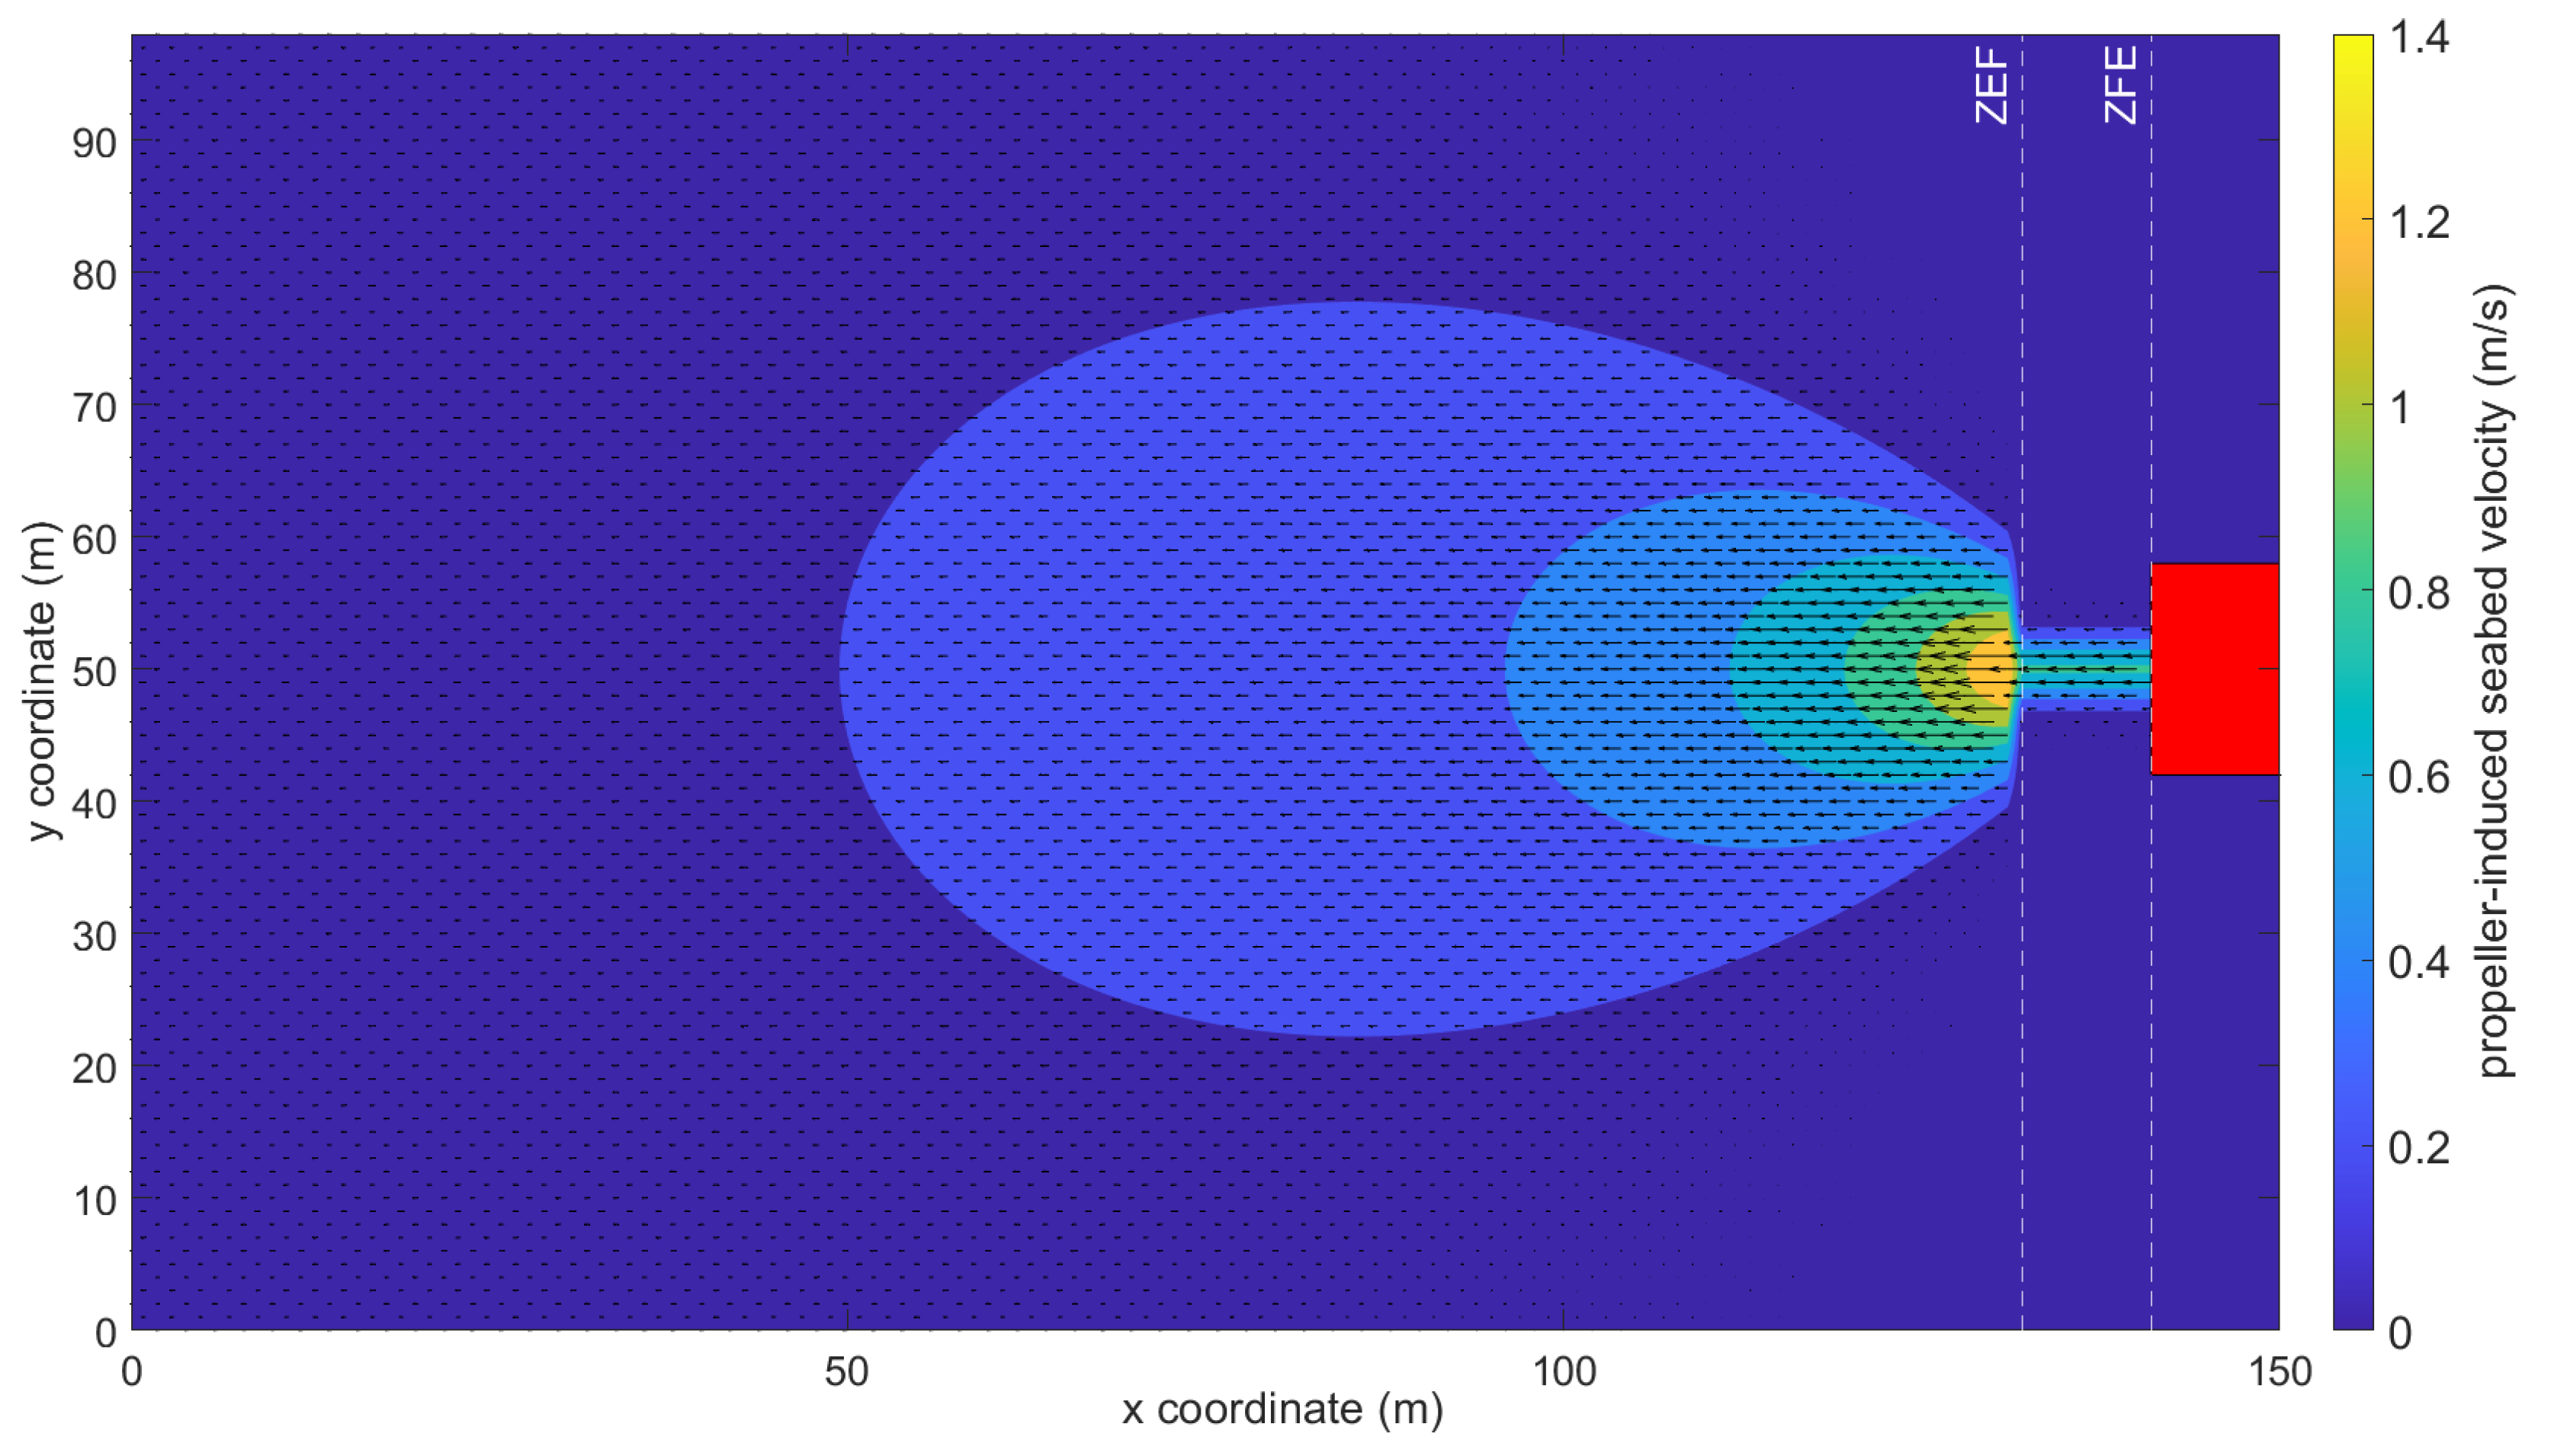
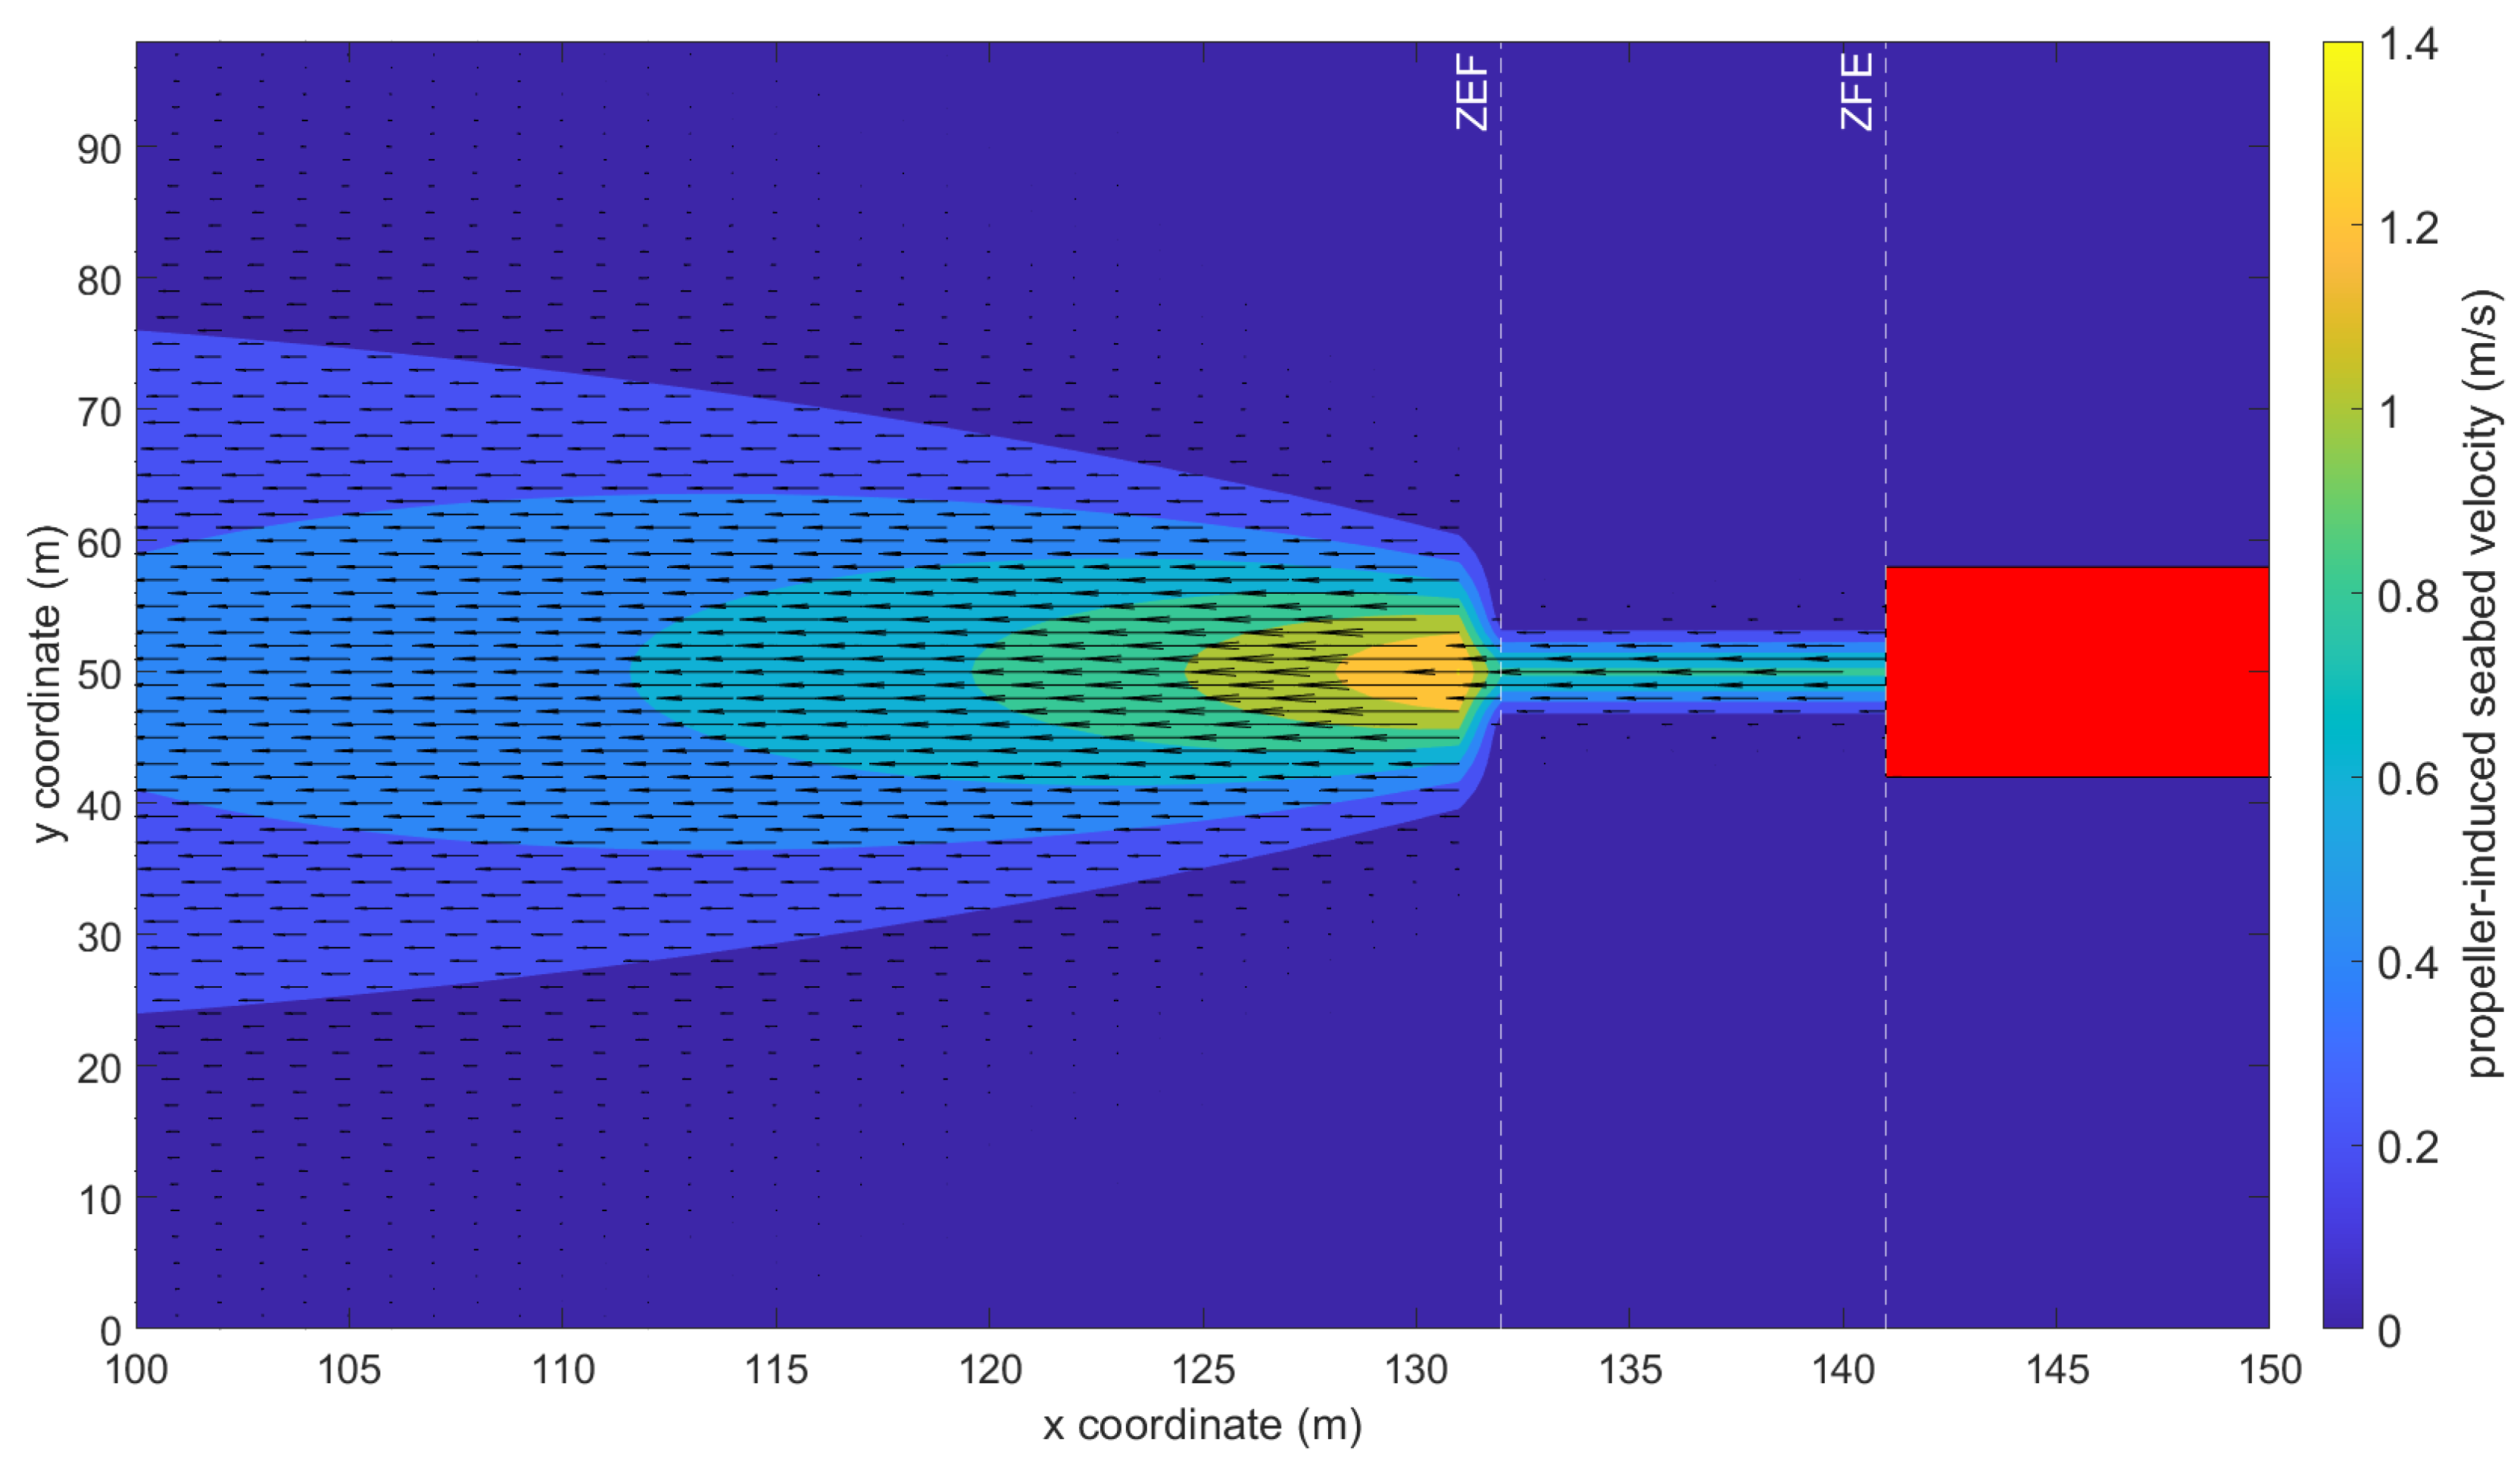
Figure 3 maps the velocity field on the seabed for a stationary vessel for test case Run2 (Table 2), taken as representative of the main features of the flow and morphology. The vectors provide the velocity direction, while the intensity is represented by the colormap. The red rectangle represents the stern area of the vessel, where the propeller is located. The two zones, ZFE and ZEF, are clearly distinguished behind the vessel, highlighted by two black vertical lines. In the zone of flow establishment, which is located between the two vertical lines of Figure 4, close to the propeller face and characterized by a length of x = D p / 2 c p , the velocity is constant along the x direction. In the zone of established flow, as confirmed by Figure 4, the maximum velocity is almost two times larger than in the ZFE, and it is achieved at the central axis. As highlighted by the vectors’ length, the velocity gradually decays when moving away from the vessel, linearly in x and exponentially in y.
For the Run2 case (see Table 2), the morphological changes induced by the suspended load (top panel), the bed load (middle panel), and the total load (bottom panel) at the end of the simulation are illustrated in Figure 5. The blue and red colours indicate the erosion and accumulation areas, respectively.
The top panel shows that behind the vessel, sediment is progressively stirred up from the seabed by the rotation of the propeller, eventually causing erosion. The continuous rotation of the propeller is reflected in the consequent growth of the eroded area due to the dispersion processes, expanding laterally and matching the velocity pattern. The scour also develops downstream, up to a maximum length of D p . The morphological evolution due to the contribution of the bed load is illustrated in the middle panel. Here, the presence of two distinct scour regions is observed: a primary scour hole (in dark blue) approximately at a distance of 2 D p from the stern of the vessel (depicted in red) and a secondary smaller hole (in light blue) directly beneath the location of the propeller. The primary scour hole extends downstream for almost one D p , causing a deposition mound (in red) behind it. In the bottom panel, the overall effect of the total load, i.e., the sum of suspended and bed load, on the seabed variation is illustrated. The specific test case is characterized by a sandy bed; thus, the bed load effect prevails over the suspended load, governing the morphological evolution of the seabed. As a result, the erosion induced by the former is two times larger than that generated by the latter. However, the suspended load mainly contributes to increasing the primary scour hole (and slightly the secondary hole) and eroding the deposition mound behind it, making it less steep.
It is important to underline that, in order to compare the numerical results to the experimental literature studies, it is preferred to focus only on the bed load contribution. This is because, as pointed out in [27], the majority of experimental works employ sand materials of different median sediment diameters. Consequently, the experimental studies related to the propeller scour could primarily capture the effect of the bed load rather than the suspended load effect. In the following, the evolution of the scour progress induced by the bed load is analysed using the definition of the typical dimensions of the scour holes:
l s , the length of the primary scour hole (extension along the x-axis);
d s , the depth of the primary scour hole;
w s , the width of the primary scour hole (extension along the y-axis).
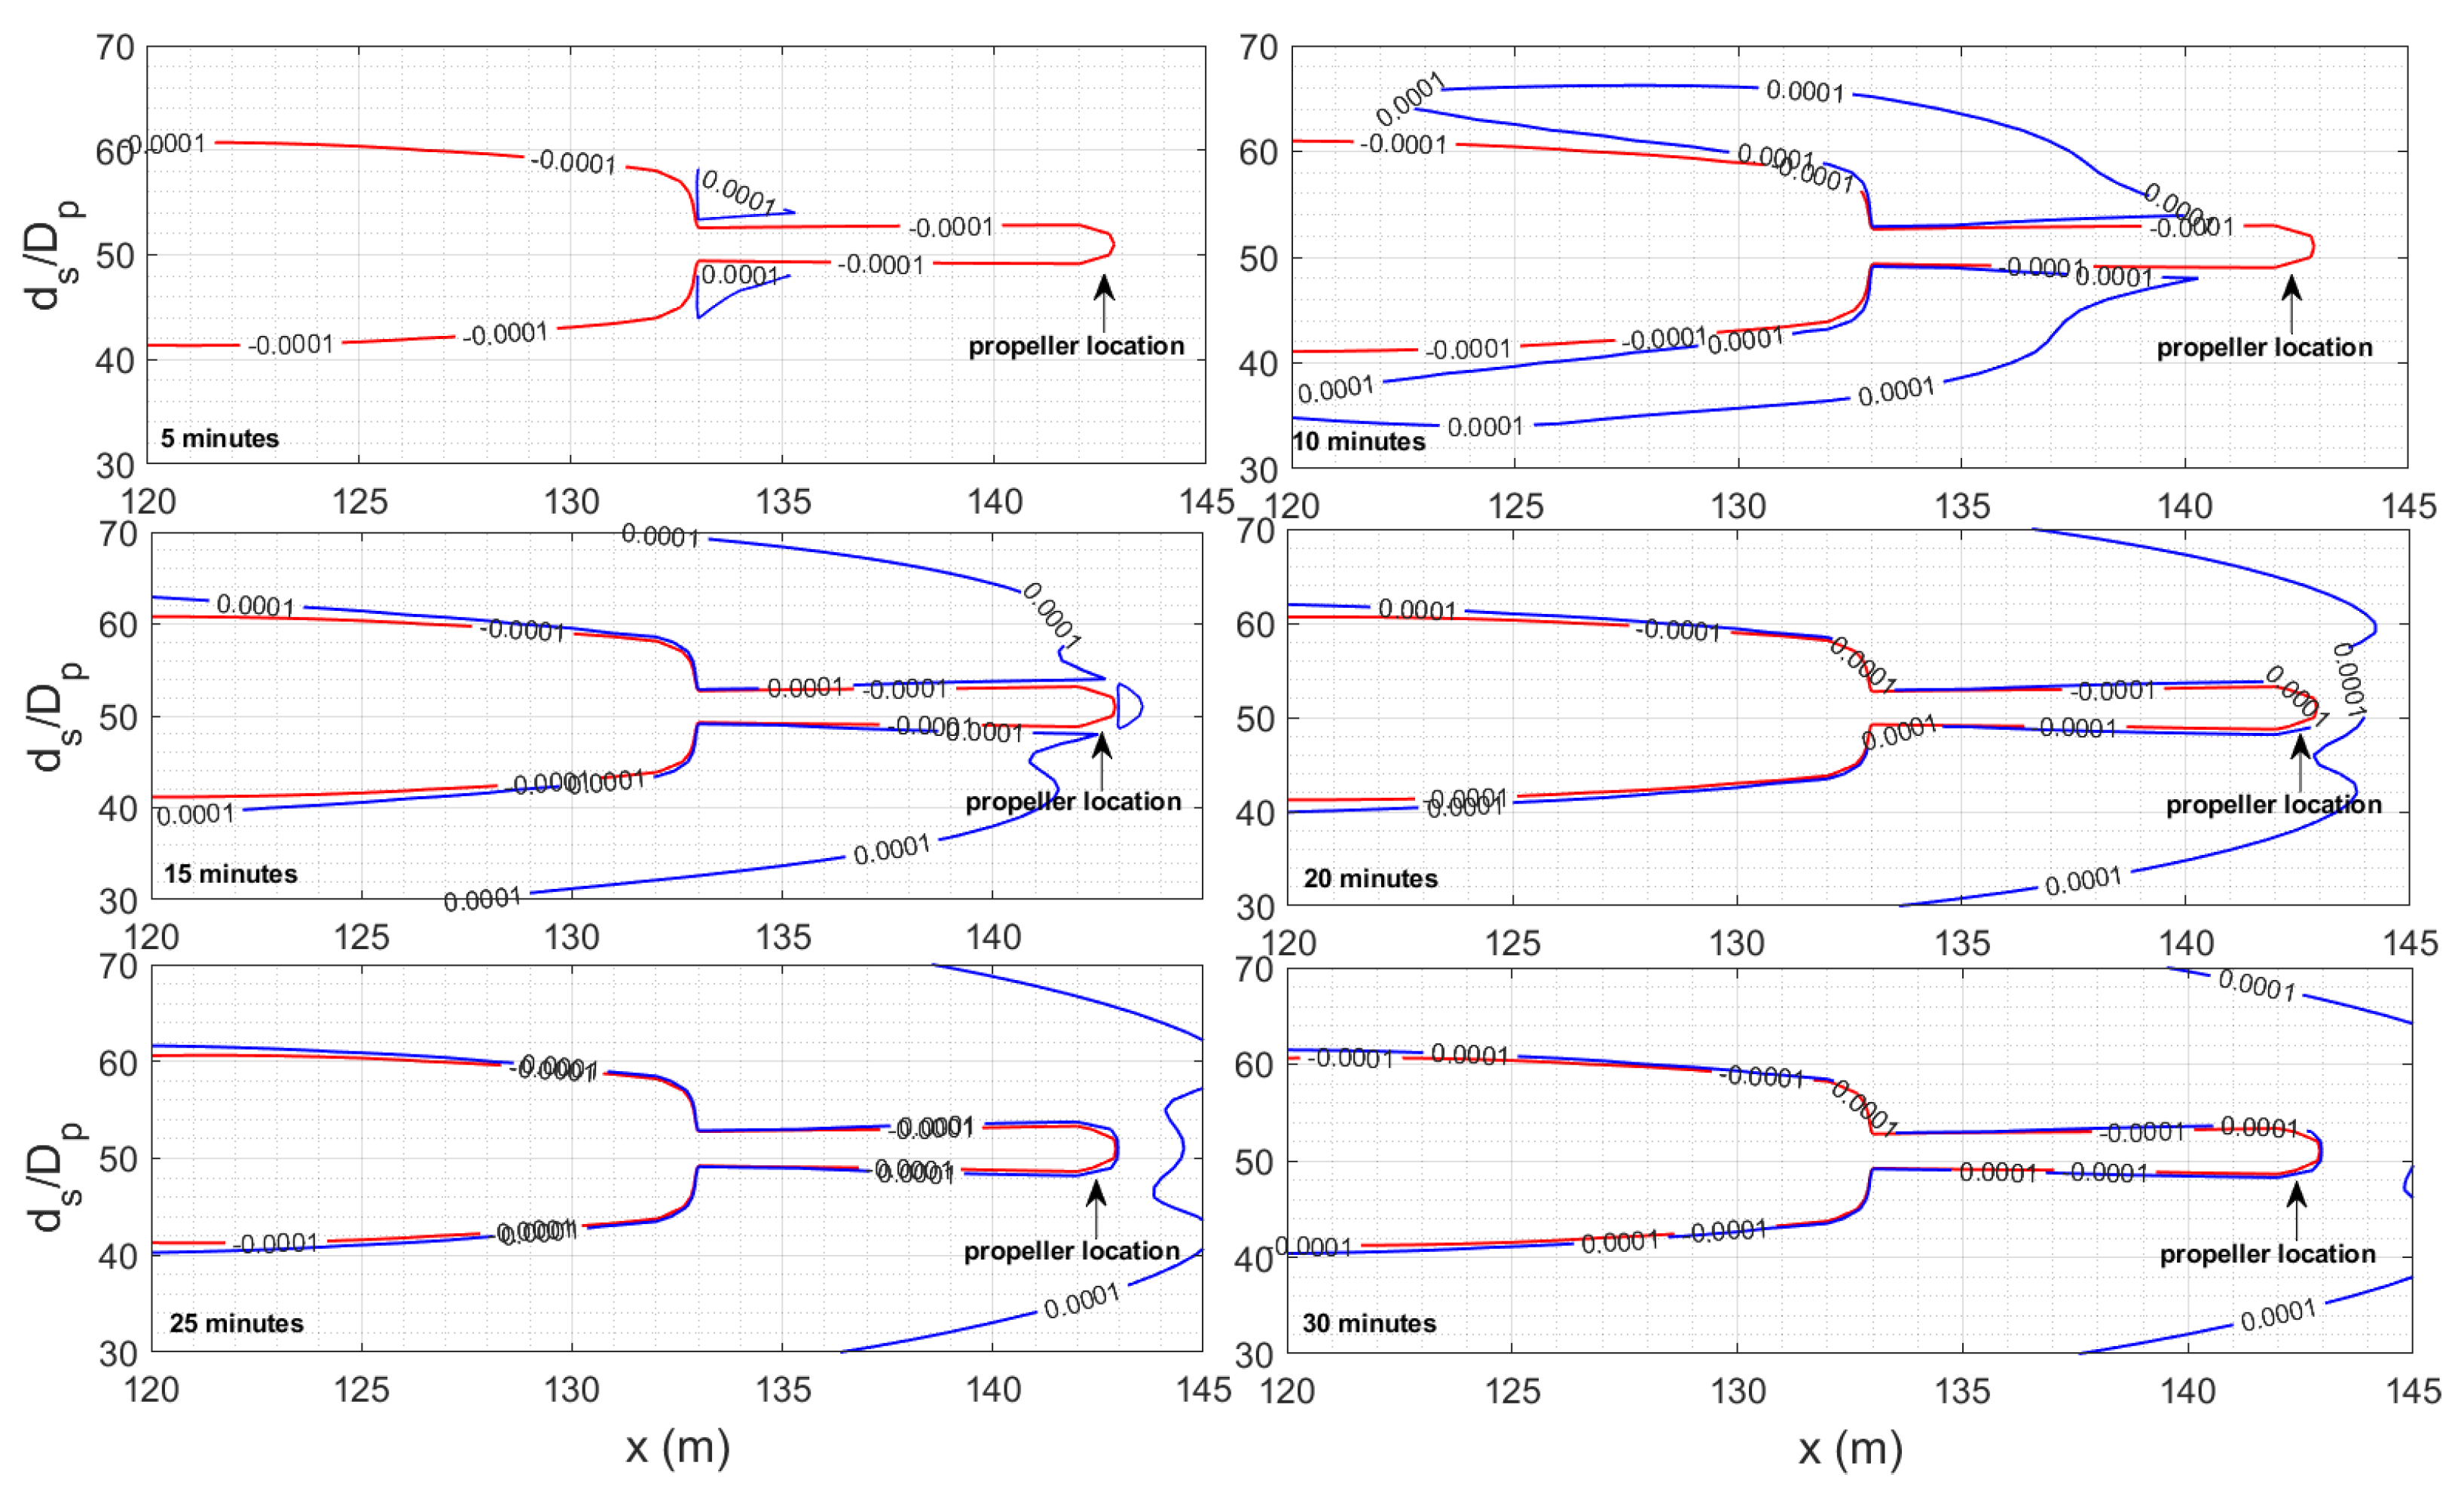
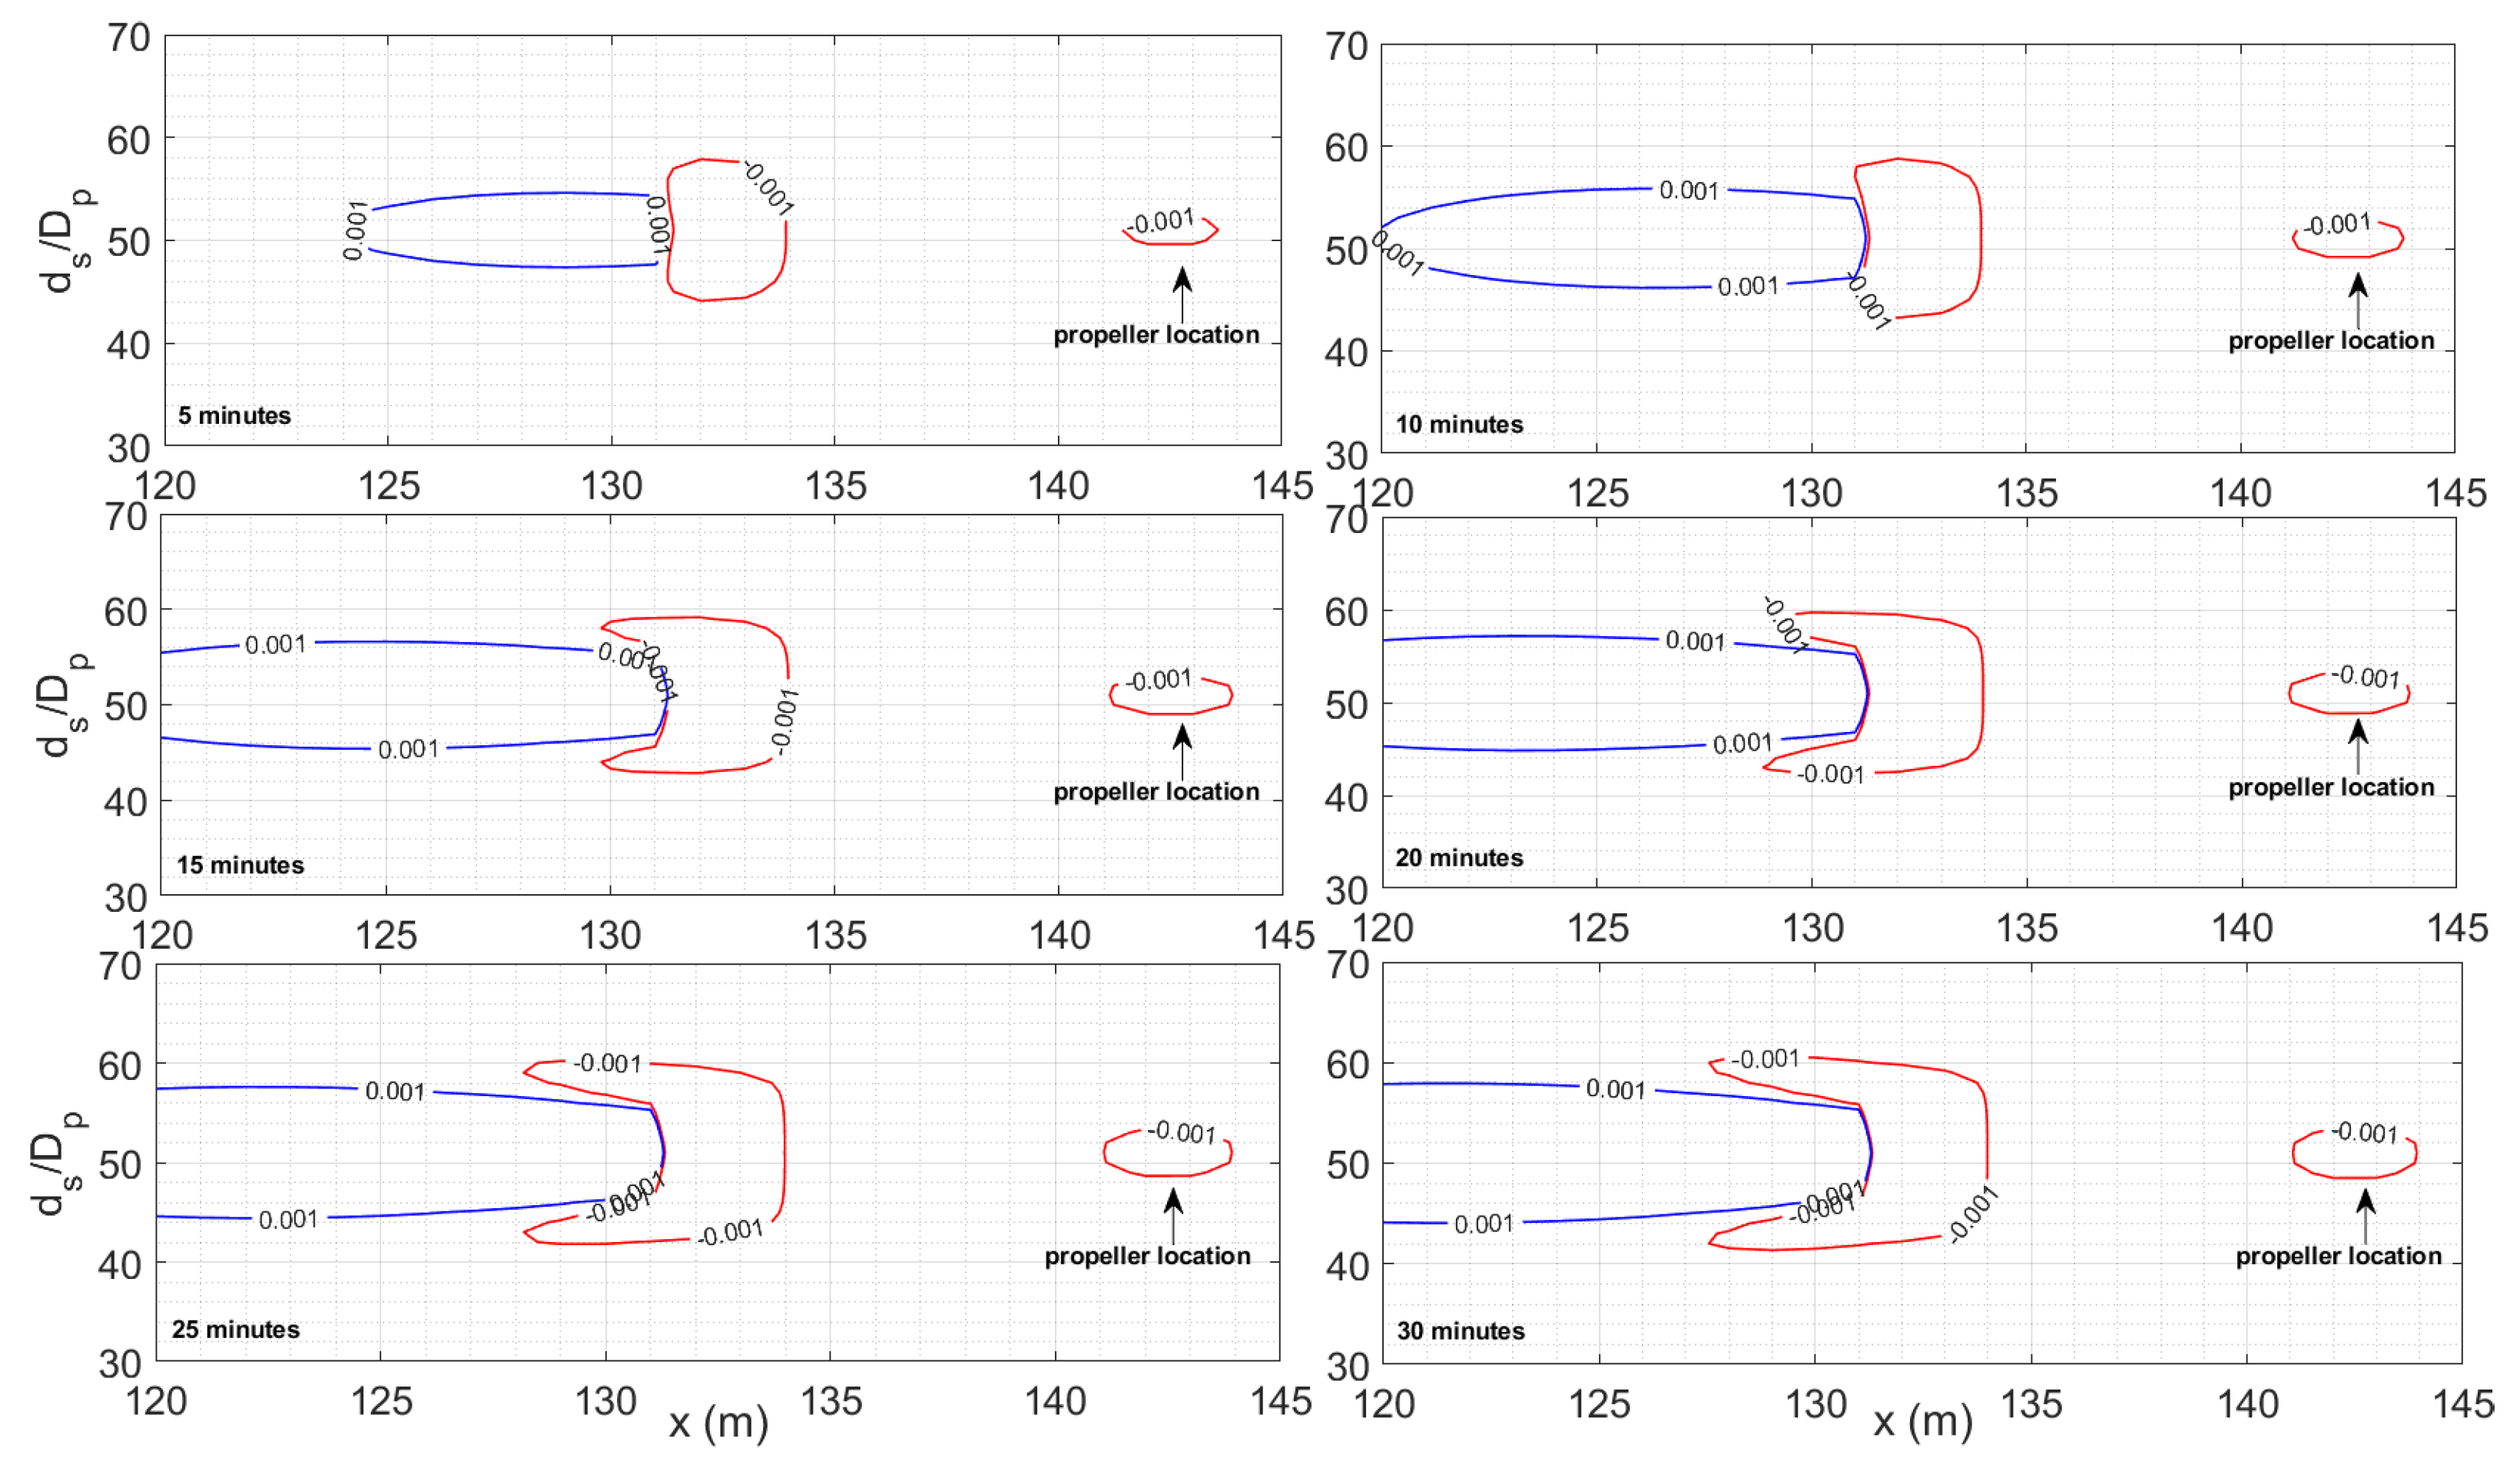
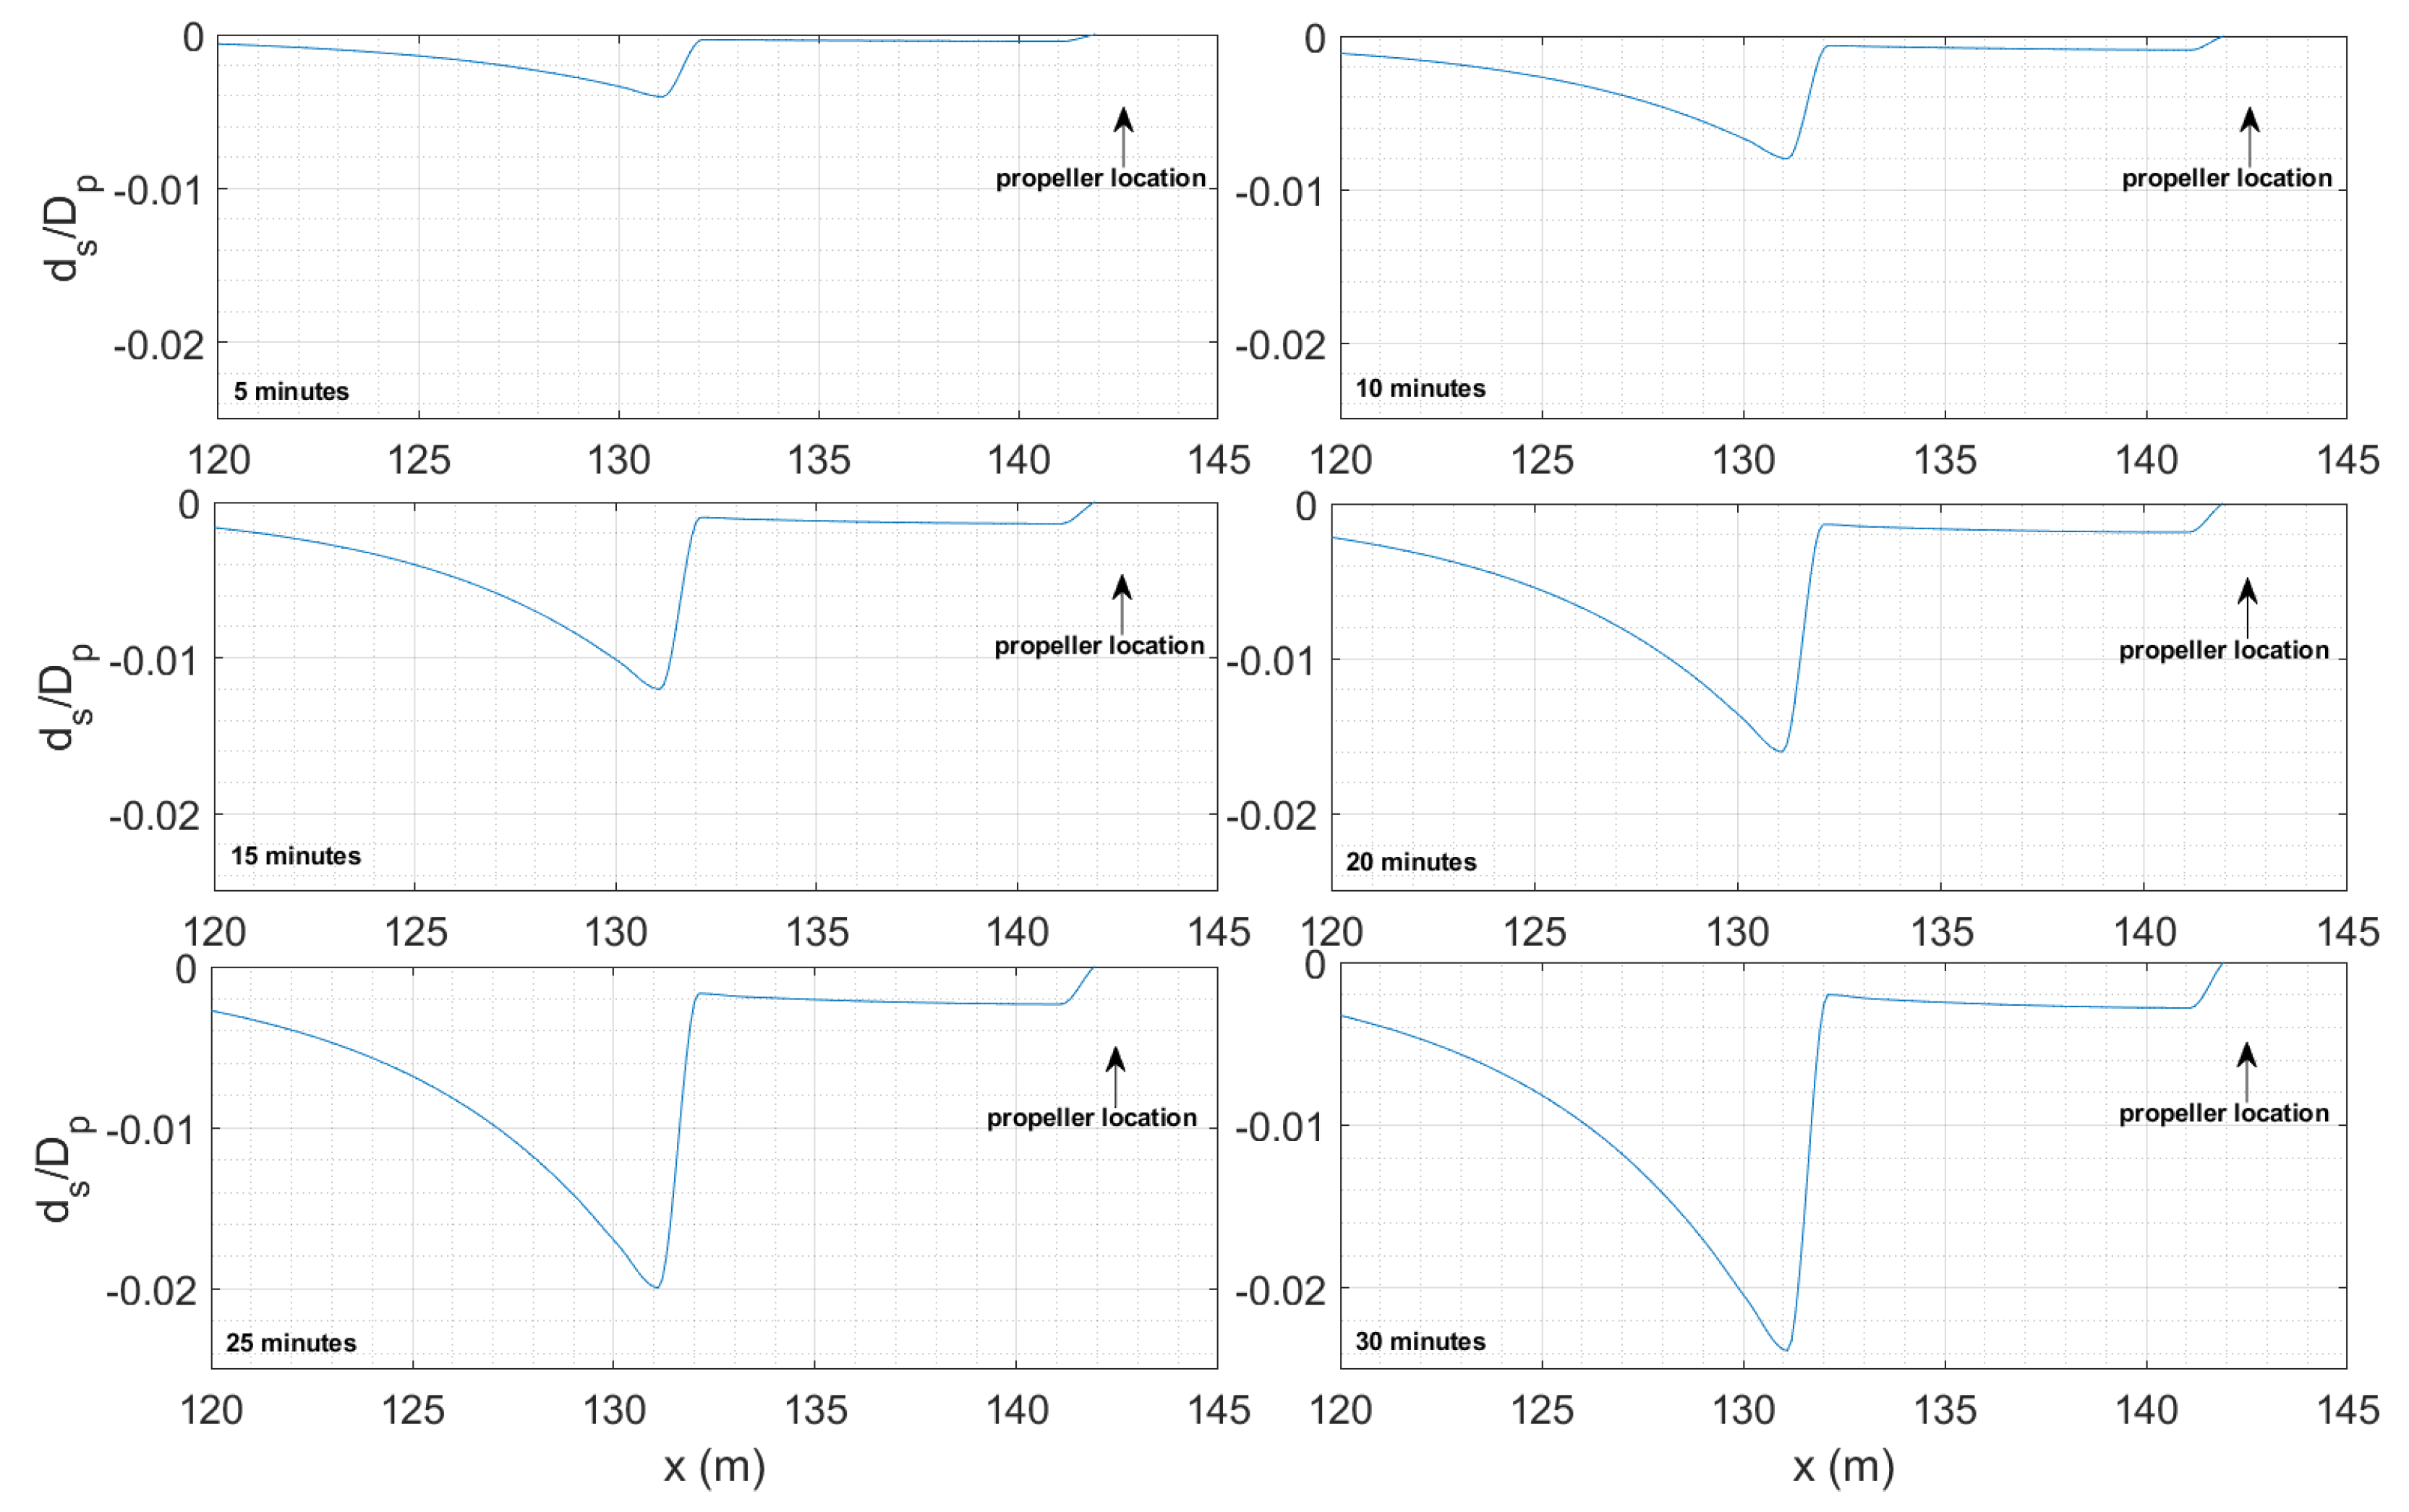
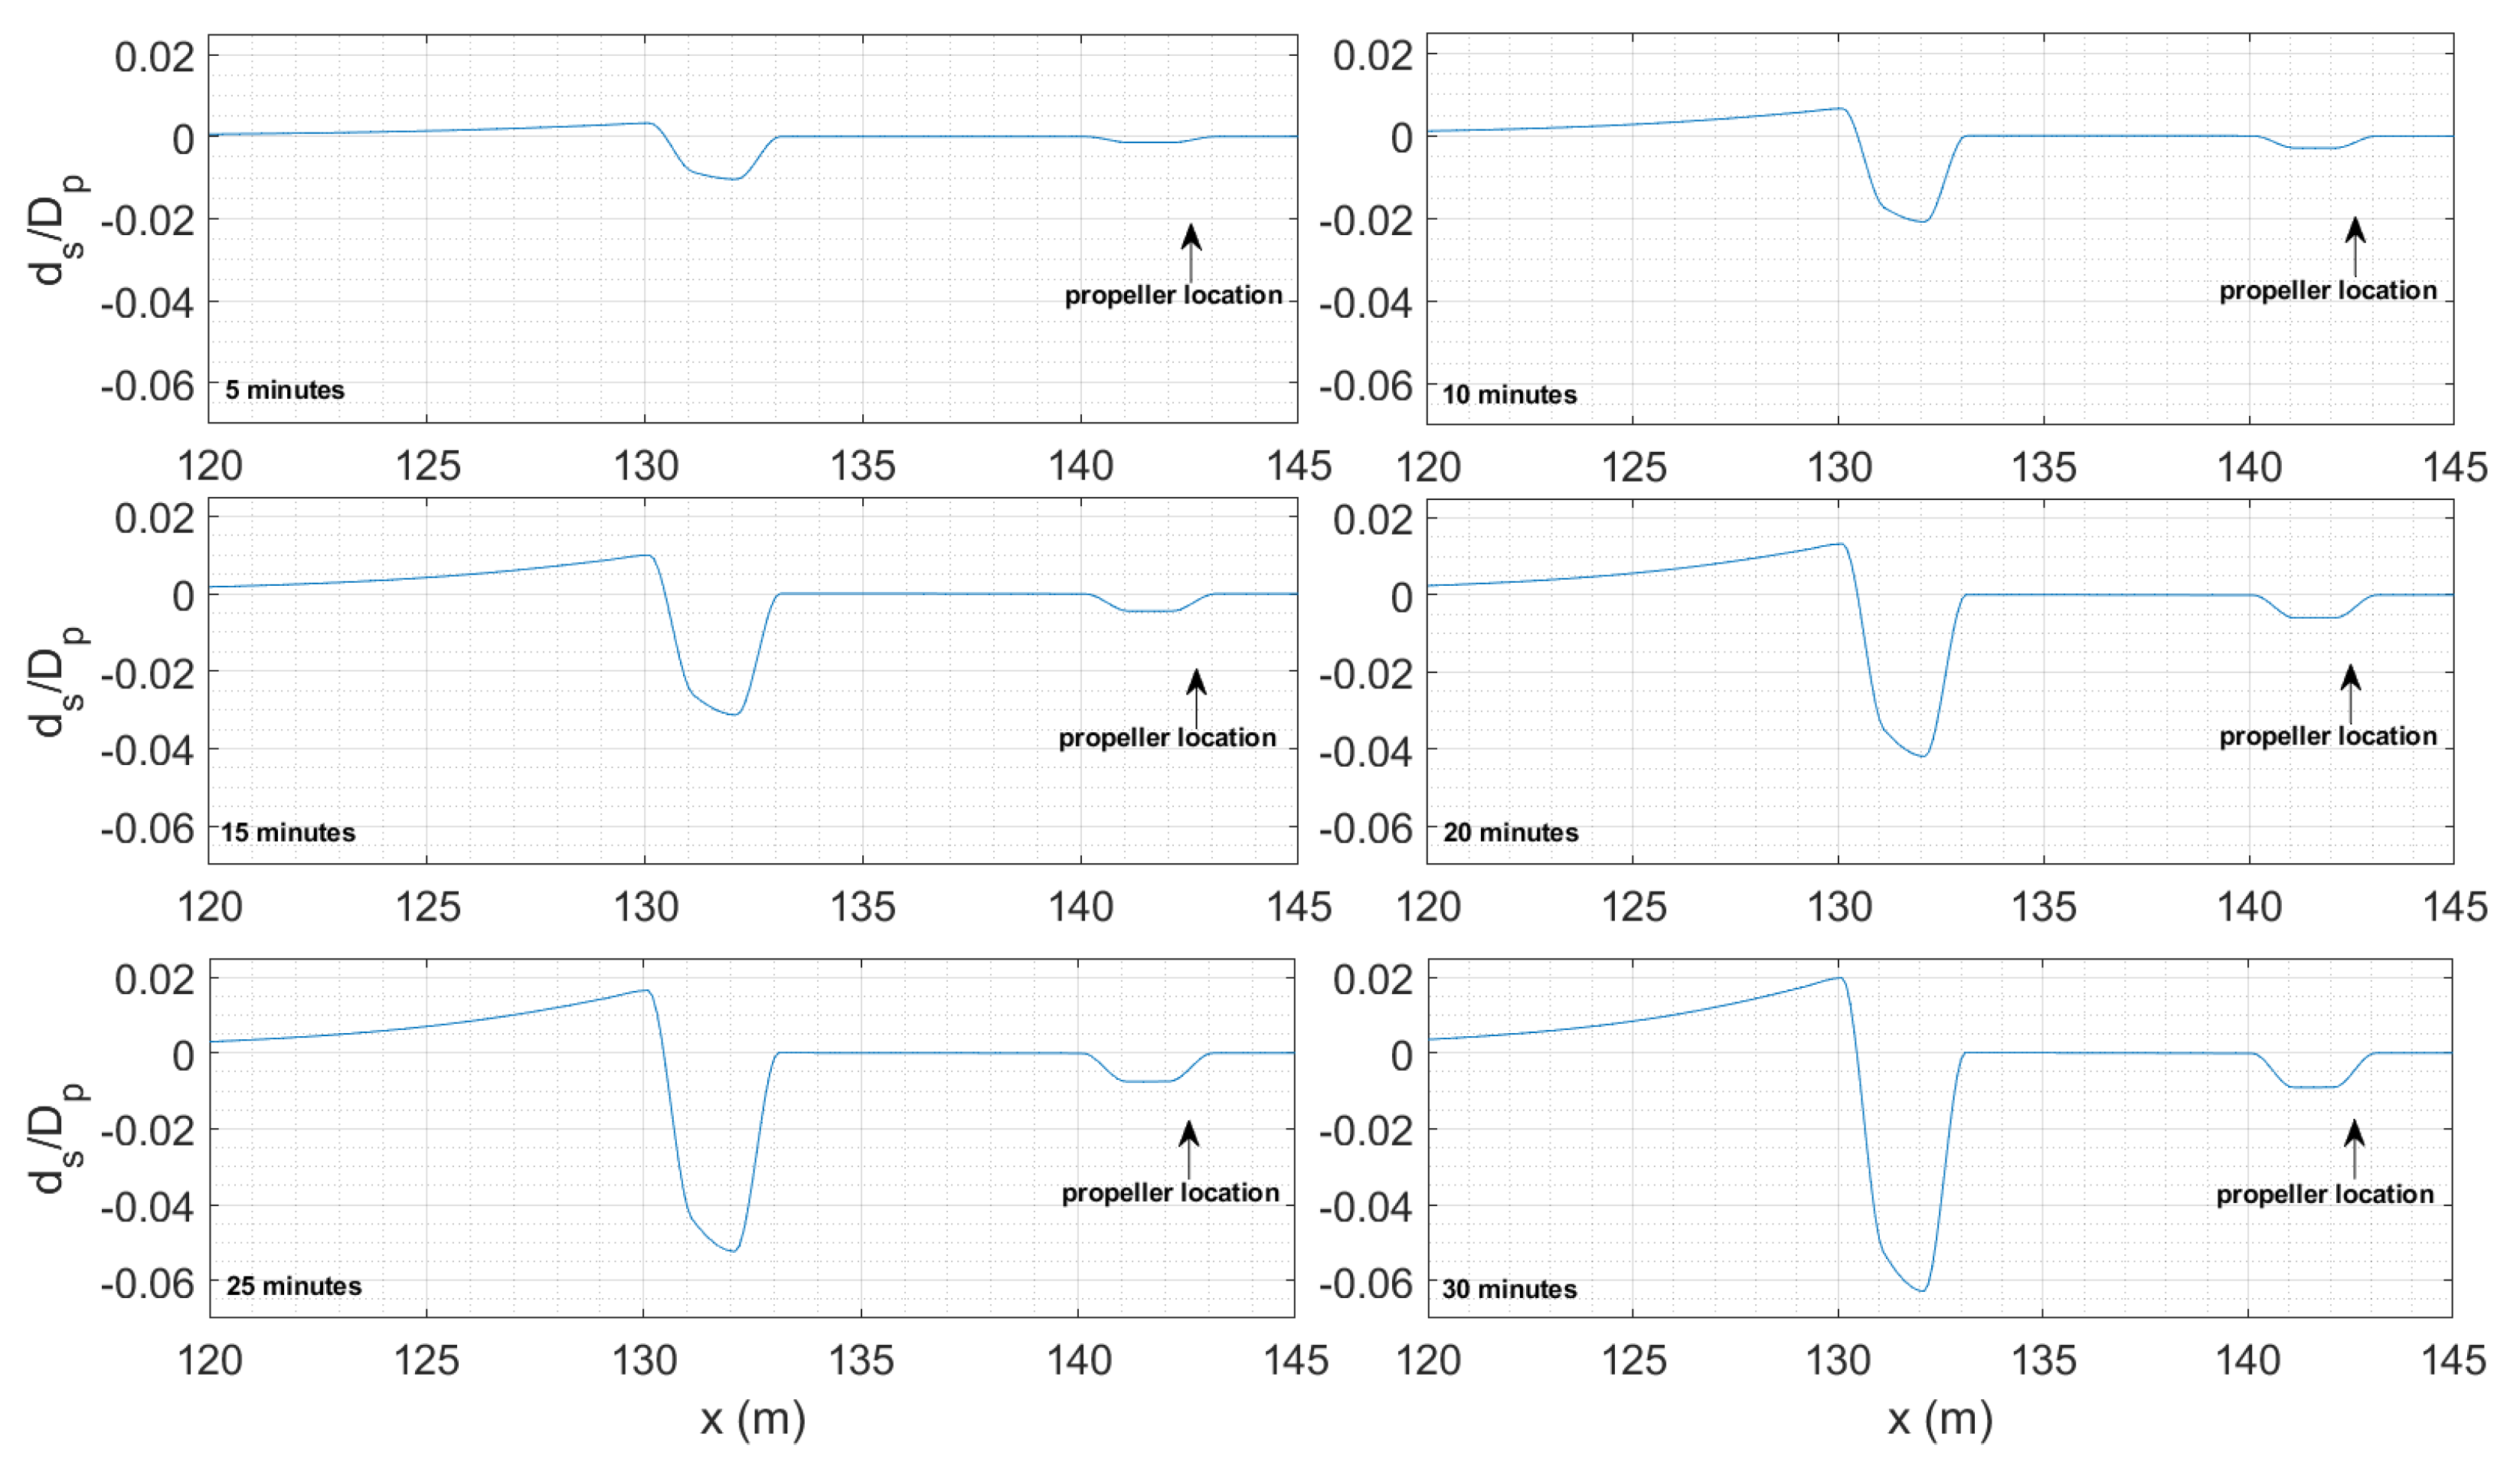
The lengths, depths, and widths of the scour holes are scaled with the propeller diameter, obtaining l s / D p , d s / D p , and w s / D p , respectively. An additional numerical test with a duration of 30 min is performed to observe the temporal evolution of the scour holes and the deposition height downstream. Figure 6 and Figure 7 show the modelled temporal evolution of the normalized plan scour profile d s / D p along the centreline of the propeller due to the suspended and bed load, respectively.
The horizontal span of the domain is represented on the x-axis, where the propeller location is indicated by a black arrow. Each panel represents the growth of the two scour holes and the accumulation zone, depicted in blue and red, respectively, every five minutes. For clarity, only two levels of the dimensionless scour depth are illustrated, corresponding to −0.0001 (erosion) and 0.0001 (accretion) for the suspended load (see Figure 6) and −0.001 (erosion) and 0.001 (accretion) for the bedload (see Figure 7). In Figure 6, the eroded area and the consequent lateral accumulation zone increase gradually with time. Similarly, Figure 7 shows that the width and length of the main scour increase progressively during the simulation. In particular, w s is found to be around 5 D p at the end of the simulation. On the contrary, the width of the accumulation seems to extend slightly while its length expands downstream during the entire duration of the numerical simulation.
Figure 8 and Figure 9 show, respectively, the suspended load- and bed load-induced scour profile progression along the centreline during the simulation. In Figure 8, it is observed that the propeller rotation generates erosion in response to the near-bed velocity profile. This eroded area tends to grow with time and contributes to the enhancement of the total scour. Additionally, it plays a crucial role in the erosion of the deposition mound, which is created due to the bed load. Figure 9 reveals that, at the initial stage of the simulation, the first scour area to appear is the primary hole at a distance from the propeller approximately equal to 3 D p . Also, a small amount of sediment begins to accumulate downstream, while both the scour depth and the deposition mound tend to increase with time. Simultaneously, a dune begins to form downstream of the primary scour hole, as well as the secondary scour upstream, in proximity to the propeller location.
Finally, the dependence of the dimensionless maximum scour depth on the revolution speed is evaluated for stationary vessel cases. Figure 10 provides the dimensionless maximum scour depths due to the total load (black bullets). An exponential function is fitted to the numerical values (f(x) = a· exp(bx), with a = 0.015 and b = 1.91), with a coefficient of determination R2 equal to 0.98, confirming the existence of an exponential law between the revolution speed and the scour depths.

3.3. Numerical Results on the Ship Propeller Effect: The Moving Vessel Case

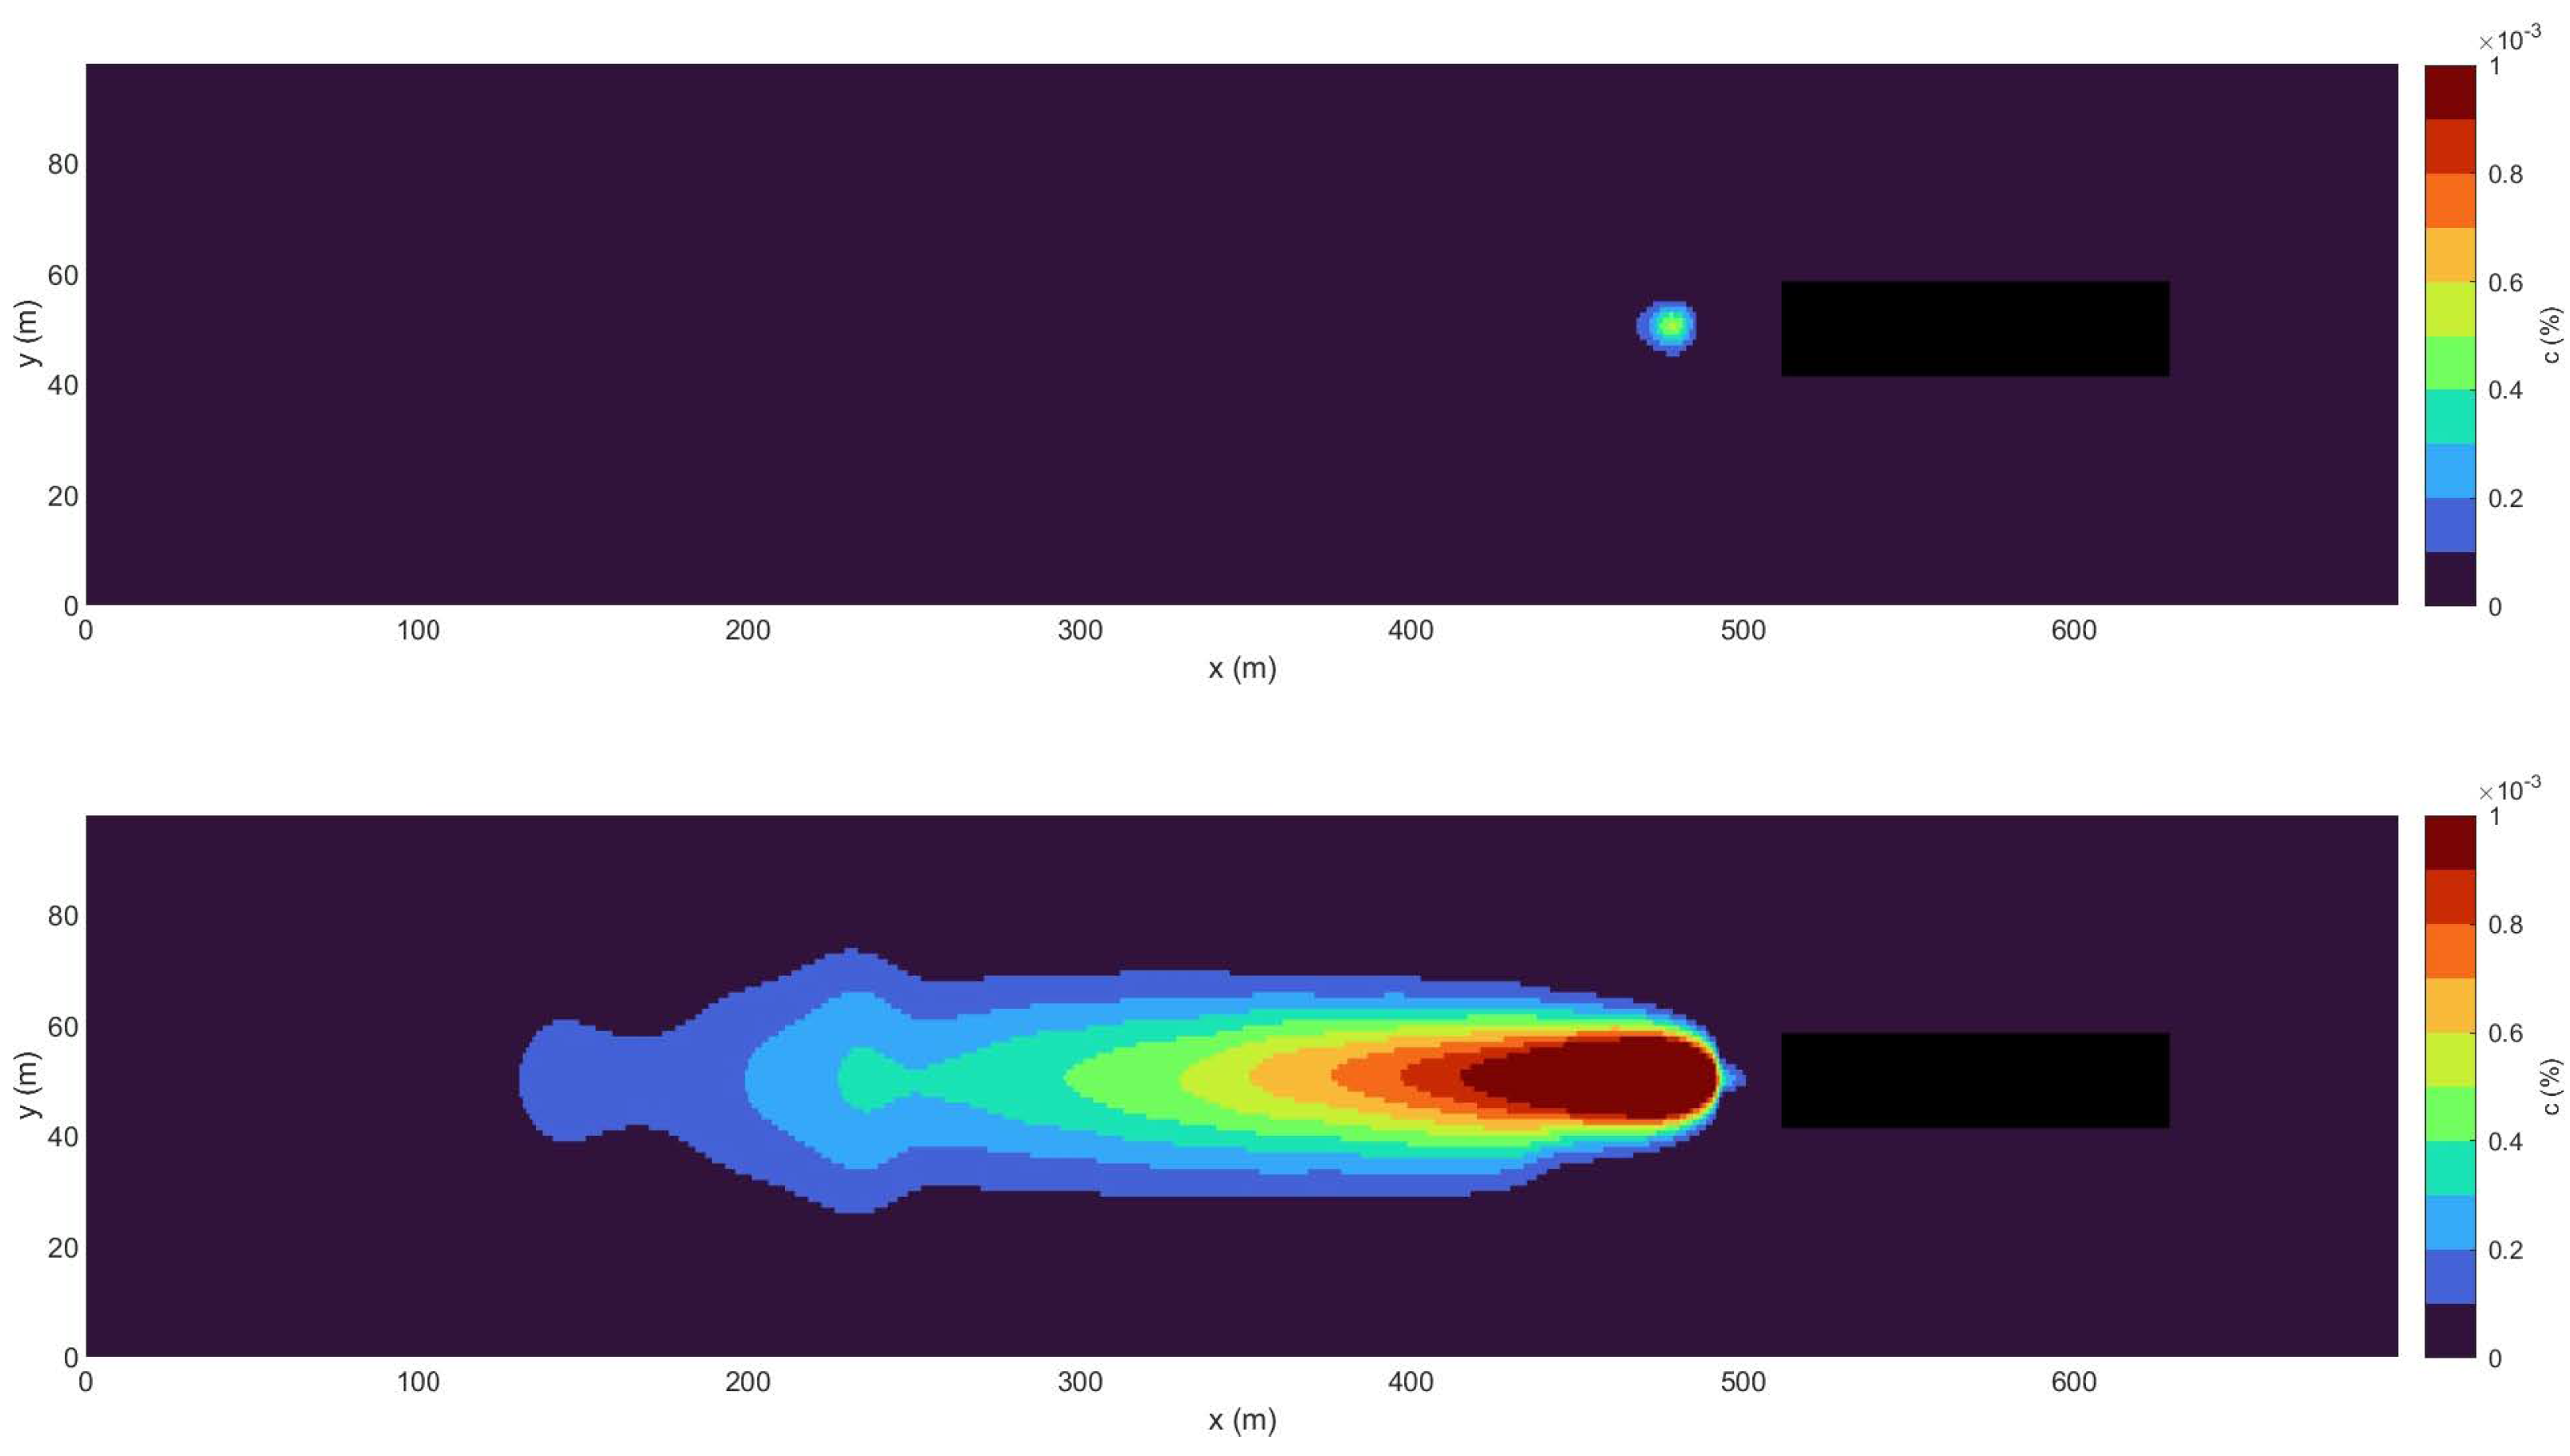
For moving vessel cases, unlike stationary vessel cases, the suspended load prevails over the bed load, thus governing the morphological evolution of the seabed. This is observed in Figure 11, where the evolution of the suspended sediment concentration without (top panel) and with (bottom panel) propeller implementation is shown. The concentration is significantly larger when the propeller effect is included, confirming that it plays an important role in the resuspension of sediment on the seabed.
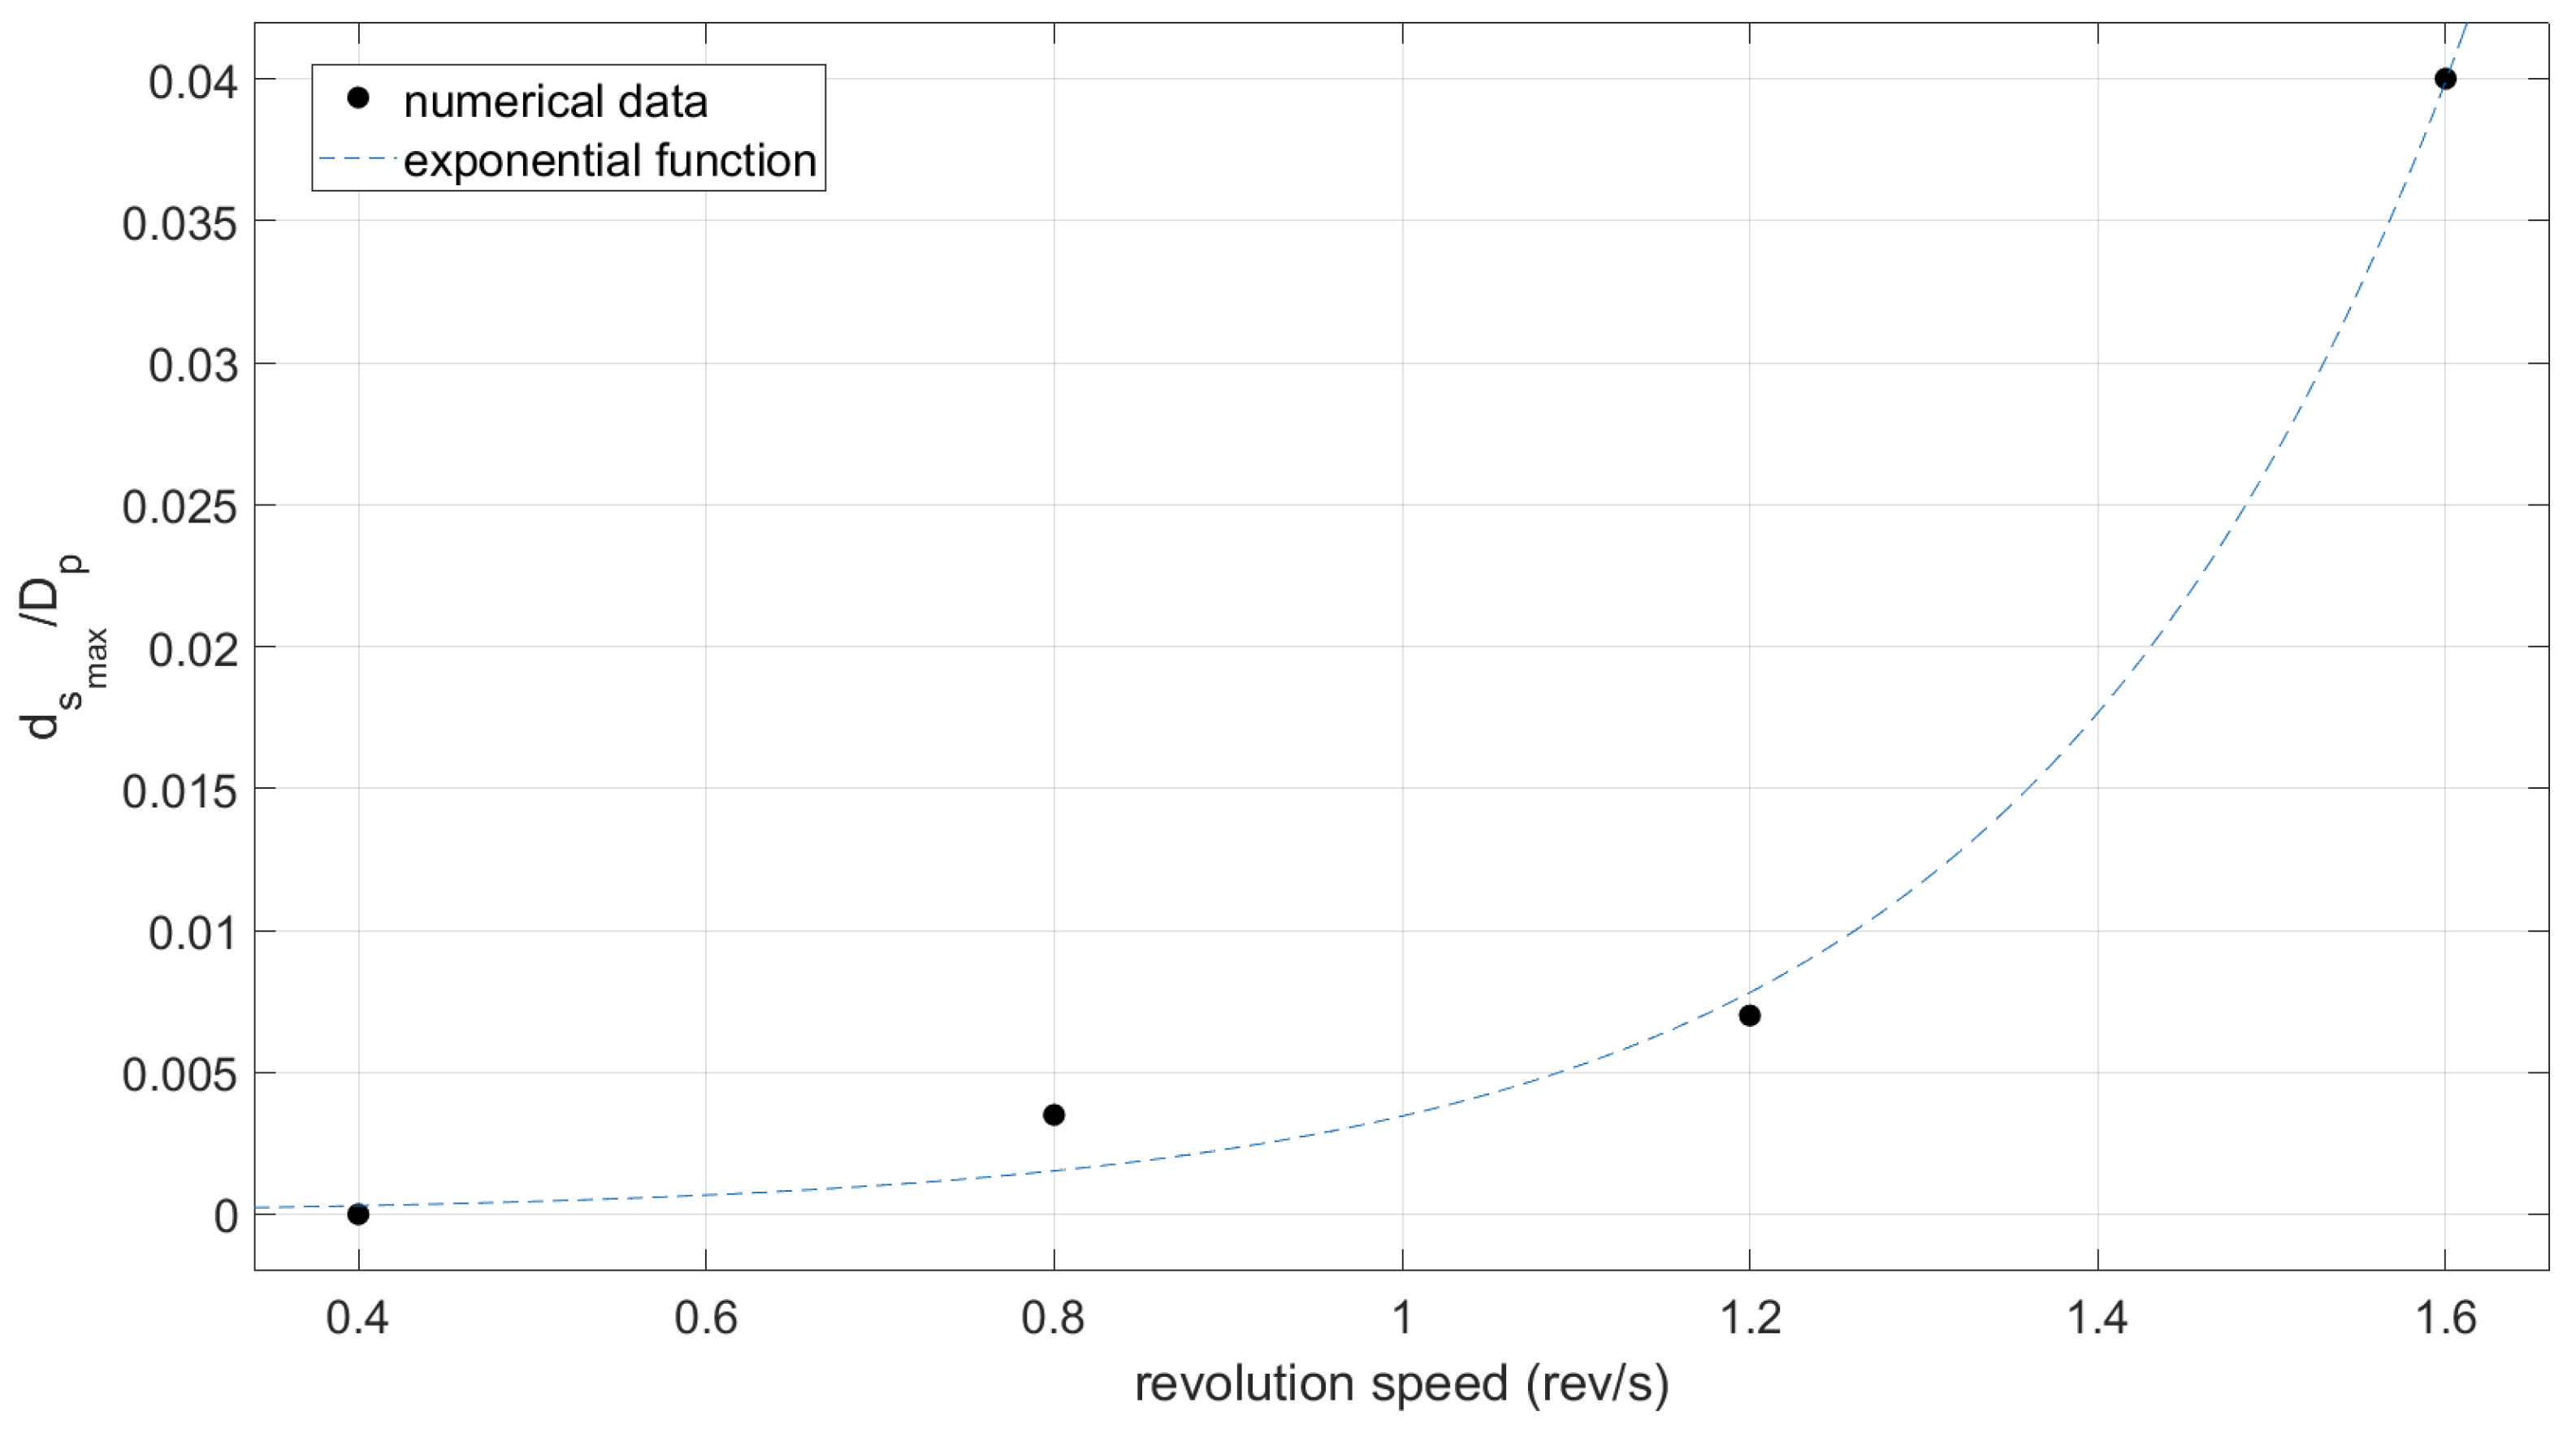
As in stationary cases, the variation of dimensionless scour depths with respect to the revolution speed is evaluated and presented in Figure 12 for moving vessel cases Run0m–Run3m. Similarly to stationary vessel cases, the numerical values are well fitted by an exponential curve (blue dashed line) f(x) = a·exp(bx), with a = 2.7 × 10⁻⁵ and b = 3.09, with a coefficient of determination R2 equal to 0.98. Although the values are significantly lower than in stationary vessel cases, the same behaviour is observed between the scour depth and revolution speed values.

4. Discussion

4.1. Propeller-Induced Velocity Field

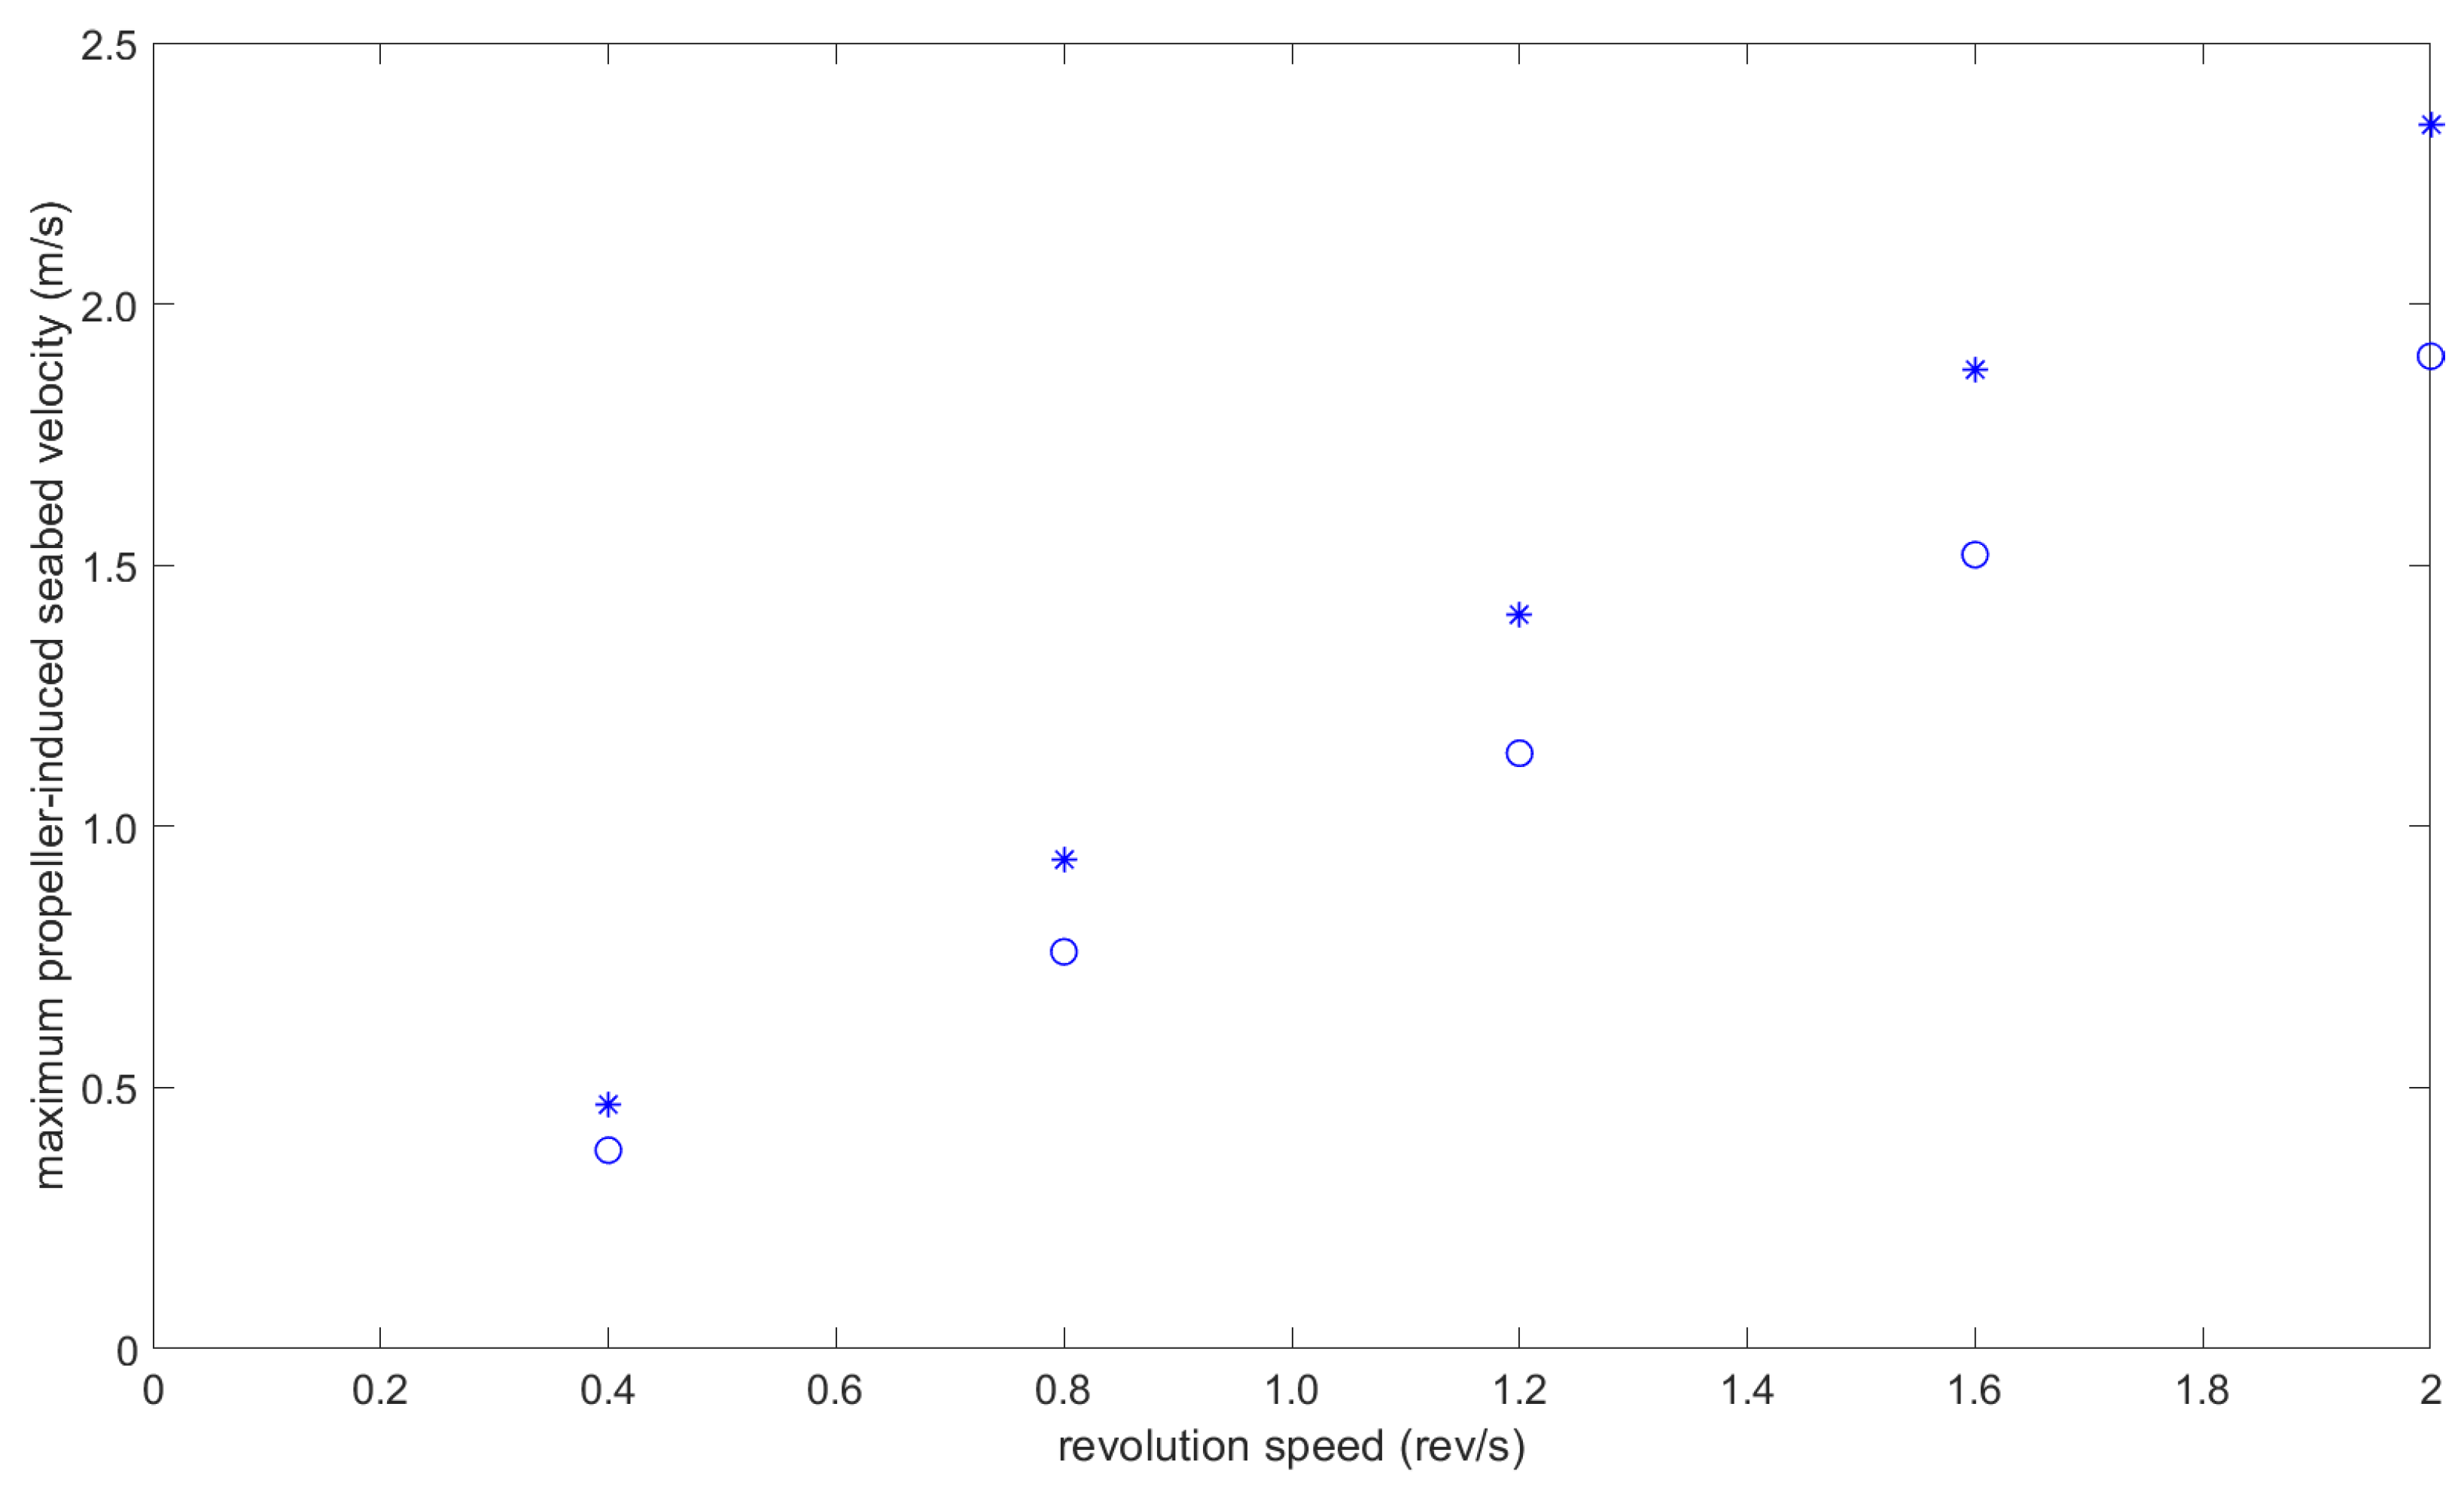
As presented in Figure 3, propeller-induced velocities decrease when moving away from the propeller, resulting in a Gaussian distribution. The same distribution of the flow velocities at the bed was also assumed in the Dutch method [19] for the estimation of maximum velocities at the bed. The magnitude of the maximum velocity derived from the present numerical implementation was found to be in good agreement with the values calculated using the Dutch method, especially for smaller values of the revolution speed, as shown in Figure 13. The values of the seabed velocity derived from the numerical simulations and from the Dutch method are represented by asterisks and bullets, respectively.
Similarly to stationary cases, the same pattern of propeller-induced seabed velocities was also found for the moving vessel. Slight differences in magnitudes were mainly found due to a lower value of C t , which depends on the advance speed.

4.2. Morphological Evolution of the Bed: The Stationary Vessel Case

For the case of the stationary vessel, the propeller effect is clearly evident, especially when compared to implementation without a propeller. Basically, the main difference is due to the propeller-induced flow field behind the vessel, which is responsible for modifying the bed shear stress and causing the bottom evolution. On the contrary, when the propeller dynamics are not implemented, no changes are noticed on the seabed.
The top panel of Figure 5 shows that the suspended load-induced bed evolution patterns reflect the propeller-induced velocity field of Figure 3 fairly well. This is because the bed evolution equation is evaluated from the sediment continuity equation, in which the time-averaged pickup and deposition rates are used. In particular, as indicated in Equation (4), the former term directly depends on the bed shear stress related to the velocity through the friction coefficient. In the middle panel of Figure 5, the bed load effect is illustrated. A comparison of this to the velocity field caused by the propeller on the bed shows that the generation of the scour holes matches the gradients of the velocities. In fact, moving downstream from the propeller, the first scour hole (i.e., the secondary hole) is formed where the velocity behind the vessel increases from very low values (around zero) to 0.4 m/s. Another jump of approximately 0.4 m/s in the bottom velocities is found to be close to the transition area between the ZFE and the ZEF. The velocity increases from 0.4 m/s in the ZFE to 0.7 m/s in the ZEF, originating in the second and main scour hole. Such a trend can be explained by the governing equation of the seabed morphological evolution, in which the bed load fluxes contribute through the gradient, as reported in Equation (9).
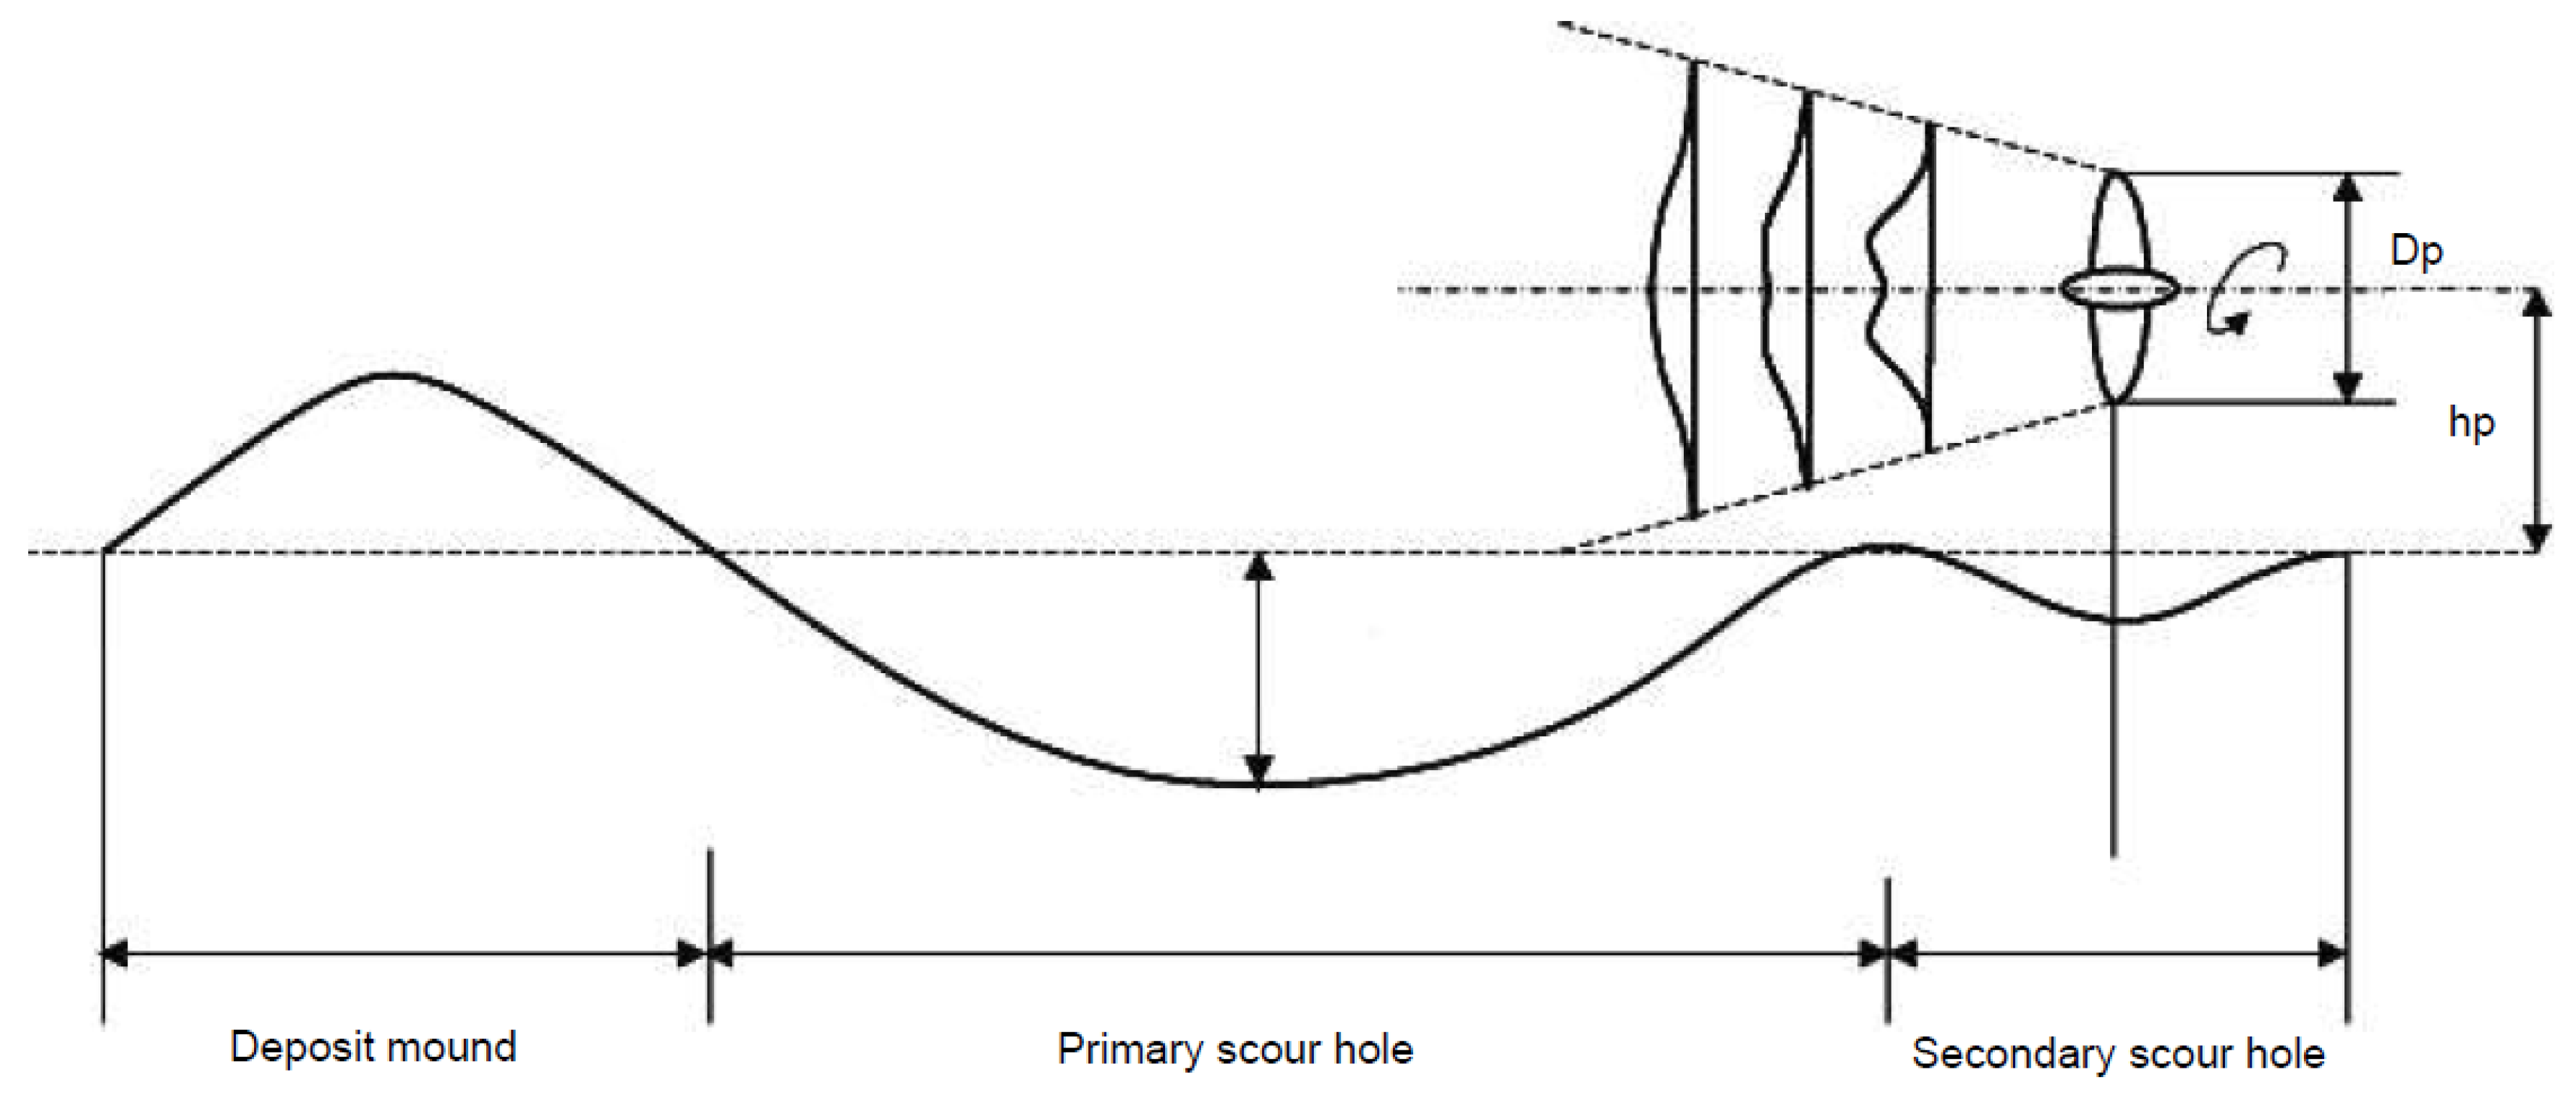
In the following section, results are presented to provide a qualitative comparison with the main relevant literature findings to better understand the behaviour of the numerical model. However, it is important to note the differences between the numerical setup and laboratory experiments (largely affected by scale issues), which can partially justify some of the discrepancies observed in the related results. First, the majority of laboratory experiments are characterized by a length scale of an order of centimetres, both for the propeller and the propeller gap. Moreover, the bed sediment corresponds to sand with a typical median grain size in a wide range between 0.5 mm and 10 mm. With reference to the velocities scale, like the efflux velocity and the revolution speed, the Froude scaling law is used. The number of revolutions assumed in the experiments is significantly larger than those practically used in reality. Refer, for example, to the works of Hong et al. [28] and Tan and Yuksel [29]. As explained before, the ratios between these parameters are fundamental in determining the maximum scour depth, depending on the densimetric Froude number F 0 , the ratio between the propeller diameter and the sediment size, and the ratio between the bed clearance and the sediment size. On the other hand, the numerical runs were set up using realistic geometrical and velocity scales, resulting in different values of F 0 , D p / d 50 , and h p / d 50 compared to the experiments. The longitudinal profile of the bottom was compared to the typical longitudinal profile due to a propeller jet shown in Figure 14. Despite the differences in the scale between the experiments and the numerical model, the qualitative behaviour of the bottom was relatively well captured by the model. Referring to the seabed changes induced by the bed load, from the numerical runs, it is possible to observe a minor scour hole in the area directly beneath the propeller, confirming a satisfactory consistency with what was observed in experimental studies [28,29].
An underestimation of the distance of the maximum depth of the primary scour hole is observed in the numerical results. In the experimental results, the primary scour is generated immediately downstream of the secondary scour hole, characterized by a rounded shape and reaching a maximum value at a distance of 4 D p from the propeller (Figure 14). On the contrary, in the numerical results, a plateau appears between the two scour holes, and the peak of the primary scour is observed at a distance of approximately 3 D p . Then, a deposition mound occurs in both cases. Moreover, the numerical model predicts a milder decay of the deposit, resulting in a more elongated shape. The different shapes can be explained by considering the sediment material employed for the seabed in both two cases. In the laboratory experiments, the sediment could not be scaled appropriately according to the scale of the propeller. As mentioned before, laboratory tests were conducted mainly in sandy environments, characterized by a ratio between the propeller and the sediment diameter varying from 50 to 103 (see, for example, [28] or [29]). Conversely, the scale in the present numerical simulations is based on real values. Therefore, it is not possible to apply the same scaling factor in the numerical and experimental tests. This explains the larger ratio between the propeller and the sediment diameter in the numerical runs, which is ten times larger than in the experimental case. Thus, while the suspended load is negligible in the experiments, it has a great impact on the numerical results due to scaling effects. Referring to the work of Schmunk et al. [27], in case of silt materials, it was observed that the longitudinal profile is characterized by a deposit height much lower than that occurred in sand, mainly due to water turbidity in the experiments with silt. The temporal development of the scour profile (see Figure 8 and Figure 9) is such that the primary scour hole is generated first and grows over time until the end of the simulation. At the same time, the generation of the primary scour hole is responsible for the development of a deposition mound downstream. Then, a secondary scour hole occurs in proximity to the propeller face. A similar trend was noticed by Hong et al. [28], who performed experimental tests and identified the following four stages of scour evolution:
  • The initial stage, in which the primary scour hole is formed downstream of the propeller, while no scour occurs beneath the propeller. A deposition mound is developed downstream of the primary scour hole.
  • The developing stage, in which the primary scour hole increases in size. In addition, due to the fluid entrainment behind the propeller caused by the jet flow, a small scour hole can be noticed directly beneath the propeller. The two holes remain separated.
  • The stabilization stage, in which both the holes are growing.
  • The asymptotic stage, during which the scour holes are merged. This stage is also referred to as the equilibrium stage, in which the maximum scour is reached.
In the present model, the stabilization and equilibrium stages cannot be reached since the hydrodynamics are not yet coupled with the propeller module. However, the numerical results present significant similarities in the scour profile progress for the initial and the developing stages.
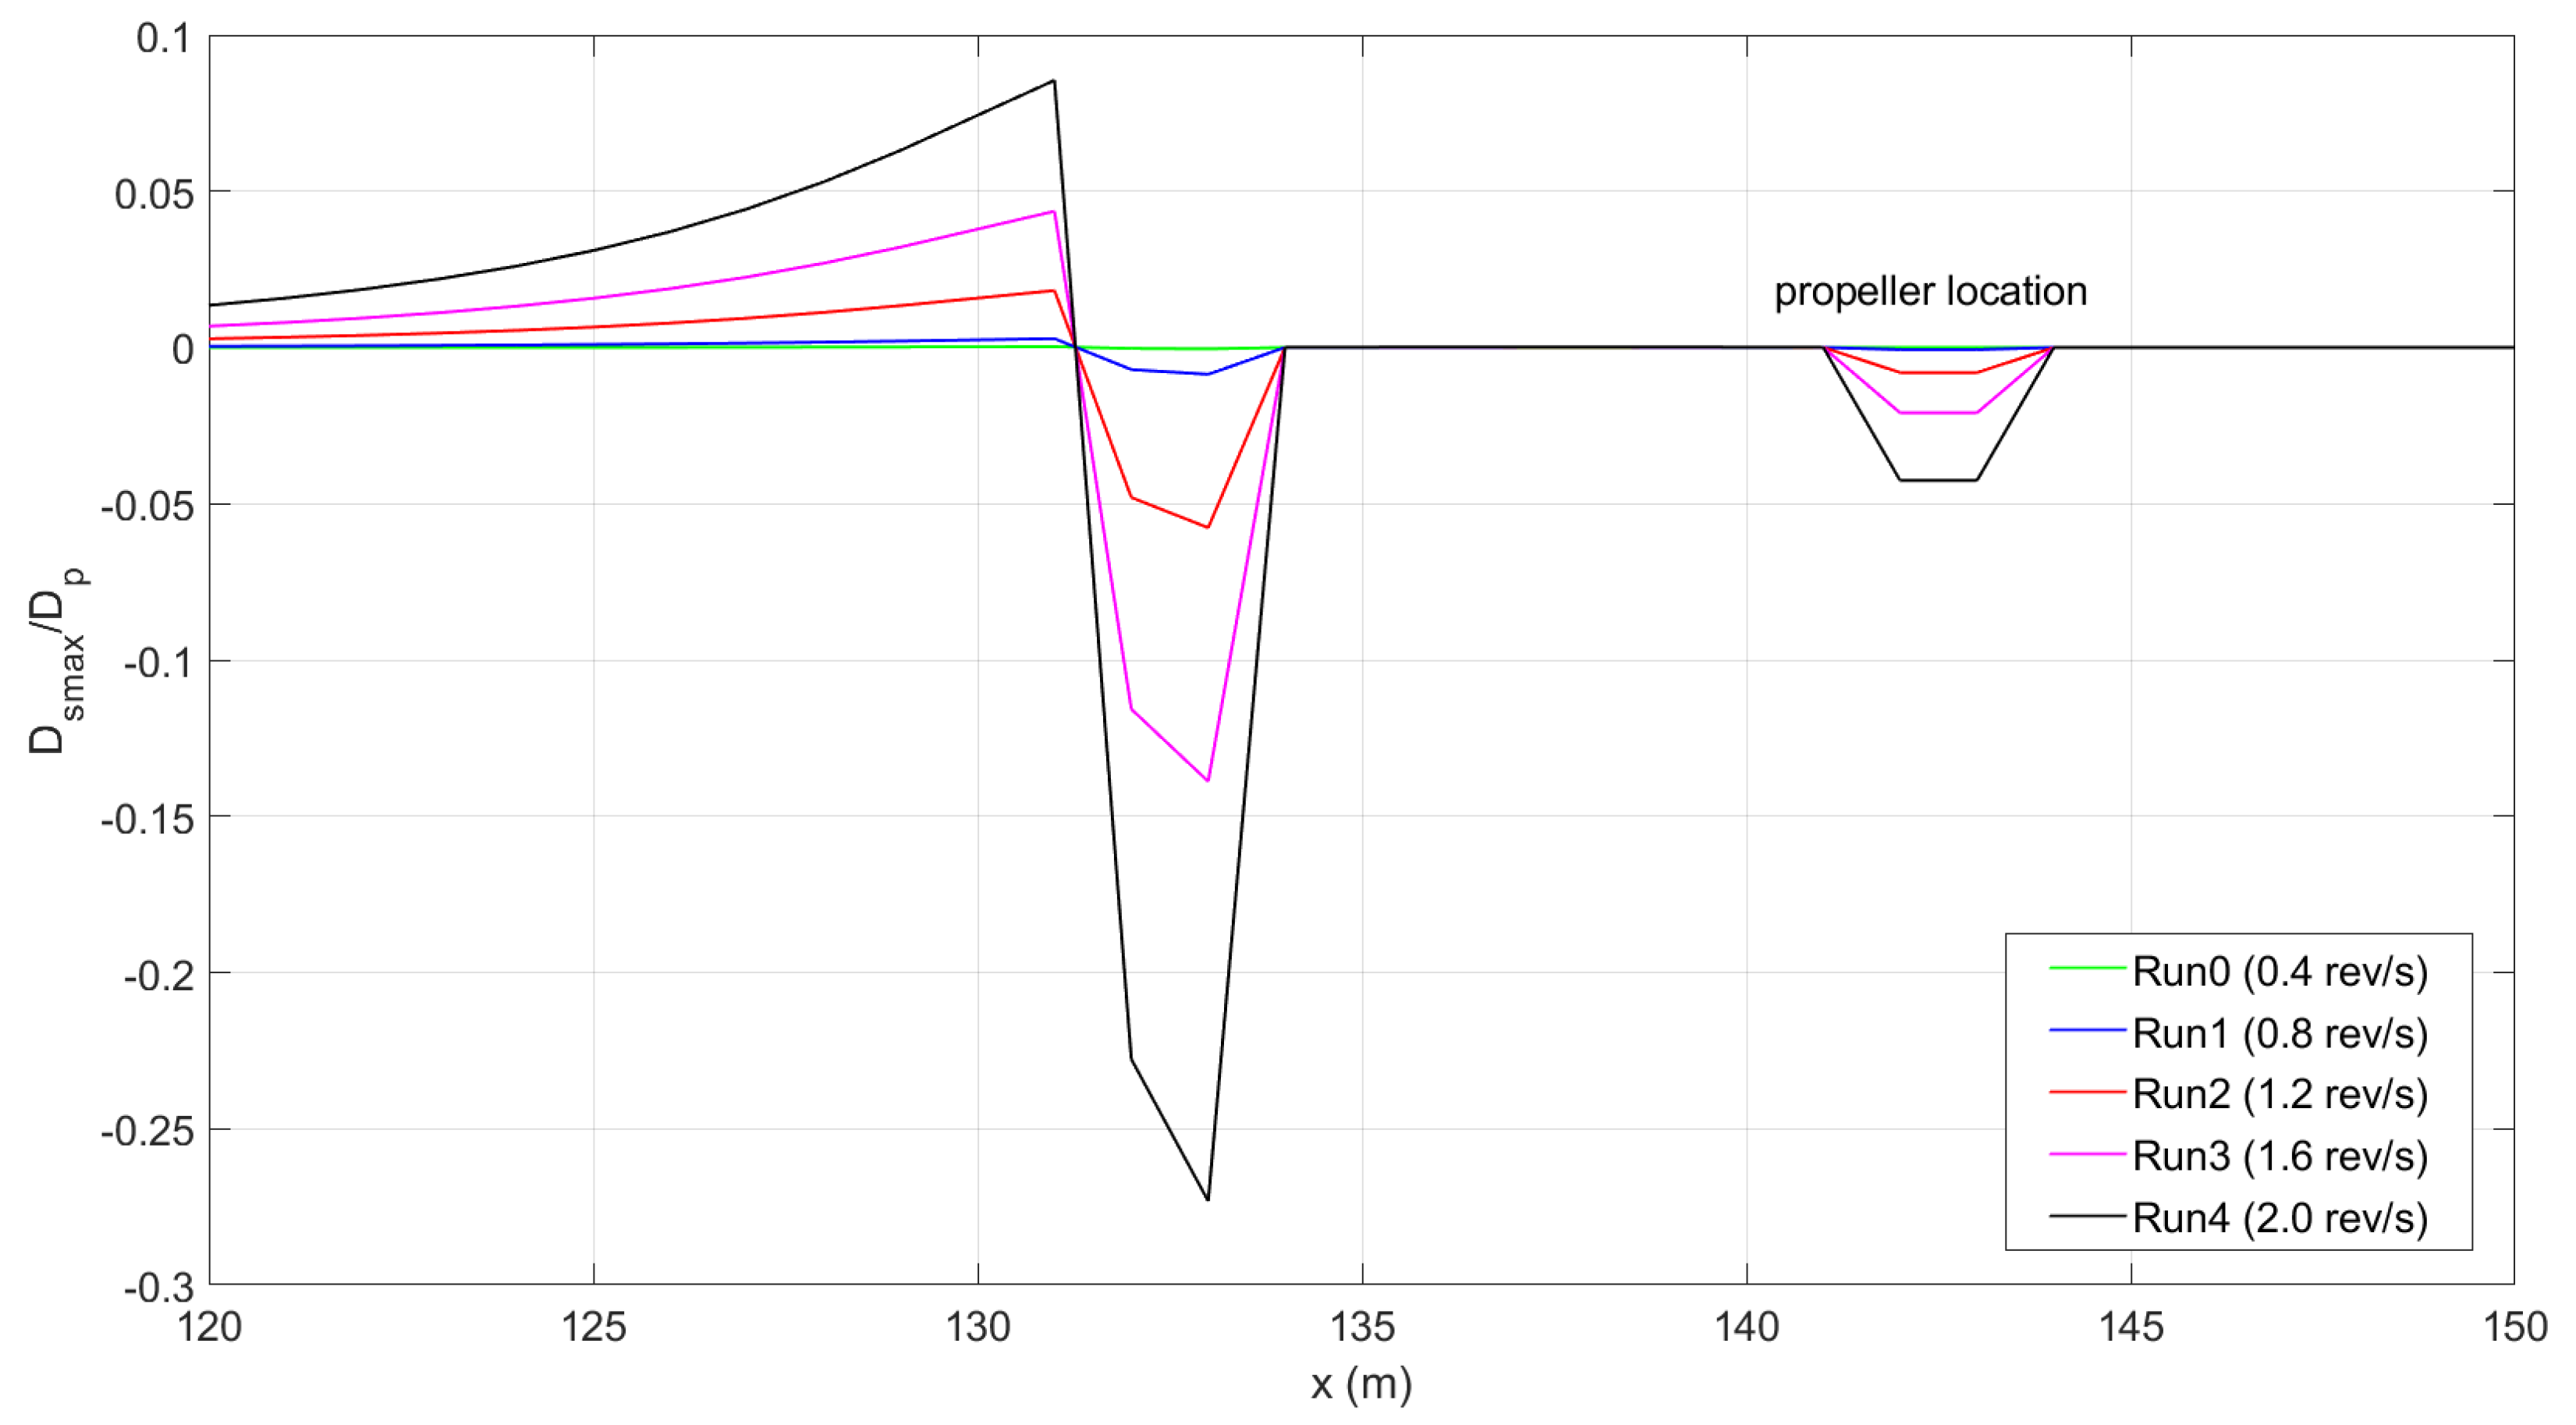
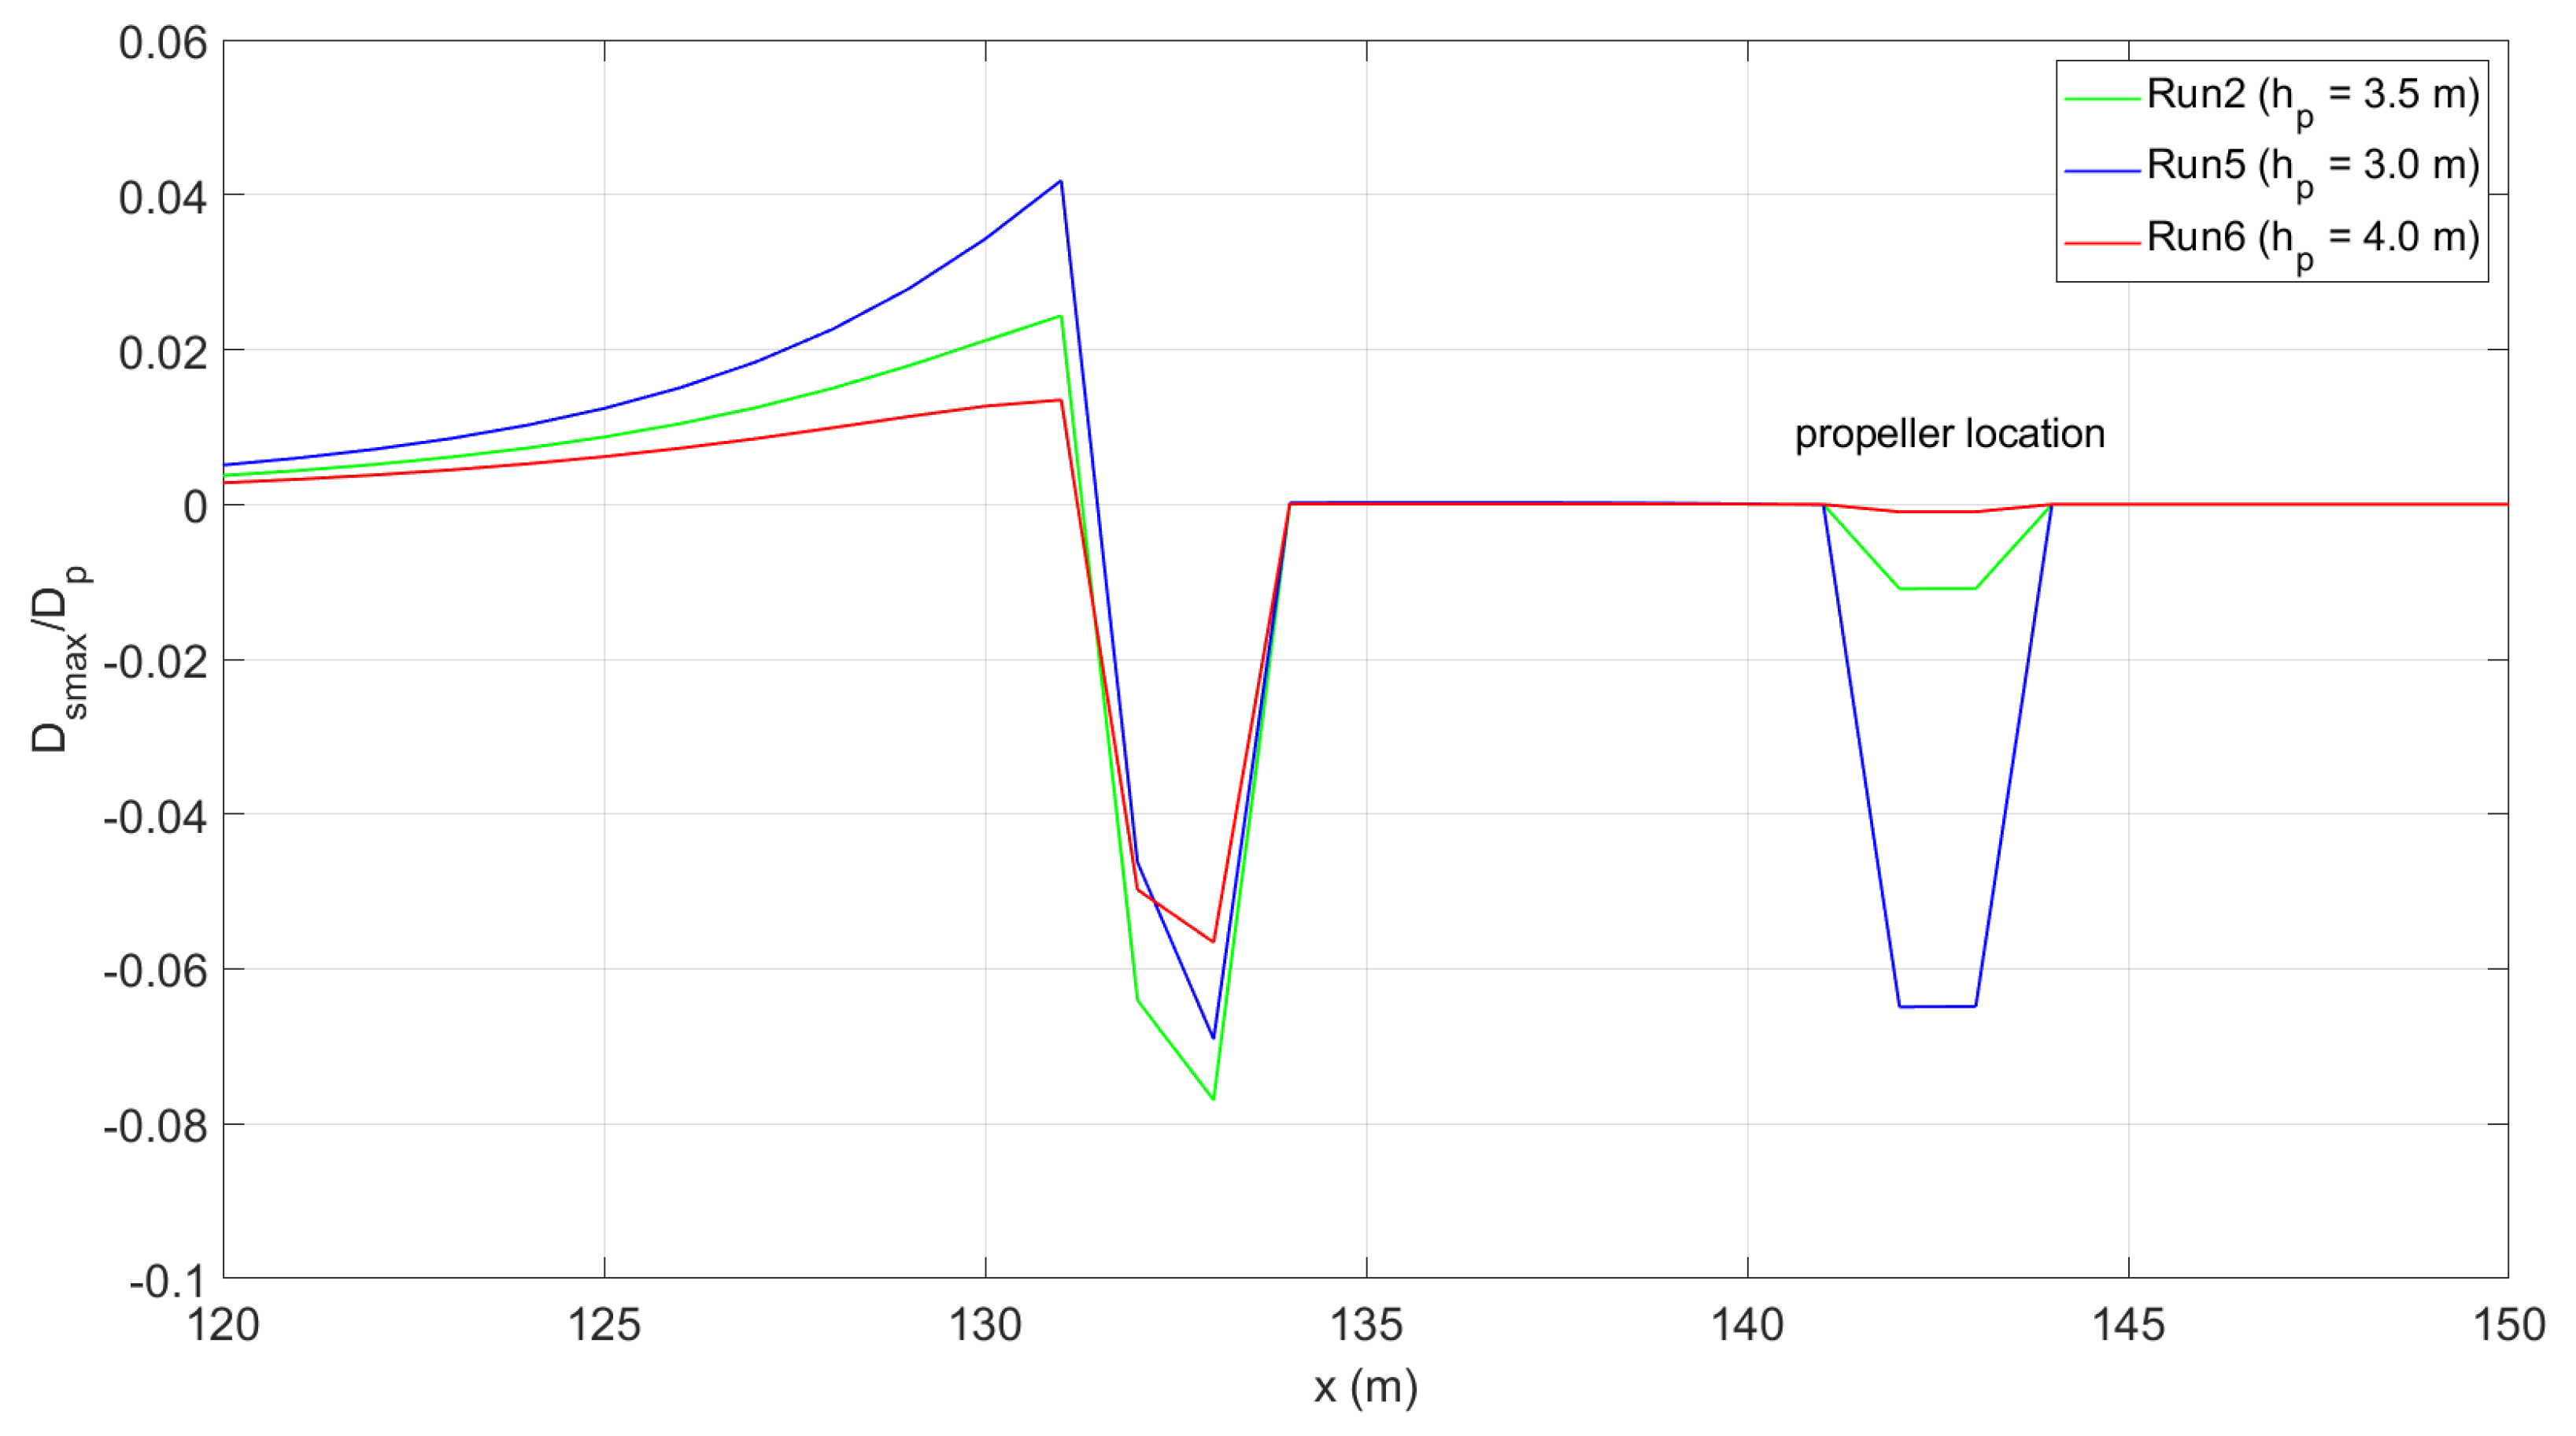
The longitudinal scour profiles are presented in Figure 15 and Figure 16 for numerical tests conducted with different propeller speeds and different bed clearances h p (consequently different offset height ratios h p / D p ), respectively. In Figure 15, the longitudinal scour profile due to the bed load is presented for different revolution speeds and a constant value of h p (3.5 m) for the stationary vessel case. The x and y axes represent the horizontal distance (in m) and the dimensionless scour depth ( d s / D p ), respectively, for test cases Run0, Run1, Run2, Run3, and Run4, characterized by different revolution speeds, indicated in the legend. For a specific value of the bed clearance ( h p = 3.5 m), slower revolution speeds correspond to a shallower scour depth and deposition mound, as mentioned by Hong et al. [28] and in cases 1 and 3 in the study by Tan and Yuksel [29]. Conversely, Figure 16 shows the dependence of the dimensionless maximum scour depth on the bed clearance h p for a constant revolution speed of 1.2 rev/s. Three different values of bed clearances, specified in the legend, were examined corresponding to Run2, Run5, and Run6. As expected, the larger the distance from the propeller axis to the seabed, the lower the overall effect on the bed morphology.
The reduction in bed clearance seems to mainly increase the secondary scour hole developing in proximity to the propeller location. This trend was also observed in Hong et al. [28]. Referring to Figure 7 of Hong et al. [28], the authors showed the dimensionless scour profiles for an offset ratio ( h p / D p ) equal to 0.5 and 1 for different numbers of revolutions. The main difference is the size of the secondary scour depth. A comparison of the values obtained shows that the dimensionless depth of the secondary scour hole for h p / D p = 0.5 is almost double that obtained for h p / D p = 1 .
For moving vessel cases, results have pointed out that the propeller jet dynamics on the bathymetry are considerably smaller than in stationary vessel cases, as already mentioned in BAW [26]. However, the presence of the propeller can significantly enhance sediment transport, especially in terms of suspended sediment concentration, since the propeller rotation tends to resuspend the sediment lying on the seabed. This is observed in Figure 11, where suspended sediment concentration is presented without (top panel) and with (bottom panel) propeller implementation. It is interesting to notice that, although the propeller cannot increase the net sediment transport inside a harbor basin, it plays a crucial role in mobilizing and resuspending sediment. This effect might be stronger in the case of fine and loose sediment, characterized by small settling velocities and remaining in suspension for longer periods, generating sediment plumes.

5. Conclusions

In the present work, the implementation of the propeller contribution in the numerical model FUNWAVE is presented and evaluated. The propeller-induced effect on sediment transport was implemented in terms of a velocity field on the seabed, resulting in an additional contribution to the shear velocity and the consequent bed shear stress. The bottom velocity computed in the ship–wake module has been expressed as a function of the efflux velocity, inherently depending on the propeller characteristics, such as the revolution speed, the propeller diameter, and the thrust coefficient, and on geometrical parameters, such as the radial distance from the propeller axis and the clearance between the propeller axis and seabed. Numerical tests were carried out for cases of both stationary and moving vessels. The numerical results presented qualitative similarities to literature findings, mainly in the scour development process and in the longitudinal profile of the scour, confirming the ability of the model to reproduce the main morphological characteristics. More precisely, both the numerical and experimental scour profiles show the existence of two scour holes, followed by a deposition mound downstream. In moving vessel cases, the suspended load prevails over the bed load and plays a dominant role in the morphological evolution of the seabed. Moreover, smaller scour depths were observed in moving vessel cases. Finally, the dependence of the dimensionless maximum scour depth on the number of revolutions was evaluated and presented, and the values were well fitted by an exponential function for both stationary and moving vessel cases.
However, the numerical approach is based on a number of assumptions, so adjustments need to be considered to improve the representation of the propeller wash in the model. First, an additional momentum flux due to the propeller wash should be included in the hydrodynamic equations. In addition, the propeller jet should also affect the hydrodynamic computation, which should be coupled with the morphodynamics. Hence, further numerical and experimental tests need to be performed in order to better calibrate and validate the present model, with the aim of providing a useful tool in predicting scour processes, which is crucial in the design and management of ports, navigation channels, and maritime structures. Additionally, this will help the authorities to evaluate multiple factors, such as the potential impact of increased traffic on the seabed and the maximum draught of vessels entering the basin, without causing severe consequences for their operativity.

Author Contributions

Conceptualization, A.D., M.B., C.C. and G.L.; methodology, A.D., C.C. and G.L.; software, A.D., C.C. and G.L.; validation, C.C. and G.L.; writing—original draft preparation, C.C. and G.L.; writing—review and editing, M.B.; visualization, C.C. and G.L.; supervision, M.B.; project administration, M.B.; funding acquisition, M.B. All authors have read and agreed to the published version of the manuscript.

Funding

This research received no external funding.

Institutional Review Board Statement

Not applicable.

Informed Consent Statement

Not applicable.

Data Availability Statement

All numerical data are available, please contact the corresponding author by e-mail.

Acknowledgments

The help and support of Fengyan Shi of the University of Delaware is deeply appreciated.

Conflicts of Interest

The authors declare no conflicts of interest.

References

  1. Johnston, M.M.; Hammack, E.A. Three-Dimensional Numerical Model Study of Flow Near a Scour Hole in Isle of Wight Bay Near Ocean City, Maryland; US Army Engineer Research and Development Center, Coastal and Hydraulics: Vicksburg, MI, USA, 2022. [Google Scholar]
  2. Wang, P.F.; Rivera-Duarte, I.; Richter, K.; Liao, Q.; Farley, K.; Chen, H.C.; Germano, J.; Markillie, K.; Gailani, J. Evaluation of Resuspension from Propeller Wash in DoD Harbors; ER-201031; Defense Technical Information Center: Fort Belvoir, VA, USA, 2016.
  3. Garland, K.A. The San Jacinto River Waste Pits Superfund Site: An Assessment of Remedial Options for Sites with Dioxin-Contaminated Sediments with Implications for Remedy Selection at the San Jacinto Site; Texans Together: Houston, TX, USA, 2015. [Google Scholar]
  4. Maynord, S.T. Physical Forces near Commercial Tows; Coastal and Hydraulics Laboratory (US): Kitty Hawk, NC, USA, 2000. [Google Scholar]
  5. UDF Manual. ANSYS FLUENT 12.0. In Theory Guide; ANSYS, Inc.: Canonsburg, PA, USA, 2009; p. 67. [Google Scholar]
  6. Lam, W.; Robinson, D.J.; Hamill, G.A.; Johnston, H.T. An effective method for comparing the turbulence intensity from LDA measurements and CFD predictions within a ship propeller jet. Ocean Eng. 2012, 52, 105–124. [Google Scholar] [CrossRef]
  7. Tavouktsoglou, N.S.; Dimakopoulos, A.; Spearman, J.; Whitehouse, R.J. Application of two phase Eulerian CFD model to simulate high velocity jet induced scour. In Proceedings of the International Conference on Offshore Mechanics and Arctic Engineering; American Society of Mechanical Engineers: New York, NY, USA, 2020; Volume 84409, p. V008T08A003. [Google Scholar]
  8. Srše, J.; Perkovič, M.; Androjna, A.; Brcko, T. Solutions to minimize sediment resuspension in ports. Časopis Pomor. Fak. Kotor J. Marit. Sci 2022, 23, 47–56. [Google Scholar] [CrossRef]
  9. Craig, P.M.; Jung, J.Y.; Mausolff, Z.; Bastidas, L.A.; Mathis, T.; Wang, P.F. Modeling sediment resuspension and transport processes induced by propeller wash from ship traffic. J. Hydraul. Eng. 2023, 149, 04023009. [Google Scholar] [CrossRef]
  10. Shi, F.; Kirby, J.T.; Tehranirad, B.; Harris, J.C.; Grilli, S. FUNWAVE-TVD Fully Nonlinear Boussinesq Wave Model with TVD Solver Documentation and User’s Manual. In Research Report NO. CACR-11-04; University of Delaware: Newark, DE, USA, 2011; Volume 2, p. 1. [Google Scholar]
  11. Kirby, J.T.; Wei, G.; Chen, Q.; Kennedy, A.B.; Dalrymple, R.A. FUNWAVE 1.0: Fully nonlinear Boussinesq wave model-Documentation and user’s manual. In Research Report NO. CACR-98-06; University of Delaware: Newark, DE, USA, 1998. [Google Scholar]
  12. Wei, G.; Kirby, J.T.; Grilli, S.T.; Subramanya, R. A fully nonlinear Boussinesq model for surface waves. Part 1. Highly nonlinear unsteady waves. J. Fluid Mech. 1995, 294, 71–92. [Google Scholar] [CrossRef]
  13. Hamill, G.A. Characteristics of the Screw Wash of a Manoeuvring Ship and the Resulting Bed Scour. Ph.D. Thesis, Queen’s University of Belfast, Belfast, UK, 1989. [Google Scholar]
  14. Albertson, M.; Dai, Y.; Jensen, R.A.; Rouse, H. Diffusion of submerged jets. Trans. Am. Soc. Civ. Eng. 1950, 115, 639–664. [Google Scholar] [CrossRef]
  15. Berger, W.; Felkel, K.; Hager, M.; Oebius, H.; Schale, E. Courant provoque par les bateaux protection des berges et solution pour eviter l’erosion du lit du haut rhin. In Proceedings of the 25th Congress of the Permanent International Association of Navigation Congresses (PIANC), Section I-1, Edinburgh, UK, 10–16 May 1981. [Google Scholar]
  16. Brocchini, M. An analytical description of the energy balance in turbulent, round, free jets. AIP Adv. 2020, 10, 075218. [Google Scholar] [CrossRef]
  17. Fuehrer, M.; Pohl, H.; Romisch, K. Propeller jet erosion and stability criteria for bottom protection of various constructions. Bull. Perm. Int. Assoc. Navig. Congr. 1987, 58, 00654610. [Google Scholar]
  18. Blaauw, H.; van de Kaa, E. Erosion of Bottom and Sloping Banks Caused by the Screw Race of Manoeuvring Ships; Publ. no. 202; Delft Hydraulics Laboratory: Delft, The Netherlands, 1978. [Google Scholar]
  19. PIANC. Guidelines for Protecting Berthing Structures from Scour Caused by Ships; Marcom Report No. 180-2015; PIANC: Brussels, Belgium, 2015. [Google Scholar]
  20. Elder, J. The dispersion of marked fluid in turbulent shear flow. J. Fluid Mech. 1959, 5, 544–560. [Google Scholar] [CrossRef]
  21. Van Rijn, L.C. Sediment pick-up functions. J. Hydraul. Eng. 1984, 110, 1494–1502. [Google Scholar] [CrossRef]
  22. Cao, Z. Equilibrium near-bed concentration of suspended sediment. J. Hydraul. Eng. 1999, 125, 1270–1278. [Google Scholar] [CrossRef]
  23. Meyer-Peter, E.; Müller, R. Formulas for bed-load transport. In Proceedings of the IAHSR 2nd Meeting, Stockholm, Appendix 2; IAHR: Lisbon, Portugal, 1948. [Google Scholar]
  24. Penna, N.; D’Alessandro, F.; Gaudio, R.; Tomasicchio, G.R. Three-dimensional analysis of local scouring induced by a rotating ship propeller. Ocean Eng. 2019, 188, 106294. [Google Scholar] [CrossRef]
  25. Van Lammeren, W.; van Manen, J.V.; Oosterveld, M. The Wageningen B-screw series. SNAME Trans. 1969, 77, 269–317. [Google Scholar]
  26. für Wasserbau, B. Principles for the design of bank and bottom protection for inland waterways (GBB). In BAW Codes of Practice and Guidelines; Bundesanstalt für Wasserbau: Karlsruhe, Germany, 2010. [Google Scholar]
  27. Schmunk, C.; Dogan, M.; Altun, S. Predicting propeller jet scour in silty and sandy marine environments. Ocean Eng. 2023, 286, 115558. [Google Scholar] [CrossRef]
  28. Hong, J.H.; Chiew, Y.M.; Cheng, N.S. Scour caused by a propeller jet. J. Hydraul. Eng. 2013, 139, 1003–1012. [Google Scholar] [CrossRef]
  29. Tan, R.I.; Yüksel, Y. Seabed scour induced by a propeller jet. Ocean Eng. 2018, 160, 132–142. [Google Scholar] [CrossRef]
Figure 1. Schematic view of the propeller-induced axial velocity field at the propeller axis.
Water 16 01647 g001
Figure 2. Three-dimensional sketch of the propeller-induced velocity distribution at the propeller axis and its projection on the seabed.
Water 16 01647 g002
Figure 3. Velocity field on the seabed induced by the propeller for case Run2.
Water 16 01647 g003
Figure 4. Close-up view of the area close to the propeller.
Water 16 01647 g004
Figure 5. Seabed morphological changes in dimensionless form (scaled with the propeller diameter) due to suspended load (top panel), bed load (middle panel) and total load (bottom panel) for Run2.
Water 16 01647 g005
Figure 6. Modelled temporal evolution of the normalized plan scour profiles d s / D p along the propeller centreline due to suspended load for Run2. The red and the blue lines indicate the erosion and the accumulation respectively.
Water 16 01647 g006
Figure 7. Modelled temporal evolution of the normalized plan scour profiles d s / D p along the propeller centreline due to bed load for Run2. The red and blue lines indicate erosion and accumulation, respectively.
Water 16 01647 g007
Figure 8. Modelled temporal evolution of the normalized scour profiles progression along the propeller centreline due to the suspended load for Run2.
Water 16 01647 g008
Figure 9. Modelled temporal development of the normalized scour profiles progression along the propeller centreline due to the bed load for Run2.
Water 16 01647 g009
Figure 10. Dependence of the dimensionless scour due to total load on the revolution speed for stationary vessel cases.
Water 16 01647 g010
Figure 11. Comparison between the suspended sediment concentration without ((top) panel) and with ((bottom) panel) propeller implementation.
Water 16 01647 g011
Figure 12. Dependence of the dimensionless scour due to total load on the revolution speed for the moving vessel cases.
Water 16 01647 g012
Figure 13. Comparison of the maximum seabed velocity evaluated by the Dutch method, represented by bullets, and the numerical model for the stationary vessel cases, represented by asterisks.
Water 16 01647 g013
Figure 14. Typical scour profile due to a propeller jet.
Water 16 01647 g014
Figure 15. Longitudinal seabed profile due to the bed load for the same value of h p (3.5 m) and different revolution speeds for the stationary vessel case.
Water 16 01647 g015
Figure 16. Longitudinal seabed profile due to the bed load for the same revolution speed (1.2 rev/s) and different values of h p for the stationary vessel case.
Water 16 01647 g016
Table 1. Summary of vessel and propeller characteristics.
DimensionValue
Ship length L116.95 (m)
Ship beam W16.96 (m)
Ship draught P4.34 (m)
Propeller diameter D p 3.7 (m)
Table 2. Overview of numerical runs for the stationary vessel.
CaseVessel Speed (kn)n (rev/s) h p (m)
Run000.43.5
Run100.83.5
Run201.23.5
Run301.63.5
Run402.03.5
Run501.23.0
Run601.24.0
Table 3. Overview of numerical runs for the moving vessel.
CaseVessel Speed (kn)n (rev/s) h p (m)
Run0m10.43.5
Run1m20.83.5
Run2m31.23.5
Run3m41.63.5
Disclaimer/Publisher’s Note: The statements, opinions and data contained in all publications are solely those of the individual author(s) and contributor(s) and not of MDPI and/or the editor(s). MDPI and/or the editor(s) disclaim responsibility for any injury to people or property resulting from any ideas, methods, instructions or products referred to in the content.