Abstract
Surfactants play a pivotal role in daily life owing to their commendable performance. The outbreak of the COVID-19 pandemic notably escalated surfactant usage. Upon entering building drainage systems with wastewater, surfactants profoundly influence hydraulic performance, an aspect that has garnered limited scholarly attention. This study employs an equally proportioned drainage test device to meticulously examine the variances in physical properties between surfactants, such as sodium dodecyl benzene sulfonate (SDBS) and alkyl ethoxylate-9 (AEO-9), and their repercussions on the hydraulic dynamics of building drainage horizontal main drains. Our findings reveal that the introduction of surfactants leads to the following: (1) an augmentation in water velocity and deposition distances of the solid simulant in the building drainage horizontal main drain with concentrations exacerbating this effect. The deposition distance of the solid simulation surged by up to 527% under experimental conditions compared to no surfactant; (2) there was a suppression of hydraulic jump and full degree of the horizontal main drain, with the concentration amplifying this suppression; and (3) an exacerbation of positive pressure in the horizontal main drain was found with increasing concentration, reaching a staggering 235.3% elevation compared to no surfactant. Moreover, SBDS foam outperformed AEO-9, demonstrating a 17.70–36.04% higher positive pressure in the horizontal main pipes. SBDS exhibits lower starting and ultimate viscosity, along with smaller colloid particle sizes, resulting in a 0.9–2.0% reduction in hydraulic jump and full degree. However, its inferior drag-reduction capability leads to a 17.48–36.44% decrease in the final deposition distances of solid simulant in the building drainage horizontal main drain compared to AEO-9.
1. Introduction
Surfactants serve as pivotal functional reagents in everyday life, encompassing roles such as detergents, bactericides, and wetting agents, owing to their adept emulsification, foaming, dispersion, aggregation, wetting, thickening, and other properties [1,2,3,4,5,6,7]. Notably, the advent of the COVID-19 pandemic in 2020 precipitated the heightened utilization of detergents and bactericides, consequently elevating surfactant concentrations within building drainage systems [1]. Sodium dodecyl benzene sulfonate (SDBS), an anionic surfactant, is globally renowned for its potent cleaning prowess, foaming capabilities, and biodegradability, rendering it the preeminent surfactant worldwide [2]. Conversely, alkyl ethoxylate-9 (AEO-9), a non-ionic surfactant, stands out as the most rapidly evolving and widely adopted variant among its non-ionic counterparts [3]. It constitutes the primary active agent in household detergents, with burgeoning usage trends suggesting its increasing dominance [4,5]. Table 1 delineates a comparative analysis of the physical attributes of commonly employed surfactants. Building drainage horizontal pipes constitute indispensable components of structures, facilitating the prompt expulsion of sewage and wastewater, thereby upholding critical building functions and sustaining a conducive living environment for occupants. [6] Nonetheless, the escalating presence of surfactants within building drainage systems imparts discernible repercussions on hydraulic characteristics, posing a tangible threat to residential environments that cannot be overlooked.

Table 1.
Physical properties of surfactants.
Numerous scholars have conducted research on surfactant properties. In 1967, Savins [7] observed that under shear force, surfactants coalesce and eventually form micellar-ordered structures, as evidenced by experiments in dilute solutions. In 2017, Hetang Wang [8] and colleagues discovered that the molecular motion of AEO-9 escalated rapidly with increasing temperature, correlating with a heightened foaming ability. Subsequently, in 2019, Wang and JC [9] noted that the stability of SDBS foam increased with rising surfactant concentrations. Also, in 2019, Zhang [10] et al. demonstrated through experiments the favorable synergistic effect between the synthetic polymer PFPE-A and the anionic surfactant SDS (K12), resulting in a significant reduction in surface tension. In 2020, Dimi Arabadzhieva [11] investigated the cationic surfactant CTAC and the non-ionic surfactant C12E5, observing that with increasing concentration, surfactants began self-assembling into micellar structures, with mixed surfactant micelles proving more stable than single-surfactant micelles. Moreover, in 2022, Xuan [12] et al. found that foaming ability and foam stability were enhanced through the combination of SDBS and AEO-9. Finally, in 2023, McKenzie, Brian E. [13] et al. demonstrated that surfactant complexation significantly boosted the diffusion and migration of colloids.
Concurrently, numerous scholars have conducted research on the application of surfactants. In the field of wastewater treatment, Li et al. [14] found in 2020 that SDBS can affect the biological nitrogen and phosphorus removal efficiency in high-salinity wastewater treatment. YIN C et al. [15] also found that surfactants can have a serious impact on denitrification-related bacteria in wastewater treatment in the same year. In the field of coal dust, J Meng et al. [16] found in 2021 that surfactants can also affect the dispersion of coal dust. The wetting mechanisms of different types of surface-active agents were compared and analyzed, and the findings were combined with the coal dust diffusion theory to provide a theoretical basis for subsequent research. In the industrial field, Wen Nie et al. [17] conducted a computational fluid dynamics (CFDs) simulation study in 2024 to investigate the dynamic wetting and coalescence process of AEO-9 droplets and dust particles. With regard to the impact of surfactants on fluid properties, Fichman et al. [18] demonstrated in 2004 that the formation of ordered micelle structures, regardless of their cationic, anionic, or non-ionic surfactant type, can result in drag reduction phenomena. In 2015, Z Matras et al. [19] demonstrated through rotational rheometer measurements that the addition of polyethylene oxide (PEO) to aqueous solutions can reduce resistance by 58%. In 2023, X Wang et al. [20] demonstrated that surfactants can reduce drag by affecting the turbulent boundary layer structure of the fluid. In 2024, Meng JQ [21] demonstrated that the drag reduction efficiency of mixed surfactant systems was significantly enhanced in comparison to single-surface systems. There has been limited research on the influence of surfactants on the air pressure of building drainage systems, but some scholars have initiated preliminary exploration and investigation. In 2000, Campbell DP [22,23] examined the impact of various surfactants on air pressure in drains and ventilation. They observed that the addition of surfactants altered fluid behavior, resulting in ventilation levels that were more than double those of clean water conditions. Subsequently, in 2007, D. P. Campbell [24] utilized the AIRNET model to simulate how surfactants affect airflow and pressure in building drainage and ventilation systems across different temperatures. Their findings indicated that with increasing temperatures, surfactants contributed to higher pressure and airflow. Additionally, in 2017, researchers from the UK, Gormley et al. [25], investigated the influence of surfactants on the transportation performance of drainage in horizontal drains. They discovered that the presence of surfactants led to an increase in solid velocity.
A review of existing research indicates that there is a paucity of studies on surfactants in the field of construction. The majority of studies focus on the drag-reduction performance of surfactants, with relatively little research on the air pressure fluctuations of building drainage systems with a horizontal main drain. There is a dearth of comprehensive and systematic research on the hydraulic performance of the horizontal main drain of building drainage systems. The proportion of gas–liquid phases and the interaction between gas–liquid phases within the building drainage system render the internal theoretical research mechanism of the system complex. Consequently, this study employs a drainage experimental device that is proportional to the actual working conditions of drains. The experiment was conducted to investigate the hydraulic jump, air pressure, water velocity, and deposition distances of the solid simulant in a building’s drainage systems with a horizontal main drain. Additionally, the impact of different concentrations of SDBS and AEO-9 on the hydraulic performance of the building drainage horizontal main drains was explored. The findings of this research are of great significance for a deeper understanding of the impact of surfactants on building drainage systems and for improving the living environment of people. They also provide reliable reference values for engineering design.
2. Materials and Methods
2.1. Experimental Equipment and System
2.1.1. Experimental System
As shown in Figure 1, a four-story (12.6 m) drainage test device was constructed at Beijing Jianzhu University, meeting relevant standard specifications [26]. The total height of the drainage system stood at 12.6 m, with the first floor measuring 3.2 m and the subsequent floors (second to fourth) each measuring 3.6 m. The horizontal branch pipes on the second to fourth floors are linked to the drainage riser by a 90° water tee, featuring a length of 0.7 m and a slope of 0.012. At the base of the building, the drainage riser is connected to a 22.8 m long horizontal main via a double 45° elbow connection device. Water flow is directly discharged from the terminus of the horizontal main pipe. The proportion of the test device is the same as in the real scenario.
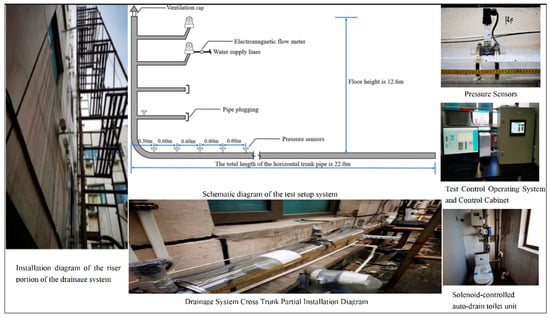
Figure 1.
Full-scale single-stack drainage testing facilities.
This experiment is based on the principle of drainage testing to design and manufacture a drainage test control system. The system consists of a PLC control system, an automated inlet and outlet drainage system, and a control terminal computer. On-site tests are conducted to verify the airtightness and reliability of the system.
2.1.2. Test Equipment
- Rotational Viscometer
Figure 2 shows the installation diagram of a rotational viscometer manufactured by Thermo in Germany with the model number HAAKE Viscotester 550. The rotary viscometer consists of a rotating component (called a rotor) and a stationary cylinder (container). The basic principle is that when a rotating component rotates in a container of aqueous solution fluid, it applies a shear force to the fluid, causing the fluid layer to move relatively. The change in fluid viscosity is determined by measuring the torque corresponding to the shear force and the speed of rotation of the rotor (shear rate).
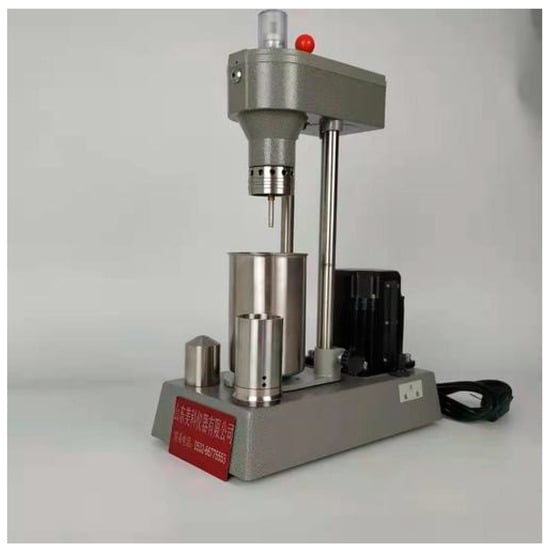
Figure 2.
Rotational viscometer.
- 2.
- Nano-particle size and potential analyzer
Figure 3 shows the nano-particle size and potential analyzer manufactured by Berkman Coulter in the United States, model number DelsaNano C. Dynamic light scattering (DLS) is a technique that uses the laser irradiation of a sample to determine the size and size distribution of particles in a solution by detecting the intensity and time of the scattered light. The basic principle is the random Brownian motion generated by the collision of molecules in the solution, which distributes the particle size. If the particle size is close to the wavelength of light, the particle scatters light. By monitoring the intensity of the scattered light over time, information about the particle size distribution can be obtained.
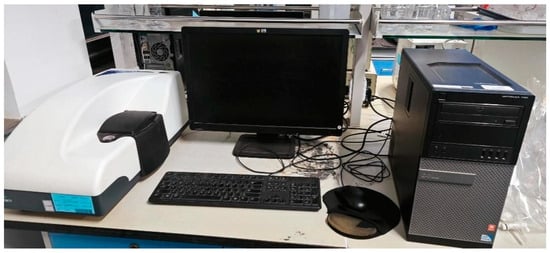
Figure 3.
Nano-particle size and potential analyzer.
- 3.
- ZR4-6 coagulation test mixer
Figure 4 shows the ZR4-6 coagulation test mixer manufactured by Zhongrun Water Industrial Technology Development Co., Ltd. in Shenzhen, China, with the model number ZR4-6.
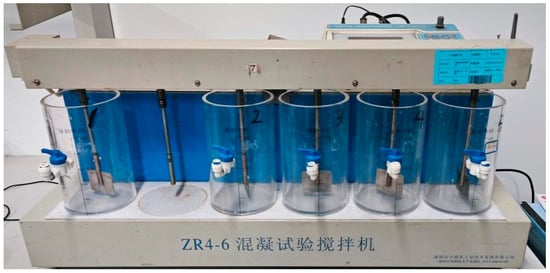
Figure 4.
ZR4-6 coagulation test mixer.
2.2. Materials
2.2.1. Polypropylene Balls
Figure 5 shows the experiment with polypropylene balls. In this experiment, a standard small ball with a diameter of (19 ± 0.4) mm made of solid polypropylene, with a mass of (3.01 ± 0.15) g, and a density similar to that of the water used, met the relevant standards [27]. In this study, the instantaneous velocity of the small ball approximated the fluid velocity.

Figure 5.
Polypropylene balls for testing.
2.2.2. Solid Simulant
Figure 6 shows the solid simulant. The standard for manufacturing the solid simulation in this experiment was based on “Sanitary Ceramics” (GB6952-2015) [27]. Each solid simulation weighed about 103 g, containing 78 g of water and 22 g of sand, with a density of about 1.2 g/cm3. After filling the housing with water, the length was about 230 mm, the diameter was about 25 mm, and it was evenly divided into three parts. Both ends were tied with rubber bands at equal distances [28].
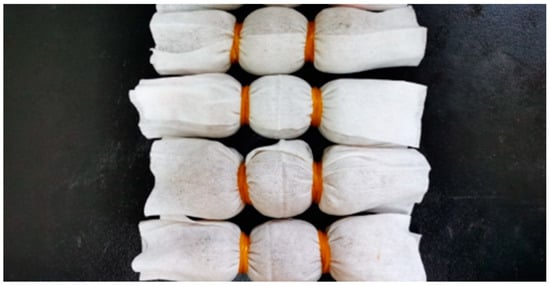
Figure 6.
Solid simulant.
2.2.3. Surfactants
The surfactants used in this experiment were SDBS, AEO-9, and sodium dodecyl benzene sulfonate (SDBS) manufactured by Tianjin Zhiyuan Chemical Reagent Co., Ltd. (Tianjin, China) with the chemical formula C18H29NaO3S; fatty alcohol polyoxyethylene ether-9 (AEO-9) manufactured by Cyprus (Beijing) Technology Co., Ltd. (Beijing, China). with the chemical formula C30H62O10 was also used.
2.3. Methods
2.3.1. Test Conditions
The mass concentration of surfactants in domestic sewage typically ranges from 5 to 20 mg/L, while in municipal sewage, it can reach up to 300 mg/L [29,30]. As indicated in Table 1, the critical micellar concentrations for SDBS and AEO-9 stand at 1.3 mmol/L and 0.15 mmol/L, respectively. The properties of surfactants undergo significant shifts before and after micellar structure formation [31,32]. To investigate the physical disparities between SDBS and AEO-9 at various concentrations, this experiment subjected aqueous solutions of SDBS and AEO-9 at concentrations of 0.01 g/L, 0.03 g/L, 0.06 g/L, and 0.12 g/L, respectively, to examination. Physical properties, including viscosity, foaming ability, foam stability, and colloidal particle size, were analyzed. Table 2 delineates the test conditions for surfactant physical properties.

Table 2.
Test conditions of surfactant.
To investigate the effects of SDBS and AEO-9 on the hydraulic performance of horizontal main drains in building drainage systems, 0.01 g/L, 0.03 g/L, 0.06 g/L, and 0.12 g/L of SDBS and AEO-9 were added to the drainage system, and the central control system controlled the 6 L water volume for drainage. The effects of different concentrations of SDBS and AEO-9 on hydraulic jump, full degree, air pressure, water velocity, and the deposition distances of solid simulant were investigated. The test conditions are listed in Table 3.

Table 3.
Test conditions of building drainage horizontal main drain.
2.3.2. Determining Viscosity
Stirring took place at a low speed to the desired temperature before pre-shearing at a maximum shear rate of 1000 s−1 for 5 min, and then maintaining equilibrium at a shear rate of 0 s−1 for 1 min. Then, different apparent viscosities were obtained by increasing the shear rate from 0 to 1000 s−1 within 180 s, and the rheological curve of the fluid was plotted.
2.3.3. Determining Colloidal Particle Size
We prepared the sample to be tested in advance and ensured its stability and transparency. Then, we placed the sample in a nano-particle and potential analyzer and set the parameters to a temperature of 25 °C and a measurement time of 120 s for measurement. We analyzed the size distribution information of surfactant molecules or aggregates using data processing software.
2.3.4. Measuring Foam Property
In this study, foaming ability and foam stability were assessed using the Waring Blender mixing method. The sample was introduced into a 1000 mL beaker, with the stirring speed set at 1000 r/min for 60 s of high-speed agitation. Subsequently, upon cessation of the device, the foam volume (V) was measured to determine the foaming ability. Foam stability was gauged by observing the time (T) required for the surfactant to drain half of the initial bubble solution.
2.3.5. Hydraulic Jump and Full-Degree Test
The hydraulic jump and full-degree test of the building’s horizontal main drain are shown in Figure 7. The hydraulic jump was obtained by observing the maximum height of the water level in the drainage horizontal main drain, which is an important parameter that characterizes the fluid behavior of the drainage drain. The full degree is the ratio of the hydraulic jump height to the drain diameter, which is an important parameter that characterizes the ratio of gas and liquid phases in the drainage drain. According to relevant research [33], the location of the hydraulic jump mainly occurs in the range of 0–60 cm from the center of the riser.
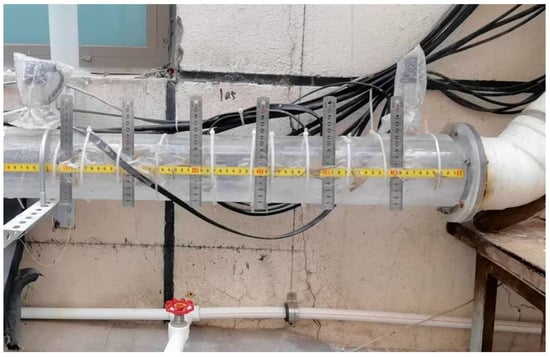
Figure 7.
Hydraulic jump and full degree test range in the horizontal main drain.
At the beginning of the experiment, the fluid flowed out along the horizontal main drainage drain. Vertical steel rulers were installed at 0, 10, 20, 30, 40, 50, and 60 cm from the center of the riser, and high-speed cameras were used to record hydraulic jump fluctuations in real-time. After the measurement was completed, the data from 7 measurement points were imported into the computer, and Kinovea software was used to analyze the hydraulic jump and full degree. Three repeated experiments were conducted for each working condition to ensure the accuracy of the data.
2.3.6. Air Pressure Test
This experiment used pressure sensors to measure pressure fluctuations in the horizontal main. Pressure sensors were installed at 0, 50, 110, 170, 230, and 290 cm from the center of the riser. The pressure sensor model was GE DruckPTX 610 bi-directional with a measuring range of ±1 kPa, a measuring accuracy of ± 0.5%, and a sampling period of 200 ms.
2.3.7. Water Velocity Test
The motion of a small ball in a horizontal main drain is shown in Figure 8. Measurement sections were positioned every 50 cm along the direction of water flow, with a 20 cm precision millimeter scale adjacent to each section. Polypropylene balls, with a density similar to that of water, were employed to test the water flow in the horizontal main drain. At the onset of the experiment, varying concentrations of SDBS and AEO-9 were added to the toilet. Once the device was activated, the water flow carried the small ball through the system. The process of adding the ball to the toilet and its subsequent discharge through each section with the water velocity was recorded in real-time using a high-speed camera. The ball’s movement speed was used to approximate the actual water velocity, and the data were analyzed with Kinovea software. Each operating condition was tested three times, with the average velocity taken as the final measurement to ensure data reliability and accuracy.
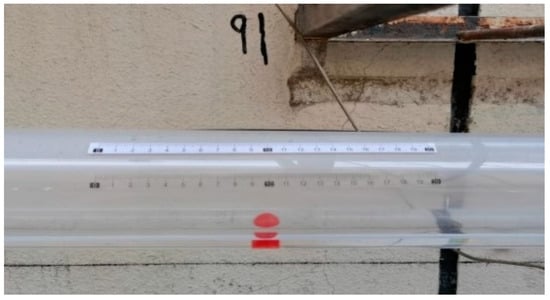
Figure 8.
The state of motion of the ball during drainage in a horizontal drain.
2.3.8. Solid Simulant Transportation Distance Test
The sedimentation of the solid simulation in the horizontal main drain is shown in Figure 9. At the onset of the experiment, the solid simulation was positioned at the junction between the building drainage riser and the horizontal branch pipe of the 4th-floor platform. Subsequently, a precisely measured volume of 6 L was discharged from the toilet via the central control system. The initial sedimentation distance of the solid simulation was recorded following the first instantaneous drainage. To mitigate errors stemming from residual water volume, multiple amounts of drainage were conducted until the solid simulation remained stationary, indicating the final sedimentation distance. This value represents the final sedimentation distance of the solid simulation.
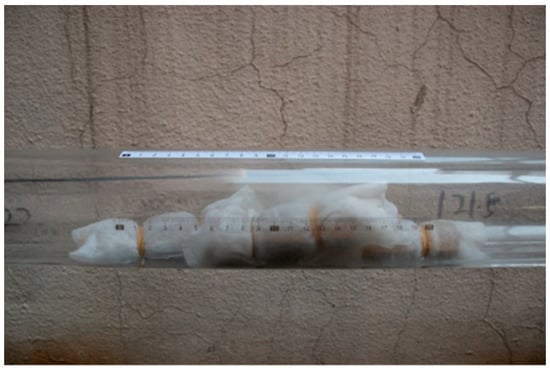
Figure 9.
Deposition of solid simulant in the horizontal main drain.
3. Results and Discussion
3.1. Physical Properties of SDBS and AEO-9
3.1.1. Viscosity
The viscosity of SDBS and AEO-9 at various concentrations varies with the shear rate, as shown in Figure 10.
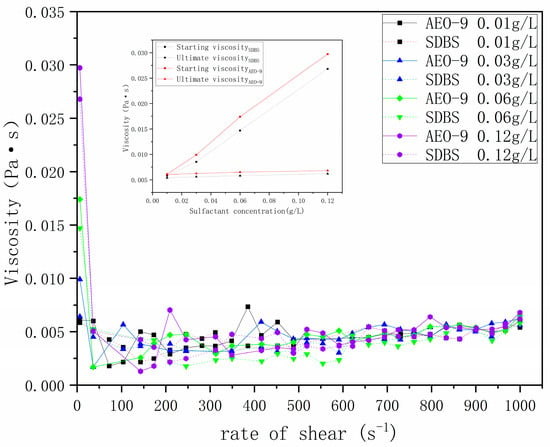
Figure 10.
Apparent viscosity of SDBS and AEO-9 as a function of shear rate.
Figure 10 illustrates that for AEO-9, the starting viscosity at concentrations of 0.03 g/L, 0.06 g/L, and 0.12 g/L is 1.62, 2.63, and 4.87 times higher than at 0.01 g/L, with the ultimate viscosity being 1.03, 1.08, and 1.13 times higher. Similarly, for SDBS, the starting viscosity at these concentrations are 1.45, 2.51, and 4.58 times higher than at 0.01 g/L, respectively, with the ultimate viscosities 1.04, 1.07, and 1.15 times higher compared to 0.01 g/L. This indicates that the starting viscosity and the ultimate viscosity are positively correlated with the concentration of surfactants. This correlation may be attributed to the increased tendency of SDBS and AEO-9 in aqueous solutions to transition from a loose, disordered distribution to self-assemble into micelle structures as the concentration rises [13], thus elevating the starting viscosity. Under high shear rates, a shear-induced phase transition occurs, promoting the dispersion and reorganization of micelle structures due to entanglement and hydrogen bonding among flexible micelles in SDBS and AEO-9 solutions, resulting in spherical or rod-shaped micelle formations. As the concentration increases, the number of micelles increases, and the interaction between micelles and water molecules and micelles increases, thereby increasing the ultimate viscosity [34,35].
When comparing the starting and ultimate viscosities of SDBS and AEO-9 at different concentrations, it was observed that for SDBS, the starting viscosity of AEO-9 was 4.5%, 16.2%, 18.4%, and 10.9% higher at 0.01 g/L, 0.03 g/L, 0.06 g/L, and 0.12 g/L, respectively. Additionally, the ultimate viscosity of AEO-9 was 11.5%, 11.4%, 12.2%, and 9.7% higher than that of SDBS, suggesting that compared to SDBS, AEO-9 exhibits higher starting and ultimate viscosities. This phenomenon may be attributed to several factors. Firstly, AEO-9 demonstrates weaker electrical repulsion compared to SDBS, facilitating easier micelle formation at the same shear rate [36]. Consequently, at high shear rates, AEO-9 micelles disperse and reorganize more readily into spherical or rod-shaped structures, thereby increasing fluid viscosity. Secondly, as a mixture containing smaller molecules, AEO-9 exhibits enhanced miscibility with aqueous solutions and a faster mixing rate compared to SDBS. This results in a higher diffusion rate in aqueous solutions [37], leading to an increased number of aggregates, stronger interactions with water molecules, and intermolecular forces, ultimately elevating fluid viscosity.
3.1.2. Foaming Property
Figure 11 shows the foaming ability and foam stability of SDBS and AEO-9 at various concentrations.
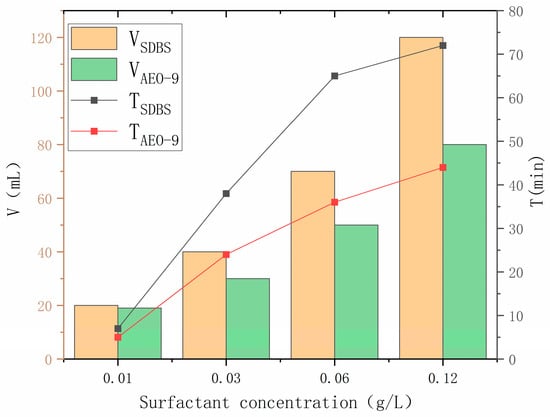
Figure 11.
Foaming ability and foam stability with different concentrations of SDBS and AEO-9.
As depicted in Figure 11, for SDBS, the foaming ability at concentrations of 0.03 g/L, 0.06 g/L, and 0.12 g/L are 2 times, 3.5 times, and 6 times higher, respectively, compared to 0.01 g/L, with foam stability increasing by 5.4 times, 9.2 times, and 10.3 times, respectively. Similarly, for AEO-9, the foaming ability at these concentrations is 1.58 times, 2.63 times, and 4.2 times higher, respectively, with foam stability increasing by 4.8 times, 7.2 times, and 8.8 times, respectively. These findings indicate a positive correlation between surfactant concentration and both foaming ability and foam stability. This relationship arises because as the concentrations of SDBS and AEO-9 increase, the propensity of surfactant molecules to dissolve in aqueous solutions rises, reducing the surface tension of the solution, lowering the energy required for bubble formation, and consequently enhancing foaming ability [38]. This increase in the surfactant concentration results in a higher air content in the aqueous solution, a tighter interfacial arrangement, and increased apparent viscosity. Additionally, the presence of hydrophilic and hydrophobic groups in SDBS and AEO-9 surfactants enhances foam stability through strong electrostatic repulsion [39].
When comparing the foam properties of SDBS and AEO-9 at various concentrations (0.01 g/L, 0.03 g/L, 0.06 g/L, 0.12 g/L), it was observed that SDBS exhibits 5.3%, 33.3%, 40%, and 50% higher foaming ability than AEO-9, with foam stability 1.4 times, 1.25 times, 1.80 times, and 1.70 times higher, respectively, indicating superior foaming ability and the foam stability of SDBS over AEO-9. This disparity can be attributed to the influence of polar groups on foam density, affected by factors such as surface activity and solubility [40]. In comparison with AEO-9, the structure of SDBS features negatively charged sulfonic groups with larger polar bases, resulting in stronger electrostatic repulsion. Moreover, SDBS possesses longer alkyl chains, rendering its molecules larger and more rigid, thereby enhancing foaming ability. This leads to a closer foam arrangement, lower bubble water content, slower foam drainage, and stronger foam stability. Conversely, AEO-9’s strong chemical inertness and suitability contribute to inferior foaming ability and foam stability [41].
3.1.3. Colloidal Particle Size
The colloidal particle size of aqueous solutions of SDBS and AEO-9 at various concentrations is shown in Figure 12.
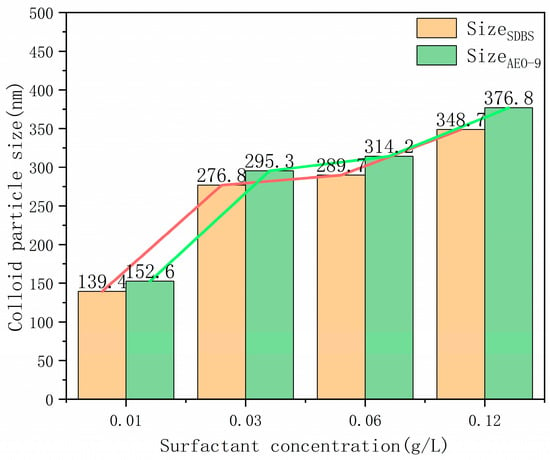
Figure 12.
Colloidal particle size of the SDBS and AEO-9 aqueous solutions at different concentrations.
From Figure 12, it is evident that for AEO-9, compared to 0.01 g/L, the colloidal particle sizes at 0.03 g/L, 0.06 g/L, and 0.12 g/L are 1.94 times, 2.06 times, and 2.47 times higher, respectively. Similarly, for SDBS, compared with 0.01 g/L, the colloidal particle sizes at 0.03 g/L, 0.06 g/L, and 0.12 g/L are 1.98 times, 2.08 times, and 2.50 times higher, respectively. This indicates a positive correlation between surfactant concentration and colloidal particle size. As the concentration increases, the colloidal particle sizes of SDBS and AEO-9 in aqueous solutions gradually increase. Relevant studies have shown that a strong correlation exists between the viscosity of surfactant solutions and their micelle structures [42]. Combining this with Section 3.1.1 on viscosity, it was observed that with increasing concentration, the number of SDBS and AEO-9 surfactant single molecules in aqueous solutions increases. Subsequently, a significant number of single molecules gradually aggregate with each other to form micelle structures. These micelles aggregate on the gas–liquid interface, leading to positive adsorption phenomena [43], thereby increasing fluid viscosity, enhancing interactions between colloidal particles and aqueous solutions, and consequently augmenting colloidal particle size.
Upon comparing the colloidal particle sizes of AEO-9 and SDBS at different concentrations, it was noted that at concentrations of 0.01 g/L, 0.03 g/L, 0.06 g/L, and 0.12 g/L, AEO-9 had colloidal particle sizes 2.37%, 4.83%, 5.60%, and 9.26% larger than SDBS, respectively. This indicates that AEO-9 has a larger colloidal particle size compared to SDBS, which is potentially attributable to the properties inherent to AEO-9. Compared with SDBS, on the one hand, AEO-9 has a higher solubility, which reduces the energy for single molecules to form micelles in aqueous solutions, thereby facilitating the formation of micelle structures [44]. On the other hand, upon its dissolution in aqueous solutions, AEO-9 exhibits smaller molecular particle sizes and larger specific surface areas, leading to higher solubility and surface energy. Consequently, AEO-9 is more prone to adsorption and aggregation with neighboring molecules, resulting in larger colloidal particle sizes, in line with the observations in Section 3.1.1.
3.2. Air Pressure in Drainage Horizontal Main Drain
3.2.1. Hydraulic Jump and Full Degree in the Drainage Horizontal Main Drain
The hydraulic jump and full degree in the horizontal main drain at different concentrations of SDBS and AEO-9 are shown in Figure 13.
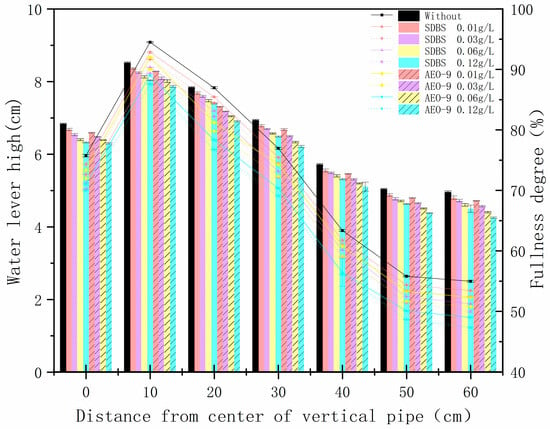
Figure 13.
Hydraulic jump and full degree of SDBS and AEO-9 during drainage in a horizontal main drain with different concentrations.
Figure 13 illustrates that the maximum values of hydraulic jump height and full degree are observed at a distance of 10 cm from the center of the riser. In the case of SDBS, compared to no surfactant, the hydraulic jump height and full degree decreased by (1.7 ± 0.02)%, (3.0 ± 0.05)%, (5.8 ± 0.07)%, and (10.2 ± 0.06)% at concentrations of 0.01 g/L, 0.03 g/L, 0.06 g/L, and 0.12 g/L, respectively. Similarly, for AEO-9, compared to no surfactant, the hydraulic jump height and full degree decreased by (2.7 ± 0.04)%, (4.8 ± 0.07)%, (5.9 ± 0.08)%, and (7.4 ± 0.06)% at the same concentrations. This suggests that surfactants decreased both the hydraulic jump height and full degree of drainage in the horizontal main drain. There exists a negative correlation between the concentration of surfactants and both hydraulic jump height and full degree. A comparison of the maximum hydraulic jump height and the full degree of SDBS and AEO-9 at different concentrations reveals that at concentrations of 0.01 g/L, 0.03 g/L, 0.06 g/L, and 0.12 g/L, the maximum hydraulic jump height and full degree of SDBS were (0.9 ± 0.03)%, (1.8 ± 0.05)%, (1.5 ± 0.02)%, and (2.0 ± 0.04)% higher than AEO-9, respectively. Thus, SDBS exhibits a greater hydraulic jump height and full degree compared to AEO-9. This phenomenon may be attributed to fluid viscosity and colloidal particle size, as discussed in Section 3.1. Both SDBS and AEO-9 undergo wetting within drainage systems, thereby reducing surface tension. As the concentration of surfactants increases, fluid viscosity rises. According to the turbulence formation theory [45], internal frictional shear stress between flow layers increases, leading to greater resistance and hydraulic jump formation [46], thus reducing hydraulic jump height. Furthermore, at equivalent concentrations, AEO-9 exhibits higher fluid viscosity and greater resistance to hydraulic jump formation compared to SDBS, resulting in a smaller hydraulic jump and full degree.
3.2.2. Air Pressure of Drainage Horizontal Main Drain
The air pressure of SDBS and AEO-9 drainage horizontal main drain at different concentrations under 6 L water volume are shown in Figure 14.
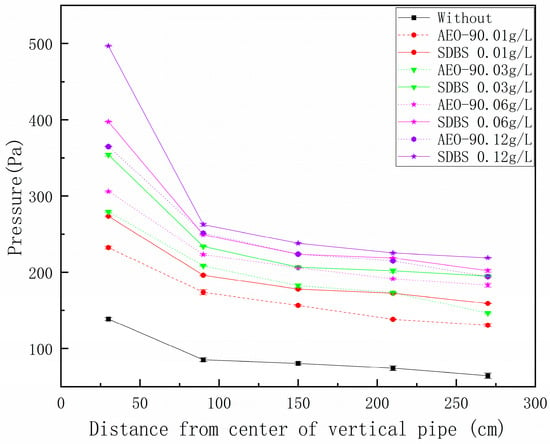
Figure 14.
Air pressure fluctuations of the drainage horizontal main drain under different concentrations of SDBS and AEO-9.
The graph in Figure 14 highlights the occurrence of maximum positive pressure near 30 cm. Regarding SDBS, the maximum positive pressure at 0.01 g/L, 0.03 g/L, 0.06 g/L, and 0.12 g/L increased by (97.9 ± 0.01)%, (127.3 ± 0.03)%, (168.8 ± 0.04)%, and (235.3 ± 0.06)%, respectively, compared to no surfactant. For AEO-9, compared with no surfactant, the maximum positive pressure at 0.01 g/L, 0.03 g/L, 0.06 g/L, and 0.12 g/L and 0.12 g/L increased by (68.1 ± 0.03)%, (88.3 ± 0.04)%, (117.7 ± 0.05)%, and (166.67 ± 0.06)%, respectively, indicating that the addition of the surfactant increases the maximum positive pressure of the horizontal main drain, and the maximum positive pressure of the horizontal main drain is positively correlated with the concentration of the surfactant. In comparison to SDBS and AEO-9, it is discerned that the maximum positive pressure of SDBS at concentrations of 0.01 g/L, 0.03 g/L, 0.06 g/L, and 0.12 g/L is (17.7 ± 0.02)%, (26.7 ± 0.03)%, (30.16 ± 0.05)%, and (36.04 ± 0.06)% higher than that of AEO-9, respectively. Pressure fluctuations are influenced by gas–liquid, two-phase flow dynamics [47]. As elucidated in Section 3.1, the augmentation of SDBS and AEO-9 concentrations potentially leads to heightened foaming ability and improved foam stability [27], thereby increasing the gas content within the mixed solution. When the hydraulic jump occurs within the horizontal main drain, the gas separated from the water struggles to dissipate promptly, resulting in an upward trend in positive pressure. Furthermore, SDBS exhibits superior foaming ability and foam stability compared to AEO-9 at equivalent concentrations, with a more stable liquid film structure. Consequently, the maximum positive pressure of SDBS surpasses that of AEO-9, aligning with the observations in Section 3.1.2.
The results regarding the air pressure fluctuation of the horizontal drainage main drain reveal an interesting inconsistency compared to the findings on hydraulic jump and full degree. Typically, the maximum positive pressure in the horizontal main drain tends to coincide with the location of the highest hydraulic jump. As the hydraulic jump reaches its peak, so does the positive pressure within the horizontal drainage main drain. However, the no surfactant, the addition of the surfactant alters this pattern: while the hydraulic jump decreases, the extreme positive pressure values exhibit an upward trajectory. This phenomenon can be attributed to the significant influence of foaming ability and foam stability on the air pressure fluctuations of the horizontal main drain, as discussed in Section 3.1. Surfactants with robust foaming ability and enhanced foam stability contribute to a more stable liquid film structure and higher air content in the aqueous solution. Consequently, when a hydraulic jump occurs, the gas separated from the water fails to discharge promptly, leading to an escalation in the extreme positive pressure values.
3.3. Drainage Horizontal Main Drain Solids Transportation Performance
3.3.1. Water Velocity of Drainage Horizontal Main Drain
The velocity in the drainage horizontal main drain under different concentrations of SDBS and AEO-9 with a 6 L water volume are shown in Figure 15.
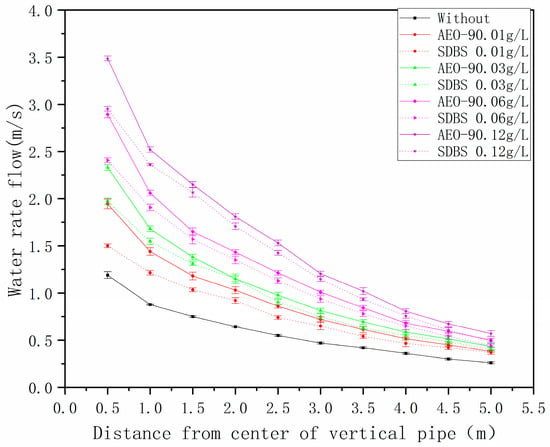
Figure 15.
Velocity of the drainage in the horizontal main drain under different concentrations of SDBS and AEO-9 with 6 L.
From Figure 15, it is evident that the maximum water velocity in the building drainage system horizontal main drain occurs approximately 0.5 m away from the center of the riser. In the case of SDBS, compared to no surfactant, the maximum water velocity increases by (30 ± 0.02)%, (65 ± 0.04)%, (100.8 ± 0.06)%, and (145.8 ± 0.08)% at concentrations of 0.01 g/L, 0.03 g/L, 0.06 g/L, and 0.12 g/L, respectively. Similarly, for AEO-9, compared to no surfactant, the maximum water velocity increases by (60 ± 0.03)%, (94.2 ± 0.05)%, (140.8 ± 0.06)%, and (190.8 ± 0.08)% at the same concentrations. This suggests that surfactants promote an increase in water velocity, and the water velocity in the building drainage system horizontal main drain is positively correlated with the surfactant concentration. Comparing the water velocities of SDBS and AEO-9 at different concentrations, it is noted that AEO-9 exhibits higher maximum values, surpassing SDBS by (28.8 ± 0.02)%, (17.9 ± 0.04)%, (4.15 ± 0.02)%, and (15.66 ± 0.03)% at concentrations of 0.01 g/L, 0.03 g/L, 0.06 g/L, and 0.12 g/L, respectively. This implies that AEO-9 has a more pronounced effect on promoting water velocity compared to SDBS. In general, higher water velocities indicate better transportation performance for solid simulation in building drainage in a horizontal main drain, leading to greater distances for solid simulation deposition. The specific mechanism underlying this phenomenon is elucidated in Section 3.3.2.
3.3.2. Deposition Distances of Solid Simulant
The deposition distance of 200 g of solid simulant washed with different concentrations of SDBS and AEO-9 during drainage in the horizontal main drain under 6 L of water is shown in Figure 16.
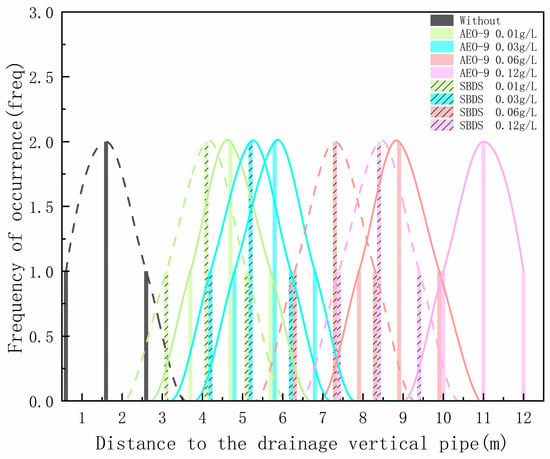
Figure 16.
Deposition distance of solid simulant with different concentrations of SDBS and AEO-9.
From Figure 16, it can be observed that when the drainage amount is 6 L for SDBS, compared to no surfactant, the deposition distances of solid simulant at 0.01 g/L, 0.03 g/L, 0.06 g/L, and 0.12 g/L increase by 127%, 211%, 308%, and 379%, respectively. For AEO-9, the deposition distance of solid simulations at 0.01 g/L, 0.03 g/L, 0.06 g/L, and 0.12 g/L increases by 149%, 262%, 378%, and 527%, respectively, compared to no surfactant. This indicates that the addition of surfactants has a promoting effect on the deposition distance of the solid simulant in horizontal drainage main drains, and the deposition distance of the solid simulant is positively correlated with the concentration of surfactants. The higher the concentration of surfactants, the more effective it is at promoting the deposition distance of solid simulations in the horizontal drainage main drain. The more clear the effect, compared with SDBS and AEO-9, at concentrations of 0.01 g/L, 0.03 g/L, 0.06 g/L, and 0.12 g/L, AEO-9 had a higher deposition distance of the solid simulant than SDBS by 27.61%, 23.22%, 36.44%, and 17.48%, respectively, indicating that compared with SDBS, AEO-9 has a better-promoting effect on the deposition distance of solid simulations, and the experimental results are the same as 3.3.1.
As discussed in Section 3.1, the number of aggregates formed by SDBS and AEO-9 increases with increasing concentration. During the flow process, under shear force, the surfactant micelle structure disperses and recombines, forming spherical or rod-shaped micelle structures [13]. This process strengthens the interaction between the surfactant and water, as well as between surfactant molecules, leading to the easier fusion of micelles. Consequently, the flexibility of micelles improves, allowing for the greater absorption of energy from turbulent small eddies during the turbulent drag-reduction process, thereby reducing the turbulent kinetic energy dissipation and enhancing the turbulent drag-reduction process. Furthermore, at equivalent concentrations, AEO-9 demonstrates greater susceptibility to shear force during the turbulent drag-reduction process. It exhibits easier dispersal and recombination into spherical or rod-shaped structures, with numerous surfactant rod-shaped molecules interrelating and exerting stronger interaction forces with water molecules and micelles. Consequently, the aggregation of micelles gradually becomes more compact, resulting in a polymer loose coil structure that enhances drag-reduction performance, water velocity, and the deposition distance of solid simulations [27]. These experimental findings are in line with De Gennes’s “viscoelastic theory” [42,48,49] and are consistent with Section 3.3.1.
4. Conclusions
Based on research into the physical properties of SDBS and AEO-9, this study investigates their respective impacts on hydraulic performance. Through a comparative analysis of their physical properties across various concentrations and their effects on hydraulic jump, air pressure, water velocity, and the deposition distance of the solid simulation sediment during drainage in the horizontal main drain, the primary conclusions are outlined below:
1. The starting viscosity, ultimate viscosity, foaming ability, foam stability, and colloidal particle size are positively related to the concentration of surfactants SDBS and AEO-9. Compared with the starting viscosity, the ultimate viscosity is more significantly influenced by concentration. Compared with SDBS, AEO-9 exhibits stronger starting viscosity, ultimate viscosity, colloidal particle size, and weaker foaming ability and foam stability, which are attributed to the structural differences between SDBS and AEO-9.
2. Comparing drains with and without surfactants, the addition of surfactants can increase the water velocity and the deposition distance of the solid simulation in the building drainage of a horizontal main drain. The water velocity increases by 30% to 190.8%, and the deposition distance of the solid simulation increases by 127% to 527%. Additionally, it suppresses the hydraulic jump and the full degree of the horizontal drainage in the main drain, reducing the water jump by 1.7% to 10.2%. Moreover, it intensifies the air pressure of drainage in the horizontal main drain, with a positive pressure increase of 68.1% to 235.3%.
3. The hydraulic jump and full degree of horizontal drainage in the main drain exhibit a negative correlation with the surfactant concentration, whereas the positive pressure, deposition distances of the solid simulant, and water velocity demonstrate a positive correlation. At a concentration of 0.12 g/L, the minimum hydraulic jump in the horizontal main drain measures 7.88 cm, the maximum positive pressure reaches 496.23 Pa, and the maximum deposition distance of the solid simulant extends to 12.5 m. Viscosity and colloidal particle size primarily influence hydraulic jump, full degree, the deposition distances of the solid simulant, and water velocity. Conversely, the air pressure of the horizontal main drain is more significantly affected by foaming ability and foam stability.
4. AEO-9, in comparison to SDBS, exhibits a greater hydraulic jump and full degree, attributed to differences in water viscosity and colloidal particle size. The lower extreme value of positive pressure is linked to the foaming ability and foam stability. AEO-9 demonstrates superior drag-reduction performance, as evidenced by the increased water velocity and deposition distance of the solid simulant, particularly at a concentration of 0.12 g/L.
This study conducted experimental research on the application of SDBS and AEO-9 in building drainage systems. It was observed that while the addition of surfactants enhanced the transportation performance of the building drainage in the horizontal main drain, it also amplified the positive pressure within these pipes. This elevation in positive pressure poses a significant challenge to the water sealing of the drainage equipment and can substantially impact the design and associated costs of drainage systems. In practical applications, ensuring the safety and stability of building drainage systems necessitates mitigating the risk of surfactant impact. This can be achieved by reducing the frequency of surfactant use and optimizing building drainage systems. Conversely, utilizing the AEO-9 surfactant, which exhibits lower foam properties and increases the diameter of the horizontal main drain of the building drainage systems, proves more advantageous for the safety and stability of building drainage systems. This study supplements our understanding of the impact and mechanisms of surfactants on the application of building drainage systems. However, given the diversity of surfactants and the complexity of building drainage systems, our exploration is confined to the effects and related mechanisms of the physical properties of SDBS and AEO-9 at different concentrations in multi-layer building drainage systems. Future investigations should encompass the effects and mechanisms of various surfactants in diverse combinations, considering different building pipeline systems, pipe diameters, and ventilation conditions.
Author Contributions
P.X.: conceptualization, supervision, project administration, review and editing, validation, and funding acquisition. S.H. and B.F.: data curation, methodology, investigation, data analysis, visualization, original draft preparation, and draft modification. All authors have read and agreed to the published version of the manuscript.
Funding
This study was supported by the National Natural Science Foundation of China (No. 51578035) and the National Major Water Pollution and Treatment Project of China (No. 2018ZX07110-008-006).
Data Availability Statement
The data presented in this study are available on request from the corresponding author. The data are not publicly available due to privacy.
Conflicts of Interest
The authors declare no conflicts of interest.
References
- Lei, F.; Xiao, L.; Gao, Y.; Li, L. Study on the bacteriostatic properties of piroctone ethanolamine salts in commonly used surfactant systems. Sci. Dly. Use Chem. 2022, 45, 18–22. [Google Scholar]
- Ye, D. Application of surfactants in household detergents. Sci. Technol. Wind 2018, 144P. [Google Scholar] [CrossRef]
- Liu, H. A Brief Discussion on the Characteristics and Applications of Non ionic Surfactants. Leather Chem. Ind. 2012, 8. [Google Scholar] [CrossRef]
- Peng, Y.; Xu, M.; Lin, S.; Li, Q. Research on synthesis methods and market development of non-ionic surfactants. Appl. Chem. 2023, 52, 546–550. [Google Scholar] [CrossRef]
- Tang, X.; Wu, C.; Li, C.; Li, B. Characterization and application of fatty alcohol polyoxyethylene ethers. Sci. Dly. Chem. 2012, 35, 22–24. [Google Scholar] [CrossRef]
- Ma, X. Some problems of building drainage technology development. Water Supply Drain. 2007, S2, 74–80. [Google Scholar]
- Savins, J.G. A stress-controlled drag-reduction phenomenon. Rheol. Acta 1967, 6, 323–330. [Google Scholar] [CrossRef]
- Wang, H.; Guo, W.; Zheng, C.; Wang, D.; Zhan, H. Effect of temperature on foaming ability and foam stability of typical surfactants used for foaming agent. J. Surfactants Deterg. 2017, 20, 615–622. [Google Scholar] [CrossRef]
- Wang, J.; Li, Z.; Fan, G.; Ye, C.; Li, G.; Cao, Y. Free drainage and bubble size for aqueous foams stabilized by sodium dodecyl benzene sulpho-nate. Destil. Water Treat. 2019, 156, 59–67. [Google Scholar] [CrossRef]
- Zhang, D.; Bai, Y.; Shen, J.; Wang, G. Surface activities and wetting behavior of fluorocarbon-cationic and hydrocarbon-anionic sur-factant mixtures in dilute solutions. J. Mol. Liq. 2019, 286, 110947. [Google Scholar] [CrossRef]
- Arabadzhieva, D.; Tchoukov, P.; Mileva, E. Impact of adsorption layer properties on drainage behavior of microscopic foam films: The case of cationic/nonionic surfactant mixtures. Colloids Interfaces 2020, 4, 53. [Google Scholar] [CrossRef]
- Xuan, Y.; Ni, X.; Yu, J. The influence of common binary surfactant complex systems on foaming ability. J. East China Univ. Sci. Technol. 2022, 48, 449–455. [Google Scholar] [CrossRef]
- Yang, A.; McKenzie, B.E.; Yi, Y.; Khair, A.S.; Garoff, S.; Tilton, R.D. Effect of polymer/surfactant complexation on diffusiophoresis of colloids in surfactant concentration gradients. J. Colloid Interface Sci. 2023, 642, 169–181. [Google Scholar] [CrossRef] [PubMed]
- Li, H.R.; Wu, S.H.; Yang, C.P. Performance and biomass characteristics of sbrs treating high-salinity wastewater at presence of anionic surfactants. Int. J. Environ. Res. Public Health 2020, 17, 2689. [Google Scholar] [CrossRef]
- Yin, C.; Li, Y.; Zhang, T.; Liu, J.; Yuan, Y.; Huang, M. Effects of exposure to anionic surfactants (SDBS and SDS) on nitrogen removal of aerobic denitrifier. Water Environ. Res. 2020, 92, 2129–2139. [Google Scholar] [CrossRef]
- Meng, J.; Wang, L.; Zhang, S.; Lyu, Y.; Xia, J. Effect of anionic/nonionic surfactants on the wettability of coal surface. Chem. Phys. Lett. 2021, 785, 139130. [Google Scholar] [CrossRef]
- Nie, W.; Liu, F.; Peng, H.; Xu, C.; Lei, C.; Akanyange, S.N.; Mwabaima, F.I. Study on the mechanism of surfactant droplet wetting and coagulation of respiratory dust: The case of AEO-9. J. Mol. Liq. 2024, 394, 123742. [Google Scholar] [CrossRef]
- Fichman, M.; Hetsroni, G. Electrokinetic aspects of turbulent drag reduction in surfactant solutions. Phys. Fluids 2004, 16, 4346–4352. [Google Scholar] [CrossRef]
- Matras, Z.; Kopiczak, B. Intensification of drag reduction effect by simultaneous addition of surfactant and high molecular polymer into the solvent. Chem. Eng. Res. Des. 2015, 96, 35–42. [Google Scholar] [CrossRef]
- Wang, X.; Zhao, M.; Wang, X.; Liu, P.; Fan, M.; Yan, X.; Ma, Z.; Zhang, Y.; Dai, C. Synergistic effect of dual hydrogen-donor deep eutectic solvent for performance improvement of fracturing-oil expulsion fluids. Chem. Eng. J. 2023, 468, 143728. [Google Scholar] [CrossRef]
- Meng, J.; Wang, J.; Wang, L.; Lyu, C.; Lyu, Y.; Nie, B. Effects of polymer-surfactant interactions on drag reduction performance and mechanisms: Molecular dynamics simulations and experimentation. Colloids Surf. A Physicochem. Eng. Asp. 2024, 684, 133126. [Google Scholar] [CrossRef]
- Campbell, D.P.; MacLeod, K.A. Detergency in drainage–waste–ventilation (DWV) systems. Build. Serv. Eng. Res. Technol. 2000, 21, 39–43. [Google Scholar]
- Campbell, D.P.; MacLeod, K.A. Detergents in drainage systems for buildings. Water Res. 2000, 18, 128–134. [Google Scholar] [CrossRef] [PubMed]
- Campbell, D.P. Surfactant effects on air pressure transients in building drainage, waste and ventilation (DWV) systems. Build. Environ. 2007, 42, 1989–1993. [Google Scholar] [CrossRef]
- Gormley, M.; Campbell, D.P. The effects of surfactant dosed water on solid transport in above ground near horizontal drainage systems. Build. Environ. 2007, 42, 707–716. [Google Scholar] [CrossRef]
- CJJ/T 245-2016; Standard for Testing the Drainage Capacity of Residential Domestic Drainage System Standdrains. Available online: https://www.doc88.com/p-6691787367502.html (accessed on 4 June 2024).
- GB6952-2015; Sanitary Ceramics. Available online: https://www.nssi.org.cn/nssi/front/88075770.html (accessed on 4 June 2024).
- Zhang, Z.; Li, J.; Gao, N. Research on the sanitation and safety of the water environment in buildings-the effect of bidet cross branch drain diameter and slope on the conveyance distance. Urban Hous. 2015, 5, 29–33. [Google Scholar]
- Hao, X.; Yang, Z.; Li, J. The impact and mechanism of surfactants in wastewater treatment under the background of the epidemic. J. Environ. Eng. 2021, 15, 1831–1839. [Google Scholar]
- Scott, M.J.; Jones, M.N. The biodegradation on surfactants in environment. Biochim. Biophys. Acta-Biomembr. 2000, 1508, 235–251. [Google Scholar] [CrossRef]
- Li, Y.; Fan, J.; Wang, B.; Xiang, L. Study on the Physical and Chemical Properties of Surfactant Micelles. Univ. Chem. 2022, 37, 171–177. [Google Scholar]
- Khadelwal, M.; J.S, A.; Rai, B.; Sarasan, G. Thermodynamic Study of Micellization of SDBS in Aqueous and in Binary Solvent Systems of Ethylene Glycol. Int. J. Eng. Res. Technol. 2020, 9, 581–586. [Google Scholar]
- Oengoeren, A.; Meier, B. A numerical approach to investigate solid transport characteristics in waste water drainage systems. In Proceedings of the CIB W62 International Symposium on Water Supply and Drainage, Brno, Czech Republic, 19–21 September 2007. [Google Scholar]
- Hu, Y.T.; Boltenhagen, P.; Matthys, E.; Pine, D.J. Shear thickening in low-concentration solution of worm like micelles. II. Slip fracture, and stability of the shear induced phase. J. Rheol. 1998, 42, 1209–1226. [Google Scholar] [CrossRef]
- Hu, Y.T.; Boltenhagen, P.; Pine, D.J. Shear thickening in low-concentration solution of wormlike micelles. I. Direct visualization of transient behavior and phase transitions. J. Rheol. 1998, 42, 1185–1208. [Google Scholar] [CrossRef]
- Wang, F.; Song, G.; Tan, B.; Du, H.; Wang, X. Effects of anionic surfactants and compounding on the performance of barrier layer polishing solutions. Lubrication Eng. 2023, 48, 46–54. [Google Scholar]
- Li, G.; Cai, L.; Wang, P.; Chen, S.; Wang, Y. Surface activity and dynamic surface tension of sodium dodecyl sulfate compounded with nonionic surfactant AEO 9/6501. J. Light Ind. 2016, 31, 7. [Google Scholar]
- Xing, M.; Gong, Z.; Wang, R. Nucleate pool boiling heat transfer characteristics of perfluoroalkyl quaternary mmonium iodide. Chem. Ind. Eng. Prog. 2020, 39, 2989–2997. [Google Scholar]
- Guo, X.; Ruan, L.; Tan, T. Study on the effect of tea saponin on the foaming ability of soybean protein. J. Henan Univ. Technol. 2009, 30, 12–15. [Google Scholar] [CrossRef]
- Tan, S.N.; Fornasiero, D.; Sedev, R.; Ralston, J. The role of surfactant structure on foam behaviour. Colloids Surf. A Physicochem. Eng. Asp. 2005, 263, 233–238. [Google Scholar] [CrossRef]
- Wang, X.; Zhang, L.; Gong, Q.; Wang, L.; Zhang, L.; Li, Z.; Zhao, S.; Yu, J. Foam properties and dynamic surface tension of aqueous solutions of sodium alkylbenzene sulfonate with different structures. J. Higher Educ. Chem. 2007, 28, 2118–2123. [Google Scholar]
- Wei, J.; Liu, F.; Liu, D. Progress in molecular dynamics simulations of surfactant solution for turbulent drag reduction. Chin. J. Theor. Appl. Mech. 2019, 51, 971–990. [Google Scholar]
- Paria, S.; Khilar, K.C. A review on experimental studies of surfactant adsorption at the hydrophilic solid–water interface. Adv. Colloid Interface Sci. 2004, 110, 75–95. [Google Scholar] [CrossRef]
- Li, J.; Zhang, X.; Zhang, C.; Xu, N. Mesoscopic Brownian dynamics simulation of self-assembly behavior of CTAC/NaSal surfactant rod micelles. China Surfactant Deterg. Cosmet. 2020, 50, 7. [Google Scholar]
- Wu, C. Hydraulics, 4th ed.; Higher Education Press: Beijing, China, 2008; pp. 127–131. [Google Scholar]
- Zhang, Z.; Fu, M.; Zhao, Y.; Li, R. Discussion on the free water jump characteristics of wave-shaped bottom plate dissipative tank. J. Appl. Mech. 2013, 6, 870–875. [Google Scholar]
- He, Z.; Liu, H.; He, L.; Wang, D.; He, S. Research progress on the excitation force of gas-liquid two-phase flow in pipelines. J. Eng. Sci. 2021, 43, 129–136. [Google Scholar]
- Pilpel, N. The relationship between rheolobic characteristic and microscopy structure–Study of surfactant additive. Trans. Faraday Soc. 1996, 62, 29–41. [Google Scholar]
- De Gennes, P.G.; Deutsch, J.M. Introduction to Polymer Dynamics.Cambridge; Cambridge University Press: Cambridge, MA, USA, 1990; pp. 34–54. [Google Scholar]
Disclaimer/Publisher’s Note: The statements, opinions and data contained in all publications are solely those of the individual author(s) and contributor(s) and not of MDPI and/or the editor(s). MDPI and/or the editor(s) disclaim responsibility for any injury to people or property resulting from any ideas, methods, instructions or products referred to in the content. |
© 2024 by the authors. Licensee MDPI, Basel, Switzerland. This article is an open access article distributed under the terms and conditions of the Creative Commons Attribution (CC BY) license (https://creativecommons.org/licenses/by/4.0/).