Abstract
Bioretention can be an efficient measure of stormwater treatment. The bioretention system has been globally adapted for controlling rainfall-runoff volume and removing pollutants. However, there is a lack of systematic analysis of some hydrological processes in the bioretention facility, such as the transportation of rainfall-runoff (event water) and soil water (pre-event water). This research uniquely applied stable isotope tracing to a bioretention system to investigate the transport of rainfall-runoff and the movement of soil water in a bioretention column. The stable isotope tracing method is helpful for determining the transport process of water and is expected to enhance our understanding of bioretention systems. The ratio of the event rainfall-runoff and the pre-event soil water in the bottom outflow of bioretention columns was calculated by the stable isotope bivariate mixing model based on the oxygen and hydrogen stable isotopic data from continuous testing in the discharge of bioretention column. The time-varying proportion of event water and pre-event water in the hydrographic curve reveals that the outflow process of soil water is divided into three stages. In the early stage, all the outflow was soil water, accounting for about 6–13% of the total outflow. In the middle stage, the proportion of soil water rapidly decreased from 100% to 20% within a few minutes. In the later stage, the soil water proportion decreased slowly from 20% to 0%. The outflow of soil water accounted for more than 36% of the total outflow and decreased with the extension of the drought period. Soil water is a critical part of the bottom outflow of bioretention columns, and the influence of soil water on the hydrological effect of bioretention columns cannot be ignored.
1. Introduction
The glory of industrial civilization has led people to adapt to the urban construction model of overcoming, surpassing, and transforming nature. However, rapid urbanization has been accompanied by a series of hydrological issues, such as frequent urban floods and waterlogging, urban water shortages, the ecological deterioration of river systems, and intensified water pollution [1]. Therefore, urban stormwater management is an essential aspect of the current urbanization process. Many countries are implementing different rainwater management methods based on the regional water characteristics of their cities, for example, the Low Impact Development (LID) in North America, the Water Sensitive Urban Design (WSUD) in Australia, the Sustainable urban drainage systems (SUDS) in the UK, and China’s Sponge City Concept (SPC) [2,3].
The bioretention system is a promising practice in low-impact development as well as a significant technical method to control rainfall-runoff pollution owing to its high runoff retention capacity, runoff purification capacity, runoff volume management capacity, and biodiversity and aesthetics improvement [4]. The existing research focusing on the hydrological effects of bioretention systems are generally small-scale or pilot experiments. For example, Gülbaz developed a rainfall-watershed-bioretention (RWB) system [5]. The results of inflow and outflow hydrographs obtained with the RWB system indicate that different soil characteristics have a considerable effect on the hydrological performance of the bioretention system due to the different infiltration capacities of the multifarious combinations of fillers. Tian tested the hypothesis that amending bioretention cells with biochar and zero-valent iron (ZVI) could improve the NO3− removal performance by investigating the hydrological performance of a bi-layer pilot-scale bioretention cell [6]. The biochar/ZVI cell greatly increased water retention by 11–27% and mean residence time by 0.7–3.8 h compared to the control cell without amendments. In the study conducted by Yang, multiple hydrological performance indicators were quantified using artificial rainfall devices, such as the peak flow arrival time, outflow arrival time, peak flow reduction rate, and runoff reduction rate [7]. The results showed that, in the bioretention system, clay had the best effect on controlling runoff among the studied soil types, while slag showed the worst hydrological effect. Additionally, rainfall intensity greatly impacted the hydrological effects [8].
These studies analyzed the parameters of total runoff reduction rate, peak flow reduction rate, peak flow arrival time, hydraulic retention time, outflow arrival time, etc. of bioretention systems. Nevertheless, the parameters in the existing research were generally acquired by directly observing the flow hydrograph of the bottom outflow of the bioretention system. The bioretention system was often regarded as a black box, and the hydrological effects of bioretention were evaluated based on the basis of the comparison between the inflow and outflow processes as experimental conditions changed [9]. These evaluating methods overlooked the multiple impacts of soil water, including the participation of soil water in the outflow hydrographs and the effects of soil water on the assessment of the storage, retention, and purification capacity of the bioretention system [10]. In addition, merely observing the outflow fails to specify hydrological processes inside the bioretention column, such as the absence of assessing the hydraulic retention time of storm runoff and the infiltration form of the runoff.
Williams and Pinder analyzed streamflow using hydrograph separation and streamflow partitioning methods to identify the pathways contributing to stream flow increase when a rain event occurs [11]. The results showed that the source of a significant amount of additional streamflow, apart from the rainfall-runoff, is attributed to subsurface contributions, namely a groundwater surge and shallow interflow. Therefore, streamflow during a storm event can be comprised of water from three sources beyond baseflow: (1) surface runoff (comprising a small fraction of 25% to 30%), (2) shallow interflow, and (3) groundwater surge. Brown estimated the contributions of groundwater and throughfall to each rainstorm flow sample using the two-tracer three-component separation method [12]. The study suggested that shallow subsurface flow provides a substantial contribution to stormflow in the catchments. Although there are differences between studies, the water before rainfall accounts for a greater proportion of river hydrograph for at least 2/3 cases [13]. We can reach the conclusion that in natural basins, most of the rainfall-runoff will be conserved in the soil as groundwater and shallow interflow and become the main contributing factor to river flow when a rainstorm event occurs. Therefore, the impact of the presence of a huge amount of soil water in the natural watershed runoff process cannot be ignored. Hydrologists have also divided the runoff into rainfall event water and pre-event water according to time. Event water refers to the rainwater from the current rainfall, while pre-event water is the rainwater from the previous rainfall, which is formerly stored in the soil and flows into the river when the rainfall occurs in the present event. Numerous studies claimed that in natural watersheds, pre-event water accounts for a considerable proportion of the flow hydrograph at the outlet of the watershed. In the same way, predevelopment hydrological processes play an important role in stormwater control measures [14]. This brought attention to the fact that when we evaluate the various hydrological effects of bioretention, the hydrograph separation of event water and pre-event water is worth further research.
Hydrometric-based storm hydrograph separation dates over 60 years, and major headway has been made in hydrograph separation since 1969, the year water isotopes were introduced as a tool for the separation of the storm hydrograph into time-source components of event and pre-event water [15]. Environmental stable water isotopes, either 18O or 2H, have been applied progressively to separate stormflow into event and pre-event components for the purpose of elucidating the sources, pathways, and residence times of water in drainage basins [16]. Nowadays, hydrograph separation using stable isotopes has flourished in various catchments at different scales [17]. Stable isotope techniques have been introduced in recent years to address the issues of bioretention systems. Kavehei used stable isotopes (13C and 15N) to assess temporal changes in soil composition and to identify the sources of carbon in 25 bioretention basins in a subtropical climate in Australia [18]. In the experiment conducted by Duan, stable carbon isotope analysis techniques helped to investigate the migration and transformation of three typical 13C-labeled persistent organic pollutants in regularly added bioretention columns [19]. Notwithstanding, no study has investigated the hydrograph separation of bioretention systems using stable isotopes so far [20].
In this paper, a bioretention column simulation device and synthetic stormwater runoff were designed. We used the hydrochemistry and oxygen and hydrogen stable isotopic tracing technique, combined with the local rainfall and soil characteristics in Wuhan, to explore the migration of pre-event water and event water in the bioretention column under different drought conditions. The purpose of this paper is to refine the hydrological effects of the bioretention column, explore the outflow process of the two parts of the water body, and evaluate the key parameters, such as the peak flow reduction rate, total water reduction rate, soil water outflow, and rainstorm runoff outflow time. This information could provide a reference for further research on the hydrological effects of bioretention systems in the future.
2. Materials and Methods
2.1. Device Setting and Experimental Setup
The experiment was conducted in the State Lab of Water Resources Engineering and Management, Wuhan University. The bioretention column consisted of 5 PVC pipes (Kingbull Economic Development Co. Ltd., Wuhan, China), with a length of 30 cm and diameter of 11 cm, and 4 extended double-threaded expansion joints, with a height of 150 cm and a diameter of 11 cm as a whole. The entire column could be disassembled in sections for the replacement of each layer’s padding and the installation of the detector (Figure 1). According to the standard complex bioretention facility structure, the column had a water depth of 30 cm and 120-cm medium (from bottom to top: 30 cm of a gravel layer, 60 cm of a filler layer, and 30 cm of a soil layer). Permeable geotextile was laid between the gravel layer and the filter layer as an inverted filter. The filler of each layer is shown in Table 1.
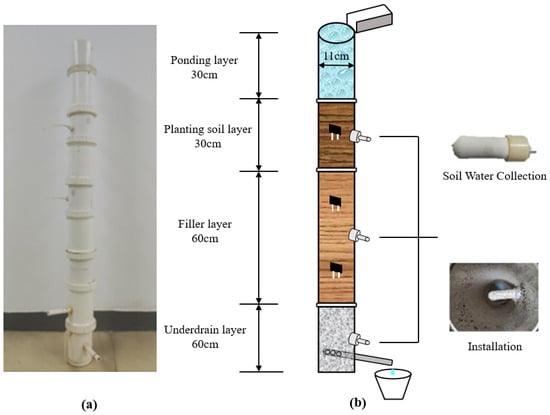
Figure 1.
Schematic of the bioretention column: (a) photograph and (b) structure.

Table 1.
The configuration of the four bioretention layers.
The gravel layer was composed of gravel with a diameter of about 1.5 cm, washed with water to prevent outflow from contamination. In the gravel layer, the perforated pipes, made of PVC pipes (2 cm in diameter), were installed at 10 cm from the bottom as drainage pipes. The pipes were punched towards one side, and the surface was wrapped with permeable geotextile to prevent soil particles from entering the perforated pipes and causing blockage. The inverted filter layer was located above the gravel layer. The main function of this layer was to prevent upper soil particles from entering the gravel layer and damage its drainage performance. In this experiment, we used single-layer thickened permeable geotextile with a thickness of about 1 mm as the inverted filter material. The filler layer was filled with 97% sandy soil and 3% corn stalk biochar mixed filler. The soil layer had a filler comprised of a mixture of 60% sandy soil and 40% silty loam from Shizishan, Wuhan. On top of the filler layer, there was a planting soil layer and a ponding layer, which can temporarily store rainwater runoff and extend the time for processing rainwater runoff. During the filling process, the filler was slightly densified, and hydraulic compaction was used after filling to ensure the consistency of the soil compaction degree of each experimental group. The bioretention column contained a soil water sampler in the middle of the planting soil layer (45 cm in depth), the filler layer (90 cm in depth), and the gravel layer (135 cm in depth) to collect different layer samples as shown in Figure 1.
2.2. Inflow and Outflow Settings
During the experiment, artificially simulated rainfall-runoff events were input into the bioretention column. The artificially simulated rainfall process used the “Rainstorm Intensity Formula and Design Rainstorm Pattern in Wuhan” as the basis. According to the results of previous rainfall detection and calculations in Wuhan, the total rainfall amounts with a return period of 2 years and 60 min was 44.5 mm. The confluence area ratio of the bioretention cell in Wuhan was set to 10:1, while the runoff coefficient was 0.9 based on the underlying surface of the experimental confluence area, which was mainly composed of impervious roof and cement pavement. To facilitate the setting of inflow intensity as well as improve the accuracy of water control, the total inflow in this experiment was 3987 mL. The inflow was in the form of uniform rainfall with an intensity of 66.45 mL/min. The synthetic runoff was controlled by a measuring cylinder to ensure uniformity of the inflow volume. The specific test arrangements are displayed in Table 2.

Table 2.
Calculation of the influent flow rate.
This experiment selected two kinds of water sources with different stable isotope signatures as the test water sources for the purpose of tracing. One of the water sources was fetched from Wuhan University’s tap water of the Engineering Department No.6 Teaching building, and the other one is from East Lake, with a salinity of 255 ppm and 242 ppm, δ2H values of −64.23‰ and −54.59‰, and δ18O values of −8.56‰ and −6.43‰, respectively.
The bottom outflow of the bioretention column was discharged through a perforated pipe in the gravel layer. The water surface was maintained at a height higher than 20 cm above the planting soil layer by continuously adding tap water at the inflow point. After the effluent stabilized, the inflow rate was found to be equal to the bottom outflow rate, verifying the good drainage capacity of the bioretention column pipe in the gravel layer to discharge water in a timely manner. The overflow of the bioretention column was free to flow through the top of the bioretention column to the outside of the system.
2.3. Sample Collection and Analytical Determination
Subsequent to the first artificial rainfall and a drought period (1 day) under natural conditions, the experiment was conducted on the bioretention column with simulated rainwater runoff using water from East Lake. After the experiment, the bioretention column was left to stand for a drought period (4 days) under natural conditions. In order to ensure that the stable isotope signatures of soil water and rainstorm runoff were significantly distinguishable in the next test (at this point, the stable isotope signatures of soil water were close to the water from East Lake), after the set drought period, tap water was used as the water source to simulate rainstorm runoff. In the next stage, the bioretention column was left to stand for a drought period (7 days) under natural conditions. To ensure a visible difference in stable isotope signatures between soil water and rainstorm runoff (at this point, the stable isotope signatures of soil water were close to those of the tap water), after the set drought period, rainstorm runoff was simulated by the water from East Lake. In the early stages of rainfall, rainwater carries a large amount of pollutants from the atmosphere to the ground. At the same time, due to the accumulation of a large amount of pollutants on the ground for a long time before the occurrence of rainfall events, these pollutants are carried to the surface runoff through rainwater erosion in the early stages of rainfall, leading to a high degree of pollution in the initial rainwater. Barco defined whether the initial erosion phenomenon occurred by comparing the growth rate of pollution load and the growth rate of runoff by plotting the growth rate of pollution load on the vertical axis and the growth rate of runoff on the horizontal axis [21]. When the plotted curve is higher than the x = y line and the maximum dispersion is >20, it is considered that there is an initial flush. This experiment considered the runoff generated in the first 15 min, which is the first 25% of the total runoff, as initial rainwater.
Sodium chloride, which was used as a tracer, was added to the initial rainwater (the first 25% of the runoff) to achieve a mineralization value of more than 10 times the background value in order to achieve a differentiation effect. Among them, the background mineralization values of the tap water and the East Lake water from the Sixth Department of Engineering of Wuhan University were 255 ppm and 242 ppm, respectively. Due to the low collection volume of soil water samples from the column, which did not meet the requirements for mineralization testing, there were no background data on soil water mineralization.
Before the experiment, 10 mL of inflow was collected and sealed with polyethylene centrifuge tubes for temporary storage. Approximately 3 mL of soil water samples were extracted by a 20-mL syringe from each layer of soil water collector and placed in polyethylene centrifuge tubes for temporary storage. After sample collection, a 0.22-μm polyether sulfone (PES) filter head was used to filter the water sample into a 2-mL chromatographic sample injection bottle before being sealed. We ensured that the water sample filled the sample bottle during filtration, and no bubble was allowed to enter the bottle to prevent the evaporation of the water sample from causing hydrogen and oxygen stable isotope fractionation. The above samples were stored cryogenically after being sealed.
When the bottom outflow of the bioretention column became stable, the first water sample was collected using a polyethylene cup. Subsequently, all outflow water samples were collected continuously at a fixed time interval. The samples were collected every 2 min for the first 15 min and every 4 min for the subsequent 15–51 min. The later sampling interval was adjusted according to the value of the outflow, and sampling reached an end when the outflow was less than 1 mL/min; 36 water samples were collected for each group of experiments.
2.4. Stable Isotope Analysis
All the samples were analyzed within the Stable Isotope Laboratory of Wuhan University. δ2H and δ18O were determined by Flashed HT Elementary Analyzer and MAT253 Stable Isotope Ratio Mass Spectrometers (Thermo Fisher Scientific., Waltham, MA, USA). The measuring accuracies of the δ2H and δ18O tests were 2‰ and 0.2‰, respectively. The Vienna Standard Mean Ocean Water (VSMOW) was used as the reference [22].
Then, the stable isotope bivariate mixing model was used for water division. The natural water stable isotope evolution in nature is mainly divided into three parts: evaporation, exchange, and mixing. The experiment was run under a short test period and low temperature; the influence of evaporation and exchange interaction on isotope evolution was low and could be ignored. Thus, mixing interaction became the main factor causing isotope evolution. The end-member mixing model is a common tool for quantifying the impact of mixing interaction. The bivariate mixing model is the simplest mixing system, which involves the mixture of two different bodies of water. Stable isotope bivariate mixing models are designed based on the principle of mass conservation. When calculating the composition of two types of water sources (current precipitation, , and non-current precipitation, ), a mass balance equation is used, as follows:
where is the quantity of mixture flow, and are the flows of current precipitation and non-current precipitation, respectively, , , and each represent the mill deviation of the stable isotope of mixed water, , current precipitation, , and non-current precipitation, .
The contribution rate of and in the sample is expressed as and 1 − , as follows:
This formula is an approximation because the mixture here is δ18O instead of 18O. Assuming that there is a total of molecules of 18O and 16O in water source A, the isotope ratio is given by:
The number of 18O molecules is calculated to be ()/(1 + ), which is the same for water source B. By the law of conservation of mass, the following equation is obtained:
Due to the low content of stable isotopes in nature and some testing reasons, generally, the absolute abundance of stable isotopes cannot be measured accurately; only the relative ratio of to can be measured, where is the ratio of the heavy isotope to the light isotope of the element and is the ratio corresponding to a specific standard.
The mill deviation of isotopic composition, δ, is defined by the formula:
By using the definition of δ, it can be concluded that:
When the isotopic natural abundance, δ, is within the range of 100‰, the above equation can be approximated as the following equation (within ± 0.03‰).
where is the component of a certain water body A in and (1 − ) is the component of the other water body B in .
Given these parameters, it can be deduced that:
That is, in the stable isotope bivariate mixing model, the contribution of each potential water source to the mixed water body can be obtained by testing the mill deviation of the stable isotope of the mixed water body and two potential water sources.
3. Results and Discussion
3.1. Hydrogen and Oxygen Isotope Signatures of Bottom Outflow
The hydrogen and oxygen stable isotope data from the bottom outflow of the bioretention column measured in the test are shown in Figure 2 (take the first group of the test results as an example for the quantity and consistency of data in each test group).
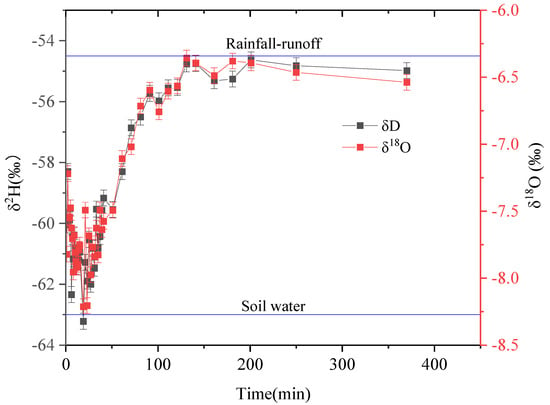
Figure 2.
Hydrogen and oxygen isotope signatures of bottom outflow.
As the figure shows, the δ2H and δ18O of the soil water were close to the δ2H and δ18O of the rainstorm runoff in the last rainfall event (δ2H = −64.23‰, δ18O = −8.56‰). According to the hydrogen and oxygen stable isotope data from the bottom outflow of the bioretention column, it can be seen that in the first 15 min, the results of δ18O and δ2H were relatively unstable, showing a fluctuating state, and their values were close to the δ18O and δ2H of the soil water in the bioretention column. This phenomenon indicated that the early outflow is mainly soil water. The fluctuation of the early outflow might be caused by fractionation due to the different intensities of evaporation of the soil water at diverse depths, which led to the difference in stable isotope signatures at diverse depths. The phenomenon was proved by testing the mill deviation of hydrogen and oxygen stable isotopes of soil water samples at different depths of the column before the experiment. Meanwhile, due to the connection between the drainage blind pipe at the bottom of the bioretention column and the atmosphere, during the drought period, the bottom of the soil water was strongly affected by evaporation, which might lead to the enrichment of heavy isotopes in the bottom soil water, resulting in a positive mill deviation in the early outflow. After about 15 min, the δ2H and δ18O of effluent from the bottom of the bioretention column began to rapidly approach the δ2H and δ18O of the rainstorm runoff, illustrating that the outflow was a mixture of rainstorm runoff and soil water, and the mixing time was considerably long (tens or even hundreds of minutes). In the later stage of outflow, the hydrogen and oxygen stable isotope signatures of the bottom outflow were close to those of the rainstorm runoff (East Lake water), demonstrating that the bottom outflow of the bioretention column was mainly rainstorm runoff at this period.
3.2. Water Chemical Tracing Technology for Tracing the Transport of Initial Rainwater
The outflow characteristics of the initial rainwater in the biological retention column of the planting layer with 60% sandy soil and 40% silty loam are shown in Figure 3. From the results, it can be seen that under the planting layer ratio of 60% sandy soil and 40% silty loam, the mineralization degree of the water samples collected after the bottom of the bioretention column began to flow showed a slight decrease, followed by a rapid increase to the peak and then a rapid decrease in the three sets of experiments conducted under the conditions of 1 day, 4 days, and 7 days of drought. In the three sets of experiments, the mineralization degree slightly decreased after 8 min, 15 min, and 10 min, respectively. This phenomenon indicates that the mineralization degree of the first outflow was slightly higher. This is because the bottom outlet of the biological retention column was connected to the atmosphere and the evaporation phenomenon was strong.
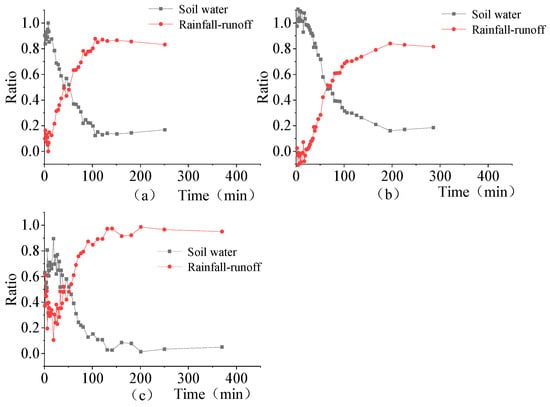
Figure 3.
TDS variation process of initial rainwater under drought period of 1 day (a), 4 days (b), and 7 days (c).
Moreover, according to the Ohio guidelines for the construction of bioretention facilities in the United States, it is recommended that the installation height of the bottom drainage pipe of the bioretention facility be more than 3 inches higher than the bottom of the bioretention facility. Therefore, in this design, the bottom drainage pipe was 10 cm away from the bottom of the bioretention column. Therefore, the bioretention bottom stored a small amount of water during dry periods, and this part of the water was connected to the atmosphere during dry periods, which was prone to evaporation, leading to ions in the water body, The concentration of molecules and compounds led to a higher degree of mineralization in the water that first flowed out. Due to the same influence of evaporation at the top of the soil column, the TDSs of the initial outflow water sample were recovered at approximately 8 min, 19 min, and 17 min in each group of experiments.
Afterward, the salinity of the outflow water began to rapidly increase, indicating that the sodium chloride added to the initial rainwater began to flow out. Mechanical diffusion refers to the phenomenon of solute diffusion generated by fluids in porous media. This is because the pores of porous media are often tortuous, which can lead to changes in the local velocity of the fluid in size and direction, thereby expanding the range of solute diffusion in the fluid. Molecular diffusion refers to the phenomenon of solute migration from high concentrations to low concentrations under the action of solution gradients, and it follows Fick’s law. Both phenomena may cause sodium chloride to move faster than the water when flowing in the water. Therefore, it can be considered that in this experiment, in the first 8 min, 15 min, and 10 min of the three experimental scenarios, the initial rainwater did not reach the bottom of the biological retention column. At the same time, this also implies that all the outflow from the bottom of the bioretention column during this period was soil water, which can be used to correct the results of dividing the outflow hydrograph at the bottom of the bioretention column using hydrogen and oxygen stable isotope technology.
Afterward, the mineralization of the water body rapidly increased to its peak, indicating that the initial rainwater began to flow out of the biological retention column. Based on this, it can be determined that under a planting soil ratio of 60% sandy soil and 40% silty loam, the hydraulic retention time of the initial rainwater in the biological retention column was 38 min, 56 min, and 54 min in the three sets of experiments completed on the first, fourth, and seventh day of the drought period, respectively. This hydraulic retention time is longer than the hydraulic retention time determined under the assumption of the initial rainwater outflow scenario when outflow occurs. At the same time, the mineralization reached its peak at 44 min, 61 min, and 67 min, respectively, indicating that the initial rainwater accounted for the largest proportion in the outflow, indicating that the initial rainwater entered the tailing stage thereafter. After 119 min, 109 min, and 125 min, respectively, the decline in salinity slowed down. Before the end of the outflow, the salinity was close to the background value of the rainstorm runoff, which means that in a rainfall event, the initial rainwater would basically flow out from the bottom of the biological retention column. To facilitate the display of the initial rainwater outflow process, a graphical representation is used, and the display results are shown in Figure 4.
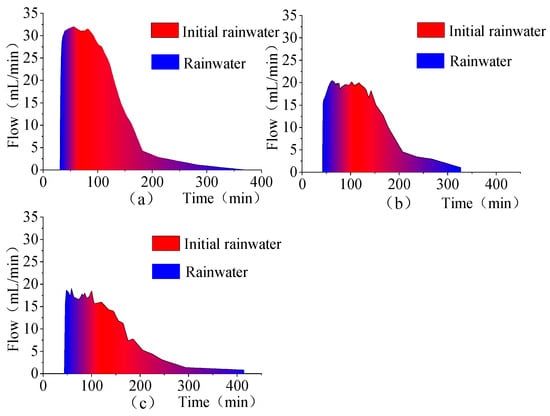
Figure 4.
Initial rainwater transport process under drought period of 1 day (a), 4 days (b), and 7 days (c).
3.3. Proportion of Rainstorm Runoff and Soil Water
The ratio of soil water and rainstorm runoff in the bottom outflow of the bioretention column at different times was calculated by using a stable isotope bivariate mixing model. The three soil water samples collected at different depths had a slight difference in the hydrogen and oxygen stable isotope ratio, and the difference with rainstorm runoff was large. Therefore, we took the average value of the mill deviation of the stable isotope of soil water at three different depths as the mill deviation of the comprehensive hydrogen and oxygen stable isotope of soil water in the bioretention column. The δ2H and δ18O data measured in the bottom outflow of the bioretention column were incorporated into the model for calculations. The results are shown in Figure 5 and Figure 6.
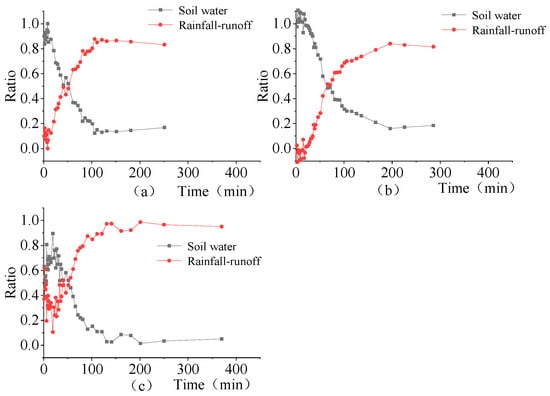
Figure 5.
Bivariate mixing calculation results of δ2H under drought period of 1 day (a), 4 days (b), and 7 days (c).
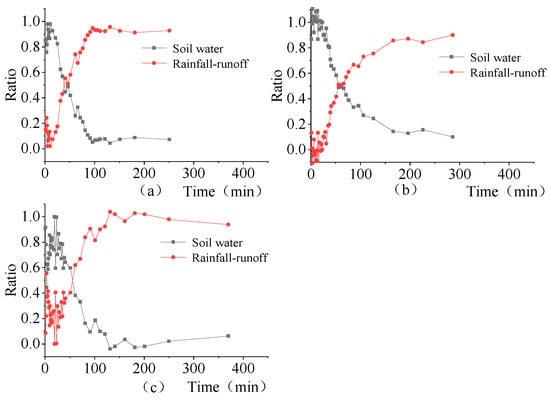
Figure 6.
Bivariate mixing calculation results of δ18O under drought period of 1 day (a), 4 days (b), and 7 days (c).
Comparing Figure 5 and Figure 6, the same trend appeared in both the soil water and rainstorm runoff ratios calculated by the bivariate mixing model according to the δ2H and δ18O isotope data. Within 23 to 28 min after the outflow occurred, the proportion of soil water gradually fluctuated from about 80% at the time of outflow to nearly 100%. On the other hand, the proportion of corresponding rainstorm runoff decreased from about 20% to nearly 0%. In the next period, the proportion of soil water decreased drastically from about 100% to 20%. Meanwhile, there was a sharp rise in the proportion of rainstorm runoff from about 0% to approximately 80%. This process lasted for about 130 to 142 min. The sharp change in offset periods were 30 to 160 min, 28 to 170 min, and 23 to 160 min, corresponding to drought periods of 1 day, 4 days, and 7 days, respectively. During the last stage, the rate of the proportion change in soil water and rainstorm runoff slowed down, with the soil water ratio gradually approaching 0% and the rainstorm runoff ratio reaching 100%.
3.4. Division of Flow Hydrograph of Bioretention Column Outflow
The migration testing results in the bioretention column of the outflow process were divided by applying the hydrogen and oxygen stable isotope technology. On the basis of the standard that rainstorm runoff began to discharge when the total dissolved solids (TDSs) recovered to the TDSs of the original outflow water samples, the division of the outflow process of the bioretention column could be modified, which could achieve a better correction effect on the proportion of the outflow. The calculation of δ2H was revised, and the result of the correction is shown in Figure 7.
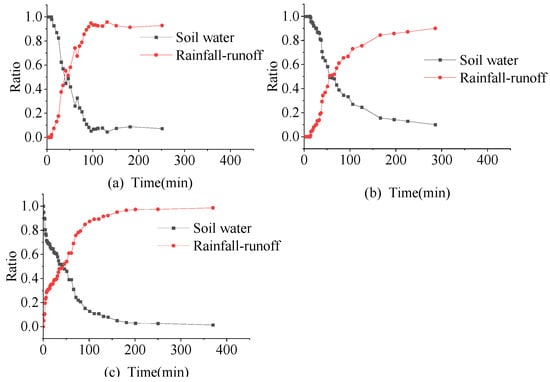
Figure 7.
Bottom outflow proportion under drought period of 1 day (a), 4 days (b), and 7 days (c).
Rainstorm runoff, , and soil water, , at different times were calculated by the two formulas:
where represents the bottom outflow according to the calculated outflow hydrograph and and are the proportions of soil water and rainstorm runoff after correction, respectively.
As shown in Figure 8, the yellow part is soil water (pre-event water), and the blue part is rainstorm runoff (event water). The rainstorm runoff hydrograph is displayed in the top right-hand corner.
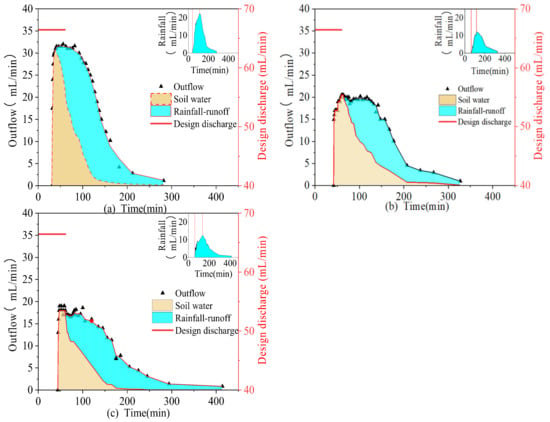
Figure 8.
Outflow hydrograph and rainstorm runoff hydrograph of bioretention column under drought period of 1 day (a), 4 days (b), and 7 days (c).
3.5. Hydrological Effects of the Bioretention Column
There are significant differences in the bottom outflow results of the biological retention column experiments completed sequentially during the 1-day, 4-day, and 7-day drought periods. The characteristics of their delayed outflow time, peak flow reduction rate, total outflow rate, total water reduction rate, and soil water outflow are shown in Table 3.

Table 3.
Flow characteristics of the bottom outflow of the bioretention column.
The delayed outflow time was prolonged with the experimental sequence, while the peak flow reduction rate increased. Research has shown that as the drought period extends, the likelihood of the occurrence of preferential flow increases, leading to an earlier outflow time [23]. Therefore, we could rule out that the drought period led to an increase in delayed outflow time. A lower permeability coefficient would prolong the outflow time and enhance the mitigation of the peak flow [24]. So, it was concluded that the extension of the outflow lagtime and the increase in the peak flow reduction rate are related to the gradual decline in the permeability coefficient of the bioretention column. As the drought period became longer, the total outflow decreased, indicating that the runoff retention capacity had enhanced, which is consistent with previous research [25]. The increase in the drought period also led to a reduction in soil water discharge.
The soil water hydrograph (yellow part) in a series of three experiments on bioretention columns could be divided into three stages. In the early stage of outflow, the proportion of soil water was 100%, while rainstorm runoff was 0%. Under the three experimental scenarios, this stage was maintained for 50 to 63 min, 56 to 110 min, and 81 to 100 min, respectively. In the middle phase, soil water outflow decreased rapidly, which was 63 to 220 min, 110 to 190 min, and 100 to 220 min, respectively. In the later stage, soil water outflow slowly decreased to 0% and stopped flowing after 220 min, 190 min, and 220 min, respectively. Separately, in the three sets of experiments, soil water dominated the bottom outflow (with a proportion greater than 50%) after 118, 110, and 90 min, respectively. In addition, soil water outflow accounted for over 48% of the total outflow.
The rainstorm runoff hydrograph of the bioretention column that was obtained successfully through the 1-day, 4-day, and 7-day drought periods in the experiments illustrates that the outflow times of rainstorm runoff were 76 min, 83 min, and 91 min, respectively. The peak flow of rainstorm runoff gradually decreased, which was 7.76 mL/min, 7.72 mL/min, and 4.18 mL/min, respectively. The peak flow reduction rates were 88.3%, 88.4%, and 93.7%, respectively. The peak flow and the reduction rate had a similar variation as the peak flow of the bottom outflow and the reduction rate of the peak flow.
4. Conclusions
This paper presents a quantitative study of the migration process of soil water and rainstorm runoff in a bioretention column under a simulated rainfall event using a combination of hydrochemistry and a stable isotope tracer. The bottom outflow of the early period (6 to 15 min) was found to be soil water entirely. After the outflow occurred, the bottom outflow was mainly soil water within tens of minutes and then gradually became dominated by rainstorm runoff until the end. These findings divide the process of bottom outflow into three stages. In the early stage, outflow was composed of soil water. In the middle stage, the proportion of soil water decreased to about 20% within a few minutes. In the later stage, soil water slowly declined and ultimately approached 0%. With the extent of the drought period, the outflow lagtime of the bottom outflow was stretched, the peak flow reduction rate of the bottom outflow increased, the rainstorm runoff outflow time was extended, the rainstorm runoff peak flow decreased, and the peak shape of the rainstorm runoff hydrograph changed from steep to gentle.
This study highlights the impact of soil water in bioretention systems. In the first 15 min, soil water that had undergone long-term soil purification comprised about 6–13% of the bottom outflow of the bioretention column, with a large potential for direct recovery. Overall soil water outflow accounted for over 36% of the total outflow, and yet, it was significantly affected by the drought period. The displacement process of soil water was shown to be an important process of bottom outflow. According to the results, previous research that adopted methods that treated bioretention systems as black boxes and ignored the presence of soil water was not rigorous enough. Future research should not ignore the impact of soil water and the influence of drought period on soil water quality and quantity when evaluating the effectiveness of water quality and quantity control in bioretention systems.
Author Contributions
Conceptualization, Y.Y.; Methodology, X.Z.; Software, C.W. and L.C.; Validation, J.C. and J.W.; Formal analysis, Y.Y.; Data curation, C.W. and L.C.; Writing—original draft, Y.Y.; Writing—review & editing, Y.Y. and X.Z.; Supervision, X.Z. All authors have read and agreed to the published version of the manuscript.
Funding
This research was supported by the Key Research and Development Program of Hubei Province (No. 2021BCA128), the Ministry of Water Resources of the People’s Republic of China (SKS-2022014), and the National Natural Science Foundation of China (No. 41890823).
Data Availability Statement
Data are contained within the article.
Acknowledgments
We thank the anonymous reviewers for their comments.
Conflicts of Interest
Author Chao Wang was employed by the company China Water Resources Dongbei Investigation, Design and Research Co., Ltd. The remaining authors declare that the research was conducted in the absence of any commercial or financial relationships that could be construed as a potential conflict of interest.
References
- Marlow, D.R.; Moglia, M.; Cook, S.; Beale, D.J. Towards sustainable urban water management: A critical reassessment. Water Res. 2013, 47, 7150–7161. [Google Scholar] [CrossRef] [PubMed]
- Fletcher, T.D.; Shuster, W.; Hunt, W.F.; Ashley, R.; Butler, D.; Arthur, S.; Trowsdale, S.; Barraud, S.; Semadeni-Davies, A.; Bertrand-Krajewski, J.-L.; et al. SUDS, LID, BMPs, WSUD and more—The evolution and application of terminology surrounding urban drainage. Urban Water J. 2015, 12, 525–542. [Google Scholar] [CrossRef]
- Li, H.; Ding, L.; Ren, M.; Li, C.; Wang, H. Sponge City Construction in China: A Survey of the Challenges and Opportunities. Water 2017, 9, 594. [Google Scholar] [CrossRef]
- Vijayaraghavan, K.; Biswal, B.K.; Adam, M.G.; Soh, S.H.; Tsen-Tieng, D.L.; Davis, A.P.; Chew, S.H.; Tan, P.Y.; Babovic, V.; Balasubramanian, R. Bioretention systems for stormwater management: Recent advances and future prospects. J. Environ. Manag. 2021, 292, 112766. [Google Scholar] [CrossRef] [PubMed]
- Gülbaz, S.; Kazezyılmaz-Alhan, C.M. Experimental Investigation on Hydrologic Performance of LID with Rainfall-Watershed-Bioretention System. J. Hydrol. Eng. 2017, 22, D4016003. [Google Scholar] [CrossRef]
- Tian, J.; Jin, J.; Chiu, P.C.; Cha, D.K.; Guo, M.; Imhoff, P.T. A pilot-scale, bi-layer bioretention system with biochar and zero-valent iron for enhanced nitrate removal from stormwater. Water Res. 2019, 148, 378–387. [Google Scholar] [CrossRef] [PubMed]
- Yang, N.; Du, W.; Chen, L.; Shen, Z.; Chang, C.-C.; Ma, Y. Prioritizing the soil and filler layers of a bioretention system by considering multiple hydrological effects. J. Hydrol. 2021, 603, 127008. [Google Scholar] [CrossRef]
- Bhaskar, A.S.; Hogan, D.M.; Archfield, S.A. Urban base flow with low impact development. Hydrol. Process. 2016, 30, 3156–3171. [Google Scholar] [CrossRef]
- Yu, Y.; Li, Z.; Yu, T.; Guo, S.; Zhou, Y.; Li, X.; Zhang, W. Hydrologic and water quality modelling of bioretention columns in cold regions. Hydrol. Process. 2023, 37, 14871. [Google Scholar] [CrossRef]
- Nissen, K.A.; Borst, M.; Fassman-Beck, E. Bioretention planter performance measured by lag and capture. Hydrol. Process. 2020, 34, 5176–5184. [Google Scholar] [CrossRef]
- Williams, J.B.; Pinder, J.E. Ground-water flow and runoff in a coastal-plain stream. Water Resour. Bull. 1990, 26, 343–352. [Google Scholar] [CrossRef]
- Brown, V.A.; McDonnell, J.J.; Burns, D.A.; Kendall, C. The role of event water, a rapid shallow flow component, and catchment size in summer stormflow. J. Hydrol. 1999, 217, 171–190. [Google Scholar] [CrossRef]
- Cizek, A.R.; Hunt, W.F. Defining predevelopment hydrology to mimic predevelopment water quality in stormwater control measures (SCMs). Ecol. Eng. 2013, 57, 40–45. [Google Scholar] [CrossRef]
- Stewart, R.D.; Lee, J.G.; Shuster, W.D.; Darner, R.A. Modelling hydrological response to a fully-monitored urban bioretention cell. Hydrol. Process. 2017, 31, 4626–4638. [Google Scholar] [CrossRef]
- Klaus, J.; McDonnell, J.J. Hydrograph separation using stable isotopes: Review and evaluation. J. Hydrol. 2013, 505, 47–64. [Google Scholar] [CrossRef]
- Buttle, J.M. Isotope hydrograph separations and rapid delivery of pre-event water from drainage basins. Prog. Phys. Geogr. Earth Environ. 1994, 18, 16–41. [Google Scholar] [CrossRef]
- Woznicki, S.A.; Hondula, K.L.; Jarnagin, S.T. Effectiveness of landscape-based green infrastructure for stormwater management in suburban catchments. Hydrol. Process. 2018, 32, 2346–2361. [Google Scholar] [CrossRef]
- Kavehei, E.; Shahrabi Farahani, B.; Jenkins, G.A.; Lemckert, C.; Adame, M.F. Soil nitrogen accumulation, denitrification potential, and carbon source tracing in bioretention basins. Water Res. 2021, 188, 116511. [Google Scholar] [CrossRef] [PubMed]
- Duan, X.; Li, J.; Li, Y. The fate of three typical persistent organic pollutants in bioretention columns as revealed by stable carbon isotopes. Chemosphere 2023, 334, 138996. [Google Scholar] [CrossRef] [PubMed]
- Lyon, S.W.; Desilets, S.L.E.; Troch, P.A. A tale of two isotopes: Differences in hydrograph separation for a runoff event when using δD versus δ18O. Hydrol. Process. 2009, 23, 2095–2101. [Google Scholar] [CrossRef]
- Barco, J.; Papiri, S.; Stenstrom, M.K. First flush in a combined sewer system. Chemosphere 2008, 71, 827–833. [Google Scholar] [CrossRef] [PubMed]
- Reference Material 8535VSMOW; Vienna Standard Mean Ocean Water. National Institute of Standards and Technology, U.S. Department of Commerce: Washington, DC, USA, 2022.
- Liu, R.F.; Fassman-Beck, E. Hydrologic response of engineered media in living roofs and bioretention to large rainfalls: Experiments and modeling. Hydrol. Process. 2017, 31, 556–572. [Google Scholar] [CrossRef]
- Braswell, A.S.; Winston, R.J.; Hunt, W.F. Hydrologic and water quality performance of permeable pavement with internal water storage over a clay soil in Durham, North Carolina. J. Environ. Manag. 2018, 224, 277–287. [Google Scholar] [CrossRef] [PubMed]
- Mangangka, I.R.; Liu, A.; Egodawatta, P.; Goonetilleke, A. Performance characterisation of a stormwater treatment bioretention basin. J. Environ. Manag. 2015, 150, 173–178. [Google Scholar] [CrossRef] [PubMed]
Disclaimer/Publisher’s Note: The statements, opinions and data contained in all publications are solely those of the individual author(s) and contributor(s) and not of MDPI and/or the editor(s). MDPI and/or the editor(s) disclaim responsibility for any injury to people or property resulting from any ideas, methods, instructions or products referred to in the content. |
© 2024 by the authors. Licensee MDPI, Basel, Switzerland. This article is an open access article distributed under the terms and conditions of the Creative Commons Attribution (CC BY) license (https://creativecommons.org/licenses/by/4.0/).