4.1. Project Overview
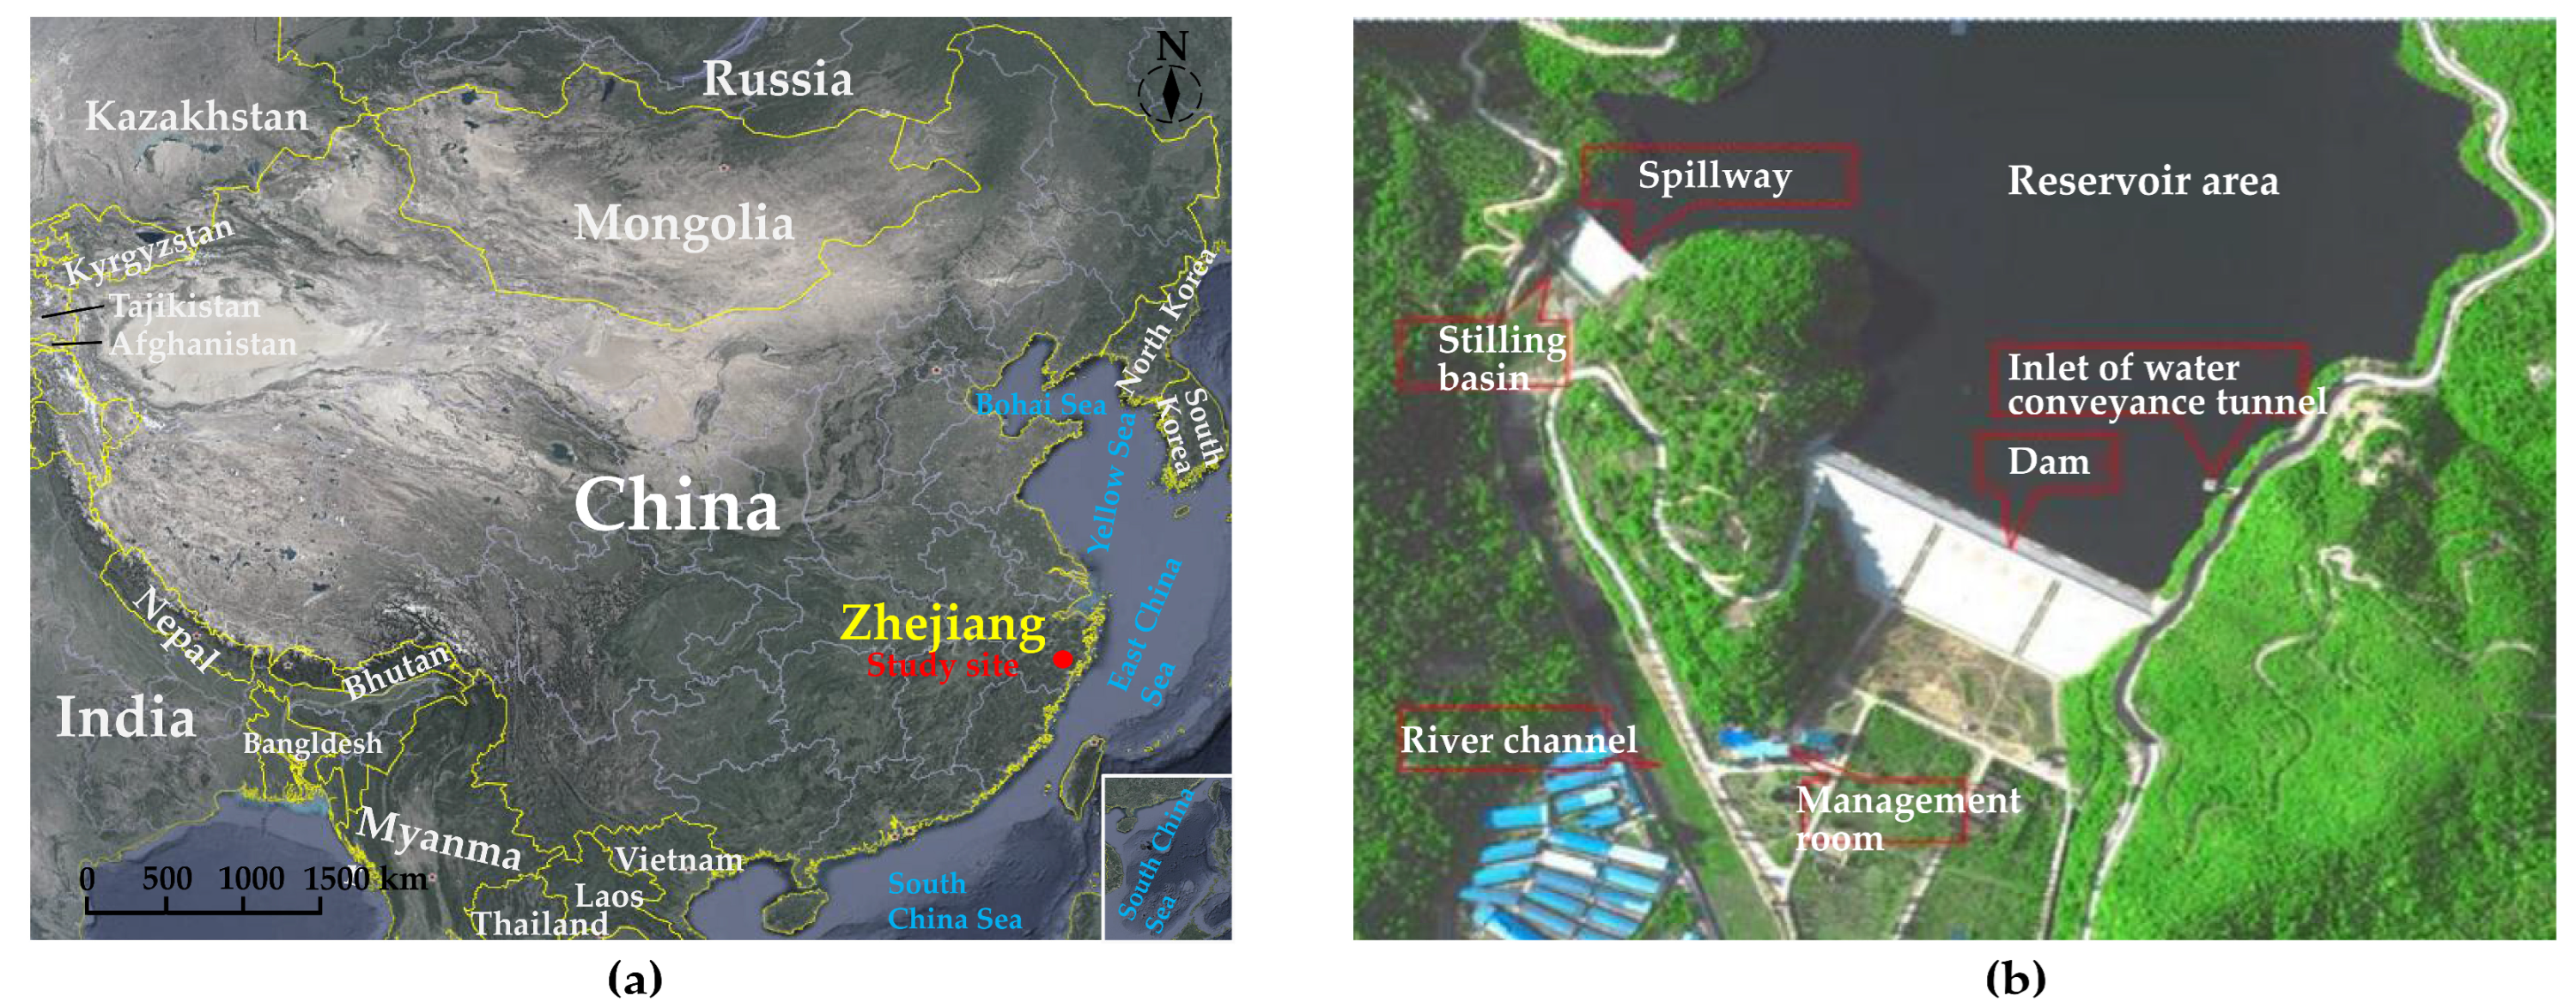
To investigate the leaching behavior of concrete cutoff walls in earth-rock dams, the Liyang Reservoir, located in Ningbo City, Zhejiang Province, China, was selected as a case study (
Figure 6a). The reservoir, primarily designed for water supply and flood control, integrating various uses such as irrigation. Its main structure comprises the dam body, spillway, and water conveyance tunnels (
Figure 6b). Due to the varied requirements of different sections, the main project of the reservoir is categorized as Class III. Among these, the spillway, water conveyance tunnels, and other components of the dam body are classified as Level 3, while the downstream river channel and the roads surrounding the reservoir are classified as Level 4. Phase I construction of the dam, completed in 1979, utilized a clay core wall with a dam crest elevation of 42.0 m. However, permeable pathways within the dam body and foundation due to the dispersive nature and poor compaction of the clay core used in the Phase I construction, leading to a higher permeability coefficient for the anti-seepage structure. Consequently, the local government launched a reservoir continuation and reinforcement project in 2004, incorporating a plastic concrete cutoff wall for reinforcement based on the Phase I structure.
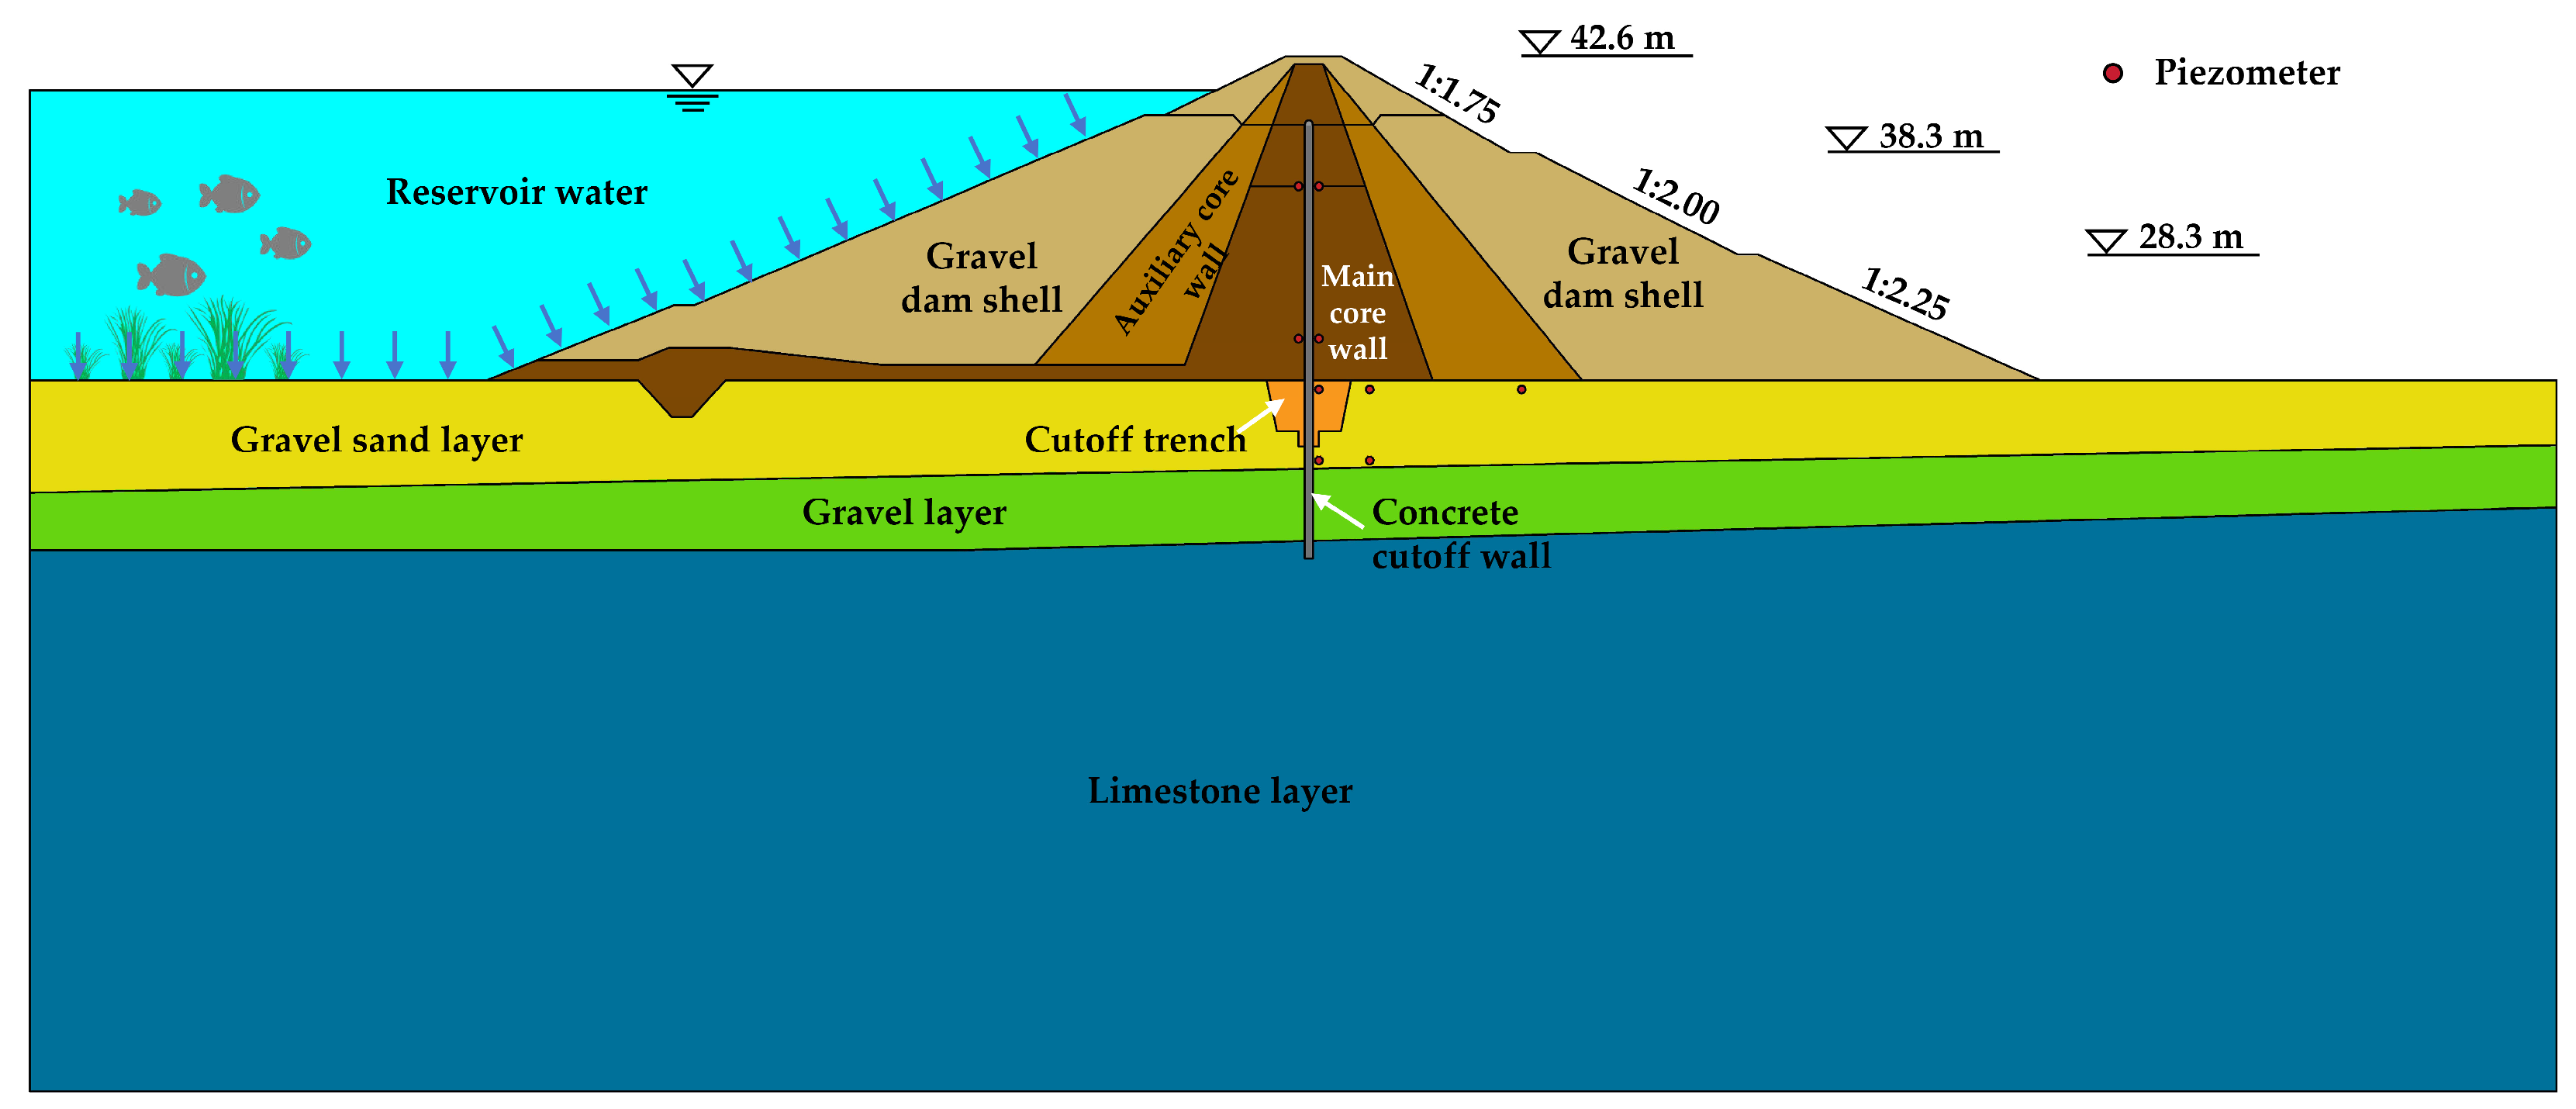
The reinforced concrete cutoff wall’s axis coincides with the crest axis of the Phase I construction and has a thickness of 0.8 m. The upper end of the anti-seepage wall is buried at an elevation of 41.5 m, and the lower portion of the concrete cutoff wall extends 0.6 m into the dam foundation’s weakly weathered layer. Additionally, the anti-seepage wall has a maximum depth of 60.85 m. A clay core wall is used for dam heightening and anti-seepage reinforcement. After the concrete cutoff wall has been built, clay core material is directly placed on its top surface to raise the dam height by 5.80 m. The Phase II reinforcement project of the dam was completed in 2008, resulting in an elevated crest elevation of 47.80 m. The dam crest is 5 m wide, its overall length is 266 m, and the maximum dam height is 31.9 m, classifying it as a medium-sized dam.
The upstream slopes of the dam are protected by dry masonry with a thickness of 30 cm. Roads, 2.0 m wide, are located at elevations of 42.6 m and 23.4 m on the upstream dam slope. Therefore, the upstream dam slope can be divided into three levels, with slope ratios of 1:1.8 (i.e., above 42.6 m elevation), 1:2.25 (i.e., between 42.6 m and 23.4 m elevation), and 1:2.5 (i.e., below 23.4 m elevation). The downstream dam slope likewise employs dry masonry with the same thickness as the upstream dam slope, and its slope ratios are also categorized into three levels. The downstream dam slope has a slope ratios of 1:1.75 (i.e., above the elevation of 38.3 m), 1:2.0 (i.e., between 38.3 m and 28.3 m elevation), and 1:2.25 (i.e., below the elevation of 28.3 m). After the reinforcement construction, the reservoir’s dead water level, normal storage level, design flood level, and checked flood level are 23.50 m, 44.50 m, 45.86 m, and 46.81 m, respectively. The corresponding reservoir capacities are approximately 300,000 m
3, 11.02 million m
3, 12.38 million m
3, and 13.28 million m
3.
Figure 7 depicts a typical cross-section of the Liyang earth-rock dam.
4.3. Model Setup and Verification
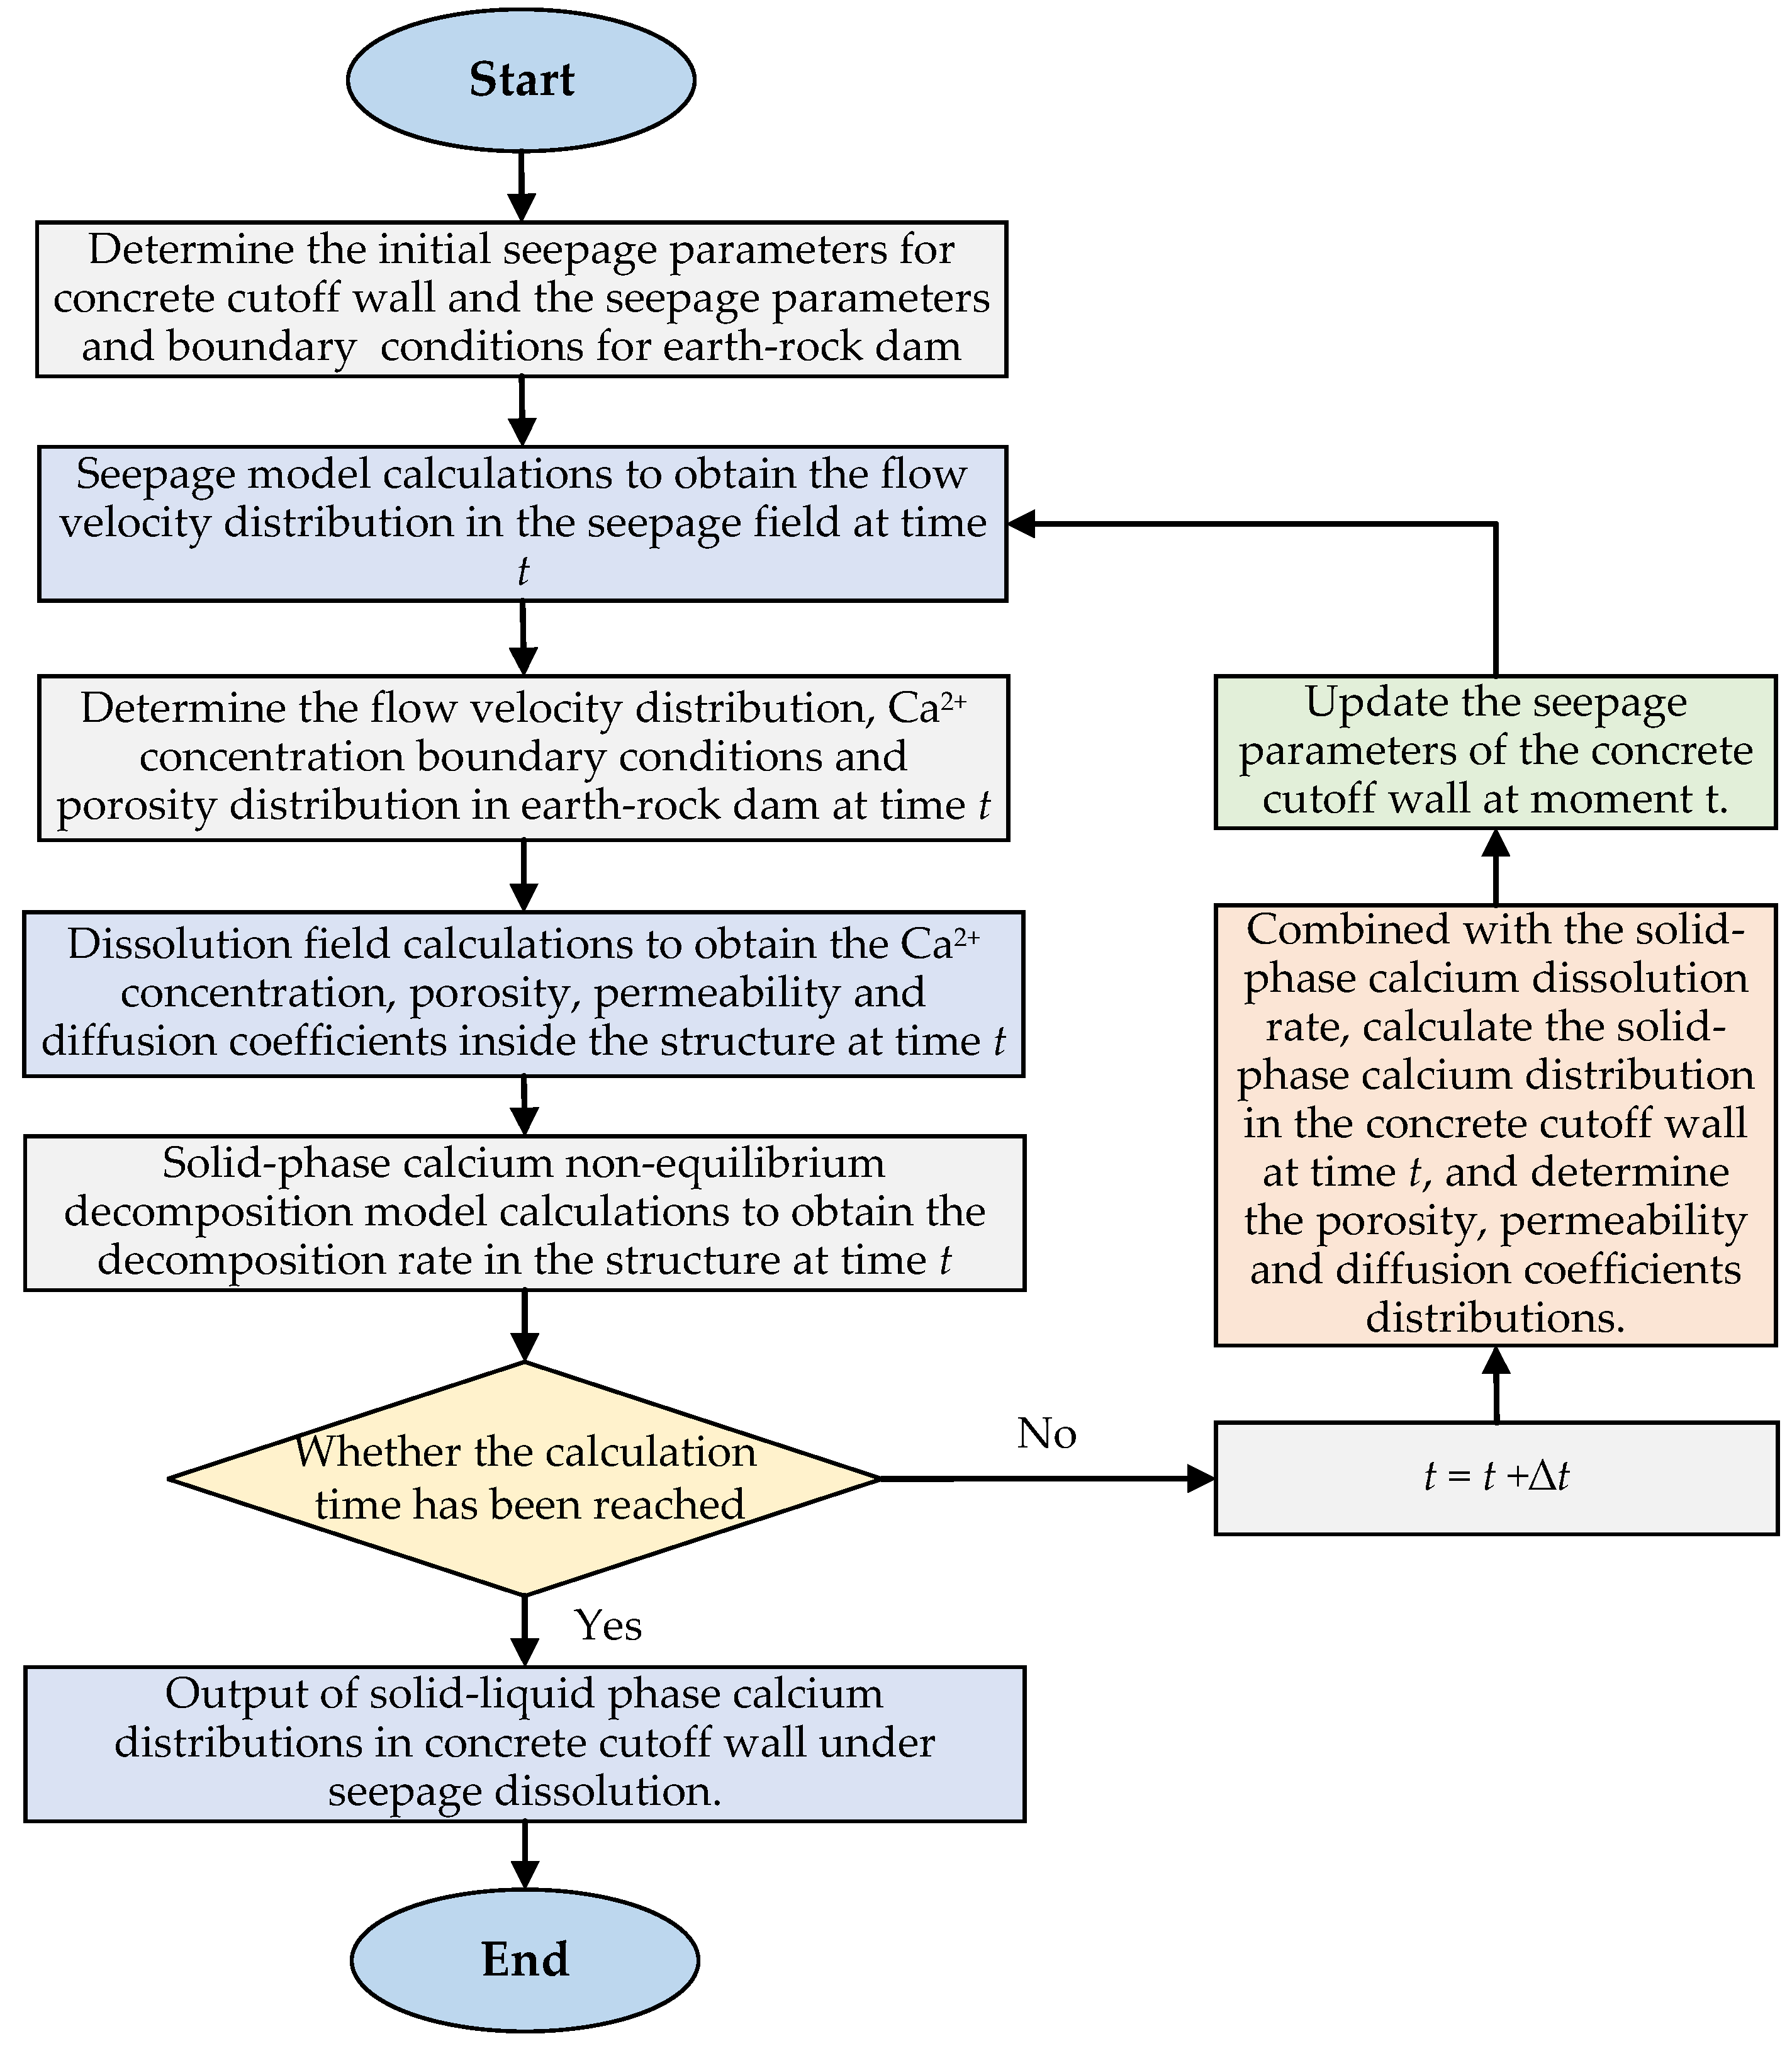
Based on the Liyang Reservoir Dam’s topographical and geological data, as well as the aforementioned proposed method, a numerical model considering the seepage and dissolution coupling effect of the anti-seepage wall at the dam’s typical cross-section is established.
Table 5 shows the computational parameters of the model, which are collected from laboratory and field tests, as well as engineering design data.
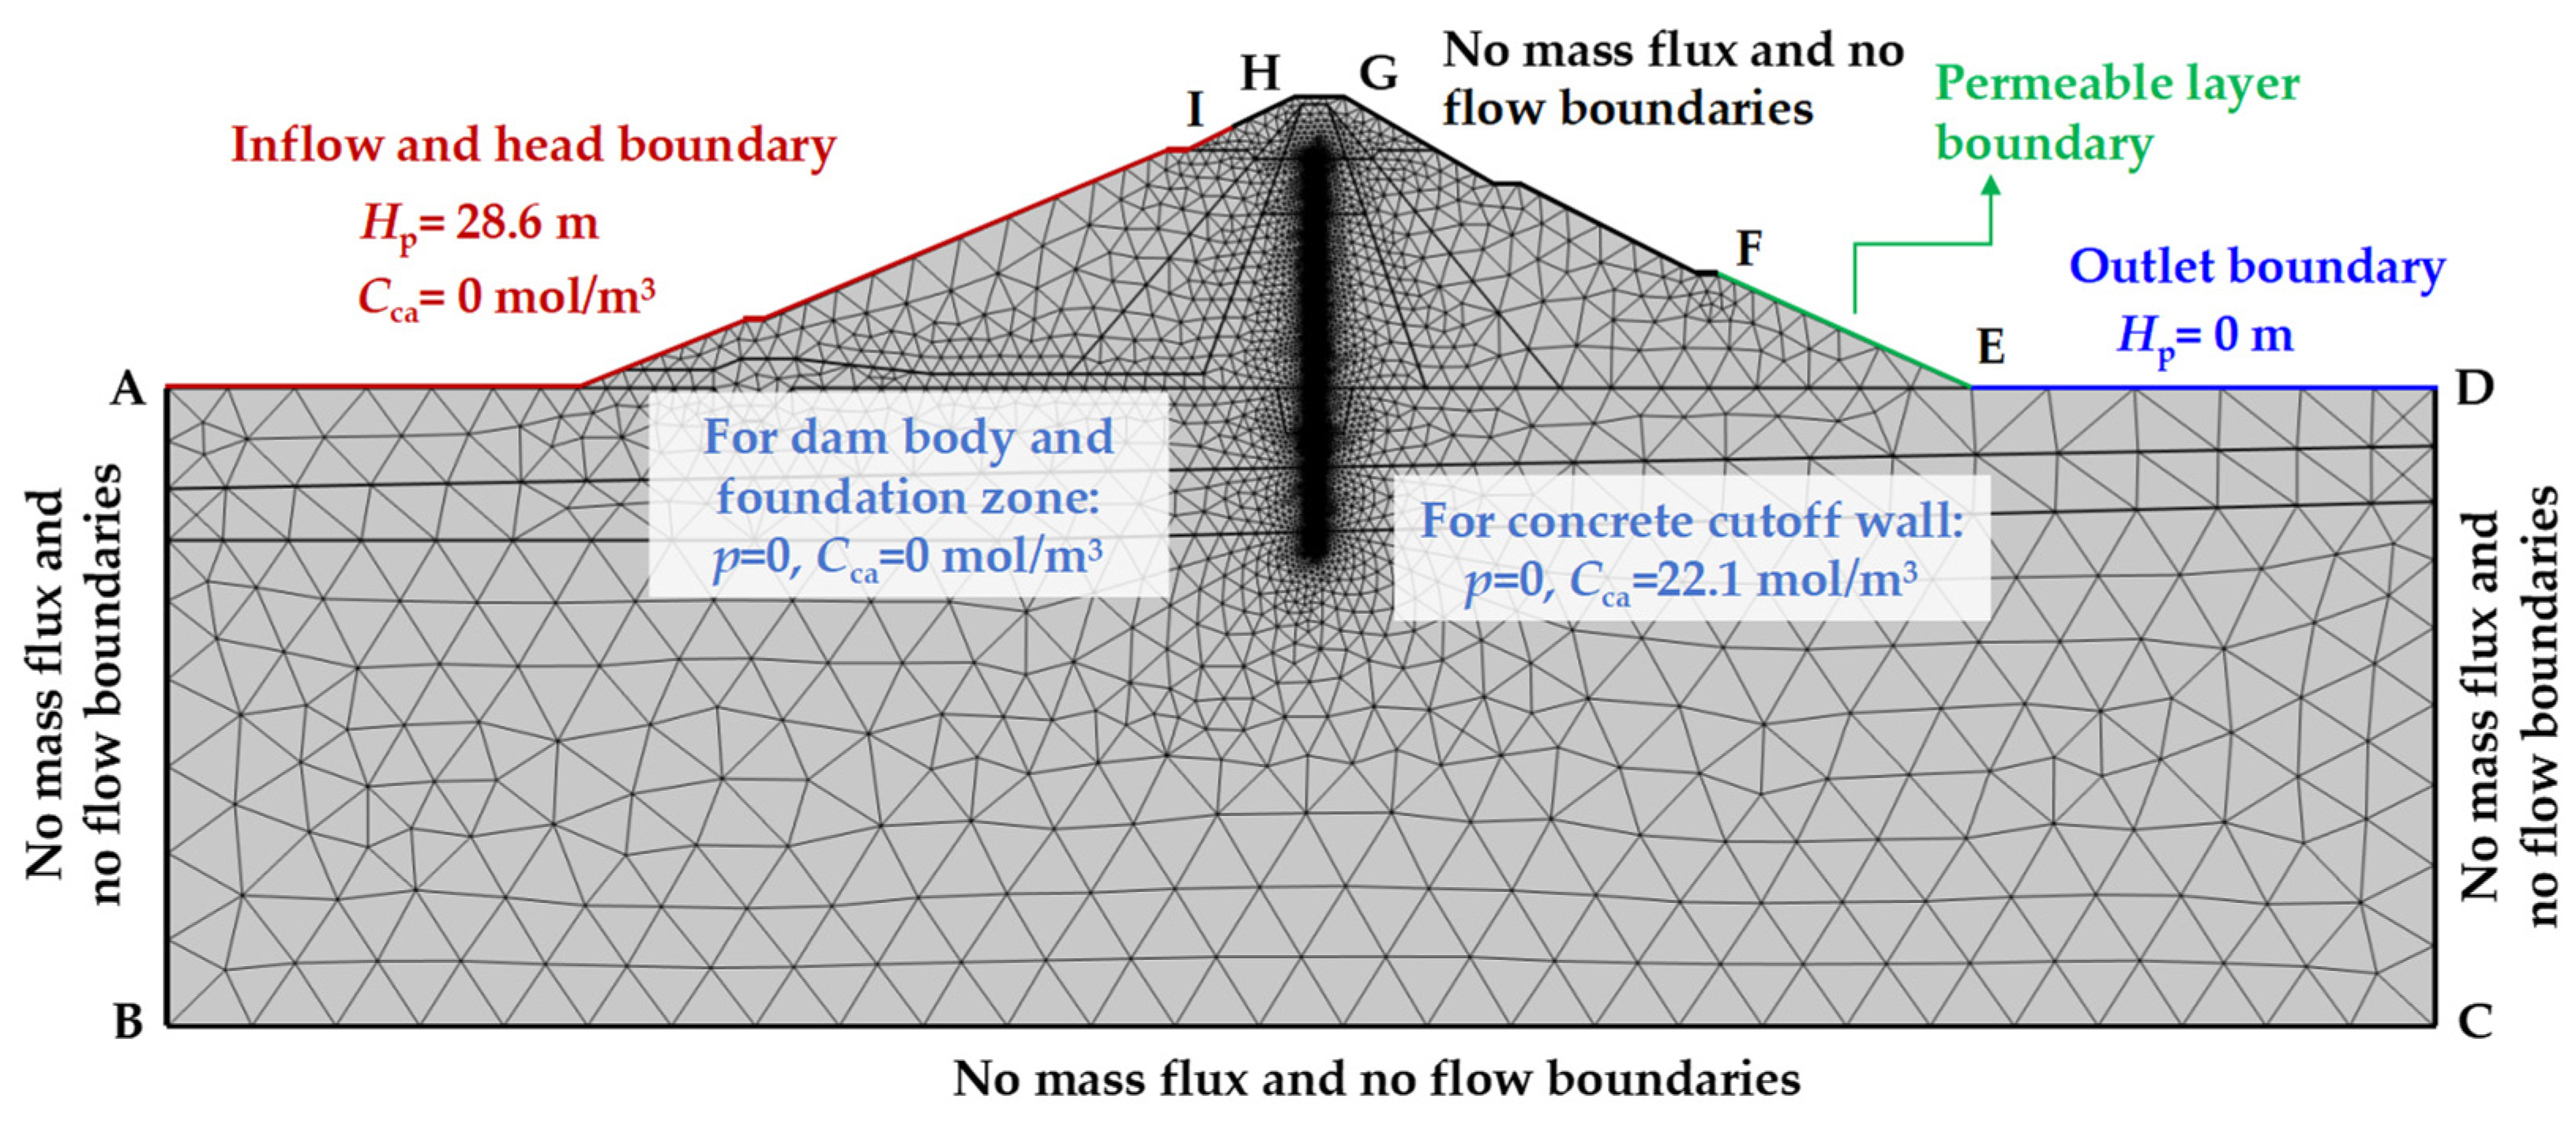
The established computational model’s boundary numbering and meshing are shown in
Figure 9. The boundary under the water level (AI) was designated as the head boundary for seepage field. This boundary can be a constant head or variable head, depending on the actual monitoring data. Permeable layer boundaries, a kind of hybrid boundary, were used to establish the EF boundary at the downstream slope [
54]. All other boundaries were designated as no flow boundaries, and the seepage field’s initial conditions were set to zero pressure. The upstream reservoir water’s calcium ion concentration is taken to be 0 mol/m
3 for the dissolution field, with the upstream boundary (i.e., AI) serving as the inflow boundary. The remaining boundaries were set to no mass boundaries except for the DE boundary, which was defined as the outlet boundary. The computation zone’s remaining concentration is set at 0 mol/m
3, with the initial calcium ion concentration of the anti-seepage wall considered to be saturation concentration (i.e.,
Cca = 22.1 mol/m
3). A triangular mesh was employed to discretize the computation zone. This resulted in 88,697 domain cells and 2761 boundary cells. It should be mentioned, as
Figure 9 illustrates, that the anti-seepage wall’s mesh was refined to guarantee computation correctness.
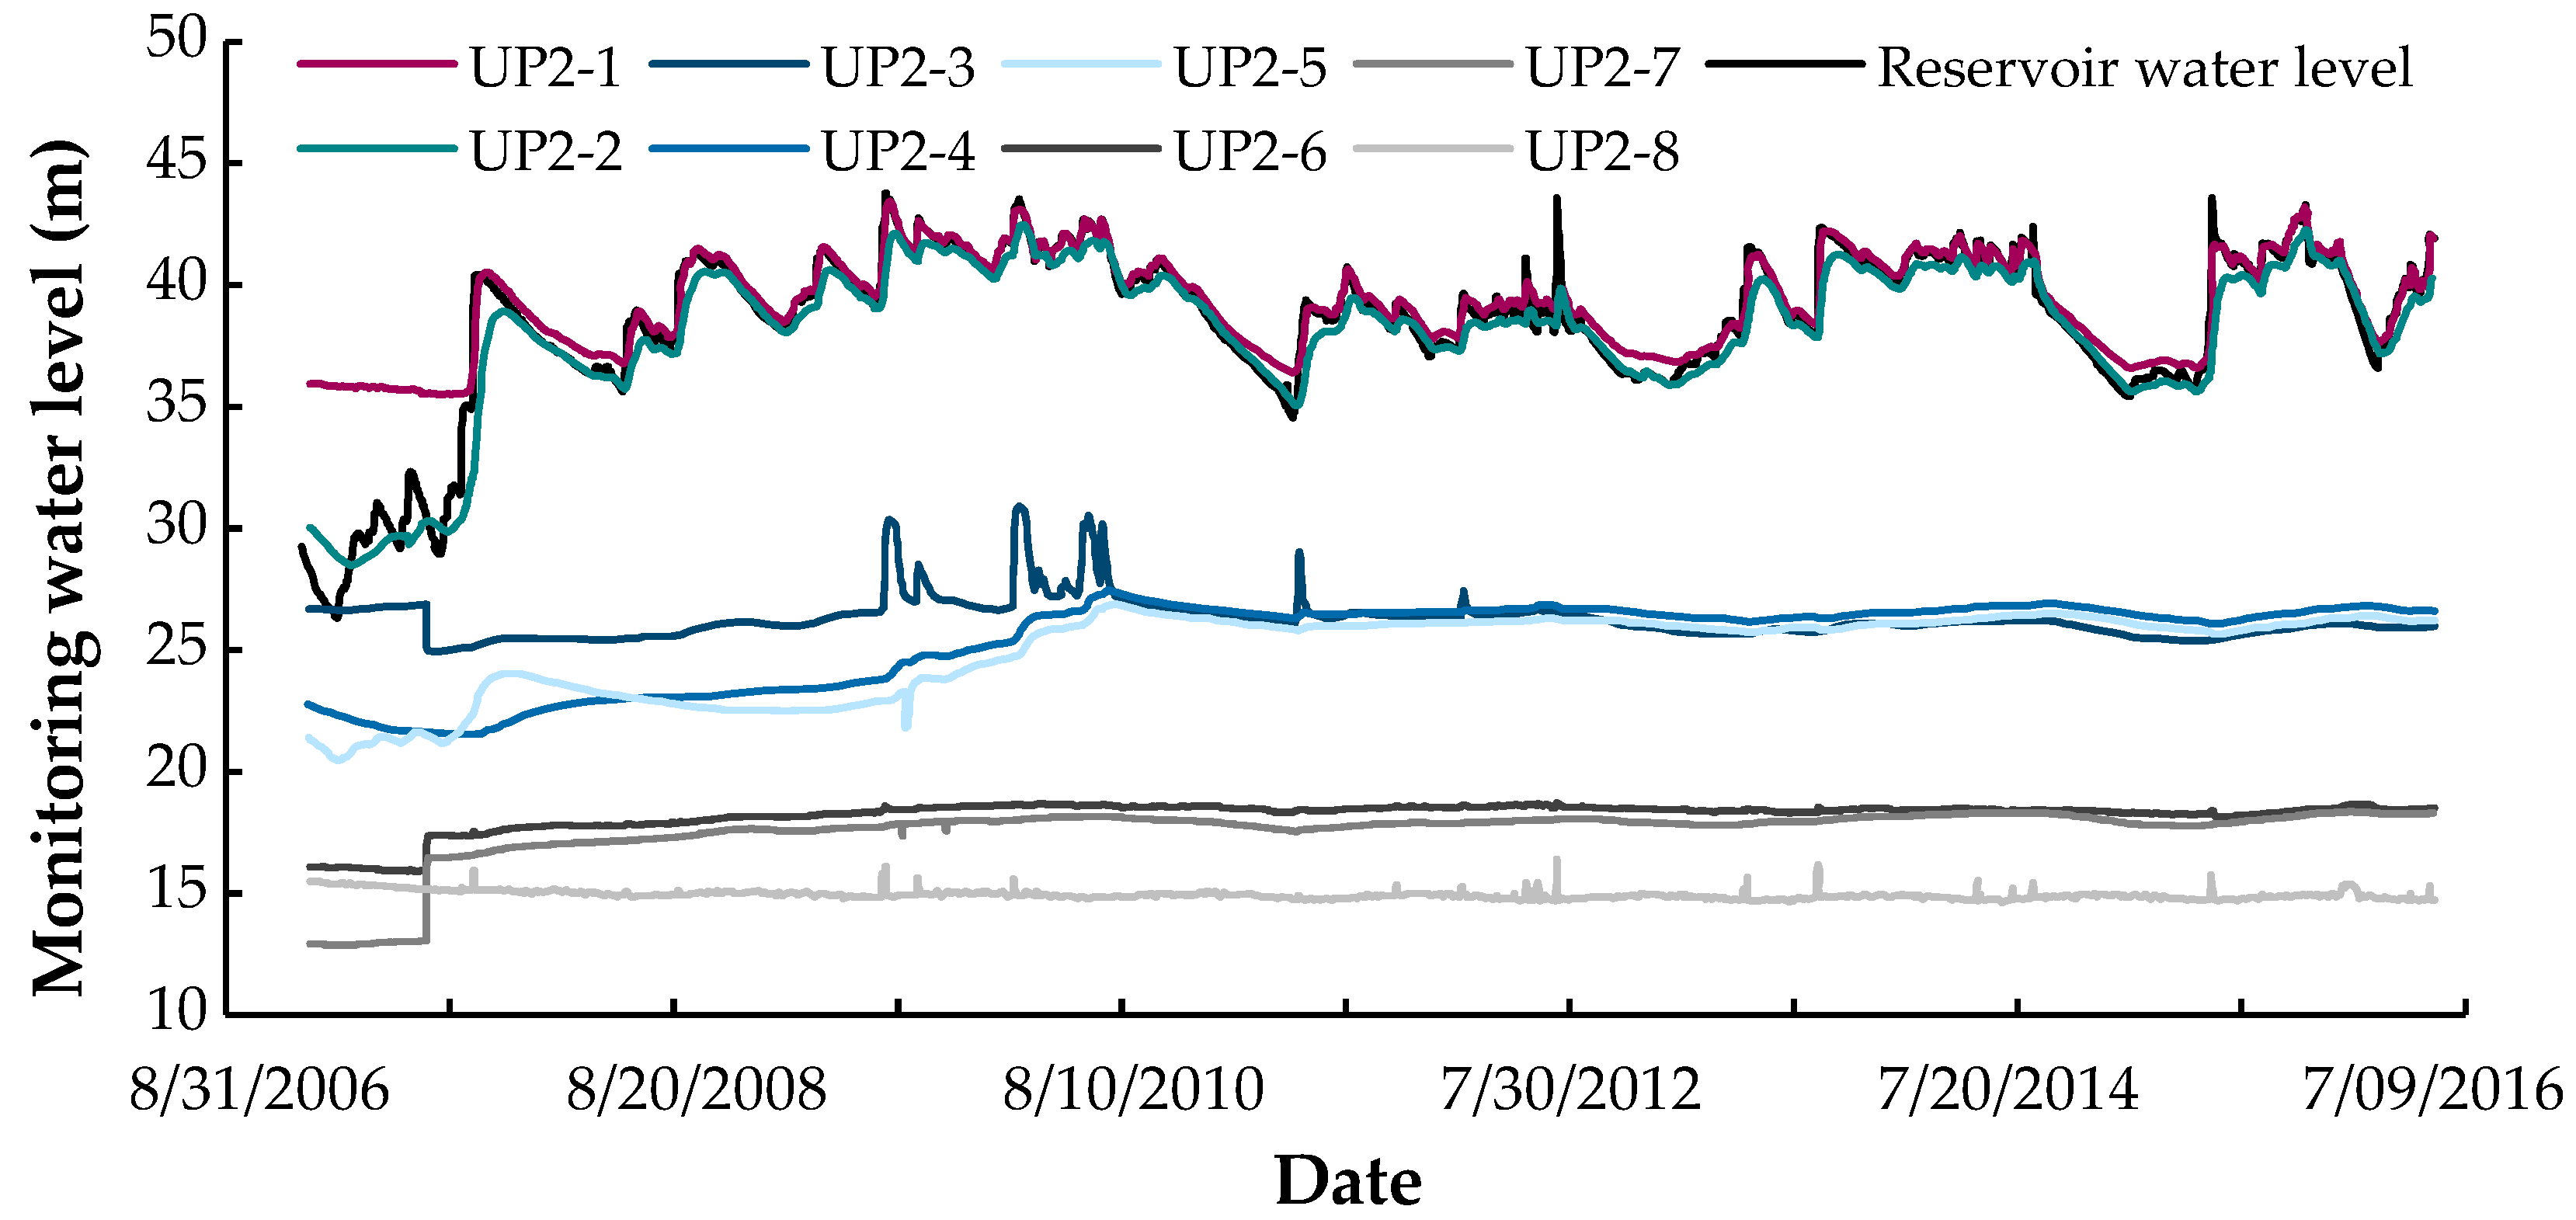
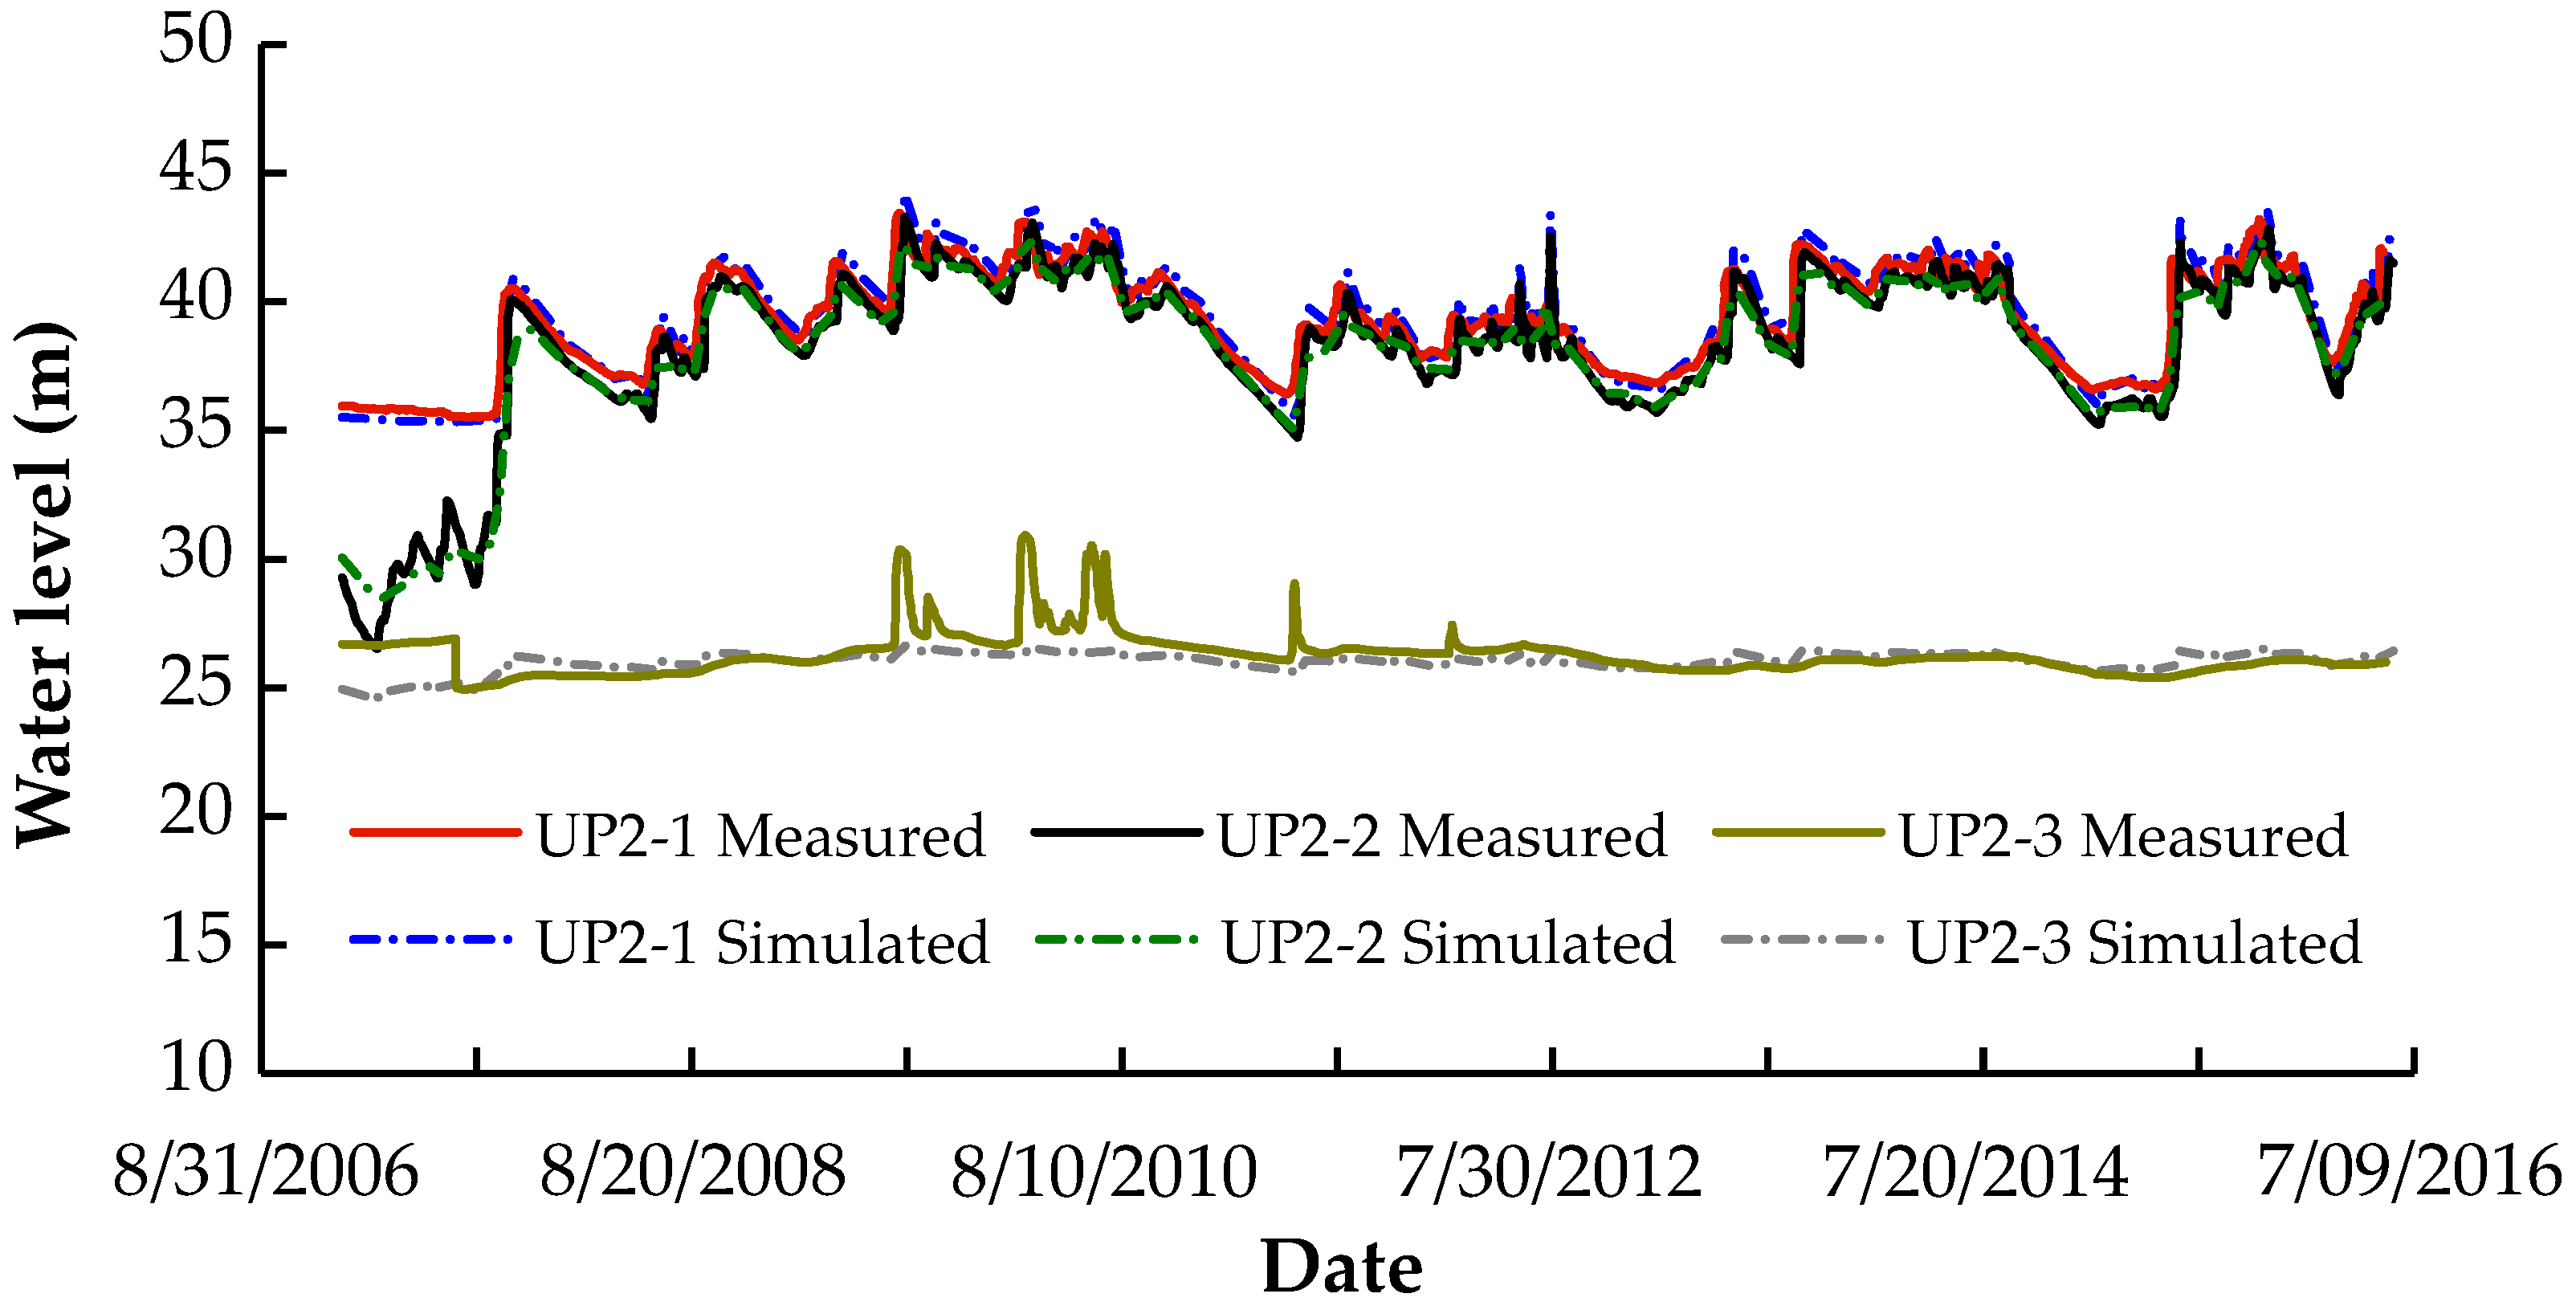
According to the established numerical model, the temporal variation data of reservoir water levels shown in
Figure 8 are used as the upstream water level boundary for simulating the operation of the reservoir. By setting piezometers into the numerical model, simulated water level changes at various monitoring points are obtained. Subsequently, the simulated water level variations are compared with the actual measurements in
Figure 8 to further validate the reasonableness of the model. A comparison of the measured and simulated water levels at various monitoring points is shown in
Figure 10. Due to the relatively low correlation between water levels at monitoring points UP2-4 to UP2-8 and changes in reservoir water levels, they are considered anomalous monitoring points and therefore are excluded from the validation process. As shown in
Figure 10, it is evident that the water level variations simulated by the suggested approach is mostly in line with the findings of the measurements. This result further demonstrates the effectiveness of the proposed model, indicating its suitability for analyzing the seepage dissolution evolution process of the concrete cutoff walls of earth-rock dams.
4.4. Seepage and Dissolution of Concrete Cutoff Wall
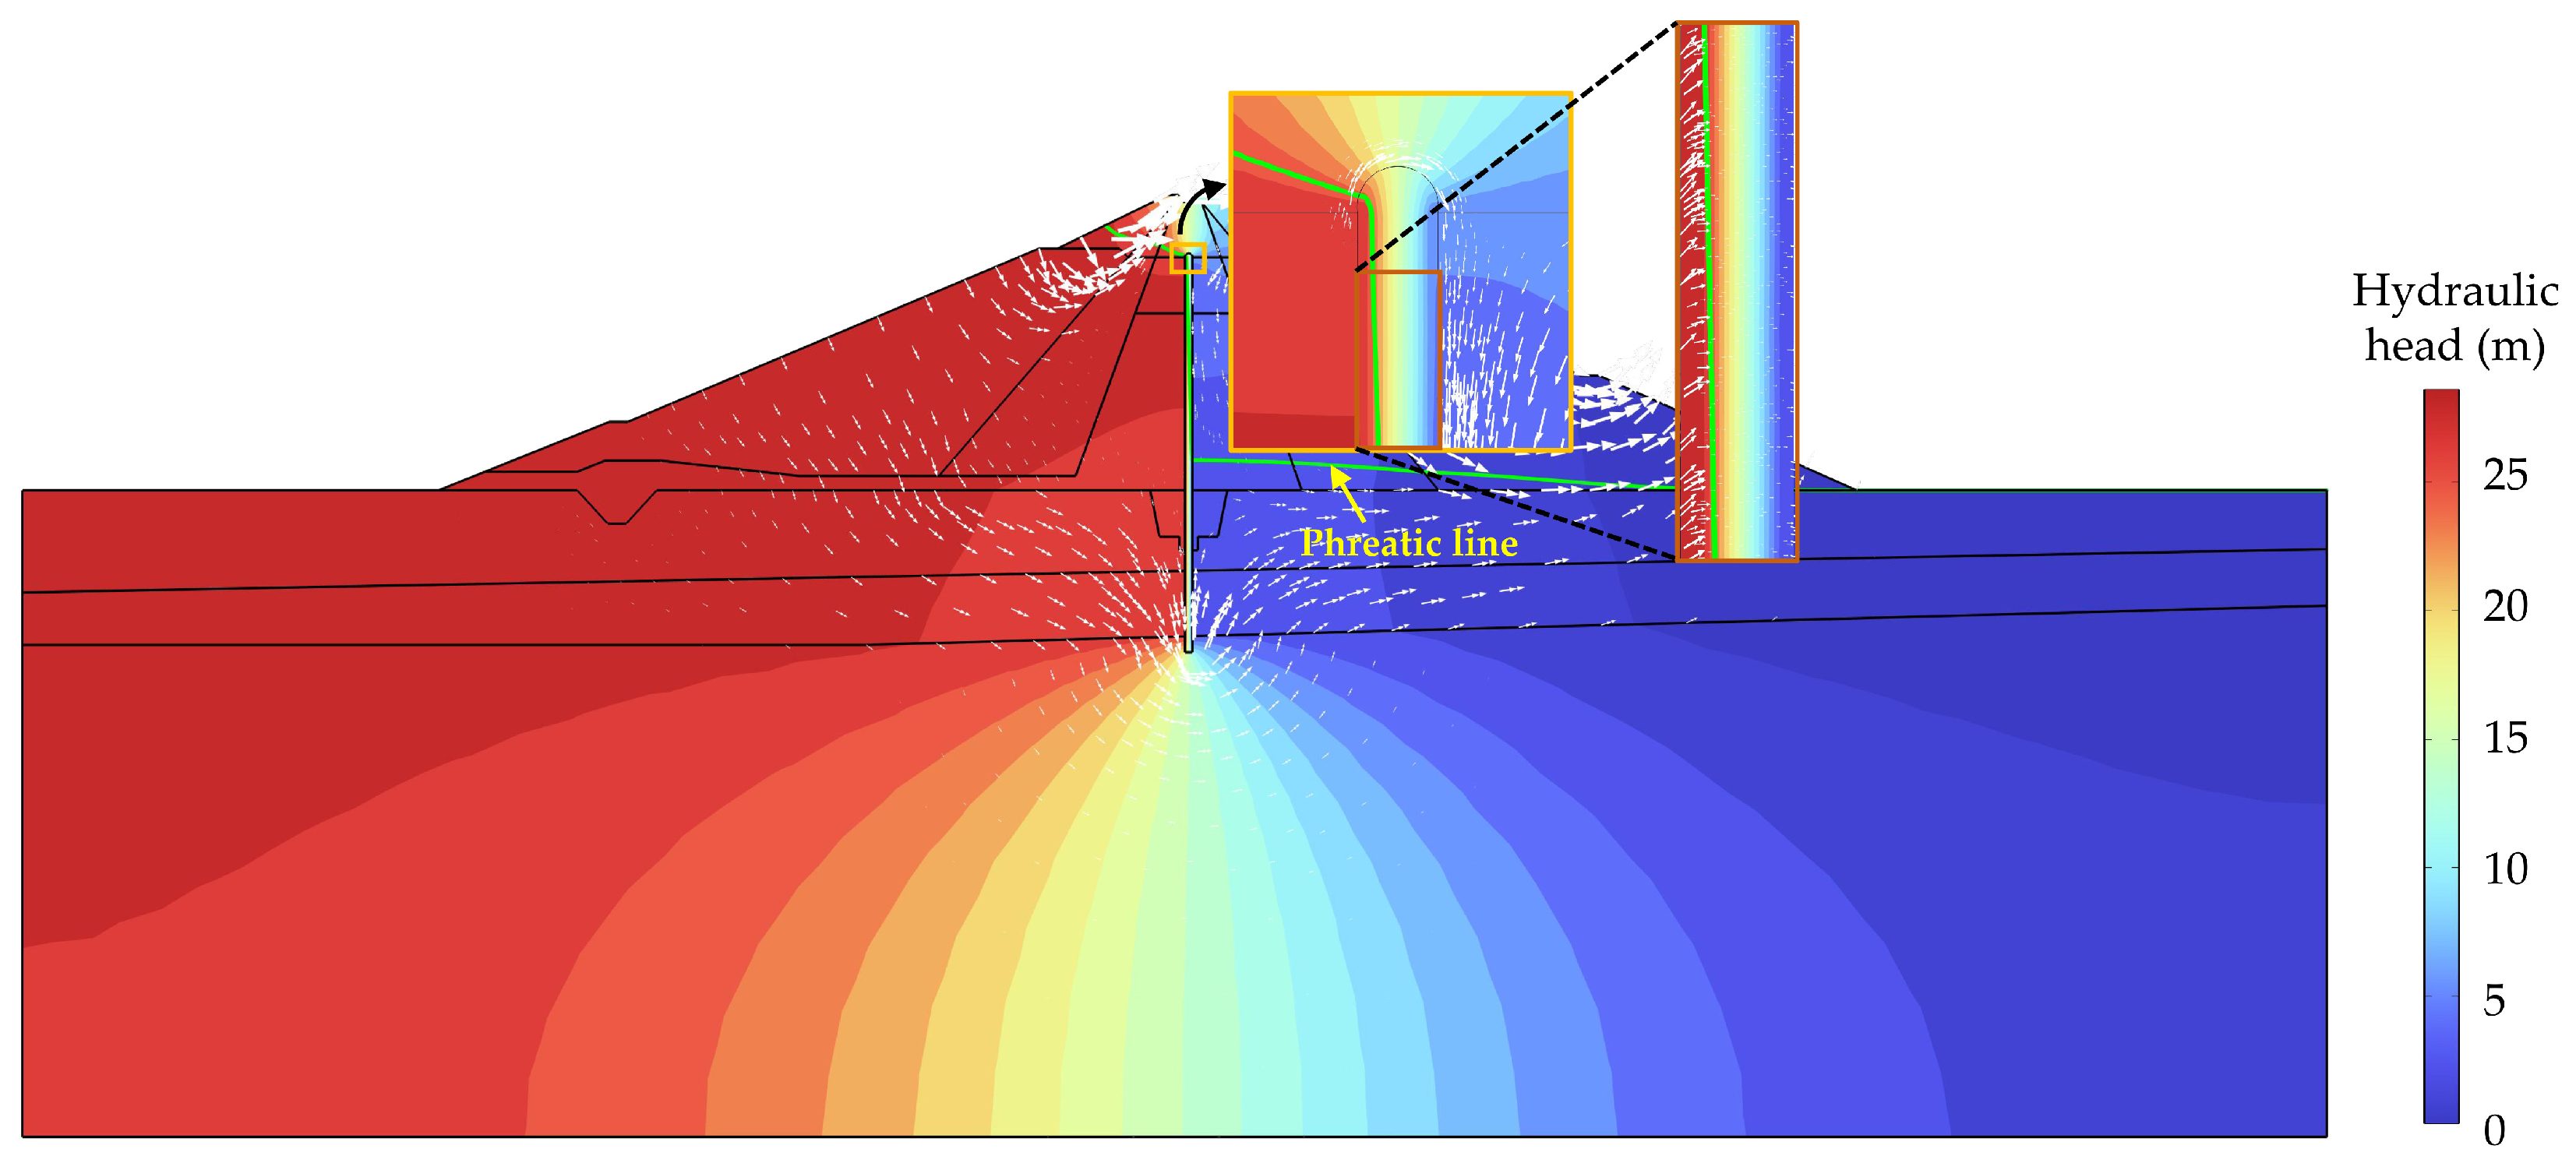
Figure 11 presents the seepage field after the completion of the Phase II reinforcement project, following the initial filling of the dam to its normal water level. The contour map of hydraulic head distribution reveals that the hydraulic head is approximately 27.81 m on the upstream side of the anti-seepage wall, significantly higher than that on its downstream side, which is only about 3.97 m. This indicates that the reinforced concrete cutoff wall has reduced the hydraulic head by 23.84 m, achieving an 85.72% reduction rate. Furthermore, the variation in the phreatic line within the dam body shows a distinct abrupt change (i.e., a sharp drop) at the location of the anti-seepage wall, indicating its effective impermeability within the dam foundation and body. The impermeable qualities of the concrete cutoff wall and the clay core wall result in a significant differential in hydraulic head between their upstream and downstream sides, creating a driving force for seepage within the dam foundation and body.
The direction of the water flow is shown by the white arrows in
Figure 11, which are sized according to the flow velocity. It can be observed that there is a significant bypass seepage phenomenon occurring at the top and bottom of the anti-seepage wall, resulting in relatively higher flow velocities at the bottom of the anti-seepage wall. In contrast, the flow velocity at the top of the concrete cutoff wall is notably lower, mainly due to its location within the lower-permeability clay core wall, which impedes most of the water flow.
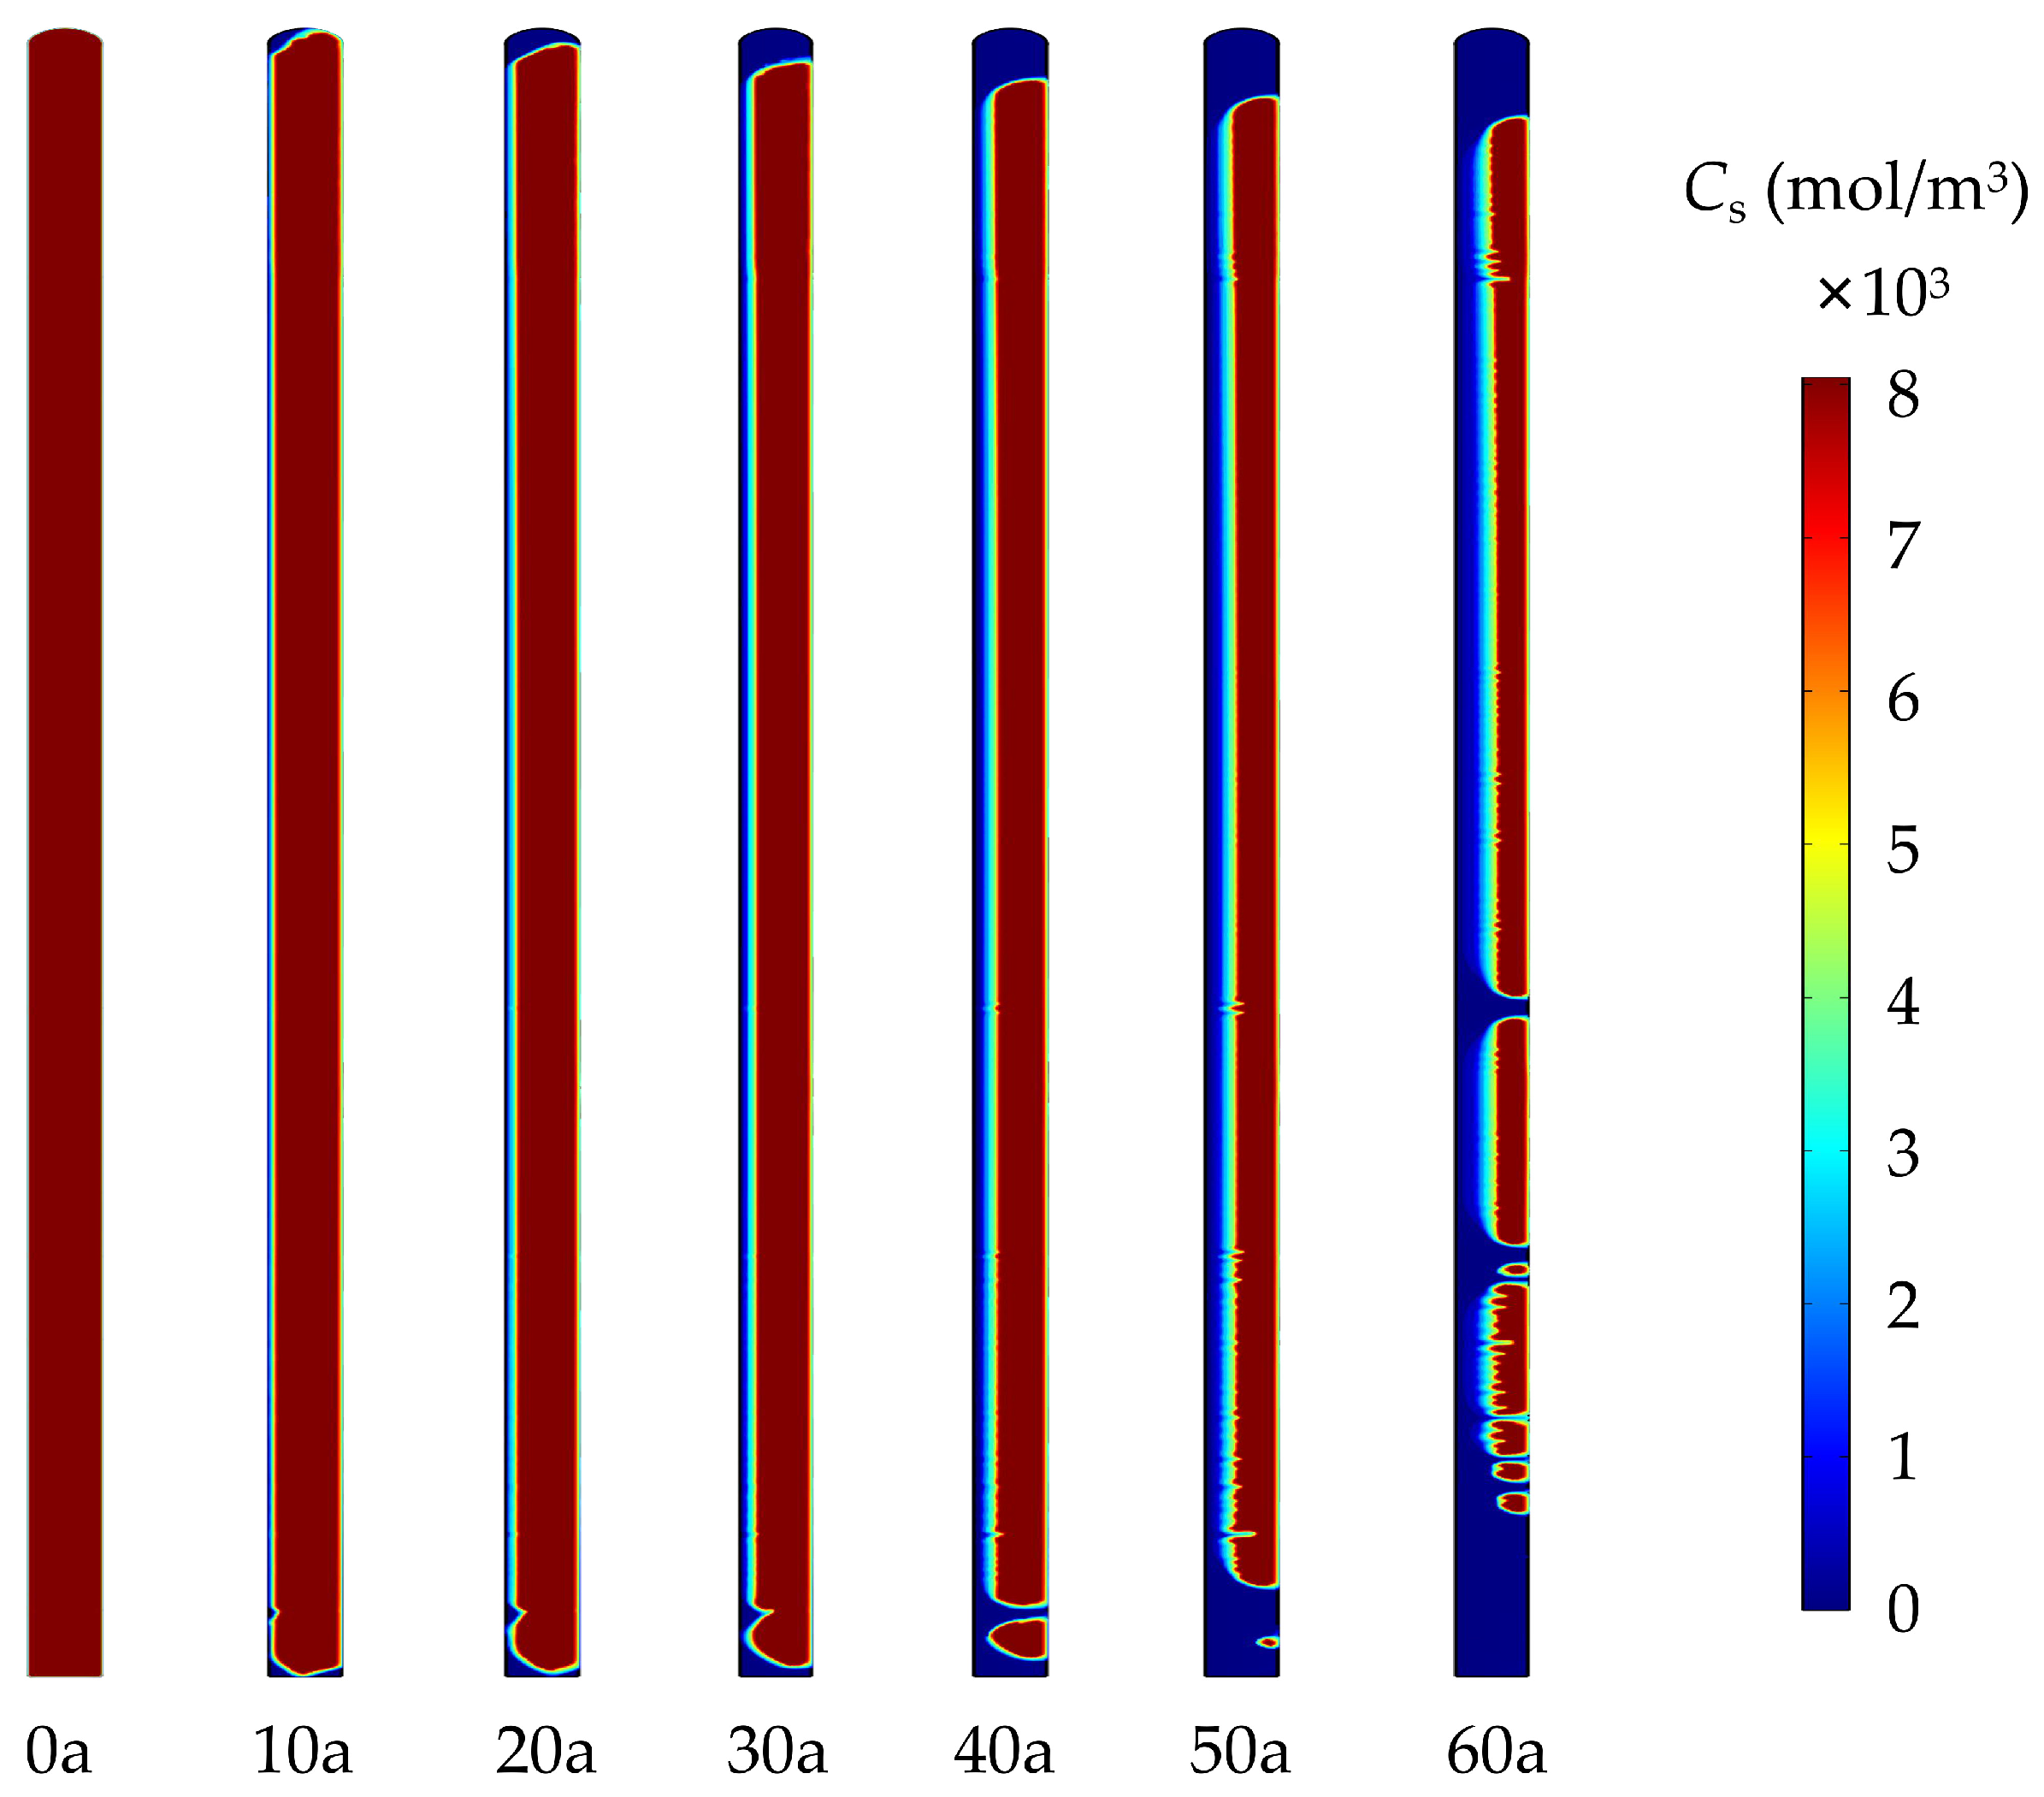
Figure 12 displays the spatial distribution of calcium within the wall during its service life. It is evident that the calcium leaching in the wall primarily occurs at the upstream water-facing surface, as well as its top and bottom sections, with the leached area gradually expanding with increasing years of service. In contrast, the downstream side of the wall exhibits negligible calcium leaching behavior, practically approaching insignificance.
For the upstream side of the anti-seepage wall, it experiences a relatively higher hydraulic head during its service life, creating a noticeable hydraulic head differential with the downstream face. Despite the obstruction of the majority of water flow within the dam foundation and body by the anti-seepage wall, the hydraulic gradient drives an inevitable internal flow within the concrete cutoff wall from upstream to downstream (
Figure 11). Due to the significantly higher flow velocity in the high hydraulic head region on the upstream face of the concrete cutoff wall compared to the low hydraulic head region on its downstream side, the leaching of calcium is accelerated in this region. Consequently, the upstream water-facing surface of the anti-seepage wall emerges as the primary area for calcium leaching. The dissolution at the top and bottom of the anti-seepage wall is predominantly induced by bypass seepage, as the flow velocity in these regions is notably higher than in other parts of the anti-seepage wall, resulting in relatively significant severe calcium leaching in these specific locations.
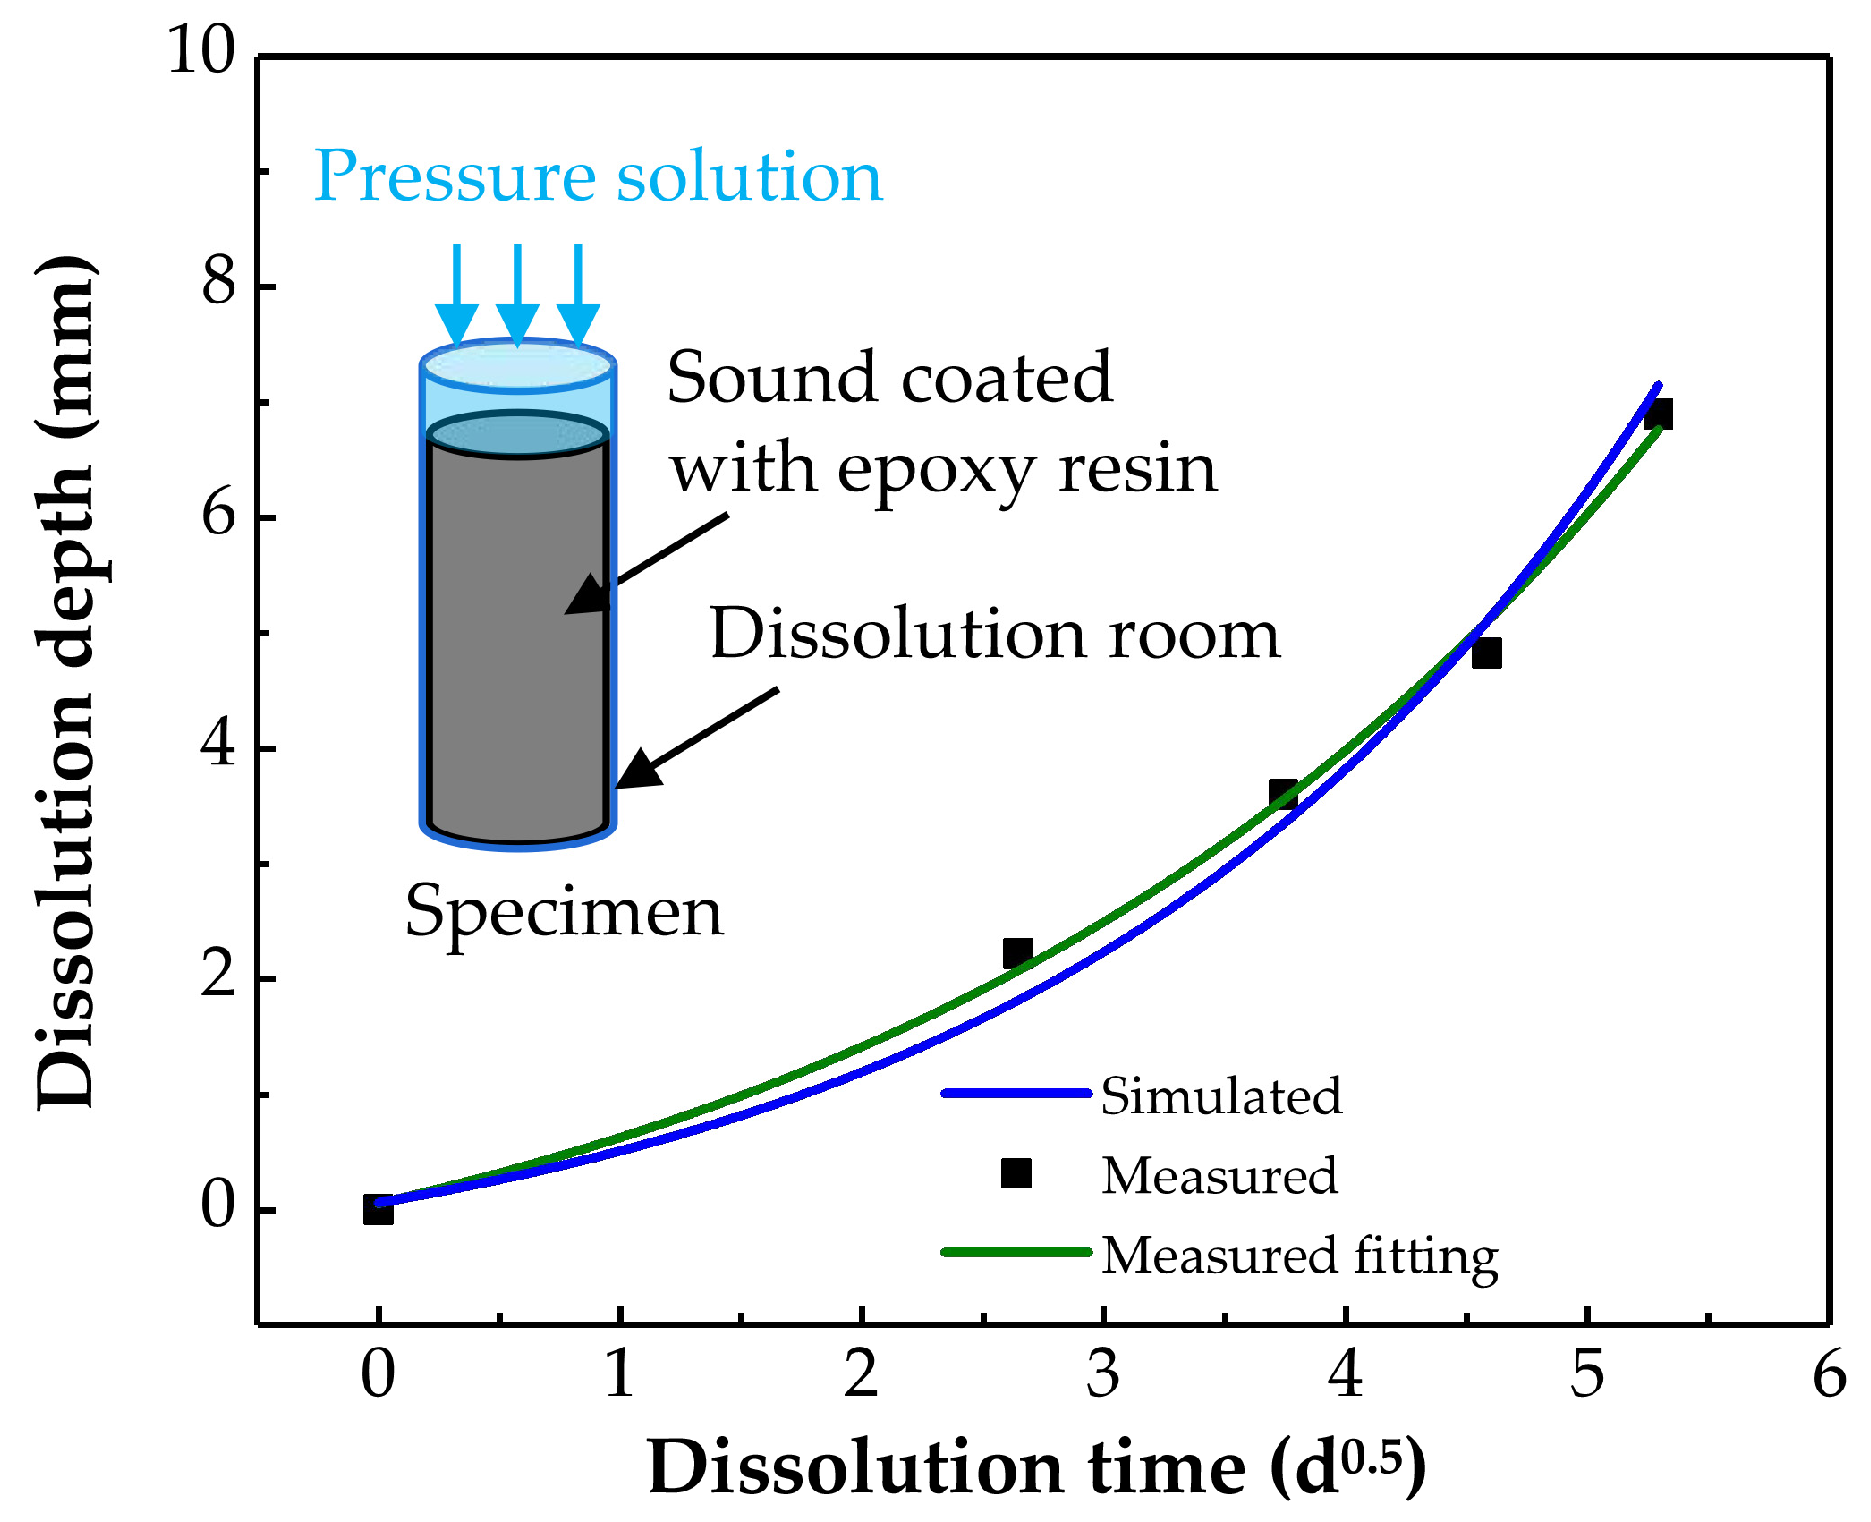
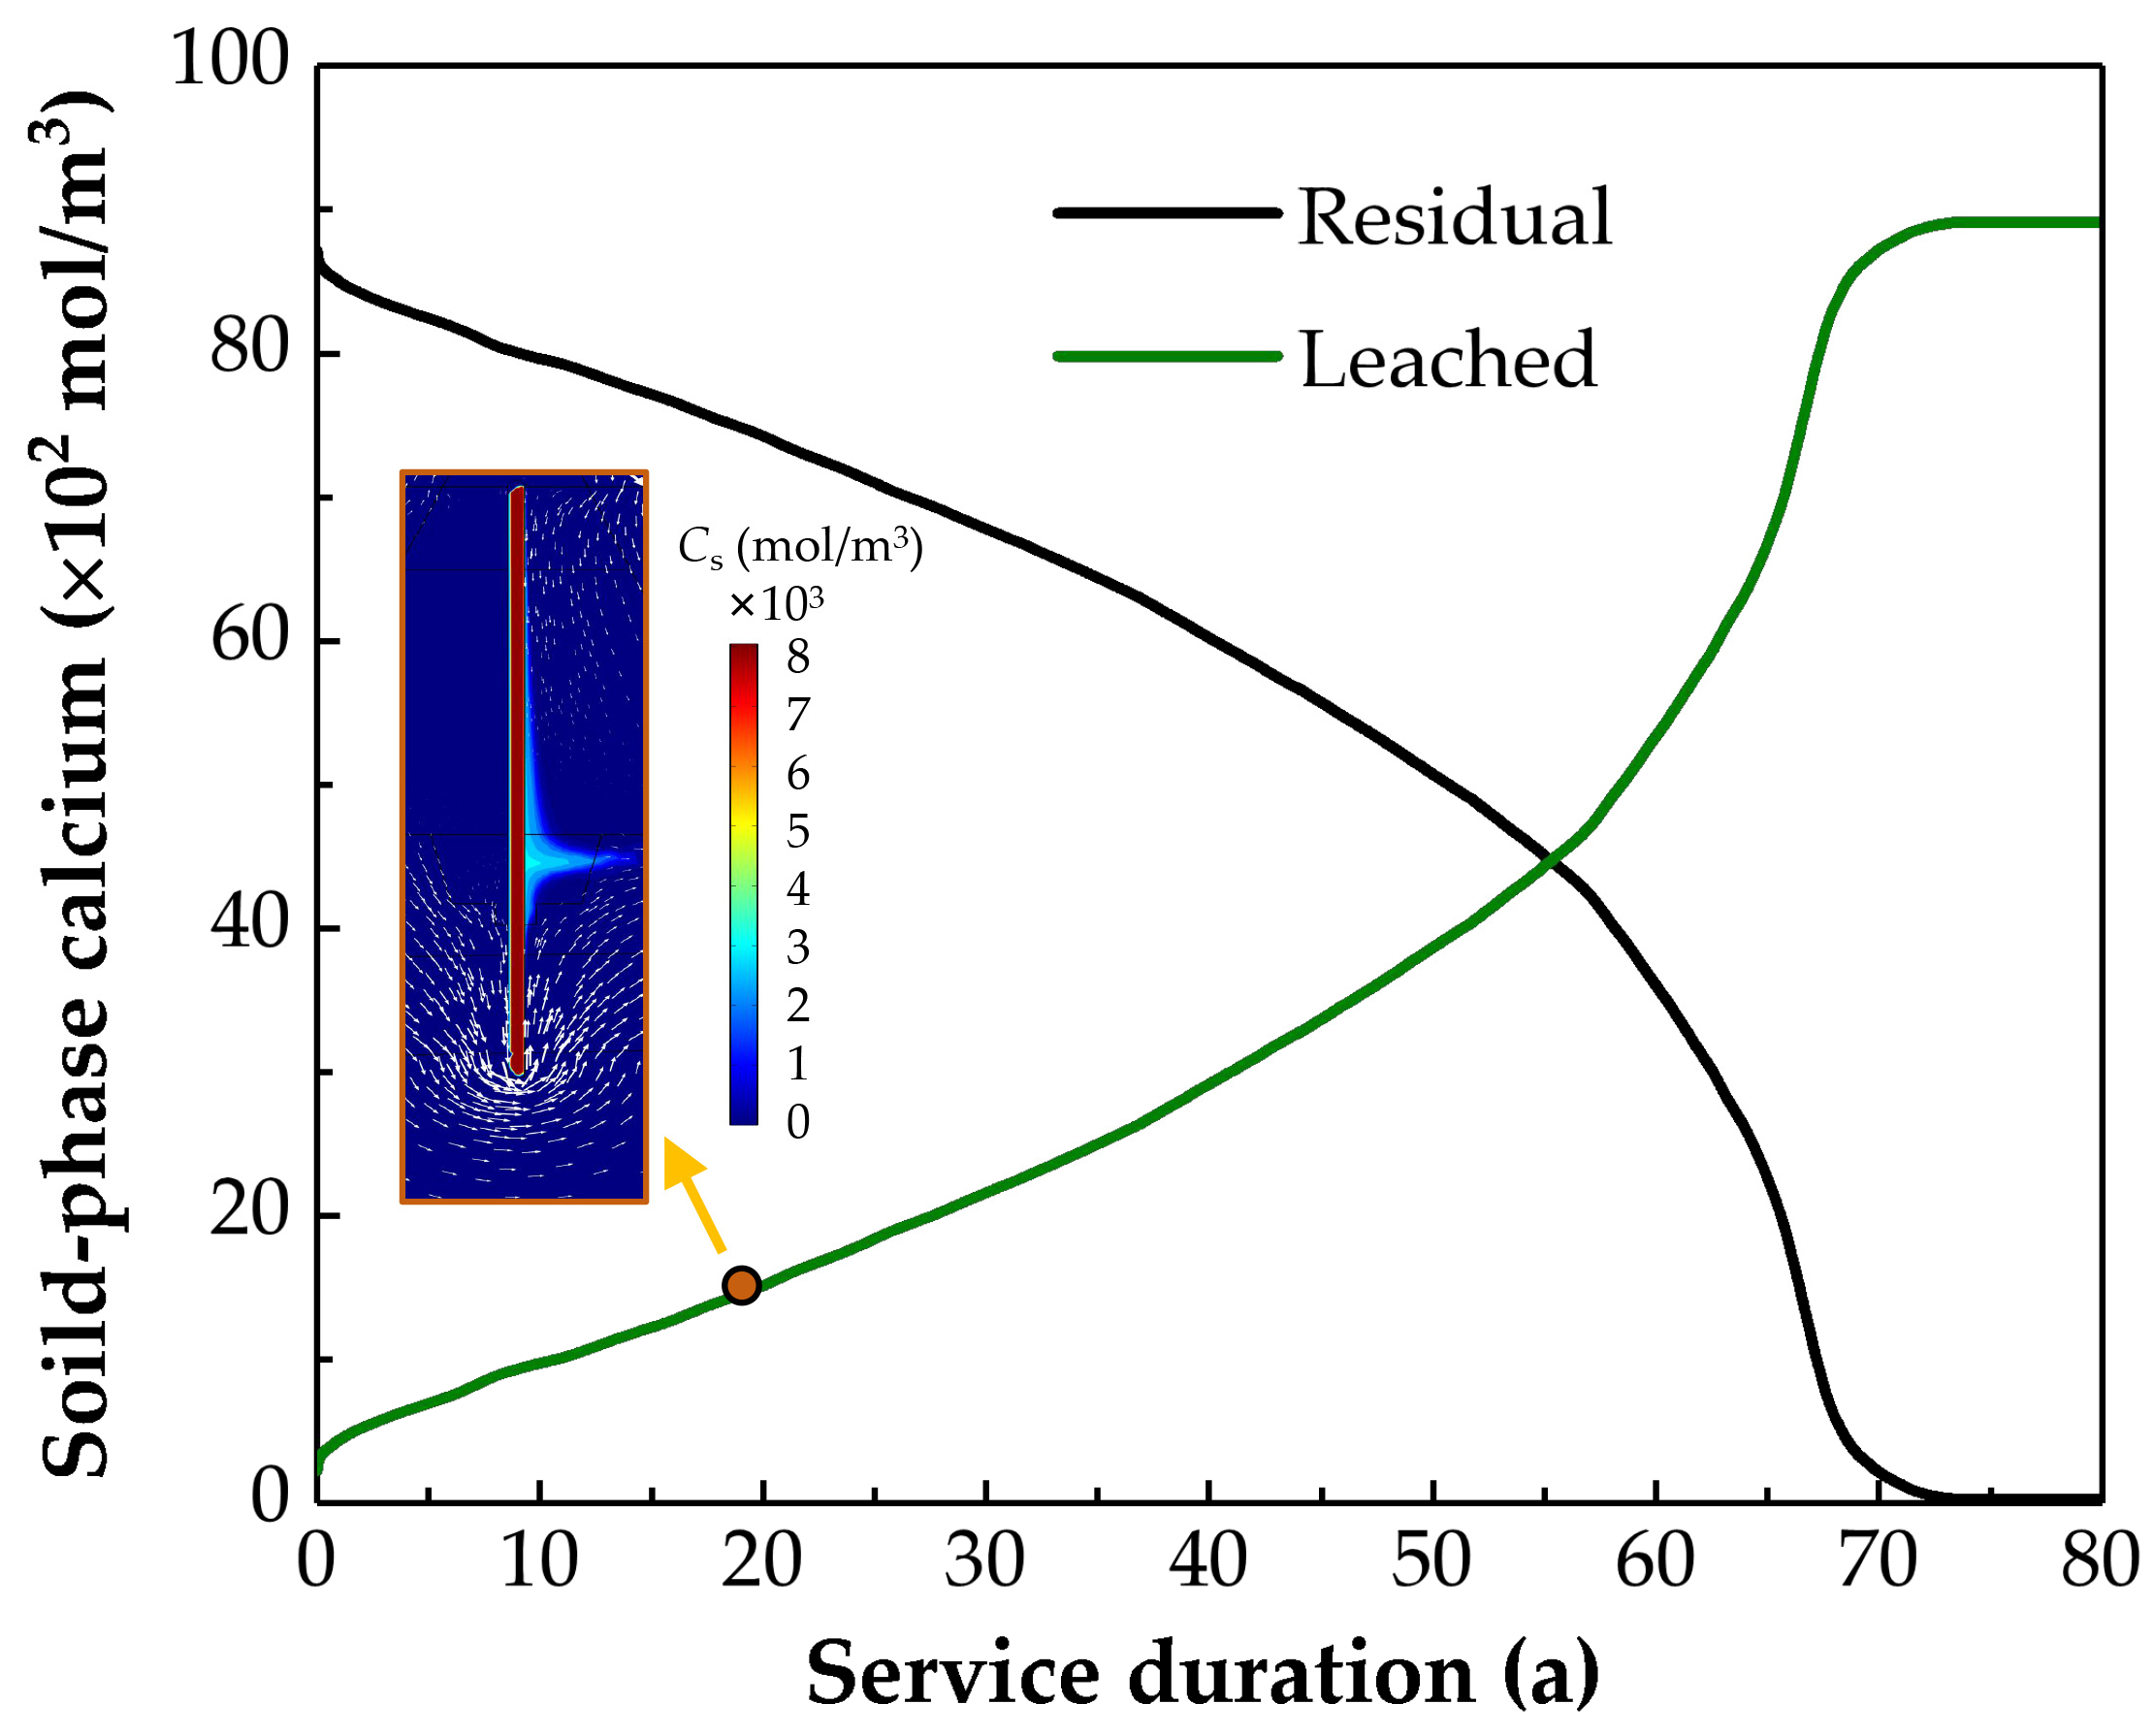
Figure 13 presents the changes in leached and residual calcium content during the service of the anti-seepage wall. It is evident that the calcium within the anti-seepage wall continuously leaches with the increase in years of service. Consequently, the amount of calcium that remains in the concrete cutoff wall steadily reduces. At approximately 73.5 years of service, the calcium within the anti-seepage wall undergoes complete dissolution. In the preceding 68 years of service, the leached calcium within the anti-seepage wall exhibits a trend of exponential growth concerning the service time, i.e., as the service time increases, the dissolution rate of calcium accelerates. Such behavior notably differs from the power–law relationship observed in traditional contact dissolution studies, where the dissolution rate of solid-phase calcium decreases gradually with time and eventually reaches a plateau [
12,
17]. The disparity primarily arises from the driving force for calcium leaching in contact dissolution, which is solely governed by concentration gradients. The calcium concentration in the external water environment progressively rises over the course of the dissolution time, which reduces the concentration difference between the ions in the external water environment and the concrete pore solution and slows down the dissolution process.
In contrast to contact dissolution, the seepage dissolution mechanism in the concrete cutoff wall involves not only concentration gradients but also hydraulic gradients. The seepage driven by the hydraulic gradient maintains relatively low ion concentrations in the external water environment, ensuring a constant concentration gradient between the inside and outside of the structure. Furthermore, under the combined influence of concentration and hydraulic gradients, the pore structure within the anti-seepage wall continuously enlarges, enhancing permeability, and the flow velocity of the internal pore fluid gradually increases. This, in turn, promotes the calcium leaching behavior of the anti-seepage wall. Therefore, for anti-seepage walls subjected to seepage dissolution, when there is a sufficient supply of calcium available for dissolution within the interior, the dissolution rate of calcium exhibits a gradual increase. When the calcium within the anti-seepage wall is nearly completely dissolved and leached, the reduction in concentration gradients both internally and externally, coupled with the predominance of slow-degrading C-S-H gel in the remaining calcium, causes the rate of calcium leaching to gradually decline until it becomes zero upon complete dissolution.
4.5. Influence of Calcium Dissolution on the Performance of Concrete Cutoff Wall
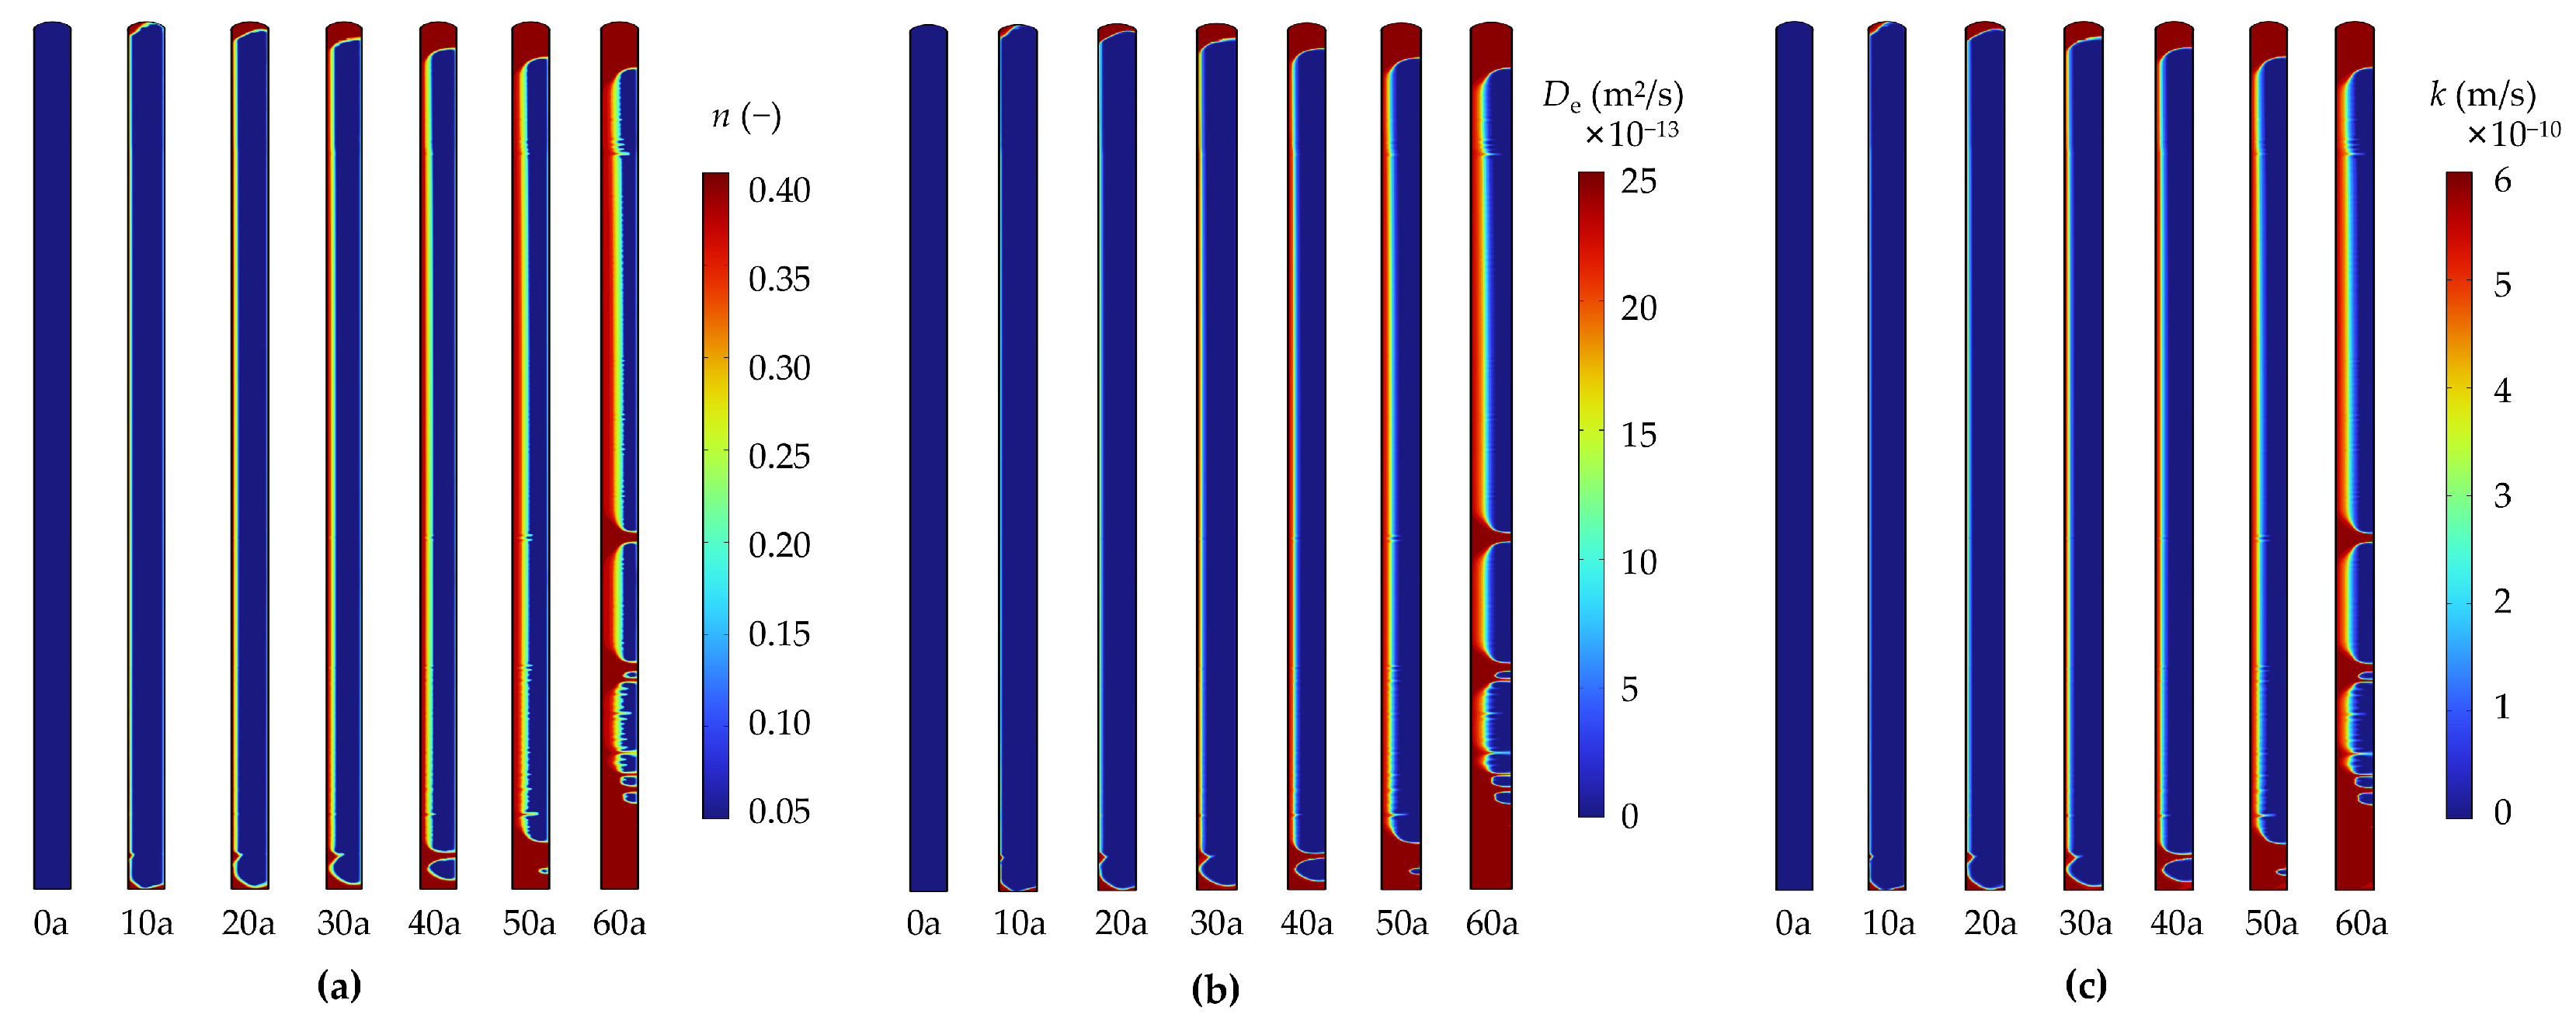
Figure 14 depicts the distribution of performance parameters, such as porosity, diffusion coefficient, and permeability coefficient, in the concrete cutoff wall at different durations. As can be seen, these three performance parameters at the upstream-facing surface, as well as the top and bottom of the anti-seepage wall, progressively increase with increasing service duration. Furthermore, their distribution patterns closely match the distribution pattern of calcium presented in
Figure 12, i.e., these three performance parameters of the calcium-dissolved area become larger, while those of the non-dissolved area remain basically unchanged.
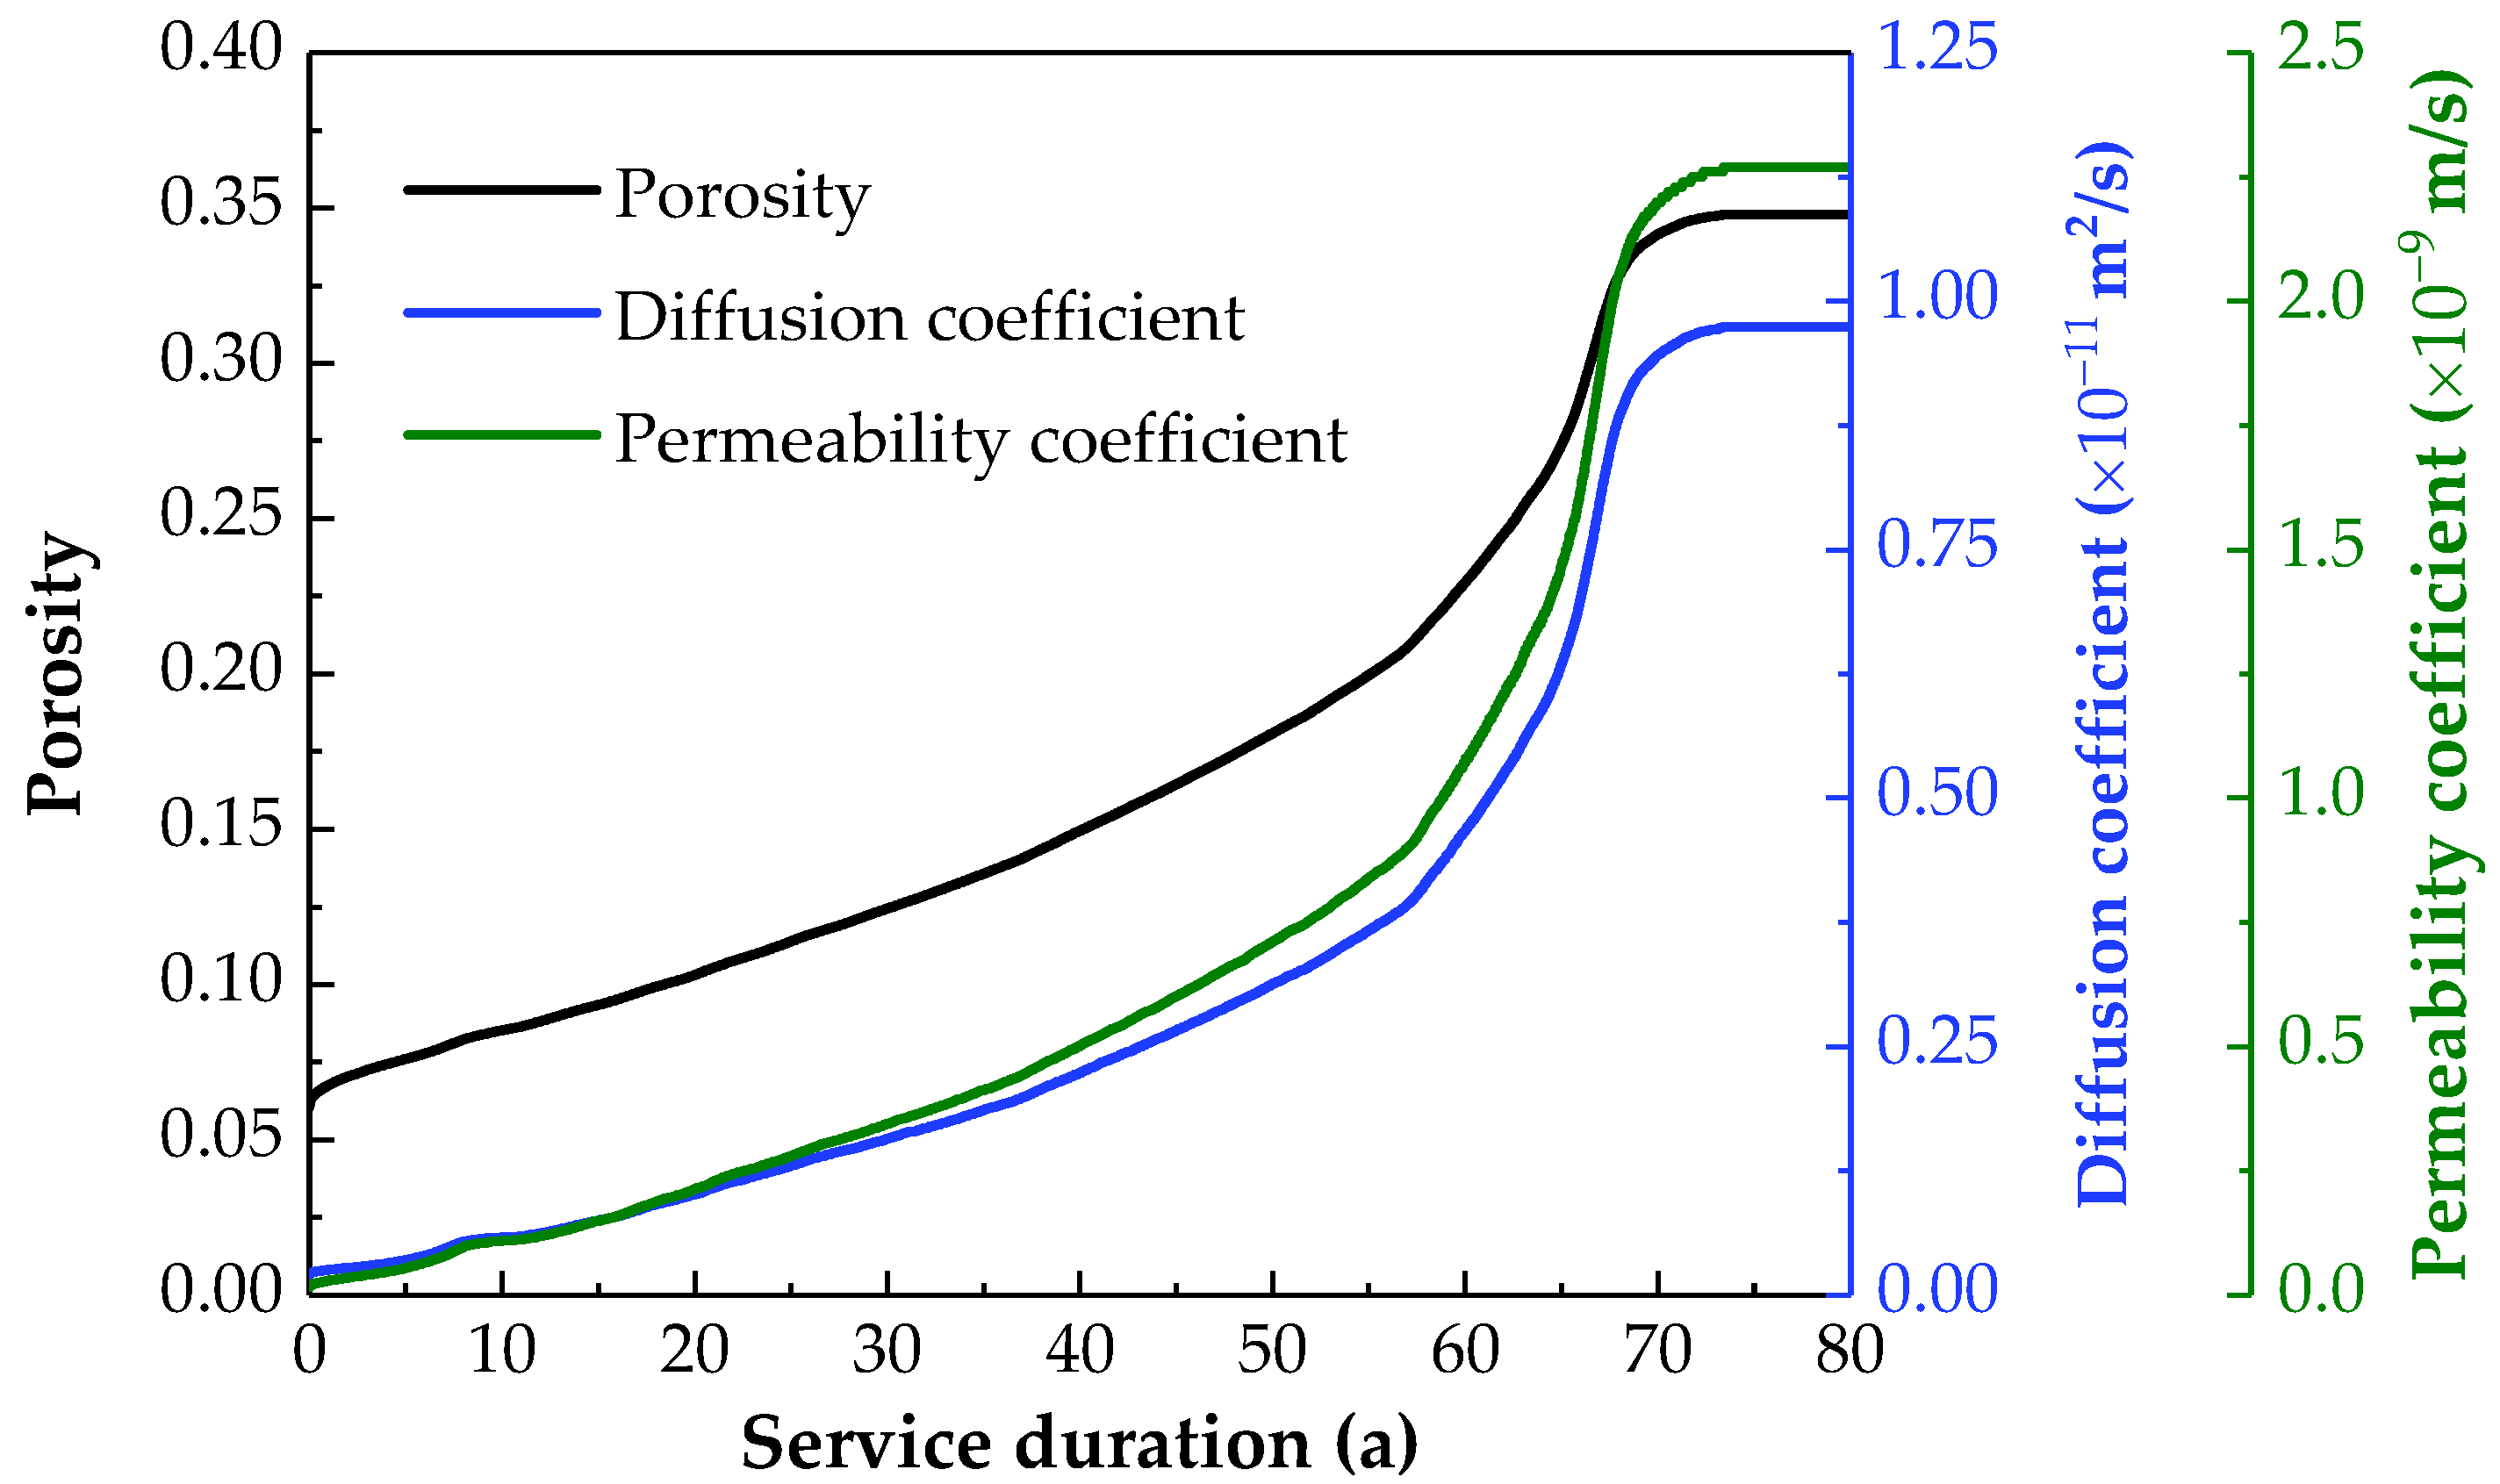
For further elucidation, the changes in the mean value of three performance parameters (i.e., porosity, diffusion, and permeability coefficients) in anti-seepage walls during service are presented in
Figure 15. It is observable that these three performance parameters exhibit a trend consistent with the leaching of calcium, i.e., an exponential growth in the initial 68 years of service, followed by a gradual slowdown and eventual cessation of growth due to the near-complete dissolution of solid-phase calcium. Consequently, the rise in these three performance parameters in the relevant regions is directly attributed to the leaching of calcium in the anti-seepage wall. Moreover,
Figure 15 provides quantitative evidence that completely dissolved wall’s typical porosity is about 0.35, which is approximately seven times larger than its initial porosity. Due to the rise in porosity, the diffusion coefficient and permeability coefficient of the anti-seepage wall increased by about two to three orders of magnitude, leading to an extremely negative impact on the impermeability of the anti-seepage wall.
To further investigate the performance characteristics during the service life of the concrete cutoff wall,
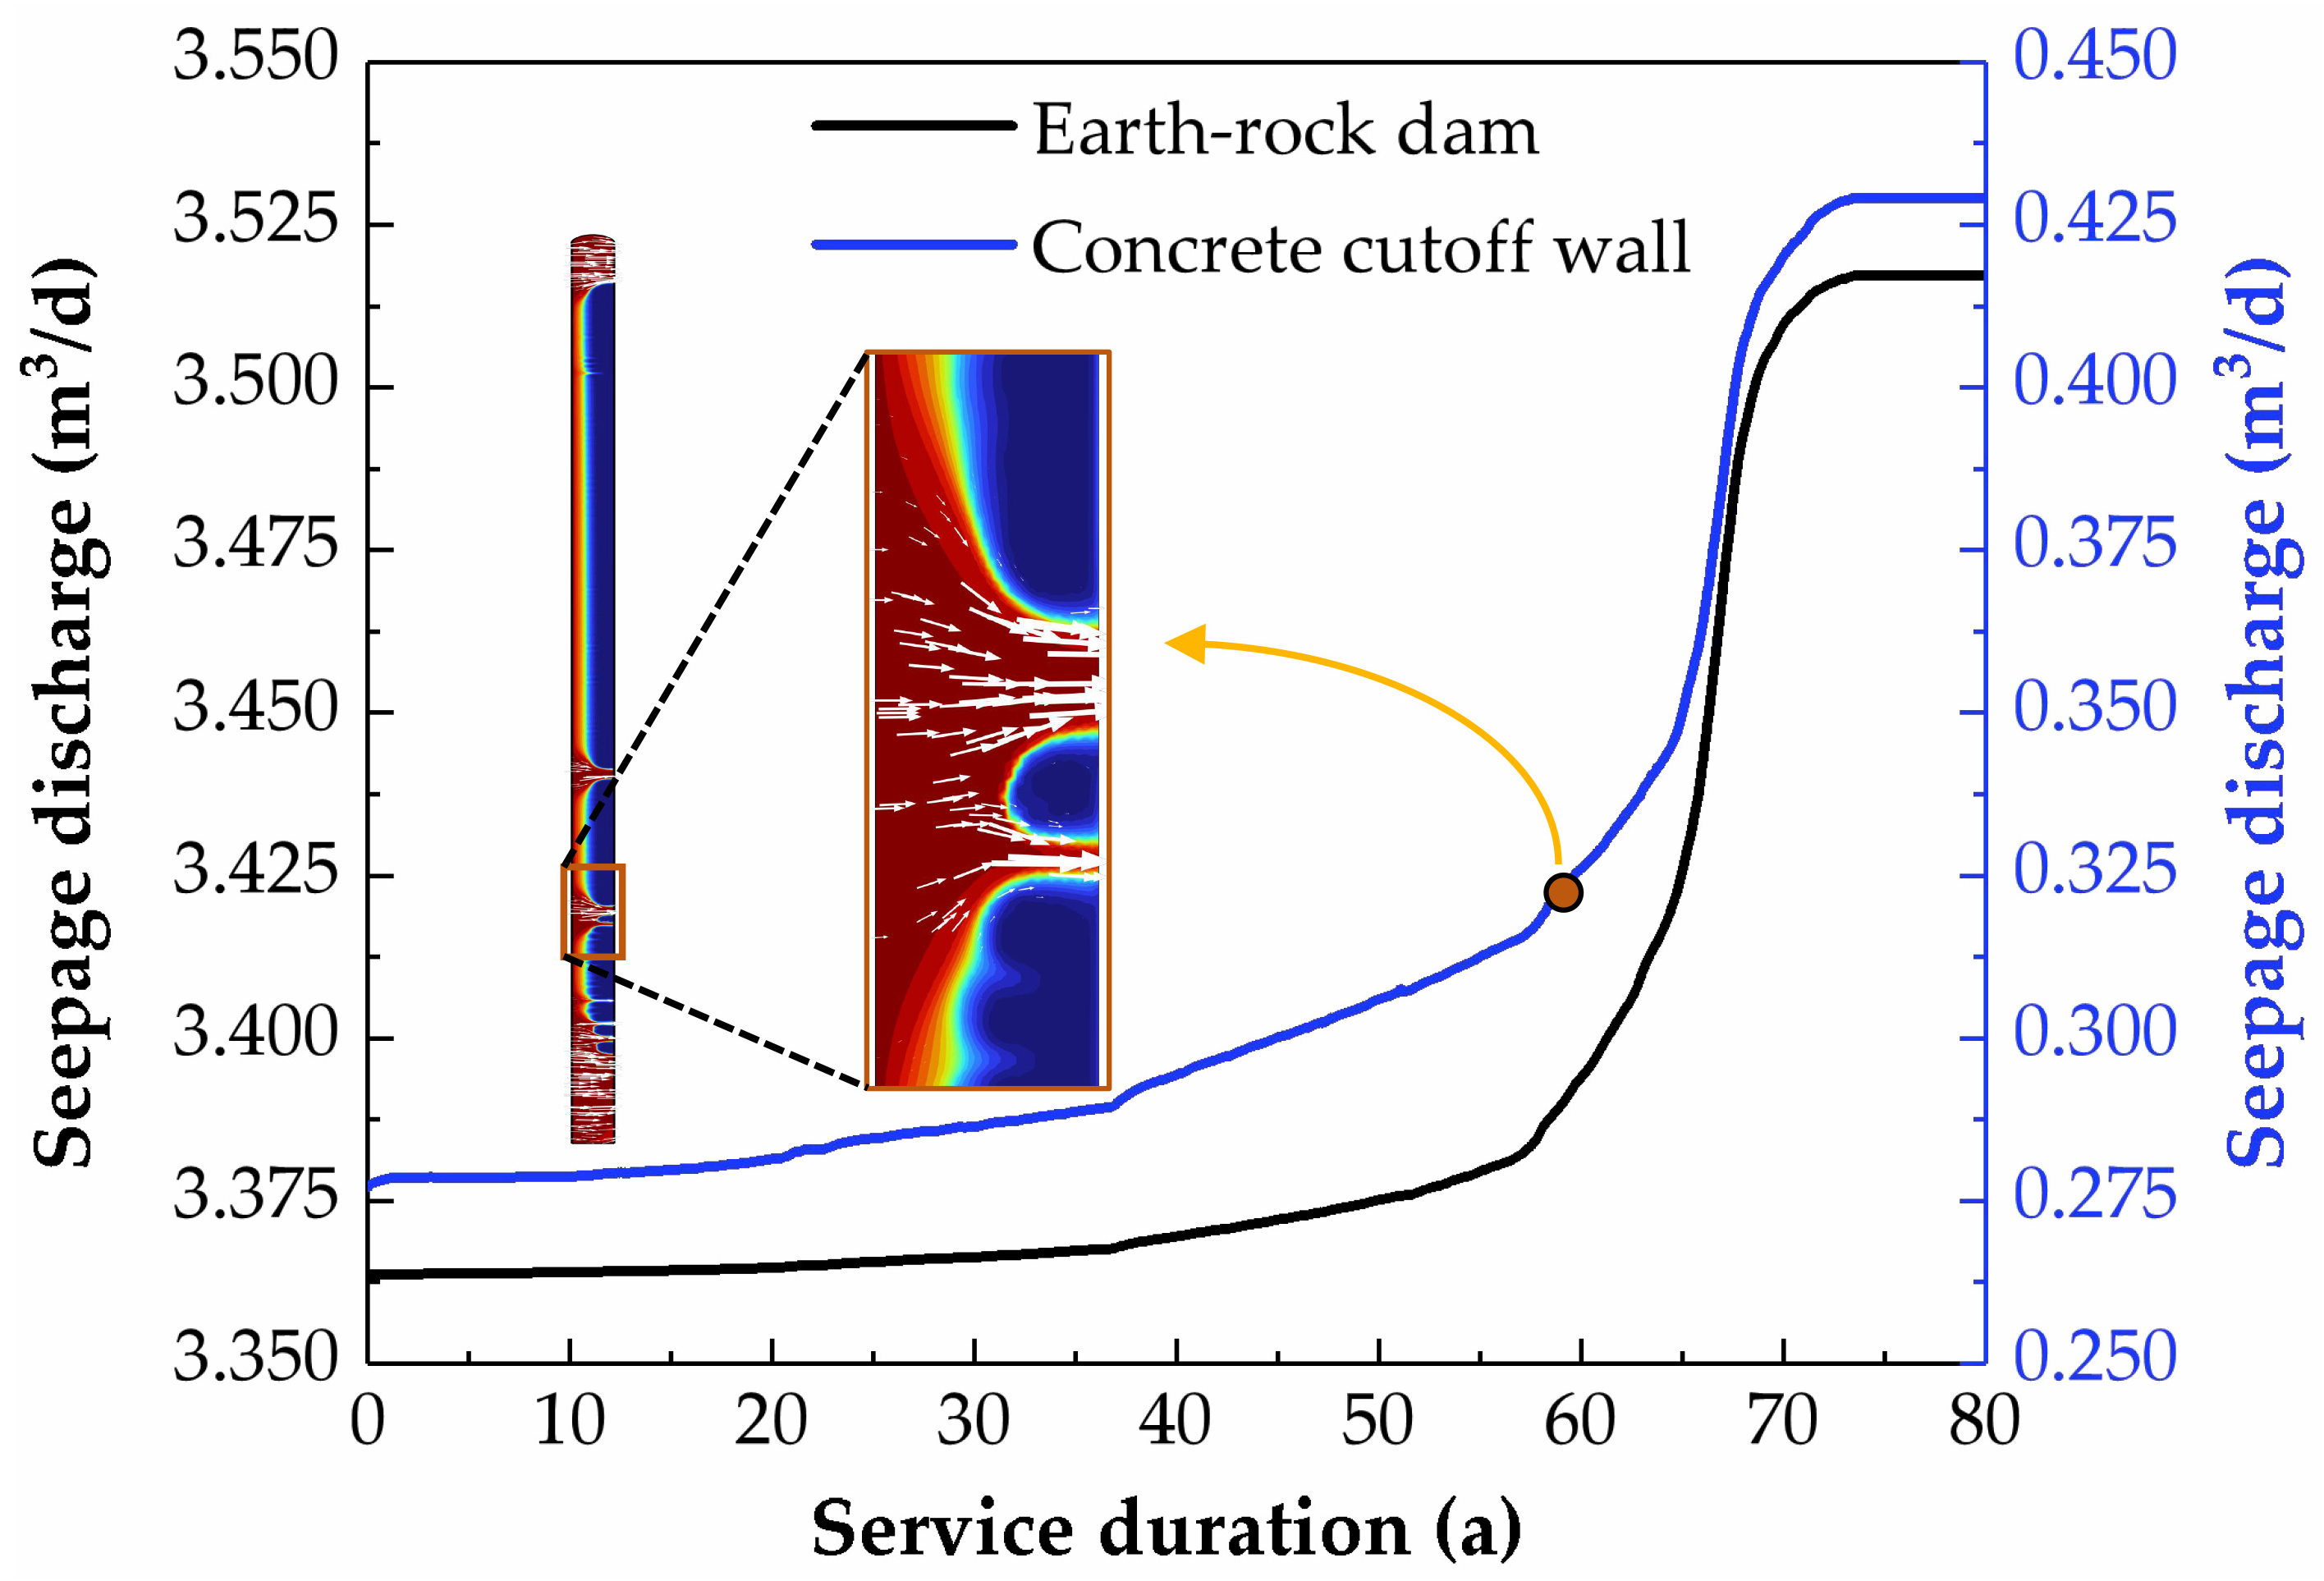
Figure 16 presents the variation in single-width seepage discharge for the dam throughout its service duration. It is evident that the seepage discharge curves of the anti-seepage wall and the dam exhibit a relatively consistent trend. In the initial 40 years of dam operation, both the dam and the anti-seepage wall demonstrated minimal growth in seepage discharge, maintaining a relatively low level. However, both structures exhibit an abrupt rise in seepage discharge around the 60-year mark of operation. This primary cause of this phenomenon is attributed to the dissolution of the anti-seepage wall, resulting in the formation of a calcium-free zone that penetrates through the wall, as depicted in
Figure 12. The formation of the calcium-free zone increases porosity, diffusion coefficient, and permeability coefficient in the corresponding regions (as shown in
Figure 14), providing a pathway for downward seepage of groundwater enriched on the upstream face of the anti-seepage wall, as illustrated in
Figure 16. Therefore, the formation of a permeable zone devoid of calcium in the anti-seepage wall is identified as the primary cause for the abrupt increase in seepage discharge.
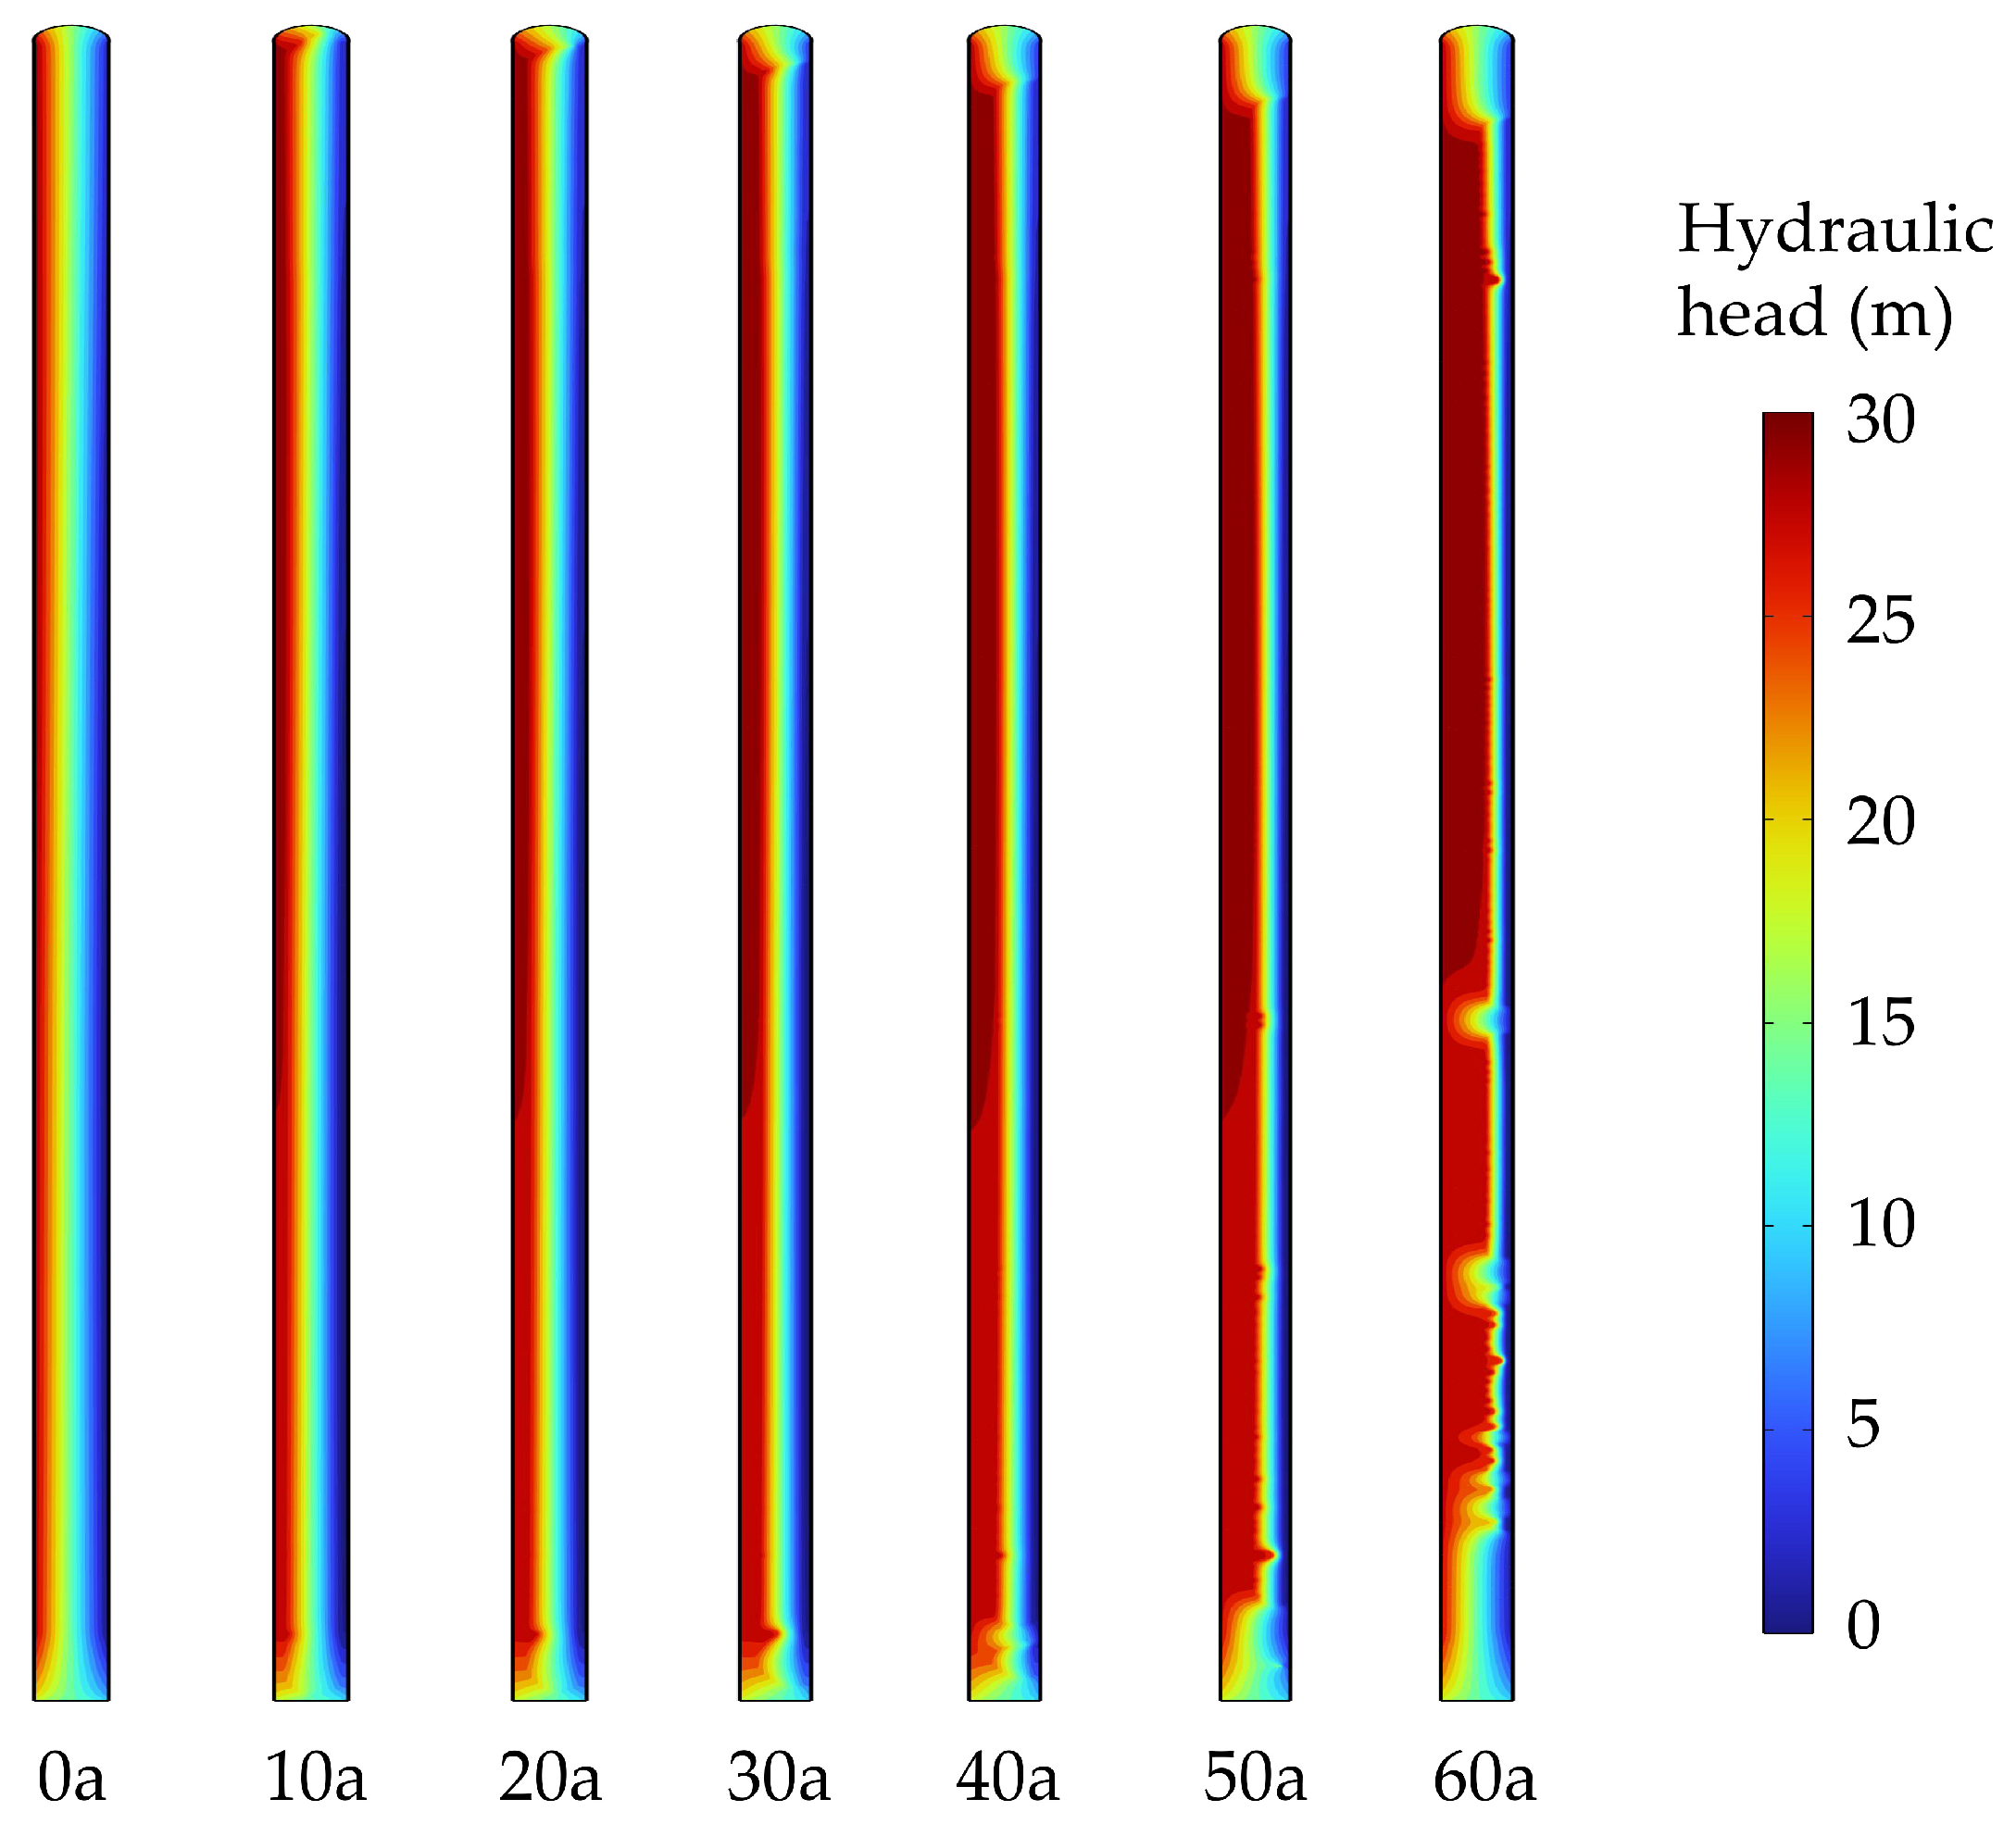
The distribution of hydraulic head within the anti-seepage wall undergoing seepage dissolution at various stages of its service duration is illustrated in
Figure 17. It can be observed that, with the increase in service time, the high hydraulic head zone within the anti-seepage wall gradually expands, while the low hydraulic head zone diminishes. This indicates that the effective area of the concrete cutoff wall capable of withstanding the influence of high hydraulic heads progressively decreases. The front of the high hydraulic head in the anti-seepage wall gradually advances towards the downstream side with the increase in service time, which means that the seepage path gradually shortens. Therefore, the hydraulic gradient of the anti-seepage wall will increase.
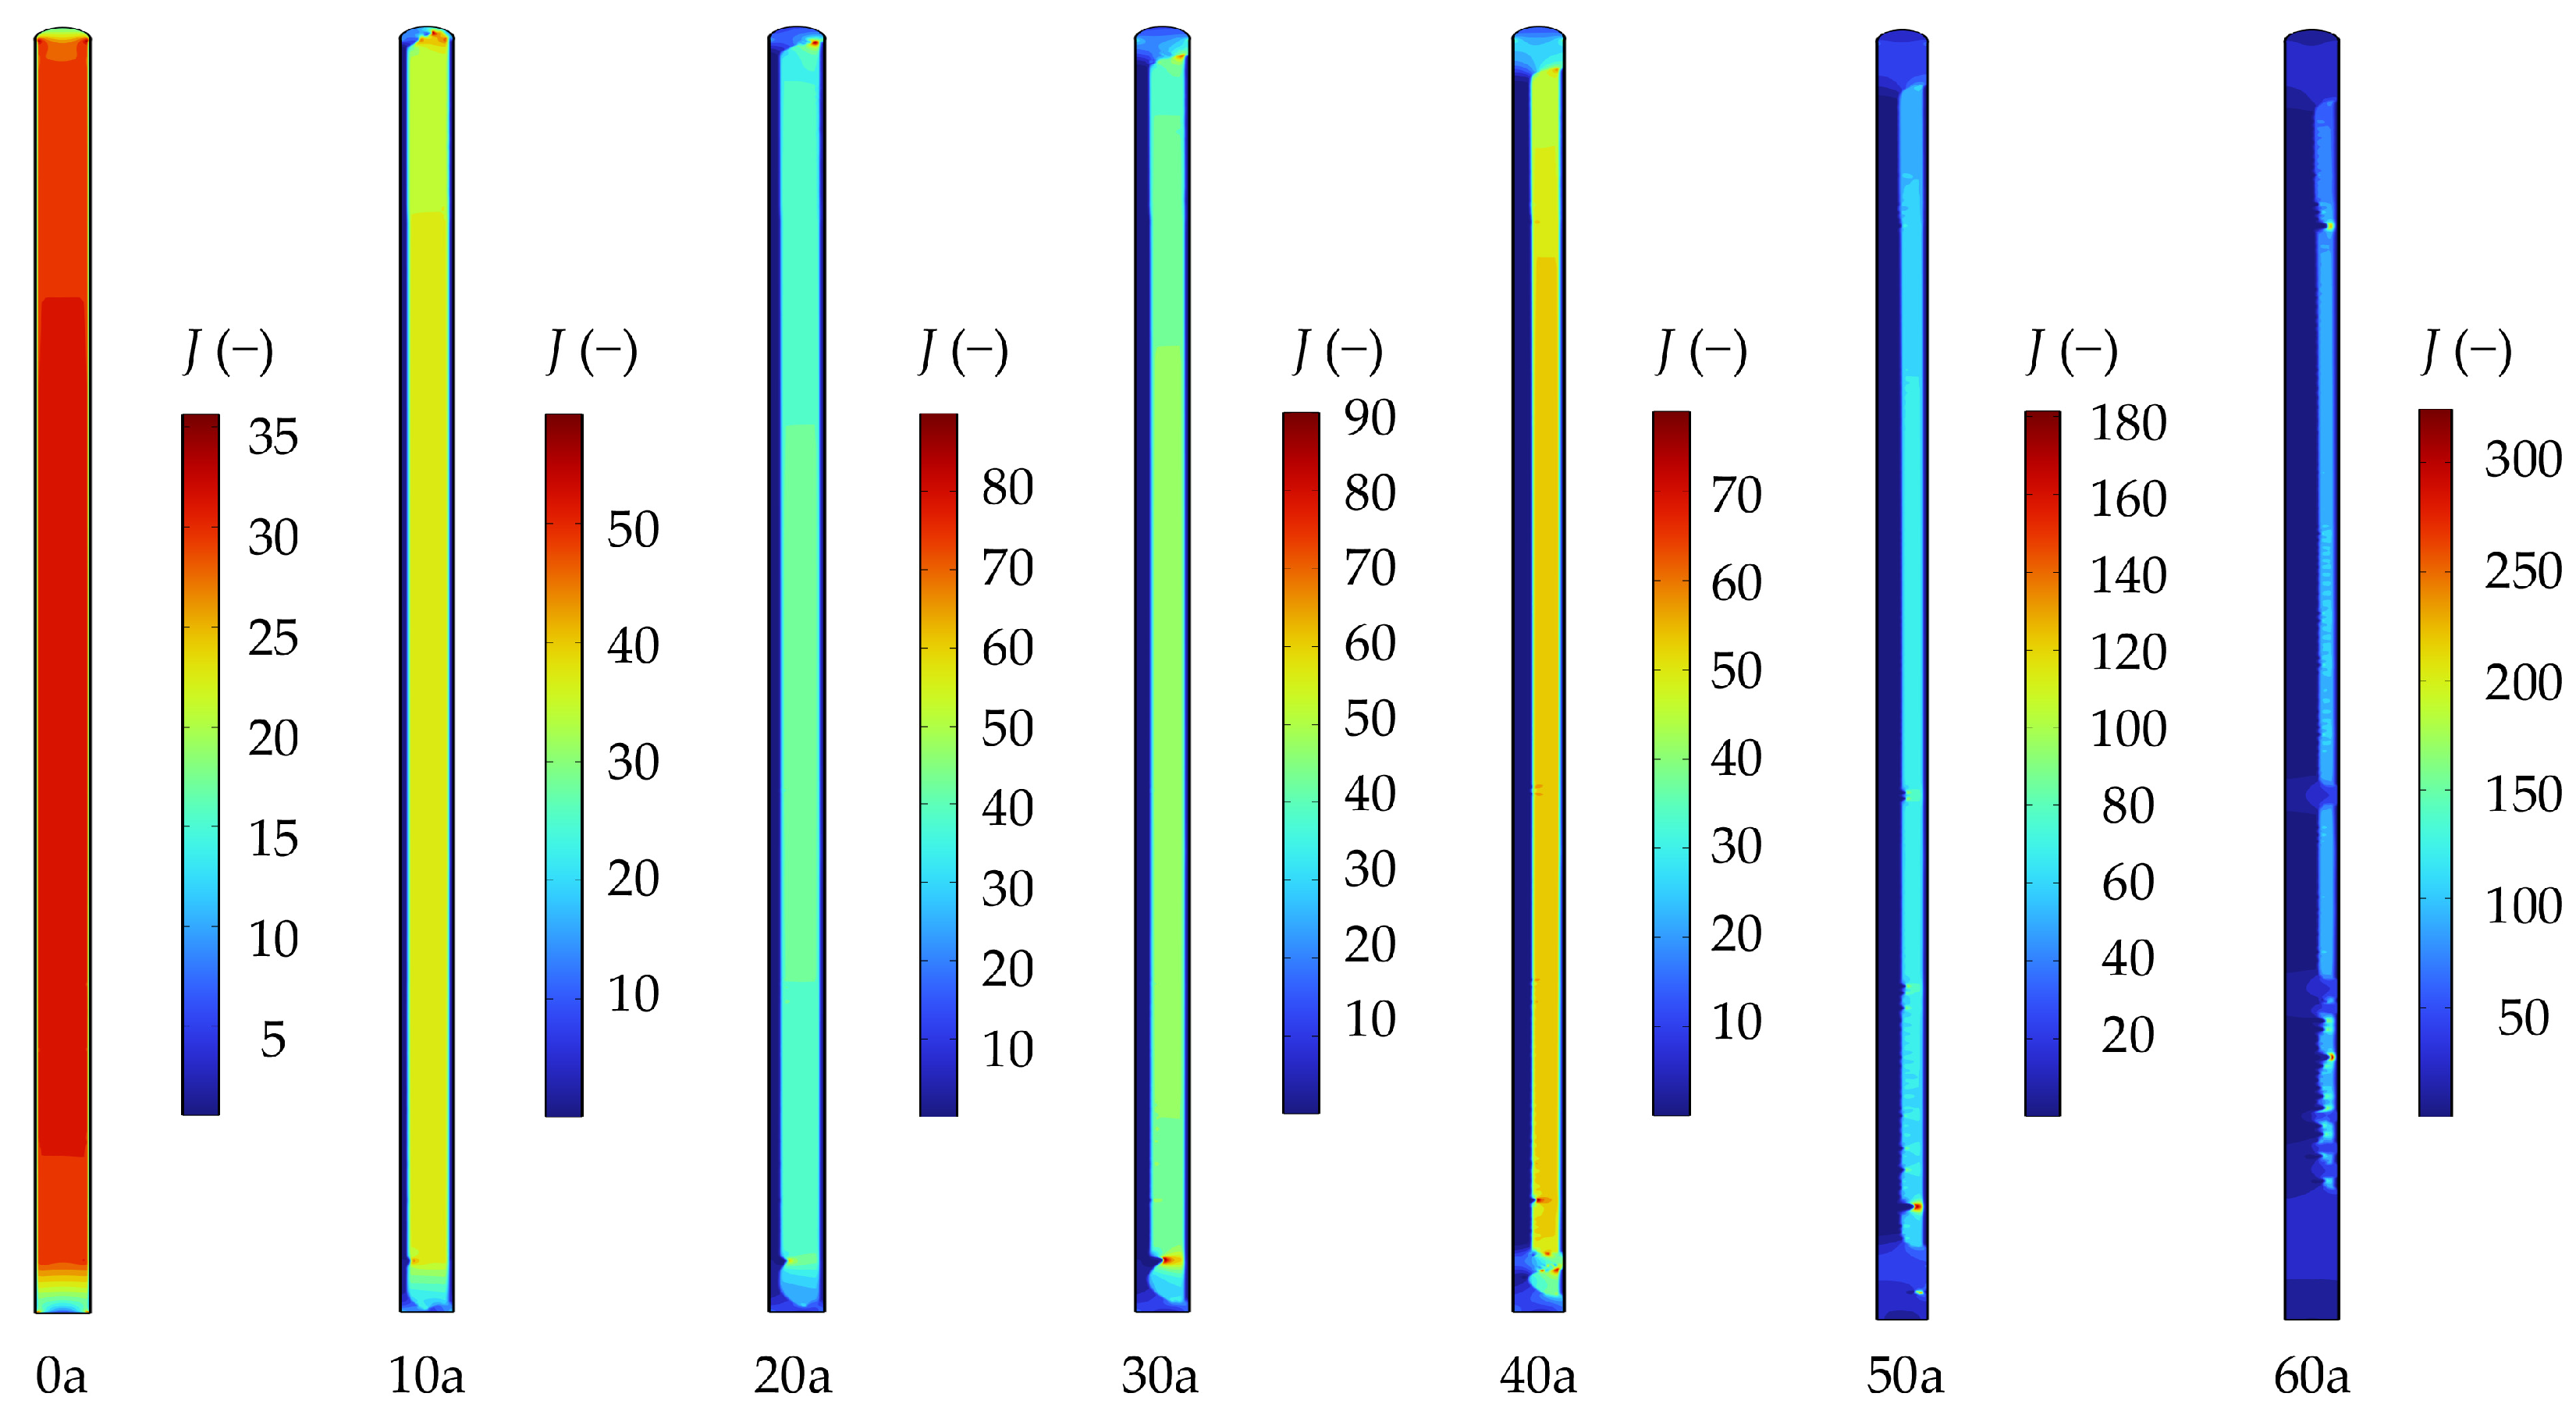
Figure 18 illustrates the hydraulic head distribution within the anti-seepage wall during its service life. In the absence of seepage dissolution, the anti-seepage wall maintains a maximum hydraulic gradient of approximately 35.6. As service time increases, the internal hydraulic gradient progressively increases. According to the relevant literature and standards [
55], the allowable hydraulic gradient for a plastic concrete cutoff wall is approximately 60 (i.e.,
Jc = 60). This means that if the hydraulic gradient at a specific location within the concrete cutoff wall exceeds
Jc, hydraulic failure is likely to occur. Upon examining the results depicted in
Figure 18, when the concrete cutoff wall has been in service for around 10 years, the maximum hydraulic gradient in the localized area at its top reaches 59, approaching the critical hydraulic gradient. Furthermore, the contours of hydraulic gradient distribution for the 20-, 30-, and 40-year service intervals reveal that localized regions at the top and bottom of the anti-seepage wall exceed the critical hydraulic gradient, although overall they remain below the critical threshold.
Combining the aforementioned observation with
Figure 16, it is evident that both the anti-seepage wall and the dam exhibit a minor increase in seepage discharges during the initial 40 years of service. This suggests that hydraulic damage to localized areas of the anti-seepage wall has a negligible influence on its overall performance during this period. However, by the 50th year of service, the hydraulic gradients in the non-dissolved region of the concrete cutoff wall had generally exceeded the critical hydraulic gradient, with the maximum hydraulic gradient reaching 181. This implies that the entire concrete cutoff wall experiences hydraulic failure at this point. Therefore, utilizing the critical hydraulic gradient as the criterion for determining the service life of the anti-seepage wall suggests that its service life falls within a range of 40 to 50 years.
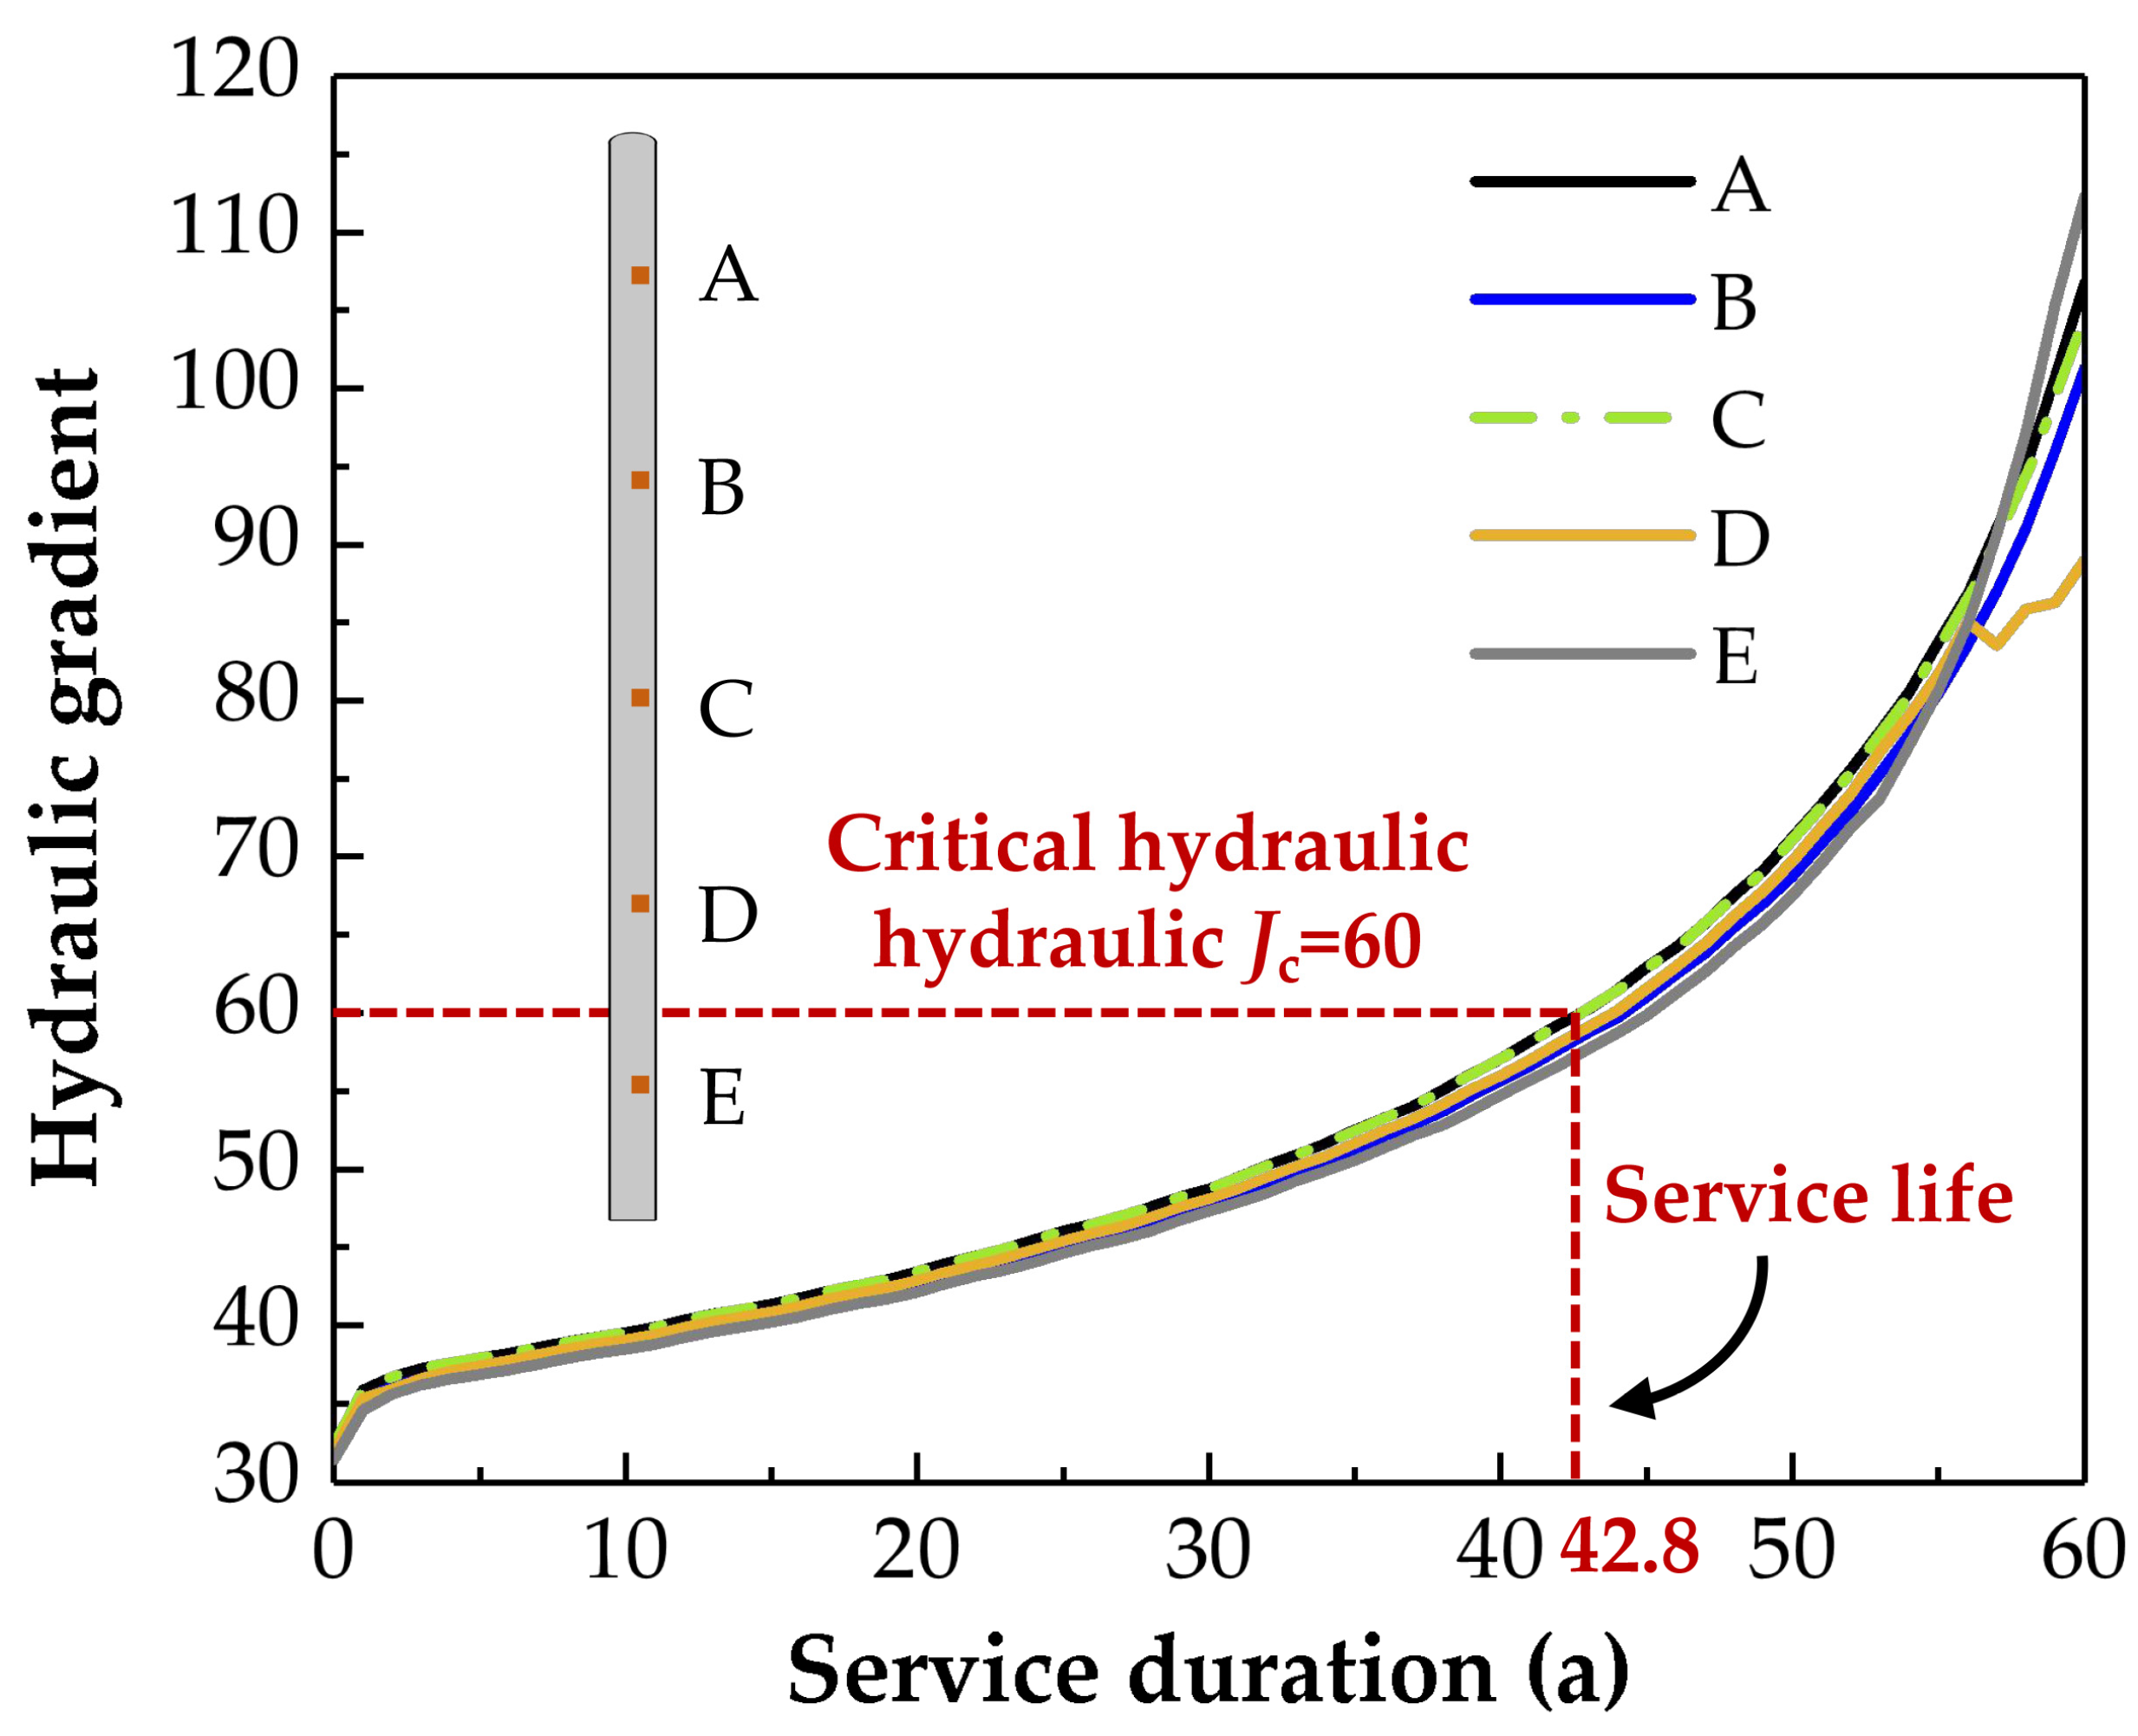
Figure 19 provides the temporal variation in hydraulic gradients at five different elevations within the concrete cutoff wall. It is evident that these points exhibit exponential growth in hydraulic gradients with increasing service time. Based on a critical hydraulic gradient of 60 as the criterion, the anticipated service life of the anti-seepage wall is about 42.8 years. At this juncture, the cumulative leaching of calcium in the single-width anti-seepage wall amounts to 1.16 × 10
5 mol, accounting for 37.7% of the total solid-phase calcium content.
4.6. Identification of Seepage Dissolution Durability Control Indices
Based on the aforementioned analytical results, the degradation of the anti-seepage wall and the subsequent increase in leakage can be attributed to calcium leaching during the dissolution process. To identify the key control indices for the seepage dissolution durability of concrete cutoff walls, a sensitivity analysis of the model parameters impacting the output results of solid-phase calcium leaching (
Csout) was conducted using the constructed numerical model. The involved model parameters include the initial permeability coefficient (
k0), initial diffusion coefficient (
D0), initial percentage of CH content in solid-phase calcium (
/
), water/cement (w/c) ratio, upstream hydraulic head (
H), and volume fraction of cement matrix in concrete (
Vvol). During numerical computations, each parameter is investigated at three levels, with each level representing the reference value, a 10% increase, and a 10% decrease from the reference value, respectively. The levels of each factor in the parameter sensitivity analysis are listed in
Table 6. It is essential to point out that the adjustments to the aforementioned parameters apply only to the concrete cutoff wall, while the material parameters for other regions within the earth-rock dam remain consistent with those shown in
Table 5. Additionally, the output variable
Csout represents the solid-phase calcium content corresponding to a service duration of 42.8 years under various scenarios.
Following the principles of orthogonal test design, an
L18(3
6) orthogonal table was selected to design the orthogonal test. This table randomly allocated test factors, and the corresponding design parameter values were substituted for each element based on the associated factor and level. The orthogonal test table for the sensitivity analysis of the parameters in the suggested model was generated using this procedure, as indicated in
Table 7. Each row in
Table 7 represents a test design, correlating to a combination of factor levels. For each test scenario, the test index
Csout was computed using the designs displayed in
Table 6 and entered into the final column of the table. Finally, the sensitivity of the test indices to each parameter was assessed using the ANOVA approach, depending on the outcomes of the several test designs.
The significance of each factor on the model’s output findings was computed following the principles of analysis of variance, as depicted in
Table 8. The calculated statistic
Fj was compared to the
F-values corresponding to the two selected significance testing levels,
α = 0.001 and
α = 0.005. This procedure enable the evaluation of each factor’s importance. Three categories were established for the significance levels: (a) when
Fj >
F0.001 (2, 5), it indicates high sensitivity of the factor with a significant impact; (b) when
F0.001 (2, 5) >
Fj >
F0.005 (2, 5), it suggests moderate sensitivity of the factor with a moderately significant impact; (c) when
Fj <
F0.005 (2, 5), it signifies low sensitivity of the factor with an insignificant impact. It is noted that
F0.001 (2, 5) = 37.12 and
F0.005 (2, 5) = 18.31, according to the probability statistics
F distribution table. This allows for the assessment of each parameter’s relative importance the test index
Csout.
The sensitivity ranking of the calcium leaching in anti-seepage walls to various parameters is displayed in
Table 8 in descending order:
H,
k0,
/
,
Vvol, w/c, and
D0. The upstream hydraulic head (
H) and the initial permeability coefficient of the anti-seepage wall (
k0) exhibit substantial influences on the leaching of solid-phase calcium, with respective statistical values
Fj reaching as high as 221.08 and 205.22. The statistical values for the other parameters are notably lower than the
Fj values for
H and
k0, which also significantly surpass
F0.001 (2, 5). Although the statistical value for the
/
is not as substantial as the first two, its
Fj value surpasses
F0.001 (2, 5), indicating it is a sensitive parameter affecting the calcium leaching in anti-seepage walls and, consequently, influencing their seepage dissolution durability. In comparison, the
Fj values for the
Vvol and the w/c are relatively smaller, falling between
F0.001 (2, 5) and
F0.005 (2, 5). Hence, these parameters are moderately significant in influencing the durability of concrete against seepage dissolution. During the seepage dissolution process, the
D0 has minimal impact on the leaching of solid-phase calcium, with its
Fj value being merely 0.91, significantly lower than
F0.005 (2, 5). Consequently, it stands as the least sensitive parameter.
According to the aforementioned analysis, the seepage dissolution durability of anti-seepage walls in earth-rock dams is primarily associated with the H, k0, and /. Therefore, to enhance the service durability of anti-seepage walls in earth-rock dams, it is imperative, during the design and construction phases of these walls, to elevate their resistance to permeation by either increasing their impermeability grade. While the influence of the w/c and appears moderately significant, it may stem from a limitation of the model in this study. Due to the absence of a functional relationship between the initial permeability coefficient and concrete parameters such as the w/c in existing research, the model fails to establish a connection between these two factors, potentially underestimating the impact of the w/c ratio on the results during sensitivity analysis. It is well-known that altering the w/c ratio can enhance the concrete’s impermeability (i.e., the initial permeability coefficient of concrete is closely related to concrete parameters such as the w/c ratio), with lower w/c ratio generally considered advantageous for reducing the initial permeability coefficient of concrete. The actual w/c ratio of concrete may exert a larger influence on the model’s output than anticipated. Therefore, the sensitivity of concrete parameters such as w/c ratio on the dissolution durability of concrete cutoff walls needs to be further discussed in future studies.
In addition, measures such as increasing the admixture of silica fume, fly ash, and similar additives are necessary to reduce the CH content in the cement slurry of concrete cutoff walls. From an engineering maintenance perspective, it is essential to judiciously control the reservoir’s water storage level, avoiding indiscriminate pursuit of economic benefits from high-head water storage for power generation. While these measures may initially increase project costs, they will significantly extend the service life and performance of concrete cutoff walls, making them economically justifiable in the long term.
