Abstract
In this study, flow behavior in a meandering channel was investigated experimentally and numerically. The experiments were carried out for nine different cases on a channel consisting of 180° and 120° angle bends following successively. Measurements were conducted employing Acoustic Doppler Velocimetry (ADV) at 13 different points in the inner, middle, and outer bends of the sections located at significant bends along the channel. Depth-averaged velocity, velocity profiles, bed shear stress, and turbulence kinetic energy parameters were considered to understand the flow behavior in the meandering channel. A 1:1 scale numerical model of the experimental setup was generated using the Computational Fluid Dynamics (CFD) method through the verified FLOW-3D software (HYDRO 2022R1). It was found to be successful in estimating all parameters and was capable of investigating the flow behavior in the meandering channel. Additionally, a mesh independence study was performed, and four different turbulence models were compared. As a result, as the flow encountered the first meander in the channel, secondary flow occurred, and lateral momentum transfer took place. Therefore, velocity increased by approximately 30% from the first meander of 180° angles to the second meander of 120° angles. Therefore, the most critical zone was the inner bend of the 120-angle meander.
1. Introduction
A meandering channel is one of the most common features of a river system. The flow pattern of a meandering channel is complex and can affect hydraulic processes as well as sediment transport. A meandering channel follows a sinuous course with alternating concave and convex structures, resulting in inner and outer bends. Meander channels play a significant role in river morphology and are altered by a variety of environmental elements. The size, morphology, and bedforms of meander channels within river systems are affected by flood events, sediment loads, and the history of avulsion. Meandering channels are quite common in places where the altitude difference is very low between upstream and downstream, such as the delta plain, where the slope is quite low.
Understanding the flow and velocity distribution in a meandering river is crucial for practical considerations related to riverbank protection, flood forecasting, river transport, water structure, and sediment transport models in river hydraulics. Knowledge of velocity distribution in a meandering channel is also valuable for determining factors such as energy dissipation, momentum transfer, bed shear stress distribution, and addressing heat and mass transport issues. A more comprehensive understanding of the hydrodynamic changes in meandering rivers contributes to an improved description of potential floods resulting from hydrological events or during the propagation of tsunami waves in the river.
As the flow enters a meander, the channel curvature induces a centrifugal force, leading to a transverse slope in the water surface. The interaction between the centrifugal force and the lateral pressure gradient generates secondary flows in the cross-sections, and these secondary flows progress along the bends. Consequently, this process results in an increase in streamwise velocity at the inner bend and a decrease at the outer bend. The velocity distribution not only varies along the depth of the channel but also across the cross-section. This variation can be observed from the channel bottom to distances below the water surface, primarily influenced by bed shear stress related to channel geometry and slope. Additionally, the roughness or smoothness of the channel bottom affects the turbulence structure of the flow. Therefore, roughness and shear stresses are identified as the key factors influencing velocity distribution [1]. In meandering channel flow, circulation cells perpendicular to the streamwise direction, known as secondary flow, are a characteristic feature. Alongside the central helical motion in the cross-section center, smaller circulation cells near the outer shore, rotating in the opposite direction, are often observed.
The mechanisms leading to the formation of these two circulation cells are revealed by the vorticity balance, where centrifugal force and turbulent stresses, which play a significant role, are perpendicular to the streamwise. Hence, the formation of the central zone cell is usually explained by the local imbalance between centrifugal force and the lateral pressure gradient [2]. On the other hand, turbulence is an important key in the formation of the outer shore cell. These secondary circulation cells have a significant influence on the erosion processes of the mobile bed on the riverbanks [3,4,5,6]. The momentum advection caused by the formation of the secondary flow determines the spatial distributions of velocities and shear stresses in the boundary layer and thus shapes the topography of the river in the case of the mobile bed [4,5]. As a result, understanding the flow behavior in meandering rivers is very important for environmental and urbanization reasons, such as designing water structures, reducing erosion, and preventing flooding.
The hydrodynamics of the flow in meandering rivers varies compared with straight channels due to a series of regular sinuous structures that follow. In order to investigate the effects of meandering on the flow structure, many researchers have carried out velocity measurements in the field and the laboratory. These measurements should be performed at different points in the sections where the curvature is present. They provide a detailed and clear understanding of the flow structure and the changes occurring in the meanders. Velocity measurements can be performed using methods such as PIV (Particle Image Velocimetry) and ADV (Acoustic Doppler Velocimetry). Numerous studies conducted ADV measurements to investigate three-dimensional velocity components, secondary flow, bed shear stress, and turbulent flow structure in meandering channels [4,5,6,7,8,9,10,11]. Dombroski and Crimaldi evaluated the accuracy of ADV velocity measurement data in turbulent boundary layer flow over a hydraulically smooth surface [8]. Sahoo and Sharma studied the turbulent flow mechanism in meandering channels using the ADV technique [12]. Laboratory studies performed by Ishigaki et al. and Bai et al. with PIV can be shown as other example studies for understanding flow behavior in a meandering channel [13,14].
Extensive studies on the investigation of flow and velocity distribution in meandering channels using experimental and numerical models have been published in the literature [9,10,15,16,17,18,19,20,21]. The effects of channel curvature on turbulent flow are the main object of experimental and theoretical research [11]. Blanckaert stated that the velocity distribution starts to deviate inwards as the river approaches the meander zone and then deflects outwards at the entrance of the first meander [7]. The velocity distribution continues to deviate toward the outer bend as a decreasing curvature effect at the exit of the meandering. Park and Ahn compared and analyzed the velocity profiles through experimental studies and numerical simulations [22]. The authors observed that the streamwise velocity distribution is inward at the first meander, almost symmetrical at the transition sections between meanders, and then it starts to deviate toward the inner next meander again for all conditions. Thus, it is concluded that the maximum streamwise velocity occurs on the shortest route along the channel, regardless of the flow conditions.
Olsen employed Computational Fluid Dynamics (CFD) to simulate the formation of meandering channels [23]. They initially analyzed a straight alluvial channel using a sediment transport model. Scurlock et al. validated a CFD model against laboratory data to study meandering channels [24]. Additionally, other studies have utilized FLOW-3D, a validated CFD model, to gain insights into flow dynamics within meandering channels [25,26].
The determination of velocity distributions, depth-averaged velocity, friction velocity, shear stresses, and turbulence kinetic energy parameters expressing turbulence quantities in a meandering channel was the main objective of this study, which provides detailed insights into the flow patterns and hydrodynamic behavior unique to channels with multiple curved sections and varying bend angles (180° and 120°). This characterization can help understand how these geometric features influence flow velocities, turbulence, and sediment transport within the channel. By comparing experimental data with numerical simulations, the validation of a Computational Fluid Dynamics (CFD) model in replicating flow phenomena in meandering channels with specific geometric configurations enhances confidence in the predictive capabilities of numerical simulations for such complex hydraulic systems.
The scope of the paper is as follows: in Section 2, the experimental setup for the meandering channel is presented, along with the experimental conditions. In Section 3, the numerical modeling is described in detail. The results from the experimental observations and the validated numerical model are given and discussed in Section 4. Finally, the conclusions are expressed in Section 5.
2. Experiments
2.1. Experimental Setup
The experiments were conducted in a curved channel measuring 33 m in length, 0.9 m in width, and 0.6 m in height, constructed with an aluminum base and plexiglass side walls at the Yıldız Technical University, Turkey (Figure 1 and Figure 2a). The slope of the channel from upstream to downstream was calculated as 0.00001. The detailed sections and features of the experimental channel are as follows:
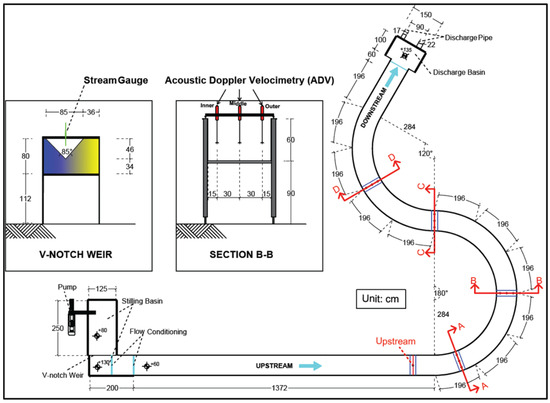
Figure 1.
Geometrical features of the meandering channel.
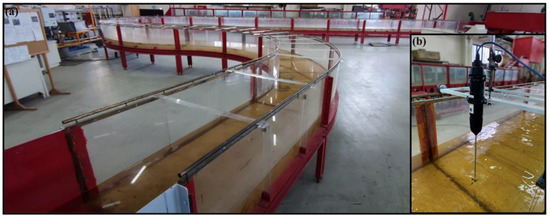
Figure 2.
(a) The meandering channel, (b) ADV measuring setup in the channel.
- There is a pump upstream of the channel capable of supplying discharges ranging from 10 to 50 L/s to the experimental system;
- Stilling basin and V-notch weir feeding the experimental channel: The stilling basin measures 2.5 m × 1.25 m and has a height of 0.8 m. Baffles consisting of perforated walls are installed in the middle of the basin to regulate the movement of water. At the outlet of the basin, there is a V-notch weir with an upper width of 0.85 m. The crest of the weir is located 0.34 m above the base of the basin. The discharge supplied to the experimental system was measured using this V-notch weir (Figure 3b);
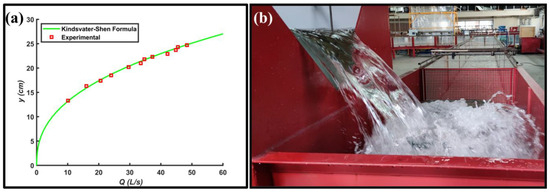 Figure 3. (a) Rating curve, (b) Flow in V-notch weir.
 - Stilling basin after the weir: This second stilling basin measures 2 m × 0.9 m, with half of it having a height of 0.6 m and the other half having a height of 1.30 m. It contains two baffles with perforated walls;
- Experimental channel: A linear section of 13.72 m is followed by two curved sections measuring 10.32 m each with a 180° bend, a 6.88 m section with a 120° bend, and a final linear segment of 1.96 m (Figure 1).
The head upstream of the V-notch weir was measured using a limnimeter. The rating curve was obtained based on the discharge values corresponding to different flow heads and compared with the Kindsvater–Shen formula (Figure 3a) [27]. The widely used equation for water discharge calculation in triangular notch is given in Equation (1).
where Q is the flow discharge, Cd is the discharge coefficient, g is the gravitational acceleration, α is the V-notch angle, and h is the flow head above weir vertex.
In our study, the meandering channel’s geometry with successive 180° and 120° bends with different angles, and the extended approach channel distinguishes it from other channels studied in the literature, which typically feature more uniform or less extreme bend angles. The experimental model in many studies in the literature consists of only a single bend or narrow-angle uniform sinusoidal bends [1,4,5,6,7,9,10,11,12,14]. In this study, the fairly long approach channel also ensures the flow reaches fully developed flow conditions before entering the meanders. This unique setup allows for the investigation of flow behaviors that are not well-documented elsewhere. The Reynolds numbers in our experiments ranged from 11,000 to 42,000, unlike many studies focusing on a narrower range. This broader scope provides new insights into the flow dynamics at different turbulence levels. At the same time, the Froude numbers in our study ranged from 0.05 to 0.31, which are less frequently studied in the existing literature. In this study, these dimensionless characteristics resemble the data obtained from field measurements, as they have a broader range and smaller values than the existing literature [5,7,11]. This range enabled us to explore diverse flow conditions and their effects on secondary flow formation and momentum transfer in the meandering channel.
Velocity measurements were performed using an Acoustic Doppler Velocity Profiler (ADV) device (Nortek AS, Oslo, Norway) (Figure 2b) [28]. Measurements conducted within the scope of the study were carried out at 13 different locations: three different positions (middle, inner bend, and outer bend) in four separate cross-sections of the channel (marked A-A, B-B, C-C, and D-D in Figure 1), and one position (middle) at the channel upstream cross-section (marked Upstream in Figure 1). Velocity measurements were taken at five different points (y = [0.5, 2.5, 4.5, 6.5, 8.5] cm) for 15 cm water depth, seven different points (y = [0.5, 2.5, 4.5, 6.5, 8.5, 10.5, 12.5] cm) for 20 cm water depth, and nine different points (y = [0.5, 2.5, 4.5, 6.5, 8.5, 10.5, 12.5, 14.5, 16.5] cm) for 25 cm water depth along the depth from the bottom at each location with 2 cm intervals. The ADV sampling frequency was set at 200 Hz.
Measurement errors were carefully processed to ensure the reliability of the experimental results. The Acoustic Doppler Velocimetry (ADV) instruments used in the study were calibrated before the experiments to reduce systematic errors. Calibration included zero velocity checks in still water and periodic verification during the experiment to account for any instrumental drift. More importantly, the amount of correlation, a representation of the data reliability of the ADV measurements, was carefully monitored throughout the entire experimental process. The correlation is directly related to the effectiveness of the acoustic effect in the control volume where the measurement took place, and seeding material must be used to ensure this. Similarly, the Signal-to-Noise Ratio (SNR), which is another representation of the quality of data obtained from ADV, was checked during the experiments. A SNR of less than 15 and a correlation of less than 70% are considered poor-quality data. The main reasons for this could be bubbles and an insufficient number of reflected particles in the flow field, and they cause signal dropout and reduce the correlation. In this study, Polyamide Seeding Particles (PSPs) with a mean particle size of 0.05 mm and a density of 1.03 g/cm3 were employed as seeding material to enhance the ADV signal. Velocity profiles were obtained by filtering out data with correlation coefficients below 90%, and the SNR value was also checked during the experiments. Some experiments were also repeated at some measurement points to avoid possible errors. Nevertheless, all obtained velocity time series were examined, and outliers and spikes were manually removed by eliminating extremely high and extremely low values. Finally, outlying data were also excluded, considering 95% confidence intervals. As a result, after all the filtering and removal of outliers, there was enough reliable data to obtain the mean flow velocity data for steady-state flow conditions. In addition, for each experimental condition, 13 different points along the meandering channel were identified, and measurements were taken every 2 cm along the depth as far as the ADV installation allowed. This provided detailed high-resolution data access within the flow field.
2.2. Experimental Conditions
The experiments were carried out at discharges of 16, 35, and 50 L/s for water depths of 15, 20, and 25 cm. Dimensionless discharge, Reynolds, and Froude number parameters were used to characterize the flow for nine different experimental conditions. Table 1 summarizes the main hydraulic and geometric parameters of the experiments. Here, H is the water depth, Q is the flow discharge, Q(gH5)−0.5 is the dimensionless discharge, Um is the mean cross-sectional velocity in the approaching channel (Um = Q/(B.H), where B is the channel width), Re is the Reynolds number (Re = Um.H/n, where n is the kinematic viscosity), and Fr is the Froude number (Fr = Um/(g.H)−0.5). Flow in all experiments was subcritical (Fr < 1). In all cases, the average Reynolds number was 26,000, and the minimum was 11,000, and the flow in the channel was classified as turbulent in the case of fully developed flow. The present data also served for the validation of a three-dimensional numerical model generated with FLOW-3D.

Table 1.
Summary of the main hydraulic and geometric parameters of the experiment.
3. Numerical Modelling
One of the objectives of this study was to develop a validated numerical model with the help of experimental data. In a separate but parallel effort to the experimental work, a CFD model was generated to study flow behavior in the meandering channel. The CFD method is based on the discretization of the Navier–Stokes and continuity equations, which are partial differential equations describing the motion of the fluid. This discretization can be performed using finite difference, finite element, and finite volume methods according to the fluid problem. The finite volume method significantly simplifies a partial differential equation into analytical solutions by applying it to the surface of the control volume considered in the flow domain with the help of divergence operators. Numerous control volumes form a computational mesh to implement the CFD method.
In this study, the FLOW-3D solver, which has features such as high accuracy, robustness, speed, and proven reliability, was preferred. FLOW-3D is a verified and commercial CFD solver based on the finite volume method widely used in academic research and industrial applications [29]. The basic physical parameters such as velocity, pressure, shear stress, and streamlines considered in this study can be obtained using the finite volume method and the solver algorithms already available in FLOW-3D.
In FLOW-3D, the solid wall and complex geometries with which the fluid interacts can be described by “STereoLithography (STL)” format files generated using computer-aided design (CAD). Therefore, in this CFD model, a 1:1 scale drawing of the experimental setup was imported into FLOW-3D as defined in the fluid domain (Figure 4a). FLOW-3D utilizes structural block mesh. This means that curvilinear surfaces that are not perpendicular or parallel to the mesh planes, e.g., for a meandering channel, must be defined within mesh cells using FAVOR (Figure 5c,d). This technique, called “Fractional Area/Volume Obstacle Representation” (FAVOR), is used to model complex geometric regions [30]. FAVOR is recognized as a specialized technique for describing geometric objects within a rectangular prism-shaped computational mesh. The free surface problem between two or more fluids is resolved by the volume of fluid (VOF) method. In this interaction region, the presence of finer cells, i.e., resolution, is very important. For this reason, it is crucial to determine the optimal grid size of the mesh. This is necessary not only for the resolution of the model but also for a more stable solution of the selected algorithm concerning the flow conditions. Nevertheless, a finer mesh structure may be time-consuming and cause memory overload. Thus, the mesh independence study must be performed for a more stable numerical model. In this study, four grid sizes (0.1 m, 0.05 m, 0.02 m, and 0.015 m) were compared in terms of velocity and FAVOR iso-surface. Mean Absolute Relative Error (MARE, %) and Root Mean Square Error (RMSE) were used to study mesh independency and select an appropriate turbulence model (Equations (2) and (3), respectively). By comparing the error amounts obtained from the streamwise velocity magnitudes, the optimum result was obtained for a grid size of 0.02 m, as shown in Figure 5a. In fact, there are no significant error differences for all grid sizes. However, as the velocity profiles were analyzed, it was concluded that finer grid sizes (0.02 m and 0.015 m) are more successful, especially in detecting surface velocity, velocities near the bottom, and the location of maximum velocity along the depth. More importantly, as FAVOR iso-surfaces were taken into account, larger grid sizes (0.1 m and 0.05 m) failed to capture the curved channel geometry (Figure 5c). Moreover, the change in the streamwise velocity value concerning different grid sizes at three measurement points was studied, and as a result, it stabilized for 0.02 m and 0.015 m grid sizes (Figure 5e–g). These locations were chosen because estimating the velocity in the boundary layer for the numerical model was more crucial. As a result, the finer grid size of 0.02 m was selected rather than the finest grid size of 0.015 m as optimum, considering the time savings and less memory usage. In addition, seven different block meshes were used over the whole geometry in order to capture each bend with a finer grid and fewer mesh elements (Figure 4a). The sizes of seven different block meshes with a total of 2.9 million cells and their distances from the inlet and outlet boundary conditions are given in Figure 4b.
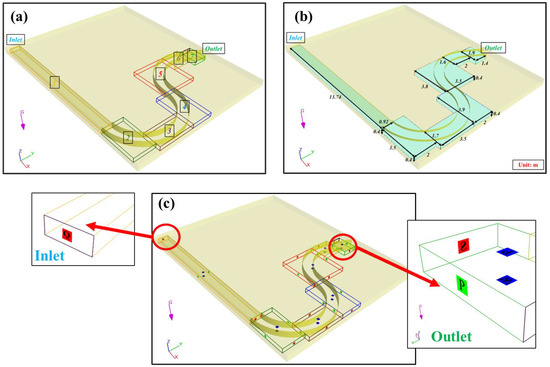
Figure 4.
(a) CAD and mesh planes of the meandering channel, (b) computational mesh with domain sizes of different parts, and (c) boundary conditions.
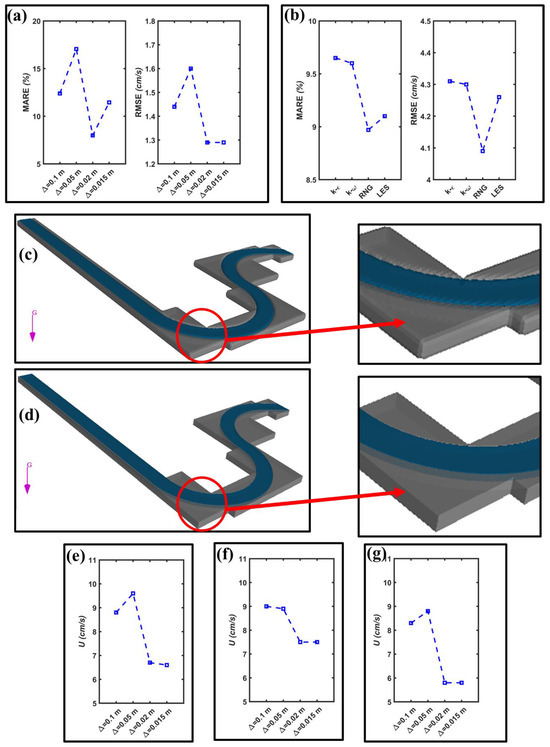
Figure 5.
(a) Error measurements for mesh independency. (b) Error measurements for turbulence modeling. (c) FAVOR for coarse mesh. (d) FAVOR for fine mesh. (e) Velocity value depending on mesh sizes at 0.005 m depth in the upstream. (f) Velocity value depending on mesh sizes at 0.005 m depth in the inner bend of Section A-A. (g) Velocity value depending on mesh sizes at 0.005 m depth in the outer bend of Section A-A.
Here, N is the total number of data points, n is the -th data point, Vexp is the measured data in the experimental study, and VCFD is the data obtained from the CFD model.
Four different turbulence models are available in FLOW-3D: Large Eddy Simulations (LESs), k-e, renormalization group (RNG), and k-w, which are based on Reynolds Averaged Navier Stokes (RANS). All turbulence models were compared, and the RNG turbulence model was found to be the most appropriate model according to the error measurements of the streamwise velocity, as shown in Figure 5b. Nevertheless, no significant differences were observed when comparing the parameters used in this study obtained from all turbulence models. FLOW-3D suggests that the RNG approach can improve the accuracy and stability of the solution for turbulent shear flows [29]. RNG is particularly favored for the investigation of streamlined separation and helicoidal flow (eddy conditions) expected to be observed in meandering channels [31]. Based on existing research in the literature, it was decided to use the RNG turbulence model. Moreover, RNG should be preferred instead of LES in order to utilize the turbulence kinetic energy, which is one of the main parameters being investigated in this study.
All nine cases used in the experimental model were implemented in the numerical model. The initial conditions and boundary conditions were adjusted to capture more realistic physical behavior. Certainly, as mentioned above, the sidewalls and the bottom of the meandering channel were defined as wall boundary conditions utilizing FAVOR in the model. The entire upper plane of the fluid domain was considered the pressure boundary condition, with a relative pressure of 0 Pa to represent the opening to the atmosphere. A volume flow rate boundary condition was utilized at the inlet to set the discharge entering the channel. Stagnation pressure boundary condition was employed to maintain a constant flow depth at the outlet, similar to the experimental conditions, and to allow water to flow through the channel (Figure 4c). Furthermore, the flow depths determined for the experimental conditions were set as initial conditions within the fluid domain.
FLOW-3D optimizes the time step during the simulation to ensure the Courant number stability condition is less than 1. In this study, the time step for all models was calculated to be 0.014 s on average, and hence, the Courant numbers were observed to be 0.130 on average, which means that all solutions were numerically stable. Additionally, all models employed convergence criteria of approximately 10−4 for maximum pressure residual. In FLOW-3D, pressure and velocity were calculated using continuity and momentum equations with first-order approximation. The pressure solver type was specified as implicit and performed using the Improved Generalized Minimal Residual (GMRES) as an iterative method for the numerical solution. Therefore, the solution was performed by controlling time steps, using double precision for numerical accuracy, and considering stability and convergence conditions. FLOW-3D performs transient solution. The simulation times were set to average 450 s, and although it varies for different cases, the steady state generally started to be observed after 350 s. However, in order to reach the final results, the solutions were tracked on the graph and observed until the flow conditions were steady in this study. For this purpose, it was also controlled that the flow depth in the channel, the depth-averaged velocity, mean kinetic energy, and the volume of fluid in the fluid domain were constant.
4. Results and Discussions
In this study, the initial focus was on experimentally investigating the hydrodynamic behavior within the meandering channel. At the same time, it aimed to validate the numerical model with the data obtained from the experimental model. Hence, nine different cases were investigated both experimentally and numerically using the same physical parameters (Table 1). These parameters, measured at 13 different locations, as shown in Figure 1, along the channel, are flow depth, velocity components in the -x, -y, and -z directions, streamwise velocity profile, depth-averaged velocity, bed shear stress associated with friction velocity, and turbulence kinetic energy related to velocity fluctuations in the -x, -y, and -z directions.
4.1. Experimental Observation
Figure 6 shows the relationship between dimensionless discharge versus dimensionless depth-averaged velocity. Here, Ud is the depth-averaged velocity, is the friction velocity, and Q(gH5)−0.5 is the dimensionless discharge. In Section A-A, the velocity difference between the inner and outer bend increased significantly in favor of the inner bend with increasing dimensionless discharge. In the section where the flow felt the first bend in Section A-A, the flow velocities increased toward the inner bend. This shows a similar result to previous experimental studies [1,7]. In other words, the flow acceleration increased on the inner surface of the bend. This is considered to be due to the pressure drop. In Section B-B, the velocity increment in the inner bend decreased. In contrast, the velocity in the middle of the section and the velocity in the outer bend increased considerably with the same trend. Therefore, velocities are lower in the inner bend and higher in the middle and outer bend of the section. In Section C-C, it was observed that the velocities were slightly higher at the outer bend than in the middle of the section. However, the lowest velocities are recorded in the inner bend, with a similar increasing trend to that in the outer bend and the middle of the section. In Section, D-D, the highest velocities were observed in the inner bend and the lowest in the outer bend for each experimental condition. The increasing trends for each point in Section D-D were the same. It can be stated that as the flow in a meandering channel courses from the upstream to the downstream along the meanders, the difference in velocity between the inner and outer bends becomes more pronounced. In addition, it is seen that the velocities tend to increase slightly downstream as all sections are considered.
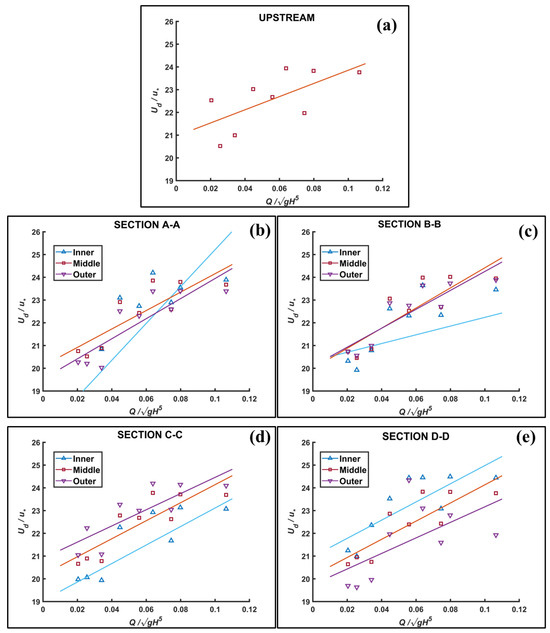
Figure 6.
Dimensionless depth-averaged velocity: (a) Upstream, (b) Section A-A, (c) Section B-B, (d) Section C-C, (e) Section D-D.
Figure 7 shows the location and maximum velocities at each section of the meandering channel for all cases and the path of the maximum unit discharge along the meandering channel. Maximum velocities appear to occur on the shortest route along the meandering channel, regardless of flow conditions. The latter, as soon as the flow enters the channel meanders, the maximum streamwise velocity is shifted from the inner bank to the outer bank due to the effect of secondary flow and lateral momentum [6]. In this study, this is particularly observed with increasing dimensionless discharge. Vectorial velocity contours were generated at each cross-section using the velocity components from the ADV measurements to investigate secondary flow formation. However, due to the insufficient number of ADV measurement points in each cross-sectional area, the secondary flows could not be adequately captured and observed. Consequently, these results were not included in the findings of this study.
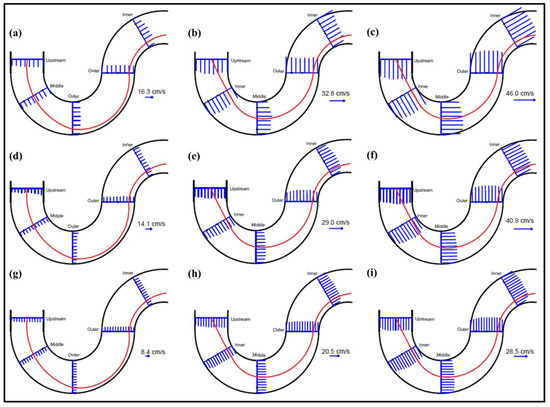
Figure 7.
Maximum streamwise velocity profiles along the depth (blue) and maximum unit discharge line (red) along the channel: (a–i) Cases 1–9, respectively.
As seen in Cases Q16H15, Q16H20, and Q50H20, for lower dimensionless discharges, the maximum velocity and unit discharge were observed in the middle of the first bend and then moved laterally to the outer due to centrifugal force. However, with the increase in the dimensionless discharge, as seen in other cases, the maximum velocity and unit discharge were observed in the first bend and moved laterally again.
Figure 8 displays the relationship between dimensionless discharge versus dimensionless bed shear stress. Here, is the friction velocity, is the bed shear stress, and S is the average slope of the meandering channel. As seen here, a behavior similar to the dimensionless velocity changes is observed in each cross-section. However, the difference in bed shear stress between the inner and outer bend in each cross-section becomes more significant as the dimensionless discharges increase. Similarly, this difference increases as the flow progresses along the sections in the channel. The increase in bed shear stress in the meandering channel can affect the critical shear stress and cause scour and accumulation around the riverbanks.
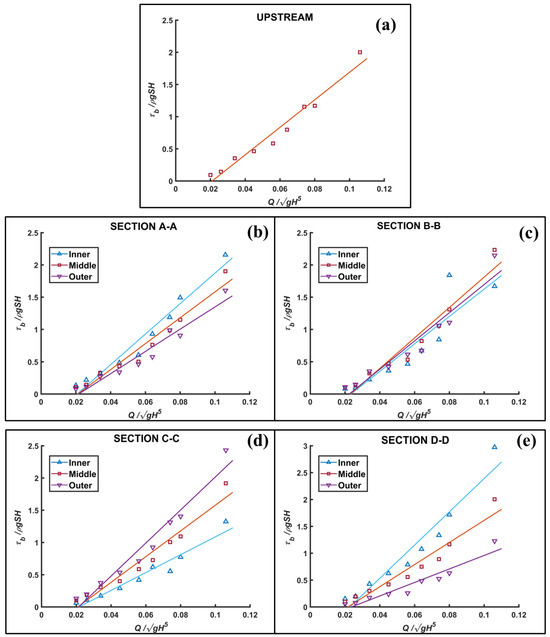
Figure 8.
Dimensionless bed shear stress: (a) Upstream, (b) Section A-A, (c) Section B-B, (d) Section C-C, (e) Section D-D.
The analysis reveals that the most notable differences occur in sections C-C and, particularly, D-D in terms of the velocities and bed shear stresses. It is concluded here that hydrodynamic changes occur in the structure of the flow in the channel due to the effect of centrifugal force with the sudden change in the bends. Consequently, this means that the flow can cause considerable morphological changes in a meandering channel after passing the first half bend.
4.2. Validation
The depth-averaged velocity, streamwise velocity profiles, and friction velocity parameters obtained from the nine cases in the experimental study were considered to validate the CFD model. Mean Absolute Relative Error (MARE, %) and Root Mean Square Error (RMSE) were used to evaluate the results (Equations (2) and (3), respectively). In this study, the CFD model was evaluated not only using error measurement but also graphically and in terms of predicting maximum and minimum values. In other words, both qualitative and quantitative assessments were performed. The error bars of the results obtained from FLOW 3-D calculated based on the results of the experimental models are given in Figure 9. Each physical parameter of the flow in the meandering channel will be discussed in detail below to validate the CFD model.
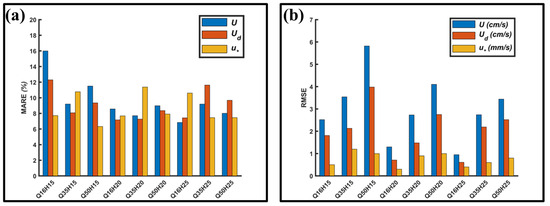
Figure 9.
Error measurements for the validation of the CFD model: (a) MARE (%), (b) RMSE.
4.2.1. Water Depth
In the experimental and numerical study, the flow depth set as the inlet condition at the upstream did not show a remarkable change along the channel. As expected, small fluctuations on the water surface can be observed with increasing discharge, especially in bends. According to the measurements, the water surface along the channel may show instantaneous differences of approximately 6.2/1000 for the experimental model and approximately 1.2/1000 for the numerical model (Figure 10). The fact that the flow depths do not change along the channel indicates that the flow is steady in the CFD model.
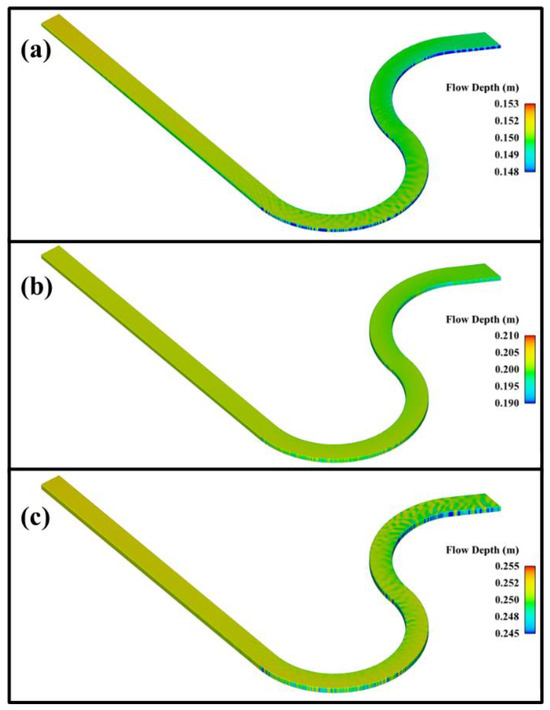
Figure 10.
Flow depths obtained using FLOW-3D: (a) H = 0.15 m, (b) H = 0.2 m, and (c) H = 0.25 m.
4.2.2. Depth-Averaged Velocity
Figure 11 shows the comparison of depth-averaged flow velocities obtained from the numerical and experimental models for each cross-section. The results of the numerical model and the experimental model were compared, and they were very close to each other for all cases. However, it is observed that the difference between the inner and outer bend observed in the experimental study was more pronounced than in the numerical model. In other words, the depth-averaged velocity difference between the inner and outer bend was smaller in the numerical model. The errors of depth-averaged velocity for all CFD models were calculated as shown in Figure 9. For MARE, the highest error was 12.3% for Case Q16H15, and the lowest error was 7.2% for Case Q16H20. For RMSE, the highest error was for Case Q50H15, with 4 cm/s, and the lowest error was for Case Q16H25, with 0.6 cm/s. Figure 12 gives more insight into velocity magnitudes in the meandering channel. For each case, maximum velocities were observed in the same sections and regions as in the experimental study. In all cases, the region where the velocity reached its maximum was the fourth cross-section D-D, which was located after crossing a half bend. Moreover, minimum velocities were observed in the same section at the outer bend. In addition to the experimental study, FLOW-3D results also show a tendency to increase the velocity of the flow before entering the first bend (Section A-A). For all cases in both the experimental and numerical model, the depth-averaged velocity increased by 30% on average from the inner bend of the first meander at 180° angle to the inner bend of the second meander at 120° angle.
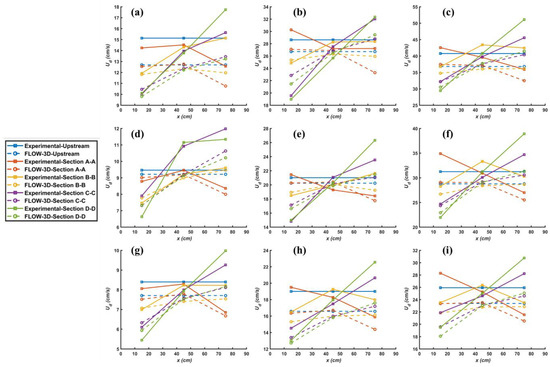
Figure 11.
Depth-averaged velocities: (a–i) Cases 1–9, respectively.
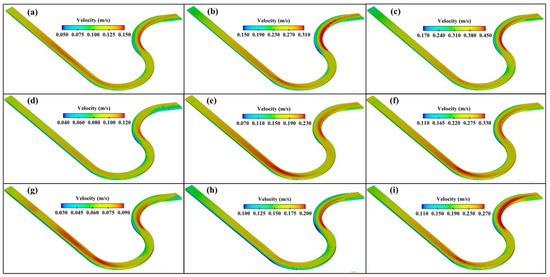
Figure 12.
Velocity magnitudes obtained using FLOW-3D: (a–i) Cases 1–9, respectively.
4.2.3. Velocity Profiles
Figure 13 illustrates a comparison of the velocity profile in the locations of all measurements and for all cases. The depth at which the maximum velocity occurs varies continuously in the inner and outer bend at each cross-section for different dimensionless discharges. Therefore, it is not possible to discuss a specific trend. As a result, besides the discharge variation, the other factor affecting the maximum velocity depth is considered to be the channel geometry. In the river environment, this means that it is relevant to river sinuosity and curvature. Two consecutive abrupt meander changes along the channel can change the maximum velocity depths for different dimensionless discharges.
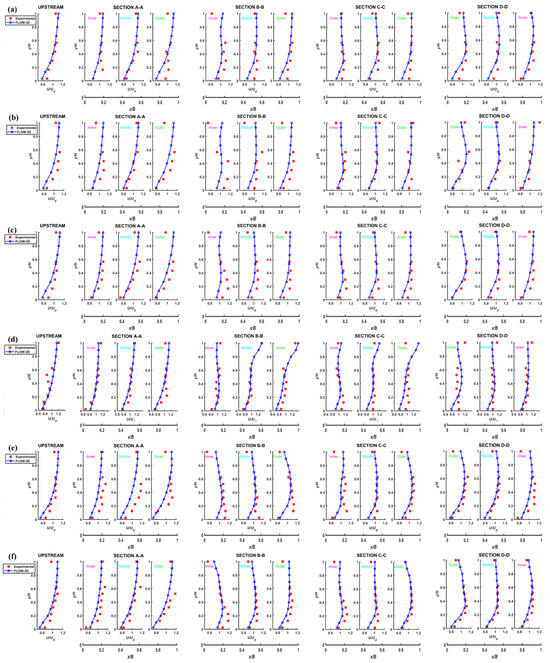
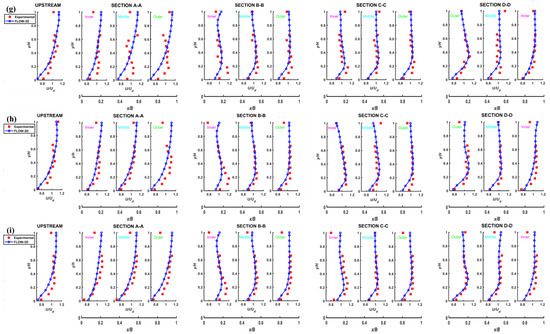
Figure 13.
Dimensionless velocity profiles: (a–i) Cases 1–9, respectively.
It is obvious that the study of flow in a meandering channel is more complex. The velocity distribution varies with different width-to-depth ratios for a straight open channel, but in a meandering channel, the velocity distribution also depends on other parameters, such as aspect ratio, sinuosity, etc. [32]. The flow in meandering channels behaves differently than in a straight channel due to the influence of curvilinear properties. The lateral momentum or transverse mass transfer dominates, even if it is small compared with the longitudinal mass transfer.
The errors of velocity profiles for all CFD models were also calculated, as shown in Figure 9. For MARE, the highest error was 16% for model 1, and the lowest error was 6.8% for model 7. For RMSE, the highest error was for model 3, with 3.5 cm/s, and the lowest error was for model 7, with 1 cm/s.
Although the data analysis was performed for raw data from ADV measurement, small anomalies in the velocity profile along the depth compared with the numerical model may occur due to the experimental environment. This may lead to some marginal and small differences in the comparison of velocity profiles obtained from the experimental and the numerical model, as in this study. These anomalies were often seen in the estimation of surface velocities. Nevertheless, FLOW-3D performed quite successfully in detecting the shape of the velocity profile and the maximum and minimum velocity locations along the depth. In light of all these results, it can be concluded that the numerical model generated with FLOW-3D is a very useful tool and a pragmatic approach for estimating velocities for meandering channels. This is particularly the case given that setting up an experimental setup is costly and time-consuming. It even provides a more probable and more acceptable velocity distribution than the experimental results for the study of hydrodynamics in meandering rivers.
4.2.4. Bed Shear Stress and Friction Velocity
The bed shear stress obtained with FLOW-3D resembles the distribution obtained from the experimental model, as seen in Figure 14. Here again, the most critical region starts after the flow crosses the first half bend in the meandering channel. In this critical region where Section D-D is located, the bed shear stress increased excessively for each case in the inner bend and decreased in the outer bend. A similar increasing trend in the bed shear stress was also observed in the inner bend of Section C-C. This high amount of bed shear stress is a very important scientific result as it will cause erosion around the river and affect the geomorphological structure of the meandering channel. At the same time, lower bed shear stress occurred in the outer bend as opposed to the high bed shear stress observed in the inner bend of section D-D. A similar pattern was also observed on the outside of the first bend as the effect of the first curvature was felt. This will lead to deposition, in other words, point bars, in these regions of the meandering channel. For all cases in both the experimental and numerical model, the bed shear stress increased by 10% on average from the inner bend of the first meander at 180° angle to the inner bend of the second meander at 120° angle. The estimation of bed shear stress with a validated CFD model is very important for investigating the changes that may occur and affect the environment in the related meandering river.
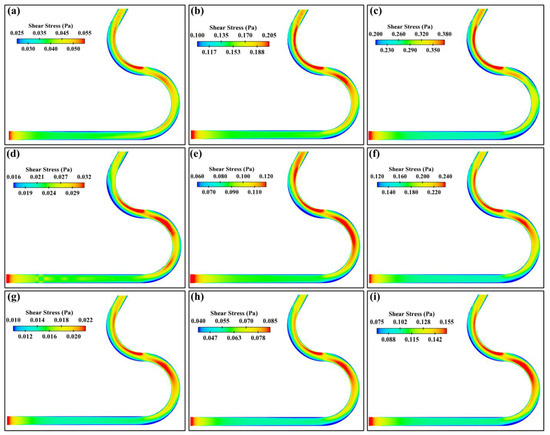
Figure 14.
Bed shear stress obtained from FLOW-3D: (a–i) Cases 1–9, respectively.
In this study, the friction velocity parameter was also used to validate the CFD model and to interpret the hydrodynamic characteristics of the flow. The relationship between friction velocity and bed shear stress is given in the most general form in Equation (4).
where is the friction velocity, τb is the bed shear stress, and is the density of water.
The errors of friction velocity for all CFD models were also calculated, as shown in Figure 9. For MARE, the highest error was 11.4% for model 5, and the lowest error was 6.3% for model 3. For RMSE, the highest error was for model 2 with 1.2 mm/s, and the lowest error was for model 4 with 0.3 mm/s. FLOW-3D exhibited a lower error rate for the friction velocity than the other parameters. Thus, the conclusion was reached that it is quite successful in modeling the friction velocity and the associated bed shear stress.
4.2.5. Turbulence Kinetic Energy
In this study, the last parameter studied to understand the flow behavior in the meandering channel is the Turbulence Kinetic Energy (Figure 15). The equation of the kinetic energy of turbulence in terms of the average of the fluctuations of the velocity components is given in general form in Equation (5).
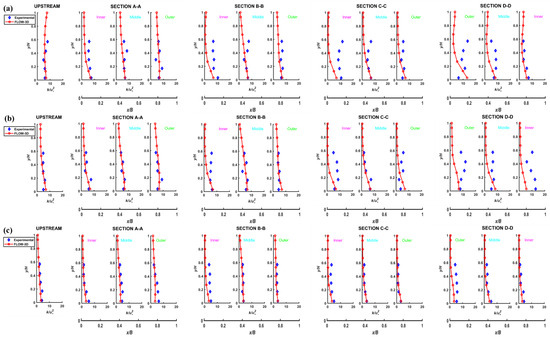
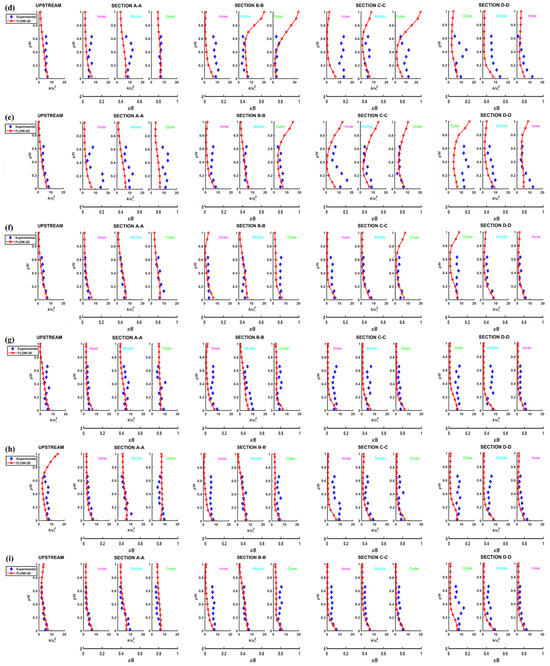
Figure 15.
Dimensionless turbulence kinetic energy: (a–i) Cases 1–9, respectively.
Here, k is the turbulence kinetic energy, and u’, v’, and w’ represent the fluctuations of velocity components in -x, -y, and -z directions, respectively.
For Case Q50H15, where the dimensionless discharge was the highest, the CFD results showed the best fit according to the experiment results. Unfortunately, as with the above-mentioned velocity profiles, there are some deviations at some points due to anomalies caused by ADV measurement techniques, which affect the turbulence in the velocity components. However, it should be noted that due to the RANS turbulence model (RNG) used, FLOW-3D can model turbulence very successfully close to the wall but not in the middle of the flow. However, it should be noted here that the main reason for these deviations toward the middle of the flow is the various vortices and eddies formed in the cross-section of the flow and due to the geometry of the meandering channel. In other words, it is a natural part of secondary flow. This situation is especially observed as the current moves along the meanders and enters into the effect of centrifugal and lateral momentum transfer as expected. For this reason, error analysis was not performed for the turbulence kinetic energy parameter in this study. Nevertheless, the CFD model gave a general prediction and good agreement for the regions near the wall, especially in understanding the sediment transport in the meandering channel.
For each test condition, turbulence kinetic energy peaks suddenly in the middle of the flow along the depth, in the region where the velocity is highest, that is, in the inner bend of Section D-D. This indicates that the flow may form a separation zone with increasing velocities after passing a half bend.
While this situation was observed in the experimental study, it could not be observed in the results obtained in the numerical model. Turbulence kinetic energy increases toward the water surface just as in sections B-B and C-C for Case Q16H20 and Q35H20, as well as in the upward direction in Case Q35H25. This situation indicates the possible formation of instantaneous small eddies on the water surface. This formation was only seen in the numerical model and could not be compared with the experimental model results due to the limitations of ADV measurement techniques.
5. Conclusions
In this study, experimental and numerical studies were performed to understand the flow behavior in the meandering channel. Using dimensionless discharge, nine different cases were defined. The same conditions were performed in both numerical and experimental models.
In accordance with the studies in the literature, it is observed that the secondary flow is formed as a result of the centrifugal force and lateral momentum transfer, which starts to be effective when the flow in the meander channel feels the first meander effect and as a result of this, it is observed that it moves out of the meander due to the increasing dimensionless discharge. The velocity compared with the upstream increased in all cases as it passed the following bends. It has been observed that the flow changes after passing the first half bend, which has critical consequences in a meandering channel. Considering all cases in the numerical and experimental model, it was observed that the velocity increased by 30% on average from the inner bend of the first meander of 180° angles to the inner bend of the second meander of 120° angles. Toward the inside of the following opposite-directed meander, the velocity increased, and the bed shear stress increased. However, the bed shear stress increased by a smaller amount, approximately 10%.
In addition, the turbulence kinetic energy increased, and eddies started to form around the center of the flow, and separation zones were formed. On the other hand, in the same cross-section, the flow velocity decreased in the outer bend, and the bed shear stress decreased extremely. It was found that the flow behavior in the channel became more definable with the increase in the dimensionless discharge. These findings will contribute to the studies on the meandering channel morphology.
The parameters of flow depth, depth-averaged velocity, velocity distribution, bed shear stress, friction velocity, and turbulence kinetic energy were used to evaluate the CFD model qualitatively and quantitatively. The CFD model results using FLOW-3D provided a good agreement with the experimental data. In this study, the CFD model has a fairly low error in estimating the depth average velocity along the channel, velocity profiles along the depth, and friction velocity. It also determined the minimum and maximum data points, allowing the determination of critical regions along the meandering channel. Considering the costly, time-consuming, and data acquisition limitations of the experimental system, FLOW-3D is more suitable to investigate the hydrodynamic variation of the flow in the meandering channel.
Author Contributions
Conceptualization, C.Y. and H.A.A.G.; methodology, C.Y. and H.A.A.G.; software, C.Y.; validation, C.Y.; formal analysis and investigation, C.Y.; writing—original draft preparation, C.Y.; writing—review and editing, H.A.A.G.; visualization, C.Y.; supervision, H.A.A.G.; project administration, H.A.A.G.; funding acquisition, C.Y. and H.A.A.G. All authors have read and agreed to the published version of the manuscript.
Funding
This study was supported by Scientific and Technological Research Council of Turkey (TUBITAK) under the Grant Number 121M858. The authors thank to TUBITAK for their supports. Cem Yılmazer would like to thank the Council of Higher Education of Turkey (YOK) for the YOK 100/2000 Ph.D. Scholarship.
Data Availability Statement
The data will be made available upon request.
Conflicts of Interest
The authors declare no conflicts of interest.
Correction Statement
This article has been republished with a minor correction to the Funding statement. This change does not affect the scientific content of the article.
References
- Pradhan, A.; Kumar Khatua, K.; Sankalp, S. Variation of Velocity Distribution in Rough Meandering Channels. Adv. Civ. Eng. 2018, 2018, 1–12. [Google Scholar] [CrossRef]
- Rozovskii, I.L. Flow of Water in Bends of Open Channels; Prushansky, Y., Translator; 1961 Israel Program for Scientific Translations; S. Monson, Jerusalem, PST Catalog No. 363; Academy of Science of the Ukrainian SSR, Institute of Hydrology and Hydraulic Engineering: Kiev, Ukrainian, 1957. [Google Scholar]
- Christensen, B.; Gislason, K.; Fredsoe, J. Secondary turbulent flow in an infinite bend. In I.A.H.R. Symposium on River, Coastal and Estuarine Morphodynamics; University of Genova, Department of Environmental Engineering: Genova, Italy, 1999; Volume 1, pp. 543–553. [Google Scholar]
- Blanckaert, K.; Graf, W.H. Mean flow and turbulence in an open-channel bend. J. Hydraul. Eng. 2001, 127, 835–847. [Google Scholar] [CrossRef]
- Blanckaert, K.; Graf, W.H. Experiments on flow in a strongly curved channel bend. In Proceedings of the 29th International Association of Hydraulic Engineering and Research (IAHR) Congress, Beijing, China, 16–21 September 2001; pp. 371–377. [Google Scholar]
- Blanckaert, K.; De Vriend, H.J. Secondary flow in sharp open-channel bends. J. Fluid Mech. 2004, 498, 353–380. [Google Scholar] [CrossRef]
- Blanckaert, K. Saturation of curvature-induced secondary flow, energy losses, and turbulence in sharp open-channel bends: Laboratory experiments, analysis, and modeling. J. Geophys. Res. 2009, 114, F03015. [Google Scholar] [CrossRef]
- Dombroski, D.E.; Crimaldi, J.P. The accuracy of acoustic Doppler velocimetry measurements in turbulent boundary layer flows over a smooth bed. Limnol. Oceanogr. Methods 2007, 5, 23–33. [Google Scholar] [CrossRef]
- Ferguson, R.I.; Parsons, D.R.; Lane, S.N.; Hardy, R.J. Flow in meander bends with recirculation at the inner bank. Water Resour. Res. 2003, 39, 1322. [Google Scholar] [CrossRef]
- Frothingham, K.M.; Rhoads, B.L. Three-dimensional flow structure and channel change in an asymmetrical compound meander loop, Embarras River, Illinois. Earth Surf. Process. Landf. 2003, 28, 625–644. [Google Scholar] [CrossRef]
- Sukhodolov, A.N. Structure of turbulent flow in a meander bend of a lowland river. Water Resour. Res. 2012, 48, W0151. [Google Scholar] [CrossRef]
- Sahoo, S.; Sharma, A. Turbulent flow mechanisms in meandering channels with sediment transport. Water Pract. Technol. 2023, 18, 484–500. [Google Scholar] [CrossRef]
- Ishigaki, T.; Shiono, K.; Rameshwaran, P. PIV and LDA measurements of secondary flow in a meandering channel for overbank flow. J. Vis. 2002, 5, 153–159. [Google Scholar] [CrossRef]
- Bai, R.; Zhu, D.; Chen, H.; Li, D. Laboratory study of secondary flow in an open channel bend by using PIV. Water 2019, 11, 659. [Google Scholar] [CrossRef]
- Fargue, L. Etude sur la correlation entre la configuration du lit et la profondeur d’eau dans les rivières a fond mobile. Ann. Ponts Chaussées 1868, 38, 34–92. [Google Scholar]
- Thomson, W.V. On the origin of windings of rivers in alluvial plains, with remarks on the flow of water round bends in pipes. Proc. R. Soc. Lond. 1876, 25, 5–8. [Google Scholar] [CrossRef]
- Dietrich, W.E.; Smith, J.D. Influence of the point bar on flow through curved channels. Water Resour. Res. 1983, 19, 1173–1192. [Google Scholar] [CrossRef]
- Nelson, J.M.; Smith, J.D. Evolution and stability of erodible channel beds. River Meand. 1989, 12, 321–377. [Google Scholar] [CrossRef]
- De Vriend, H.J.; Geldof, H.J. Main flow velocity in short and sharply curved river bends. Commun. Hydraul. 1983, 6. [Google Scholar]
- Gu, L.; Zhang, S.; He, L.; Chen, D.; Blanckaert, K.; Ottevanger, W.; Zhang, Y. Modeling flow pattern and evolution of meandering channels with a nonlinear model. Water 2016, 8, 418. [Google Scholar] [CrossRef]
- Abad, J.D.; García, M.H. Hydrodynamics in Kinoshita-generated meandering bends: Importance for river-planform evolution. In Proceedings of the 4th IAHR Symposium on River, Coastal and Estuarine Morphodynamics, Urbana, IL, USA, 4–7 October 2005; pp. 761–771. [Google Scholar] [CrossRef]
- Park, S.W.; Ahn, J. Experimental and numerical investigations of primary flow patterns and mixing in laboratory meandering channel. Smart Water 2019, 4, 1–15. [Google Scholar] [CrossRef]
- Olsen, N.R.B. Three-dimensional CFD modeling of self-forming meandering channel. J. Hydraul. Eng. 2003, 129, 366–372. [Google Scholar] [CrossRef]
- Scurlock, S.M.; Cox, A.L.; Baird, C.L.; Thornton, C.I.; Abt, S. Hybrid Hydraulic Modeling of River-Training Structures in Sinuous Channels; Bureau of Reclamation Technical Service Center: Denver, CO, USA, 2015. [Google Scholar]
- Maurya, O.P.; Nandi, K.K.; Modalavalasa, S.; Dutta, S. Flow Hydrodynamics Influences due to Flood Plain Sand Mining in a Meandering Channel. In North-East Research Conclave; Springer: Singapore, 2022; pp. 245–251. [Google Scholar] [CrossRef]
- Li, G.; Lang, L.; Ning, J. 3D Numerical simulation of flow and local scour around a spur dike. In Proceedings of the 35th IAHR World Congress, Chengdu, China, 8–13 September 2013; pp. 1–9. [Google Scholar] [CrossRef]
- Shen, J. Discharge Characteristics of Triangular-Notch Thin Plate Weirs: Studies of Flow of Water over Weirs and Dams; Geological survey water-supply paper, 1617-B.; U.S. Government Printing Office: Washington, DC, USA, 1981.
- Nortek AS. The Comprehensive Manual for Velocimeters; Nortek AS: Vangkroken, Norway, 2018. [Google Scholar]
- Flow Science. FLOW-3D User Manual; Flow Science, Inc.: Santa Fe, NM, USA, 2019. [Google Scholar]
- Hirt, C.W.; Sicilian, J.M. A porosity technique for the definition of obstacles in rectangular cell meshes. In Proceedings of the 4th International Conference on Numerical Ship Hydrodynamics, Washington, DC, USA, 24–27 September 1985. [Google Scholar]
- Yakhot, V.; Orszag, S.A.; Thangam, S.; Gatski, T.B.; Speziale, C.G. Development of turbulence models for shear flows by a double expansion technique. Phys. Fluids A Fluid Dyn. 1992, 4, 1510–1520. [Google Scholar] [CrossRef]
- Jha, R.; Singh, V.P.; Singh, V.; Roy, L.B.; Thendiyath, R. River Hydraulics, Hydraulics, Water Resources and Coastal Engineering; Springer: Berlin/Heidelberg, Germany, 2022. [Google Scholar]
Disclaimer/Publisher’s Note: The statements, opinions and data contained in all publications are solely those of the individual author(s) and contributor(s) and not of MDPI and/or the editor(s). MDPI and/or the editor(s) disclaim responsibility for any injury to people or property resulting from any ideas, methods, instructions or products referred to in the content. |
© 2024 by the authors. Licensee MDPI, Basel, Switzerland. This article is an open access article distributed under the terms and conditions of the Creative Commons Attribution (CC BY) license (https://creativecommons.org/licenses/by/4.0/).