Technical Note

Reach-Based Extrapolation to Assess the Ice-Jam Flood Hazard of an Ungauged River Reach along the Mackenzie River, Canada

1
Global Institute for Water Security, School of Environment and Sustainability, University of Saskatchewan, Saskatoon, SK S7N 3H5, Canada
2
Water Monitoring and Stewardship Division, Environment and Climate Change, Government of the Northwest Territories, Yellowknife, NT X1A 3S8, Canada
*
Author to whom correspondence should be addressed.
Water 2024, 16(11), 1535; https://doi.org/10.3390/w16111535
Submission received: 4 April 2024 / Revised: 5 May 2024 / Accepted: 16 May 2024 / Published: 27 May 2024

Abstract

:
Many communities along rivers in the Northwest Territories do not have water-level gauges, making flood hazard analyses difficult at these sites. These include the communities of Jean Marie River, Tulita and Fort Good Hope on the Mackenzie River, Nahanni Butte on the Liard River and Fort McPherson on the Peel River. However, gauges do exist at other sites upstream and downstream of these communities, from which flood hazard assessments can be extrapolated to the ungauged communities. Reach-based extrapolation becomes particularly challenging when analysing ice-jam flood hazards since data sparsity is an additional challenge at these locations. A simple empirical approach using non-dimensional stage and discharge was implemented, which allowed only a minimum of the required data from all sites to be extracted. From the gauged sites, water-surface elevations and slopes from digital elevation models, channel widths, thalweg elevations and ice thicknesses from under-ice flow measurement surveys and recorded water levels were obtained. As a test case, results from the gauged reach of Fort Simpson were extrapolated to the ungauged reach of Jean Marie River and are presented in this technical note.

1. Introduction

Flood hazard maps are crucial for assessing the vulnerability of riverside communities to flooding. In Canada, many of the flood hazard assessments require updating and revising. This is particularly the case when a more severe flood event than the ones used for the flood hazard assessment has occurred, requiring the current assessments to be updated. For instance, the town of Peace River updated its flood hazard mapping and guidelines several times after extreme flood events that were more severe than any previous flood on record, which resulted in increasing the height of the town’s dikes [1]. Similarly, the Government of Newfoundland and Labrador keeps a list of the communities that require updated or new flood hazard assessments. Those communities whose flood hazard assessments and mapping are more than 10 years old are given priority [2]. The EU Floods Directive also mandates its member states to renew their flood hazard and risk assessments with new maps every 6 years [3] (paragraph adapted from Chapter 10 of [4]).
To help governments, communities, and individuals cope with flood risks and reduce flood damages, high quality flood mapping that is up-to-date and easy to access is needed. That is the goal of the Flood Hazard Identification and Mapping Program (FHIMP), which is working to improve Canada’s existing flood mapping capabilities. The FHIMP, in collaboration with provincial and territorial governments, lays out a plan to produce and share flood hazard maps of the most flood-prone areas in Canada. These maps will guide decision-making in areas such as land-use planning, flood mitigation, climate-change adaptation, resilience building, and the safeguarding of lives and properties.
FHIMP aims to produce flood maps for the areas with high flood risk, in collaboration with Natural Resources Canada (NRCan), Environment and Climate Change Canada (ECCC) and Public Safety Canada (PSC), as well as the territorial Government of the Northwest Territories (GNWT). The GNWT is currently working on new flood maps for several communities in the Northwest Territories that are prone to riverine flooding. These communities are Jean Marie River, Fort Liard, Nahanni Butte, Tulita, Fort Good Hope, and Fort McPherson. With the exception of Fort Liard, these communities do not have gauges or sufficient gauge records in order for flood risk hazard assessments to be carried out. An important foundation of these assessments is the derivation of stage frequency distributions which traditionally require longer series of water-level data. Gauges do exist in other riverside communities; however, they are located many kilometres upstream and/or downstream of the ungauged communities. For most sites, ice-related flood hazards are higher than open-water flood hazards, hence, only the former will be focused on in this study. Using the gauged/ungauged reaches of Fort Simpson/Jean Marie River, it is the aim of this research to explore a novel methodology of extrapolating the ice-jam flood hazard information from the gauged reaches to the ungauged reaches of the same river systems. This form of reach-based extrapolation is a novel method The method allows estimates of ice-related water levels to be made for annual exceedance probabilities (AEP) of 0.2%, 0.5%, 1%, 2%, 5%, 10%, 20% and 50%.
“Since most systematic information consists of ice-related water levels at one location … there is a need to generalize water levels throughout the reach of interest by extrapolation upstream and downstream from the locations of known water levels” [5]. “This can be done in a variety of ways, which range in complexity from a simple uniform slope calculation using a known open water slope, to a non-uniform hydraulic modelling analysis that can account for changes in cross-section shape and a non-uniform channel slope” [6]. However, these methods may be difficult to implement if the distances along the river between the gauged and ungauged reaches are large (many tens of kilometers up to over 100 km) or if cross-sections of the reaches are not available. Hence, a novel method is proposed here that still allows reach-based extrapolation to be carried out between reaches that are far apart and have very sparse data sets for ice-jam flood hazard estimation.

2. Methodology

2.1. Ice-Jam Flood Frequency Analysis

To determine the ice-jam flood levels and extents at a gauge location, hydrologic procedures from engineering analysis were applied. According to federal guidelines [5,6], the water level for identifying flood hazard areas should correspond to a flood that has a theoretical or historical basis of having a 1% chance of being exceeded in any year (a 100-year return period). Flood frequency analysis (FFA) is a type of hydrologic procedure that uses the statistical characteristics of a past flood record to establish the connection between water-level elevations (particularly important for ice-induced floods) and the exceedance probability at a specific site (adapted from [5]).
The challenge arises, though, if the FFA is to be carried out at a location situated far from a gauge. FFAs derived from the gauge data need to be extrapolated to the remote area of interest through a method coined reach-based extrapolation [5,6]. Such a regionalised approach is not pursued in the context of river hydraulics alone, because the hydraulics of a river section without gauges can be estimated by extending a hydraulic model of a section with gauges, based on the data of discharge, water level and flood extent along the river. This works well for open-water flows, where discharge and water levels generally have a deterministic relationship. However, for river ice-jam hydraulics, these relationships are more chaotic in nature. For instance, water level elevations depend not only on the discharge amount, but also on other factors like the morphology of ice jams, the location of ice-jam lodgements and the properties of the ice. Therefore, it makes sense to apply parameterisations from gauged to ungauged river sections where ice-jam flooding occurs by transferring data recorded at the gauges, situated upstream or downstream of the ungauged sections, to the ungauged sections that are of interest. Because of the random nature of ice jams, the frequency distributions of the parameters and boundary conditions, rather than their individual values, should be transferred to the ungauged section to estimate its ice hydraulics. The methodology has been applied to the North Saskatchewan River at an ungauged site approximately 40 km downstream of the gauge at Prince Albert and on the Athabasca River at Fort McKay (with only 6 years of open-water gauge recordings) situated approximately 50 km downstream of Fort McMurray (with 60 years of flow and water level data acquired during ice-induced seasons) (adapted from Chapter 12 of [4]).
In this study, not a numerical modelling, but rather an empirical approach will be used to calculate equilibrium ice-jam backwater levels. The analytical method stems from Beltaos [7,8] and has been extended by Lindenschmidt (Chapter 4 in [9]) in an ice-jam flood-forecasting context. Referring to Figure 1 from a dimensional analysis perspective, the dimensionless discharge ξ and dimensionless ice-jam stage η can be determined as follows:
ξ = Q W 2 g S 1 / 3 W S
η = H W S
where g is the gravitational acceleration (m/s2), H is the backwater staging depth (m), Q is the discharge (m3/s), S is the slope (-) and W is the river width (m).
Rearranging Equation (2) so that H is a function of η, W and S yields
H = η · W · S
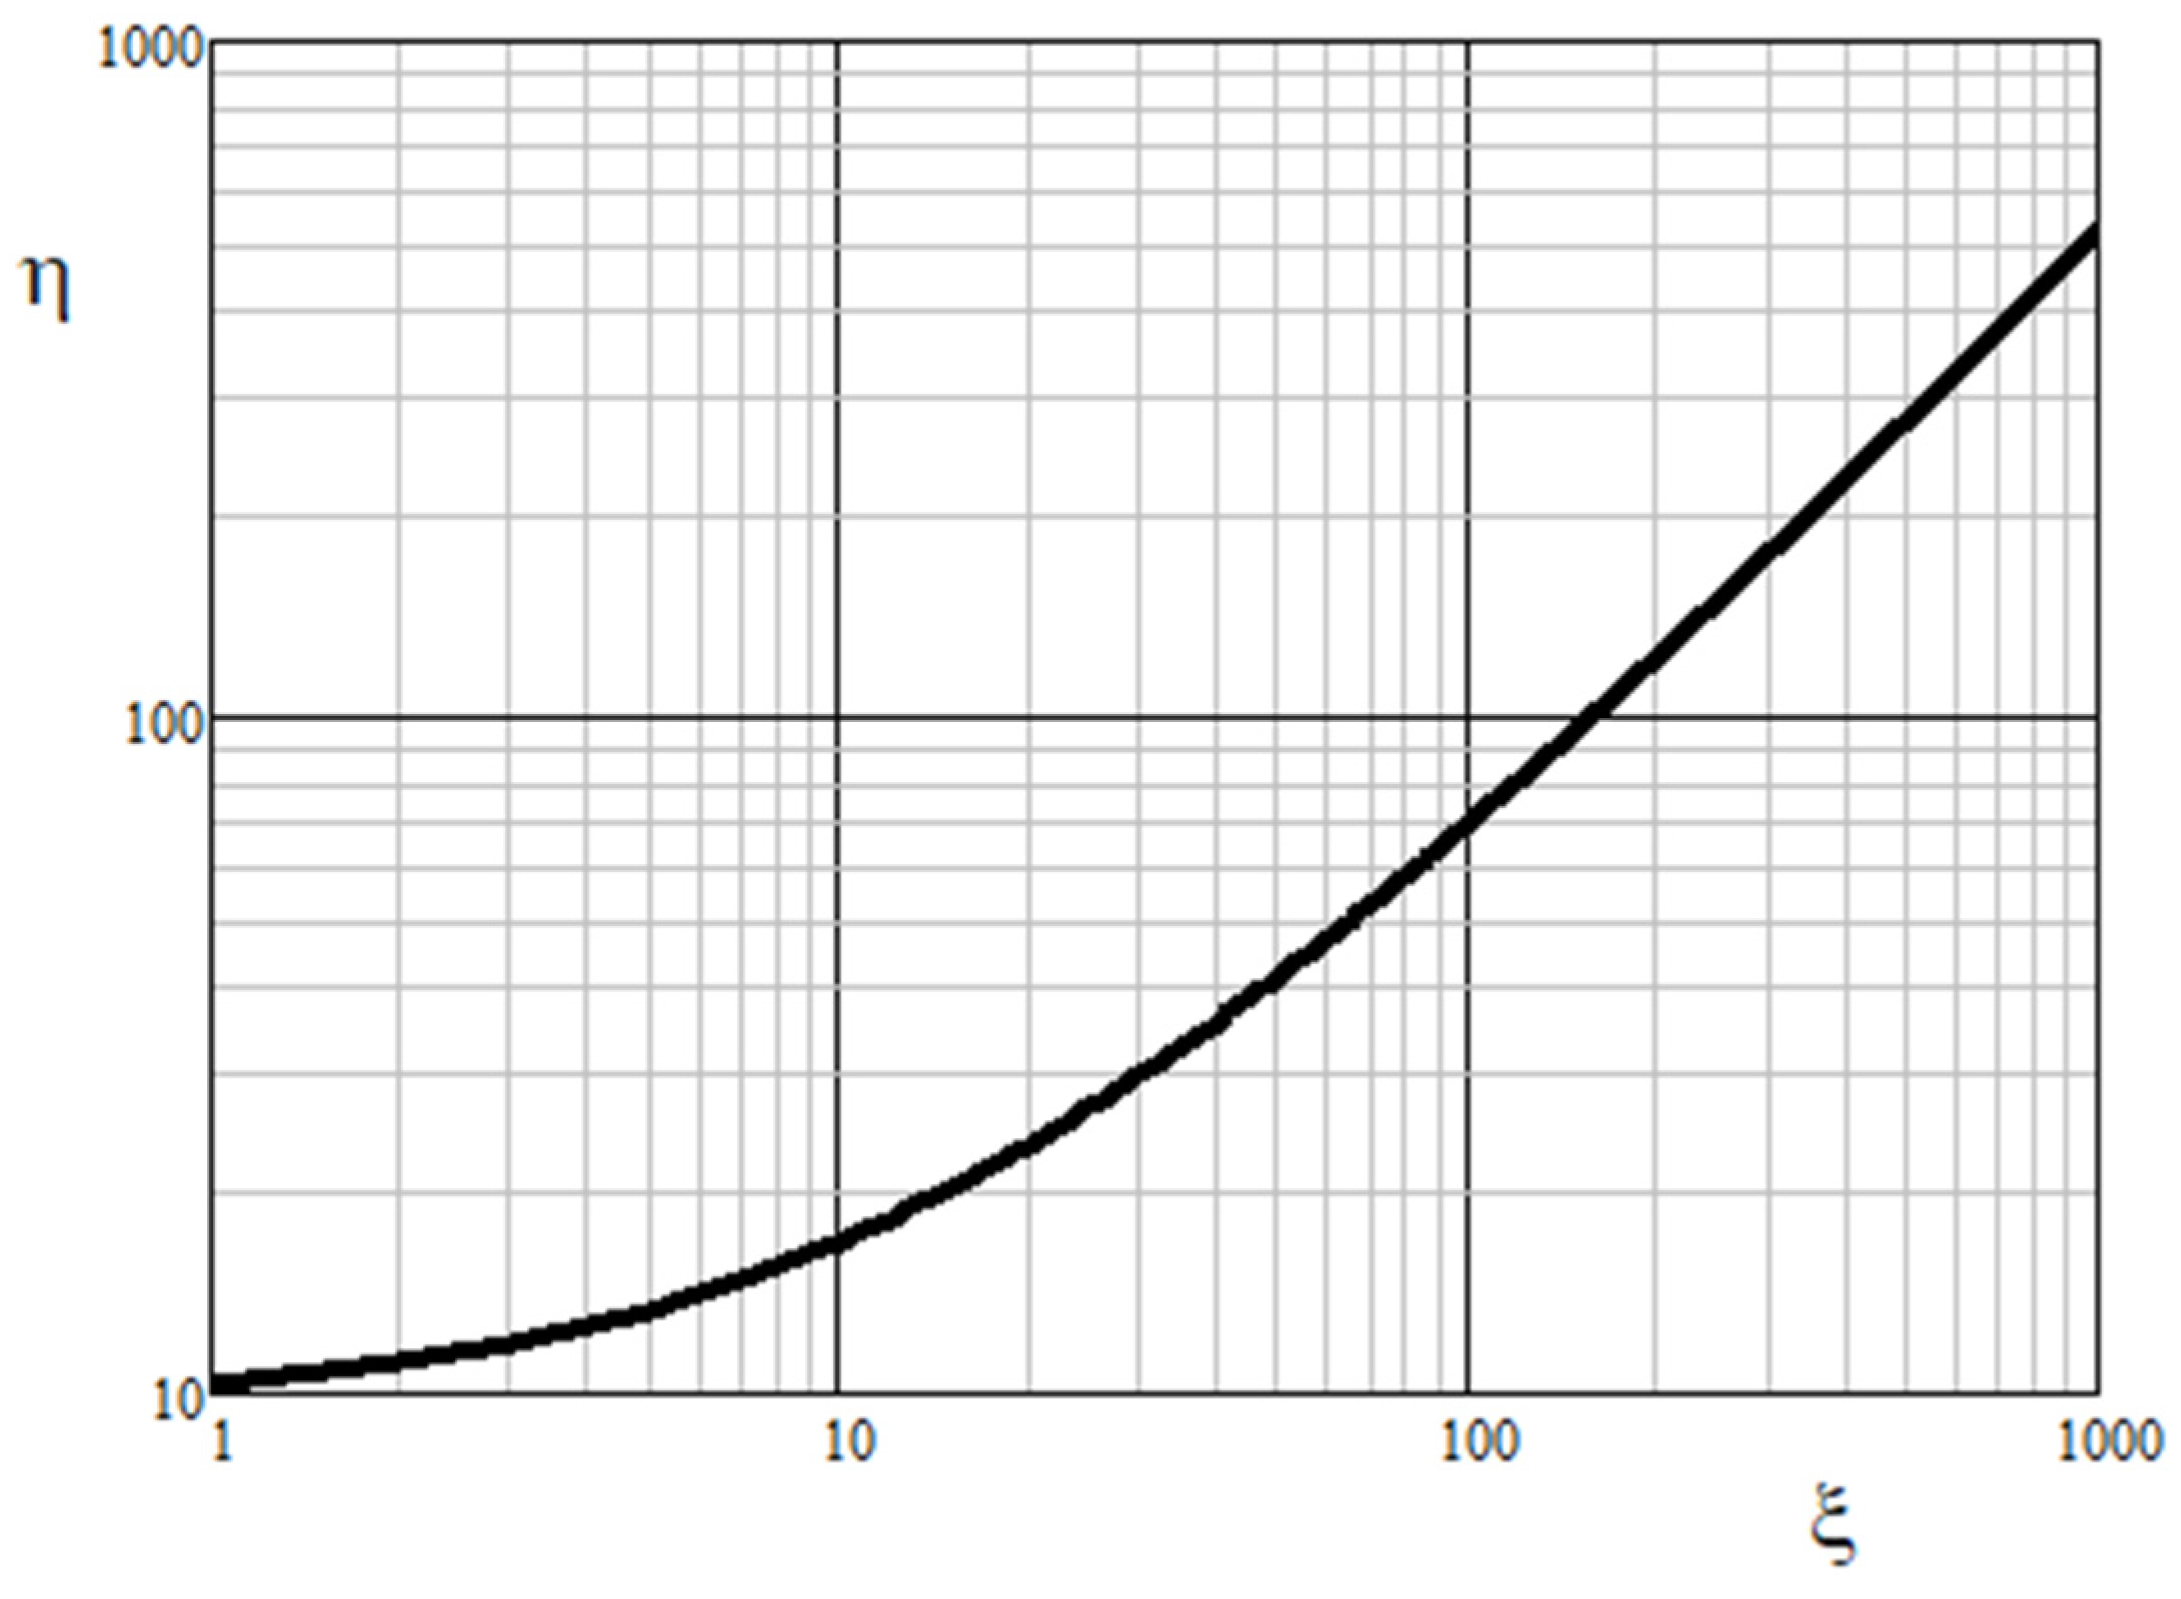
The relationship between ξ and η is shown graphically in Figure 2, which includes a confidence band. Ranges of values of ξ and η can be estimated for ungauged communities, from which flood depths H can be back-calculated.
The equation for η can be extended to
η = H W S = 0.63 f o 1 / 3 ξ + 5.75 μ 1 + 1 + 0.11 μ f o 1 / 3 f i f o ξ
where fo is a composite friction factor calculated from the average of the ice friction factor fi and the riverbed friction factor fb, and μ is a coefficient. The parameter μ is the friction coefficient and represents the internal strength of the ice cover. This coefficient is a lumped variable representing the effects of several unknown or difficult-to-determine factors, including lateral stress within the ice cover, ice-on-bank friction, angle of internal resistance, porosity and possibly cohesion. Table 1 shows typical ranges of these parameters for various riverbed slopes [4,10].
The depth h (m) of water under the ice jam can be calculated using [7]
h = q 4 g S f o 1 / 2 2 / 3
and the maximum thickness t (m) of the ice jam is
t = H h s i
where si is the specific gravity of ice (=0.92).

2.2. Data Sources

The fine temporal resolutions (15 min values) of water levels and flow for all gauges for the years 1996 to 2023 (~27 years) were provided by the Water Survey of Canada. Fine resolution is necessary, in particular to extract the maximum staging from ice jamming since ice-jam events can come and pass within a few hours and the maximum values cannot be captured by a daily mean value.
High Resolution Digital Elevation Model (HRDEM) data are available from Natural Resources Canada (NRCan) (NRCan, 2023). Airborne LiDAR data are available for some communities. ArcticDEM, which is based on 2 m spacing and is mostly interpolated from satellite imagery, is available for coverage outside the LiDAR extents.
Maximum depth measurements are required at the gauges and were extracted from Acoustic Doppler Current Profiler (ADCP) surveys carried out under the ice by the Water Survey of Canada to estimate winter flows. Aligning the geodetic elevation of the water surface recorded on the day of the survey allowed the elevation of the thalweg to be determined.

2.3. Monte Carlo Framework (Gauged Reach)

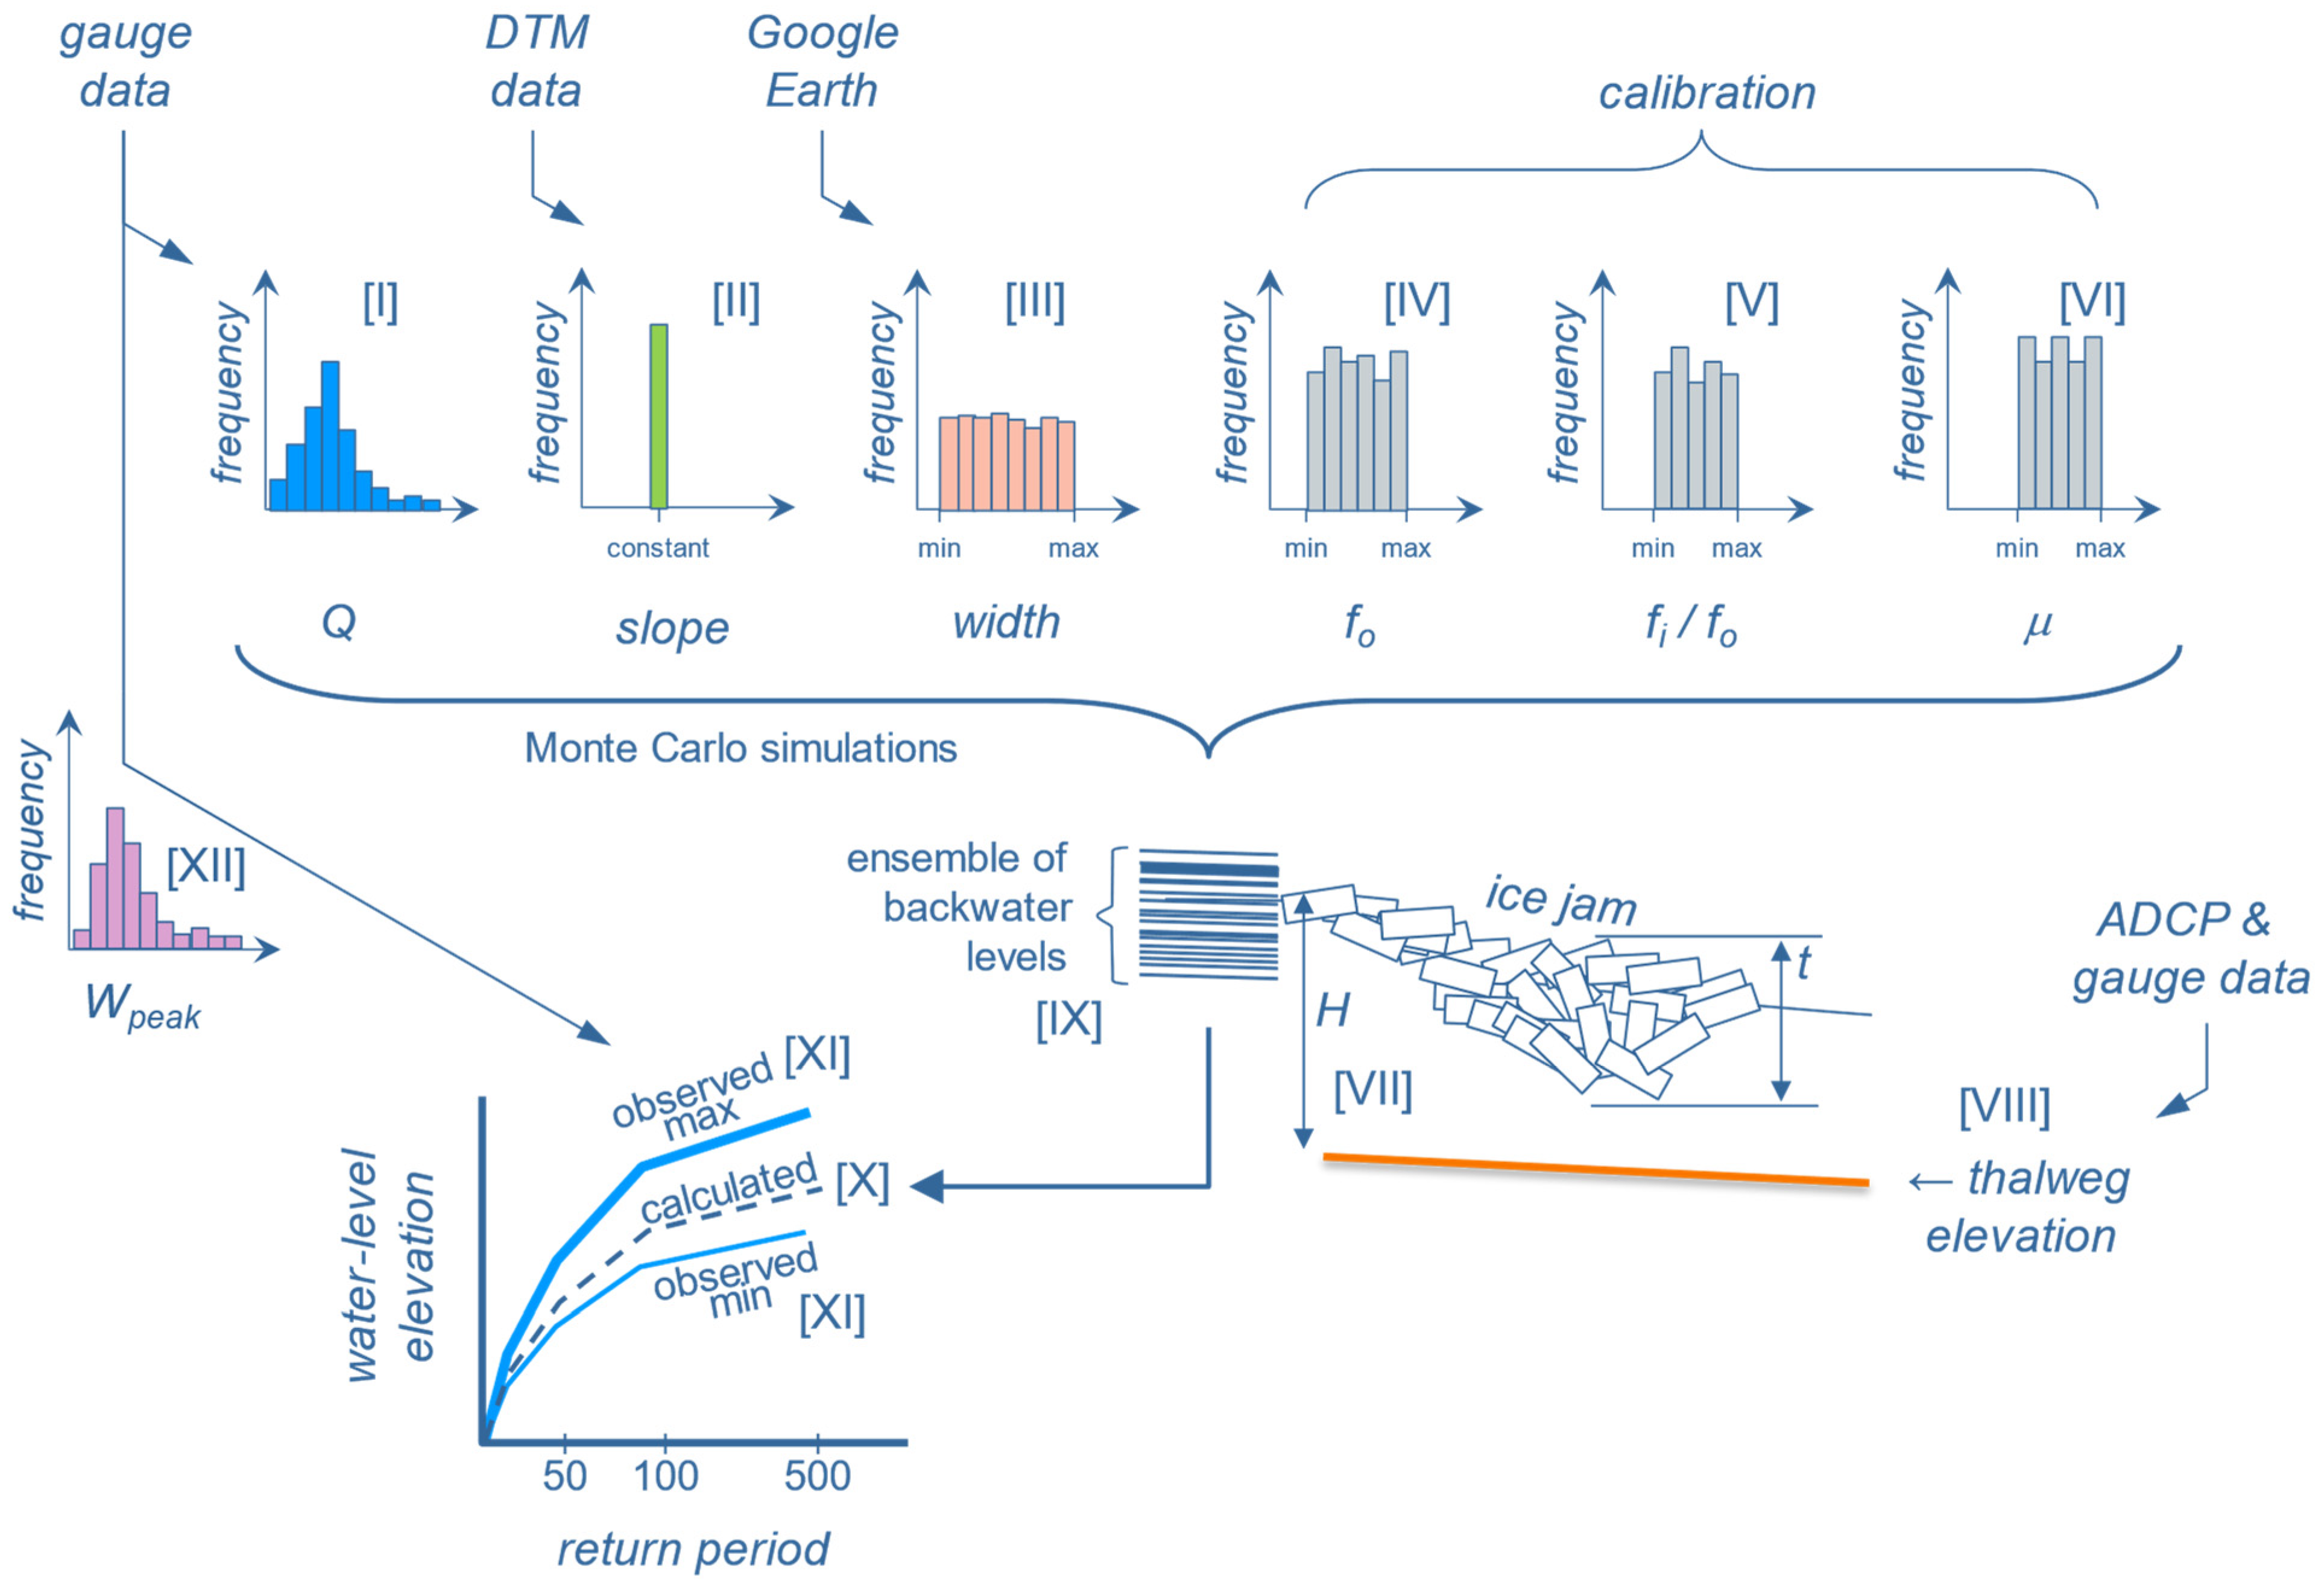
A conceptualisation of the Monte Carlo Analysis framework for the gauged reach is shown in Figure 3. The analysis is carried out by calculating the non-dimensional discharge and stages of Equations (1) and (4) many thousands of times, using random values of the following input parameters extracted from frequency distributions. Referring to Figure 3 for numbering:
  • An extreme value distribution (GEV) of the flows Q at the end of breakup derived from annual flows recorded with the last b-flag at the gauge;
  • Constant value of the slope along the site from elevation data along the river water surface from the digital terrain model or digital elevation model at the site;
  • Uniform distribution of width ranging between the minimum and maximum widths of the river at the site, measured in Google Earth;
  • Uniform distribution of the composite ice–riverbed friction factor fo (Table 1);
  • Uniform distribution of the ratio of the ice friction to composite friction factors fi/fo (Table 1);
  • Uniform distribution of the ice-cover strength parameter μ (Table 1).
  • The many simulations yield the same number of backwater depths H (Equation (3));
  • These are added to the thalweg elevation derived from the maximum depth recorded in the ADCP data and water-level elevation recorded at the time of the ADCP survey (thalweg_elevation = water-level_elevation − maximum_depth);
  • This yields an ensemble of backwater level elevations.
  • Percentiles of the backwater-level elevations correspond to the return periods (e.g., 99th percentile corresponds to a return period of 1:100 AEP (= 1/0.01)) that are graphed to calculate a hazard curve;
  • This must lie between the observed minimum and maximum hazard curves;
  • These are derived from the extreme value distribution of instantaneous backwater level elevation maxima recorded at the gauge.
The ranges of the distributions of the parameters fo, fi/fo and μ, corresponding to [IV], [V] and [VI] in Figure 3, are adjusted (calibrated) until the calculated hazard curve [X] lies within the observed minimum/maximum range of the observed hazard curves, corresponding to [XI] in Figure 3.

2.4. Monte Carlo Framework (Ungauged Reach)

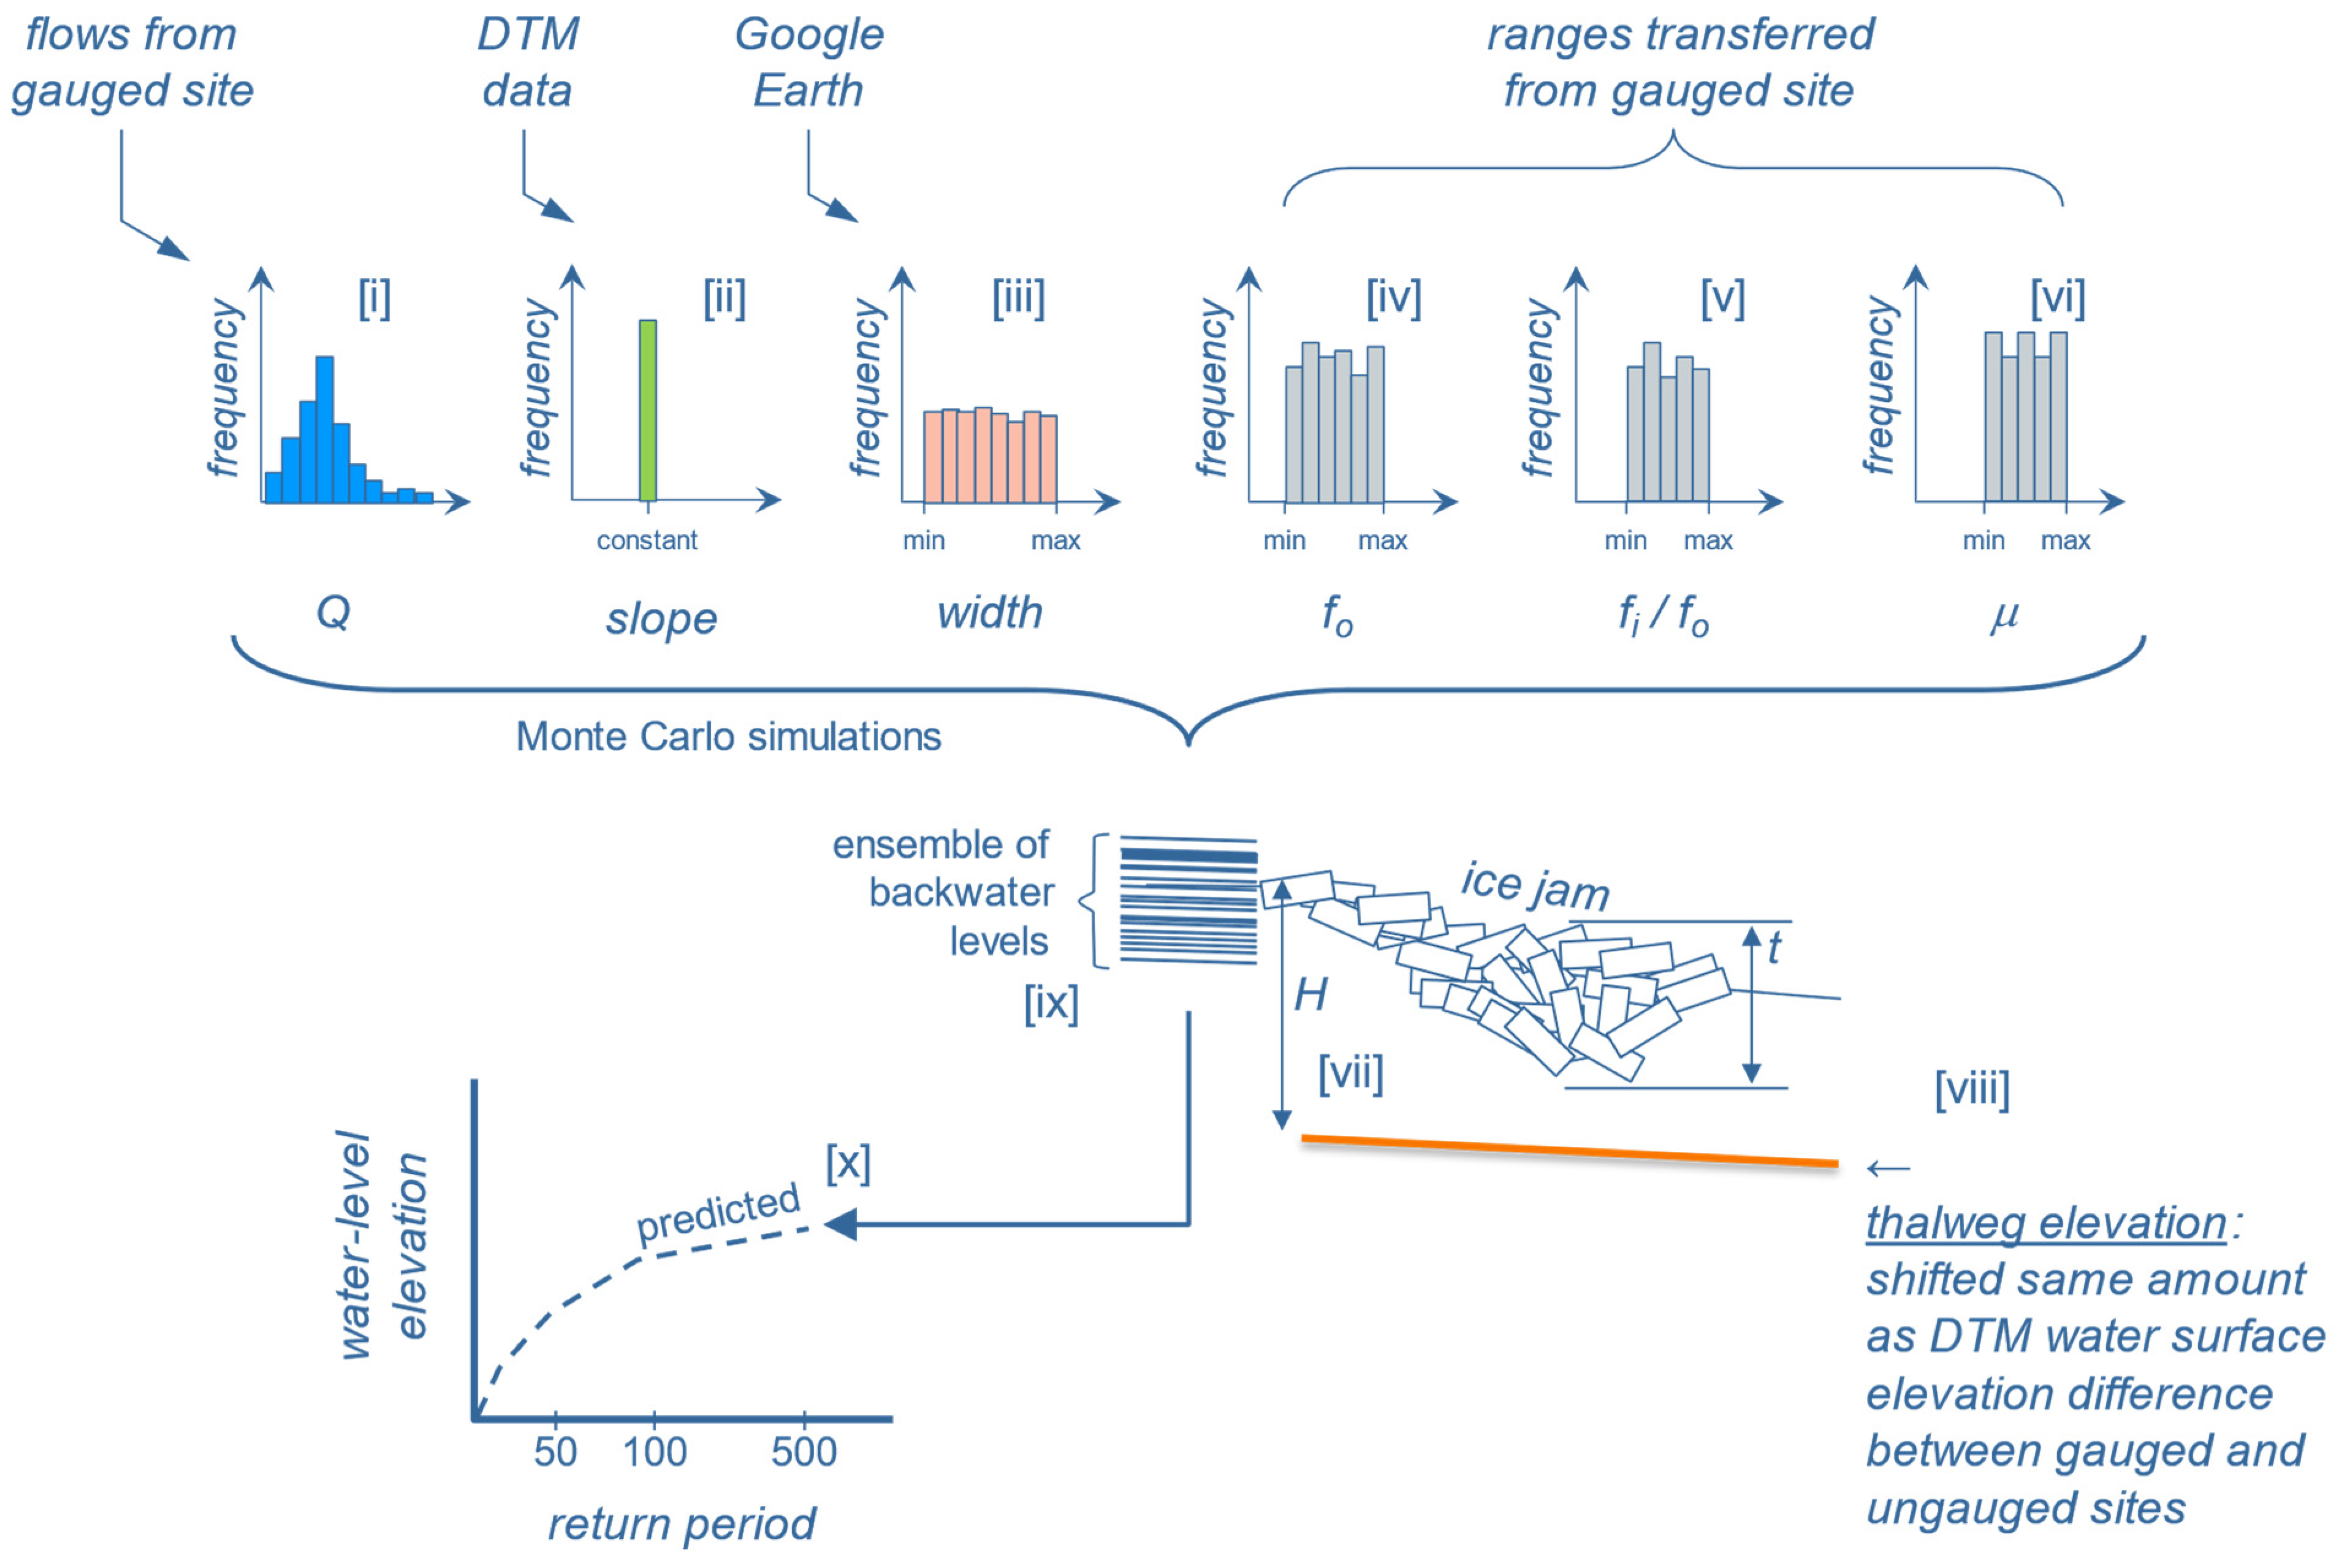
The Monte Carlo framework of the gauged reach is extrapolated to the ungauged reach by transferring most of the parameterisations from the gauged reach to the ungauged reach, with a few adjustments to fit the framework to the conditions of the ungauged site. Referring to Figure 4.
(i)
The same extreme value distribution of flows derived from the gauge data was used for the ungauged site, except for Jean Marie River, where the frequency distribution of the flows recorded at Strong Point were used.
(ii)
A constant value of slope at the site, derived from the digital elevation model at the site, was used.
(iii)
The range of widths were adjusted to the range observed at the ungauged site in Google Earth.
(iv)
The same range of fo as that of the gauged site was maintained at the ungauged site.
(v)
The same range of fi/fo as that calibrated for the gauged site was retained for the ungauged site.
(vi)
The same range of m as that determined for the gauged site was transferred to the ungauged site.
(vii)
The Monte Carlo Analysis again yielded an ensemble of backwater depths H whose values were added to the thalweg elevation;
(viii)
This is an elevation increment corresponding to the difference in the water-level surface elevations between the gauged and ungauged sites, determined from the sites’ corresponding digital terrain models; this represents a high level of uncertainty, since the depths of the river at the two sites for the same flow conditions are not necessarily similar.
(ix)
The backwater level depths are added to the thalweg elevation to yield an ensemble of backwater level elevations;
(x)
From these, return periods can be estimated to predict a hazard curve for the ungauged reach.

3. Results

3.1. Fort Simpson/Jean Marie River Case Study

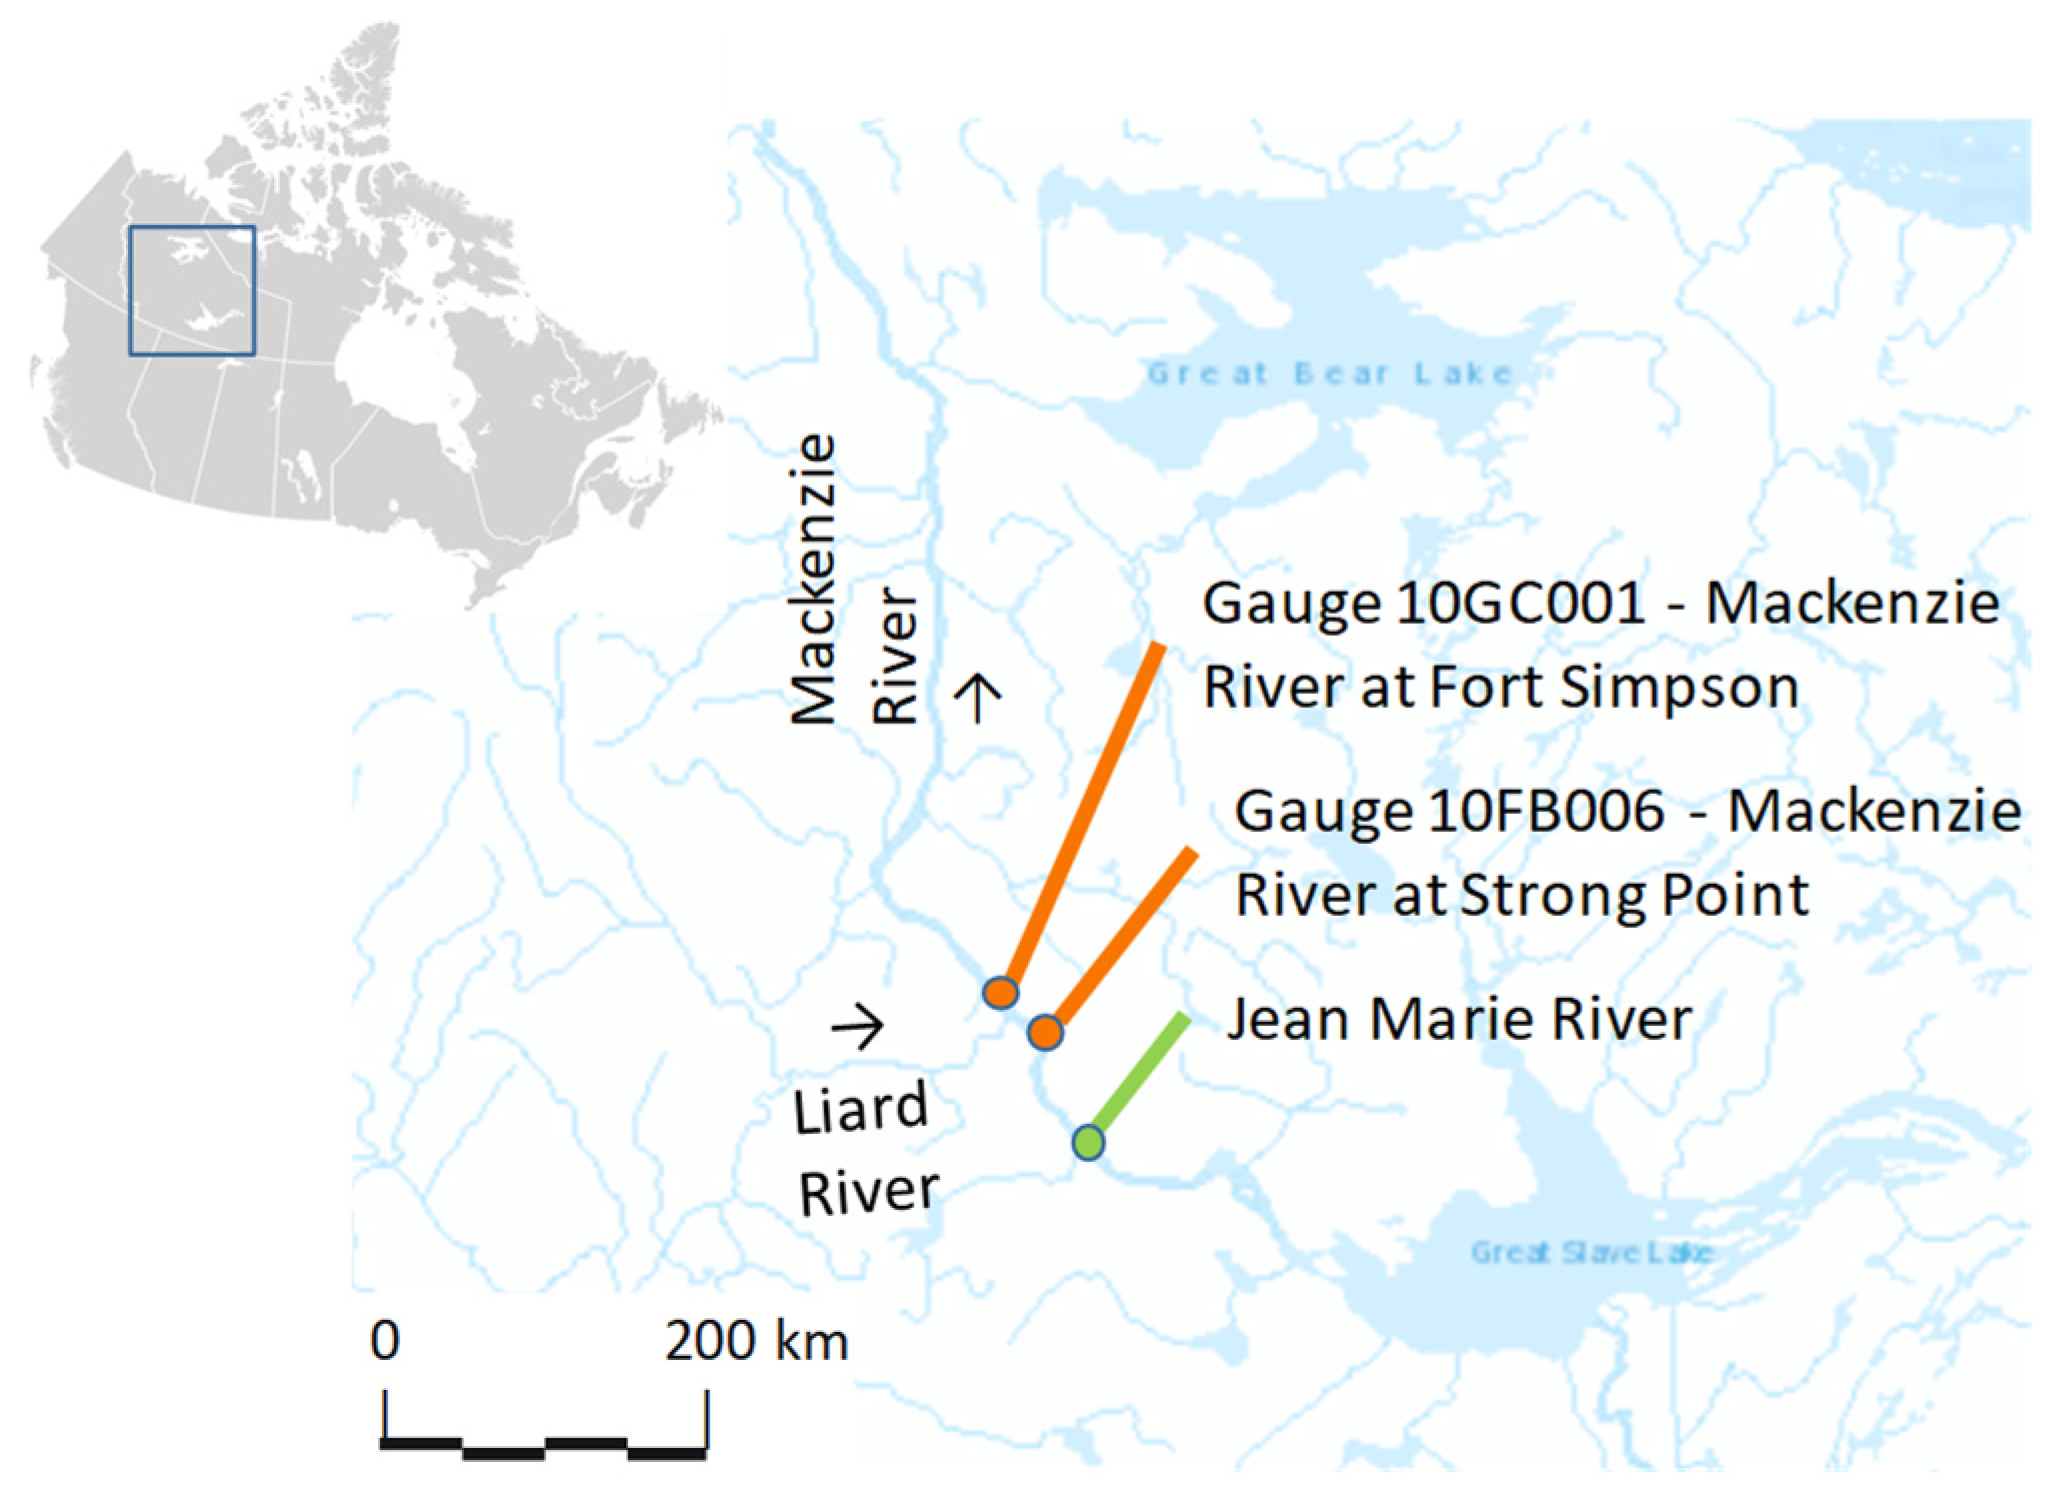
The ice-jam flood hazard at the ungauged reach of the Mackenzie River at the Jean Marie River required estimation. As indicated in Figure 5, the gauged site at Fort Simpson is located approximately 65 km downstream of the Jean Marie River.
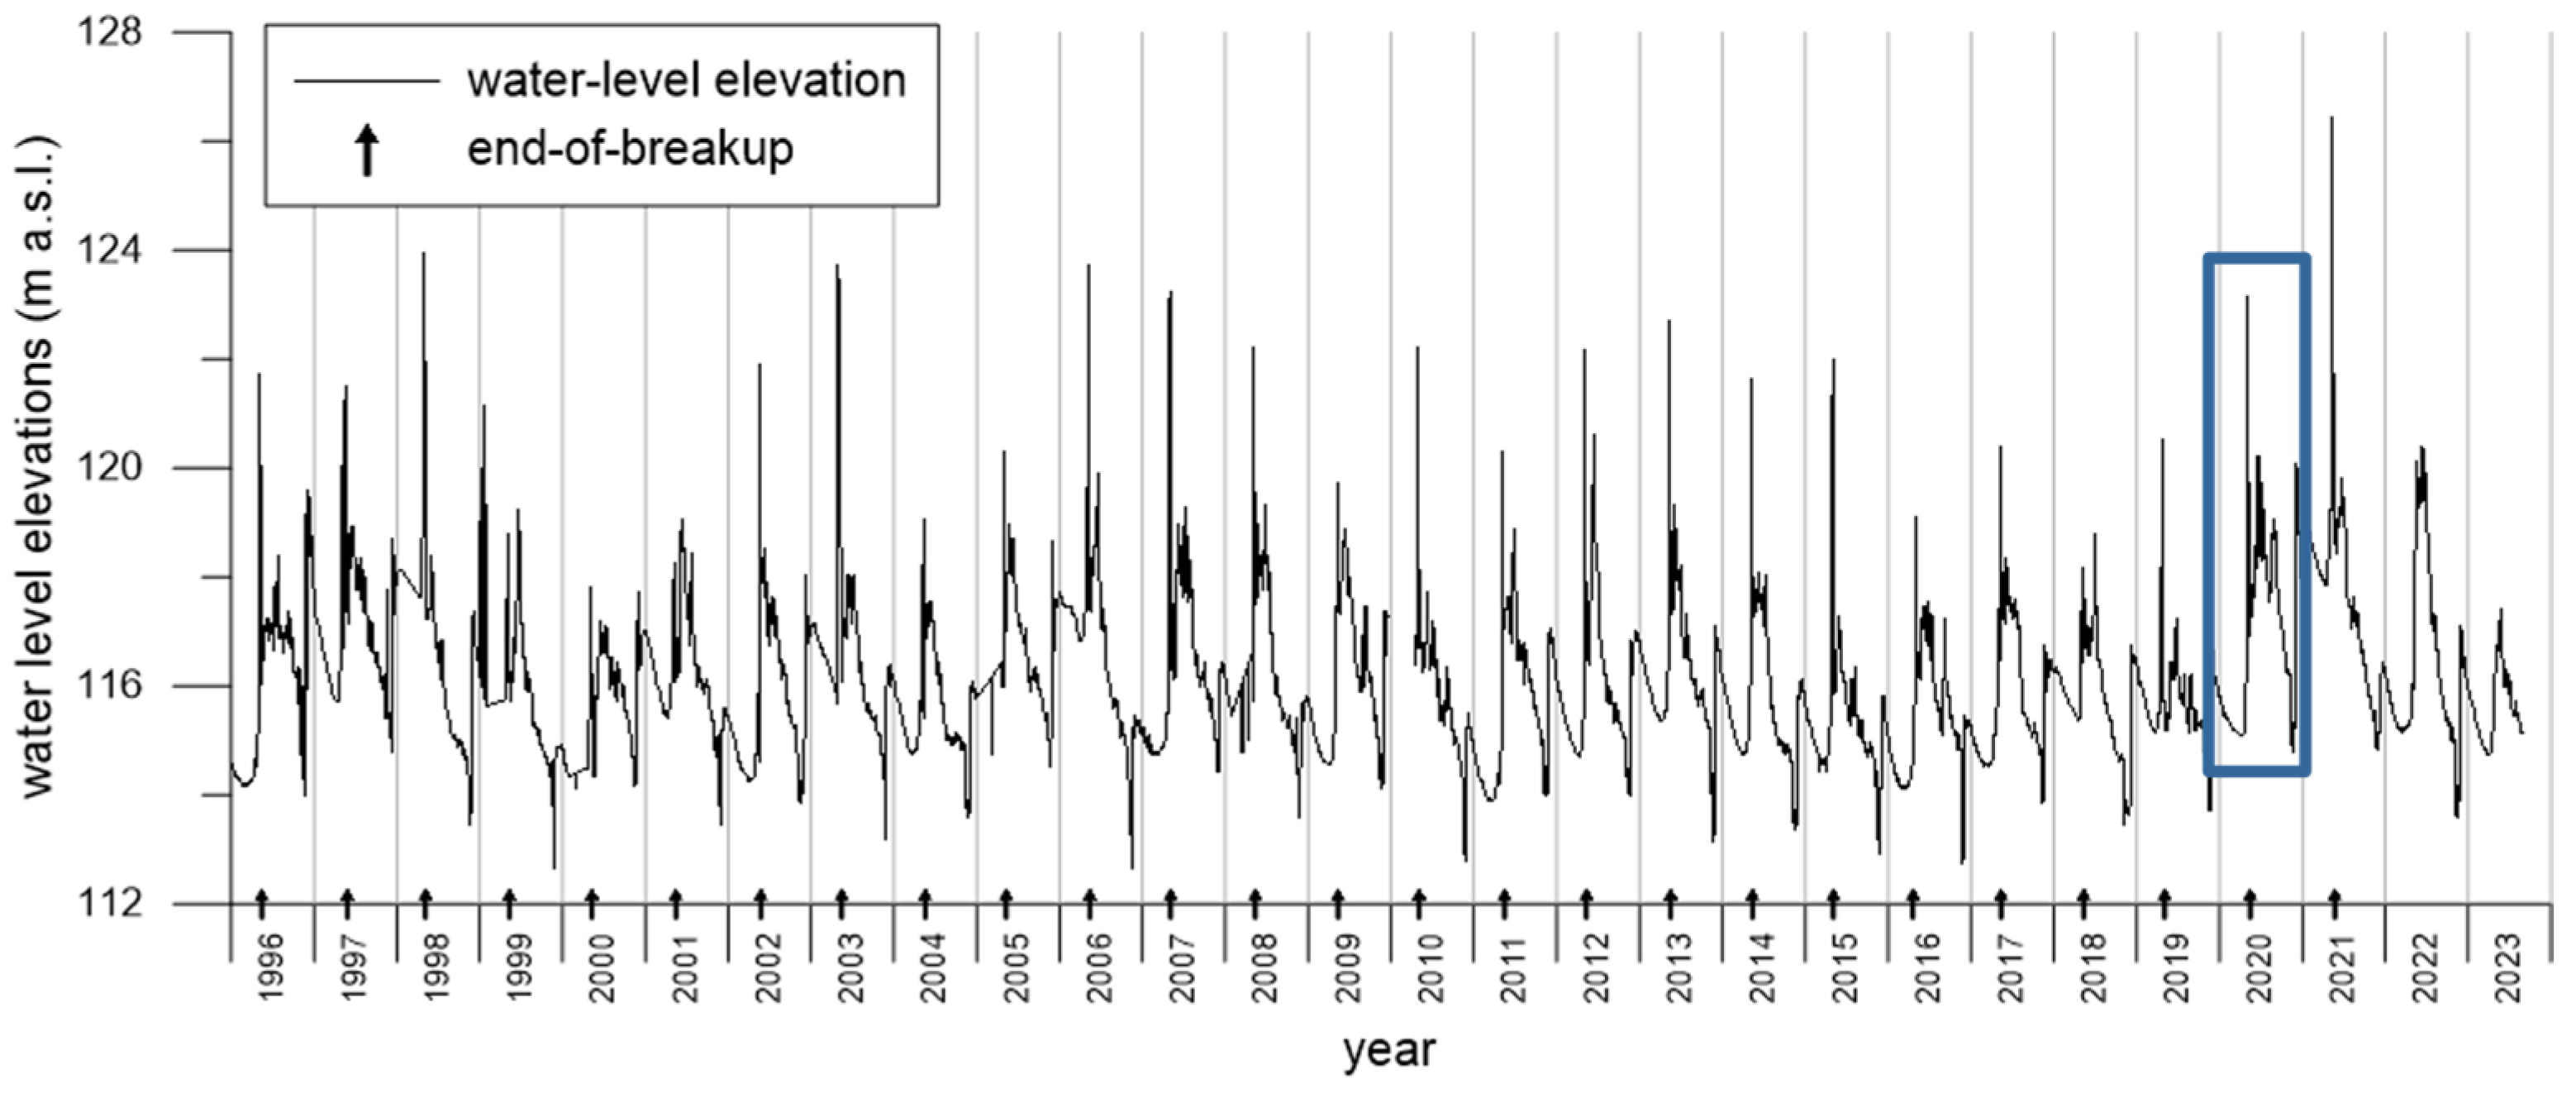
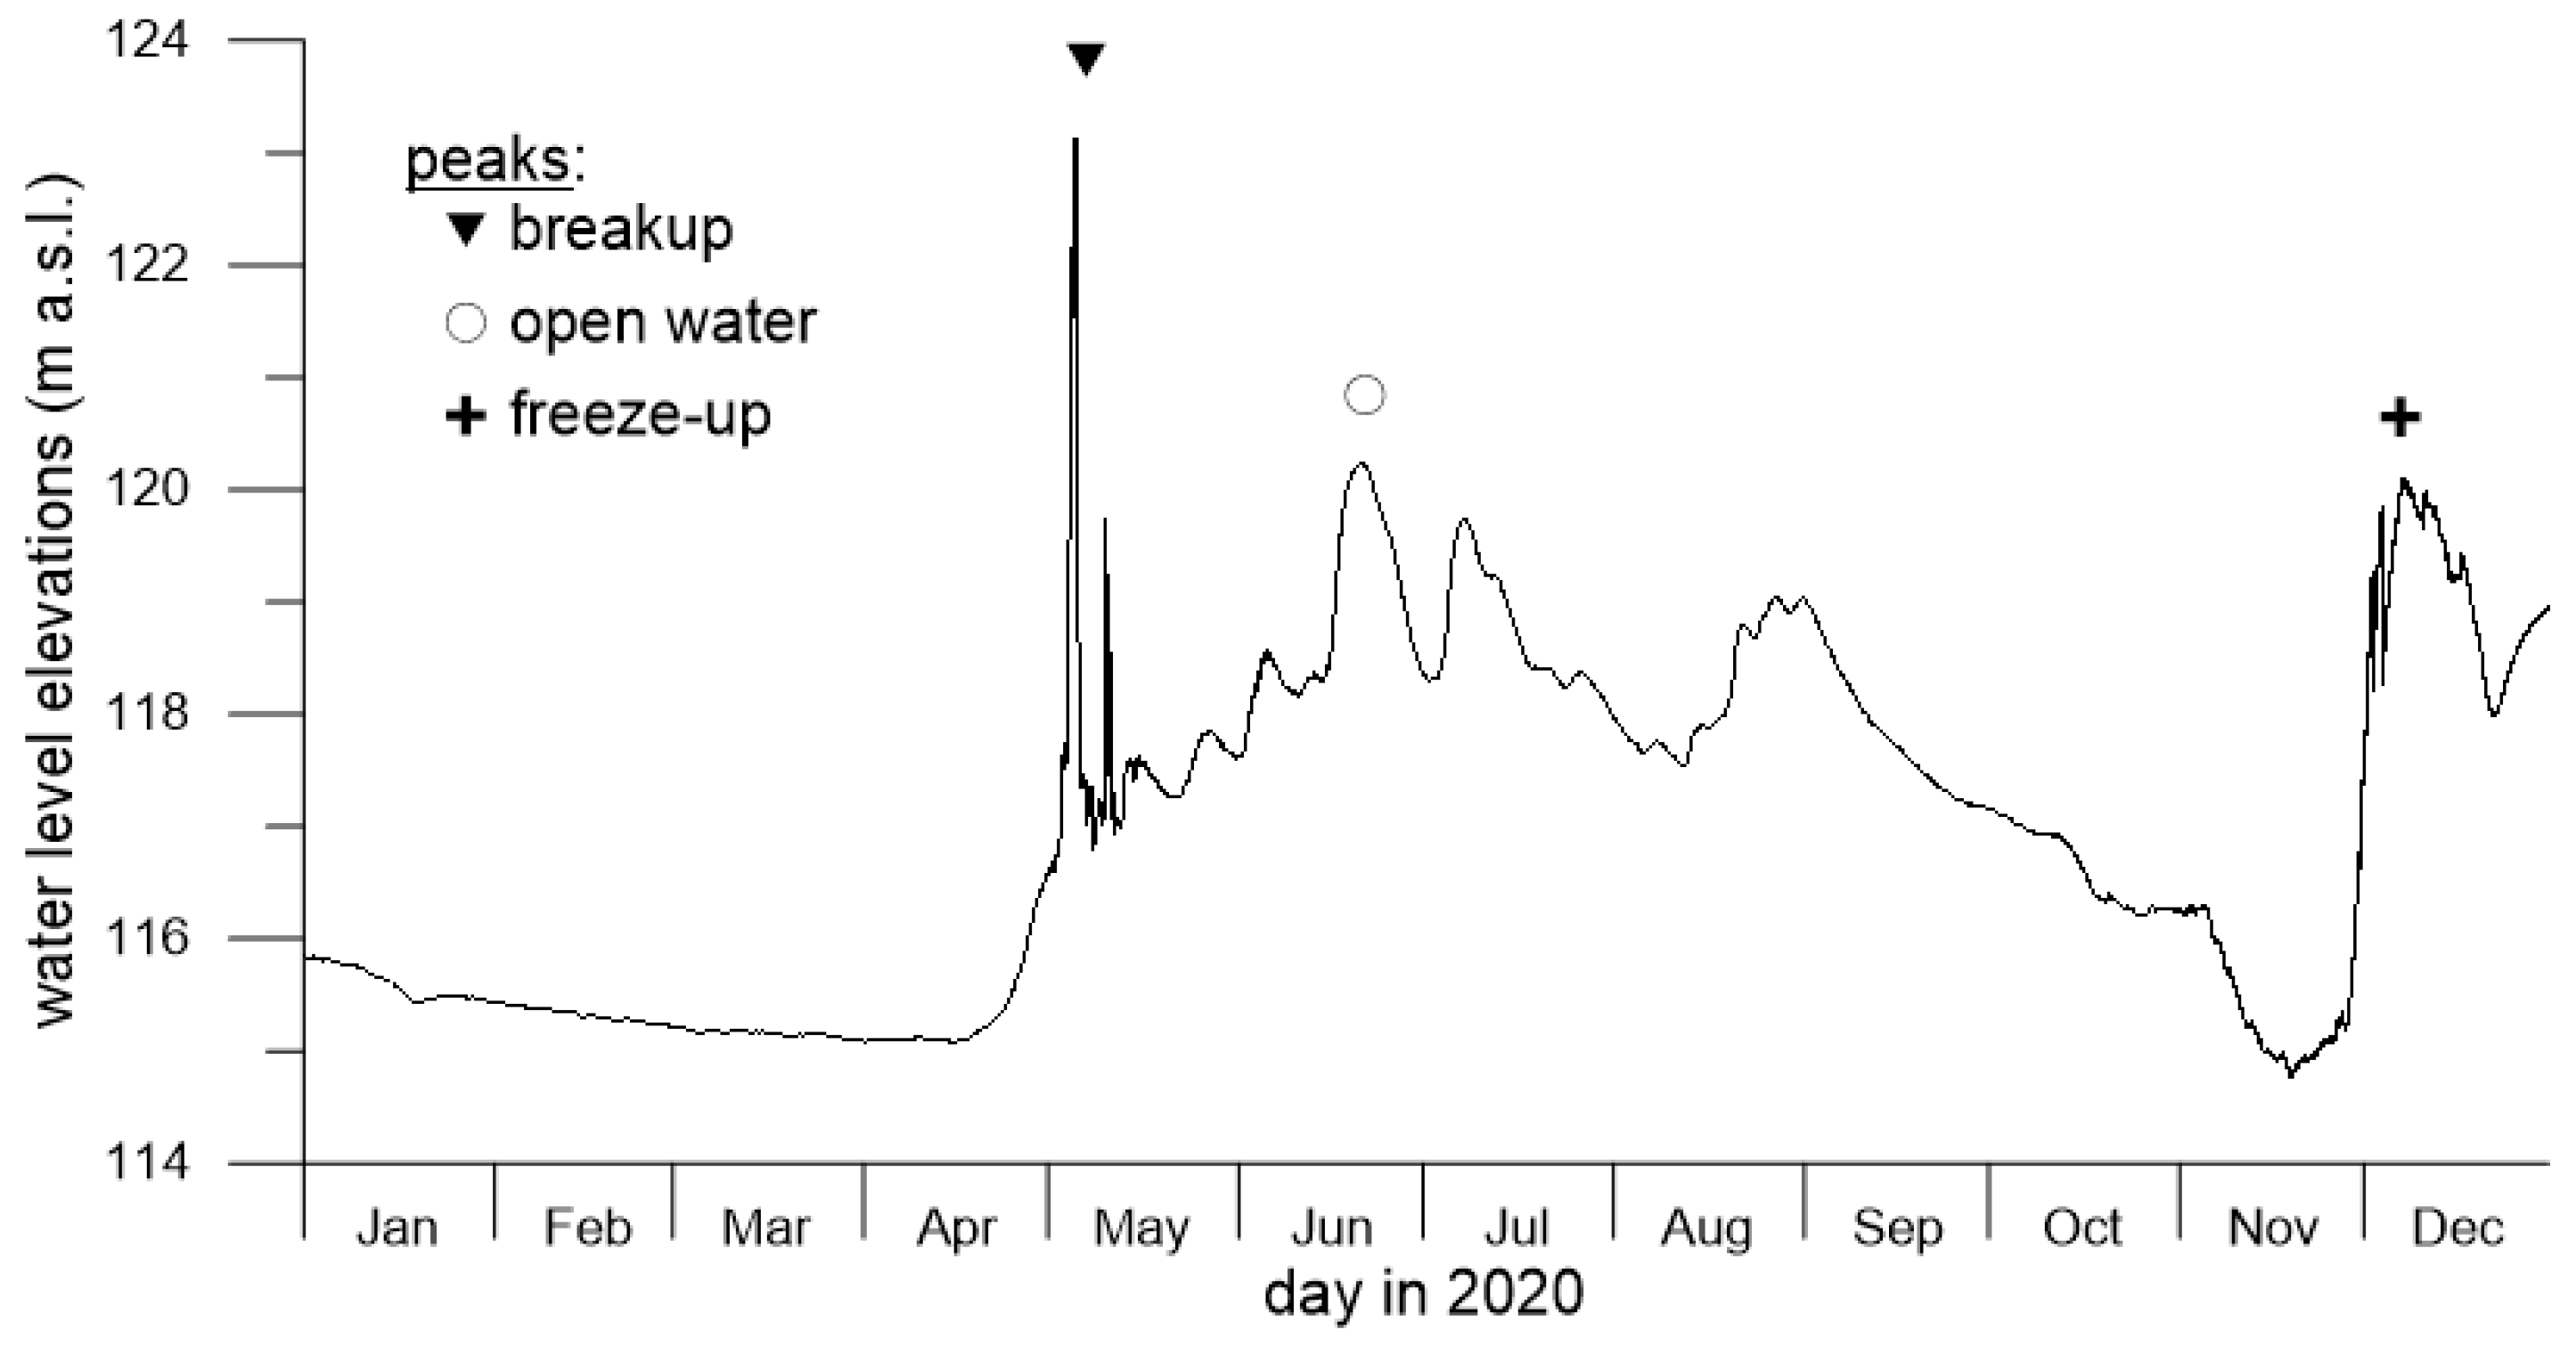
The ice-jam flood hazard was first calculated for the gauged site of Fort Simpson. A time series of the water-level elevations recorded at the town’s gauge for the time period 1996–2023 is given in Figure 6. A zoomed-in inset of the year 2020 is provided in Figure 7 to provide a clearer view of the three flood peaks that generally occur each year, in order of severity, probabilistically: (i) one during the spring breakup of the ice cover, (ii) another during open water in late spring or early summer and (iii) one last one during the initial freezing of the river in the fall. In this study, we will only consider the peak staging during spring breakup.

3.2. Monte Carlo Analysis Framework to Calibrate Gauged Reach Parameters at Fort Simpson

The results are laid in numerical order corresponding to the step numbering in the conceptualisation of the Monte Carlo frameworks for the gauged and ungauged reaches described in the Methodology above.
(I) End-of-breakup flow frequency curve:
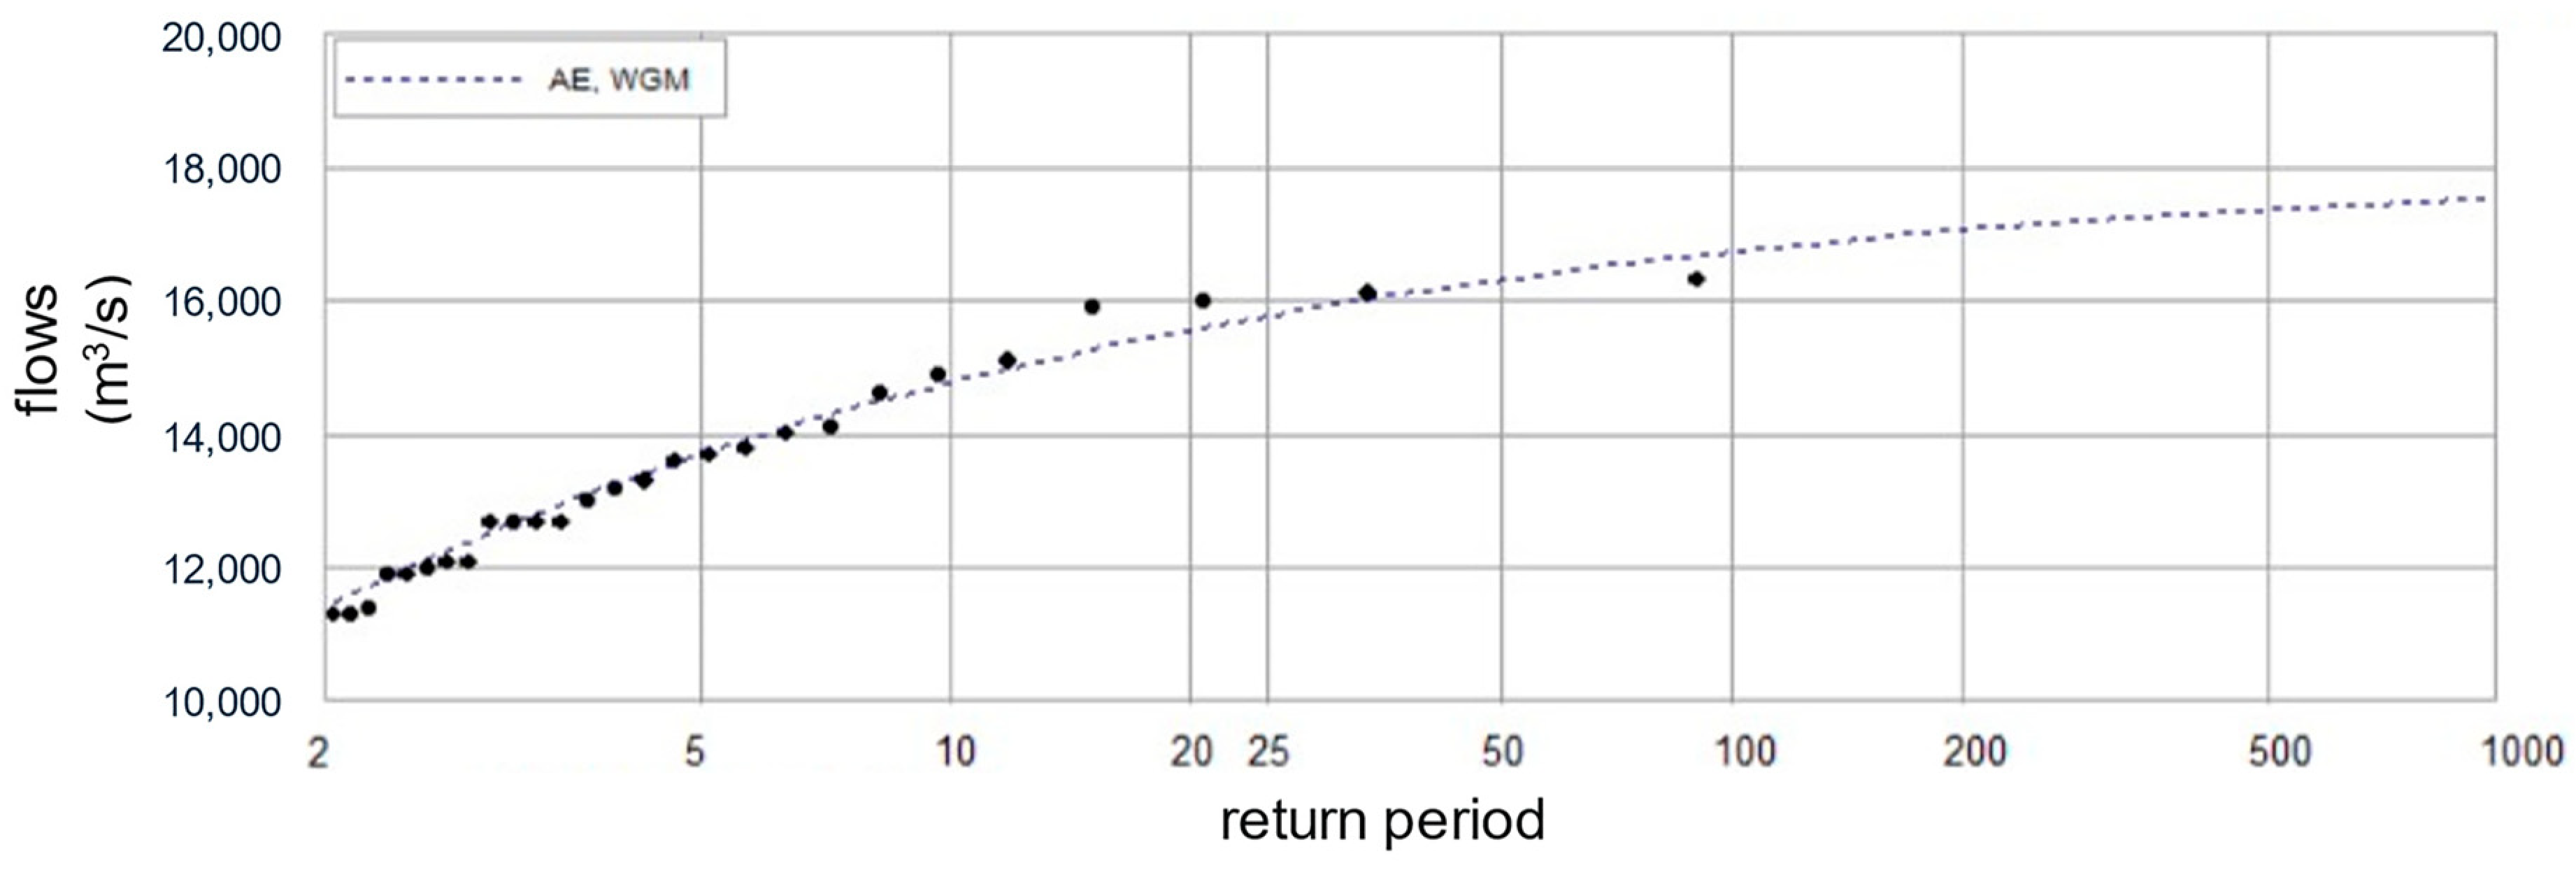
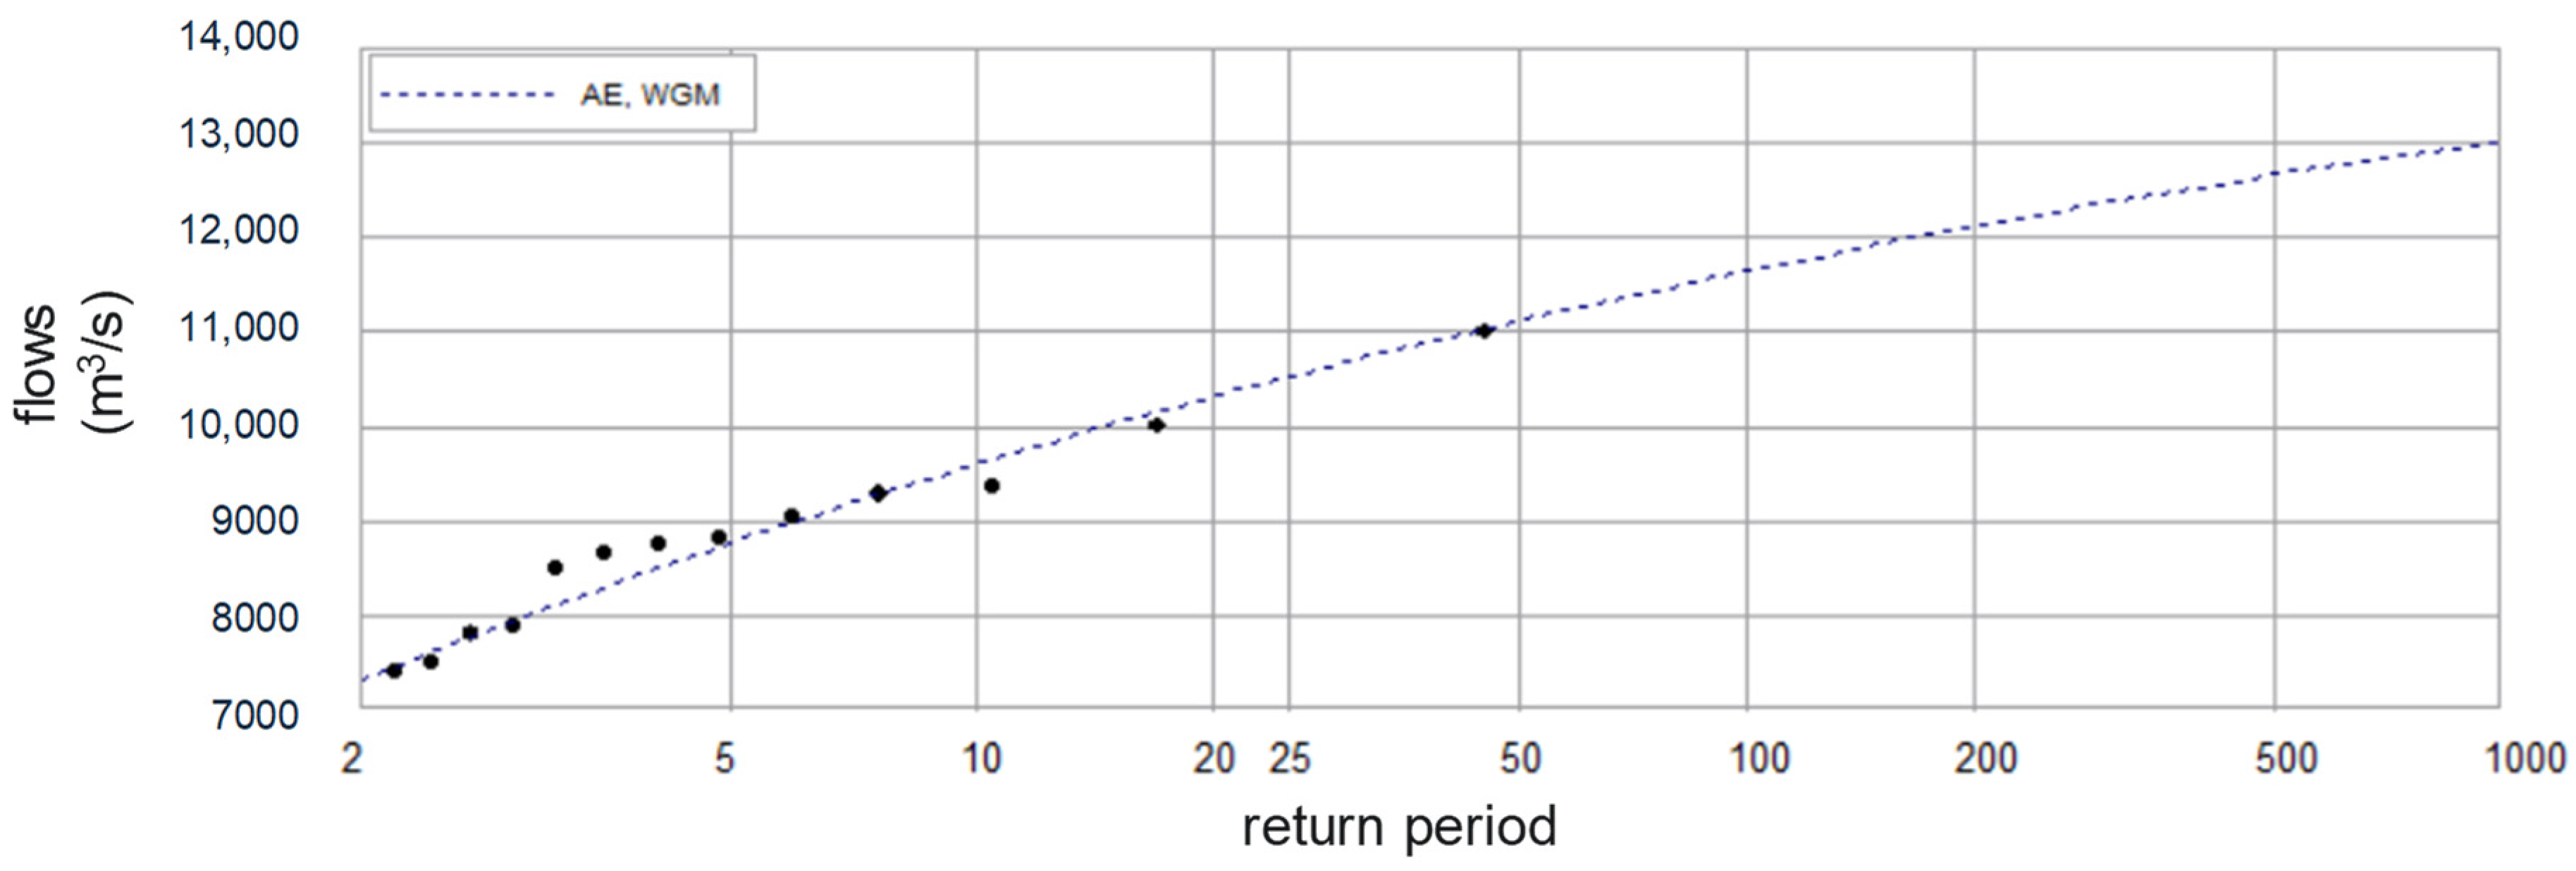
Flows at the end-of-breakup at the gauge in Fort Simpson are required as input to the dimensionless discharge ξ of Equation (1). For the Monte Carlo Analysis, a frequency distribution of these flows is required, shown in Figure 8, from which values can be extracted randomly. The generalised extreme value distribution (AE) provided the best fit for the data (lowest Kolmogorov–Smirnov difference).
(II to III) Gauged-reach slope from the digital terrain model:
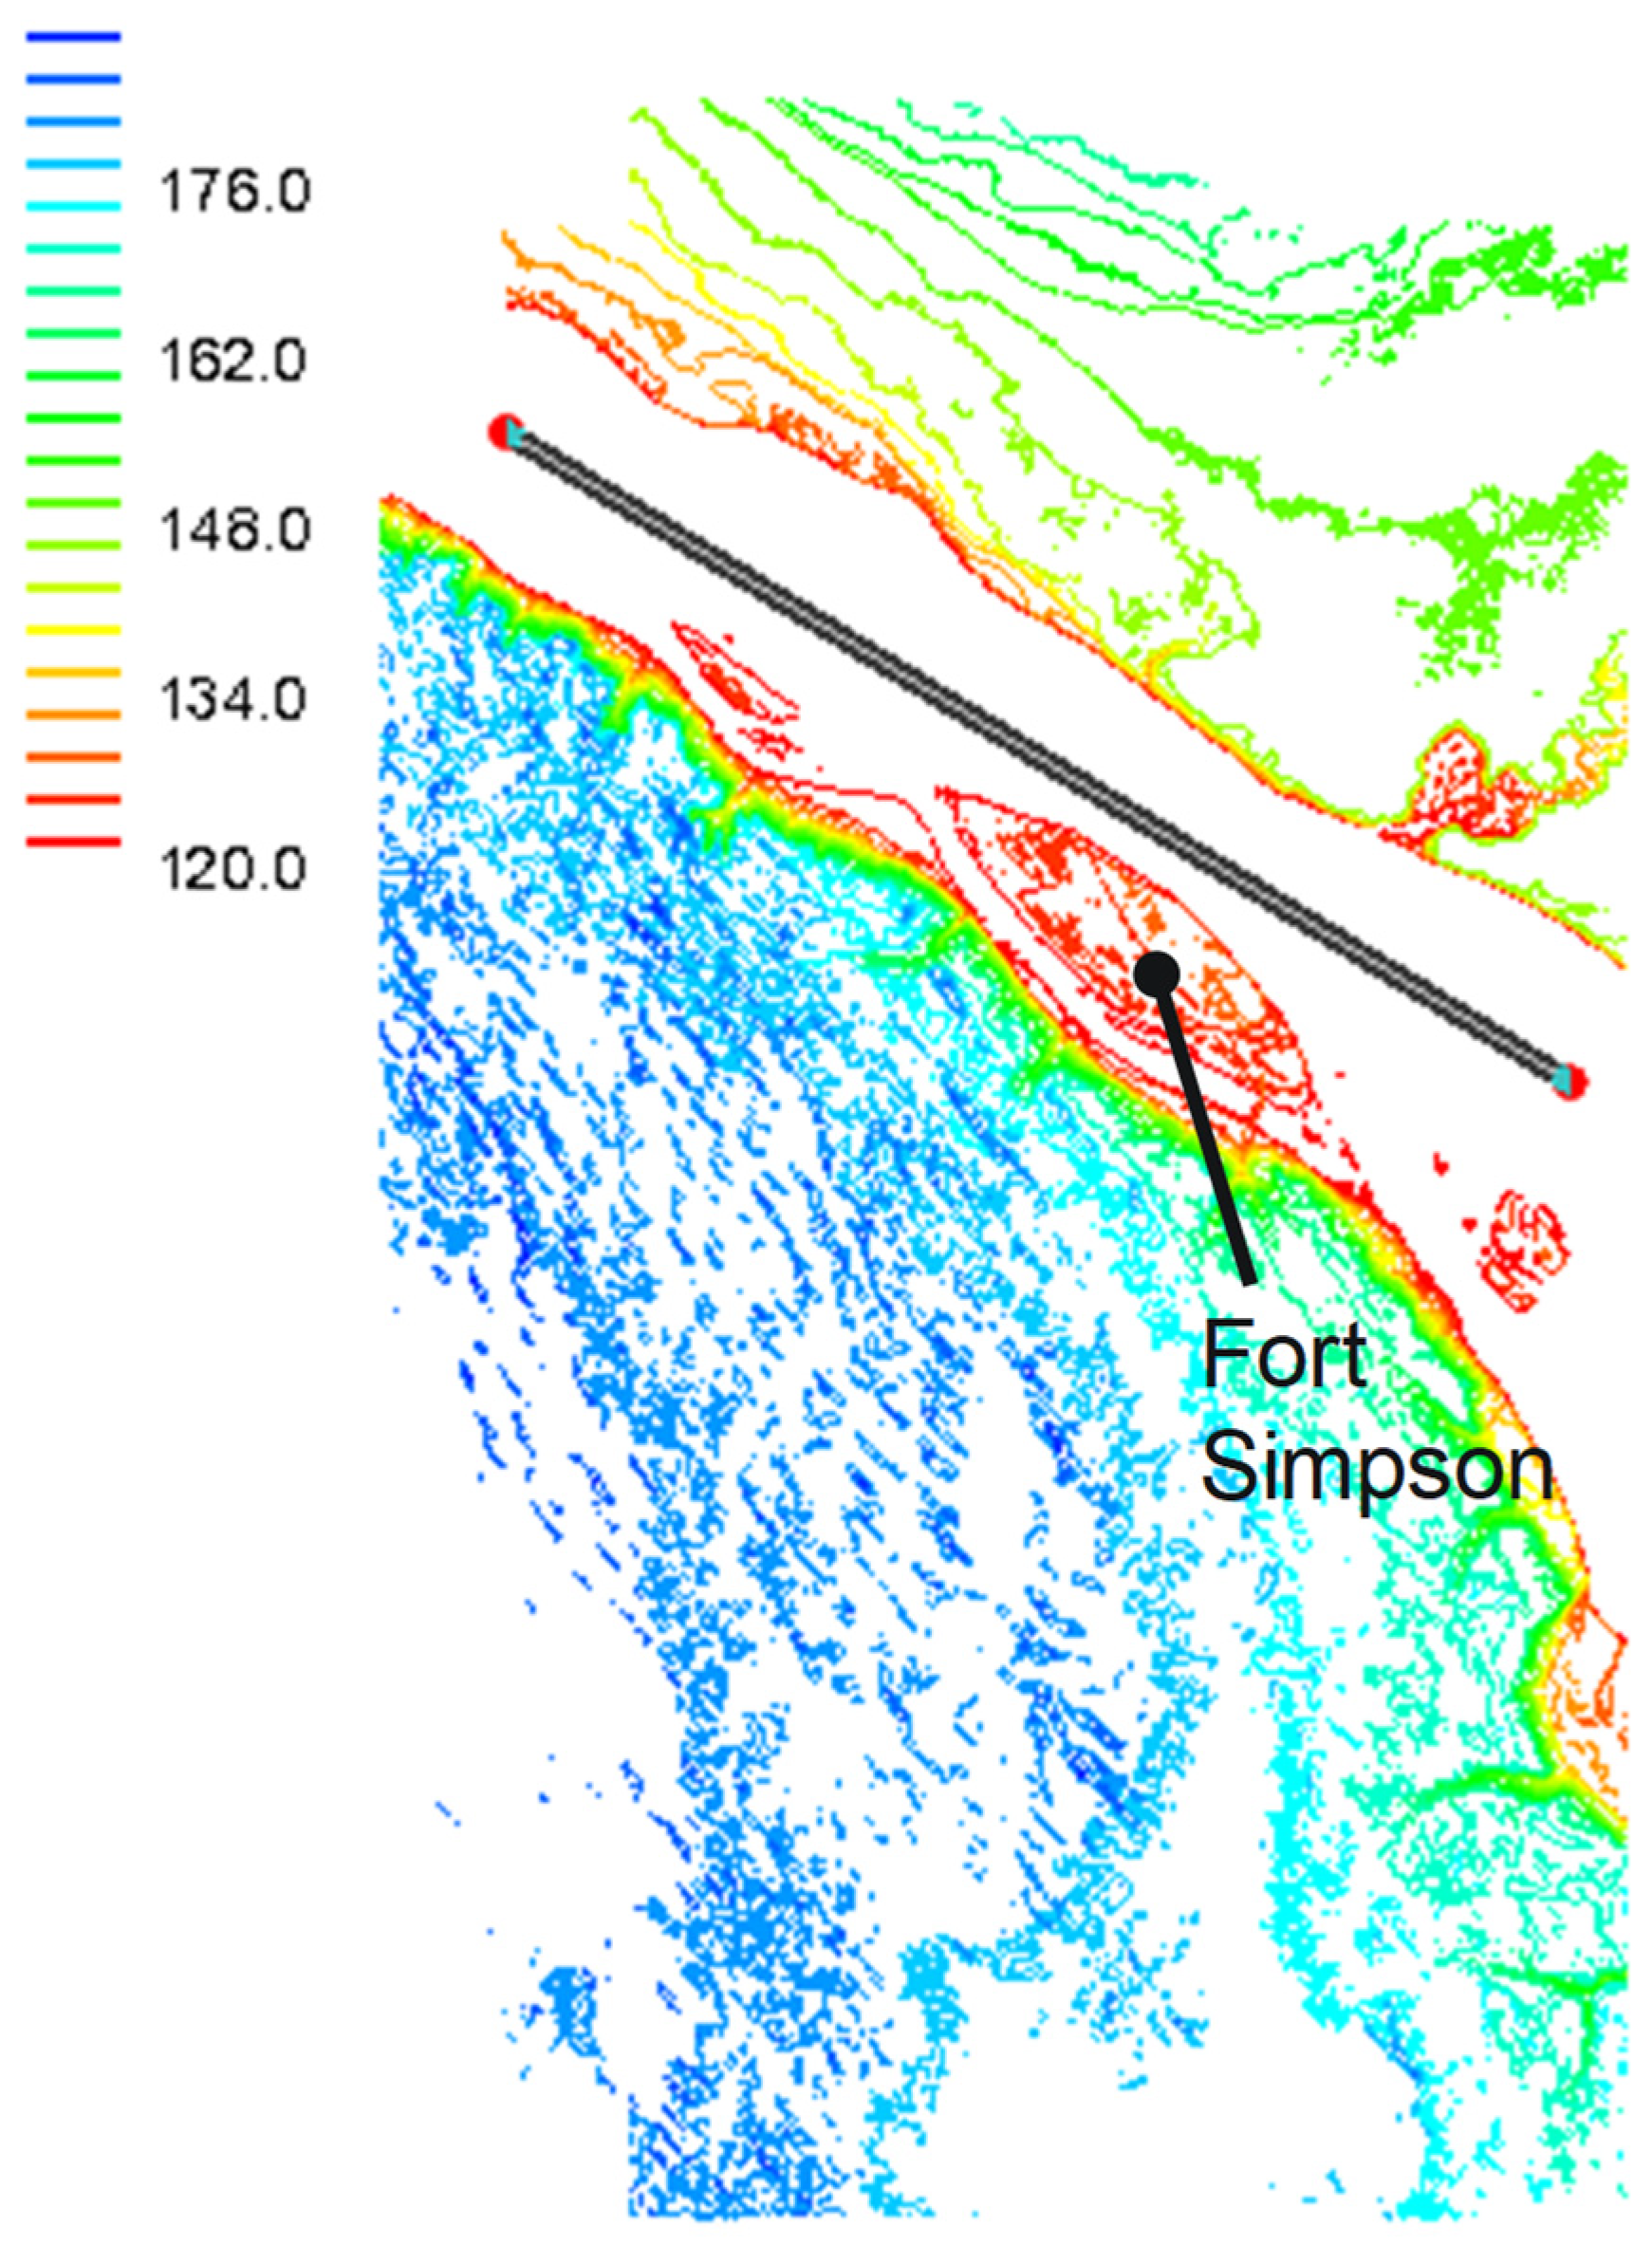
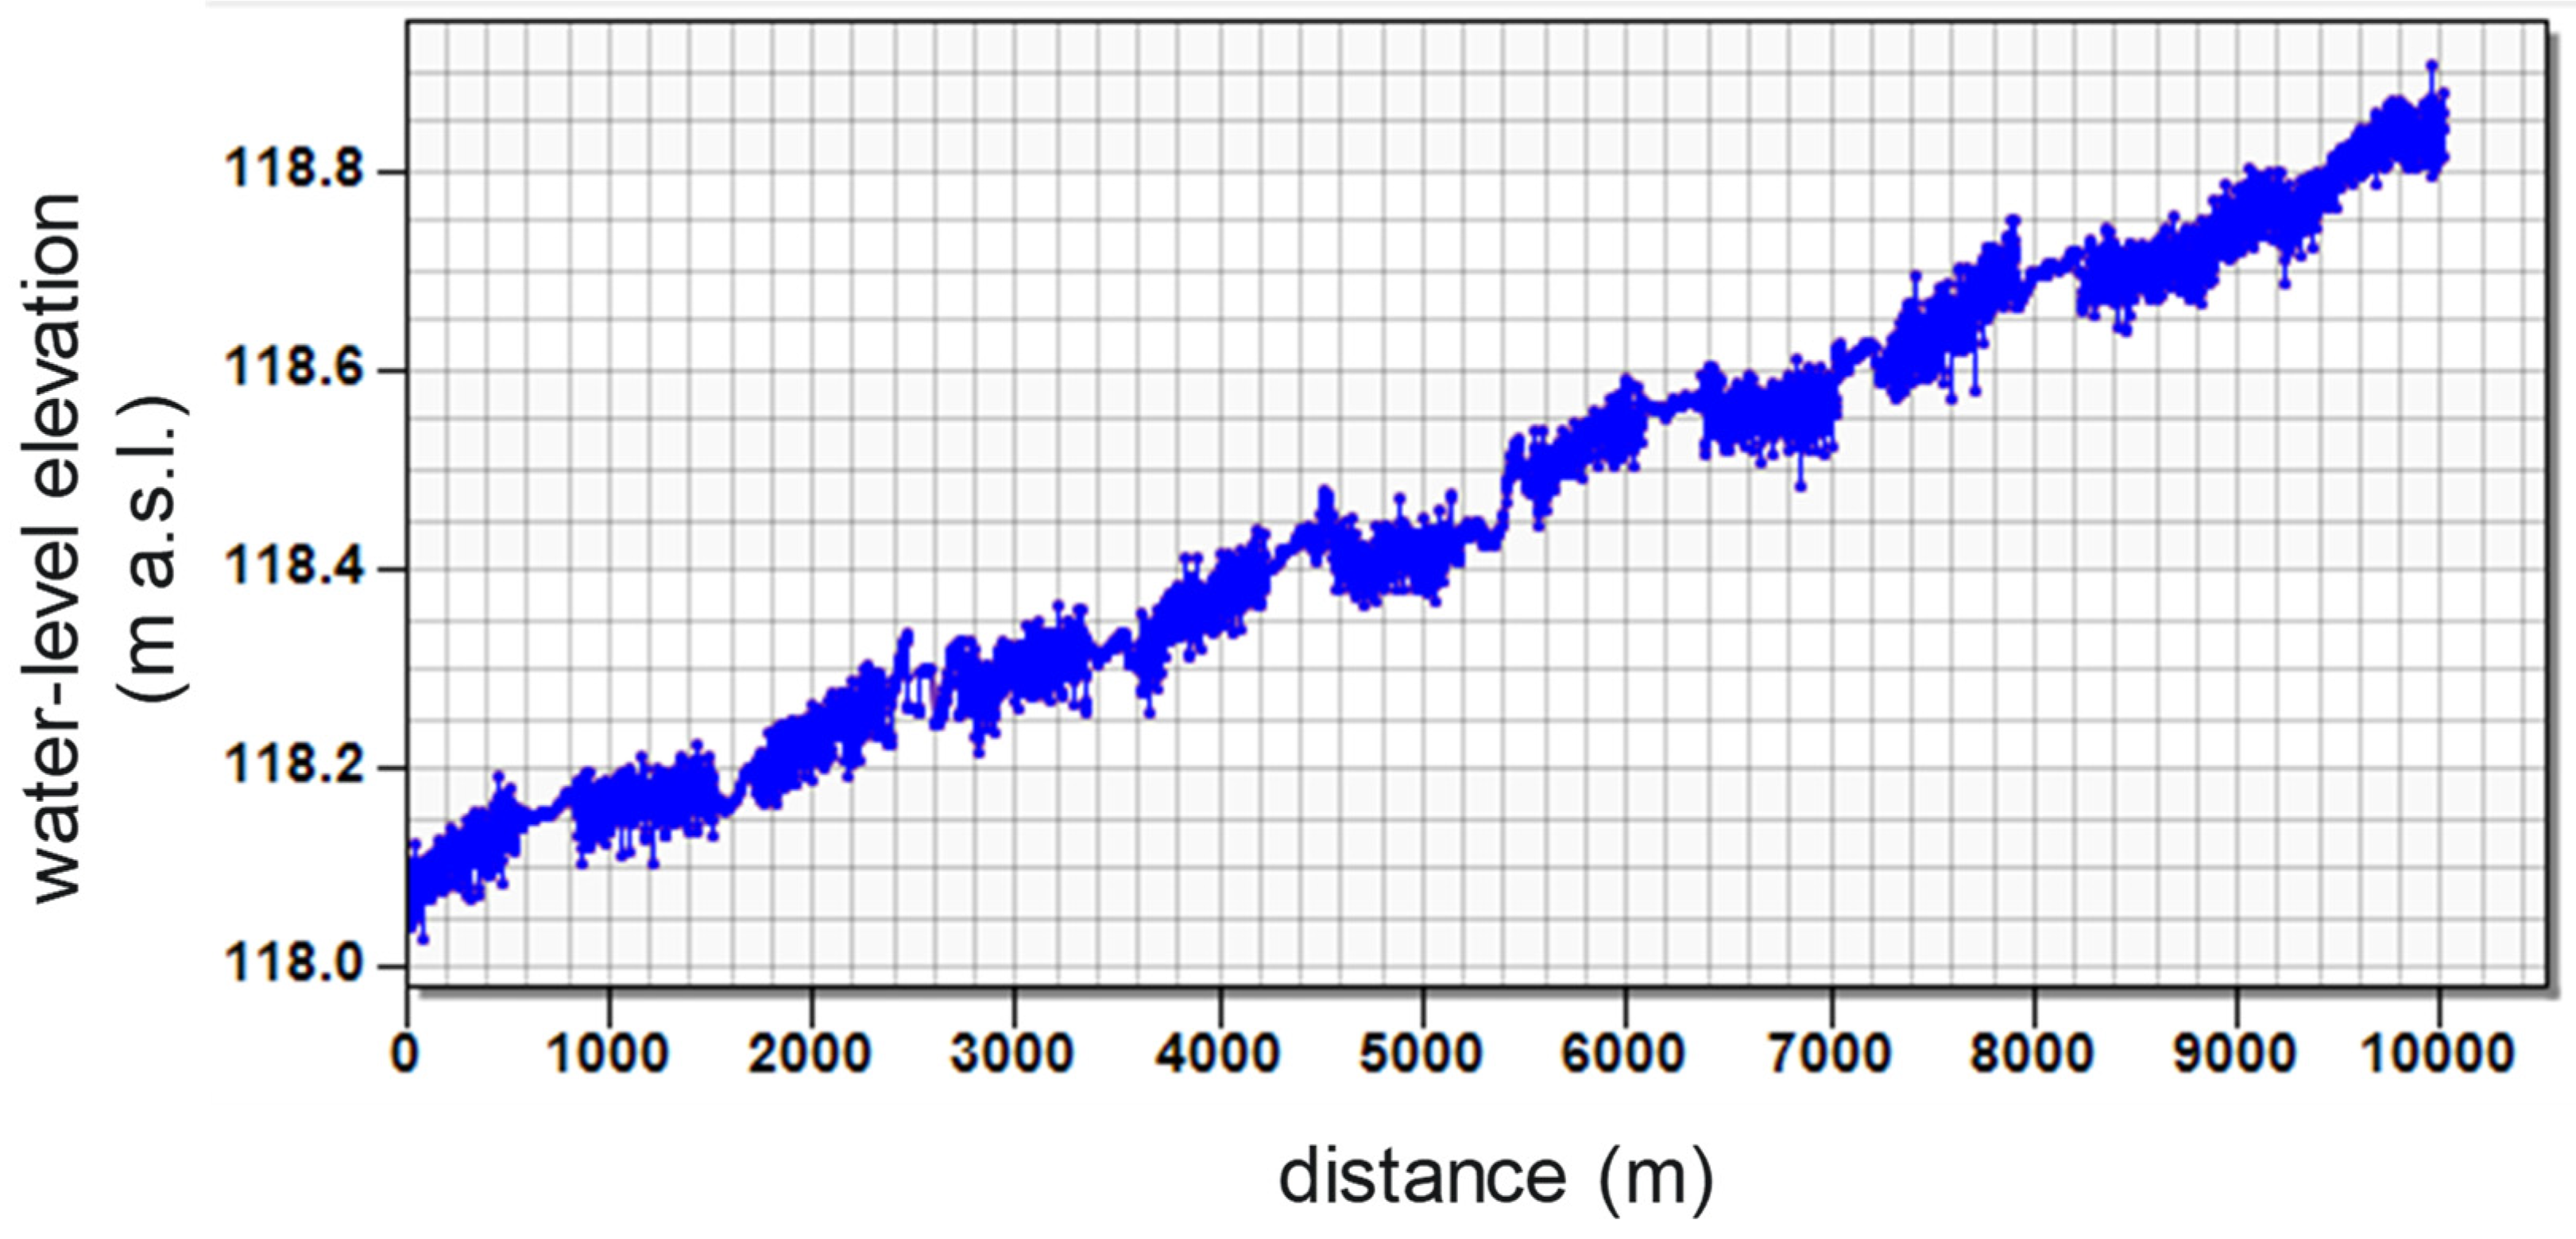
The digital terrain map for Fort Simpson is provided in Figure 9. Using the software package Watershed Modeling System (WMS 11.2) from Aquaveo (Provo, UT, USA), arcs (lines) were extended along the river centre near the gauge site from which water-surface elevations were extracted and graphed along their corresponding distances along the arc (Figure 10) to determine the slope, which is 0.000075 for Fort Simpson.
Extracted from Google Earth, river widths at Fort Simpson range between 1550 and 1600 m. Values, along with other hydrological characteristics, are provided in Table 2.
(IV to VI) Range of parameters fo, fifo and μ:
The composite friction parameter was calibrated to range between 0.045 and 0.055, as indicated, along with other parameter ranges, in Table 3. This resulted in non-dimensional discharge and stage ranges of 22–482 and 22–157, respectively, at Fort Simpson. The ratio of the ice friction factor to the composite friction factor was calibrated to vary between 1.45 and 1.55, which is also tabulated in Table 3. For the calibration, the ice strength parameter ranged between 0.7 and 1.3, also recorded in Table 3.
(VII to VIII) Gauged reach backwater level depths calculations:
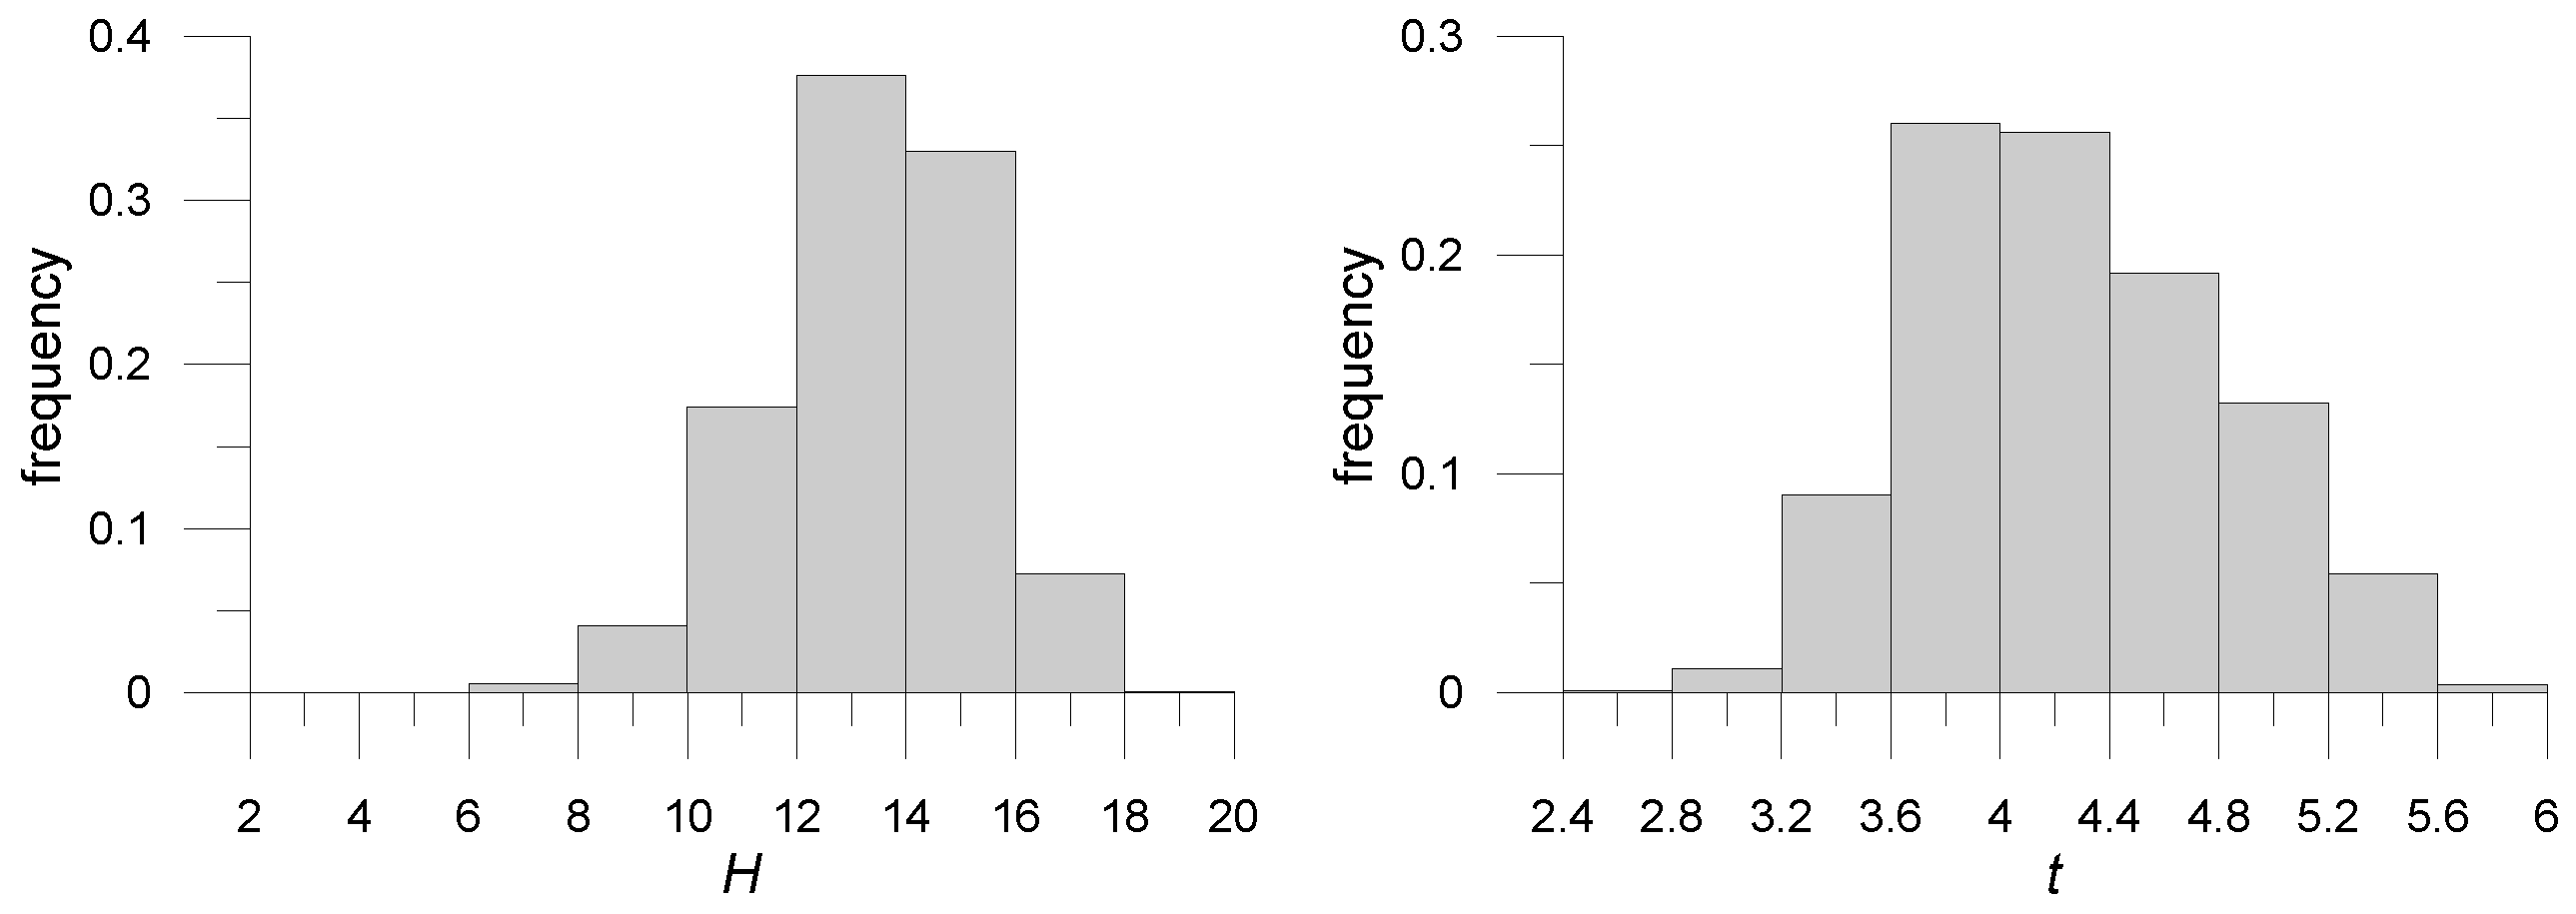
Equations (1) and (4) were set up in a Monte Carlo framework in which ξ and η were calculated 10,000 times, with each calculation having a different set of parameters drawn randomly from distributions to yield 10,000 depth H values (Equation (3)) and maximum ice-jam thicknesses t values (Equation (6)). Histograms of H and t are provided in Figure 11.
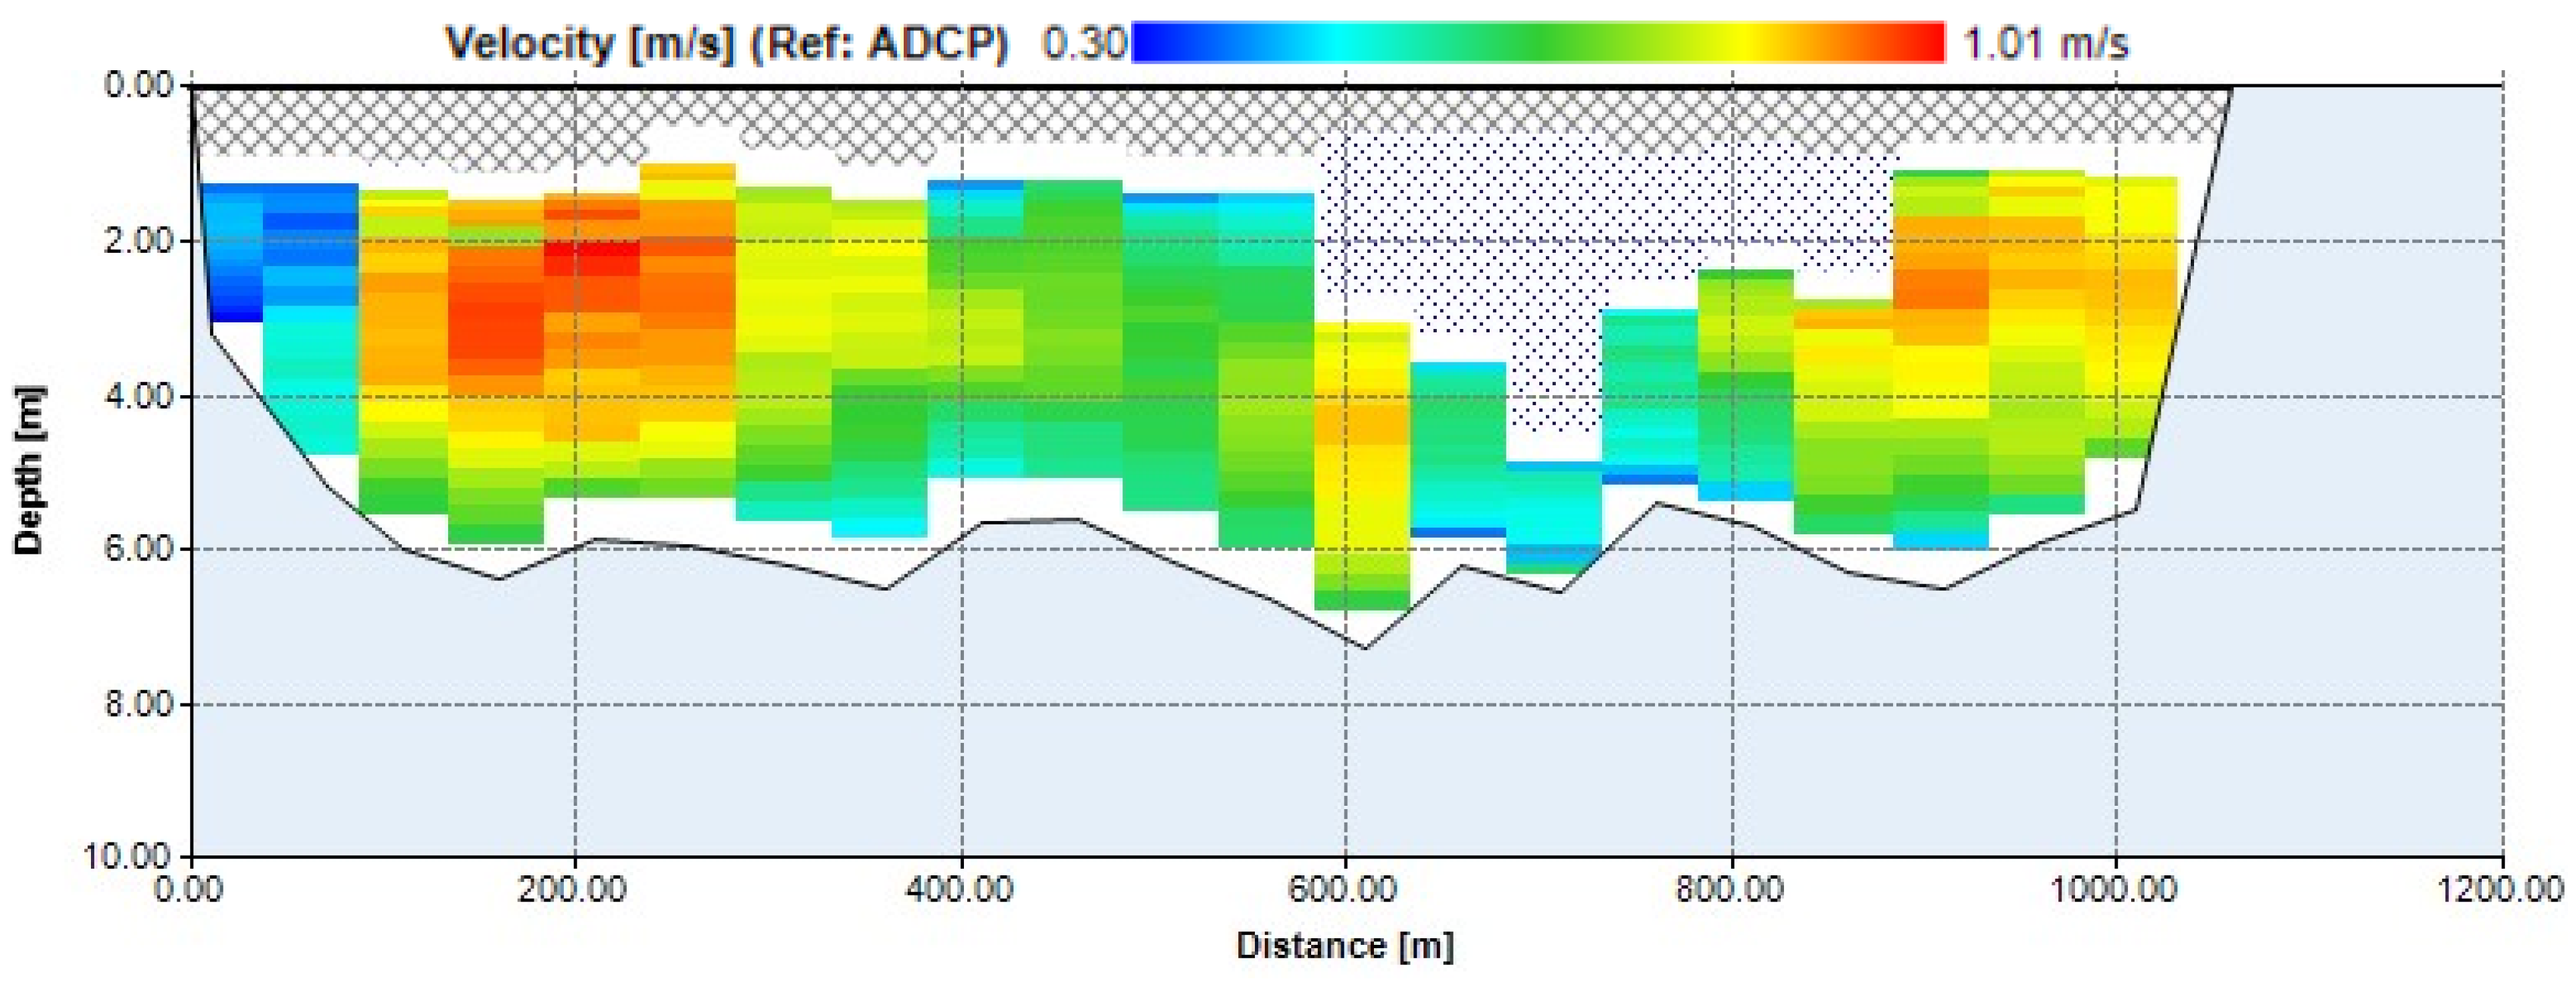
The geodetic elevation of the thalweg is then added to these values to obtain geodetic elevations of the water-level elevations (Step IX). An example of a cross-section surveyed on 16 March 2022 at the gauge located at Fort Simpson is shown in Figure 12. The maximum depth of the cross-section was 6.99 m. The water-level elevation recorded on that day at the gauge was 115.796 m a.s.l., and thus the thalweg elevation was 108.806 m a.s.l.
(IX to XII) Return periods of backwater-level elevations at gauged reach:
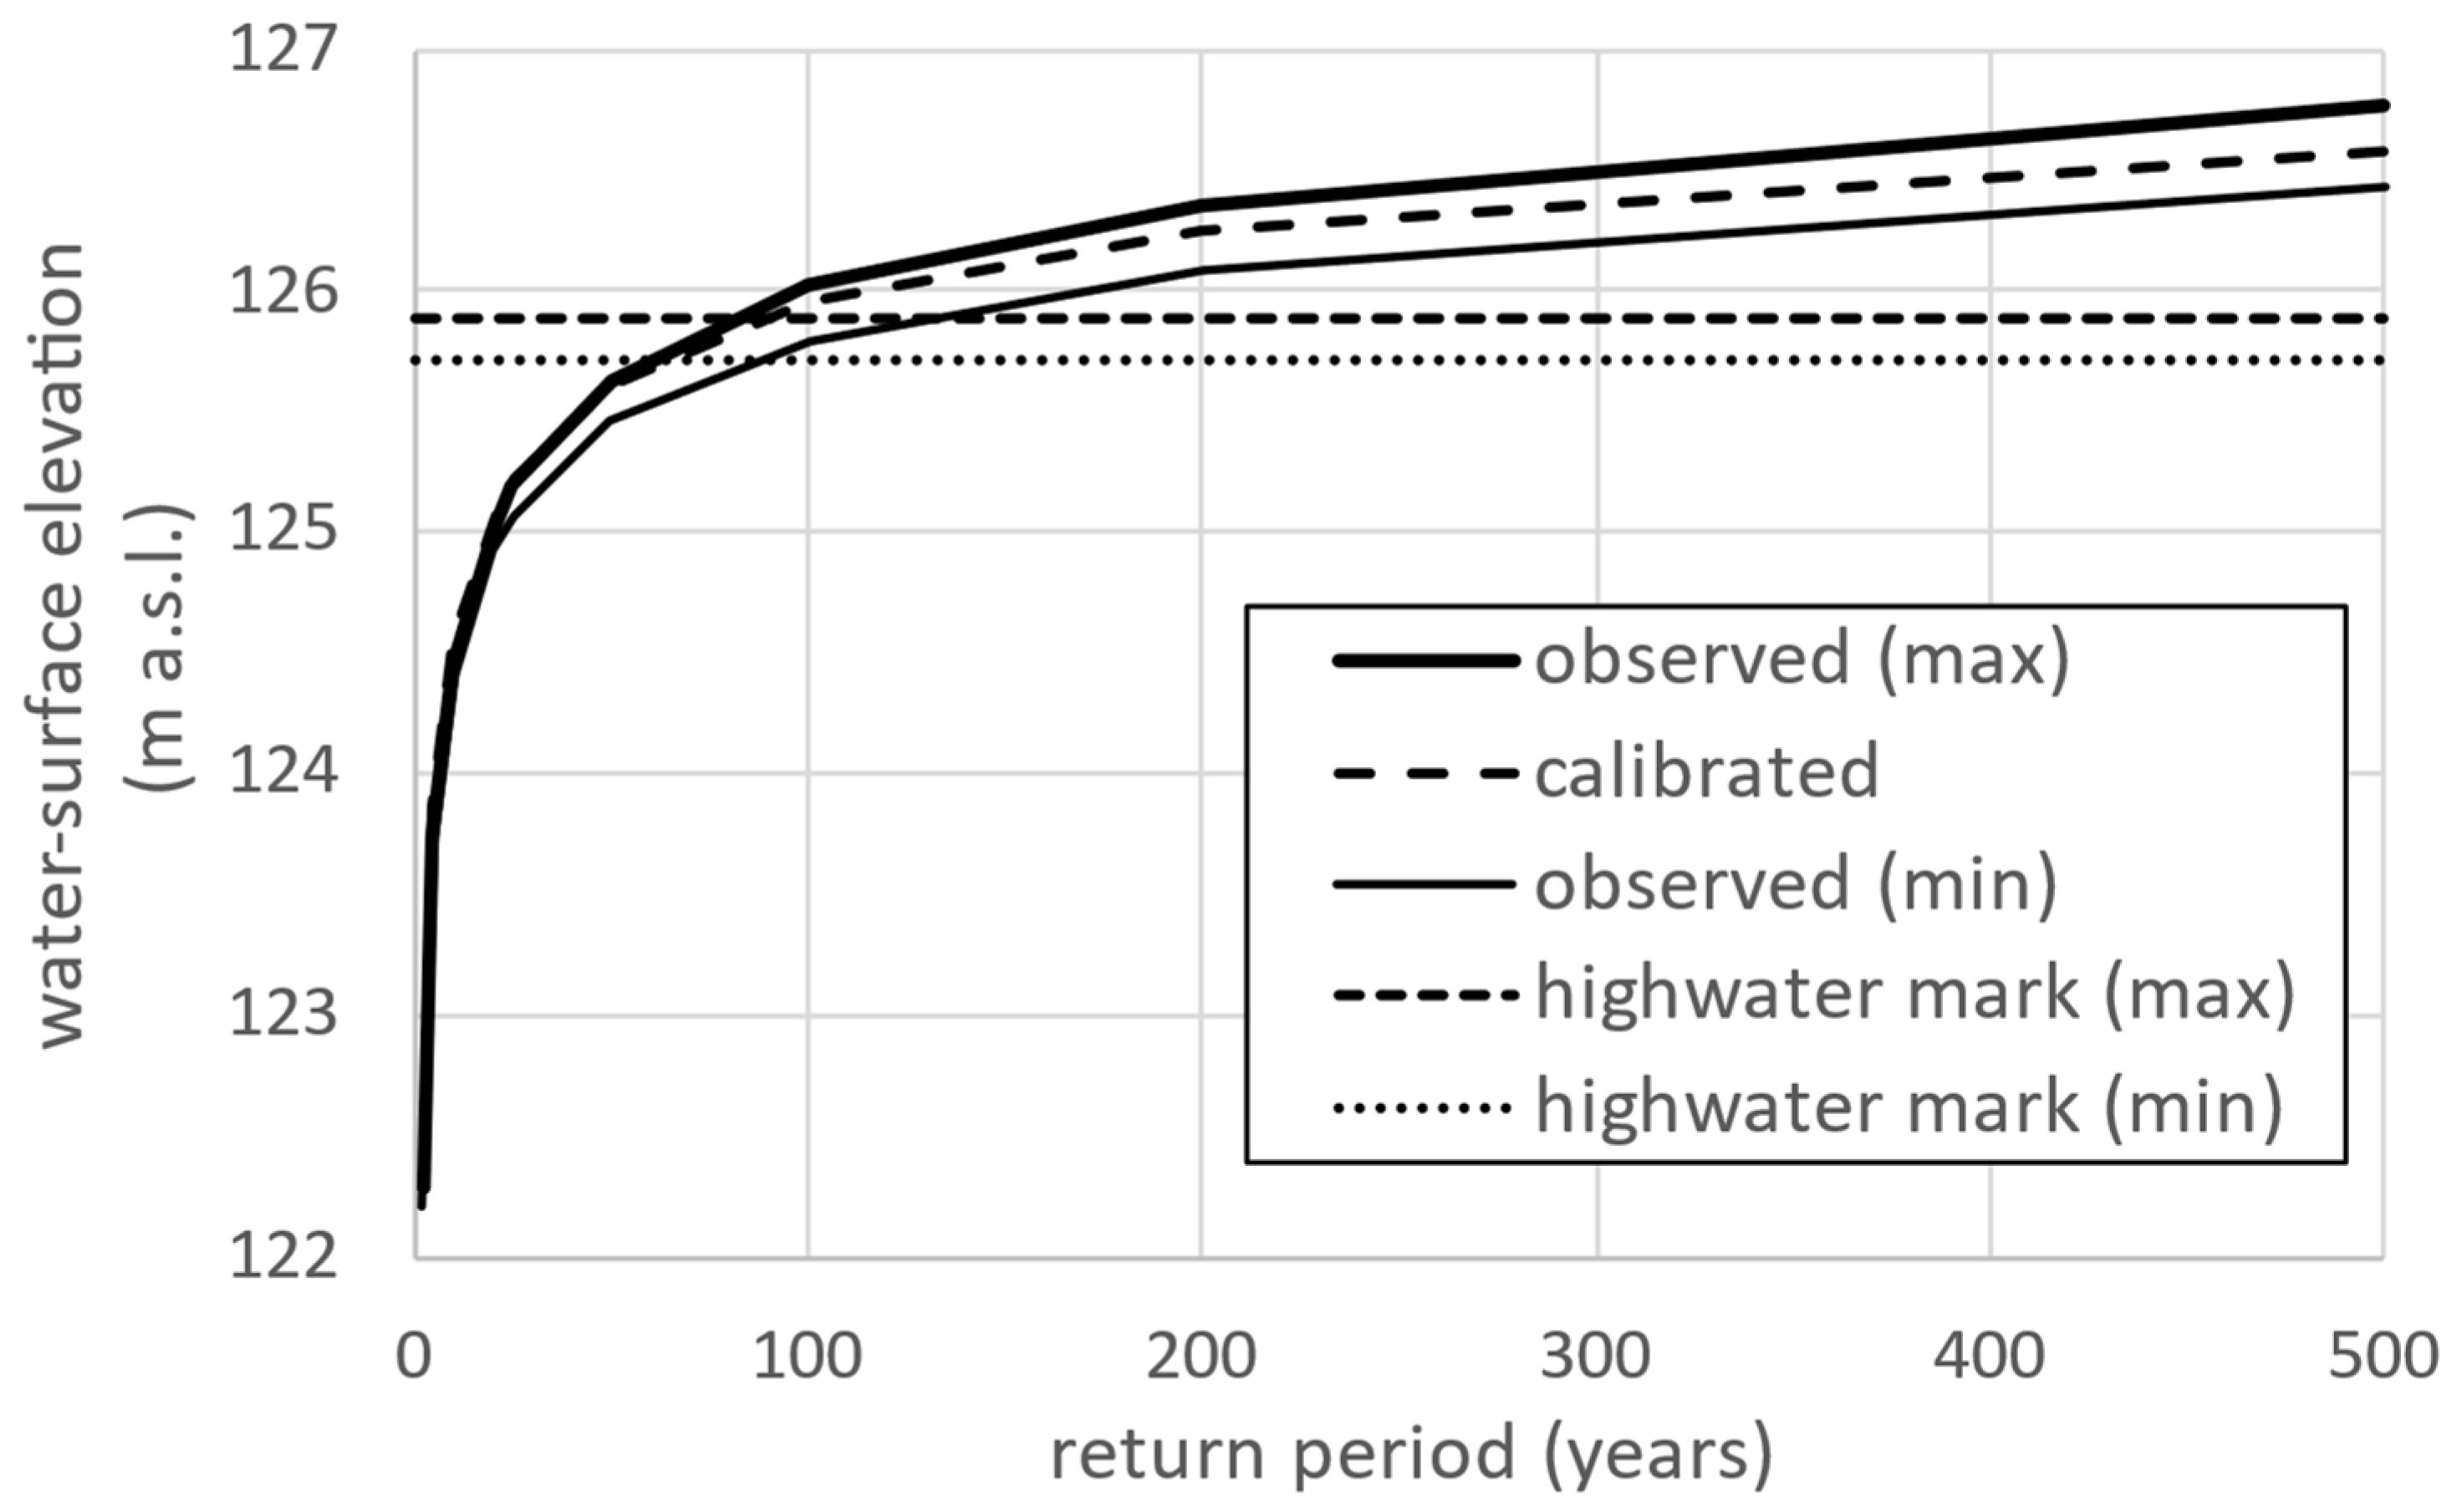
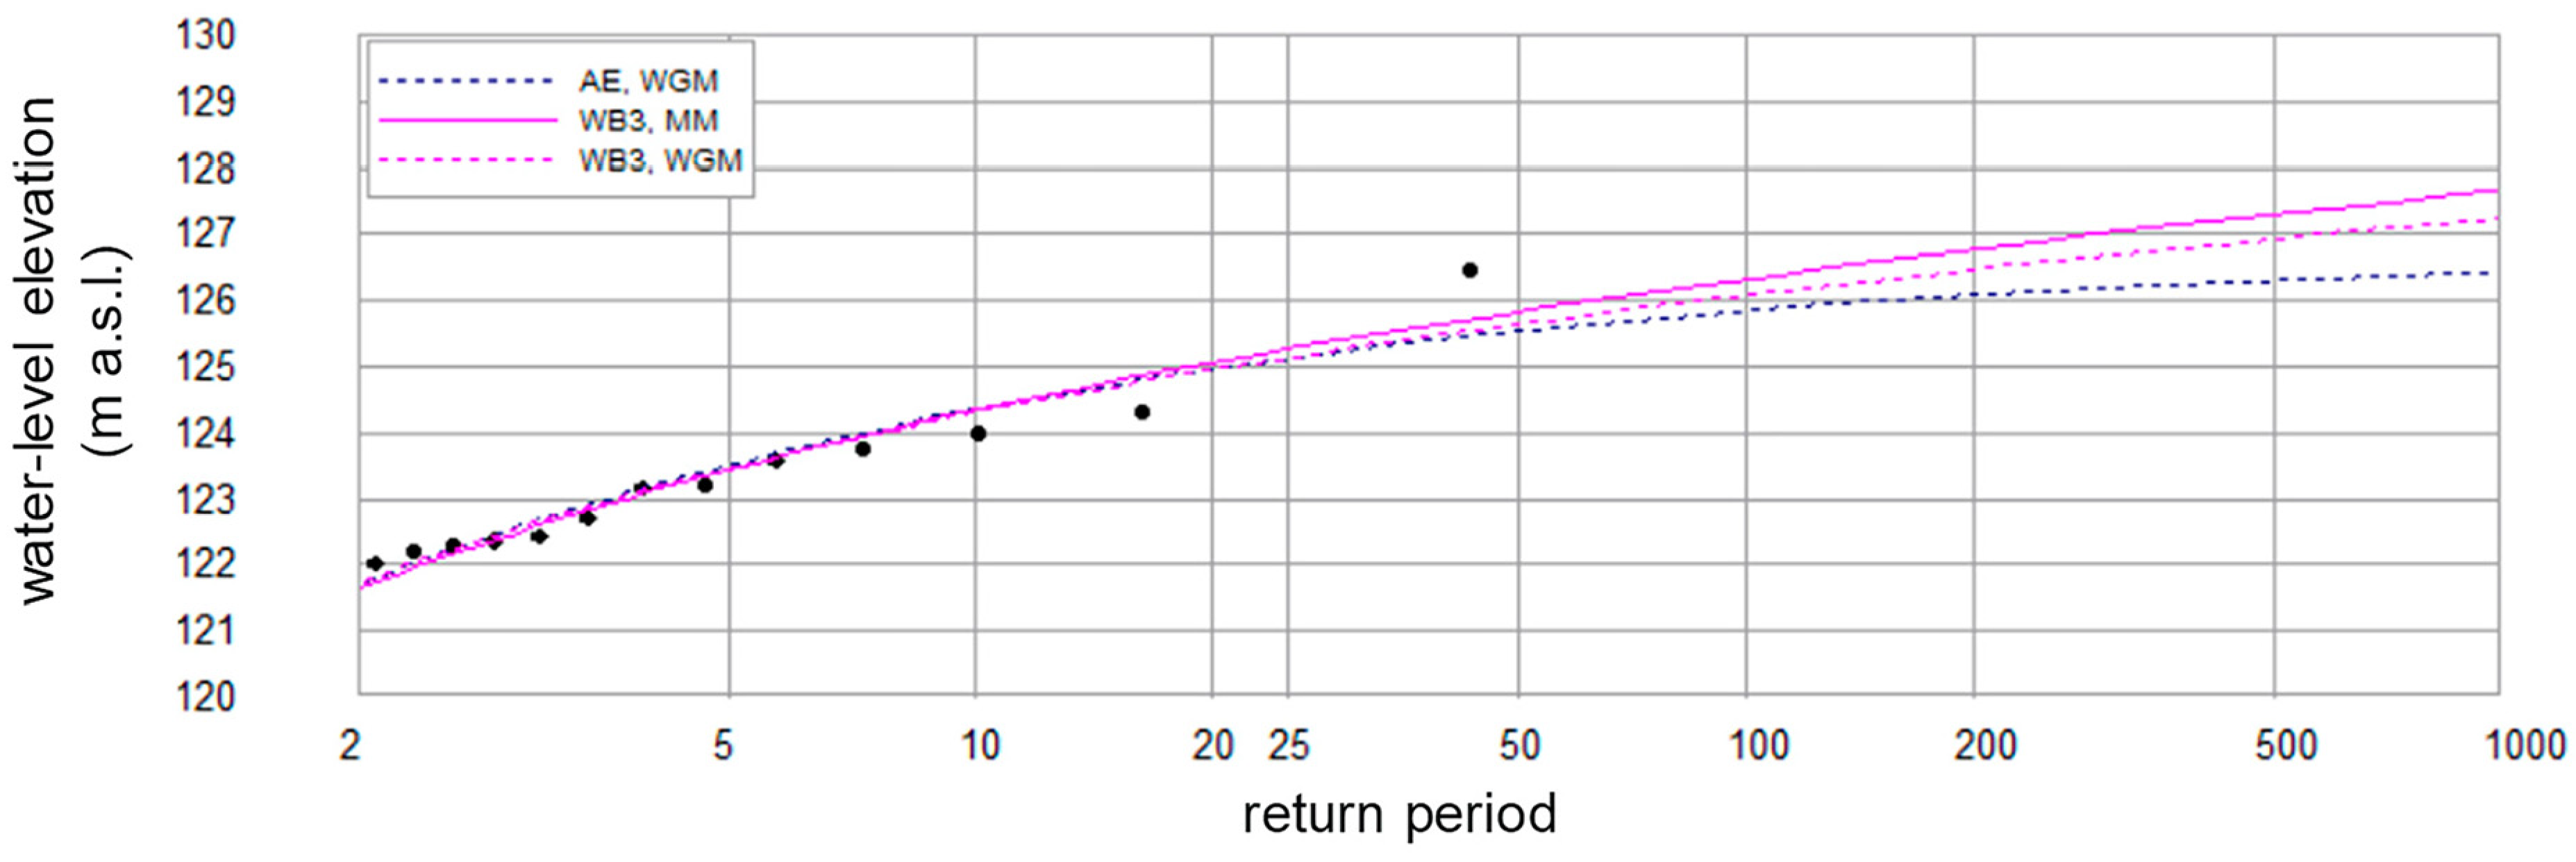
Percentiles that correspond to the AEP (see Table 4) were then extracted from all the water level elevation values and plotted in Figure 13. The parameters fo, fi/fo and μ were adjusted until the calculated stage frequency curve lay between the observed maximum- and minimum-stage frequency curves, as shown in Figure 13. Maximum and minimum highwater marks surveyed from the 2021 ice-jam flood event [12] are included for comparison. The 1:100 and 1:500 AEP values along the ice-jam flood hazard curve are, respectively, about 0.25 and 1 m above the average highwater mark elevations.
The three best-fitting frequency distributions of the instantaneous water-level elevation maxima recorded each year during ice-cover breakup are shown in Figure 14.

3.3. Monte Carlo Analysis Framework to Extrapolate Parameterisation to the Ungauged Reach at the Jean Marie River

(i) Flow frequency distribution at Strong Point:
For the Jean Marie River ice-jam flood hazard assessment flows at the end-of-breakup recorded at Strong Point were used instead of at Fort Simpson to exclude the flows from the Liard River entering the Mackenzie River between Fort Simpson and the Jean Marie River. A frequency distribution, shown in Figure 15, was derived from the flows, and was used to generate random values as input to the dimensionless discharge ξ of Equation (1) for the Jean Marie River. For the Monte Carlo Analysis, a frequency distribution of these flows is required (shown in Figure 7), from which values can be extracted randomly. The generalised extreme value distribution (AE) provided the best fit to the data (lowest Kolmogorov–Smirnov difference).
(ii to iii) Ungauged reach slope and range of widths:
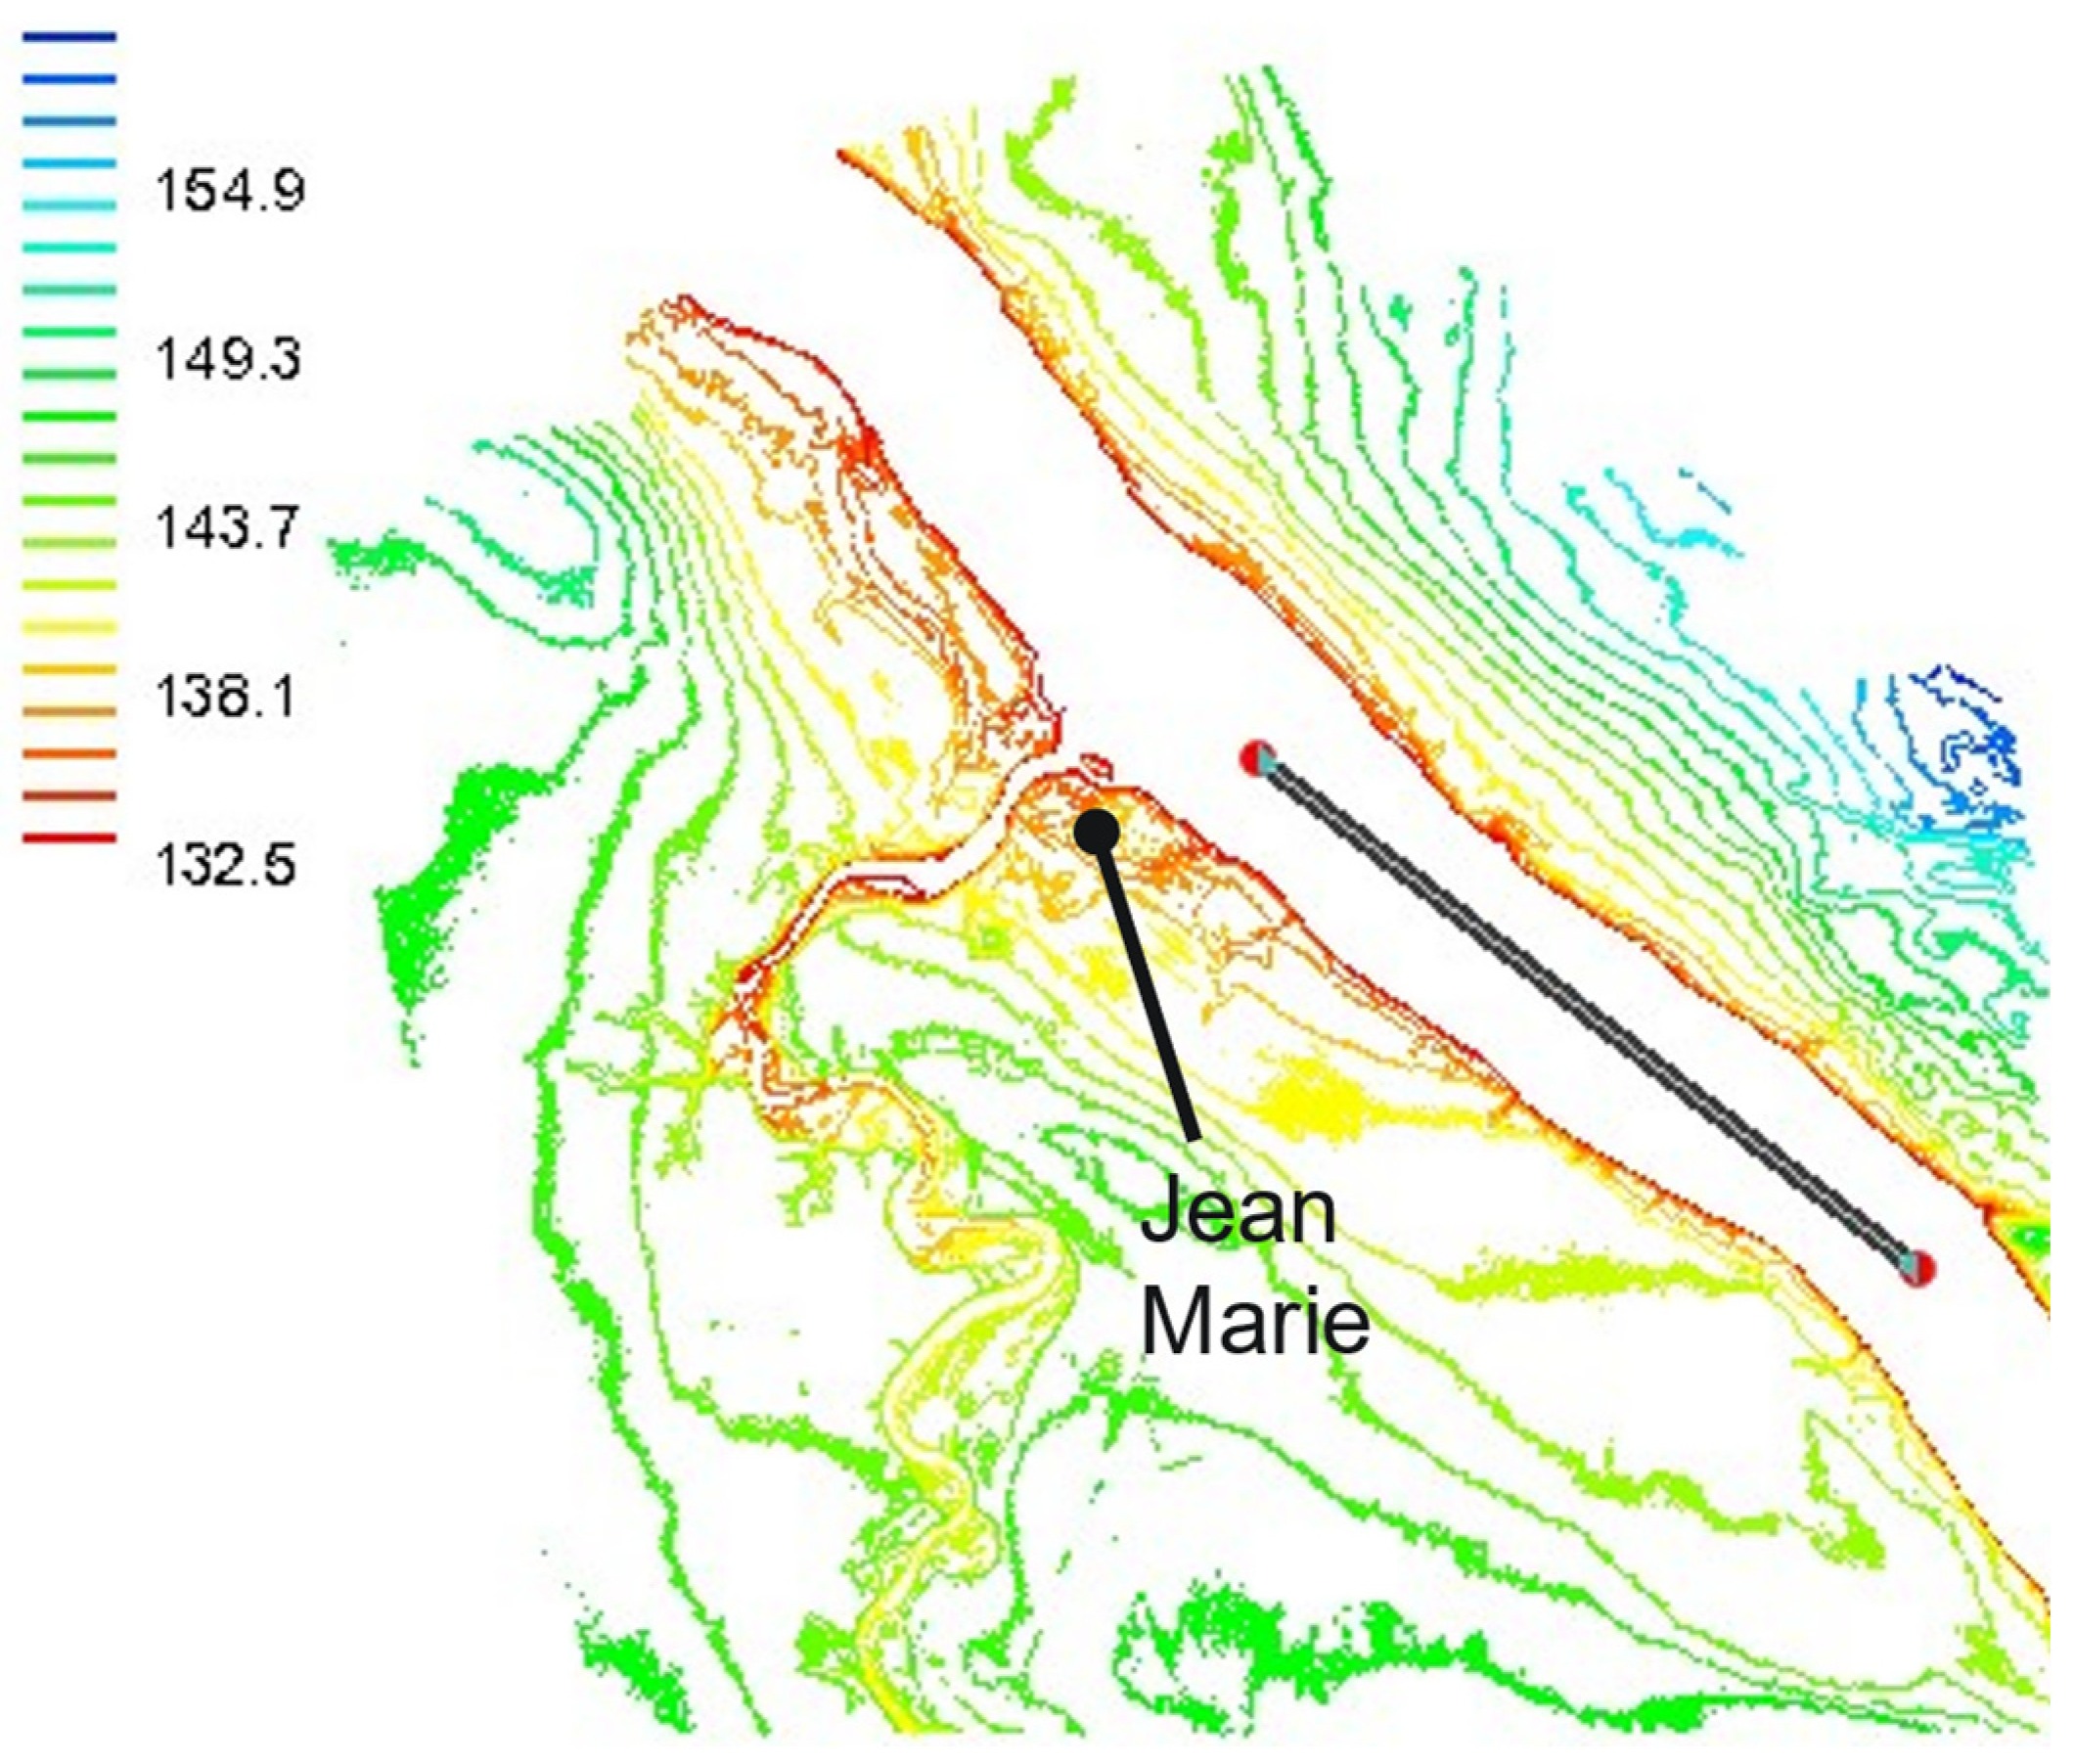
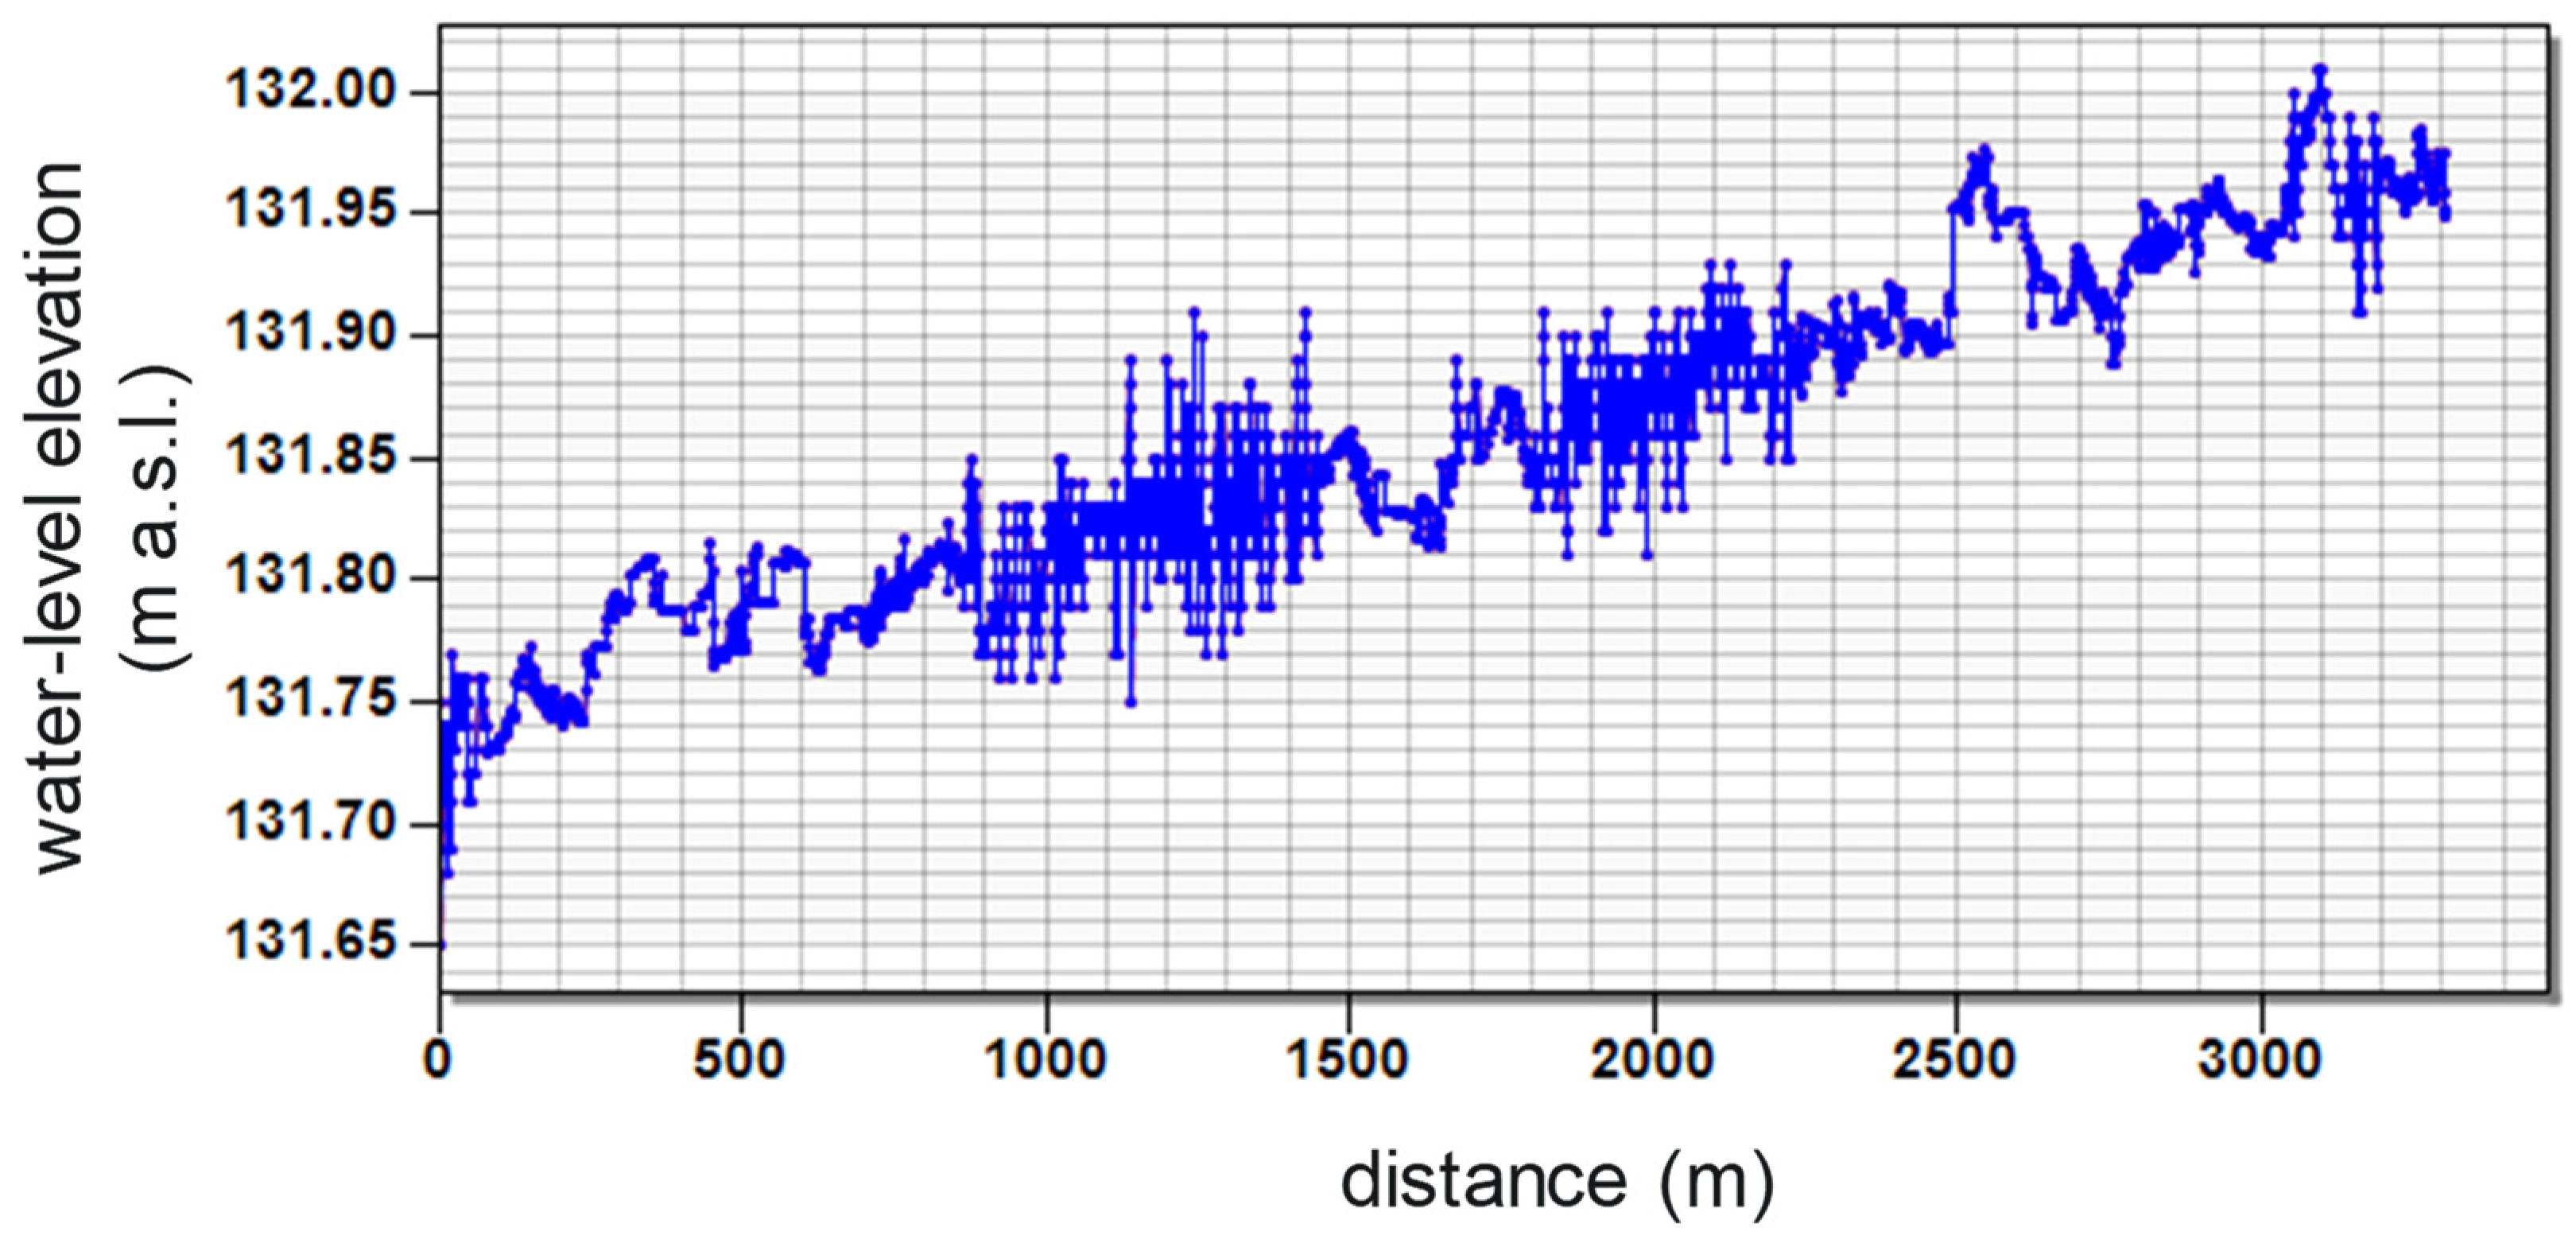
The slope and ranges for river widths in the Monte-Carlo framework for the ungauged reach were adjusted from the values used in the framework of the gauged reach. The digital terrain model of the Jean Marie River area (Figure 16) allowed the river slope at the site to be calculated. Water-surface elevations were extracted along an arc, a longitudinal line drawn approximately along the centre of the river and graphed along their corresponding distances along the arc (see Figure 17) to determine a slope of 0.000068 for the Jean Marie River. River widths range between 850 and 900 m for the Jean Marie River.
(iv to vi) Extrapolated set of parameters fo, fifo and μ:
The same ranges of parameter values calibrated for Fort Simpson were then applied to the settings at the Jean Marie River.
(vii to viii) Gauged reach backwater-level depth calculations:
A large source of uncertainty is the depth of the thalweg at the ungauged site. Since no bathymetry was available for the Jean Marie River, the same value as that at Fort Simpson was used. The geodetic elevation of the thalweg at the Jean Marie River was increased by the amount corresponding to the difference in elevations extracted at the river centres from the digital terrain models (Figure 8 and Figure 16).
(ix to x) Return periods of backwater level elevations at ungauged reach:
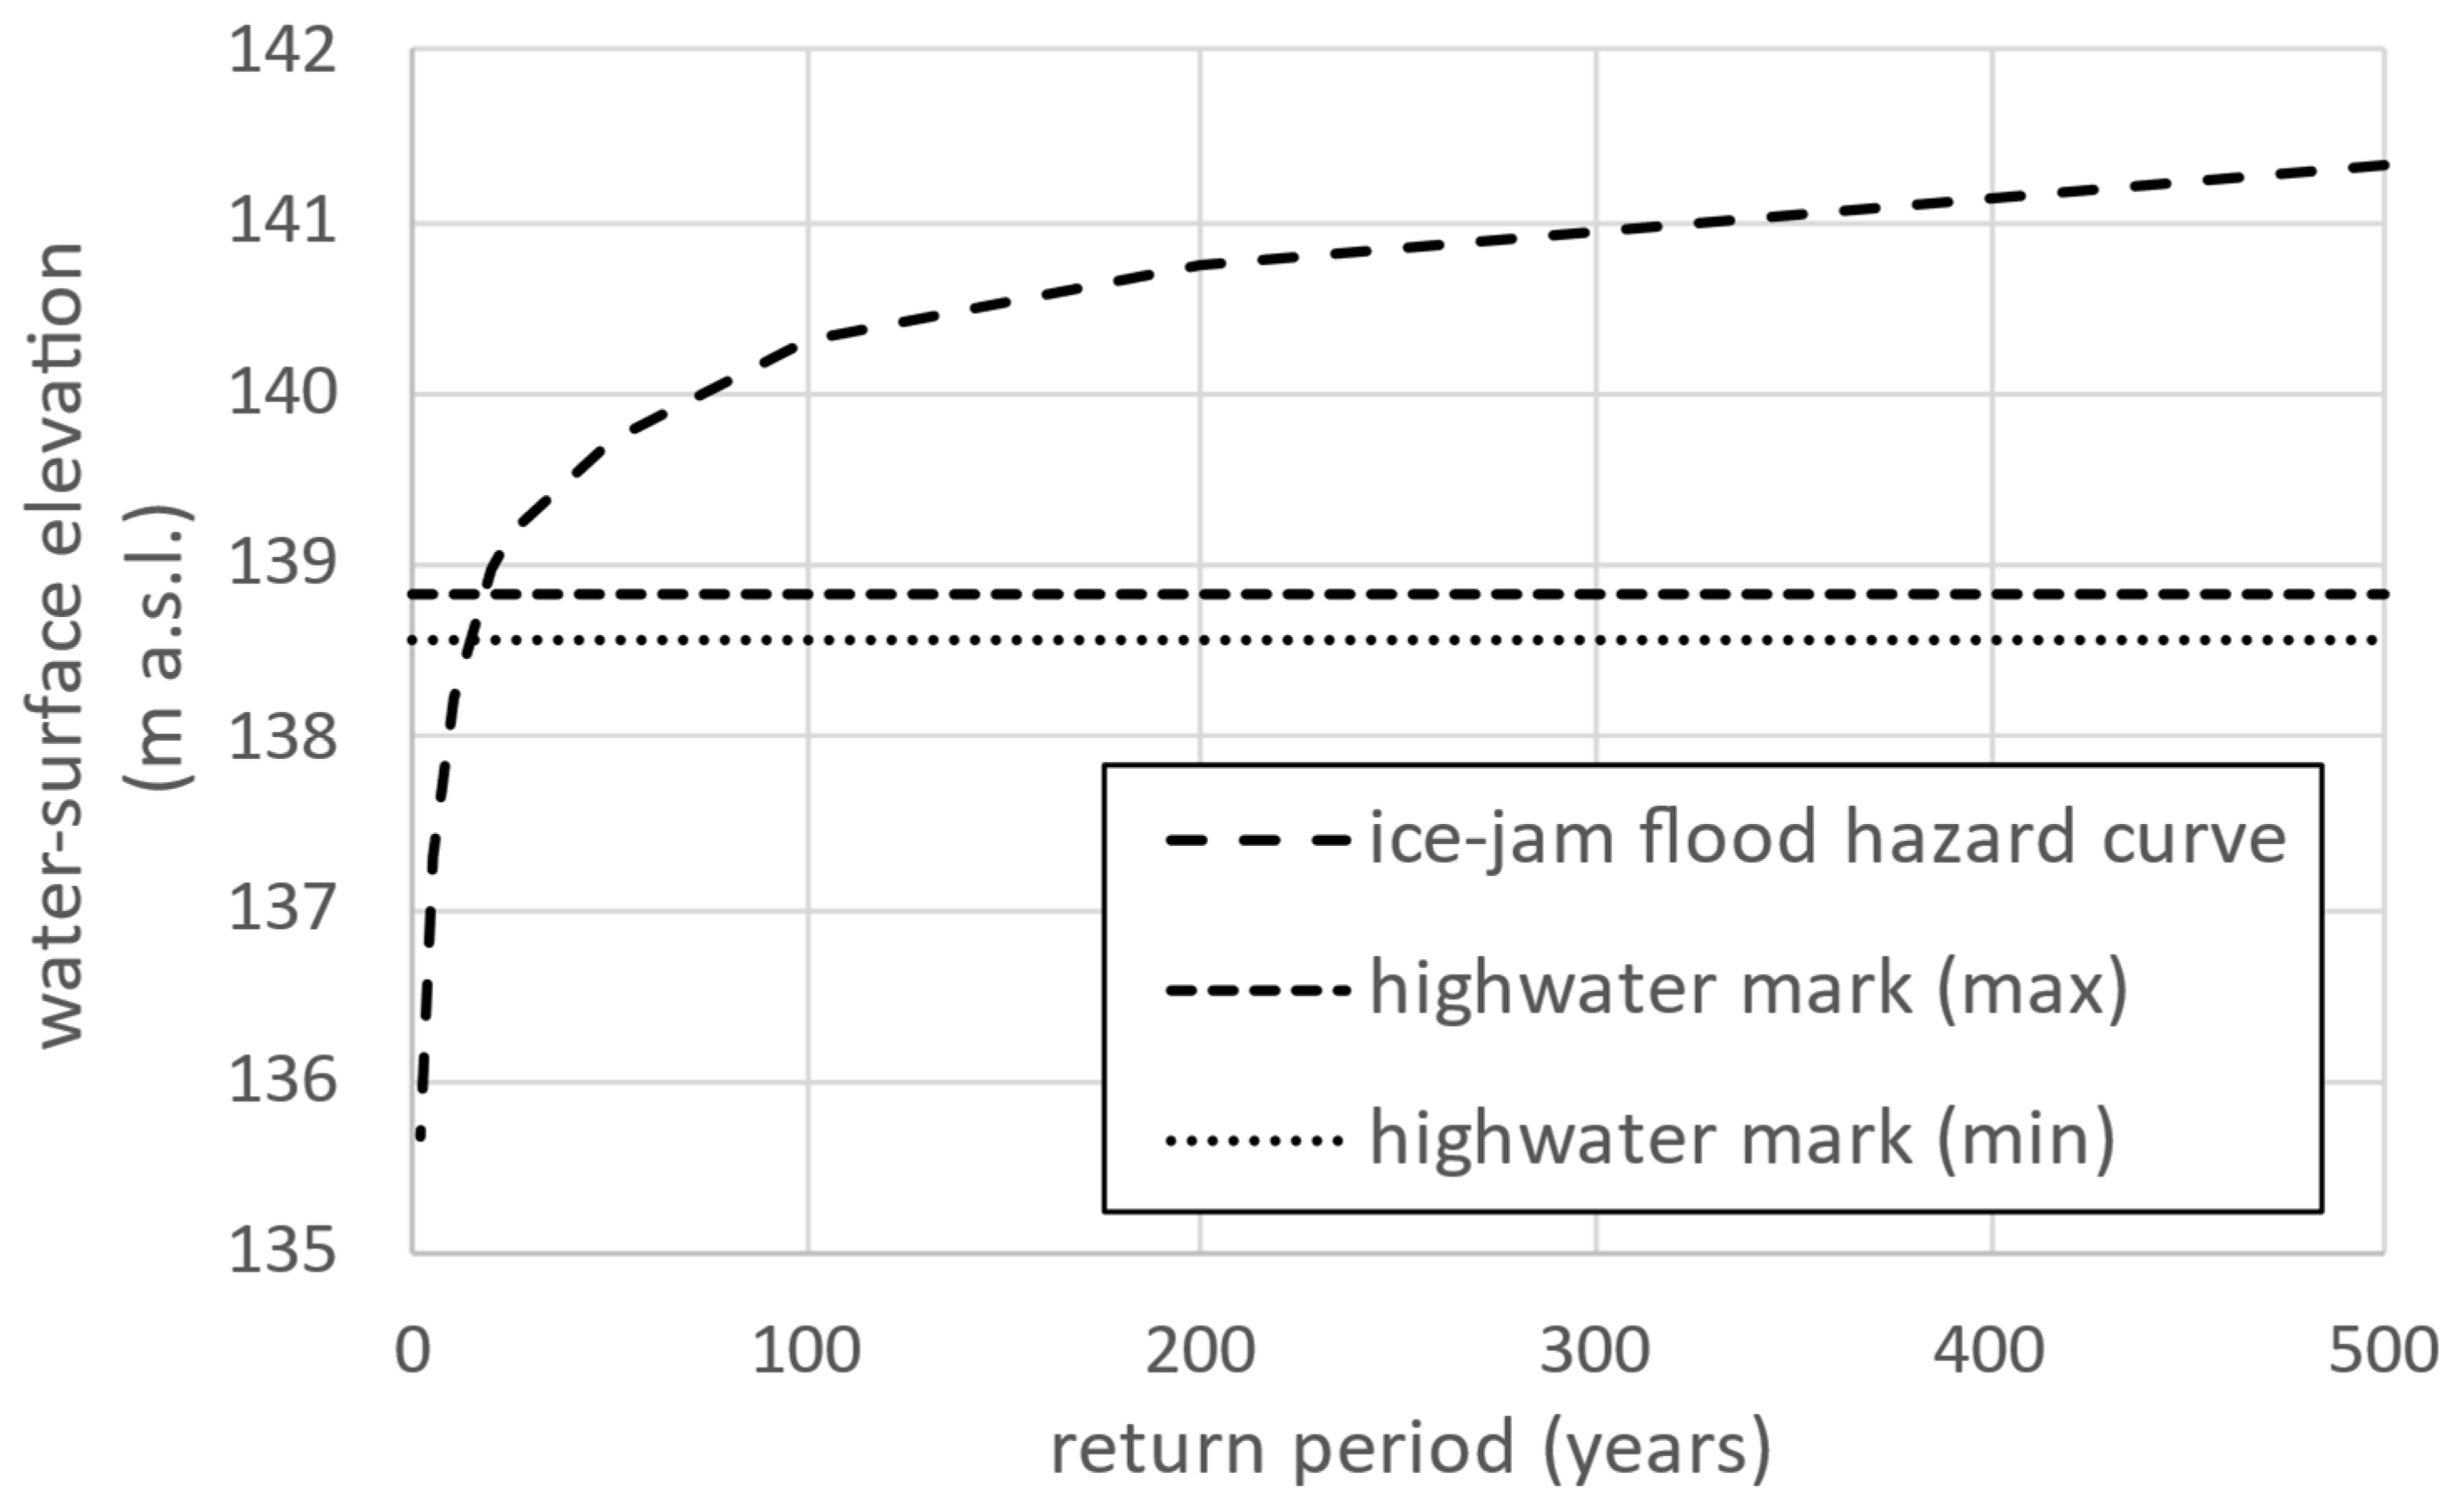
Again, percentiles corresponding to the required return periods were calculated from the group of backwater depths. These depths were added to the estimated thalweg elevations to obtain the set of backwater level elevations. The corresponding stage frequency distribution for the Jean Marie River is provided in Figure 18. Maximum and minimum highwater marks [12] from the 2021 ice-jam flood event are superimposed onto the graph for comparison.
The 1:100 and 1:500 AEP values along the ice-jam flood hazard curve are, respectively, about 1.5 and 2.5 m above the average highwater mark elevations. These increments are higher than those at Fort Simpson. It is expected that the increments are somewhat greater at the Jean Marie River, since the river there is narrower and more incised than at Fort Simpson. Also, there is no large tributary at the Jean Marie River, in contrast to the Liard River at Fort Simpson, where floodwaters can backflow (the Jean Marie River is a much smaller tributary to the Mackenzie River). A field survey to determine the thalweg elevation would bring more certainty to the community’s hazard assessment.

4. Conclusions

The empirical approach of non-dimensional discharge and stage was successfully implemented to estimate the ice-jam flood hazard at the gauged community of Fort Simpson. This, in turn, allowed a successful extrapolation of the hazard assessment to the ungauged community of the Jean Marie River. The largest source of uncertainty in the extrapolated hazard assessment is the elevation of the thalweg at the ungauged site.
The lack of data to verify the stage-frequency distributions at the ungauged site is problematic. Although high water marks do provide some guidance as to the severity of the estimated distributions, it is difficult to allot the marks to certain AEP levels. Elevations of scars on trees impacted by past ice jams [13] and space-borne remote sensing imagery of the extent of past ice-jam flooding [14] could provide independent data to establish such distributions for verification.

Author Contributions

Conceptualization, K.-E.L.; methodology, K.-E.L.; validation, K.-E.L.; formal analysis, K.-E.L.; investigation, K.-E.L.; resources, K.-E.L., A.C. and J.S.; data curation, A.C.; writing—original draft preparation, K.-E.L.; writing—review and editing, J.S.; visualization, K.-E.L.; project administration, K.-E.L. and A.C.; funding acquisition, A.C. All authors have read and agreed to the published version of the manuscript.

Funding

Funding for this project was provided by the Government of Northwest Territories and the Government of Canada, under the Flood Hazard Identification and Mapping Program (FHIMP); fund number 1-427286-1323-8000.

Data Availability Statement

The authors do not have permission to share the third-party data used in this study.

Acknowledgments

A special thank you to Water Survey of Canada for preparing the gauge and ADCP data used in this project. The funders helped with the collection of data and by proof-reading and commenting on the manuscript to refine its contents.

Conflicts of Interest

The authors declare no conflicts of interest.

References

  1. Lindenschmidt, K.-E.; Das, A.; Rokaya, P.; Chu, T. Ice jam flood risk assessment and mapping. Hydrol. Process. 2016, 30, 3754–3769. [Google Scholar] [CrossRef]
  2. NFLD. Newfoundland and Labrador Flood Management Strategy. Prepared by the Water Resources Management Division of the Department of Environment, Climate Change and Municipalities, Government of Newfoundland and Labrador, 26 July 2022. Available online: https://www.gov.nl.ca/ecc/files/Newfoundland-and-Labrador-Flood-Management-Strategy.pdf (accessed on 15 May 2024).
  3. EU. Floods—EU Measures to Manage the Risks Floods Pose to Human Health, the Environment, the Economy and Cultural Heritage. European Union, 2024. Available online: https://ec.europa.eu/environment/water/flood_risk/implem.htm (accessed on 15 May 2024).
  4. Lindenschmidt, K.-E. River Ice Processes and Ice Flood Forecasting—A Guide for Practitioners and Students, 2nd ed.; Springer Nature: Cham, Switzerland, 2024. [Google Scholar] [CrossRef]
  5. NRCan. Federal Hydrologic and Hydraulic Procedures for Flood Hazard Delineation, Version 1.0. From the Federal Flood Mapping Guidelines Series by Natural Resources Canada; 2019. Available online: https://publications.gc.ca/pub?id=9.893845&sl=0 (accessed on 15 May 2024).
  6. NRCan. Federal Hydrologic and Hydraulic Procedures for Flood Hazard Delineation, Version 2.0. Federal Flood Mapping Guidelines Series; 2023. Available online: https://publications.gc.ca/pub?id=9.928283&sl=0 (accessed on 15 May 2024).
  7. Beltaos, S. River ice jams: Theory, case studies and application. J. Hydraul. Eng. 1983, 109, 1338–1359. [Google Scholar] [CrossRef]
  8. Beltaos, S. River Ice Jams; Water Resources Publications, LLC: Highlands Ranch, CO, USA, 1995. [Google Scholar]
  9. Lindenschmidt, K.-E. River Ice Processes and Ice Flood Forecasting—A Guide for Practitioners and Students; Springer Nature: Cham, Switzerland, 2020. [Google Scholar] [CrossRef]
  10. White, K.D. Hydraulic and Physical Properties Affecting Ice Jams (Report 99-11). US Army Corps of Engineers’ Cold Regions Research and Engineering Laboratory, 1999. Available online: https://apps.dtic.mil/sti/pdfs/ADA375289.pdf (accessed on 15 May 2024).
  11. Beltaos, S. River Ice Formation; Committee on River Ice Processes and Environment, Canadian Geophysical Union—Hydrology Section: Edmonton, AB, Canada, 2013. [Google Scholar]
  12. Ollerhead and Associates. Spring 2021 Flood Level Mapping in the Communities of Fort Simpson and Jean Marie River, Northwest Territories; Submitted by Ollerhead and Associated Ltd. to the Government of Northwest Territories, 30 August 2021; Project No. 21-81-MC; Ollerhead and Associates: Yellowknife, NT, Canada, 2021. [Google Scholar]
  13. Lubiniecki, T.I.; Lindenschmidt, K.-E.; Laroque, C.; Rokaya, P. Determining ice-jam stage frequency distributions of an ungauged river reach using dendrogeomorphological data. Int. J. River Basin Manag. 2024, 1–9. [Google Scholar] [CrossRef]
  14. Lindenschmidt, K.-E. Extension and refinement of a stochastic modelling approach to assess ice-jam flood hazard. Hydrol. Res. 2023, 54, 149–164. [Google Scholar] [CrossRef]
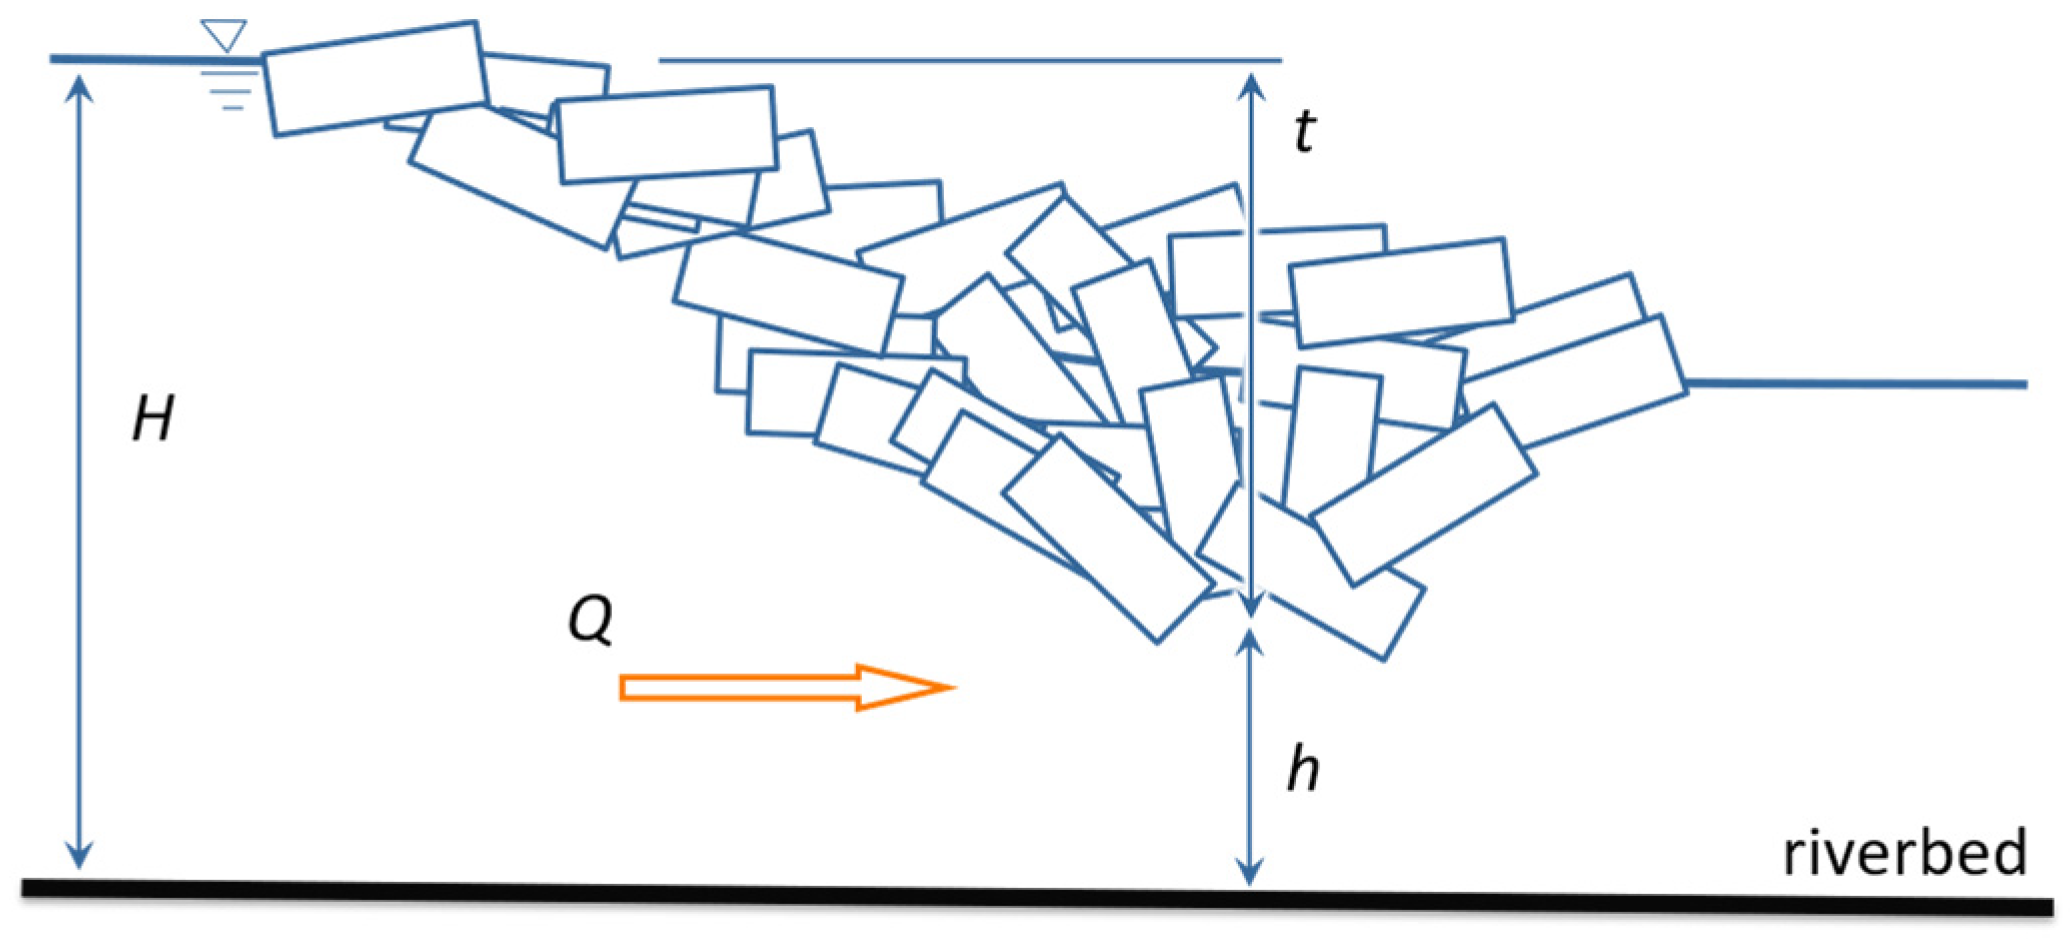
Figure 1. Idealised equilibrium ice jam for a discharge Q showing backwater staging depth H, depth under the ice jam h and ice-jam thickness t (from [4]).
Water 16 01535 g001
Figure 2. Relationship between dimensionless discharge ξ and dimensionless ice-jam stage η for equilibrium ice jams.
Water 16 01535 g002
Figure 3. Conceptualisation of the Monte Carlo framework for the gauged reach.
Water 16 01535 g003
Figure 4. Conceptualisation of the Monte Carlo framework for the ungauged reach.
Water 16 01535 g004
Figure 5. Gauge location for the Jean Marie River reach along the Mackenzie River.
Water 16 01535 g005
Figure 6. Water-level elevations recorded at Fort Simpson for the 1996–2023 timeframe; the year 2020 is magnified in Figure 7 to provide an example of spring breakup, open-water and freezing peaks.
Water 16 01535 g006
Figure 7. Water-level elevations recorded at Fort Simpson for 2020, zoomed in from Figure 6, showing the spring breakup, open-water and freezing peaks.
Water 16 01535 g007
Figure 8. Frequency distributions of flows recorded at the end of spring breakup (flow with last recorded b-flag) at Fort Simpson.
Water 16 01535 g008
Figure 9. Digital terrain map of the Fort Simpson area along the Mackenzie River; surface water elevations extracted along the line (representing a length of 10 km) within the river segment were graphed, as indicated in the next figure, to calculate slope.
Water 16 01535 g009
Figure 10. Surface water elevations along an arc (shown in Figure 9) within the river at Fort Simpson to calculate river slope.
Water 16 01535 g010
Figure 11. Histograms of the resulting backwater depths H (Left panel) and maximum ice-jam thicknesses t (Right panel) for Fort Simpson.
Water 16 01535 g011
Figure 12. Cross-section at the Fort Simpson gauge surveyed on 16 March 2022 for under-ice flow calculations using an ADCP (provided by the Water Survey of Canada).
Water 16 01535 g012
Figure 13. Calibrated stage frequency curve within the minimum/maximum bounds of the three best-fitted stage frequency distributions of the observed data.
Water 16 01535 g013
Figure 14. Frequency distributions of ice-induced water-level peaks recorded by the Fort Simpson gauge.
Water 16 01535 g014
Figure 15. Frequency distributions of flows recorded at the end of spring breakup (flow with last recorded b-flag) at Strong Point.
Water 16 01535 g015
Figure 16. Digital terrain map of the Jean Marie River along with the Mackenzie River; surface water elevations extracted along the line (representing a length of 3.6 km) within the river segments were graphed, as indicated in the next figure, to calculate slope.
Water 16 01535 g016
Figure 17. Surface water elevations along the arc, located in the previous figure, within the river at the Jean Marie River to calculate the river slope.
Water 16 01535 g017
Figure 18. Calculated stage frequency distribution at the Jean Marie River.
Water 16 01535 g018
Table 1. Typical ranges of fo, fi/fo, and μ for different riverbed slopes compiled from Beltaos [7,11] and Lindenschmidt.
Slope (-)fofi/foμExample Sites
0.0001–0.0003<0.11.4–1.51.2–1.3Thames River; Churchill River
(Labrador)
0.0003–0.00040.3–0.41.3–1.70.8–1.6Athabasca River near Fort McMurray;
upper Dauphin River; Red River
0.0007–0.00100.1–0.70.6–1.50.6–1.2Smoky River; Athabasca River upstream of Fort McMurray; lower Dauphin River
Table 2. Hydrological characteristics at Fort Simpson and the Jean Marie River.
LocationGross Drainage Area (km2)SlopeWidth Range (m)DEM Water Surface Elevation (m a.s.l.)Thalweg Elevation (m a.s.l.)
Fort Simpson1,300,0000.0000751550–1600118.6108.806
Jean Marie Riverna0.000068850–900131.8122.006
Table 3. Calibrated and transferred ranges of parameters fo, fi/fo and μ, with resulting ranges of non-dimensional discharge ξ and stage η at Fort Simpson and the Jean Marie River.
Reachfofi/foμξ (xi)η (eta)
Fort Simpson0.045–0.0551.45–1.550.7–1.322–48222–157
Jean Marie River0.045–0.0551.45–1.550.7–1.3433–1246130–346
Table 4. Return period values with corresponding probabilities and percentiles.
return period5002001005025201052
probability %0.2%0.5%1%2%4%5%10%20%50%
percentile0.9980.9950.990.980.960.950.90.80.5
Disclaimer/Publisher’s Note: The statements, opinions and data contained in all publications are solely those of the individual author(s) and contributor(s) and not of MDPI and/or the editor(s). MDPI and/or the editor(s) disclaim responsibility for any injury to people or property resulting from any ideas, methods, instructions or products referred to in the content.