Article

Effect of Fermentation Time, pH, and Their Interaction on the Production of Volatile Fatty Acids from Cassava Wastewater

by
Lina Marcela Sanchez-Ledesma
1,*,
Jenny Alexandra Rodríguez-Victoria
1 and
Howard Ramírez-Malule
2,*
1
Escuela de Ingeniería de Recursos Naturales y del Ambiente, Universidad del Valle, Cali 760042, Colombia
2
Escuela de Ingeniería Química, Universidad del Valle, Cali 760042, Colombia
*
Authors to whom correspondence should be addressed.
Water 2024, 16(11), 1514; https://doi.org/10.3390/w16111514
Submission received: 7 April 2024 / Revised: 27 April 2024 / Accepted: 6 May 2024 / Published: 25 May 2024
(This article belongs to the Section Wastewater Treatment and Reuse)

Abstract

:
Acidogenic fermentation is a technology that involves halting methanogenesis in the conventional anaerobic digestion process to produce mainly volatile fatty acids (VFAs). VFAs serve as direct precursors to energy-rich or higher value-added products upon undergoing additional processing. In this study, batch reactors were utilized to assess the individual and interaction effects of fermentation time and pH variables on VFA production from acidogenic fermentation of cassava wastewater through the establishment of a completely randomized design and a second-order response surface (rotatable central composite design), respectively. The maximum VFA production observed was 3444.04 mg of acetic acid (HAc)/L (0.58 gCODVFA/gCOD) in a fermentation time of 6 days, with acetic (48.5%), propionic (28.3%), and butyric (13.6%) acids identified as the main metabolites. Additionally, in the assessment of the effect of pH, the maximum VFA production reached 2547.72 mgHAc/L (0.34 gCODVFA/gCOD) at pH 5.9, and acetic acid was identified as the predominant organic acid. Statistically, the fermentation time and pH variables individually affect VFA production from cassava wastewater; however, the interaction between them generated a non-significant effect.

1. Introduction

For several decades, cassava (Manihot esculenta Crantz) has been considered a valuable source of food, employment, and income for many farming communities in developing countries [1]. Worldwide, the largest cassava production is in Africa (63% of the global volume), with more than 208 million tons in 2022, followed by Asia (29%) and Latin America (7%) [2].
In Colombia, cassava and the products derived from its processing, such as starch, have become the basis of the economy for different populations. Nevertheless, the production process generates potentially polluting effluents due to the high organic load, cyanide concentrations, and pH. These effluents can cause a significant deterioration in the receiving water sources if discharges arrive without prior treatment. Consequently, the water bodies become unfit for other uses such as human consumption, fishing, and recreation [3,4].
Proper management of wastewater from cassava processing can reduce contamination of the ecological environment and promote the development of a circular economy. Previous studies have highlighted anaerobic digestion (AD) as a viable treatment method [5,6]. However, in recent years, there has been growing investigation interest in treating it by means of acidogenic fermentation (AF) [7,8,9], a stage within conventional AD.
AF not only reduces organic matter and mitigates environmental impact but also generates value-added chemical compounds, such as volatile fatty acids (VFAs). VFAs have diverse applications in chemical and biological processes (e.g., biological nutrient removal, bioplastic production, feedstock in the pharmaceutical, chemical, and food industries, etc.) [10,11] and are usually refined from petroleum. Petroleum-based production methods supply about 90% of the demand of this market [12]. These methods involve the use of high temperatures, pressures, and metals as catalysts [13], as well as greater contribution to environmental pollution, climate change, and scarcity of raw materials [14].
Therefore, biological routes of VFA production have gained considerable attention, as they can use renewable carbon sources (e.g., solid waste and wastewater) as a substrate. Consequently, these processes are more environmentally friendly and become an interesting alternative to replace petrochemical refining [15,16].
Studies in this field typically explore the influence of operational and environmental factors on the process, such as pH, hydraulic retention time (HRT), solids retention time (SRT), temperature (T), organic loading rate (OLR), substrate to microorganism (S/M) ratio, headspace partial pressure, and inoculum [17,18,19,20]. Adequate control of these operational variables is important to ensure high yield and composition of VFA production.
AF of cassava wastewater (CWW) aimed at direct VFA production has been poorly studied [7,8,9]. Hasan et al. [9] evaluated the effect of temperature (25 to 40 °C) and alkalinity (1 to 3 g/L of sodium bicarbonate) on VFA production, while Niz et al. [8] investigated the effect of CWW adapted and non-adapted inoculum with and without methanogenic archaeal inhibition techniques in order to improve VFA production. Additionally, the study by da Silva et al. [7] aimed to evaluate the impact of pH (4.5 to 7.0) and initial substrate concentration (10 to 50 g/L in terms of glucose) on lactic acid production yield particularly. Therefore, this work highlights the significance of understanding the influence of fermentation time (FT) and pH value in batch reactors, given the scarcity of studies on these variables in the scientific literature for CWW as a substrate. Undoubtedly, FT and pH are critical factors that affect the performance and composition of VFAs and can be directly modified during the operation of the fermentation system [20,21]. Regarding FT, it is desired that it be as short as possible (maximizing the production of VFAs), because if it is reduced, productivity is increased. The FT is notably influenced by substrate characteristics and type, significantly impacting the hydrolysis rate of particulate organic matter [22]. Furthermore, the pH has a significant influence on fermentative bacteria as it affects the activity of certain essential enzymes and metabolic pathways [23]. Operating at lower pH levels can reduce the need of basic chemicals for pH control, especially in wastewater with relatively low alkalinity, thus enhancing the economic feasibility of large-scale technology application [24].
Therefore, the aim of this study was to assess the individual and interactive effects of FT and pH on the production and composition of VFAs through AF of CWW using a microbiome with thermal inhibition of methanogenesis. This was achieved by the establishment of a completely randomized design and a second-order response surface (rotatable central composite design), respectively. These findings may provide a theoretical basis for controlling and optimizing VFA production from CWW.

2. Materials and Methods

2.1. Substrate

Wastewater from the cassava starch extraction process was used as a substrate for the AF process. The substrate was physicochemical characterized and stored at 4 °C for less than 24 h to preserve its properties.

2.2. Inoculum

Sludge from an Upflow Anaerobic Sludge Blanket (UASB) reactor at a wastewater treatment plant from a pig slaughterhouse was used.
The inoculum was progressively adapted to the substrate, aiming to obtain an enriched inoculum of acidogenic microorganisms capable of transforming the carbohydrates present in the CWW into VFAs. After adaptation, the inoculum was subjected to a heat pretreatment consisting of a temperature of 85 °C for 30 min [25] before starting the experiments.

2.3. Acidogenic Fermentation Experiments

Batch flow amber glass flasks with 400 mL total volume (200 mL reaction volume and 200 mL of headspace) were used as acidogenic reactors. Three experiments (E1, E2, and E3) were performed to evaluate the individual effect of FT, pH, and the effect of their interaction, respectively. In addition, for each experiment, a blank reproducing the test with distilled water instead of the substrate was established.
The substrate and inoculum were placed in each reactor at an S/M ratio of 4 gCOD/g volatile solids (VS). The initial pH of the mixture was adjusted using drops of sodium phosphate solution (Na2HPO4, Thermo Fisher Scientific Inc., Waltham, MA, USA) or hydrochloric acid (HCl, Merck KGaA, Darmstadt, Germany). The pH values were selected based on the results of previous studies [25,26]. A magnetic bar was inserted into each reactor to promote complete mixing, and a cap with 2 NaOH (Merck KGaA, Darmstadt, Germany) pellets for CO2 absorption was placed. Then, the reactors were sealed with rubber septa and aluminum seals. Finally, the reactors were incubated at a temperature of 34 ± 1 °C during the established FT. Figure 1 illustrates the experimental unit used in all experiments.
The internal pressure of each reactor was regularly monitored. In addition, at the end of the experiment, a sample of the liquid phase was collected and characterized for pH, total solids (TS), VS, soluble chemical oxygen demand (SCOD), total VFAs, total alkalinity, bicarbonate alkalinity, total carbohydrates, and the composition of VFAs.
The yield for each evaluated experimental condition was calculated by using Equation (1) [27]:
y i e l d = C O D V F A f i n a l C O D V F A ( i n i t i a l ) T C O D i n i t i a l C O D V F A ( i n i t i a l )
where CODVFA(final) represents the COD of VFAs produced in the reactors, and TCODinitial and CODVFA(initial) are the total COD and the COD of the VFAs present in the feed, respectively.

2.4. Experimental Design and Statistical Analyses

A completely randomized design (CRD) was utilized as the statistical methodology to assess the individual effect of the variables FT and pH. Eight FTs and six pH values were evaluated in the first (E1) and second experiment (E2), respectively. Each experimental condition was performed in triplicate. Table 1 displays the conditions of E1 and E2.
A one-way analysis of variance (ANOVA) with a 95% confidence level and 5% probability (p < 0.05) was applied to investigate the existence of significant differences among the FT and pH conditions evaluated. When experimental results were considered different by ANOVA, a multiple comparison test was employed. All ANOVAs were run using R Studio software version 2023.06.1+524.
Finally, the third experiment (E3) utilized a second-order response surface, specifically a rotatable central composite design (RCCD), to assess the effect of the interaction of the variables FT and pH on VFA production. For the development of response surface, the levels of the FT and pH variables were coded as low (−1), middle (0), and high (1), as presented in Table 2.
For the regression model shown in Equation (2), which corresponds to a second-order response surface (the model included linear, quadratic, and factor interaction terms), the fitted variable was as follows:
μ y = β 0 + β 1 X 1 + β 2 X 2 + β 11 X 1 2 + β 22 X 2 2 + β 12 X 1 X 2 + ε ,
where μy is the variable predicted from the response surface (dependent), X1 and X2 are the independent variables, β0 corresponds to the term to be countered, β1 and β2 are the linear coefficients, β11 and β22 are the quadratic coefficients, β12 is the interaction of the coefficients, and ε is the residual error.

2.5. Analytical Methods

The pH, total and bicarbonate alkalinity, TS, and VS were determined following standard methods [28]. An iris HI801 spectrophotometer (Hanna Instruments, Woonsocket, RI, USA) was used for the determination of TCOD, SCOD, ammonia nitrogen, and orthophosphates. Total carbohydrates were analyzed following the method described by Dubois et al. [29]. Total VFAs were analyzed by adapting the method described by DiLallo and Albertson [30]. A Perkin Elmer gas chromatograph, model Clarus 590, was used for the analysis of VFA composition.
The internal pressure of the reactors was monitored with OxiTop® system heads (WTW, Giessen, Germany) in differential pressure mode (negative or positive difference with respect to the initial pressure in the reactor).

3. Results and Discussion

3.1. Physicochemical Characterization of CWW and Inoculum Solids Concentration

The physicochemical characteristics of the substrate and the solids concentration of the inoculum used to evaluate the effect of FT, pH, and their interaction on VFA production are shown in Table 3 and Table 4, respectively. Those values were similar to studies using either the same or a similar substrate [25].

3.2. Effect of Fermentation Time on VFA Production

3.2.1. VFA Production, Yields, and Substrate Uptake

Figure 2 shows the VFA production, yields, and carbohydrate uptake for each FT evaluated.
An increase in total VFA production was observed as the FT increased from 1 to 6 d (Figure 2a). Later, a slight decrease was observed, with a tendency to stabilize. The maximum VFA production was 3444.04 mgHAc/L for 6 d of fermentation, corresponding to a yield of 0.58 gCODVFA/gCOD. Conversely, the minimum VFA production was 2382.99 mgHAc/L for an FT of 1 d, with a yield of 0.22 gCODVFA/gCOD. However, the VFA production for the FT of 1 d represented an increase of 36.2% with respect to the initial VFA concentration of the substrate utilized.
Few studies in the scientific literature investigate the influence of FT on the AF of wastewater in batch reactors, especially if the substrate is CWW. Nonetheless, the trend of increasing VFA production rate with FT is consistent with the observations of Jankowska et al. [31]. The authors evaluated a range of 5 to 15 d for a mixture of primary sludge and waste activated sludge, justifying the increase in VFAs with the presence of more soluble proteins, available carbohydrates, and disintegration of waste activated sludge by prolonging the FT.
The production of VFAs from glucose-rich substrates requires an FT of a few hours [32]. Nevertheless, for more complex and less soluble substrates, a longer duration (5 to 15 d) is required [21], which aligns with our findings.
Bengtsson et al. [33] concluded that variations in FT and pH in reactors significantly affected the quantity and composition of VFAs produced from industrial wastewaters, including cheese whey permeate and effluents from three pulp and paper mills. The authors verified that increasing FT occasioned higher degrees of acidification up to a maximum of 0.93 and 0.75 gCODVFA/gCOD at 95 and 24 h of FT for the whey and the paper mill effluent, respectively.
Despite the similarity in trend with the previously cited works, the results of our study differ from those observed by other authors for CWW. Hasan et al. [9] identified the maximum VFA production from CWW at 45 h; however, different operating conditions (pH 5.9, 30 °C, and 3 g/L sodium bicarbonate) were used in their experiments. The authors obtained 4000 mg/L of total VFAs with an initial concentration of 8865 mgCOD/L in the influent wastewater, achieving a yield of 0.45 gTVFA/gCOD. Conversely, Niz et al. [8] observed for the same substrate with an adapted inoculum a maximum degree of acidification of 75.8% for day 4 of the 20 monitored. According to Jankowska et al. [21], different types of substrates involve varied kinetics and require different FTs.
Statistically, there were significant differences (p < 0.05) in VFA production between the FTs tested in our study. Table 5 presents the summary of the ANOVA for the results of the FT variable.
Fisher’s test was applied to identify the treatments that generated the difference, clustering the results into four groups: group a (FT of 1 d), group b (FTs of 2 and 3 d), group c (FTs of 3 and 4 d), and group d (FTs of 4, 5, 6, 7, and 8 d).
Considering the results obtained in this study, an FT of 6 d is deemed appropriate for VFA production from the substrate studied.
Additionally, in this experiment, carbohydrates were assumed as the predominant carbon source in the acidogenic reactors to produce VFAs. However, according to Colin et al. [34], CWW can contain carbohydrates, acetic acid, and lactic acid. In our experiment, in addition to carbohydrates, concentrations of total VFAs (approximately 1749 mgHAc/L) were quantified in the substrate, mainly composed of acetic and valeric acids.
Figure 2b shows the carbohydrate concentration in the supernatant of each reactor at the end of the AF test. A progressive decreasing trend as FT increases is discernible. An average carbohydrate concentration of 67.76 mg/L was measured for FTs between 4 and 8 d, which represents a consumption of 87.6% of the initially existing carbohydrates.
High carbohydrate uptakes have been reported in similar studies [35,36], demonstrating a high affinity of the microorganisms for the substrate. Alibardi and Cossu [35] noted a correlation between VFAs and biogas production with carbohydrate consumption, while protein and lipid content did not display a significant effect. The authors observed that substrates with higher carbohydrate content yielded a concentration of butyric acid close to that of acetic acid, resulting in a butyric acid/acetic acid ratio above 0.8. In contrast, for substrates where proteins and lipids predominated, the ratio was only 0.36.

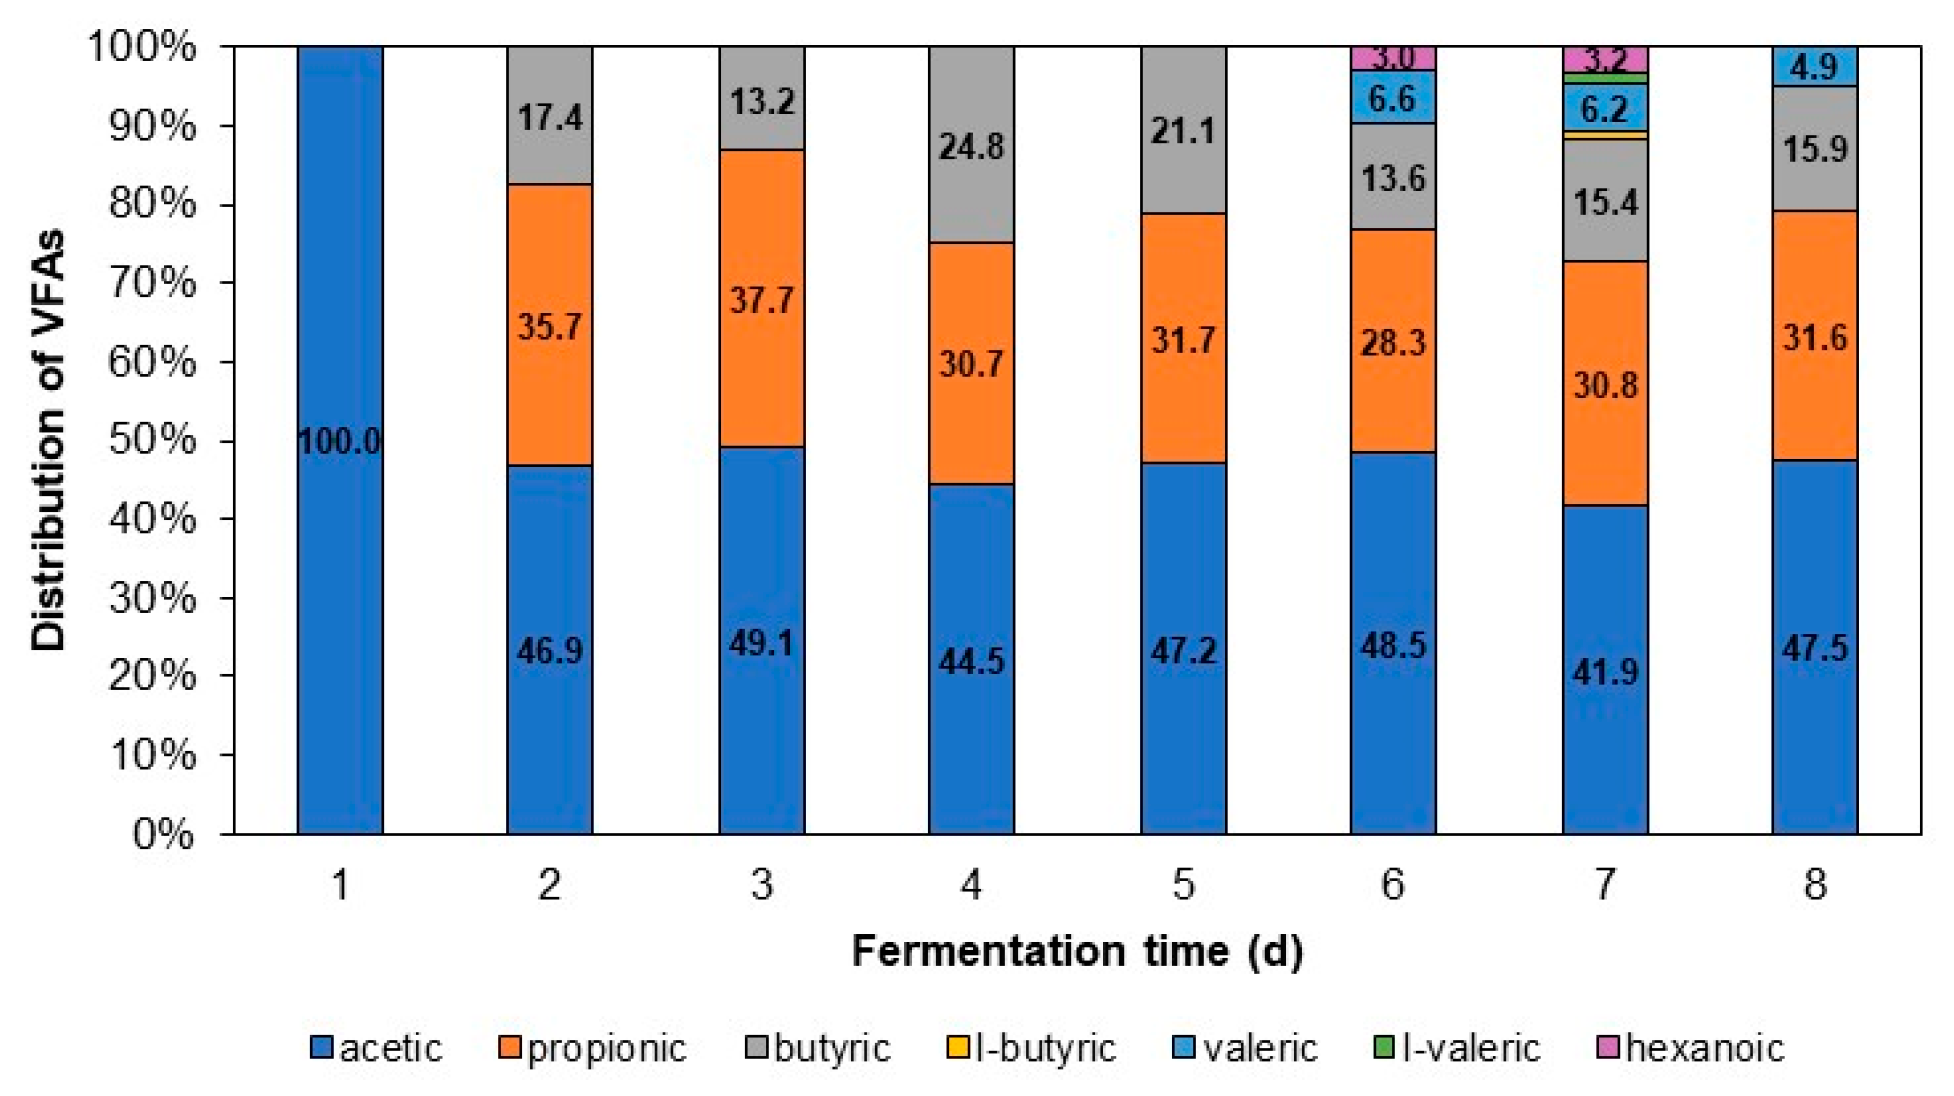
3.2.2. VFA Distribution for Different Fermentation Times

The distribution of VFAs at the end of the trial for the different FTs is illustrated in Figure 3. A greater diversity of produced VFAs is observed as FT increases. Acetic, butyric, and propionic acids were predominant in trials ranging from 2 to 8 d. However, lower concentrations of isovaleric, valeric, isobutyric, and hexanoic acids were also detected for FTs longer than 5 d.
The results align with those reported by Hasan et al. [9], who, in experiments evaluating the influence of temperature and alkalinity on the AF of CWW using a response surface, confirmed a predominance of acetic, butyric, and propionic acids (63, 22, and 12%, respectively).
Two common types of fermentation exist: the butyrate type, which yields butyrate, acetate, CO2, and H2, and the propionate type, which generates propionate, acetate, and some valerate, with minimal H2 production [37]. Therefore, in the tests performed for the FT variable, a predominance of propionate-type fermentation can be assumed. Consistent with the above, the pressure differential monitored in the reactors was lower compared to those measured for other variables, where butyric acid instead of propionic acid was predominant.
Acetic acid is the primary and preferred product of acidogenesis because of its higher generation of reducing equivalents during ATP synthesis [15]. Nevertheless, under elevated H2 partial pressure (pH2), acetic acid is formed via the butyrate oxidation intermediate by syntrophic bacteria to avoid inhibition of accumulated products [38].
Acetic acid production is carried out by the acetogens (e.g., Acetobacter, Gluconobacter, and Clostridium genera), which are characterized by a diverse group of microorganisms that include bacteria of many different phyla, allowing them to metabolize a wide spectrum of substrates. In most cases, the substrate is oxidized to acetyl-CoA; this central intermediate is then converted to acetate as the end product, coupled to substrate-level phosphorylation and thus providing ATP [39].
Propionate can be synthesized from pyruvate through two metabolic pathways. In one pathway, lactate and propionate are directly formed by the reduction of pyruvate, utilizing NADH and releasing NAD+ [40]. The other pathway does not use lactate as an intermediate but involves other compounds such as oxaloacetic, malic, fumaric, and succinic acids, as well as succinyl-CoA, methylmalonyl-CoA, and propionyl-CoA for the synthesis of propionic acid [41]. Propionic acid is mainly produced by propionic acid bacteria like Corynebacteria, Propionibacterium, and Bifidobacterium [15].
The predominance of the propionic acid metabolic pathway in this experiment may be due to the presence of proteins in the substrate [17], which were not monitored in this study. This hypothesis gains strength, particularly since this experiment was characterized by the production of high concentrations of total VFAs (approximately 3444 mgHAc/L) and the use of a substrate with a low carbohydrate concentration (546.34 mg/L), in contrast to the concentrations present in the substrate utilized in our previous experiments. As reported by de Oliveira Schmidt et al. [42], the composition of CWW includes glucose, cyanide, carbohydrates, proteins, lipids, and minerals, which vary depending on environmental factors like soil, climate, and variety of cassava. According to Yu and Fang [43], acetate, propionate, butyrate, and i-butyrate can directly result from the fermentation of carbohydrates, proteins, and lipids. However, higher-molecular-weight VFAs, such as valerate, i-valerate, and caproate, are primarily linked to the fermentation of protein-rich substrates, as observed by Jankowska et al. [21] in the AF of microalgae biomass and whey. These metabolites were also detected in this experiment (Figure 3). The AF of non-protein substrates produced few or none of these three previously mentioned VFAs [36,44].
In addition, the production of hexanoic acid (also called caproate) reported in this study aligns with findings from Jankowska et al. [21], who concluded that prolonging FT favored chain elongation and the buildup of medium-chain fatty acids. The authors observed the presence of caproate and caprylate at an FT of 15 d, which was the maximum time tested by the researchers.
Despite the above, the VFA distribution trend in this study differs from that found by Amorim et al. [45], who observed predominance of butyric acid in experiments that assessed the effect of the type of methanogenesis inhibition (chemical or thermal) on the production of H2 and carboxylic acids from CWW.
There are indications that the presence of H2 and CO2 in the headspace may influence certain fermentation pathways [15,46,47]. The pH2 can affect fermentation performance and the composition of the final products [35]. High pH2 can alter metabolic pathways, resulting in the production of more reduced intermediates, such as propionate, butyrate, and lactate [48], while low pH2 reduces the butyrate/acetate ratio and increases H2 yields [35,49]. Furthermore, according to Zhou et al. [50], pH2 has an important influence on the richness and diversity of microbial populations in AF, and a reduction in pH2 potentially leads to increased bacterial diversity.

3.2.3. Variation in pH and Internal Pressure in Acidogenic Reactors

In contrast to studies correlating higher VFA production with a more pronounced decrease in pH value [51], in our study, a light increase in pH values (ranged from 5.92 to 6.06) was observed at the end of the trials for all FTs evaluated, being more evident for the longer FTs (7 and 8 d).
The increase in pH value may be due to the use of NaOH pellets. According to Pabón Pereira et al. [48], NaOH pellets for CO2 capture from the gas phase can force the dissociation and disappearance of bicarbonate and carbonic acid from the liquid phase, causing the increase in pH. However, other studies (specifically related to biochemical methane potential tests) do not describe this effect and, on the contrary, promote the use of NaOH pellets [52]. In some cases, subsequent to the pH decrease generated by VFA production, the buffering capacity may be related to the reaction of water-soluble CO2 with hydroxide ions to form bicarbonate ions (HCO3), which tends to restore the pH of the process towards neutrality [53]. Also, Dinamarca et al. [54] reported the possibility of maintaining a stable pH by producing volatile buffers in the anaerobic system through the buffering effect of macromolecules (e.g., proteins and other compounds) present in the residues.
All of the above could be possible explanations for the increase in pH in the experiments, despite the production of VFAs.
In thermodynamically stable dark fermentative processes, H2 is always produced with VFAs or alcohols [15]. In our study, the biogas could be mainly composed of H2, as the inoculum was thermally pretreated for the inhibition of methanogenic archaea, and absorption of most of the CO2 by NaOH pellets is expected.
The biogas produced in the acidogenic reactors for the FTs evaluated was analyzed by measuring the internal pressures shown in Figure 4.
In general, the curves exhibit four phases. A first phase of gas consumption between 10 and 18 h of fermentation is visualized as a decrease in pressure over time. In this phase, the rate of consumption of gaseous compounds was higher than the production rate. The decrease in the internal pressure of the reactor may be mainly due to the absorption of CO2 (present in the air or produced by biodegradation of the substrate during the preparatory stage of the reactors) by NaOH pellets since gas purging at the beginning of the experiment was not performed. Additionally, the inoculum is characterized by the presence of a variety of microorganisms, which could have contributed to the decrease in internal pressure due to the consumption of oxygen present in the headspace by facultative microorganisms.
Subsequently, a second phase lasting 10 to 20 h shows a small peak (progressive increase in the reactor’s internal pressure, followed by a decrease). A high CO2 production in the initial hours of the test may be reflected in a relatively lower gas absorption rate compared to production, showing an initial pressure peak that tends to decrease as the production/absorption rates balance out. Additionally, this phase could also signify the onset of a substrate assimilation stage with the consequent production of biogas (mainly H2) and acetic acid as the primary VFA (Figure 3).
The third phase was characterized by the formation of a noticeably larger peak than the previous one. For FTs less than or equal to 3 d, the peak was inconclusive due to the interruption of the assay as described in material and methods (Table 1). However, for FTs greater than or equal to 4 d, this phase ranged from 1.5 to 5 d.
On one hand, the exponential growth of pressure in this phase could indicate that microorganisms exhibit a high level of activity, as they have recognized the substrate as a significant food source for their metabolic needs [55], producing mainly acetic, propionic, and butyric acids (Figure 3). On the other hand, the decrease in pressure may be due to the possible assimilation of H2 by hydrogenotrophic methanogenic archaea that may not have been fully inhibited by the thermal pretreatment [56] or by consumption in other metabolic pathways leading to the production of VFAs [57].
Among the factors that likely contributed to the formation of CH4 by hydrogenotrophic methanogenic archaea is the final pH value of the medium, which was close to 6.0 in all acidogenic reactors. According to Torres Lozada et al. [58], methanogenic archaea can maintain stability for methane formation within the pH range of 6.0 to 8.0.
Finally, a fourth phase is observed in which the headspace pressure tends to stabilize. In this phase, there are no significant increases or decreases in the internal pressure in the reactor, which could be influenced by substrate depletion evidenced from the fourth day of fermentation (Figure 2b).
The maintenance of an adequate and optimized headspace level is necessary, as authors acknowledge that it contributes to increasing the production of VFAs and biogas [15]. According to Huang et al. [59], a lower pH2 in the headspace thermodynamically favors the conversion of hydrolyzed products into VFAs.

3.3. Effect of Initial pH on VFA Production

3.3.1. VFA Production, Yields, and Substrate Uptake

Figure 5 shows the total VFA production, yields, and carbohydrate uptake at the end of the fermentation trial for each pH value evaluated. The FT was adjusted to 6 d considering the results of previous experiments performed and reported in this study.
An increase in the total VFA concentration was observed as the initial pH increased (Figure 5a). The VFA concentration ranged from 2114.33 to 2547.72 mgHAc/L, corresponding to yields between 0.19 and 0.34 gCODVFA/gCOD for initial pH values of 5.0 and 5.9, respectively. The VFA concentration obtained at an initial pH of 5.0 represented an increase of 36% compared to the VFA concentration present in the substrate used.
Statistically, there were significant differences (p < 0.05) in VFA production between the different pH values tested. Table 6 presents the summary of the ANOVA for the results of the pH variable.
Fisher’s test was applied to identify the treatments that generated the difference, grouping the results into two groups: group a (pH of 5.0, 5.2, 5.4, and 5.5) and group b (pH of 5.5, 5.7, and 5.9).
The production trend found for this experiment is consistent with that observed by Lv et al. [20] during glucose fermentation in a continuous stirred tank acidogenic reactor (CSTR). The authors found that the concentration of total VFAs showed significant variations at different pH levels (5.0, 5.5, and 6.0), being favored at pH 6.0 with a maximum production of 2139.11 mgHAc/L. A decrease in pH to 5.5 and 5.0 was reflected in the reduction in total VFA concentration by 21.78% and 14.45%, respectively. Also, Jiang et al. [60] evaluated the effect of pH (5.0, 6.0, 7.0, and uncontrolled at 35 °C) on VFA production from food waste and found that VFA concentration and yield were higher at pH 6.0. The authors achieved a maximum total VFA concentration of 39.46 g/L (yield of 0.316 g/gVSfed) composed mainly of acetate and butyrate (77%), attributing the higher production to optimal hydrolytic enzyme activity at pH 6.0.
According to results reported by Infantes et al. [23], the concentration of undissociated acids increased as pH decreased (6, 5, and 4), causing inhibition. The undissociated forms of VFAs are capable of crossing the cell membrane and dissociating inside the cell due to the higher internal pH, releasing a proton inside the cell. The uptake of protons in this way uncouples the proton motive force, leading to increased energy requirements to maintain the intracellular pH close to neutrality, resulting in reduced biomass growth [23].
Previous studies have inquired about the pH value suitable for VFA production from CWW [8,9,61]. However, the scientific literature specifically aimed at evaluating the effect of pH for this substrate is still limited. Niz et al. [8] investigated AF with adapted and non-adapted biomass and with and without methanogenesis inhibition techniques in a batch process. The authors concluded that inoculum adaptation and thermal treatment were not as relevant in improving VFA production as was the pH of the fermentation broth. The optimum pH range observed by the authors oscillated from 5.5 to 6.0, with a total VFA production of 5080 to 5760 mg/L, respectively. Meanwhile, the study by Barana and Cereda [61], which investigated CWW treatment using a two-phase anaerobic digester, maintained a pH value between 5.5 and 6.0 during the AF stage and observed concentrations ranging from 200 to 4520 mgHAc/L.
Figure 5b shows the concentration in the supernatant at the end of the AF assay and the carbohydrate consumption for each evaluated pH condition.
The carbohydrate concentration in the supernatant ranged from 432.68 to 560.98 mg/L, representing a consumption of 66.2 to 73.9% for conversion into cell mass, organic acids, and gaseous products. The lowest and highest carbohydrate consumptions were measured at pH 5.2 and 5.5, respectively. It is evident that there was a significant consumption of carbohydrates from the substrate, but not as observed for the FT variable, which was around 87.60% from 4 to 8 d of fermentation (Figure 2b).
Substrate consumption can be influenced by different factors (e.g., temperature, inoculum, pH, substrate concentration, etc.). As reported by Infantes et al. [23], substrate consumption exhibited a pH- and temperature-dependent behavior. The authors observed that glucose was completely utilized at pH 5.0 and 6.0 at all temperatures evaluated (26, 33, and 40 °C), but this was not the case when the pH was 4.0, as glucose was only fully consumed at 26 °C. The amount of glucose consumed decreased to 42 and 23 mM when the temperature increased to 33 and 40 °C, respectively. These results reflect the difficulty that persists in comparing existing studies in the literature, as different factors can be determinants in the final outcome, including the nature of the inoculum.

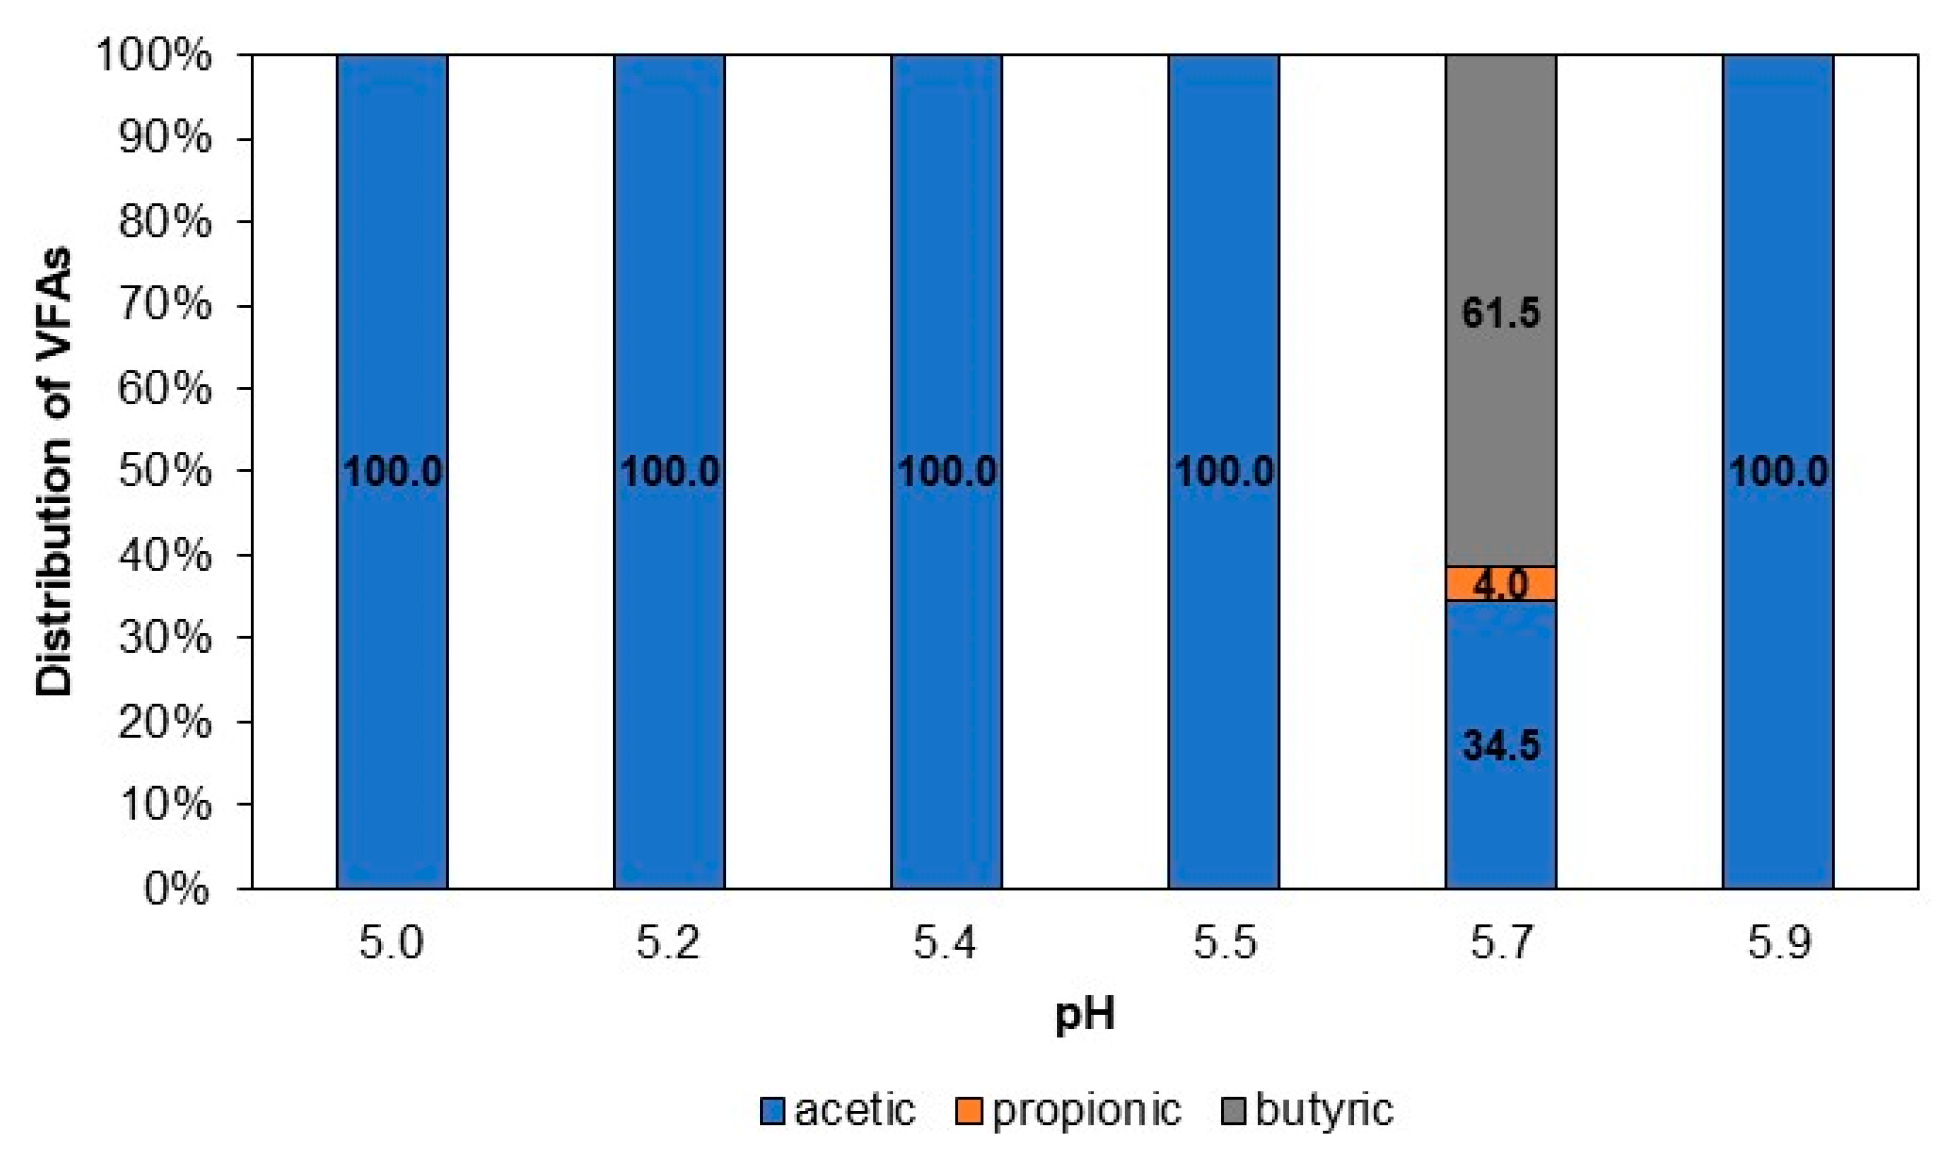
3.3.2. VFA Distribution for Different pH Values

Figure 6 shows the distribution of VFAs at the end of the test for each pH value tested. The VFAs were mainly composed of acetic acid, except for the reactors operated at pH 5.7, whose composition was acetic, butyric, and propionic acids at 34.5, 61.5, and 4.0%, respectively. Undoubtedly, at this pH value, butyrate-type fermentation predominated, since the percentage of acetate and butyrate represented approximately 70 to 90% of the total VFAs [20].
A variety of studies have examined the production and distribution of VFAs according to the operating pH, mostly for a glucose substrate and with mixed culture [20,21,62,63]. However, the results obtained in our work differ slightly from those found in previous studies. Jankowska et al. [21] evaluated acidic (5.0), neutral (7.0), and alkaline (11.0) initial pH conditions for four different substrates (maize silage, cheese whey, microalgae biomass, and glucose). The authors found that acetate and butyrate were the main acids under acidic (pH < 5.0) or partially neutral (pH > 5.5) conditions, whereas acetate and propionate were dominant under alkaline conditions. However, the authors concluded that the distribution of VFAs was only dependent on the type of substrate, and not on the pH value. Lv et al. [20] investigated the effect of pH (5.0–6.0) and HRT (2–12 h) in a CSTR, and their results showed that acetate and butyrate dominated during pH regulation. Also, Atasoy et al. [62] demonstrated that acetic acid (44 ± 7%) was predominant under neutral pH conditions (without pH control), while a mixture of acetic (35 ± 8%) and butyric (37 ± 4%) acids dominated under acidic conditions (pH 5.0), and butyric acid (60 ± 12%) under alkaline conditions (pH 8.0 and 10.0). Temudo et al. [63], when assessing low pH values (4.0 to 5.5), detected butyrate and acetate as the main dissolved organic products, while at higher pH values (6.25 to 8.50), butyrate production decreased, and ethanol and acetate became the primary products. Finally, Yu and Fang [43] in AF of dairy wastewater verified that acetate and butyrate were the dominant products at pH > 5.5, while propionate was dominant at pH < 5.5.
According to the scientific literature, an acidic pH favors the formation of acetic and butyric acids for glucose, which is consistent with the findings in our study for reactors operated at pH 5.7, where the proportions of acetic and butyric acids varied slightly (34.5 and 61.5%, respectively). However, for the other acid pH values evaluated, only acetic acid was produced.
On one hand, for CWW, Niz et al. [8] found the highest VFA production at pH 5.50 to 6.09, with butyric acid (87%) as the main metabolite. On the other hand, Hasan et al. [9] found butyric (42%), acetic (35%), and propionic (20%) acids (for pH 5.9), which is not consistent with what was observed for the same pH value in our study.
The above suggests that the pH value is not the only determinant of VFA composition, but the substrate type and the nature of the inoculum may also have a significant influence on VFA distribution. According to Lv et al. [20], researchers have demonstrated that the regulation of operational parameters not only modifies the specific acid production but also influences the microbial community. According to the results of Atasoy and Cetecioglu [17], the adaptation of the bacterial community to different pH conditions can determine the acid profile. The authors observed the predominance of the phyla Bacteroidetes at pH 10, Proteobacteria at neutral pH, and Firmicutes at pH 5 during the AF of cheese wastewater. This is consistent with the findings of Horiuchi et al. [32], as the shift in the main products in their experiments was caused by the change in dominant microbial populations in the acidogenic reactor due to the pH change, shifting from bacteria producing butyric acid to bacteria producing propionic acid. Furthermore, Eng et al. [64] identified a strong link between experimental conditions (pH and temperature) and bacterial composition in sugarcane vinasse fermentation experiments for VFA production.
Considering the diversity of the acid profile obtained in the conducted research, it is believed that the spectrum of VFAs in AF with mixed cultures is not reproducible or independent of the inoculum. However, based on our results and previous studies for CWW, it is highly probable that a mixture of VFAs, primarily composed of acetic, propionic, and butyric acids, is formed. The generation of a VFA-rich effluent (mainly composed of acetic and butyric acids) through wastewater fermentation offers versatile opportunities for its utilization in various energy and chemical manufacturing processes. These processes include but are not limited to photofermentation and microbial electrolysis cells for H2 production, the synthesis of biopolymers like polyhydroxyalkanoates (PHA), and microalgae cultivation for the generation of high-value products (e.g., biodiesel) [65].
In this experiment, a pH of 5.7 was considered the suitable value for the AF of CWW, based on the maximum production of total VFAs and diversity in the acids produced.

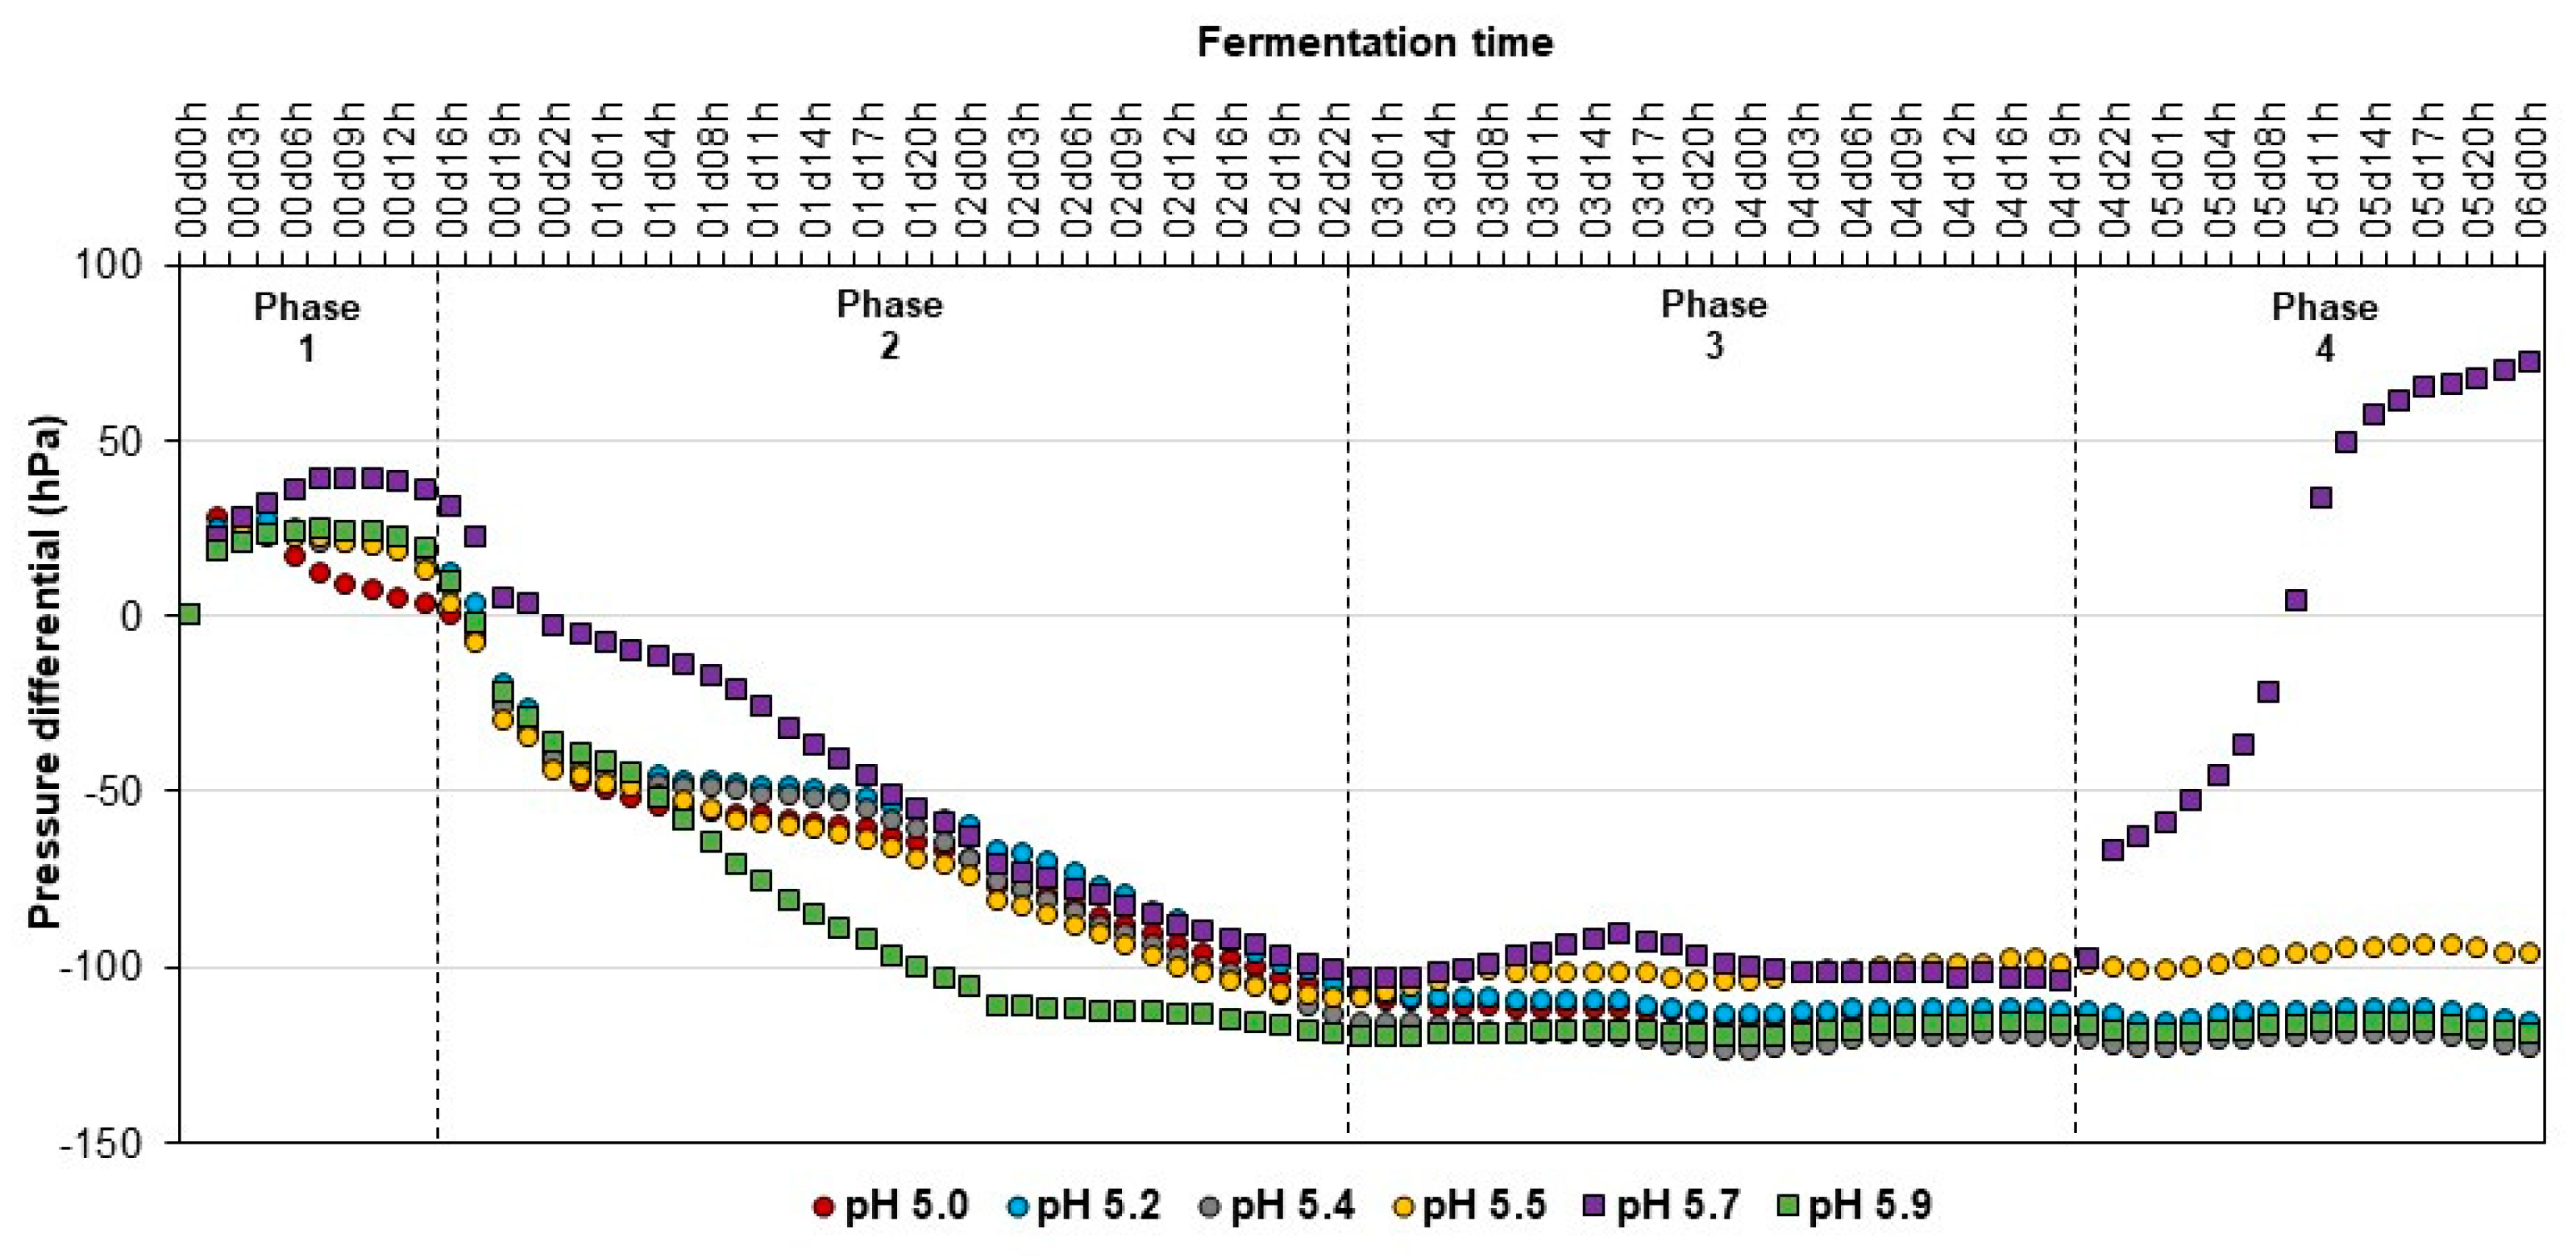
3.3.3. Variation in pH and Internal Pressure in Acidogenic Reactors

After the AF experiment ended, it was observed that the pH of the supernatant decreased in some conditions and increased in others with respect to the initial adjusted value. Overall, a decrease in pH was observed in the reactors adjusted to 5.0, 5.2, 5.4, and 5.9, while in the reactors adjusted to 5.5 and 5.7, the trend was upward. Other researchers have also observed decreasing and increasing trends [60,66] in pH value during fermentation.
The increase in pH value during fermentation, in addition to the reasons previously explained (Section 3.2.3), may be attributed to the rise in bicarbonate alkalinity due to the production of ammonia nitrogen (NH4+-N). In this experiment, the replicates that showed the greatest increases in pH value were those with bicarbonate alkalinity at the end of the trial. The values ranged from 107.62 to 424.78 mgCaCO3/L. According to Xiao et al. [67], in fermentation processes (glucose and proteins) with low substrate concentration (e.g., glucose ≤ 1603.65 mg/L), the hydrolysis and acidification of the inoculum promote the release of ammonia, which is an alkaline substance with high buffering capacity [68]. According to Jiang et al. [60], a higher pH (6.0 and 7.0) leads to a higher release of ammonia.
The biogas produced in the acidogenic reactors for the different pH values was analyzed through the internal pressures shown in Figure 7.
Three phases were observed for all initial pH values evaluated, except for pH 5.7, where an additional phase was identified. In the first phase, an increase in the internal pressure of the reactor during the first hour of operation due to the increase in temperature (incubation at 34 ± 1 °C) was observed, followed by a trend of stable pressures that extended from 3 to 14 h. This phase could be related to the latency or adaptation stage of microorganisms to the established operating conditions (e.g., pH, S/M ratio, temperature, etc.). The first phase was quite short (3 h) in the acidogenic reactor adjusted to pH 5.0, probably because it was the condition where microorganisms had to undergo fewer changes compared to the conditions in which the inoculum was before the experimental setup.
Subsequently, a second phase characterized by a progressive decrease in the internal pressure in the reactor was observed, which lasted between 35 and 70 h. In the third phase, it was observed that the internal pressures varied very little among them, that is, a stable trend was observed. This phase extended from 40 to 95 h. Finally, a fourth phase was detected only for the pH 5.7 condition, in which there was a progressive and significant increase in the internal pressure of the reactor. The reasons for the perceived decrease or increase in internal pressure in acidogenic reactors were described in Section 3.2.3.
Undoubtedly, differences in the dynamics of the internal pressure of the reactors that evaluated the effect of FT and pH on VFA production are observed (Figure 4 and Figure 7). This indicates that in the AF process, it was not only the parameters evaluated that were responsible for the behavior of the internal pressure of the reactors, since in both experiments, there was a condition at pH 5.4 and FT of 6 d, which behaved differently. This could be due to the heterogeneity of the inoculum used in the two experiments.

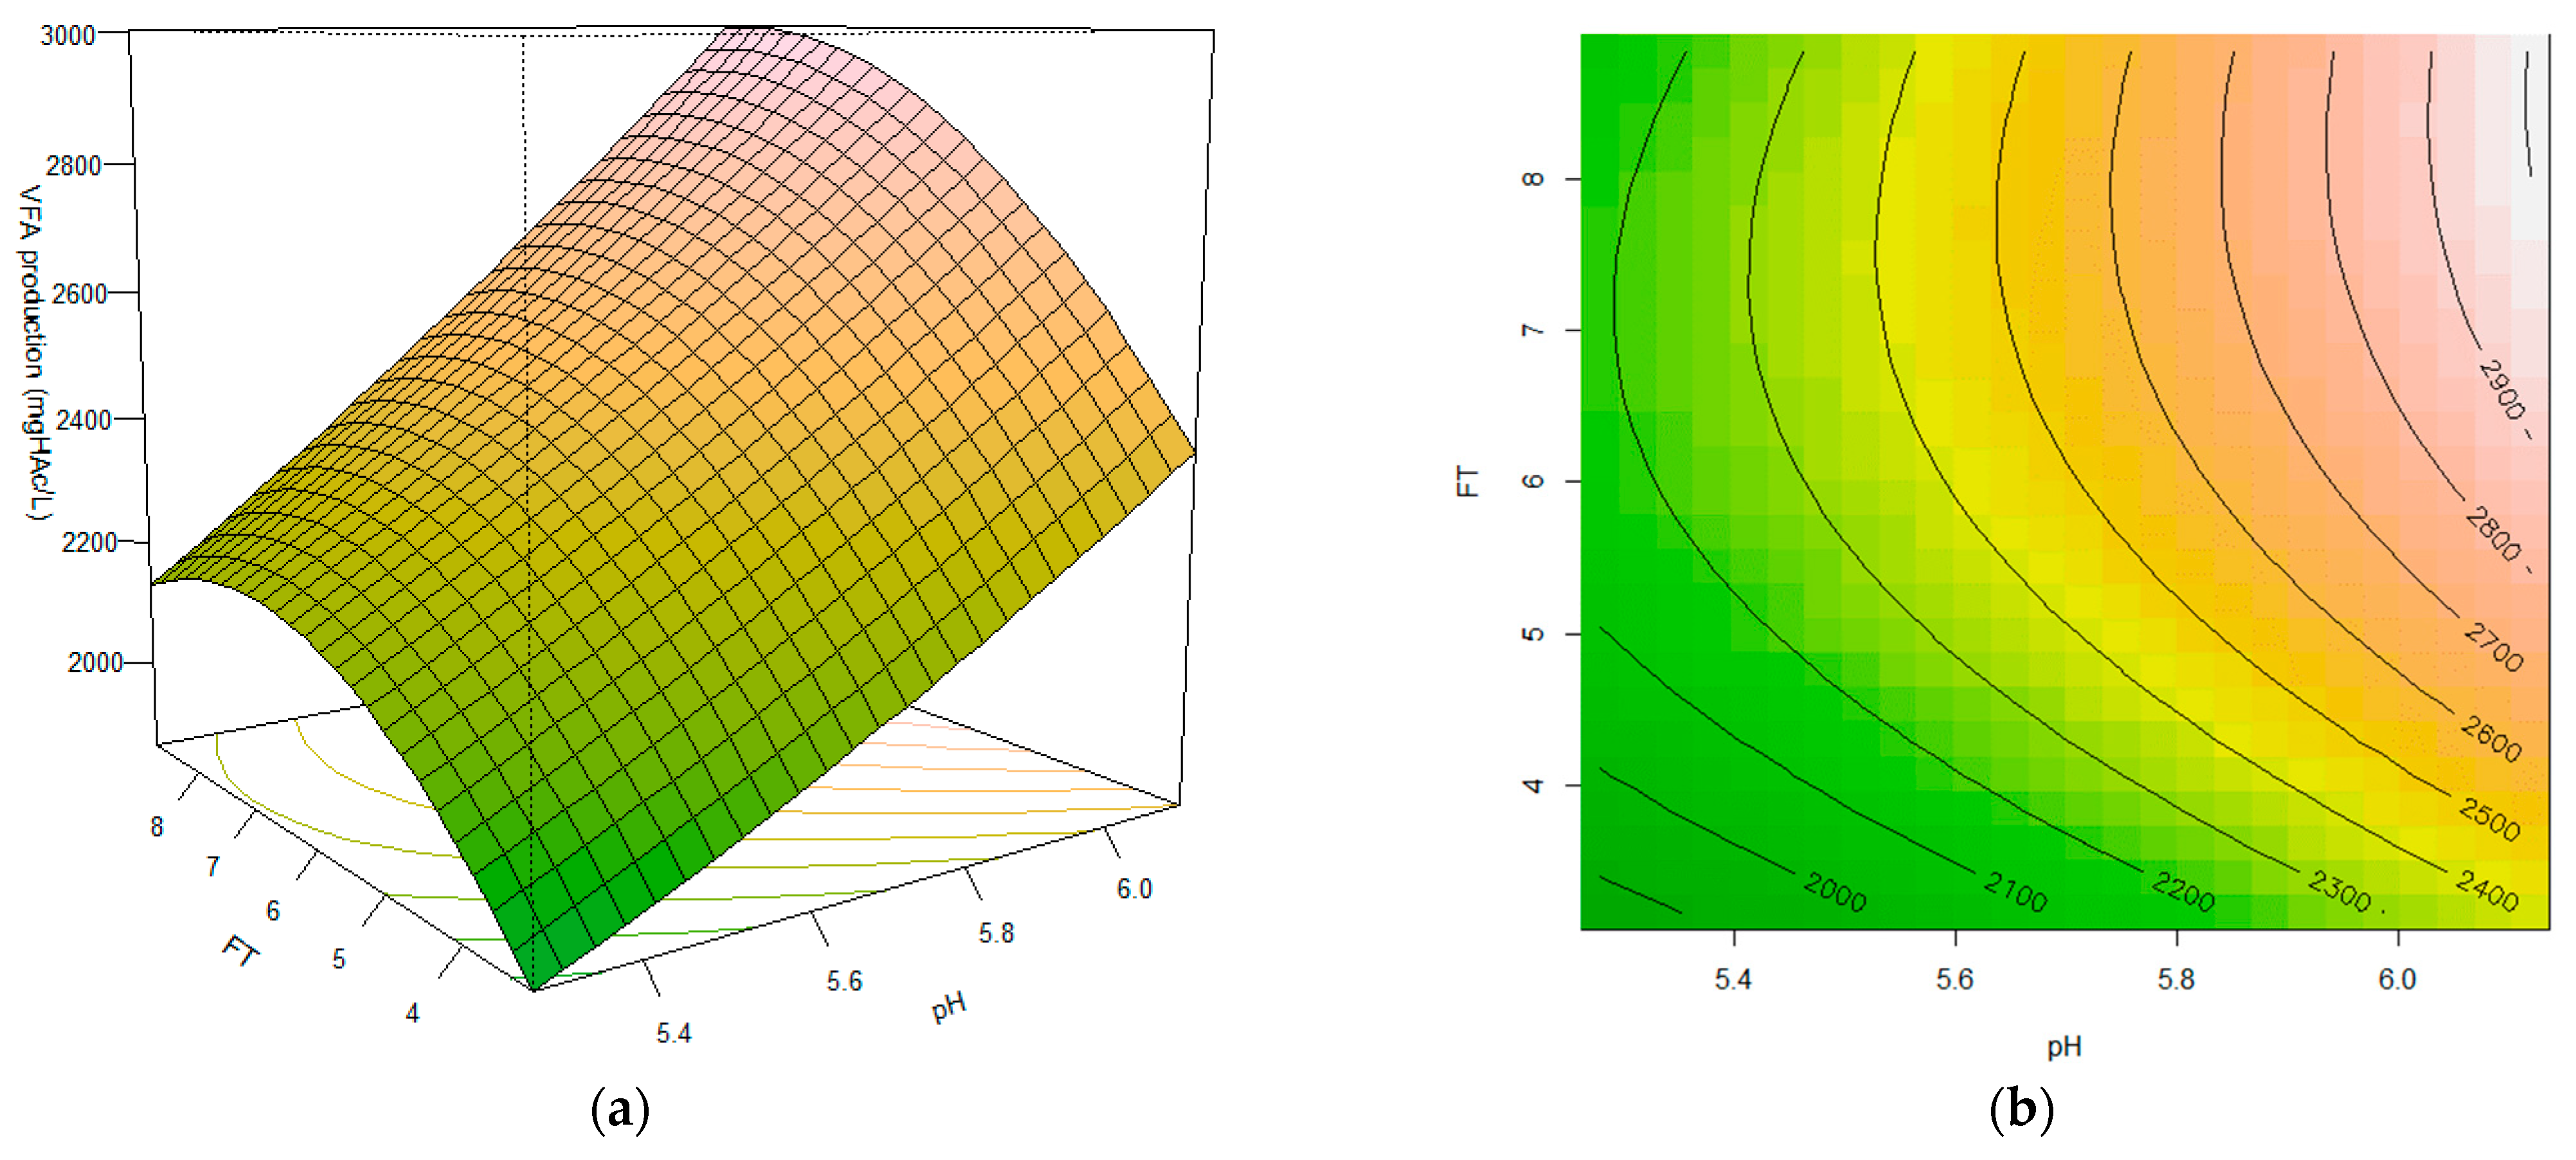
3.4. Effect of the Interaction among Fermentation Time and pH Variables on VFA Production

An RCCD was conducted to fit a nonlinear model. The aim was to develop and evaluate a statistical approach to better understand the relationships between the two variables under consideration. Hence, nine treatments (equivalent to 20 experimental runs) were conducted to evaluate the resulting effect of the interaction between the pH and FT variables on VFA production in AF of CWW. Those results are summarized in Table 7. The studied variables ranged from 5.28 to 6.12 for pH and from 3.17 to 8.83 d for FT. The central point was set at a pH of 5.7 and an FT of 6 d.
The variation in total VFA concentration as a function of the independent variables initial pH (X1) and FT (X2) is explained by the quadratic model presented in Equation (3), corresponding to the response surface shown in Figure 8. Additionally, the ANOVA of the RCCD is presented in Table 8.
V F A s = 2490.075 + 252.318 X 1 + 153.697 X 2 + 14.064 X 1 2 84.199 X 2 2 + 42.415 X 1 X 2
According to the previous results (Table 8), the model was significant as evidenced by the F-value equivalent to 6.855 (p-value of 0.001982) for total VFA concentration. The R2 value obtained for the regression model describing the experimental variation of the response variable was 0.71, representing a moderate fit between experimental and predicted values. The value obtained for the adjusted coefficient of determination (adjusted R2) was 0.61. The lack-of-fit test was not significant for total VFA concentration (p-value of 0.729221).
Additionally, it is observed that the two variables individually (linear terms) exert a significant influence (p < 0.05) on the response variable. The analysis showed a greater influence of initial pH than FT. However, the interaction term and the quadratic terms of the model were not significant (p-values of 0.5747 and 0.3703, respectively). This, coupled with the moderate curvature observed (Figure 8a), suggests that the optimal values of FT and pH are not within the adopted range. These results are not consistent with findings by Eng et al. [64] for VFA production from sugarcane vinasse, as the quadratic model was suitable for predicting the maximum VFA production.
The production of organic acids increased gradually with pH as with FT. The highest concentration and yield of VFAs were measured at pH 6.12 and FT 6 d, equivalent to 2913.59 mgHAc/L and 0.48 gCODVFA/gCOD, respectively (Table 7).
The region where VFA production tends to be maximized is at pH and FT values above 5.6 and 5 d, respectively (Figure 8b). It is feasible to perform experiments in a wider range to identify the optimal conditions. However, for AF processes where the main objective is the production of VFAs, pH values higher than 6.0 are not recommended, since they may favor the activity of methanogenic archaea and therefore cause the consumption of the VFAs produced. According to Eng et al. [64], experimental evidence indicates that methane production is favored in a pH range (6.6–7.5) close to neutral conditions. Pittmann and Steinmetz [69] assessed the effect of operational conditions (temperature, pH, retention time, and withdrawal) and reactor operation mode on VFA production as a first step to produce of polyhydroxyalkanoates. The authors observed that a pH of 7.0 gave the best result, but methane production proved to be a problem at this value. After 15 d, the acetate concentration decreased rapidly, and the total VFA concentration was less than 44% of the maximum after 18 d, concluding that to prevent methanogenic conditions, a pH level of 6 should be maintained.
Based on our results, it is considered that the second-order response surface may be suitable for determining the optimal region (in terms of FT and pH) for VFA production from CWW. However, it is recommended that experimental trials be conducted beforehand to determine the evaluation range, using the same inoculum lot that will be utilized for the response surface experiments.
The predominant metabolites in the treatments were acetic, propionic, and butyric acids, except for the conditions pH 5.7 and FT 3.17 d with acetic acid, and pH 5.4 and FTs 4 and 8 d with acetic and butyric acids produced mainly. It is confirmed that for CWW, butyrate and propionate-type fermentations prevail in the experiments. Furthermore, the nature of the inoculum (individual characteristics, microbial consortia, time of adaptation to the substrate, homogenization prior to the experiments, etc.) is a determining aspect of the metabolic pathway established in the fermentation process. According to Khatami et al. [66], the impact of microbial structure on VFA production remains a gray area, and more research is needed to increase the efficiency of VFA production from waste and commercialize bio-based VFA production.

3.5. Future Perspectives

Establishing suitable operational conditions is crucial for optimizing the AF of CWW for VFA production. However, scientific studies evaluating the effect of operational variables on AF for CWW are scarce.
Research suggests that the outcome of the fermentation process may be influenced by a combination of operational variables (such as pH, FT or HRT, temperature, S/M ratio, headspace pressure, etc.), as well as factors like inoculum characteristics, bacterial structure, and substrate composition. This complexity makes it challenging to compare different scientific studies regarding total VFA production, yields, and the effects of variables on the process. Also, standardizing the method for calculating the yield of the wastewater AF process is necessary.
Additionally, characterizing the microbial community is essential for enhancing the understanding of fermentation processes and their association with the produced metabolites. In our experiments investigating the effect of FT and pH on VFA production, the inoculum was collected from the same UASB reactor at different times. It underwent identical adaptation and pretreatment protocols and ensured the same inoculum mass according to the established S/M ratio. Nevertheless, we did not control or ensure the homogeneity of specific characteristics of the added mass, such as granule size and individual microbiological aspects, which could influence its response to certain biological processes [70]. These variations could explain the observed variability in substrate consumption, VFA composition, and internal pressure behavior of the reactor under certain evaluated conditions.
Hence, future research should encompass an analysis of the microbial community utilized as inoculum in AF processes, the assessment of the individual and interactive effects of other variables (such as S/M ratio, temperature, and headspace pressure, among others) specific to CWW, and the configuration and design of reactors. Addressing these aspects is crucial to render this process economically viable and enable VFA production on a large scale.

4. Conclusions

The production of VFAs from AF of CWW is feasible and can be enhanced by controlling the FT and pH variables. A pH of 5.7 and an FT of 6 d are considered adequate to produce VFAs from CWW using a thermally pretreated inoculum. Under these conditions, yields of approximately 0.36 gCODVFA/gCOD were achieved, with variability observed in the VFAs produced, primarily consisting of acetic, propionic, and butyric acids. The mixture of organic acids produced could serve as a raw material in subsequent processes to obtain biological products (biofuels, bioplastics, biofertilizers, etc.). While individual variables FT and pH significantly influenced VFA production from CWW, their interaction was found to be not significant for the range evaluated.

Author Contributions

Conceptualization, L.M.S.-L., J.A.R.-V. and H.R.-M.; methodology, L.M.S.-L., J.A.R.-V. and H.R.-M.; validation, L.M.S.-L.; formal analysis, L.M.S.-L.; investigation, L.M.S.-L.; resources, L.M.S.-L.; data curation, L.M.S.-L.; writing—original draft preparation, L.M.S.-L.; writing—review and editing, J.A.R.-V. and H.R.-M.; visualization, L.M.S.-L.; supervision, J.A.R.-V. and H.R.-M.; project administration, H.R.-M.; funding acquisition, H.R.-M. All authors have read and agreed to the published version of the manuscript.

Funding

This research was funded by Universidad del Valle, Project CI-21237.

Data Availability Statement

All data generated or analyzed during this study are included in this published article.

Conflicts of Interest

The authors declare no conflicts of interest.

References

  1. Aristizábal, J.; Sánchez, T. Guía Técnica Para Producción y Análisis de Almidón de Yuca; Organización de las Naciones Unidas para la Agricultura y la Alimentación: Roma, Italy, 2007; Volume 163. [Google Scholar]
  2. FAOSTAT Cultivos y Productos de Ganadería. Available online: https://www.fao.org/faostat/es/#data/QCL (accessed on 15 December 2023).
  3. Nnaji, C.C.; Akanno, C.C. Assessment of Environmental Degradation Due to Processing of Cassava into Garri Flakes Using Pollution Indices. Environ. Process. 2022, 9, 46. [Google Scholar] [CrossRef]
  4. Torres, P.; Rodríguez, J.; Rojas, O. Extracción de Almidón de Yuca. Manejo Integral y Control de La Contaminación Hídrica. Livest. Res. Rural Dev. 2005, 17, 74. [Google Scholar]
  5. De Amorim, M.C.C.; De Souza Silva, P.T.; Barbosa, P.S.; Montefusco, N.E. Anaerobic Biodegradation of Cassava Wastewater under Different Temperatures and Inoculums. Comun. Sci. 2019, 10, 65–76. [Google Scholar] [CrossRef]
  6. Sawatdeenarunat, C.; Saipa, S.; Suaisom, P.; Mai, C.; Mai, C. Methane Recovery from Cassava Starch Wastewater via Anaerobic Digestion: Effect of Inoculum Source and Kinetic Study. Asia-Pac. J. Sci. Technol. 2021, 26, 2. [Google Scholar] [CrossRef]
  7. da Silva, D.B.; Fenandes, B.S.; da Silva, A.J. Effect of Initial PH and Substrate Concentration on the Lactic Acid Production from Cassava Wastewater Fermentation by an Enriched Culture of Acidogenic Microorganisms. Water Environ. Res. 2021, 93, 1925–1933. [Google Scholar] [CrossRef]
  8. Niz, M.Y.K.; Formagini, E.L.; Boncz, M.À.; Paulo, P.L. Acidogenic Fermentation of Cassava Wastewater for Volatile Fatty Acids Production. Int. J. Environ. Waste Manag. 2020, 25, 245–261. [Google Scholar] [CrossRef]
  9. Hasan, S.D.M.; Giongo, C.; Fiorese, M.L.; Gomes, S.D.; Ferrari, T.C.; Savoldi, T.E. Volatile Fatty Acids Production from Anaerobic Treatment of Cassava Waste Water: Effect of Temperature and Alkalinity. Environ. Technol. 2015, 36, 2637–2646. [Google Scholar] [CrossRef] [PubMed]
  10. Ramos-Suarez, M.; Zhang, Y.; Outram, V. Current Perspectives on Acidogenic Fermentation to Produce Volatile Fatty Acids from Waste. Rev. Environ. Sci. Bio/Technol. 2021, 20, 439–478. [Google Scholar] [CrossRef]
  11. Atasoy, M.; Owusu-Agyeman, I.; Plaza, E.; Cetecioglu, Z. Bio-Based Volatile Fatty Acid Production and Recovery from Waste Streams: Current Status and Future Challenges. Bioresour. Technol. 2018, 268, 773–786. [Google Scholar] [CrossRef]
  12. de Sousa e Silva, A.; Morais, N.W.S.; Coelho, M.M.H.; Pereira, E.L.; dos Santos, A.B. Potentialities of Biotechnological Recovery of Methane, Hydrogen and Carboxylic Acids from Agro-Industrial Wastewaters. Bioresour. Technol. Rep. 2020, 10, 100406. [Google Scholar] [CrossRef]
  13. Dionisi, D.; Silva, I.M.O. Production of Ethanol, Organic Acids and Hydrogen: An Opportunity for Mixed Culture Biotechnology? Rev. Environ. Sci. Biotechnol. 2016, 15, 213–242. [Google Scholar] [CrossRef]
  14. Sun, L.; Gong, M.; Lv, X.; Huang, Z.; Gu, Y.; Li, J.; Du, G.; Liu, L. Current Advance in Biological Production of Short-Chain Organic Acid. Appl. Microbiol. Biotechnol. 2020, 104, 9109–9124. [Google Scholar] [CrossRef] [PubMed]
  15. Dahiya, S.; Lingam, Y.; Venkata Mohan, S. Understanding Acidogenesis towards Green Hydrogen and Volatile Fatty Acid Production—Critical Analysis and Circular Economy Perspective. Chem. Eng. J. 2023, 464, 141550. [Google Scholar] [CrossRef]
  16. Nizzy, A.M.; Kannan, S. A Review on the Conversion of Cassava Wastes into Value-Added Products towards a Sustainable Environment. Environ. Sci. Pollut. Res. 2022, 29, 69223–69240. [Google Scholar] [CrossRef] [PubMed]
  17. Atasoy, M.; Cetecioglu, Z. The Effects of PH on the Production of Volatile Fatty Acids and Microbial Dynamics in Long-Term Reactor Operation. J. Environ. Manag. 2022, 319, 115700. [Google Scholar] [CrossRef] [PubMed]
  18. Liu, H.; Wang, F.; Wang, Z.; Wu, D.; Xing, T.; Kong, X.; Sun, Y. Impact of PH, Temperature, and Hydraulic Residence Time on the Acidogenic Fermentation of Fruit and Vegetable Waste and Microbial Community Analysis. J. Chem. Technol. Biotechnol. 2023, 98, 819–828. [Google Scholar] [CrossRef]
  19. Lu, Y.; Chen, R.; Huang, L.; Wang, X.; Chou, S.; Zhu, J. Acidogenic Fermentation of Potato Peel Waste for Volatile Fatty Acids Production: Effect of Initial Organic Load. J. Biotechnol. 2023, 374, 114–121. [Google Scholar] [CrossRef] [PubMed]
  20. Lv, N.; Cai, G.; Pan, X.; Li, Y.; Wang, R.; Li, J.; Li, C.; Zhu, G. PH and Hydraulic Retention Time Regulation for Anaerobic Fermentation: Focus on Volatile Fatty Acids Production/Distribution, Microbial Community Succession and Interactive Correlation. Bioresour. Technol. 2022, 347, 126310. [Google Scholar] [CrossRef] [PubMed]
  21. Jankowska, E.; Chwialkowska, J.; Stodolny, M.; Oleskowicz-Popiel, P. Volatile Fatty Acids Production during Mixed Culture Fermentation—The Impact of Substrate Complexity and PH. Chem. Eng. J. 2017, 326, 901–910. [Google Scholar] [CrossRef]
  22. Wainaina, S.; Lukitawesa; Kumar Awasthi, M.; Taherzadeh, M.J. Bioengineering of Anaerobic Digestion for Volatile Fatty Acids, Hydrogen or Methane Production: A Critical Review. Bioengineered 2019, 10, 437–458. [Google Scholar] [CrossRef]
  23. Infantes, D.; Gonzáles del Campo, A.; Villaseñor, J.; Fernández, F.J. Kinetic Model and Study of the Influence of PH, Temperature and Undissociated Acids on Acidogenic Fermentation. Biochem. Eng. J. 2012, 66, 66–72. [Google Scholar] [CrossRef]
  24. Tamis, J.; Joosse, B.M.; van Loosdrecht, M.C.M.; Kleerebezem, R. High-Rate Volatile Fatty Acid (VFA) Production by a Granular Sludge Process at Low PH. Biotechnol. Bioeng. 2015, 112, 2248–2255. [Google Scholar] [CrossRef] [PubMed]
  25. Mañunga, T. Acople Entre Un Reactor Anaerobio de Medio Suspendido y Un Reactor Anaerobio de Crecimiento Adherido Para La Producción de Hidrógeno y Metano a Partir de Agua Residual Del Proceso de Extracción de Almidón de Yuca. Ph.D. Thesis, Universidad del Valle, Cali, Colombia, 2019. [Google Scholar]
  26. Sanchez-Ledesma, L.M.; Ramírez-Malule, H.; Rodríguez-Victoria, J.A. Volatile Fatty Acids Production by Acidogenic Fermentation of Wastewater: A Bibliometric Analysis. Sustainability 2023, 15, 2370. [Google Scholar] [CrossRef]
  27. Bolaji, I.O.; Dionisi, D. Acidogenic Fermentation of Vegetable and Salad Waste for Chemicals Production: Effect of PH Buffer and Retention Time. J. Environ. Chem. Eng. 2017, 5, 5933–5943. [Google Scholar] [CrossRef]
  28. APHA; AWWA; WEF. Standard Methods for the Examination of Water and Wastewater; American Public Health Association: Washington, DC, USA, 2005. [Google Scholar]
  29. Dubois, M.; Gilles, K.; Hamilton, J.K.; Rebers, P.A.; Smith, F. A Colorimetric Method for the Determination of Sugars. Anal. Chem. 1956, 28, 350–356. [Google Scholar] [CrossRef]
  30. DiLallo, R.; Albertson, O. Volatile Acids by Direct Titration. Water Pollut. Control Fed. 1961, 33, 356–365. [Google Scholar]
  31. Jankowska, E.; Chwiałkowska, J.; Stodolny, M.; Oleskowicz-Popiel, P. Effect of PH and Retention Time on Volatile Fatty Acids Production during Mixed Culture Fermentation. Bioresour. Technol. 2015, 190, 274–280. [Google Scholar] [CrossRef] [PubMed]
  32. Horiuchi, J.I.; Shimizu, T.; Tada, K.; Kanno, T.; Kobayashi, M. Selective Production of Organic Acids in Anaerobic Acid Reactor by PH Control. Bioresour. Technol. 2002, 82, 209–213. [Google Scholar] [CrossRef] [PubMed]
  33. Bengtsson, S.; Hallquist, J.; Werker, A.; Welander, T. Acidogenic Fermentation of Industrial Wastewaters: Effects of Chemostat Retention Time and PH on Volatile Fatty Acids Production. Biochem. Eng. J. 2008, 40, 492–499. [Google Scholar] [CrossRef]
  34. Colin, X.; Farinet, J.L.; Rojas, O.; Alazard, D. Anaerobic Treatment of Cassava Starch Extraction Wastewater Using a Horizontal Flow Filter with Bamboo as Support. Bioresour. Technol. 2007, 98, 1602–1607. [Google Scholar] [CrossRef]
  35. Alibardi, L.; Cossu, R. Effects of Carbohydrate, Protein and Lipid Content of Organic Waste on Hydrogen Production and Fermentation Products. Waste Manag. 2016, 47, 69–77. [Google Scholar] [CrossRef] [PubMed]
  36. Castilla-Archilla, J.; Papirio, S.; Lens, P.N.L. Two Step Process for Volatile Fatty Acid Production from Brewery Spent Grain: Hydrolysis and Direct Acidogenic Fermentation Using Anaerobic Granular Sludge. Process Biochem. 2021, 100, 272–283. [Google Scholar] [CrossRef]
  37. Cohen, A.; Van Gemert, J.M.; Zoetemeyer, R.J.; Breure, A.M. Main Characteristics and Stoichiometric Aspects of Acidogenesis of Soluble Carbohydrate Containing Wastewaters. Process Biochem. 1984, 19, 228–232. [Google Scholar]
  38. Liu, C.; Ren, L.; Yan, B.; Luo, L.; Zhang, J.; Awasthi, M.K. Electron Transfer and Mechanism of Energy Production among Syntrophic Bacteria during Acidogenic Fermentation: A Review. Bioresour. Technol. 2021, 323, 124637. [Google Scholar] [CrossRef] [PubMed]
  39. Schuchmann, K.; Müller, V. Energetics and Application of Heterotrophy in Acetogenic Bacteria. Appl. Environ. Microbiol. 2016, 82, 4056–4069. [Google Scholar] [CrossRef] [PubMed]
  40. Lee, H.S.; Salerno, M.B.; Rittmann, B.E. Thermodynamic Evaluation on H2 Production in Glucose Fermentation. Environ. Sci. Technol. 2008, 42, 2401–2407. [Google Scholar] [CrossRef] [PubMed]
  41. Yan, Y.; Feng, L.; Zhang, C.; Wisniewski, C.; Zhou, Q. Ultrasonic Enhancement of Waste Activated Sludge Hydrolysis and Volatile Fatty Acids Accumulation at PH 10.0. Water Res. 2010, 44, 3329–3336. [Google Scholar] [CrossRef]
  42. de Oliveira Schmidt, V.K.; de Vasconscelos, G.M.D.; Vicente, R.; de Souza Carvalho, J.; Della-Flora, I.K.; Degang, L.; de Oliveira, D.; de Andrade, C.J. Cassava Wastewater Valorization for the Production of Biosurfactants: Surfactin, Rhamnolipids, and Mannosileritritol Lipids. World J. Microbiol. Biotechnol. 2023, 39, 65. [Google Scholar] [CrossRef]
  43. Yu, H.G.; Fang, H.H. Acidogenesis of Dairy Wastewater at Various PH Levels. Water Sci. Technol. 2002, 45, 201–206. [Google Scholar] [CrossRef]
  44. Fernández, F.J.; Villaseñor, J.; Infantes, D. Kinetic and Stoichiometric Modelling of Acidogenic Fermentation of Glucose and Fructose. Biomass Bioenergy 2011, 35, 3877–3883. [Google Scholar] [CrossRef]
  45. Amorim, N.C.S.; Amorim, E.L.C.; Kato, M.T.; Florencio, L.; Gavazza, S. The Effect of Methanogenesis Inhibition, Inoculum and Substrate Concentration on Hydrogen and Carboxylic Acids Production from Cassava Wastewater. Biodegradation 2018, 29, 41–58. [Google Scholar] [CrossRef] [PubMed]
  46. Arslan, D.; Steinbusch, K.J.J.; Diels, L.; De Wever, H.; Buisman, C.J.N.; Hamelers, H.V.M. Effect of Hydrogen and Carbon Dioxide on Carboxylic Acids Patterns in Mixed Culture Fermentation. Bioresour. Technol. 2012, 118, 227–234. [Google Scholar] [CrossRef] [PubMed]
  47. Yuan, Y.; Hu, X.; Chen, H.; Zhou, Y.; Zhou, Y.; Wang, D. Advances in Enhanced Volatile Fatty Acid Production from Anaerobic Fermentation of Waste Activated Sludge. Sci. Total Environ. 2019, 694, 133741. [Google Scholar] [CrossRef]
  48. Pabón Pereira, C.P.; Castañares, G.; Van Lier, J.B. An OxiTop® Protocol for Screening Plant Material for Its Biochemical Methane Potential (BMP). Water Sci. Technol. 2012, 66, 1416–1423. [Google Scholar] [CrossRef]
  49. Khanal, S.K.; Chen, W.H.; Li, L.; Sung, S. Biological Hydrogen Production: Effects of PH and Intermediate Products. Int. J. Hydrogen Energy 2004, 29, 1123–1131. [Google Scholar] [CrossRef]
  50. Zhou, M.; Zhou, J.; Tan, M.; Du, J.; Yan, B.; Wong, J.W.C.; Zhang, Y. Enhanced Carboxylic Acids Production by Decreasing Hydrogen Partial Pressure during Acidogenic Fermentation of Glucose. Bioresour. Technol. 2017, 245, 44–51. [Google Scholar] [CrossRef] [PubMed]
  51. Martinez-Burgos, W.J.; Sydney, E.B.; de Paula, D.R.; Medeiros, A.B.P.; de Carvalho, J.C.; Soccol, V.T.; de Souza Vandenberghe, L.P.; Woiciechowski, A.L.; Soccol, C.R. Biohydrogen Production in Cassava Processing Wastewater Using Microbial Consortia: Process Optimization and Kinetic Analysis of the Microbial Community. Bioresour. Technol. 2020, 309, 123331. [Google Scholar] [CrossRef] [PubMed]
  52. Souto, T.F.; Aquino, S.F.; Silva, S.Q.; Chernicharo, C.A.L. Influence of Incubation Conditions on the Specific Methanogenic Activity Test. Biodegradation 2010, 21, 411–424. [Google Scholar] [CrossRef] [PubMed]
  53. Hilkiah Igoni, A.; Ayotamuno, M.J.; Eze, C.L.; Ogaji, S.O.T.; Probert, S.D. Designs of Anaerobic Digesters for Producing Biogas from Municipal Solid-Waste. Appl. Energy 2008, 85, 430–438. [Google Scholar] [CrossRef]
  54. Dinamarca, S.; Aroca, G.; Chamy, R.; Guerrero, L. The Influence of PH in the Hydrolytic Stage of Anaerobic Digestion of the Organic Fraction of Urban Solid Waste. Water Sci. Technol. 2003, 48, 249–254. [Google Scholar] [CrossRef]
  55. Norli, I.; Ho, Y.C.; Fischer, K.; Kranert, M.; Boley, A. Biodegradability Assessment of Bio-Flocculant via Anaerobic and Aerobic Test. In Proceedings of the International Conference on Environment Science and Engineering (ICESE), Bali, Indonesia, 1–3 April 2011; Volume 7, pp. 189–193. [Google Scholar]
  56. Barrios Pérez, J.D. Influencia Del PH Sobre La Producción Biológica de Hidrógeno a Partir de Agua Residual Agroindustrial. Bachelor’s Thesis, Universidad del Valle, Cali, Colombia, 2015. [Google Scholar]
  57. Polettini, A.; Pomi, R.; Rossi, A.; Zonfa, T.; De Gioannis, G.; Muntoni, A. Continuous Biohydrogen Production from Cheese Whey—Part 1: New Insights into Process Stability. J. Clean. Prod. 2022, 47, 21044–21059. [Google Scholar] [CrossRef]
  58. Torres Lozada, P.; Pérez Vidal, A.; Cajigas, Á.A.; Otero, A.M.; González, M. Selección de Acondicionadores Químicos Para El Tratamiento Anaerobio de Aguas Residuales Del Proceso de Extracción de Almidón de Yuca; Universidad del Valle: Cali, Colombia, 2008. [Google Scholar]
  59. Huang, Y.X.; Guo, J.; Zhang, C.; Hu, Z. Hydrogen Production from the Dissolution of Nano Zero Valent Iron and Its Effect on Anaerobic Digestion. Water Res. 2016, 88, 475–480. [Google Scholar] [CrossRef] [PubMed]
  60. Jiang, J.; Zhang, Y.; Li, K.; Wang, Q.; Gong, C.; Li, M. Volatile Fatty Acids Production from Food Waste: Effects of PH, Temperature, and Organic Loading Rate. Bioresour. Technol. 2013, 143, 525–530. [Google Scholar] [CrossRef]
  61. Barana, A.C.; Cereda, M.P. Cassava Wastewater (Manipueira) Treatment Using a Two-Phase Anaerobic Biodigestor. Ciência e Tecnol. Aliment. 2000, 20, 1–7. [Google Scholar] [CrossRef]
  62. Atasoy, M.; Eyice, O.; Schnürer, A.; Cetecioglu, Z. Volatile Fatty Acids Production via Mixed Culture Fermentation: Revealing the Link between PH, Inoculum Type and Bacterial Composition. Bioresour. Technol. 2019, 292, 121889. [Google Scholar] [CrossRef]
  63. Temudo, M.F.; Kleerebezem, R.; van Loosdrecht, M. Influence of the PH on (Open) Mixed Culture Fermentation of Glucose: A Chemostat Study. Biotechnol. Bioeng. 2007, 98, 69–79. [Google Scholar] [CrossRef] [PubMed]
  64. Eng, F.; Fuess, L.T.; Bovio-Winkler, P.; Etchebehere, C.; Sakamoto, I.K.; Zaiat, M. Optimization of Volatile Fatty Acid Production by Sugarcane Vinasse Dark Fermentation Using a Response Surface Methodology. Links between Performance and Microbial Community Composition. Sustain. Energy Technol. Assess. 2022, 53, 102764. [Google Scholar] [CrossRef]
  65. Puyol, D.; Batstone, D.J.; Hülsen, T.; Astals, S.; Peces, M.; Krömer, J.O. Resource Recovery from Wastewater by Biological Technologies: Opportunities, Challenges, and Prospects. Front. Microbiol. 2017, 7, 2106. [Google Scholar] [CrossRef]
  66. Khatami, K.; Atasoy, M.; Ludtke, M.; Baresel, C.; Eyice, Ö.; Cetecioglu, Z. Bioconversion of Food Waste to Volatile Fatty Acids: Impact of Microbial Community, PH and Retention Time. Chemosphere 2021, 275, 129981. [Google Scholar] [CrossRef]
  67. Xiao, B.; Han, Y.; Liu, J. Evaluation of Biohydrogen Production from Glucose and Protein at Neutral Initial PH. Renew. Energy 2010, 35, 6152–6160. [Google Scholar] [CrossRef]
  68. Sittijunda, S.; Reungsang, A.; O-Thong, S. Biohydrogen Production from Dual Digestion Pretreatment of Poultry Slaughterhouse Sludge by Anaerobic Self-Fermentation. Int. J. Hydrogen Energy 2010, 35, 13427–13434. [Google Scholar] [CrossRef]
  69. Pittmann, T.; Steinmetz, H. Influence of Operating Conditions for Volatile Fatty Acids Enrichment as a First Step for Polyhydroxyalkanoate Production on a Municipal Waste Water Treatment Plant. Bioresour. Technol. 2013, 148, 270–276. [Google Scholar] [CrossRef] [PubMed]
  70. Espinosa Chávez, B. Evaluación Del Desarrollo de La Actividad Sulfatorreductora En Un Lodo Granular Metanogénico de Diferentes Tamaños. Master’s Thesis, Instituto Potosino de Investigación Científica y Tecnológica, San Luis Potosí, Mexico, 2007. [Google Scholar]
Figure 1. Experimental unit used in the AF of CWW.
Water 16 01514 g001
Figure 2. Effect of FT in the AF of CWW. (a) Production and yield of VFAs and (b) carbohydrate concentrations and uptake.
Water 16 01514 g002
Figure 3. VFA distribution for the FTs evaluated in AF of CWW.
Water 16 01514 g003
Figure 4. Pressure differentials measured in the acidogenic reactors for each FT evaluated.
Water 16 01514 g004
Figure 5. Effect of pH in the AF of CWW. (a) Production and yield of VFAs and (b) carbohydrate concentrations and uptake.
Water 16 01514 g005
Figure 6. VFA distribution for different pH values evaluated in AF of CWW.
Water 16 01514 g006
Figure 7. Pressure differentials measured in the acidogenic reactors for each pH evaluated.
Water 16 01514 g007
Figure 8. Resulting effect of the interaction among pH and FT on the production of VFAs in AF of CWW. (a) Response surface and (b) contour plot.
Water 16 01514 g008
Table 1. Characteristics of the experiments conducted to evaluate the influence of FT and pH on the production of VFAs by AF of CWW.
ExperimentE1E2
Variable evaluatedFTpH
Evaluated conditions1, 2, 3, 4, 5, 6, 7 and 8 d5.0, 5.2, 5.4, 5.5, 5.7 and 5.9
Adjusted conditionsS/M: 4 gCOD/gVS
pH: 5.4
T: 34 ± 1 °C
S/M: 4 gCOD/gVS
T: 34 ± 1 °C
FT: 6 d
Replicates33
Table 2. Coding of the factors used in the RCCD.
TreatmentFactorsCodified FactorsReplicates
pHFTpHFT
15.404.00−1−12
26.004.001−12
35.408.00−112
46.008.00112
55.706.00004
65.708.8301.4142
75.703.170−1.4142
86.126.001.41402
95.286.00−1.41402
Table 3. Physicochemical characterization of wastewater from the cassava starch extraction process in the set of experiments.
ParameterUnitsE1E2E3
pH 4.294.444.47
TCODmg/L5000.004775.005000.00
SCODmg/L4580.004580.004700.00
VFAsmgHAc/L1749.581553.311265.57
Carbohydratesmg/L546.341658.541776.42
Total alkalinitymgCaCO3/L0162.72100.12
Bicarbonate alkalinitymgCaCO3/L000
Total aciditymgCaCO3/L1173.55822.60853.67
TSmg/L6310.005520.005230.00
VSmg/L4480.004010.003715.00
Ammonia nitrogenmgNH4+/L60.0557.8576.10
OrthophosphatesmgPO43−/L0.621.070.80
Table 4. Concentration of total and volatile solids in the inoculum utilized in the set of experiments.
ParameterUnitsE1E2E3
TSg/L57.63105.7363.93
VSg/L41.3152.5653.52
Table 5. Summary of one-way ANOVA for the FT variable.
SourcedfSum of SquaresMean SquareF-Valueρ-Value
Treatment71,869,472267,06728.0875.064 × 10−5
Residuals876,0689508
Note: df = degree of freedom.
Table 6. Summary of one-way ANOVA for the pH variable.
SourcedfSum of SquaresMean SquareF-Valueρ-Value
Treatment5461,05292,2104.09580.0211
Residuals12270,16222,513
Note: df = degree of freedom.
Table 7. Experimental results of the RCCD for the production of VFAs by AF of CWW.
TreatmentFactorsVFA Production (mgHAc/L)Yields
gCODVFA/gCOD
pHFT
15.404.001980.400.21
26.004.002428.920.34
35.408.002202.230.27
46.008.002820.410.46
55.706.002486.980.36
65.708.832601.370.39
75.703.172165.370.26
86.126.002913.590.48
95.286.002248.120.29
Table 8. ANOVA for the quadratic model describing total VFA production as a function of the independent variables and interactions at a 95% confidence level for the RCCD.
SourceSum of SquaresF-Valueρ-Value
Model 6.8550.001982
Linear terms1,386,60515.90450.000249
Interaction term14,3930.33020.574671
Quadratic terms93,0471.06730.370346
Lack of fit65,3370.43960.729221
Pure error544,947
R20.71
Adjusted R20.61
Disclaimer/Publisher’s Note: The statements, opinions and data contained in all publications are solely those of the individual author(s) and contributor(s) and not of MDPI and/or the editor(s). MDPI and/or the editor(s) disclaim responsibility for any injury to people or property resulting from any ideas, methods, instructions or products referred to in the content.

