Article

The Transformation of Per- and Polyfluoroalkyl Substances in the Aquatic Environment of a Fluorochemical Industrial Park

College of Oceanography and Ecological Science, Shanghai Ocean University, Shanghai 201306, China
*
Author to whom correspondence should be addressed.
Water 2024, 16(11), 1513; https://doi.org/10.3390/w16111513
Submission received: 28 April 2024 / Revised: 21 May 2024 / Accepted: 23 May 2024 / Published: 25 May 2024

Abstract

:
Jiangsu High-Tech Fluorochemical Industrial Park in Changshu City, Jiangsu Province, is the largest fluorochemical industrial park in Asia. The occurrence of per- and polyfluoroalkyl substances (PFASs) in surface water and widespread local plants was investigated in Jiangsu High-Tech Fluorochemical Industrial Park. Thirty-two target PFASs were detected in dissolved-phase, particle-phase and plant samples. The concentrations of total PFASs ranged from 1650 to 8250 ng/L in the dissolved-phase samples, 132 to 6810 ng/g dw in the particle-phase samples and 25.8 to 9460 ng/g dw in different plant tissues. Perfluorohexanoic acid (PFHxA), Perfluorooctanoate acid (PFOA) and 6:2 fluorotelomer carboxylic acid (6:2 FTCA) were predominant PFASs and contributed 80−91% to ΣPFAS in water samples. A total of 67 emerging PFAS were identified in all samples using nontargeted analysis. Typha orientalis showed better accumulation ability, with an average ΣPFAS concentration of 3450 ng/g dw and the highest root concentration factor (RCF) of 171. Typha orientalis, Eichhornia crassipes and Alternanthera sessilis have potential for use in PFAS phytostabilization.

1. Introduction

Per- and polyfluoroalkyl substances (PFASs) are a class of man-made persistent organic pollutants (POPs) with the general chemical formula CnF2n+1-R, where at least one hydrogen atom on a carbon atom in the carbon chain is replaced by a fluorine atom [1]. Due to the different number of carbon atoms and functional groups attached, the number of PFASs is more than 16,000 and is still increasing [2,3]. Previous research has demonstrated that PFASs exhibit environmental persistence and bioaccumulation, posing a significant threat to human health, including hepatotoxicity, immunotoxicity, and potential carcinogenicity [4,5,6,7,8,9,10]. Recognizing these concerns, 3M, the world’s largest PFAS producer, initiated the voluntary phase-out of perfluorooctane sulfonate (PFOS) and its products in 2000 [11]. From 2009 to 2019, with the restriction of PFOS, perfluorooctanoic acid (PFOA) and perfluorohexanesulfonic acid (PFHxS) under the Stockholm Convention on Persistent Organic Pollutants, short-carbon-chain PFASs and emerging PFASs emerged to meet the huge market demand [12,13,14,15]. Emerging PFAS compounds contain one or more ether bonds, -CH2 groups, or phosphate (phosphonate) groups and are more easily biotransformed or chemically transformed, posing a potential ecological risk [16]. Suspect and nontarget screening methods are used to identify emerging PFASs due to the lack of reference standards for emerging PFASs, and there have been many studies using these methods to discover hundreds of emerging PFAS congeners in environmental and biological samples worldwide [17,18,19,20,21,22].
Water plays a pivotal role as a primary carrier for PFASs because of their water solubility, facilitating the transport of PFASs across diverse environmental media and biological populations. This phenomenon substantially contributes to the widespread distribution of PFASs. Surface water surrounding Zhangjiang High-Technology Park in Shanghai exhibited ΣPFAS concentrations ranging from 115 to 600 ng/L [23]. Aquatic environments surrounding fluorochemical industrial parks are often characterized by high levels of PFAS contamination due to the direct discharge of fluorochemicals. The concentrations of total perfluoroalkyl acids (PFAAs) ranged from 4570 to 11,900 ng/L in the lakes surrounding a fluorochemical production base in Wuhan, China [24]. Aquatic plants are crucial vectors for the transfer of contaminants from the aquatic environment to the food chain. In hydroponic experiments, aquatic plants displayed potential to remove PFASs from the aquatic environment [25]. Greger et al. treated leakage water from a landfill with plants, and the results showed that the removal capacity of aquatic plants (42.1%) was higher than that of terrestrial plants (7.7%) [26,27]. The aquatic plant removal rate of PFOA and PFOS was more than 82% after treatment for 15 days in the study by Chen et al. [28]. Studies have reported that aquatic plants are effective species for PFAS phytoremediation given their high bioaccumulation (RCF > 1) and translocation capacity (transport factor (TF) > 1) [29,30]. Alternanthera sessilis was considered a good phytoremediator of C4–C7 PFCAs in surface water, with mean RCFs and TFs greater than one [31]. To date, research on PFAS uptake and distribution in plants has focused on terrestrial plants and agricultural species. Notably, conclusions obtained from soil environments may vary when extrapolated to aquatic ecosystems, due to the differences in environmental factors such as temperature, pH and dissolved oxygen [32].
Jiangsu High-Tech Industrial Park is located north of Changshu City, Jiangsu Province, China, adjacent to the Yangtze River. The park has focused on the development of the fluorine material industry since 1999. It is the largest fluorine material production, import and export base in Asia, and it is a fluorine material industrial park with the longest fluorine industrial chain and the highest agglomeration degree in the world [33]. Some scholars have conducted research at Jiangsu High-Tech Fluorochemical Park [33,34,35,36,37,38]. The ΣPFAS concentrations were 276 and 120 ng/g dw in tree leaf and bark samples in Jiangsu High-Tech Fluorochemical Industrial Park [35]. In vegetable and fruit samples collected from downstream regions, the maximum values were 11.5 and 10.5 ng/g ww [34]. However, few studies have investigated the distribution and transport of PFASs within aquatic plants growing in contaminated sites.
In this study, an investigation was conducted at a fluorochemical industrial park in Changshu, China. In total, 32 target PFASs were quantified and 67 suspect and nontarget PFASs were identified. The objectives of this study were to (1) investigate the concentrations and distribution of PFASs in the surface water and aquatic plants in the fluorochemical industrial park; (2) identify emerging PFASs by suspect and nontarget screening; and (3) explore the distribution and transport of PFASs within aquatic plants.

2. Materials and Methods

2.1. Standards and Reagents

In this study, 32 PFAS standards and 15 isotopically labeled internal standard (IS) compounds (Text S1) were purchased from Wellington Laboratory (Guelph, ON, Canada). Methanol (HPLC, ≥99.9%), acetonitrile (HPLC, ≥99.9%), methyl tert-butyl ether (MTBE, GC, ≥99.9%) and standard silica sand (AR, 0.55–1 mm) were purchased from Macklin (Shanghai, China). Na2CO3 (AR, ≥99.8%), NaHCO3 (AR, ≥99.5%) and tetrabutylammonium hydrogen sulfate (TBAHS, AR, 98%) were purchased from Aladdin Scientific Corp. (Shanghai, China). Milli-Q water (Milli-Q Direct-Q®3 UV, Darmstadt, Germany) was used throughout the experiment.

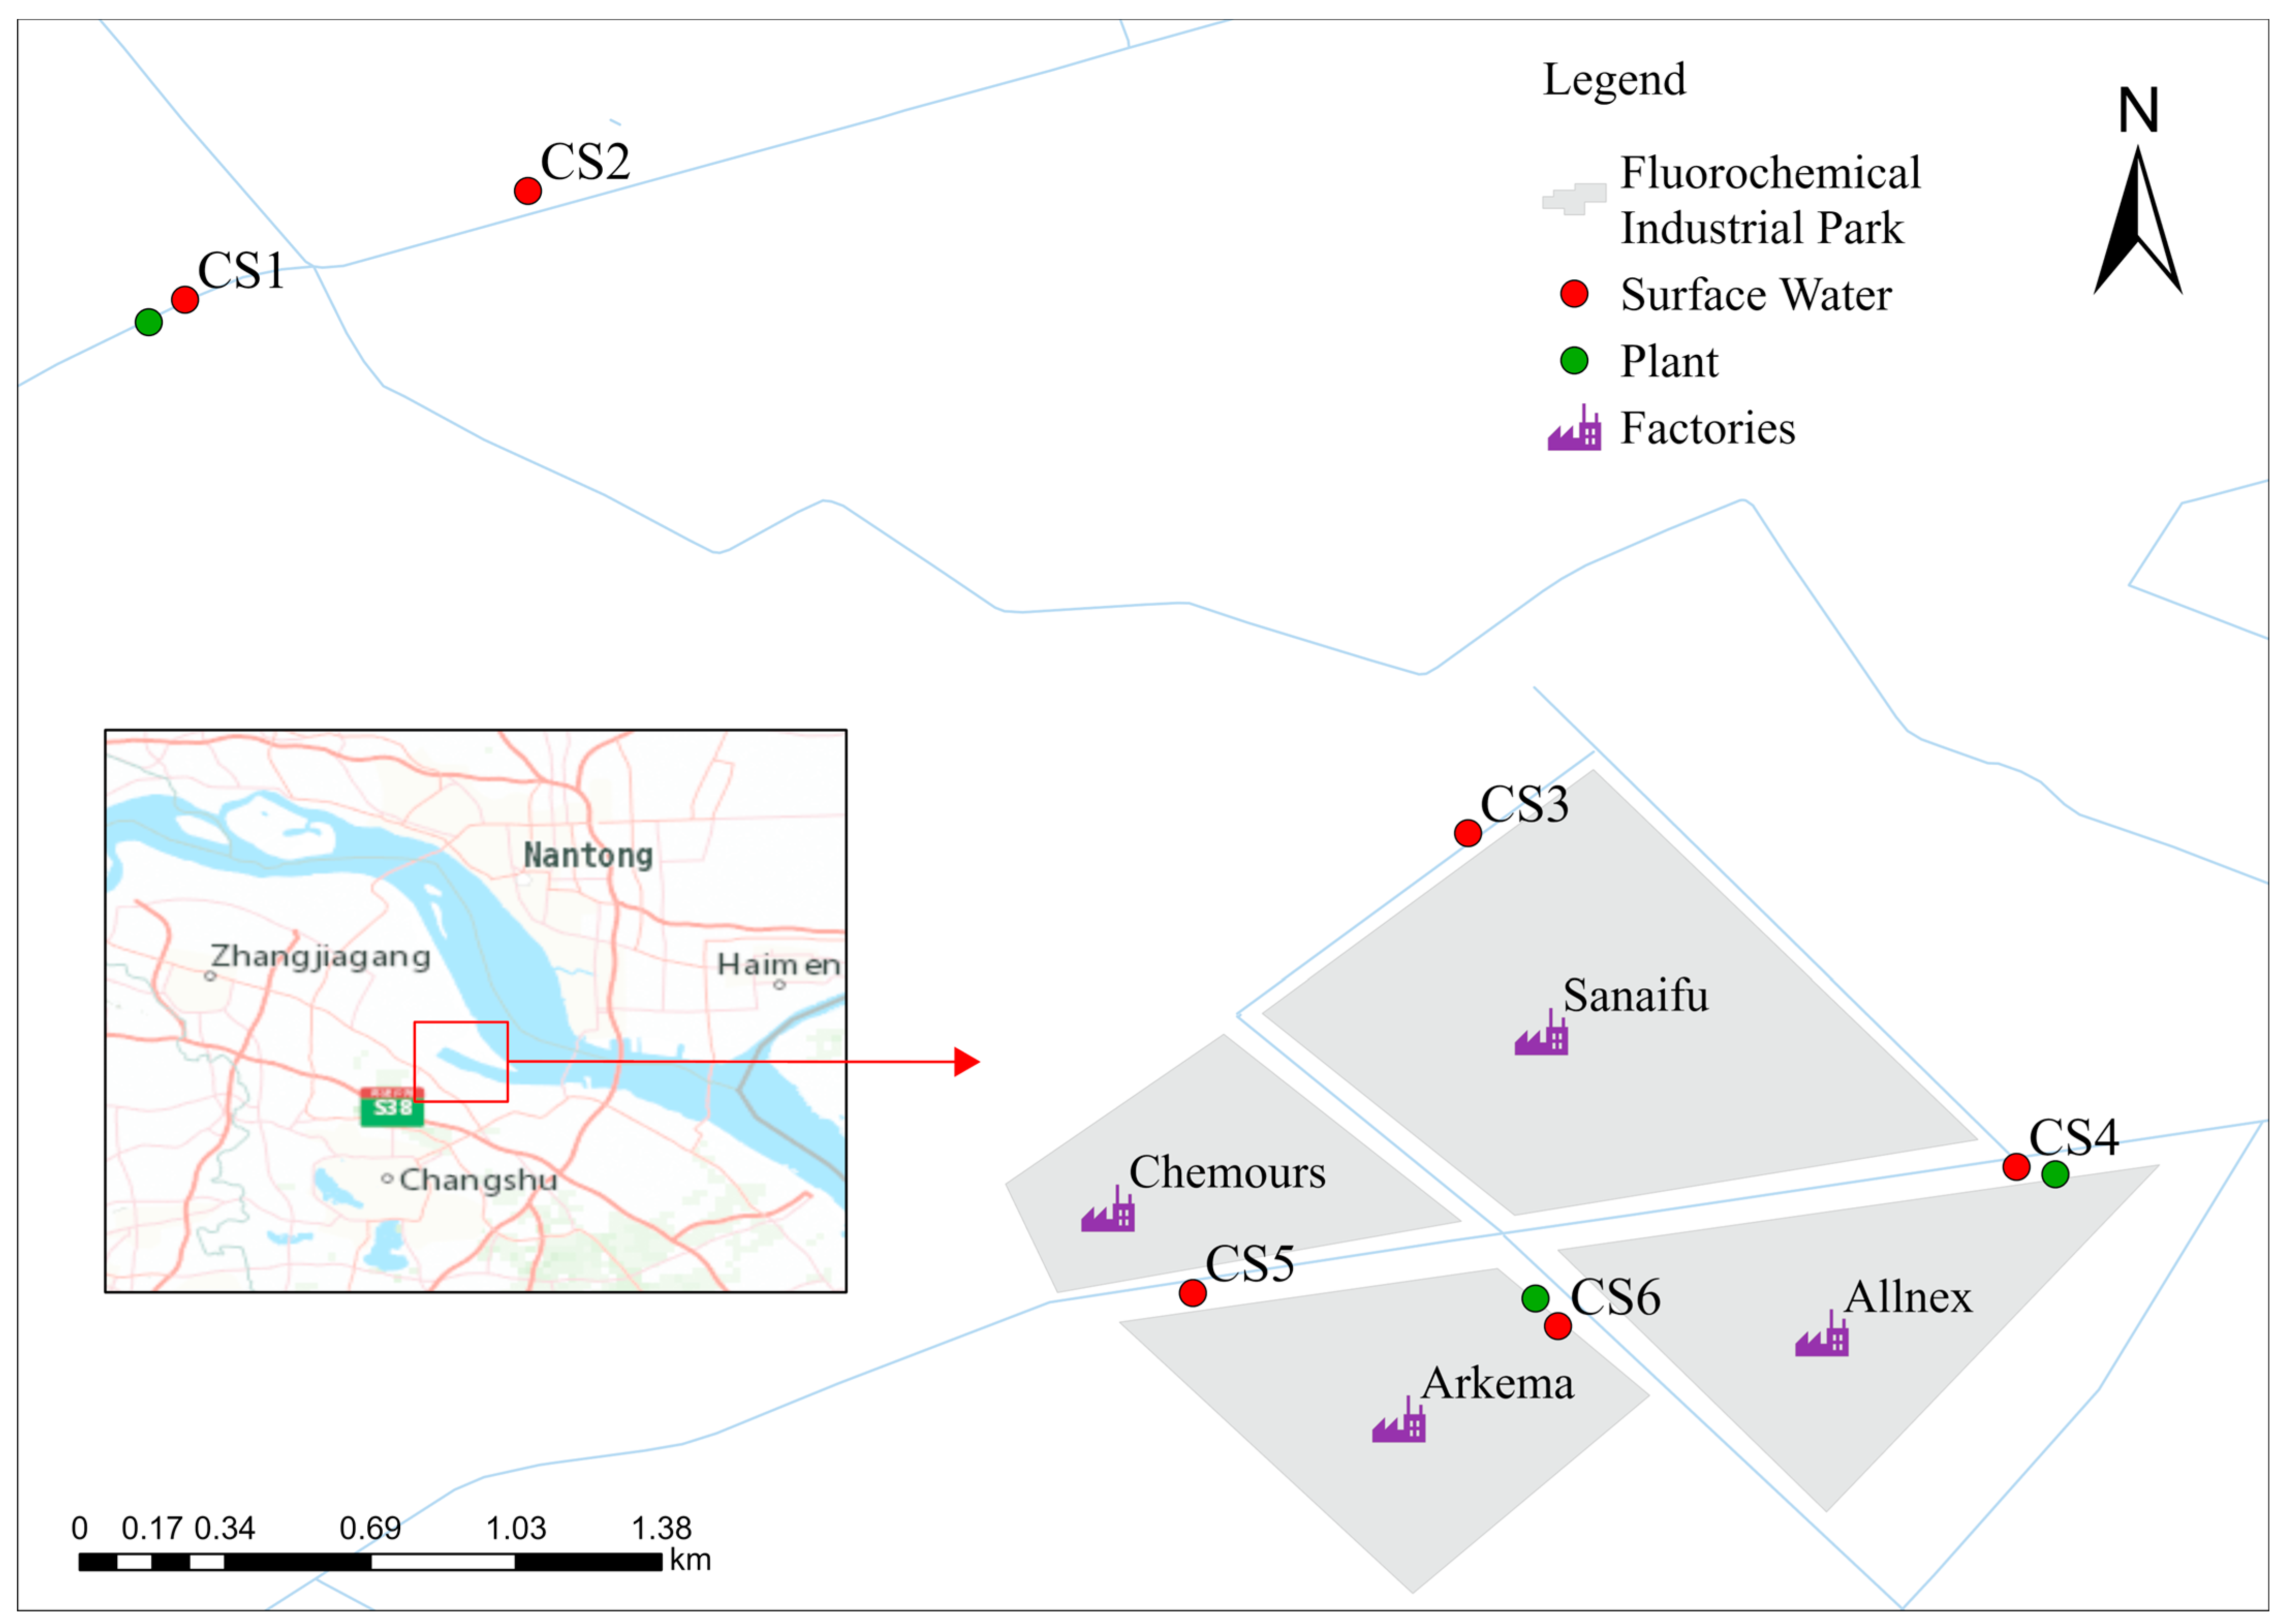
2.2. Sampling Campaign

All samples were collected from Jiangsu High-Tech Fluorochemical Industrial Park in October 2022. The sampling sites and main fluorochemical factories are provided in Figure 1. Surface water samples were collected at sites CS1–CS6 (Table S1). Plant samples were widespread local species and collected at sites CS1 (Alternanthera sessilis), CS4 (Eichhornia crassipes) and CS6 (Typha orientalis).
Surface water samples were collected in 1L Polypropylene (PP) bottles. Plant samples were stored in PP plastic bags. Upon returning to the laboratory, the plant samples were washed with tap water and Milli-Q water and separated into roots, stems, and leaves. For further extraction, the plant tissues were freeze-dried and milled into powder. All the samples were frozen at −20 °C before pre-treatment.

2.3. PFAS Extraction

Surface water samples were filtered through 0.7 μm glass fiber filters (47 mm, Whatman, Maidstone, UK, pre-combusted at 450 °C for 6 h) to separate the particle phase from water. The dissolved phase was spiked with 2 ng of IS compounds and extracted with Oasis WAX cartridges (30 μm, 6 mL, 150 mg, Waters Corporation, Milford, MA, USA). The cartridges were pre-conditioned with 0.2% ammonia methanol solution, 4 mL of methanol, and 4 mL of Milli-Q water. Then, 10 mL of 0.2% ammonia methanol solution was used for eluting. The eluent was concentrated to 1 mL under a gentle stream of nitrogen gas (>99.999%) and transferred to a Supelclean Envi-Carb cartridge (1 mL, 100 mg, Merck, Darmstadt, Germany) for further purification. Finally, 200 μL of eluent was stored in a sampler vial at −20 °C before analysis. After freeze-drying, the particle-phase samples were extracted with 10 mL of 0.2% ammonia methanol solution by sonication for 20 min and then centrifuged (3000 rpm) for 5 min. The procedure was repeated twice, and the combined extracts were processed in the same way as the dissolved-phase samples.
Plant samples were extracted by the method described by Zhang et al. with a few minor modifications [39]. In total, 10 mL of NaOH (0.4 M) was added to a 50 mL PP tube containing the freeze-dried plant tissue samples. The mixture was spiked with 2 ng of IS compounds and refrigerated at 4 °C overnight. Then, 2 mL of TBAHS (0.5 M) and 4 mL of Na2CO3/NaHCO3 buffer (0.25 M, pH10) were added into the mixture for extraction. After vortexing, 10 mL of MTBE was added and the mixture was shaken vigorously for 20 min. The organic and aqueous layers were separated by centrifugation (3000 rpm, 10 min), and the MTBE layer was transferred to another PP tube. The aqueous phase was further extracted twice with MTBE. The combined organic phase was evaporated under nitrogen gas and then reconstituted in 1 mL of methanol. After diluting with 9 mL of water, the sample was extracted with Oasis WAX cartridges and eluted by 4 mL of methanol and 4 mL of 0.2% ammonia methanol solution. The eluent was reduced to 1 mL under a gentle stream of nitrogen gas and then filtered through 0.22 μm nylon organic phase filters (13 mm, CNW, Berlin, Germany) before being transferred into a sampler vial.

2.4. Target Analysis

Thirty-two PFASs were measured in this study; details of the mass parameters for the compounds are given in Table S2. The quantification of PFASs was performed using ultra-high-performance liquid chromatography coupled with triple-quadrupole tandem mass spectrometry (UPLC-MS/MS, SHIMAZU, Kyoto, Japan) under multiple reaction monitoring (MRM) modes with negative electrospray ionization (ESI). A ZORBAX Eclipse Plus C18 analytical column (2.1 × 100 mm, 1.8 μm, Agilent, Santa Clara, CA, USA) was used at 50 °C. The mobile-phase constituents were Milli-Q water (A) and methanol (B) at a flow rate of 0.3 mL/min. The gradient was as follows: t = 0.1 min, 25% B; t = 5 min, 75% B; t = 10 min, 100% B. The injection volume was 1 μL.

2.5. Suspect and Nontarget Screening

Nontarget analysis was conducted using Vanquish Flex UHPLC coupled with quadrupole Orbitrap Exploris 240 MS (Thermo Fisher Scientific, Waltham, MA, USA). Chromatographic separation was performed on a ZORBAX Eclipse Plus C18 (2.1 × 5 mm, 1.8 µm, Agilent, USA) guard column and an analytical C18 column (2.1 × 100 mm, 1.8 µm, Agilent, USA). Mobile phase A was 2 mM ammonium acetate ultrapure water, and mobile phase B was acetonitrile. The gradient was as follows: t = 0.2 min, 20% B; t = 8 min, 80% B; t = 10 min, 95% B; t = 15 min, 20% B. The injection volume was 5 μL.
Samples were analyzed by intelligent data acquisition mode in AcquireX (Thermo Fisher Scientific, Waltham, MA, USA), which was based on the data-dependent acquisition (DDA) mode. AcquireX was used to acquire abundant MS2 information, and the data processing workflow was run by Compound Discoverer 3.3 (CD 3.3, Thermo Fisher Scientific, Waltham, MA, USA). For suspect screening, the raw data were pre-filtered following suspect lists, which combined the US EPA CompTox Chemistry Dashboard [40], the Norman Suspect List Exchange [41], and the Nist Suspect List of Possible Per- and Polyfluoroalkyl Substances (PFASs) [42]. When the suspect lists were unavailable, emerging PFAS compounds were discovered by extracting peaks with feature fragment ions [43,44,45]. For further confirmation in nontarget screening, the peak shape, peak response intensity and rationality of retention time were checked to comprehensively judge whether the feature was retained [36]. The confidence level (CL) of 2–4 was determined according to the study of Schymanski et al. [46]. Semi-quantitative analysis was conducted to determine the estimated concentrations of nontarget PFASs using target PFASs with similar structures [36]. More details can be found in Text S2.

2.6. Quality Assurance and Quality Control (QA/QC)

Teflon and polytetrafluoroethylene (PTFE) materials were avoided during the study to minimize the background contamination. The correlation coefficient of the calibration curve consisted of a concentration gradient (0.5, 1, 2, 5, 10, 20, 50, 100 and 200 ng/mL) of PFAS standards and was at least 0.999 for all target analytes. Procedure blanks were prepared using Milli-Q water and standard silica sand; they were routinely analyzed to check for contamination during PFAS extraction. The method spike recovery experiment was verified by adding a target PFAS to blank matrices including Milli-Q water and standard silica sand, and the matrix spike recovery experiment was verified by adding a target PFAS to plants with low background (Table S3). The method spike recoveries of all PFASs were in the range of 60–120%. Matrix effects were deemed not obvious, with the matrix effect recovery rates within the acceptable range of 70% to 130%. The limit of detection (LOD) and the limit of quantification (LOQ) were defined as the concentrations giving signal-to-noise ratios of 3 and 10, respectively (Table S3). The average spike recoveries of the IS compounds in the instrumental analysis are provided in Table S4.

2.7. Statistical Analysis

The partition coefficient, Kd, of PFASs between particles and dissolved phases was calculated by Equation (1):
K d = C p a r t i c l e   p h a s e C d i s s o l v e d   p h a s e × 1000
Cparticle phase: the concentrations of PFASs in the particle phase (ng/g dw); Cdissolved phase: the concentration of PFASs in the dissolved phase [24,47].
The root concentration factor (RCF), stem transfer factor (TFs) and leaf transfer factor (TFl) were calculated by Equations (2)–(4):
R C F = C r o o t C d i s s o l v e d   p h a s e
T F s = C s t e m C r o o t
T F l = C l e a f C r o o t
Croot: the concentrations of PFASs in the roots of plants (ng/g dw); Cstem: the concentrations of PFASs in the stems of plants (ng/g dw); Cleaf: the concentrations of PFASs in the leaves of plants (ng/g dw) [48,49].

3. Results and Discussion

3.1. PFASs in Surface Water

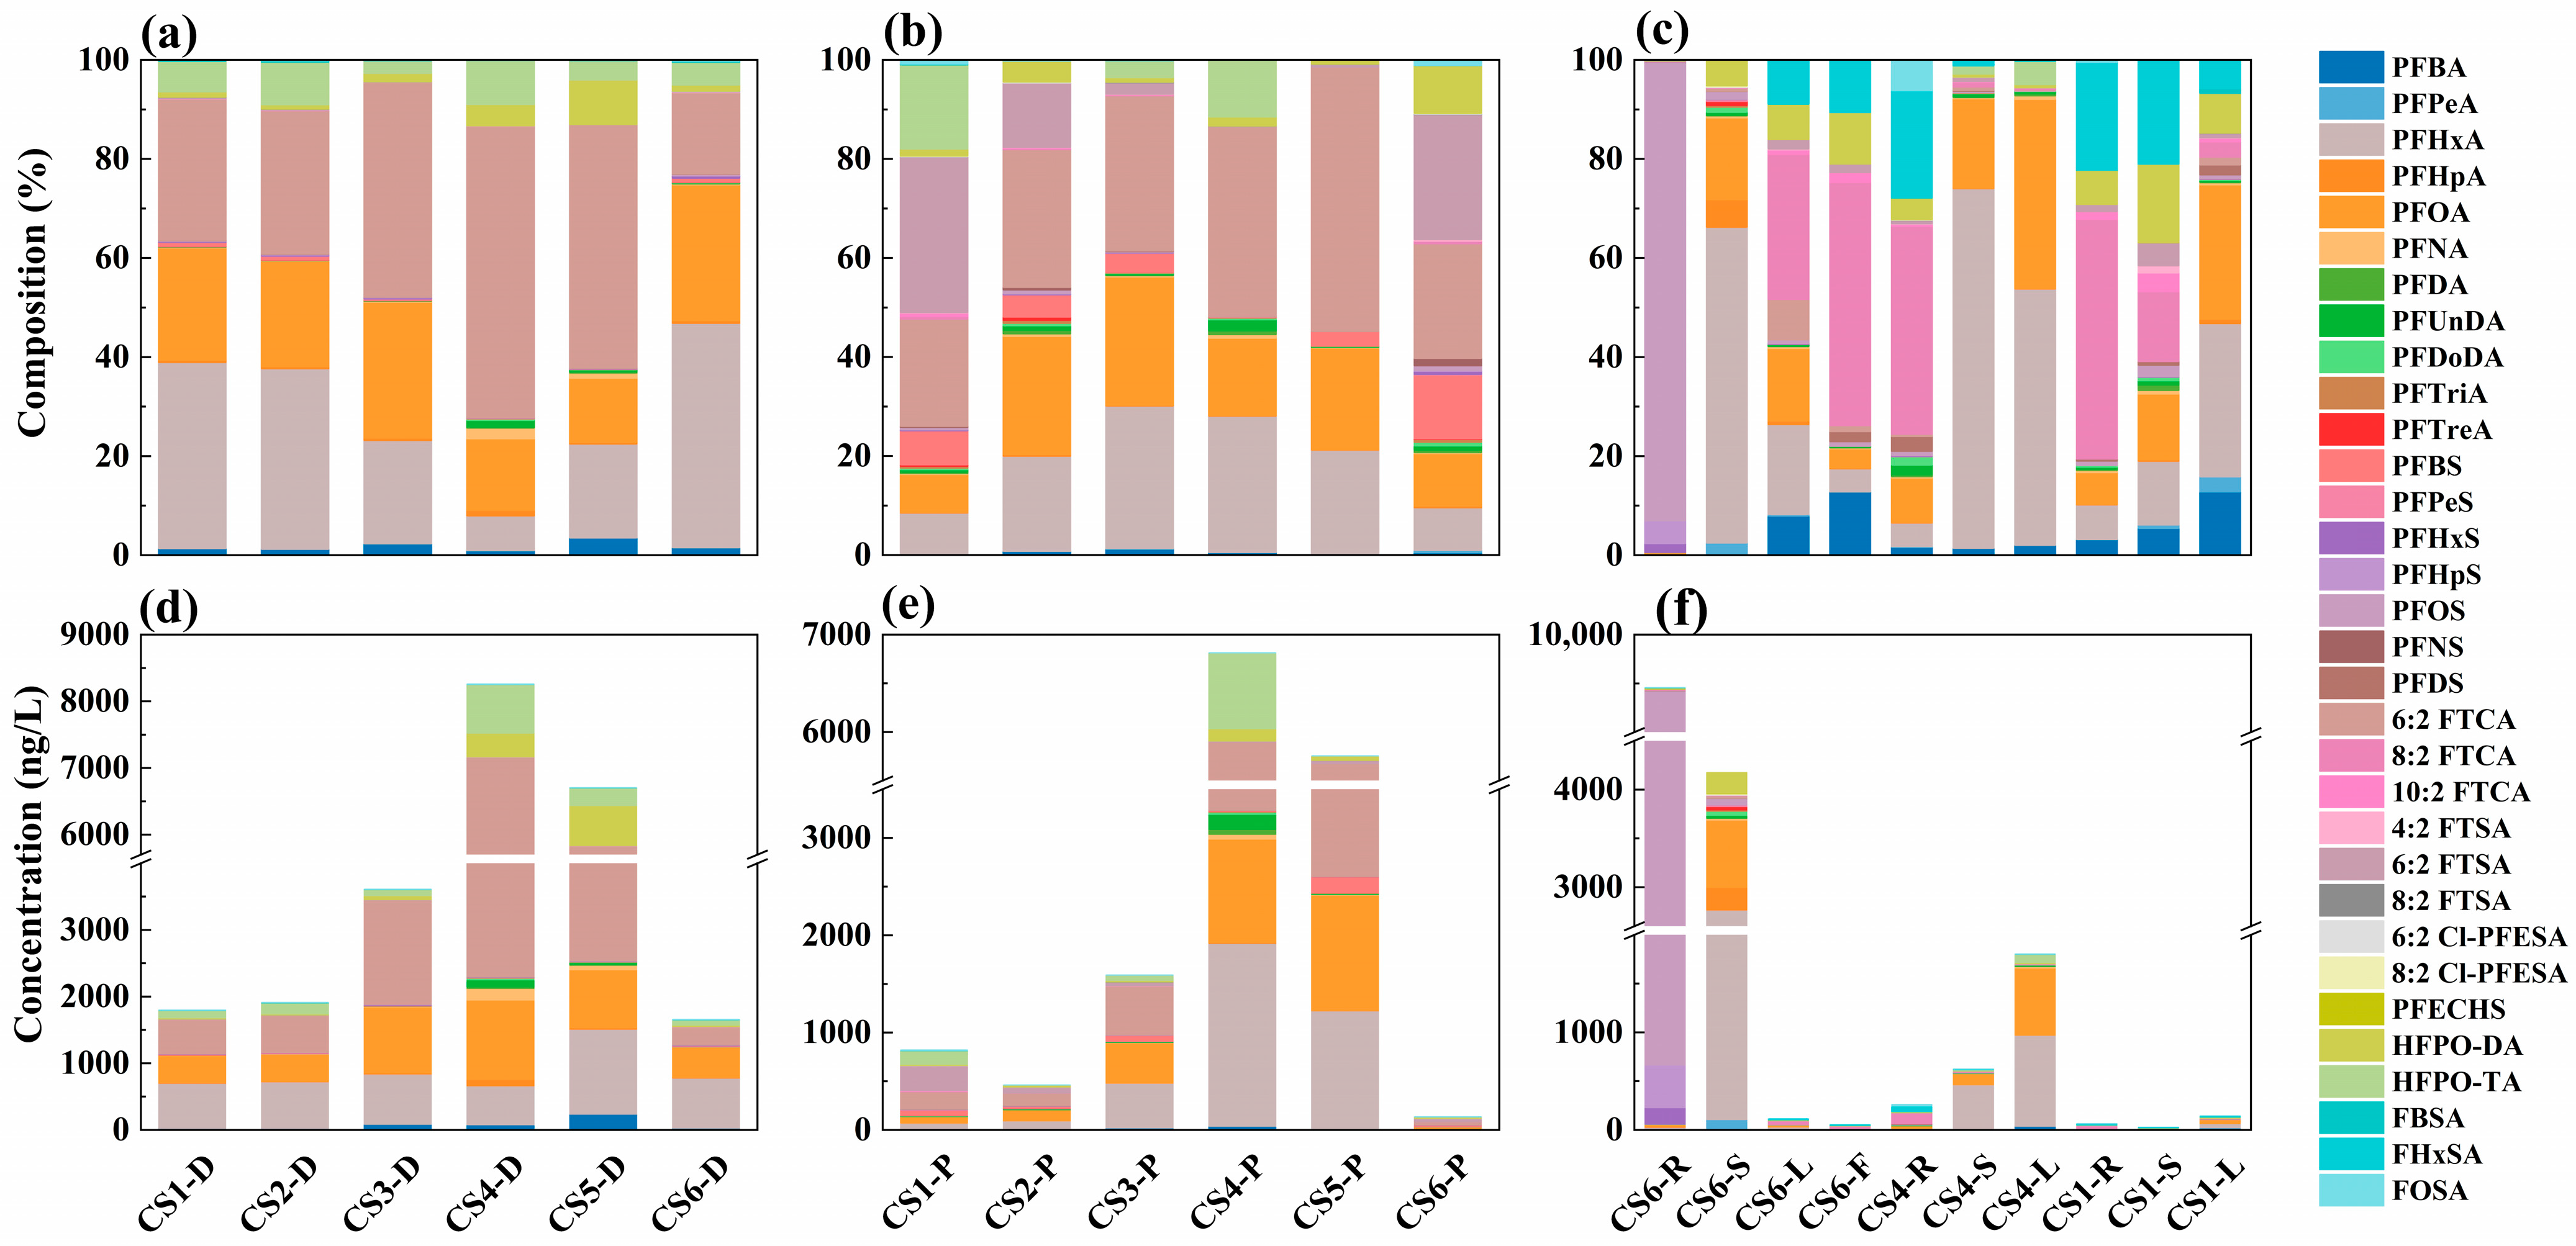
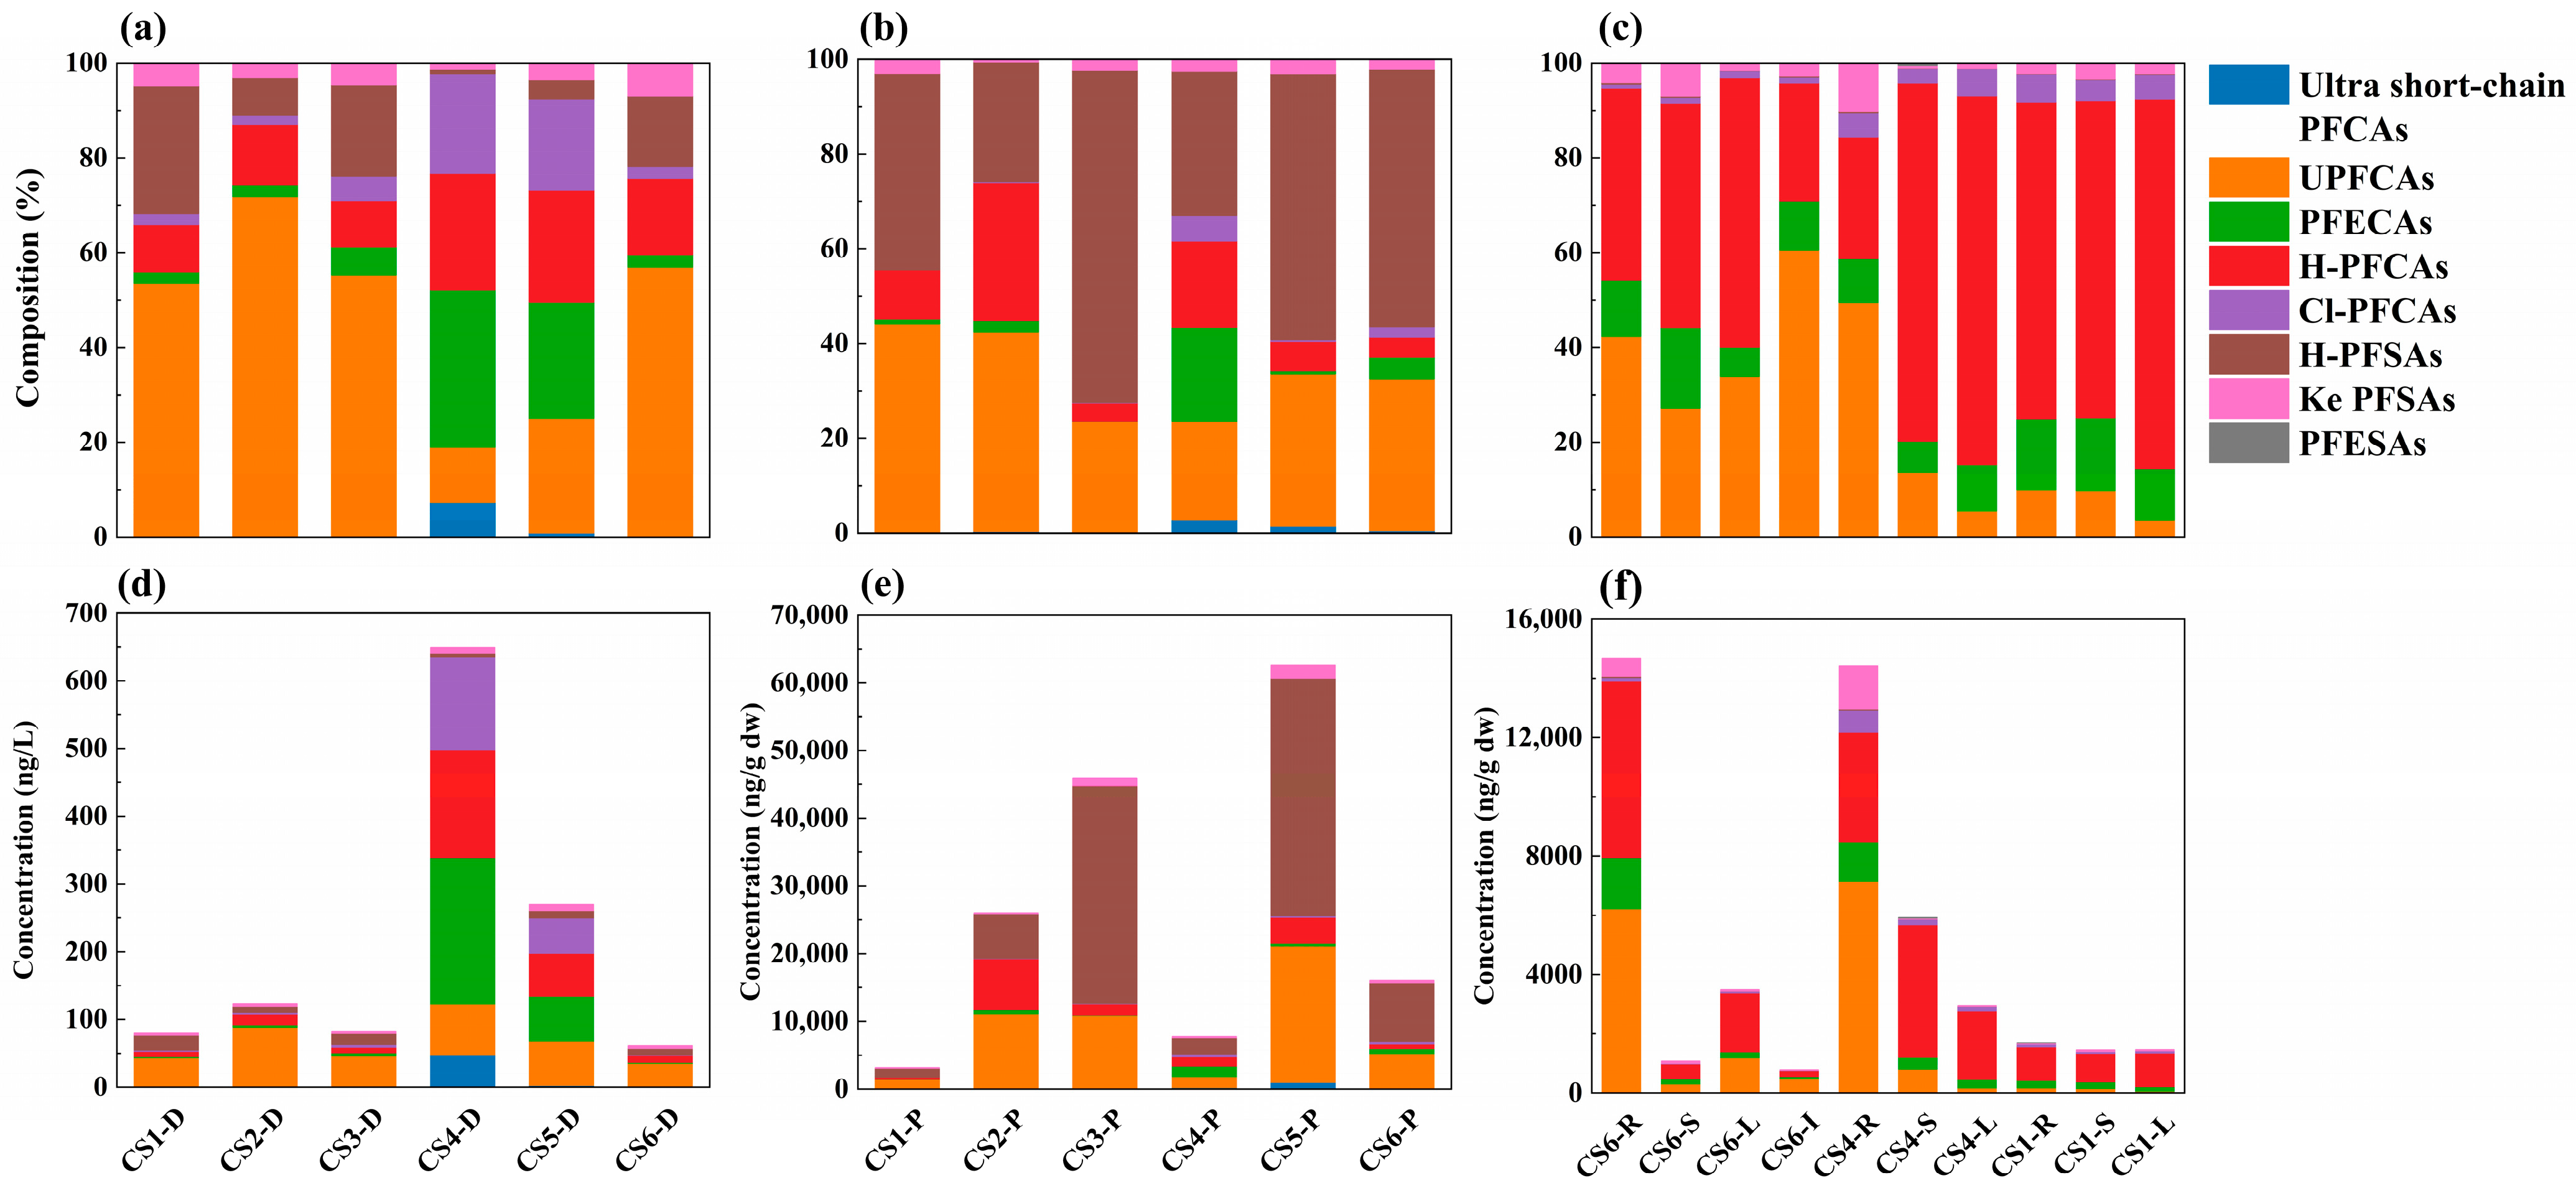
3.1.1. Concentration and Distribution of PFASs in Surface Water

The concentrations of PFASs in the dissolved phase and particle phase are summarized in Table 1. In the dissolved phase, 29 PFASs were detected among the 32 target PFASs analyzed in this study. The ΣPFAS ranged from 1650 to 8250 ng/L, with an average value of 3990 ng/L. This was higher compared to a 2013 study in Jiangsu High-Tech Fluorochemical Industrial Park, which reported a mean concentration of 2800 ng/L [33]. This indicated the influence of fluorochemical plants on the surrounding surface water over time. In the particle phase, the ΣPFAS ranged from 113 to 6800 ng/g dw, with a mean concentration of 1140 ng/g dw. The particle levels (g dw) in the particle phase are given in Table S5. All Perfluorocarboxylic acids (PFCAs) in this study were detected at a frequency of 100%, except perfluoropentanoic acid (PFPeA) (33%) and perfluorotridecanoic acid (PFTriA) (67%). Meanwhile, in the particle phase, C4–C14 PFCAs were detected with detection frequencies (DFs) of 100%, followed by PFBA (83%) and PFPeA (67%). The mean (median) concentrations of perfluorononanoic acid (PFNA), perfluorodecanoic acid (PFDA), perfluoroundecanoic acid (PFUnDA), perfluorododecanoic acid (PFDoDA), PFTriA and perfluorotetradecanoic acid (PFTreA) with longer chain lengths (C > 8) were in the range of <0.290–42.6 ng/L (<0.290–5.26 ng/L), which were much lower than those of PFCAs with short chain lengths (C ≤ 6). The mean (median) levels of perfluorinated sulfonic acids (PFSAs) were in the range of <0.228–9.15 ng/L (<0.228–10.86 ng/L) and relatively lower than those of PFCAs. For PFSAs in the particle phase, PFPeS and PFOS were 100% detected, with average concentrations of 0.0900 ng/g dw and 2.04 ng/g dw. Long-chain PFTreA and PFDS, not detected in the dissolved phase, were found in the particle phase at concentrations ranging from 0.240 to 2.25 ng/g dw and 0.440 to 1.12 ng/g dw, respectively. This suggested a stronger affinity of long-chain PFCAs and PFSAs to the particle phase [50]. For emerging PFAS, 6:2 FTCA, 6:2 fluorotelomer sulfonic acid (6:2 FTSA), 6:2 chlorinated polyfluorinated ether sulfonic acid (6:2 Cl-PFESA), hexafluoropropylene oxide dimer acid (HFPO-DA) and trimer acid (HFPO-TA) were frequently detected with DFs of 100%, and the mean (median) value of them ranged from 0.29 to 1840 ng/L (0.300–1060 ng/L). As substitutes for PFOA, HFPO-DA and HFPO-TA were present in total concentrations ranging from 16.4 ng/L to 601 ng/L (with an average of 179 ng/L) and 76.8 ng/L to 731 ng/L (with an average of 240 ng/L), respectively. The PFAS levels in this study were classified as moderate compared to other regions. The average concentrations of ΣPFAS in fluorinated industrial parks in Zibo, China and Fuxin, China were 354,000 ng/L and 3050 ng/L [36]. As for the river water collected upstream and downstream from a fluorochemical production plant in the Netherlands, the average concentrations of ΣPFAS occurred in a range from 38.0 to 876 ng/L [51].
Figure 2a,b show that PFHxA, PFOA and 6:2 FTCA were the predominant PFASs in the dissolved phase and particle phase in Jiangsu High-Tech Fluorochemical Industrial Park, with both contributing 84% to ΣPFAS. This was consistent with the research by Song et al. [36]. In the dissolved phase, PFHxA accounted for the highest proportion (45%) at site CS6. PFOA accounted for the highest proportion at site CS3 (27%) and CS6 (27%), which was the most widely used PFAS during the emulsion polymerization of PTFE [52]. This may be because PFHxA has been used by Arkema Factory to produce Fluorine Kautschuk material (FKM) since 2008 [53]. Chemours (part of the DuPont fluorochemicals division) and the fluoropolymer plant of Arkema were reported to use PFOA to manufacture PTFE [52]. It was shown that 6:2 FTCA constituted 18–59% and 22–53% of the total PFASs in two phases, which may have originated from industrial wastewater discharge during its production process, and the perfluorocarbon C6 alkyl structure products produced by the DuPont Branch through the telomerization reaction may be important precursors of 6:2 FTCA [36,54]. Emerging PFASs, particularly 6:2 FTSA, HFPO-DA and HFPO-TA, dominated the dissolved phase and particle phase with total concentrations of 2520 ng/L and 1630 ng/g dw. These three compounds can be used as processing aids in the manufacture of fluorinated polymers, including polyvinylidenefluoride (PVDF) and PTFE, which are the main products of Arkema, Chemours and Sanaifu [53,55]. The concentrations of ΣPFAS were comparatively higher at sampling sites CS3, CS4 and CS5 compared to other sampling points. The highest concentration was detected at CS4, which represented the confluence of two rivers. The mixing of two rivers may lead to a release of PFASs in the sediment, thus resulting in higher concentrations at the confluence [56]. The concentrations of ΣPFAS at CS1 and CS2 were 1790 ng/L and 1910 ng/L; this may have been due to the well-developed textile and apparel industries and the proximity of some sampling points to the fluorochemical factory [57].
The occurrence of nontarget PFASs in different media is shown in Figure 3 based on semi-quantitative calculations. A total of 67 emerging PFASs were identified in all samples using nontargeted analysis (Tables S7 and S8). There were nine classes in the CF2 Kendrick mass defect plot (Figure S1), where same line implied homologues with CF2 units. Twenty-seven emerging PFASs were identified as Level 2, including ultra-short-chain PFCAs, unsaturated perfluorocarbonic acids (UPFCAs), perfluoroether carbonic acids (PFECAs), hydrogenated perfluorocarbonic acids (H-PFCAs), chlorinated perfluorocarbonic acids (Cl-PFCAs), hydrogenated perfluorosulfonic acids (H-PFSAs), ketone perfluorosulfonic acids (Ke PFSAs) and perfluoroether sulfonic acids (PFESAs), totaling eight classes. Figures S2–S17 provide structures and MS/MS spectra evidence of each class of PFAS. The estimated concentrations of nontarget PFASs (Level 2) in surface water (dissolved phase and particle phase) were in the ranges of 61.3–649  ng/L and 3160–62,600  ng/g dw (Figure 3). The total estimated concentrations of nontarget PFASs exceeded those of target PFASs in 15 out of 22 samples, indicating the severe emerging PFAS pollution. In the dissolved phase, UPFCAs, H-PFCAs and Ether PFCAs were the main pollutants, accounting for 28%, 28% and 23% of the total nontarget PFAS concentration, while H-PFSAs, UPFCAs and H-PFCAs dominated in the particle phase with proportions of 53%, 31% and 10%. H-PFCAs could be an alternative polymerization agent of PVDF production or an impurity in the oligomerization process using ammonium salt of C9HF17O4 as the main active ingredient [36]. In this study, a small amount of C9HF17O4 was identified (2–3% of the total nontarget PFAS concentration), so H-PFCAs may be mainly released from the production of PVDF.

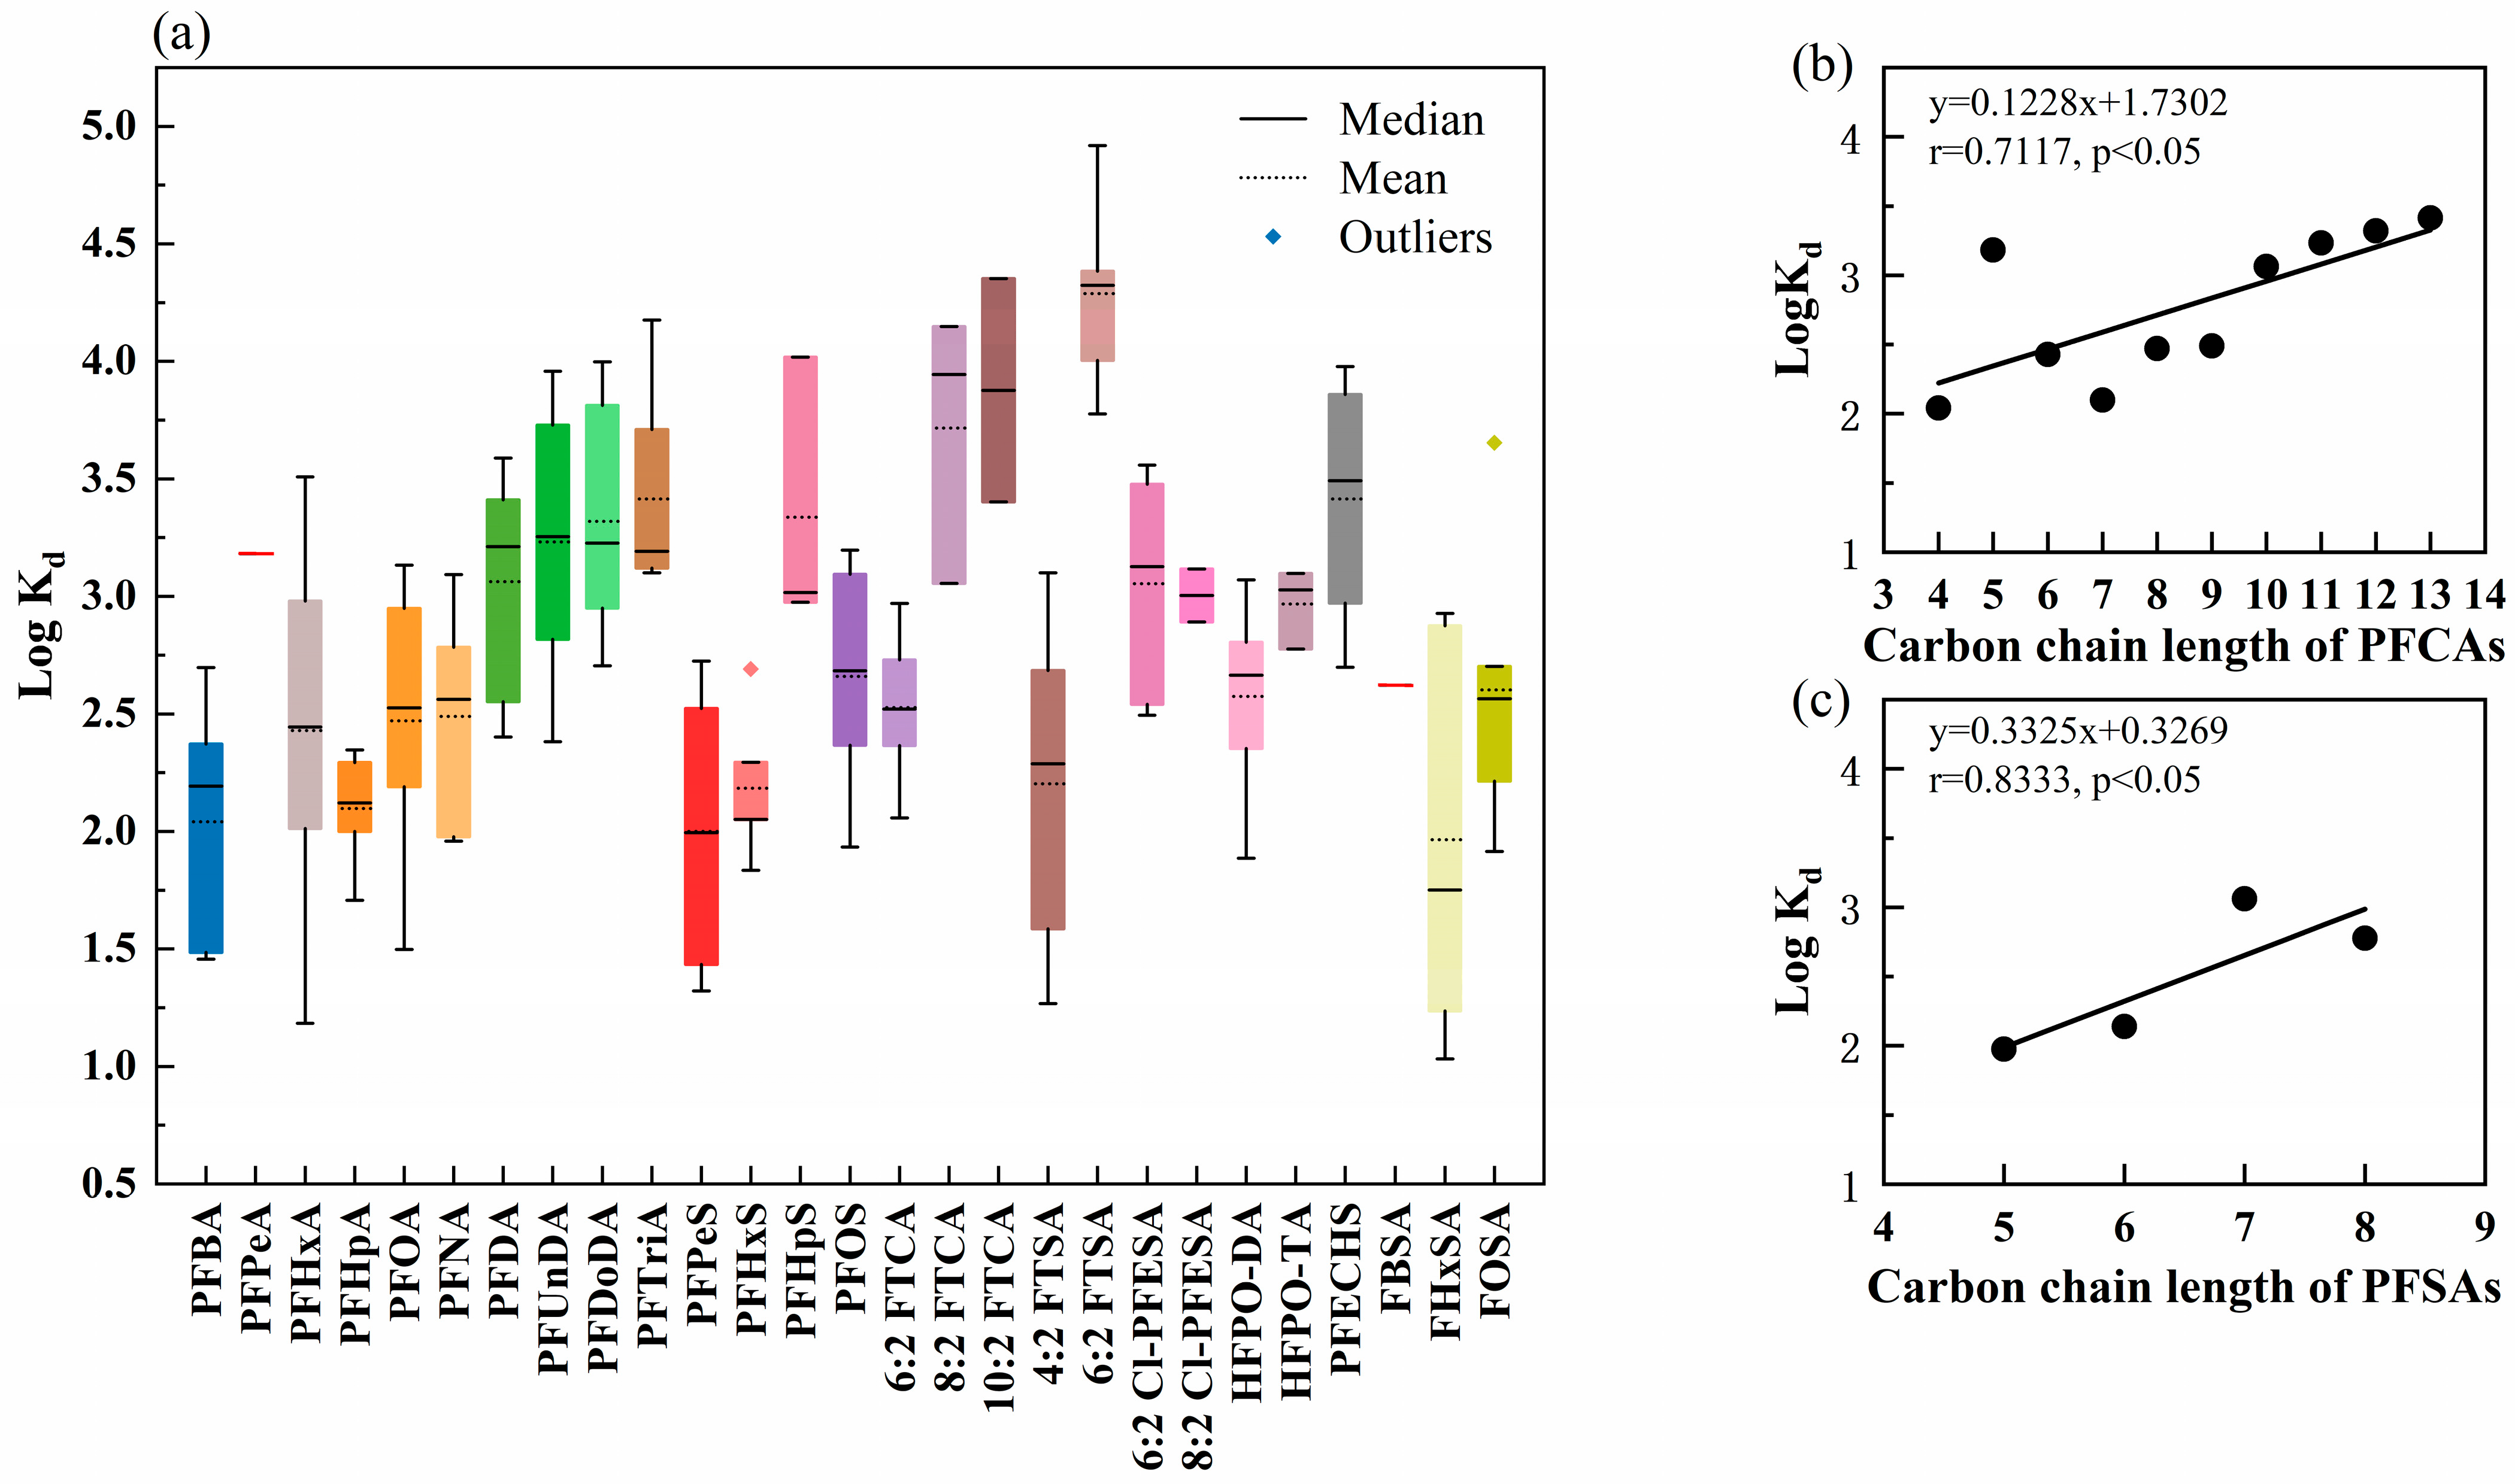
3.1.2. Partitioning of PFASs in Dissolved Phase and Particle Phase

Kd values varied greatly among different sampling points, which could have been due to the dynamic aquatic ecosystem, in which it is difficult to achieve a steady-state equilibrium in the environment [47,58]. Therefore, the mean value of log Kd was used to represent the partition coefficient in this study. As in shown in Figure 4, the average log Kd of PFCAs ranged from 2.04 to 3.41, exhibiting a positive linear correlation (r = 0.7117, p < 0.05) with increasing carbon chain length (C4–C14) from PFBA to PFTriA. Meanwhile, the average log Kd of PFSAs (2.00–3.34) showed a positive linear correlation (r = 0.8333, p < 0.05) with increasing carbon chain length (C5–C8) from PFPeS to PFOS. This observed trend aligns with previous research findings [47,59]. The particle phase may influence the distribution of PFASs in aquatic environments. Long-chain PFCAs and PFSAs were more likely to interact with the particle phase, promoting their long-distance transport and deposition in sediments via water movement. PFECHS had a relatively high average log Kd value (3.42), suggesting that the hexagonal chemical ring structure of PFECHS enhances its association with the particle phase [47].

3.2. PFASs in Aquatic Plants

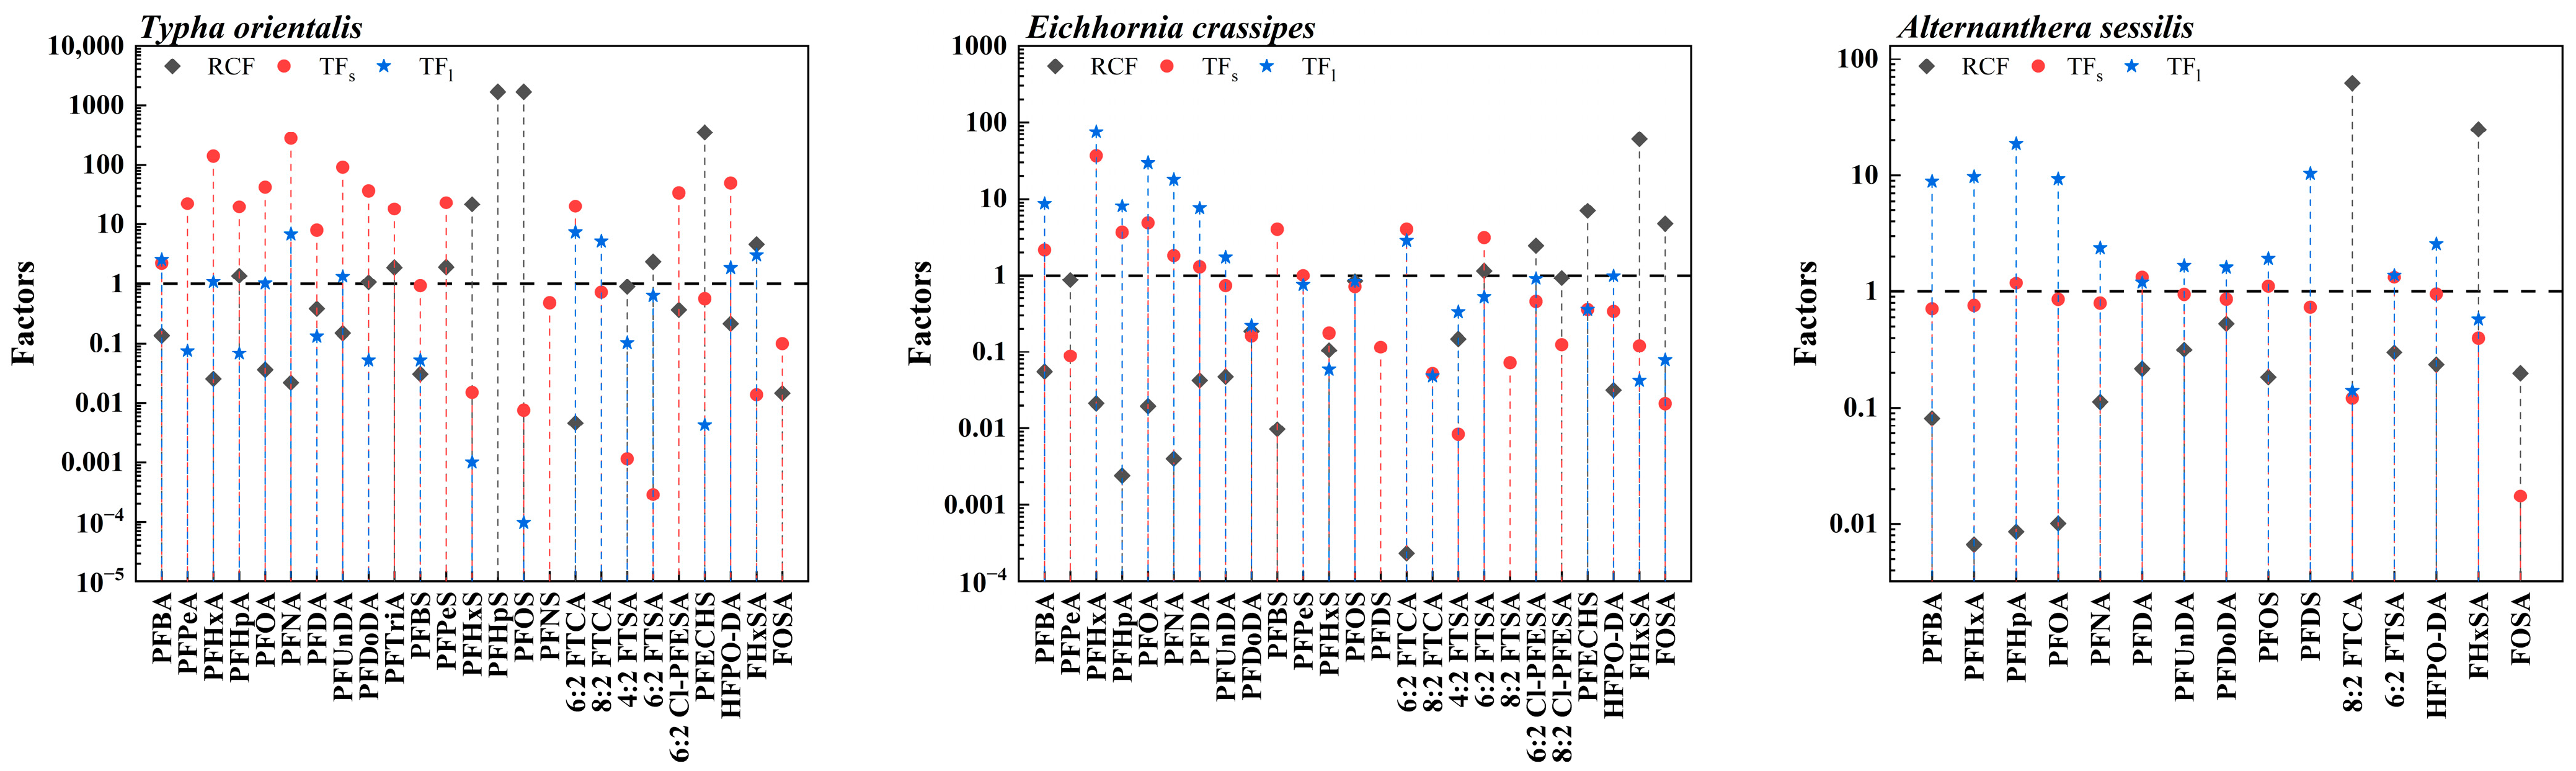
3.2.1. Absorption of PFASs in Aquatic Plants

Figure 2c,f show the concentrations and distributions of PFASs in aquatic plants. A total of 32 PFASs were detected in aquatic plant samples from Jiangsu High-Tech Fluorochemical Industrial Park, of which, 10 PFASs had DFs of 100%, including PFBA, PFHxA, PFHpA, PFOA, PFNA, PFUnDA, PFDA, PFUnDA, PFOS, 8:2 FTCA, 6:2 FTSA and HFPO-DA. PFOA and PFHxA were the main substances in plant samples, with mean concentrations in three species of 415 ng/g dw and 159 ng/g dw, indicating that plants may be affected by river pollution. Short-chain PFAAs (C4–C7) were more abundant than long-chain PFAAs (C > 8) in aquatic plants. On average, short-chain PFAAs were found 24 times more than long-chain PFAAs. This aligned with previous research indicating that there was a higher uptake rate of PFASs with shorter-chain carbons in plants [34,60]. The main emerging PFASs were 8:2 FTCA and HFPO-DA, with average concentrations of 23.6 ng/g dw and 24.2 ng/g dw. According to previous studies, plants can take up and transform many PFCA precursors and HFPO homologs [61,62]. For nontarget PFASs (Figure 3c,f), there were 13 nontarget PFASs with DFs of 100% in aquatic plants, including UPFCAs (n = 5, 8), Ke PFSAs (n = 8, 13), H-PFCAs (n = 4–7, 12), Cl-PFCAs (n = 9) and PFECAs (n = 9, 11, 12). Nontarget PFASs primarily accumulated in roots, accounting for 73% (Typha orientalis), 62% (Eichhornia crassipes) and 37% (Alternanthera sessilis) of the total concentration. Based on previous studies, nontarget PFASs may be by-products of industrial production processes and degradation products formed by the biological transformation of PFAS precursors in plants [36,62,63].
RCF was used to estimate a plant’s ability to accumulate PFASs from water. RCF > 1 was considered to indicate effective accumulation [29,64]. As is shown in Figure 5 and Table S7, RCFs were in the range of 0.00460–1680, 0.000234–60.4 and 0.00665–61.8 in Typha orientalis, Eichhornia crassipes and Alternanthera sessilis, with average RCFs of 5.54, 0.0314 and 0.0352. Among the three plants, Typha orientalis had a relatively strong root bioaccumulation ability and was most effective in taking up PFHpA, PFDoDA, PFTriA, PFPeS, PFHxS, PFHpS, PFOS, 6:2 FTSA and PFECHS with higher RCFs. PFCAs followed a “U”-shaped trend of RCFs decreasing as chain length increased from PFBA to PFOA, and increasing from PFOA to PFTriA, except slightly increased RCFs of PFHpA in Typha orientalis and PFPeA in Eichhornia crassipes. In contrast, RCFs increased with increasing chain lengths of PFSAs (Figure 5). Similar phenomena have been observed in multiple studies [65,66,67,68]. According to the previous indoor exposure experiments, the root accumulation of short-chain PFCAs (C < 7) and PFSAs (C < 6) may be due to their small molecular size and strong hydrophilicity, making them easy to be absorbed by plants’ roots along with water. For long-chain PFCAs and PFSAs, this may be due to their strong hydrophobicity, making them easy to be adsorbed on the root surface [68,69,70]. But in this study of an actual aquatic environment, there were more complex mechanisms; the growth environment and plant species may have been possible influencing factors. For emerging PFASs, 6:2 Cl-PFESA had a higher RCF than PFOS in Eichhornia crassipes, which may have been due to the hydrophobic group Cl reducing the hydrophilicity of the PFASs, thereby weakening their migration ability [71].

3.2.2. Transport of PFASs in Aquatic Plants

The transport pathways of PFASs in aquatic plants were compound-specific, and there were differences in concentrations among different tissues even within the same species [72]. Among the four plant tissues (roots, stems, leaves and inflorescences) of Typha orientalis grown at CS6, the highest total concentration of the target PFAS was observed in the roots (9460 ng/g dw), followed by stems (4170 ng/g dw), leaves (112 ng/g dw) and inflorescences (51.2 ng/g dw). The fast growth rate, large size and significant below-surface components made Typha orientalis more likely to absorb pollutants from the environment [73]. It was noted that the highest concentration of PFOS was detected in the roots of Typha angustifolia (8760 ng/g d.w.), accounting for 93% of ΣPFAS. This may have been due to the fact that the root cell structure of Poaceae Barnhart changed with growth, increasing the contact area between their roots and pollutants in the aquatic environment [74]. Moreover, previous research had reported that PFOS accumulated largely in the roots (49–96%) of wetland plants [75]. In contrast, for Eichhornia crassipes collected from CS4, leaves exhibited the highest total target PFAS concentration (1800 ng/g dw), followed by stems (624 ng/g dw) and roots (259 ng/g dw). It is noteworthy that the concentrations of PFSAs in the roots of Eichhornia crassipes were 5 times higher than those in the leaves, demonstrating a stronger affinity for binding to root cells. This observation aligned with the results of hydroponic experiments conducted by Phung et al. [76]. The trend of leaf accumulation was also observed in Alternanthera sessilis samples from CS1, where leaves (140 ng/g dw) accumulated the most target PFASs, followed by roots (48.7 ng/g dw) and stems (25.8 ng/g dw). Across the three plant species examined, stems exhibited a relatively weaker capacity for PFAS accumulation, contributing 1–23% to ΣPFAS. This may have been because when PFASs in the root system migrate through the xylem of the stem via transpiration, stems thus exhibit a relatively weaker capacity to retain these PFASs as primary transport organs compared to other plant tissues [77]. In the leaves of Eichhornia crassipes and Alternanthera sessilis, short-chain PFCAs accounted for 58% and 63% of the total PFCAs, indicating that short-chain PFCAs with stronger hydrophilicity were more likely to migrate upwards in floating plants through transpiration.
In this study, TFs were used to measure the ability of plants to absorb and transport pollutants [78]. When TF > 1, this indicates that PFASs have the ability to migrate and transport between different environmental media [49]. On average, TFs followed the following order: Typha orientalis (31.6) > Eichhornia crassipes (2.64) > Alternanthera sessilis (0.800). Meanwhile, TFl showed a different trend: Eichhornia crassipes (7.83) > Alternanthera sessilis (5.02) > Typha orientalis (1.65). Among PFCAs (C < 7) in floating plants (Eichhornia crassipes and Alternanthera sessilis), the average TFs and TFl were higher than those in PFCAs (C ≥ 8), indicating that these two plants had a stronger ability to transport short-chain PFCAs. For PFSAs, only PFBS and PFPeS had TFs values greater than 1. Two possible explanations for the declining TFs with increasing chain length were that (1) larger-molecular-weight PFASs require more energy for transport, leading to reduced mobility; (2) longer carbon chain lengths may hinder their ability to cross the Kjeldahl band, a barrier within the plant [68,79]. As an alternative to PFOA, both TFs and TFl of HFPO-DA in Typha orientalis were higher than PFOA (ΔTF = 0.860–7.16), and it was the opposite situation in another two species. Similar patterns of TF were also observed in a previous study, where the TF value of HFPO-DA was significantly higher than that of PFOA across the four plants studied, with ΔTF = 0.9–3.2 (Phyllanthus urinaria, Justicia procumbens, Eleusine indica, and Aster indicus) [68]. This trend may indicate that ether bonds could enhance the migration and transformation of pollutants, and plant species also have an impact on the migration of pollutants in their bodies [78]. Intriguingly, the RCF values for PFHxA exhibited minimal variation across Typha orientalis, Eichhornia crassipes and Alternanthera sessilis (0.0300, 0.0200 and 0.0100), despite TFs values differing (139, 36.5, and 0.760). Conversely, the RCF values for PFOS showed a vast difference of 103 orders of magnitude between the three plants (1680, 0.840 and 0.180), yet TFs values remained relatively similar (0.0100, 0.710 and 1.10). These observations highlighted how both plant species and the inherent properties of PFAS compounds themselves influenced plants’ abilities to transport these chemicals.
Plant species with both RCFs and TFs greater than one have the potential to be used for phytoremediation [80,81]. Although no PFAS phytoremediators were found in this study, PFAS-tolerant species with high BCF (BCF > 1) and low TF (TF < 1) values can be used for the phytostabilization of contaminated sites [82,83]. In this study, such plants included Typha orientalis for C6–C8 PFSAs, 6:2 FTSA and PFECHS; Eichhornia crassipes for 8:2 FTSA, PFECHS, FHxSA and FOSA; and Alternanthera sessilis for 8:2 FTCA and FHxSA (Figure 5). More plant species should be studied to find PFAS phytoremediators in actual aquatic environments. Also, more influencing factors corresponding to the translocation and bioaccumulation of PFASs within plant compartments merit further investigation.

4. Conclusions

In the Jiangsu High-Tech Fluorochemical Industrial Park, PFHxA, PFOA and 6:2 FTCA were the primary contaminants in surface water. The spatial distribution of ΣPFAS in dissolved- and particle-phase samples suggests that fluorochemical plants may be potential sources. Long-chain PFCAs and PFSAs have a higher affinity for interacting with the particle phase. Emerging PFAS contamination within fluorochemical industrial parks has warranted serious attention. Typha orientalis, Eichhornia crassipes and Alternanthera sessilis have the potential for use in PFAS phytostabilization. The uptake and transport of PFASs in plants exhibit species and compound specificity. The root bioaccumulation ability of Typha orientalis was relatively strong. Short-chain PFCAs were more likely to migrate upwards in floating plants (Eichhornia crassipes and Alternanthera sessilis) through transpiration.

Supplementary Materials

The following supporting information can be downloaded at: https://www.mdpi.com/article/10.3390/w16111513/s1.

Author Contributions

Methodology, data analysis, manuscript drafting and formal analysis, J.H.; writing—review, editing and funding acquisition, Z.Z.; software, J.L.; validation, S.L. All authors have read and agreed to the published version of the manuscript.

Funding

This research was funded by the Natural Science Foundation of Shanghai, 22ZR1427600 and National Natural Science Foundation of China, NSFC41977310.

Data Availability Statement

Data will be made available on request.

Conflicts of Interest

The authors declare no conflicts of interest.

References

  1. Zhuoma, D. Preparation of Metal-Organic Framework Composite Nanofibers and Application in Perfluoroalkyl and Polyfluoroalkyl Substances Analysis. Master’s Thesis, Wuhan University, Wuhan, China, 2022. [Google Scholar]
  2. ECHA. Annex Xv Restriction Report—Per- and Polyfluoroalkyl Substances (PFASs); ECHA: Helsinki, Finland, 2023. [Google Scholar]
  3. He, Q.; Yan, Z.; Zhi, Y.; Qian, S.; Wang, X.; Chen, Y.; Liu, C.; Chen, C.; Hu, X. Research Progress on Bioaccumulation of Per- and Polyfluoroalkyl Compounds by Plants. China Environ. Sci. 2022, 42, 5395–5407. [Google Scholar] [CrossRef]
  4. Kudo, N.; Kawashima, Y. Toxicity and Toxicokinetics of Perfluorooctanoic Acid in Humans and Animals. J. Toxicol. Sci. 2003, 28, 49–57. [Google Scholar] [CrossRef]
  5. Grandjean, P.; Andersen, E.W.; Budtz-Jørgensen, E.; Nielsen, F.; Mølbak, K.; Weihe, P.; Heilmann, C. Serum Vaccine Antibody Concentrations in Children Exposed to Perfluorinated Compounds. JAMA 2012, 307, 391–397. [Google Scholar] [CrossRef] [PubMed]
  6. Post, G.B.; Cohn, P.D.; Cooper, K.R. Perfluorooctanoic Acid (PFOA), an Emerging Drinking Water Contaminant: A Critical Review of Recent Literature. Environ. Res. 2012, 116, 93–117. [Google Scholar] [CrossRef]
  7. Ganesan, S.; Vasudevan, N. Impacts of Perfluorinated Compounds on Human Health. Bull. Environ. Pharmacol. Life Sci. 2015, 4, 183–191. [Google Scholar]
  8. Rainieri, S.; Conlledo, N.; Langerholc, T.; Madorran, E.; Sala, M.; Barranco, A. Toxic Effects of Perfluorinated Compounds at Human Cellular Level and on a Model Vertebrate. Food Chem. Toxicol. 2017, 104, 14–25. [Google Scholar] [CrossRef]
  9. Pelch, K.E.; Reade, A.; Wolffe, T.A.; Kwiatkowski, C.F. PFAS Health Effects Database: Protocol for a Systematic Evidence Map. Environ. Int. 2019, 130, 104851. [Google Scholar] [CrossRef] [PubMed]
  10. Blake, B.E.; Fenton, S.E. Early Life Exposure to Per-and Polyfluoroalkyl Substances (PFAS) and Latent Health Outcomes: A Review Including the Placenta as a Target Tissue and Possible Driver of Peri-and Postnatal Effects. Toxicology 2020, 443, 152565. [Google Scholar] [CrossRef]
  11. Paul, A.G.; Jones, K.C.; Sweetman, A.J. A First Global Production, Emission, and Environmental Inventory for Perfluorooctane Sulfonate. Environ. Sci. Technol. 2009, 43, 386–392. [Google Scholar] [CrossRef]
  12. Zhong, H.; Zheng, M.; Liang, Y.; Wang, Y.; Gao, W.; Wang, Y.; Jiang, G. Legacy and Emerging Per- and Polyfluoroalkyl Substances (PFAS) in Sediments from the East China Sea and the Yellow Sea: Occurrence, Source Apportionment and Environmental Risk Assessment. Chemosphere 2021, 282, 131042. [Google Scholar] [CrossRef]
  13. Dean, W.S.; Adejumo, H.A.; Caiati, A.; Garay, P.M.; Harmata, A.S.; Li, L.; Rodriguez, E.E.; Sundar, S. A Framework for Regulation of New and Existing PFAS by EPA. J. Sci. Policy Gov. 2020, 16, 1–14. [Google Scholar]
  14. UN Environment Programme (UNEP). SC-9/4: Perfluorooctane Sulfonic Acid, Its Salts and Perfluorooctane Sulfonyl Fluoride. In Proceedings of the 2019 Meetings of the Conferences of the Parties to the Basel, Rotterdam and Stockholm Conventions, Geneva, Switzerland, 29 April–10 May 2019. [Google Scholar]
  15. UN Environment Programme (UNEP). SC-9/12: Listing of Perfluorooctanoic Acid (PFOA), Its Salts and PFOA-Related Compounds. In Proceedings of the 2019 Meetings of the Conferences of the Parties to the Basel, Rotterdam and Stockholm Conventions, Geneva, Switzerland, 29 April–10 May 2019. [Google Scholar]
  16. Feng, X. Pollution Characteristics and Human External and Internal Exposure of Novel Per-/Poly-Fluoroalkyl Substances in Typical Environment. Ph.D. Thesis, Nankai University, Tianjin, China, 2021. [Google Scholar]
  17. Li, X.; Cui, D.; Ng, B.; Ogunbiyi, O.D.; Guerra de Navarro, M.; Gardinali, P.; Quinete, N. Non-Targeted Analysis for the Screening and Semi-Quantitative Estimates of per-and Polyfluoroalkyl Substances in Water Samples from South Florida Environments. J. Hazard. Mater. 2023, 452, 131224. [Google Scholar] [CrossRef] [PubMed]
  18. Wang, Y.-Q.; Hu, L.-X.; Liu, T.; Zhao, J.-H.; Yang, Y.-Y.; Liu, Y.-S.; Ying, G.-G. Per- and Polyfluoralkyl Substances (PFAS) in Drinking Water System: Target and Non-Target Screening and Removal Assessment. Environ. Int. 2022, 163, 107219. [Google Scholar] [CrossRef] [PubMed]
  19. Hensema, T.J.; Berendsen, B.J.A.; van Leeuwen, S.P.J. Non-Targeted Identification of per- and Polyfluoroalkyl Substances at Trace Level in Surface Water Using Fragment Ion Flagging. Chemosphere 2021, 265, 128599. [Google Scholar] [CrossRef] [PubMed]
  20. Gonzalez de Vega, R.; Cameron, A.; Clases, D.; Dodgen, T.M.; Doble, P.A.; Bishop, D.P. Simultaneous Targeted and Non-Targeted Analysis of per- and Polyfluoroalkyl Substances in Environmental Samples by Liquid Chromatography-Ion Mobility-Quadrupole Time of Flight-Mass Spectrometry and Mass Defect Analysis. J. Chromatogr. A 2021, 1653, 462423. [Google Scholar] [CrossRef] [PubMed]
  21. Wang, Y.; Yu, N.; Zhu, X.; Guo, H.; Jiang, J.; Wang, X.; Shi, W.; Wu, J.; Yu, H.; Wei, S. Suspect and Nontarget Screening of Per- and Polyfluoroalkyl Substances in Wastewater from a Fluorochemical Manufacturing Park. Environ. Sci. Technol. 2018, 52, 11007–11016. [Google Scholar] [CrossRef] [PubMed]
  22. Liu, J.; Zhao, Z.; Li, J.; Hua, X.; Zhang, B.; Tang, C.; An, X.; Lin, T. Emerging and Legacy Perfluoroalkyl and Polyfluoroalkyl Substances (PFAS) in Surface Water around Three International Airports in China. Chemosphere 2023, 344, 140360. [Google Scholar] [CrossRef]
  23. Zheng, P.; Liu, M.; Yin, H.; Shen, L.; Wang, Y.; Wu, Q. Analysis of 58 Poly-/Perfluoroalkyl Substances and Their Occurrence in Surface Water in a High-Technology Industrial Park. Environ. Pollut. 2020, 267, 115381. [Google Scholar] [CrossRef] [PubMed]
  24. Zhou, Z.; Liang, Y.; Shi, Y.; Xu, L.; Cai, Y. Occurrence and Transport of Perfluoroalkyl Acids (PFAAs), Including Short-Chain PFAAs in Tangxun Lake, China. Environ. Sci. Technol. 2013, 47, 9249–9257. [Google Scholar] [CrossRef]
  25. Huang, D.; Xiao, R.; Du, L.; Zhang, G.; Yin, L.; Deng, R.; Wang, G. Phytoremediation of Poly- and Perfluoroalkyl Substances: A Review on Aquatic Plants, Influencing Factors, and Phytotoxicity. J. Hazard. Mater. 2021, 418, 126314. [Google Scholar] [CrossRef]
  26. Greger, M.; Landberg, T. Removal of PFAS from Water by Aquatic Plants. J. Environ. Manag. 2024, 351, 119895. [Google Scholar] [CrossRef] [PubMed]
  27. Greger, M. Removal of PFAS from Water by Plants. IJESNR 2021, 28, 556233. [Google Scholar] [CrossRef]
  28. Chen, Y.-C.; Lo, S.-L.; Lee, Y.-C. Distribution and Fate of Perfluorinated Compounds (PFCs) in a Pilot Constructed Wetland. Desalination Water Treat. 2012, 37, 178–184. [Google Scholar] [CrossRef]
  29. Huff, D.K.; Morris, L.A.; Sutter, L.; Costanza, J.; Pennell, K.D. Accumulation of Six PFAS Compounds by Woody and Herbaceous Plants: Potential for Phytoextraction. Int. J. Phytoremediat. 2020, 22, 1538–1550. [Google Scholar] [CrossRef]
  30. Battisti, I.; Zambonini, D.; Ebinezer, L.B.; Trentin, A.R.; Meggio, F.; Petit, G.; Masi, A. Perfluoroalkyl Substances Exposure Alters Stomatal Opening and Xylem Hydraulics in Willow Plants. Chemosphere 2023, 344, 140380. [Google Scholar] [CrossRef] [PubMed]
  31. Colomer-Vidal, P.; Jiang, L.; Mei, W.; Luo, C.; Lacorte, S.; Rigol, A.; Zhang, G. Plant Uptake of Perfluoroalkyl Substances in Freshwater Environments (Dongzhulong and Xiaoqing Rivers, China). J. Hazard. Mater. 2022, 421, 126768. [Google Scholar] [CrossRef] [PubMed]
  32. Griffin, E.K.; Hall, L.M.; Brown, M.A.; Taylor-Manges, A.; Green, T.; Suchanec, K.; Furman, B.T.; Congdon, V.M.; Wilson, S.S.; Osborne, T.Z.; et al. Aquatic Vegetation, an Understudied Depot for PFAS. J. Am. Soc. Mass Spectrom. 2023, 34, 1826–1836. [Google Scholar] [CrossRef] [PubMed]
  33. Cui, R.; Zhang, Y.; Wang, J.; Dai, J. Levels and Composition Distribution of Perfluoroalkyl Substances in Water and Biological Samples from Jiangsu Hi-Tech Fluorochemical Industry Park in Changshu, China. Environ. Chem. 2013, 32, 1318–1327. [Google Scholar] [CrossRef]
  34. Li, P.; Oyang, X.; Zhao, Y.; Tu, T.; Tian, X.; Li, L.; Zhao, Y.; Li, J.; Xiao, Z. Occurrence of Perfluorinated Compounds in Agricultural Environment, Vegetables, and Fruits in Regions Influenced by a Fluorine-Chemical Industrial Park in China. Chemosphere 2019, 225, 659–667. [Google Scholar] [CrossRef]
  35. Shan, G.; Wei, M.; Zhu, L.; Liu, Z.; Zhang, Y. Concentration Profiles and Spatial Distribution of Perfluoroalkyl Substances in an Industrial Center with Condensed Fluorochemical Facilities. Sci. Total Environ. 2014, 490, 351–359. [Google Scholar] [CrossRef]
  36. Song, D.; Qiao, B.; Yao, Y.; Zhao, L.; Wang, X.; Chen, H.; Zhu, L.; Sun, H. Target and Nontarget Analysis of Per- and Polyfluoroalkyl Substances in Surface Water, Groundwater and Sediments of Three Typical Fluorochemical Industrial Parks in China. J. Hazard. Mater. 2023, 460, 132411. [Google Scholar] [CrossRef] [PubMed]
  37. Gao, C.; Hua, Z.; Li, X. Distribution, Sources, and Dietetic-Related Health Risk Assessment of Perfluoroalkyl Acids (PFAAs) in the Agricultural Environment of an Industrial-Agricultural Interaction Region (IAIR), Changshu, East China. Sci. Total Environ. 2022, 809, 152159. [Google Scholar] [CrossRef] [PubMed]
  38. Wang, J.; Zhang, Y.; Zhang, W.; Jin, Y.; Dai, J. Association of Perfluorooctanoic Acid with HDL Cholesterol and Circulating miR-26b and miR-199–3p in Workers of a Fluorochemical Plant and Nearby Residents. Environ. Sci. Technol. 2012, 46, 9274–9281. [Google Scholar] [CrossRef] [PubMed]
  39. Zhang, W.; Cao, H.; Liang, Y. Plant Uptake and Soil Fractionation of Five Ether-PFAS in Plant-Soil Systems. Sci. Total Environ. 2021, 771, 144805. [Google Scholar] [CrossRef] [PubMed]
  40. United States Environmental Protection Agency. PFAS Master List of PFAS Substances (Version 2); United States Environmental Protection Agency: Washington, DC, USA, 2021.
  41. Trier, X.; Lunderberg, D. S9|PFASTRIER|PFAS Suspect List: Fluorinated Substances. Zenodo Dataset 2015. Available online: https://zenodo.org/records/2621989 (accessed on 15 November 2023).
  42. Place, B. Suspect List of Possible Per-And Polyfluoroalkyl Substances (PFAS) Version 1.5.0; National Institute of Standards and Technology: Gaithersburg, MD, USA, 2021. [Google Scholar]
  43. Liu, Y.; Qian, M.; Ma, X.; Zhu, L.; Martin, J.W. Nontarget Mass Spectrometry Reveals New Perfluoroalkyl Substances in Fish from the Yangtze River and Tangxun Lake, China. Environ. Sci. Technol. 2018, 52, 5830–5840. [Google Scholar] [CrossRef] [PubMed]
  44. Wang, X.; Yu, N.; Qian, Y.; Shi, W.; Zhang, X.; Geng, J.; Yu, H.; Wei, S. Non-Target and Suspect Screening of per- and Polyfluoroalkyl Substances in Chinese Municipal Wastewater Treatment Plants. Water Res. 2020, 183, 115989. [Google Scholar] [CrossRef] [PubMed]
  45. Yu, N.; Guo, H.; Yang, J.; Jin, L.; Wang, X.; Shi, W.; Zhang, X.; Yu, H.; Wei, S. Non-Target and Suspect Screening of Per- and Polyfluoroalkyl Substances in Airborne Particulate Matter in China. Environ. Sci. Technol. 2018, 52, 8205–8214. [Google Scholar] [CrossRef] [PubMed]
  46. Schymanski, E.L.; Jeon, J.; Gulde, R.; Fenner, K.; Ruff, M.; Singer, H.P.; Hollender, J. Identifying Small Molecules via High Resolution Mass Spectrometry: Communicating Confidence. Environ. Sci. Technol. 2014, 48, 2097–2098. [Google Scholar] [CrossRef] [PubMed]
  47. Liu, Y.; Zhang, Y.; Li, J.; Wu, N.; Li, W.; Niu, Z. Distribution, Partitioning Behavior and Positive Matrix Factorization-Based Source Analysis of Legacy and Emerging Polyfluorinated Alkyl Substances in the Dissolved Phase, Surface Sediment and Suspended Particulate Matter around Coastal Areas of Bohai Bay, China. Environ. Pollut. 2019, 246, 34–44. [Google Scholar] [CrossRef]
  48. Li, H.; Lao, Z.; Liu, Y.; Feng, Y.; Song, A.; Hu, J.; Liao, Z.; Zhang, L.; Liu, M.; Liu, Y.; et al. Uptake, Accumulation, and Translocation of Organophosphate Esters and Brominated Flame Retardants in Water Hyacinth (Eichhornia crassipes): A Field Study. Sci. Total Environ. 2023, 874, 162435. [Google Scholar] [CrossRef]
  49. Zhu, Y. Occurrence Characteristic and Risk Assessment of Per- and Polyfluorinated Substances around Fluorine Chemical Park. Master’s Thesis, Liaoning Technical University, Liaoning, China, 2023. [Google Scholar]
  50. Li, W.; Liu, X.; Mao, H.; Wang, S. Concentration, Distribution, and Bioconcentration of Short- and Long-Chain Perfluoroalkyl Substances in the Water, Suspended Particulate Matter, and Surface Sediment of a Typical Semi-Enclosed Bay. Sci. Total Environ. 2023, 890, 164416. [Google Scholar] [CrossRef] [PubMed]
  51. Gebbink, W.A.; van Asseldonk, L.; van Leeuwen, S.P.J. Presence of Emerging Per- and Polyfluoroalkyl Substances (PFASs) in River and Drinking Water near a Fluorochemical Production Plant in the Netherlands. Environ. Sci. Technol. 2017, 51, 11057–11065. [Google Scholar] [CrossRef] [PubMed]
  52. Dauchy, X. Evidence of Large-Scale Deposition of Airborne Emissions of per- and Polyfluoroalkyl Substances (PFASs) near a Fluoropolymer Production Plant in an Urban Area. Chemosphere 2023, 337, 139407. [Google Scholar] [CrossRef] [PubMed]
  53. Dalmijn, J.; Glüge, J.; Scheringer, M.; Cousins, I.T. Emission Inventory of PFASs and Other Fluorinated Organic Substances for the Fluoropolymer Production Industry in Europe. Environ. Sci. Process. Impacts 2024, 26, 269–287. [Google Scholar] [CrossRef] [PubMed]
  54. Yarwood, G.; Kemball-Cook, S.; Keinath, M.; Waterland, R.L.; Korzeniowski, S.H.; Buck, R.C.; Russell, M.H.; Washburn, S.T. High-Resolution Atmospheric Modeling of Fluorotelomer Alcohols and Perfluorocarboxylic Acids in the North American Troposphere. Environ. Sci. Technol. 2007, 41, 5756–5762. [Google Scholar] [CrossRef] [PubMed]
  55. Pan, Y.; Zhang, H.; Cui, Q.; Sheng, N.; Yeung, L.W.Y.; Guo, Y.; Sun, Y.; Dai, J. First Report on the Occurrence and Bioaccumulation of Hexafluoropropylene Oxide Trimer Acid: An Emerging Concern. Environ. Sci. Technol. 2017, 51, 9553–9560. [Google Scholar] [CrossRef] [PubMed]
  56. Liu, X.; Li, L.; Gu, L.; Hua, Z.; Zhang, Y.; Xue, H. Distribution and Release of Perfluorinated Compounds (PFCs) in Water-Sediment Systems: The Effect of Confluence Channels. Sci. Total Environ. 2021, 775, 145720. [Google Scholar] [CrossRef]
  57. Kotthoff, M.; Müller, J.; Jürling, H.; Schlummer, M.; Fiedler, D. Perfluoroalkyl and Polyfluoroalkyl Substances in Consumer Products. Environ. Sci. Pollut. Res. 2015, 22, 14546–14559. [Google Scholar] [CrossRef] [PubMed]
  58. Johansson, H.; Lindström, M.; Håkanson, L. On the Modelling of the Particulate and Dissolved Fractions of Substances in Aquatic Ecosystems—Sedimentological and Ecological Interactions. Ecol. Model. 2001, 137, 225–240. [Google Scholar] [CrossRef]
  59. Zhao, P.; Xia, X.; Dong, J.; Xia, N.; Jiang, X.; Li, Y.; Zhu, Y. Short- and Long-Chain Perfluoroalkyl Substances in the Water, Suspended Particulate Matter, and Surface Sediment of a Turbid River. Sci. Total Environ. 2016, 568, 57–65. [Google Scholar] [CrossRef]
  60. Felizeter, S.; McLachlan, M.S.; De Voogt, P. Root Uptake and Translocation of Perfluorinated Alkyl Acids by Three Hydroponically Grown Crops. J. Agric. Food Chem. 2014, 62, 3334–3342. [Google Scholar] [CrossRef] [PubMed]
  61. Chen, L.; Chen, D.; Zhou, S.; Lin, J.; Liu, Y.; Huang, X.; Lin, Q.; Morel, J.L.; Ni, Z.; Wang, S.; et al. New Insights into the Accumulation, Transport, and Distribution Mechanisms of Hexafluoropropylene Oxide Homologues, Important Alternatives to Perfluorooctanoic Acid, in Lettuce (Lactuca sativa L.). Environ. Sci. Technol. 2023, 57, 9702–9712. [Google Scholar] [CrossRef] [PubMed]
  62. Zhao, J.; Yang, L.; Yang, X.; Zhao, X.; Li, M.; Zhao, S.; Zhu, L.; Zhan, J. Degradation of 8:2 Fluorotelomer Carboxylic Acid (8:2 FTCA) by Plants and Their Co-Existing Microorganisms. J. Hazard. Mater. 2023, 451, 131129. [Google Scholar] [CrossRef] [PubMed]
  63. Zhang, H.; Wen, B.; Hu, X.; Wu, Y.; Luo, L.; Chen, Z.; Zhang, S. Determination of Fluorotelomer Alcohols and Their Degradation Products in Biosolids-Amended Soils and Plants Using Ultra-High Performance Liquid Chromatography Tandem Mass Spectrometry. J. Chromatogr. A 2015, 1404, 72–80. [Google Scholar] [CrossRef] [PubMed]
  64. Wang, M.; Wang, H.; Lei, G.; Yang, B.; Hu, T.; Ye, Y.; Li, W.; Zhou, Y.; Yang, X.; Xu, H. Current Progress on Fluoride Occurrence in the Soil Environment: Sources, Transformation, Regulations and Remediation. Chemosphere 2023, 341, 139901. [Google Scholar] [CrossRef] [PubMed]
  65. Blaine, A.C.; Rich, C.D.; Sedlacko, E.M.; Hyland, K.C.; Stushnoff, C.; Dickenson, E.R.V.; Higgins, C.P. Perfluoroalkyl Acid Uptake in Lettuce (Lactuca sativa) and Strawberry (Fragaria ananassa) Irrigated with Reclaimed Water. Environ. Sci. Technol. 2014, 48, 14361–14368. [Google Scholar] [CrossRef] [PubMed]
  66. Blaine, A.C.; Rich, C.D.; Sedlacko, E.M.; Hundal, L.S.; Kumar, K.; Lau, C.; Mills, M.A.; Harris, K.M.; Higgins, C.P. Perfluoroalkyl Acid Distribution in Various Plant Compartments of Edible Crops Grown in Biosolids-Amended Soils. Environ. Sci. Technol. 2014, 48, 7858–7865. [Google Scholar] [CrossRef] [PubMed]
  67. Liu, Z.; Lu, Y.; Shi, Y.; Wang, P.; Jones, K.; Sweetman, A.J.; Johnson, A.C.; Zhang, M.; Zhou, Y.; Lu, X.; et al. Crop Bioaccumulation and Human Exposure of Perfluoroalkyl Acids through Multi-Media Transport from a Mega Fluorochemical Industrial Park, China. Environ. Int. 2017, 106, 37–47. [Google Scholar] [CrossRef] [PubMed]
  68. Zhi, Y.; Lu, H.; Grieger, K.D.; Munoz, G.; Li, W.; Wang, X.; He, Q.; Qian, S. Bioaccumulation and Translocation of 6:2 Fluorotelomer Sulfonate, GenX, and Perfluoroalkyl Acids by Urban Spontaneous Plants. ACS EST Eng. 2022, 2, 1169–1178. [Google Scholar] [CrossRef]
  69. Briggs, G.G.; Bromilow, R.H.; Evans, A.A. Relationships between Lipophilicity and Root Uptake and Translocation of Non-Ionised Chemicals by Barley. Pestic. Sci. 1982, 13, 495–504. [Google Scholar] [CrossRef]
  70. Felizeter, S.; McLachlan, M.S.; de Voogt, P. Uptake of Perfluorinated Alkyl Acids by Hydroponically Grown Lettuce (Lactuca sativa). Environ. Sci. Technol. 2012, 46, 11735–11743. [Google Scholar] [CrossRef]
  71. Lin, Q.; Zhou, C.; Chen, L.; Li, Y.; Huang, X.; Wang, S.; Qiu, R.; Tang, C. Accumulation and Associated Phytotoxicity of Novel Chlorinated Polyfluorinated Ether Sulfonate in Wheat Seedlings. Chemosphere 2020, 249, 126447. [Google Scholar] [CrossRef] [PubMed]
  72. Lu, H.; Qian, S.; Zhi, Y.; Li, Z.; Yan, Z.; Li, H.; Lu, X. Bioaccumulation Characteristics of Perfluorocarboxylic Alkyl Compounds by Ferns. China Environ. Sci. 2023, 43, 2440–2449. [Google Scholar] [CrossRef]
  73. Mc, K.; Pegman, A.P.; Ogden, J. Productivity-decomposition Dynamics of Typha Orientalis at Kaitoke Swamp, Great Barrier Island, New Zealand. N. Z. J. Bot. 2005, 43, 779–789. [Google Scholar] [CrossRef]
  74. Lei, M.; He, J.; Zhang, H.; Liu, W.; Fang, S. Pollution Characteristics and Risk Assessment of Perfluoroalkyl Substances in the Typical Wetland of Chengdu City. Environ. Chem. 2024, 43, 1–11. [Google Scholar]
  75. Wang, T.-T.; Ying, G.-G.; Shi, W.-J.; Zhao, J.-L.; Liu, Y.-S.; Chen, J.; Ma, D.-D.; Xiong, Q. Uptake and Translocation of Perfluorooctanoic Acid (PFOA) and Perfluorooctanesulfonic Acid (PFOS) by Wetland Plants: Tissue- and Cell-Level Distribution Visualization with Desorption Electrospray Ionization Mass Spectrometry (DESI-MS) and Transmission Electron Microscopy Equipped with Energy-Dispersive Spectroscopy (TEM-EDS). Environ. Sci. Technol. 2020, 54, 6009–6020. [Google Scholar] [CrossRef] [PubMed]
  76. Phung, T.V.; Nguyen, T.D.; Nguyen, T.N.; Truong, T.K.; Pham, H.V.; Duong, H.A. Removal of Perfluoroalkyl Acids (PFAAs) from Aqueous Solution by Water Hyacinth (Eichhornia crassipes): Uptake, Accumulation, and Translocation. Sci. Total Environ. 2024, 926, 172029. [Google Scholar] [CrossRef]
  77. Zhu, Y.; Tang, J.; Tan, T.; Li, Y.; Xiang, B. Contaminant characteristic of per- and poly-fluorinated substances in maize in the surrounding of fluorine chemical park. Ecol. Environ. Sci. 2023, 32, 1001–1006. [Google Scholar] [CrossRef]
  78. Han, M.; Li, Z.; Xu, L.; Li, Z.; Wen, X.; Shi, Q.; Hu, X.; Qin, C. The migration, transformation and toxicity of per- and polyfluoroalkyl substances in organisms. China Environ. Sci. 2024, 44, 1638–1647. [Google Scholar] [CrossRef]
  79. Wu, Z. Study on Leaching of Perfluoroalkyl Substances in Soil. Master’s Thesis, Guangzhou Institute of Geochemistry, Chinese Academy of Sciences, Guangzhou, China, 2020. [Google Scholar]
  80. Marzban, L.; Akhzari, D.; Ariapour, A.; Mohammadparast, B.; Pessarakli, M. Effects of Cadmium Stress on Seedlings of Various Rangeland Plant Species (Avena fatua L., Lathyrus sativus L., and Lolium temulentum L.): Growth, Physiological Traits, and Cadmium Accumulation. J. Plant Nutr. 2017, 40, 2127–2137. [Google Scholar] [CrossRef]
  81. Yoon, J.; Cao, X.; Zhou, Q.; Ma, L.Q. Accumulation of Pb, Cu, and Zn in Native Plants Growing on a Contaminated Florida Site. Sci. Total Environ. 2006, 368, 456–464. [Google Scholar] [CrossRef] [PubMed]
  82. Awa, S.H.; Hadibarata, T. Removal of Heavy Metals in Contaminated Soil by Phytoremediation Mechanism: A Review. Water Air Soil Pollut. 2020, 231, 47. [Google Scholar] [CrossRef]
  83. Mayakaduwage, S.; Ekanayake, A.; Kurwadkar, S.; Rajapaksha, A.U.; Vithanage, M. Phytoremediation Prospects of Per- and Polyfluoroalkyl Substances: A Review. Environ. Res. 2022, 212, 113311. [Google Scholar] [CrossRef] [PubMed]
Figure 1. Sampling sites around the fluorochemical industrial park.
Water 16 01513 g001
Figure 2. Percentages of target PFASs in dissolved phase (a), particle phase (b) and plants (c) in the fluorochemical industrial park. Concentrations of target PFASs in dissolved phase (d), particle phase (e) and plants (f) in the fluorochemical industrial park.
Water 16 01513 g002
Figure 3. Percentages of nontarget PFASs in the dissolved phase (a), particle phase (b) and plants (c) in the fluorochemical industrial park. Concentrations of nontarget PFASs in the dissolved phase (d), particle phase (e) and plants (f) in the fluorochemical industrial park.
Water 16 01513 g003
Figure 4. (a) Log Kd values of PFASs in the water dissolved phase–particle phase system in the fluorochemical industrial park. The linear relationship between the carbon chain length of PFCAs (b) and PFSAs (c) and log Kd values in the water dissolved phase–particle phase system. Red line represented that there were only one log Kd value.
Water 16 01513 g004
Figure 5. RCFs and TFs of PFASs in Typha orientalis, Eichhornia crassipes and Alternanthera sessilis. As the concentrations of PFTreA, PFDS, 10:2 FTCA, 8:2 FTSA, 8:2 Cl-PFESA, HFPO-TA and FBSA in the Typha orientalis compartment, the concentrations of PFTriA, PFTreA, PFHpS, PFNS, 10:2 FTCA, HFPO-TA and FBSA in the Eichhornia crassipes compartment and the concentrations of PFHpA, PFTriA, PFTreA, PFBS, PFPeS, PFHxS, PFHpS, PFNS, 6:2 FTCA, 10:2 FTCA, 4:2 FTSA, 8:2 FTSA, 6:2 Cl-PFESA, 8:2 Cl-PFESA, PFECHS, HFPO-TA and FBSA in the Alternanthera sessilis compartment were lower than the corresponding LOQs, their RCF or TF values were not obtained in this study.
Water 16 01513 g005
Table 1. Concentrations (ng/L and ng/g dw) of PFASs in water (dissolved-phase and particle-phase) samples.
Dissolved PhaseParticle Phase
MeanMedianRangeDF (%)MeanMedianRangeDF (%)
PFBA79.152.024.0–237100%14.17.23n.d.–38.983%
PFPeA0.4300.430<LOQ–0.46033%0.9300.720n.d.–1.6567%
PFHxA789724583–1270100%62027311.5–1880100%
PFHpA26.412.87.75–95.1100%3.312.010.440–9.52100%
PFOA721663407–1190100%47426114.3–1180100%
PFNA42.65.261.89–174100%10.43.020.250–48.5100%
PFDA7.722.070.840–23.6100%11.23.000.630–53.9100%
PFUnDA23.21.880.470–106100%28.74.341.19–152100%
PFDoDA5.180.7700.230–24.2100%5.442.340.980–22.9100%
PFTriA2.131.32<LOQ–5.6967%3.012.810.700–7.17100%
PFTreA<LOQ<LOQ<LOQ0%1.751.880.240–3.12100%
PFBS9.1510.90.790–14.3100%<LOQ<LOQ<LOQ0%
PFPeS1.191.72<LOQ–1.9183%0.09000.07000.0400–0.170100%
PFHxS5.825.553.14–9.69100%0.9600.870<LOQ–1.5483%
PFHpS0.4000.260<LOQ–0.72083%0.5700.220<LOQ–1.7767%
PFOS3.413.272.35–5.20100%2.041.710.310–3.75100%
PFNS0.7500.750<LOQ–0.87033%<LOQ<LOQ<LOQ0%
PFDS<LOQ<LOQ<LOQ0%0.7800.780<LOQ–1.1233%
6:2 FTCA18401060272–4870100%109033831.0–3070100%
8:2 FTCA0.6000.500<LOQ–1.0283%2.101.16<LOQ–4.4083%
10:2 FTCA0.2300.240<LOQ–0.28050%2.250.580n.d.–5.6350%
4:2 FTSA1.351.290.730–1.9667%0.3700.3100.0300–0.920100%
6:2 FTSA2.362.351.28–3.61100%71.535.29.37–258100%
8:2 FTSA<LOQ<LOQ<LOQ0%0.5400.1700.0400–2.09100%
6:2 Cl-PFESA0.2900.3000.0900–0.490100%0.4100.3200.100–0.840100%
8:2 Cl-PFESA0.1600.160<LOQ–0.18067%0.2100.1500.100–0.540100%
PFECHS0.04000.0200<LOQ–0.080067%0.1300.1500.0100–0.190100%
HFPO-DA17940.616.4–601100%38.216.511.3–126100%
HFPO-TA24013876.8–731100%324139n.d.–77950%
FBSA2.061.841.53–3.45100%0.7200.720<LOQ–0.72017%
FHxSA0.7300.6500.560–0.990100%0.2000.0400n.d.–0.50083%
FOSA2.682.691.46–3.44100%1.801.010.280–6.58100%
ΣPFAS399027601650–825011402540113–6800
Note: LOQ: limits of quantification.
Disclaimer/Publisher’s Note: The statements, opinions and data contained in all publications are solely those of the individual author(s) and contributor(s) and not of MDPI and/or the editor(s). MDPI and/or the editor(s) disclaim responsibility for any injury to people or property resulting from any ideas, methods, instructions or products referred to in the content.

