Article

Modeling Environmental Vulnerability for 2050 Considering Different Scenarios in the Doce River Basin, Brazil

by
Jasmine Alves Campos
1,
Demetrius David da Silva
1,
Gabrielle Ferreira Pires
1,
Elpídio Inácio Fernandes Filho
2,
Ricardo Santos Silva Amorim
1,
Frederico Carlos Martins de Menezes Filho
3,
Celso Bandeira de Melo Ribeiro
4,
Juliana Ferreira Lorentz
5 and
Uilson Ricardo Venâncio Aires
6,*
1
Departament of Agricultural Engineer, Federal University of Viçosa, Viçosa 36570-900, Brazil
2
Departament of Soil and Plant Nutrition, Federal University of Viçosa, Viçosa 36570-900, Brazil
3
Department of Civil Engineer, Federal University of Viçosa, Campus Rio Paranaíba, Rio Paranaíba 38810-000, Brazil
4
Departament of Environmental and Sanitary Engineer, Federal University of Juiz de Fora, Juiz de For a 36036-900, Brazil
5
Department of Civil Engineer, Federal University of Viçosa, Viçosa 36570-900, Brazil
6
Department of Agricultural and Biological Engineering, Mississippi State University, Mississippi State, MS 39759, USA
*
Author to whom correspondence should be addressed.
Water 2024, 16(10), 1459; https://doi.org/10.3390/w16101459
Submission received: 21 April 2024 / Revised: 13 May 2024 / Accepted: 17 May 2024 / Published: 20 May 2024
(This article belongs to the Section Water and Climate Change)

Abstract

:
Understanding climate change and land use impacts is crucial for mitigating environmental degradation. This study assesses the environmental vulnerability of the Doce River Basin for 2050, considering future climate change and land use and land cover (LULC) scenarios. Factors including slope, elevation, relief dissection, precipitation, temperature, pedology, geology, urban distance, road distance, and LULC were evaluated using multicriteria analysis. Regional climate models Eta-HadGEM2-ES and Eta-MIROC5 under RCP 4.5 and RCP 8.5 emission scenarios were employed. The Land Change Modeler tool simulated 2050 LULC changes and hypothetical reforestation of legal reserve (RL) areas. Combining two climate and two LULC scenarios resulted in four future vulnerability scenarios. Projections indicate an over 300 mm reduction in average annual precipitation and an up to 2 °C temperature increase from 2020 to 2050. Scenario 4 (RCP 8.5 and LULC for 2050 with reforested RLs) showed the greatest basin area in the lowest vulnerability classes, while scenario 3 (RCP 4.5 and LULC for 2050) exhibited more high-vulnerability areas. Despite the projected relative improvement in environmental vulnerability by 2050 due to reduced rainfall, the complexity of associated relationships must be considered. These results contribute to mitigating environmental damage and adapting to future climatic conditions in the Doce River Basin.

1. Introduction

The intensification of anthropogenic activities without planning and consideration of environmental susceptibility negatively impacts natural systems and can lead to irreversible environmental changes that compromise their recovery capacity [1,2,3]. Environmental vulnerability becomes a fundamental tool to understand the environmental conditions of a location and contribute to its sustainable planning and management [4,5,6]. Vulnerability is associated with the susceptibility of a system to suffering damage due to stressors [7]. However, it is a complex concept and can be understood in different ways depending on the area of knowledge it is related to [8]. In this study, we define environmental vulnerability as the susceptibility of the system to environmental degradation [9]. This type of assessment helps us to understand the effects of natural and anthropogenic activities and provides information for implementing policies to mitigate damage in the most vulnerable areas [1,10,11].
Several studies have been conducted to develop indices and descriptive approaches for spatially analyzing the vulnerability of environments in areas of varying extents and under various environmental and social pressures [1,10,12]. For example, ref. [5] assessed the environmental vulnerability of a large-scale arid region in China; ref. [10] estimated vulnerability in the Cerrado, an area impacted by agricultural expansion; ref. [13] developed a model to assess environmental vulnerability related to flooding; ref. [14] conducted vulnerability studies in Brazilian Amazon Indigenous Lands and assessed environmental vulnerability at a global level. However, few authors consider different future climate change scenarios, generally employ global climate models, and do not evaluate more than one land use and cover projection scenario [6,15,16]. Assessments utilizing regional climate models and considering land use and land cover scenarios are essential for anticipating impacts and developing medium- and long-term adaptations and actions to reduce hazards.
Considering climate change, mainly changes in the meteorological parameters of precipitation and temperature, is essential. According to the Sixth Assessment Report of the Intergovernmental Panel on Climate Change (AR6), the temperature of the global land surface will rise by at least 1.5 °C by the middle of this century in all scenarios [17]. Furthermore, there is evidence of changes in precipitation patterns, intensifying extreme events such as drought, floods, and large forest fires. These alterations have the potential to significantly impact environmental vulnerability, as climate change acts as a driving factor [10].
Changes in temperature and precipitation parameters can also exacerbate soil degradation through an interaction of several factors [18,19]. The increase in global temperature increases the water retention capacity in the atmosphere, changing the hydrological cycle through changes in precipitation including total precipitation, distribution, or frequency, speeding the decomposition of organic matter, changing soil moisture, interfering with agricultural practices and land use, and affecting surface runoff [18,19,20,21].
The analysis was performed in the Doce River basin, Brazil, which has historically suffered from deforestation, degraded pastures, high rates of erosion, and water contamination due to the discharge of effluents [9,22,23]. Furthermore, in 2015, the basin suffered one of the main environmental disasters in Brazil with the collapse of the Fundão mining tailings dam. The release of tailings caused the contamination of more than 660 km of water bodies and the loss of 1469 hectares of land surface, in addition to other environmental and socioeconomic damages [24]. Recently, [9] assessed the environmental vulnerability of the Doce River watershed under current conditions and estimated that approximately 36% of the basin’s lands are in the highest degrees of vulnerability. Thus, given the relevance of the study area, it is also necessary to understand the future vulnerability conditions of the basin. By predicting the behavior of natural and anthropogenic variables and simulating future scenarios, actions can be anticipated and policies and resources can be implemented more appropriately.
In this study, we utilized GIS-MCDA (Multicriteria Decision Analysis and Geographic Information Systems), employing various environmental information as input data, such as climatic factors (precipitation and temperature), relief (slope, elevation, and relief dissection), pedology, geology, and anthropogenic factors (distance from roads, distance from cities, and land use and land cover (LULC)), to evaluate the future environmental vulnerability of the Doce River Basin. Additionally, we considered two future IPCC scenarios of climate change (RCP 4.5 and RCP 8.5) and two scenarios of LULC (LULC projections for 2050 and hypothetical situations for reforesting preservation areas). The novelty of this study lies in (1) evaluating the environmental vulnerability for future scenarios focused on the susceptibility of this system to environmental degradation, as many studies only analyze climatic vulnerability; (2) using regional models which are more representative of global climatic models; and (3) evaluating environmental vulnerability considering the projection of LULC scenarios for 2050, taking into account the projections of changes in LULC and reforesting the legal areas of vegetation according to the Brazilian Forest Code [25].
Thus, this work aimed to evaluate the environmental vulnerability in the Doce River basin, Brazil, for the year 2050, considering future scenarios of both climate change and land use and land cover. The prediction of LULC for future situations can be an efficient tool for creating management strategies for soil and water conservation. Also, integration with climate projections can make environmental modeling even more realistic, given that soil degradation by erosion is also affected by climate change.

2. Materials and Methods
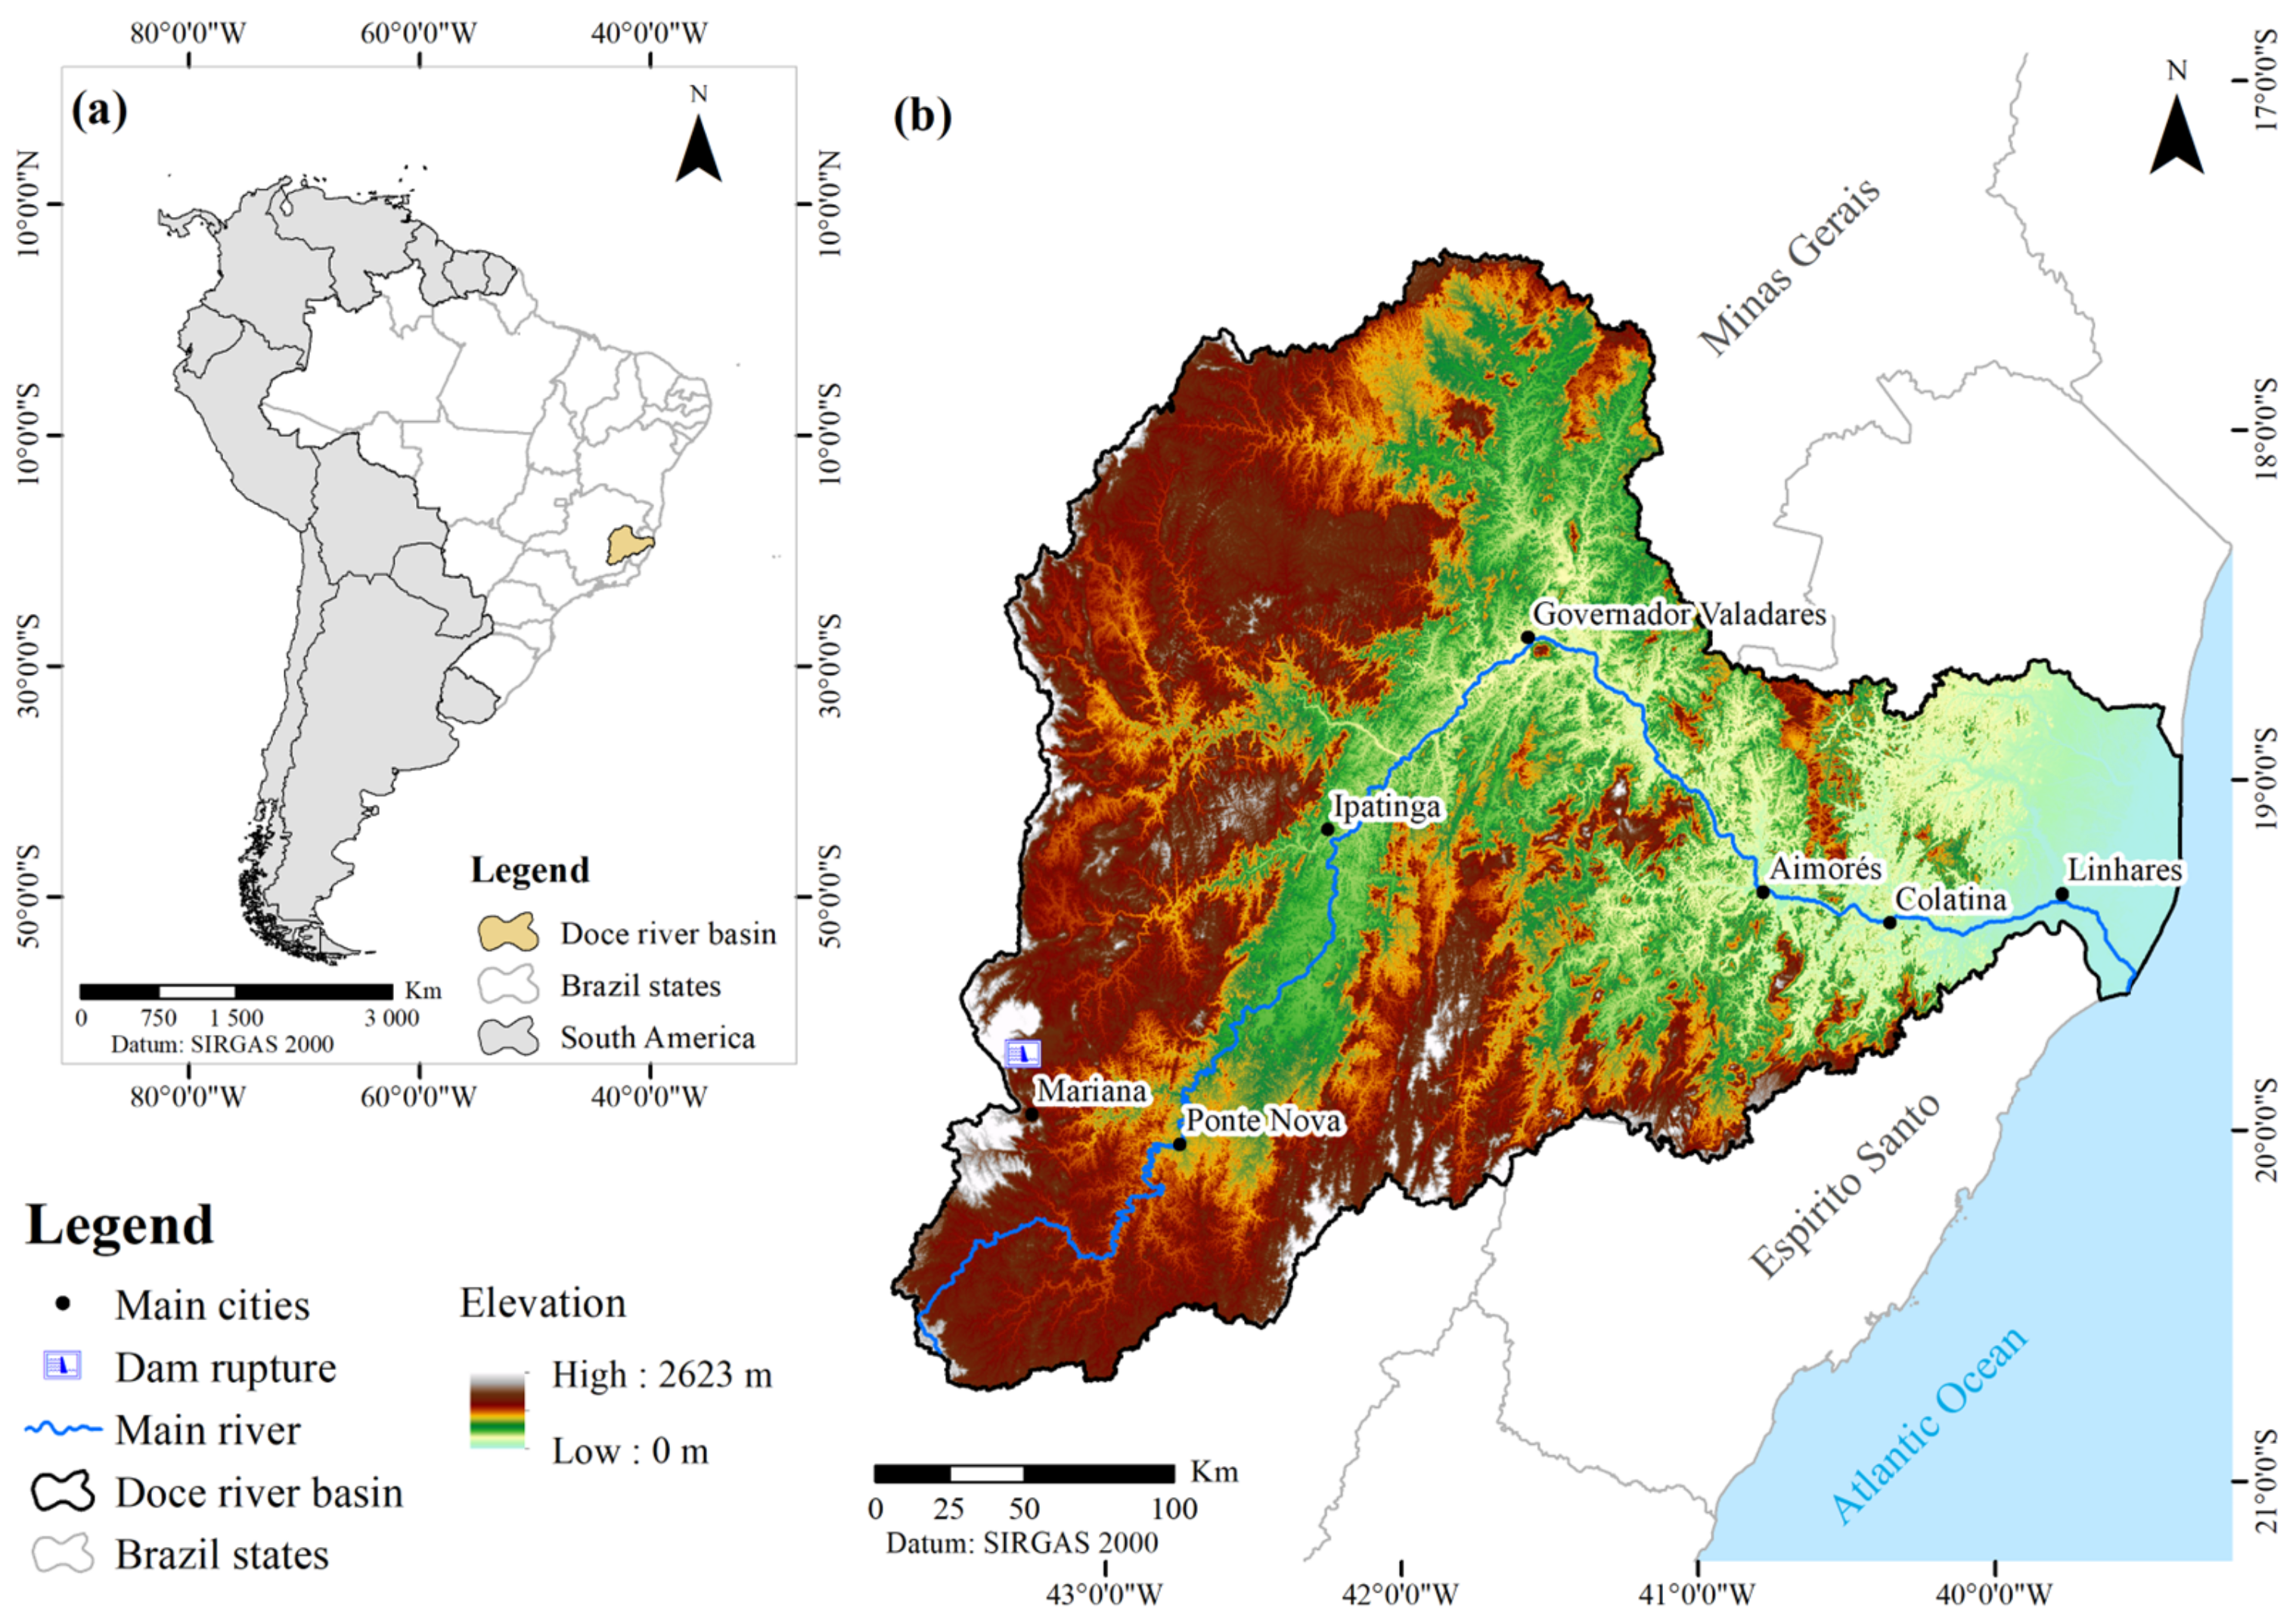
2.1. Study Area

The Doce River Basin (Figure 1) is in the southeastern region of Brazil and covers part of the states of Minas Gerais (86%) and Espírito Santo (14%) with a total drainage area of approximately 86,715 km2 [26].
The original vegetation of the basin consisted of the Atlantic Forest biome (98%) and the Cerrado biome. These biomes are under intense threat from agricultural activities [27], with around 63% of the two biomes occupied by agriculture and livestock [28]. Currently, the Atlantic Forest has only 12.4% of its original vegetation [29].
The Doce River Basin supplies water to an estimated population of 3.5 million inhabitants in 228 municipalities [26]. In addition to its use for urban supply, it is used in mining, agriculture, power generation, and industry. Despite its importance, the basin has suffered impacts on its water quality and quantity as a result of widespread historical deforestation and inappropriate land use [22]. The forest remnants are restricted mainly to the steep regions of the basin. The pastures, overall, have some degree of degradation, rendering them more susceptible to erosion [30]. There is also evidence of water degradation due to urban areas releasing effluents [23].
In November 2015, the basin was the scene of one of the worst environmental disasters in Brazil, the rupture of the Fundão tailings dam, in Mariana, which released an estimated volume of 43 million m3 of mining tailings [31,32]. This accident impacted several water bodies and the environment, such as the destruction of native vegetation; damage to areas intended for agriculture and pasture; silting up water bodies; damage to hydroelectric plants; fish kills; and water contamination by ores, heavy metals, and toxic chemicals, among others [30,33,34].

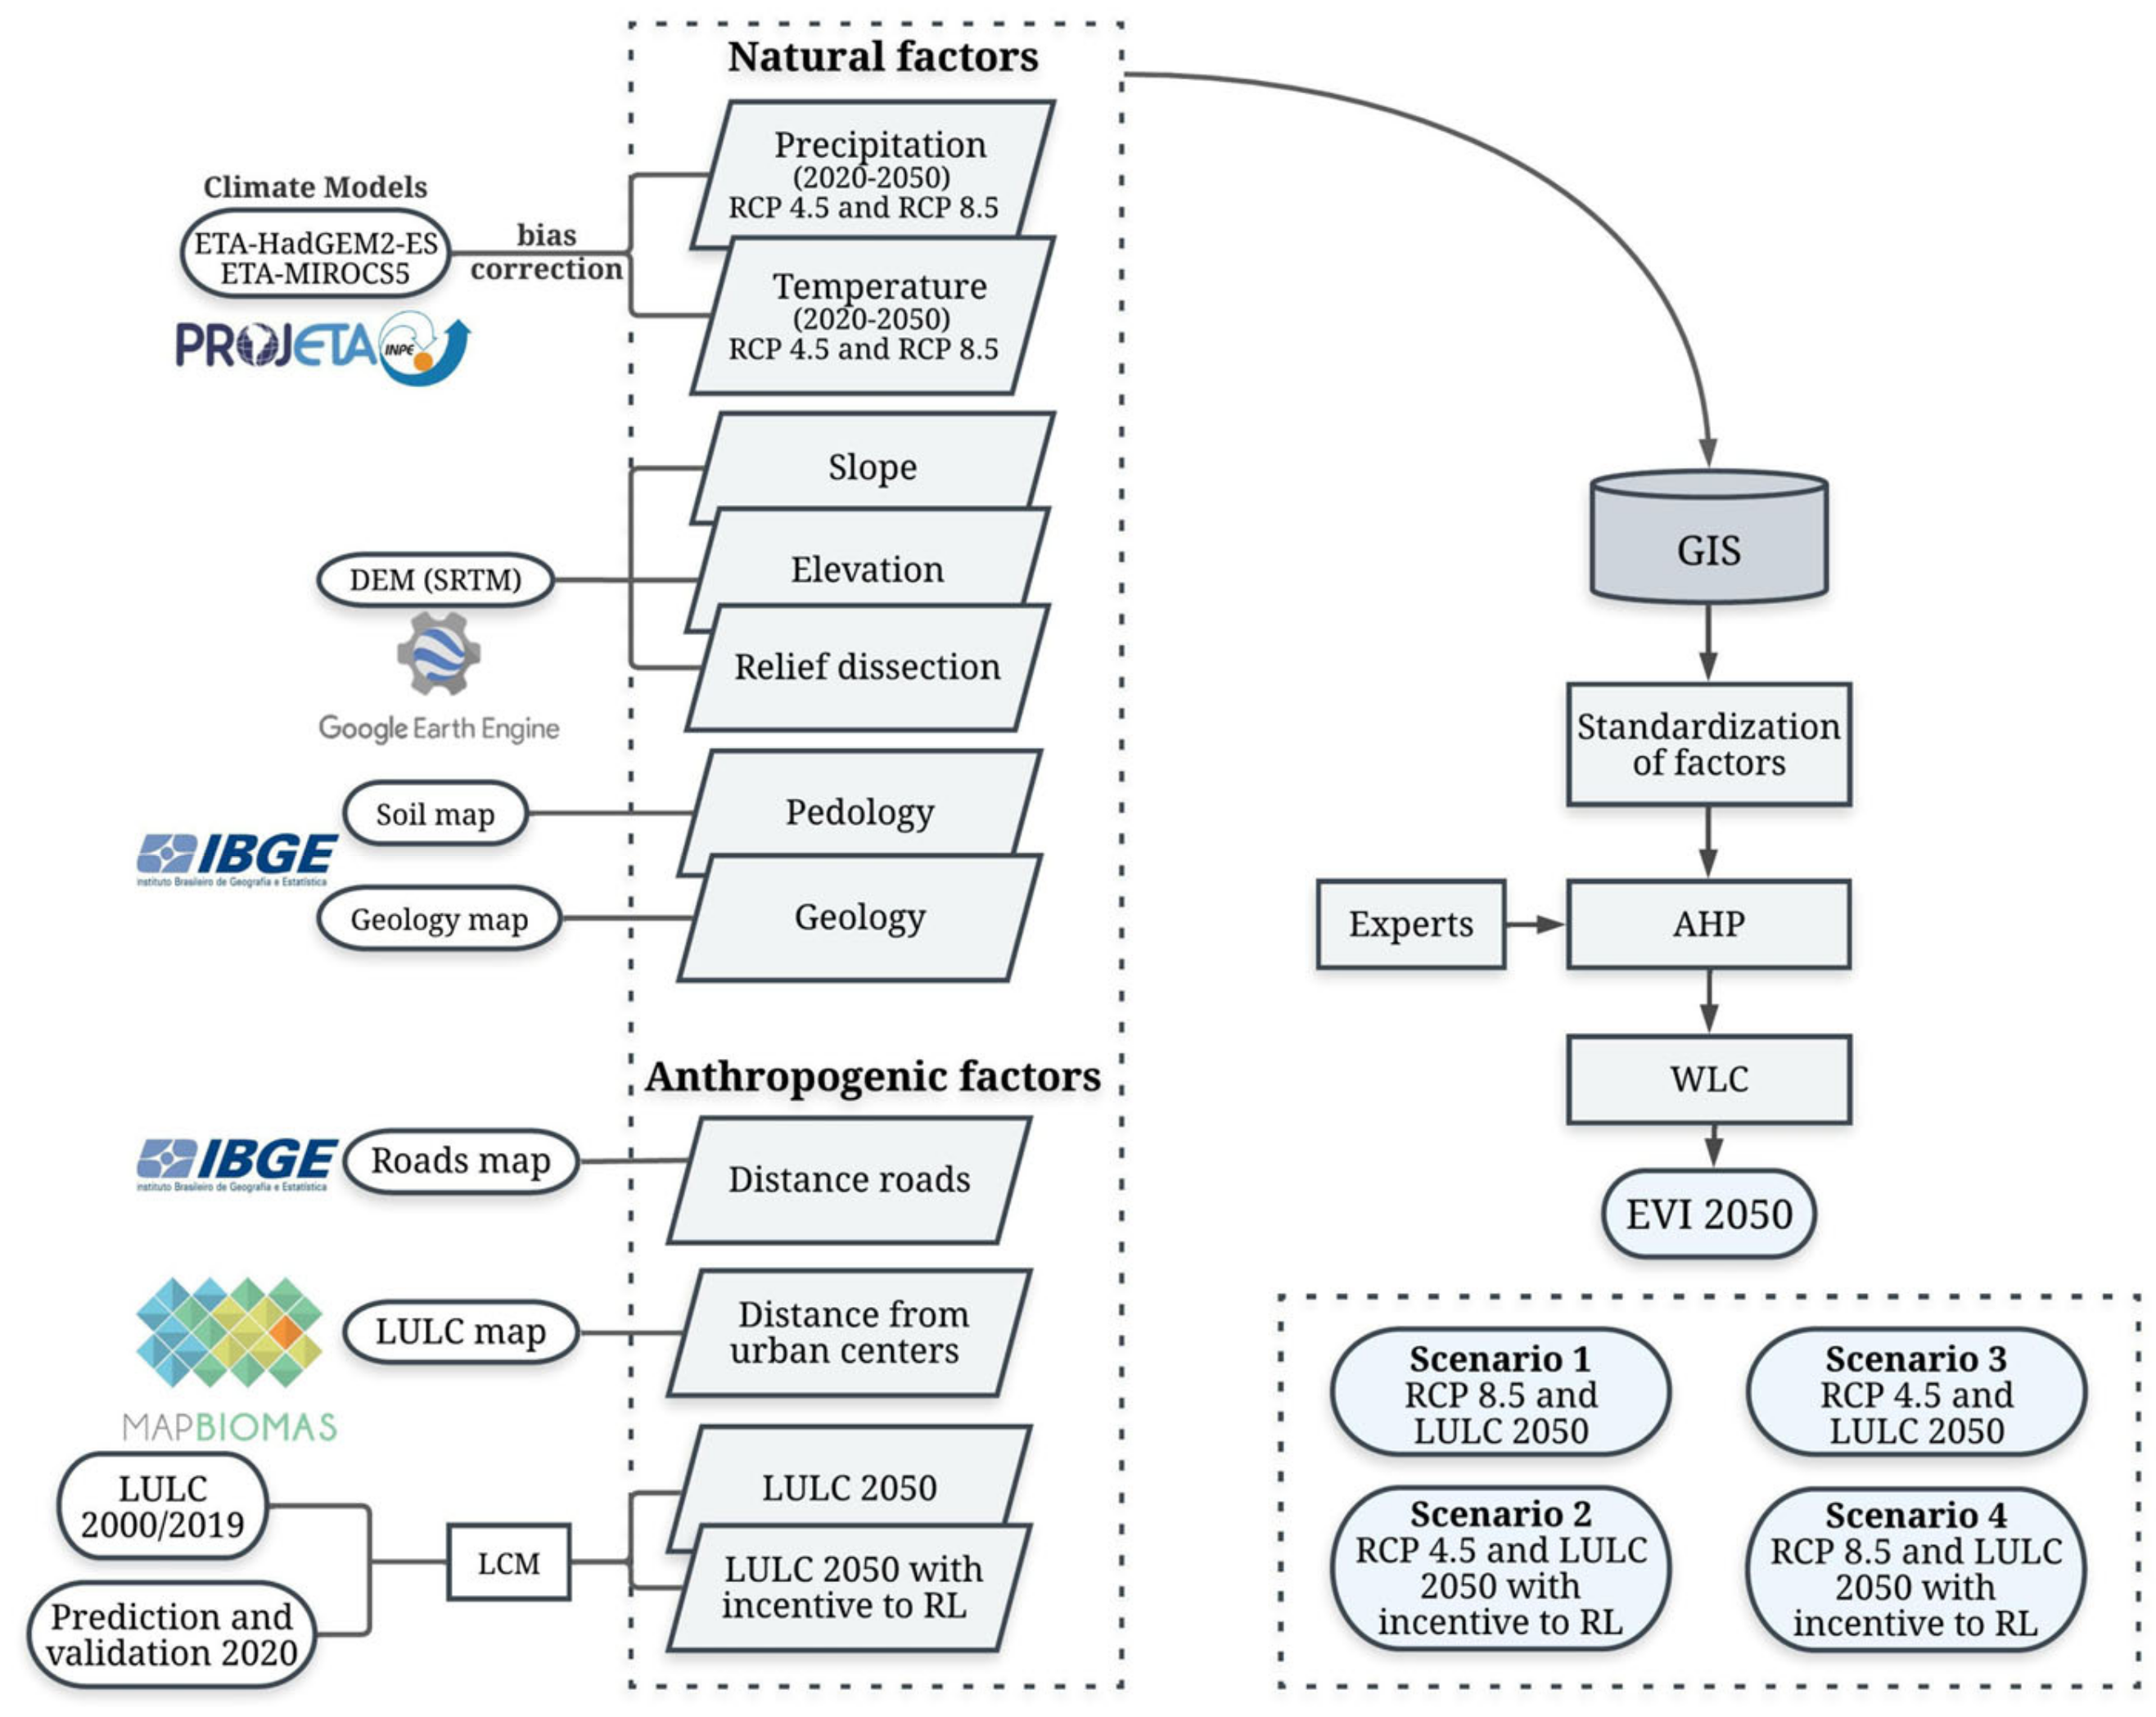
2.2. Gathering and Processing Data

The methodology used the interaction between natural factors (precipitation, temperature, slope, elevation, relief dissection, pedology, and geology) and factors related to anthropogenic activities (distance from cities and roads, and LULC) through the Multicriteria Decision Analysis and Geographic Information Systems (GIS-MCDA) to determine scenarios of environmental vulnerability for the Doce River Basin for the year 2050. Figure 2 shows the methodology adopted in this study.
The factors used in this study were based on the literature [5,6,9,12,35], aspects of the basin, and the availability of information. The modeling considered the variables of slope, elevation, relief dissection, pedology, and geology as being intrinsic to the area since they do not change over time. However, precipitation, temperature, and LULC data change over the years. As a result, they were simulated for future conditions.
The DEM (Digital Elevation Model) was obtained from the Shuttle Radar Topography Mission (SRTM) project with a spatial resolution of 30 m. The slope was generated from the Hydrographically Conditioned Digital Elevation Model (HCDEM) with the aid of ArcGIS 10.5/ArcMap® software. Mountainous regions with slopes greater than 45% were considered more vulnerable to degradation by erosive processes, as utilized by [9].
Relief dissection was developed according to the assumptions of [36], using the DEM. This factor assesses the morphometry of the terrain by the degree of notching of the valleys and the average interfluvial dimension; the steeper and deeper the landscape, the greater the vulnerability [36].
Pedology [37] and geology [38] vector information was extracted from the Brazilian Institute of Geography and Statistics (IBGE) at 1:250:000 scale. Pedology enables the identification of soil groups that are more susceptible to physical processes, such as erosion, based on properties like texture, structure, cohesion, and depth [39]. Geology identifies the cohesion of minerals and their resistance to weathering and erosion [40].
The Euclidean distance of urban infrastructure areas was calculated based on the future LULC mapping for the year 2050, as detailed below. And the road distance factor was obtained from cartographic road data from the IBGE for the year 2021 [41], considering the smallest variation in this factor until the year 2050. The removal of vegetation cover for road construction and urban expansion reduces the soil’s water infiltration capacity, increasing surface runoff and soil losses [42].
Changes in climate patterns can significantly impact the dynamics of the environment and its vulnerability [10]. This can occur due to the interaction of various factors such as changes in the hydrological cycle, influence on soil moisture, decomposition of organic matter, agricultural practices, vegetation cover, surface runoff, and soil erosion.
To model the climate data, the variables of total monthly precipitation and air temperature at 2 m above ground level were used as data from the regionalized climate models Eta-HadGEM2-ES and Eta-MIROC5, made available for South America by the Projeta platform (http://projeta.cptec.inpe.br/ (accessed on 25 June 2020)) of the National Institute for Space Research-INPE, with an approximate spatial resolution of 20 km [43]. These products are derived from two global models: the British Hadley Center Global Environmental Model 2-HadGEM2-ES [44] and the Japanese Model for Interdisciplinary Research on Climate—MIROC5 [45]. The Eta downscaling procedure is described in [46,47] based on [48].
For both models, the pessimistic scenario (RCP 8.5) and the intermediate scenario (RCP 4.5) of concentration of greenhouse gasses were analyzed, according to the climate change projections of the Intergovernmental Panel on Climate Change—IPCC [49]. The first, RCP 8.5, assumes that additional radiative forcing reaches more than 8.5 Wm−2, with CO2 concentrations of about 550 ppm in the year 2050; in RCP 4.5, the radiative forcings are approximately 4.5 Wm−2, with CO2 concentrations around 480 ppm [50].
Monthly data on precipitation and temperature were acquired for the base period, 2020–2050, for the two scenarios considered. On the Projeta platform, historical control data of the climate models were acquired for the years 1980 to 2005 to evaluate the data of the simulated models with the data derived from observations. The latter were obtained from the meteorological database developed by [51] available at http://careyking.com/data-downloads/ (accessed on 2 September 2020). It is a set of interpolated data based on observed data for all of Brazil from 1980 to 2013, with a spatial resolution of 0.25° by 0.25°. It has been widely used in several studies [52,53,54].
Due to the difference in the spatial resolutions between the climate models and the observed database, the climate information was resampled to a common 0.2° grid using the bilinear interpolation method, as employed in [55]. Then, in the development of the environmental vulnerability index (EVI), all input data were standardized to the same spatial resolution of 30 m.
In addition to the individual data of the models, the result of the Ensemble, which consists of the average precipitation and temperature data of the two climate models considered (Eta-HadGEM2-ES and Eta-MIROC5), was also assessed. According to [56], this is important to avoid the particularities of a specific climate model, as it is also used to integrate a quantity of analyzed data.
Finally, all climate data that were used in the study of environmental vulnerability were aggregated on an annual basis, relative to the average for the period 2020–2050, considering the average annual precipitation and the average annual temperature to incorporate the influence of precipitation and temperature in modeling [10,12,57].
Modeling future scenarios of LULC required data from the past. Observed maps of three years of LULC (2000, 2019, and 2020) obtained from the MapBiomas Project, collection 6.0 [28], were used. The images are available with a spatial resolution of 30m and were extracted for the study area through the GEE platform [58] and reclassified (forest, non-forest natural formation, farming, non-vegetated area, urban area, rocky outcrop, mining and water) as shown in the Supplementary Materials (Table S1).
To analyze future environmental vulnerability, all data had to be on the same scale [59,60]. Thus, all variables were standardized on a common scale from 0 to 255. For data considered continuous, the fuzzy linear function was used to perform this conversion. The control points of the fuzzy functions were adapted from [9] and can be verified in the Supplementary Materials (Table S2).
The categorical variables were classified into classes ranging from very low vulnerability to very high vulnerability (value 255), adapted from [9], available in the Supplementary Materials (Table S3). The hierarchical levels for the pedology and geology factors were determined according to the assumptions of [39,40]; relief dissection was based on [36]; and the LULC was categorized based on the level of soil protection indicated by the vegetation cover [12]. The vulnerability of the water body class was considered null [61].

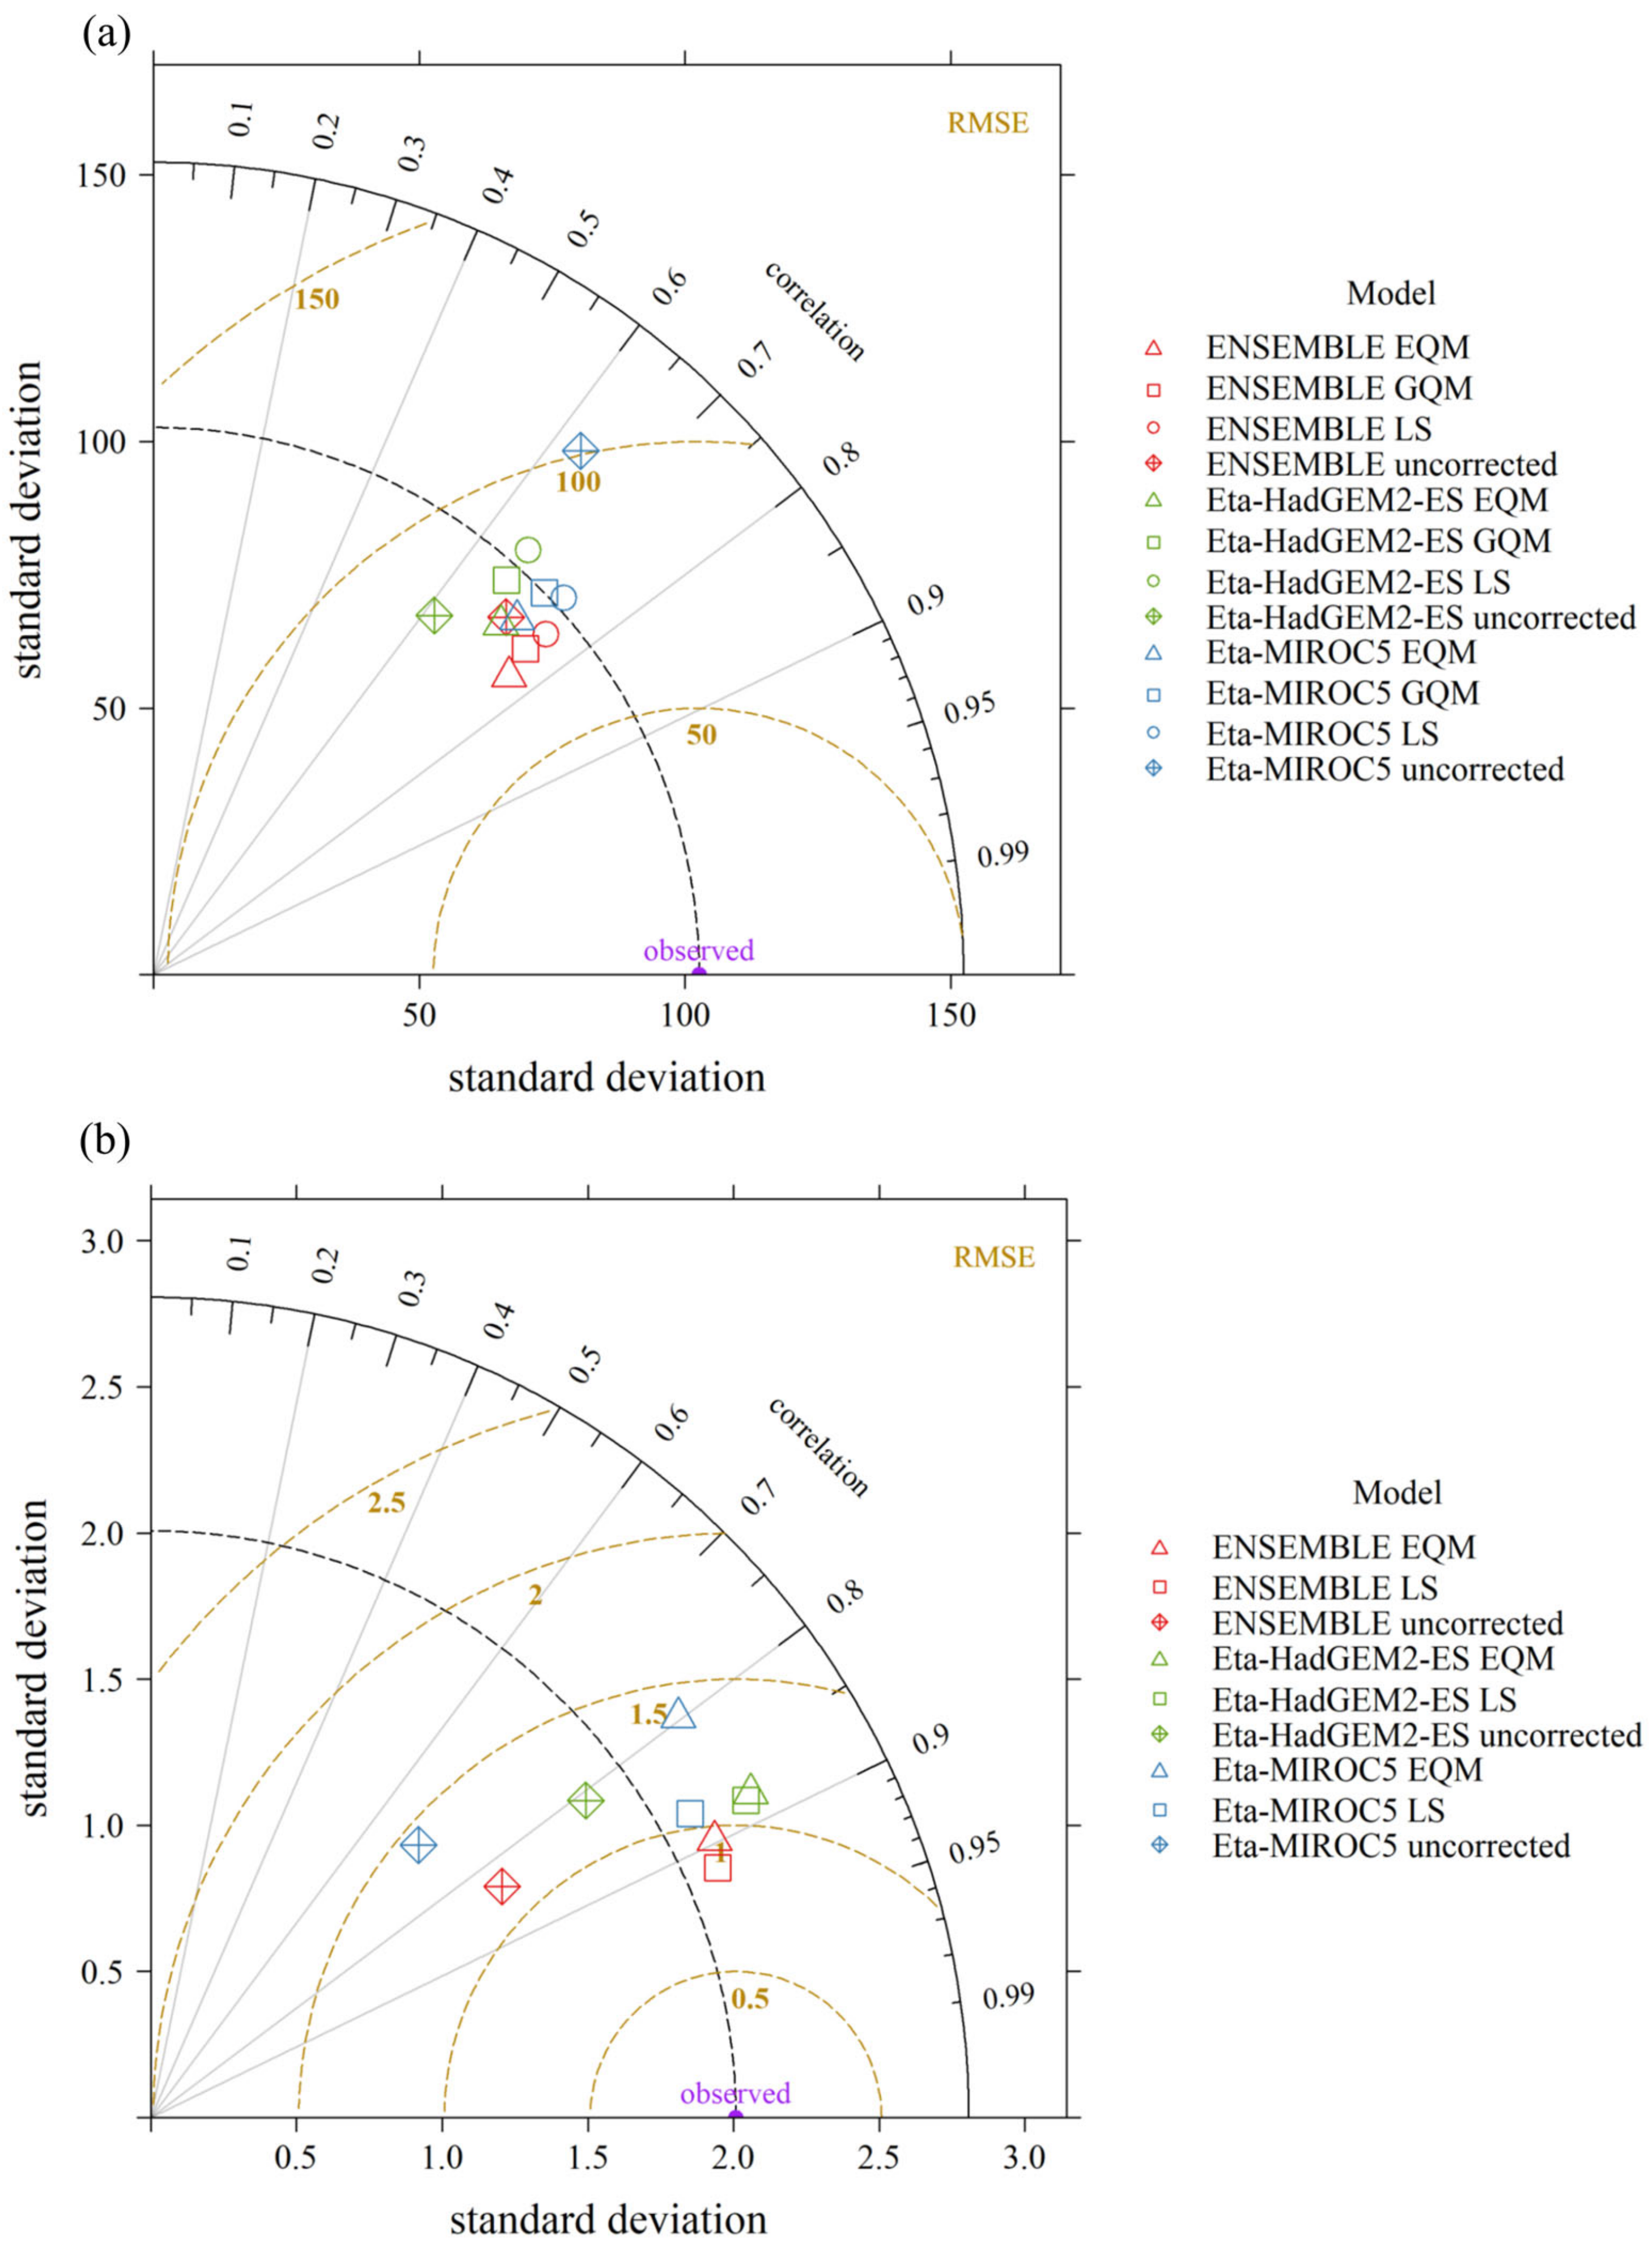
2.3. Correction of Climate Model Bias

Bias correction of the regional climate models was performed with data on total monthly precipitation and monthly average temperature for the simulated future period from 2020 to 2050 and the model’s control period from 1980 to 2005 with monthly observed data [51] referring to the same historical period. All climate data were processed using the R coding language (version 4.1.1). The bias correction was developed with the aid of the hyfo package [62].
Three methods to correct bias were used for precipitation and two methods for temperature. Using the linear scaling method (LS), precipitation was corrected with a multiplicative correction factor, which consists of the ratio between the long-term average of observed data and model control data. The temperature was corrected with an additive factor, the difference between the observed long-term monthly average and the historical control [63].
The empirical quantile mapping (EQM) method corrects the distribution of simulated data so that they correspond to the same behavior of observed data, using empirical cumulative distribution functions (CDFs) [64,65]. This technique was used to correct precipitation and temperature bias. Gamma quantile mapping (GQM) is similar to EQM; however, it uses the Gamma distribution to represent the cumulative distribution function. GQM was only used to correct precipitation [66,67].
To evaluate the methods, the monthly observed and simulated control data were divided into two samples: a calibration period and a validation period, as used by [55]. Using the Biascorrect function from the R hyfo package, the set of data related to the observations and control of the models was inserted, both for the same calibration period (1980–2000), being used to adjust the validation period (2001–2005). The data relating to the climate models used for the development of future environmental vulnerability had their bias corrected using the complete data series (1980–2005).
The performance was evaluated using the R software, version 4.1.1, through the hydroGOF package [68]. The used metrics were Mean Absolute Error (MAE), Root Mean Squared Error (RMSE), Percentage of Bias (PBIAS), the Nash–Sutcliffe coefficient (NSE), the Willmot agreement index (d), correlation coefficient (r), determination coefficient (R2), and the Kling–Gupta coefficient (KGE). Graphically, the performance of the climate models was presented by the Taylor diagram [69], which shows the RMSE, standard deviation (SD), and correlation coefficient (r).

2.4. Land Change Modeler (LCM)

To simulate the LULC for future conditions, the Land Change Modeler (LCM) module integrated with the TerrSet software version 19.0.2 was used [70]. The LCM constitutes a set of tools based on historical data, maps of transition potentials, and the Markov chain that allows projections of the LULC for the future to be made [71].
A Multi-Layer Perceptron (MLP) neural network was used to develop transition potential maps, given its good performance when modeling complex and non-linear relationships of changes in land use and land cover [72]. The MLP was generated with the help of the explanatory variables (elevation, slope, Euclidean distance from cities, agricultural areas, roads, and hydrography) as well as the LULC change map between 2000 and 2019. These variables have been frequently used in the literature for modeling land use and land cover [73,74,75,76].
Later, the Markov chain was applied to determine the amount of change (probability of change) that will occur on a given specific date and generate the predicted land use [70]. Thus, based on the LULC modifications observed for the years 2000 and 2019, modeling was carried out for the year 2020, validating it with the map provided by MapBiomas for this same year by the Kappa index, available in the CrossTab function of TerrSet2000. Based on the projection of changes, the LULC map was developed for the year 2050.
To assess the most critical situation, mainly due to the possible future degradation of the LULC of the Doce River Basin, the land use transitions that resulted in the deterioration of the conservation status of the previously occupied class were modeled, assuming the intensification of use. Thus, for instance, the expansion of agricultural areas into forest areas was included in the LCM sub-model as transformations from agricultural areas to non-vegetated or urban areas and transitions from forests to non-vegetated areas or non-forest formations.
The current Brazilian Forest Code, introduced by Law 12.651/2012 [25], establishes that every rural property must maintain a percentage of its area covered by native vegetation, declared as a Legal Reserve (RL). Thus, RL areas were included in our future land use scenarios, considering (1) evaluating the behavior of the RL areas, assuming that the legislation will not be effectively complied with by 2050, and (2) evaluating a hypothetical future situation, in which it was considered that by the year 2050, there will be full respect for the legal reserve areas established by law. Therefore, the reforestation of the RLs in the Doce River Basin was simulated, verifying how this could impact the modeling of the area’s future environmental vulnerability. Vector data of the RLs declared for the study area were obtained from the National Rural Environmental Registry System—SICAR [77].

2.5. Current Scenario

The current scenario refers to the current situation of the vulnerability of the basin and was simulated to serve as a baseline for the proposed future scenarios. For its development, the same variables described above were used; however, it differed by adopting the LULC for the year 2020, obtained from the MapBiomas Project, collection 6.0 [28]; using the distance from urban centers for the year 2020; and considering the series of average annual data on precipitation and temperature from 1990 to 2020, acquired from [78].

2.6. Environmental Vulnerability Index

To develop the EVI, a paired comparison was carried out between the variables using the Hierarchical Analysis Processes (AHPs), developed by [79], which facilitates ranking and attributing weight to the variables. It is widely used in environmental studies [35,80,81].
The AHP was conducted using the Saaty scale [82] based on the opinions of ten experts. Furthermore, the consistency (CR—Consistency Ratio) generated in the paired comparison was determined. Values of CR ≤ 0.1 indicate good consistency and values of CR > 0.1 indicate that the judgments made in the paired comparison should be revised [82].
The individual weights were combined using the geometric mean. This method has been frequently used in the literature as it enables more adequate results in aggregating collective preferences [83,84,85]. Afterward, the weights were standardized to ensure that the total sum of the criteria’s final weights equaled 1.
To create the environmental vulnerability map, the Weighted Linear Combination (WLC) was used. It is a technique that made it possible to combine the factors used with their corresponding scores employing a weighted average [86].
Thus, considering the combination of two scenarios for the variables, precipitation and temperature (intermediate RCP 4.5 and pessimistic RCP 8.5), and the two future LULC mappings (the year 2050 and year 2050 with reforested RLs), four future EVI scenarios were simulated: scenario 1 (RCP 8.5 for precipitation and temperature; LULC for the year 2050), scenario 2 (RCP 4.5 for precipitation and temperature; LULC for the year 2050 with reforested RLs), scenario 3 (RCP 4.5 for precipitation and temperature; LULC for the year 2050), and scenario 4 (RCP 8.5 for precipitation and temperature; LULC for the year 2050 with reforested RLs).
Finally, the maps of the obtained future scenarios, as well as the current scenario, were reclassified into five classes at defined intervals to enable the evaluation between the generated scenarios.

3. Results and Discussion

Due to the existence of bias between regional climate models and observed data, bias correction was carried out with the application of the EQM, GQM, and LS methods. Some of the performance metrics can be observed by the Taylor diagram (Figure 3) [69]. All performance metrics are presented in detail for the precipitation variable (Table S4) and average air temperature (Table S5) in the Supplementary Materials.
Overall, all evaluated correction methods improved the performance of the models compared to the uncorrected (raw) data, as also observed in [55]. Notably, the average Ensemble model performed better than the individual models. Despite the small difference in performance between the correction methods, Ensemble EQM and Ensemble LS were selected for determining the best metrics for correcting the bias of the variables of precipitation and temperature (r = 0.77 and r = 0.92, respectively).
A similar result was obtained in [55] when evaluating different bias correction methods for monthly precipitation in Costa Rica. The authors highlighted the EQM method as one of those that performed the best. For the Ensemble model, in most regions of the study area, they obtained r values between 0.7 and 0.85; however, for the Caribbean area, much lower values were verified, between 0.6 and 0.7, or even below 0.5. The authors justified this behavior as a result of the particularities of the area, such as the precipitation pattern that is not well described by climate models.
Also, climate models simulate the temperature variable better than precipitation, as evidenced by the better performance of temperature even for the uncorrected data. Several studies in the literature have addressed the lower ability of models to predict precipitation compared to temperature [87,88,89,90,91].
According to [92], due to the complex interactions of atmospheric processes, it is more difficult to predict changes in precipitation patterns than most consistent projections for the increase in atmospheric CO2 and temperature. Precipitation is controlled by temperature (thermodynamic processes) and atmospheric circulation (dynamic processes); thus, it is more difficult to understand the associated complex physical mechanisms, as well as the small scale on which they occur, which impacts the variability of simulation responses and the reliability of precipitation forecasts [93,94]. Although regionalized models are more reliable than global climate models for representing geographic characteristics for the projections of precipitation patterns, such as orography, related to more refined spatial resolutions (12.5 to 50 km), these are still subject to considerable errors [55,95].
For the precipitation parameter, the greatest differences between the RCP 4.5 and RCP 8.5 scenarios are verified in October, November, December, and January, which are months of the rainy season. The Eta-HadGEM2-ES model was the one that most underestimated the data for the historical period observed (Supplementary Material Figure S1). As for the temperature, in the most pessimistic scenario (RCP 8.5), there is a considerable increase in the average monthly temperature during the winter, mainly in June and July, and the Eta-HadGEM2-ES model simulated the highest monthly temperatures (Figure S2).
According to [46], in the south-central region of Brazil, during September, October, and November, there is a tendency for the Eta-HadGEM2-ES model to simulate reductions in precipitation, reflected in the annual values. The Eta-Miroc5 model, on the other hand, may increase precipitation during the rainy season, compared to the current climate.
Likewise, a study using the Eta-HadGEM2-ES model in three metropolitan cities in southeastern Brazil—Rio de Janeiro, São Paulo, and Santos—from 2006 to 2100 found a tendency for precipitation to decrease by about 3 to 6 mm day−1 in the rainy season, referring to December, January, and February, with the largest reductions in mountain regions [96]. The authors emphasize that as most of the annual precipitation comes from these months, the projected annual precipitation total will also be reduced.
As for temperature, the Eta-HadGEM2-ES model is more sensitive to the increase in greenhouse gasses, estimating a warming of around 4 °C by 2040, while in Eta-Miroc5, the increase is around 1.5 to 2 °C [46]. However, regardless of the regional climate model or the evaluated scenario, in the central and southeastern regions of Brazil, there is a warming trend due to the high population density and economic activity [97].
Thus, the results obtained in the present study for the Doce River Basin corroborate the projections for the southeast region. And, as expected, the reduction in precipitation and the temperature rise were more intense in the pessimistic scenario (RCP 8.5), as can be seen for the annual projections of the Ensemble model for precipitation (Figure 4) and temperature (Figure 5).
From the projections of the Ensemble model in the simulated future period, the central regions of the basin, close to the city of Governador Valadares, tend to present the lowest precipitation volumes. The worsening of the situation is more noticeable in the RCP 8.5 scenario. Furthermore, the reduction in total annual precipitation exceeds 400 mm compared to the historical period observed, with the average reduction for RCP 8.5 being 395 mm in the study area (Figure 4). Regarding the temperature, it is noted that the difference in temperature between the RCP 4.5 and 8.5 scenarios was, on average, 0.4 °C for the basin area. However, considering the historical period, a temperature increase of up to 2 °C is projected in the pessimistic scenario (Figure 5).
As for land use and land cover, the biggest changes, between 2000 and 2019, happened between the forest and agriculture classes (Figure 6a). The resulting balance indicated that the forest areas increased by 3231.8 km2, an increase of 1.92%, while the agricultural areas reduced by 3558.6 km2, corresponding to −2.12%.
Considering the projection for future scenarios in Figure 6b, assuming LULC intensification for the year 2050, agriculture and livestock would represent 68.7% of the basin area (59,606 km2), while forests would be 26.5% (23,013 km2). On the other hand, if, by the year 2050, the RL areas were to be fully respected and these areas were kept with native forest vegetation, the areas with agriculture and livestock would correspond to 63.8% of the Doce River Basin (55,418 km2), with forests at 31.7% (27,502 km2). Also, the expansion of urban areas is projected to be around 26.5% from 2019 to 2050, with an increase in non-vegetated areas from 19.3 to 30.7% for the same period, depending on the RL conditions.
It should be noted that when validating the accuracy of the predicted map for 2020 with the MapBiomas map, the Kappa index value of 0.94 was obtained, indicating excellent representativeness [98], also for the future condition. The Supplementary Materials (Figure S3) show the LULC maps for 2000 and 2019, and the maps projected for the year 2050, according to simulated conditions.
By observing the dynamics of LULC, it is noted that between the years 2000 and 2019, improvements in the recovery of the basin were mainly due to forest recomposition. After the biggest environmental disaster in Brazil, the rupture of the Samarco tailings dam, in November 2015, there was an articulation of several bodies to mitigate and compensate for the impacts, such as the agreement that intends to implement the forest restoration of 40,000 hectares of the river basin of the Doce River, established in the Term of Transaction and Adjustment of Conduct (TTAC) signed in 2016 [27,99].
Other initiatives aligned with worldwide goals can be mentioned, such as the Bonn Challenge, which aimed to restore 150 million hectares by 2020; the 20 × 20 Initiative, with a target of 20 million hectares by 2020; and the Paris Agreement, in which Brazil is committed to restoring 12 million hectares of native vegetation by 2030 [100]. In addition, there are national efforts, such as the Pact for the Restoration of the Atlantic Forest, which has already shown positive results with the restoration of more than 700,000 hectares of native forests of the Atlantic Forest biome in different states of Brazil between 2011 and 2015 [101].
In the future projections of LULC for the year 2050, considering the most critical future condition, which is the intensification of land use, an advance of agriculture and livestock was predicted, especially in the northwest region of the basin, where large forest areas are concentrated and many are not protected by the law, as well as in small forest areas in the central and southwest regions.
When considering the implementation of policies that encourage restoration in RL areas, mitigation of the environmental susceptibility to damage is expected, such as mitigating the impacts of anthropic actions in the Doce River Basin. In this way, for instance, one can minimize the damage caused by the advance of agriculture in important areas for the preservation of environmental and water resources, such as Permanent Preservation Areas (APPs) and Water Recharge Zones (tops of hills).
The relevance of forest vegetation cover in improving soil quality and, consequently, reducing its vulnerability to erosion [102]; its influence on the hydrological response of basins [103]; and the ability to maintain water quality [104], among other functions, are already well known. Therefore, the implementation of policies that encourage forest restoration in RL areas can favor the environmental conservation of the basin and mitigate its vulnerability.
After projecting climate and LULC information to simulate future conditions, all input variables used to develop the environmental vulnerability index were standardized on an adequacy scale from 0 to 255. The standardized mappings of natural and anthropic factors used are shown in the Supplementary Materials, respectively, in Figures S4 and S5. The standardized climatic factors, as well as the current scenario, are in Figure S6.
The spatial pattern of climatic factors is similar for both scenarios, RCP 4.5 and RCP 8.5, mainly for the temperature factor, where the areas of the lower Doce River are most vulnerable. As for precipitation, the most vulnerable areas are in the southwest region of the study area, characterized by greater precipitation volume, while the least vulnerable are in the central region. However, it should be noted that in this basin, in the RCP 8.5 scenario, there is a projection of lower rainfall volumes than in RCP 4.5, and since the fuzzy standardization performed is expressed by an increasing linear function, which means that the higher the precipitation, the greater vulnerability, the RCP 8.5 scenario tends to have more areas included in lower vulnerability levels.
By individual judgments of the experts obtained by the AHP method, it was possible to determine the weight for each factor of the environmental vulnerability study (Supplementary Materials Table S6). The CR values resulting from the paired comparison of the experts were below 0.1, which indicates consistency in their assessments [79].
The LULC (0.2433), precipitation (0.1501), and slope (0.1343) factors received the greatest scores in the analysis, while temperature (0.0297) was the least important one (Table S6). The LULC is also considered one of the most important factors in other multicriteria environmental studies, obtaining the highest scores [12,81,105].
Thus, based on the scores obtained and the standardized factors, the modeling of environmental vulnerability was developed considering future scenarios of climate change and LULC. Figure 7 shows the spatial distribution of the environmental vulnerability of the Doce River Basin for the four simulated future scenarios and the current scenario.
Overall, the maps for the different scenarios have a similar spatial pattern (Figure 7). In general, the areas with the lowest vulnerability are located in the northwest region of the study area; in conservation areas, such as the Rio Doce State Park; and places close to the basin’s outlet. This is mainly associated with LULC, since the higher vegetation cover, such as in natural forests, corresponds to lower vulnerability. Also, the topographical factors of slope, elevation, and relief dissection contribute to the lower vulnerability observed close to the Atlantic Ocean. The most environmentally vulnerable areas are in higher regions of the basin, close to the basin’s borders, and points with steep relief without vegetation cover, as well as in places with high rainfall at the west of the basin and areas intensely affected by anthropic land use in the central region.
By evaluating the area in each environmental vulnerability class in the different scenarios considered (Figure 8), it is verified that future scenario 4 (RCP 8.5 and LULC in 2050 with reforested RLs) has a higher percentage of area in the low and very low environmental vulnerability classes with 30,845.6 km2 (35.5%). On the other hand, future scenario 3 (RCP 4.5 and LULC in 2050) determines a larger area of the basin in the high and very high vulnerability classes, 30,412.2 km2 (35.0%). This can be explained by the fact that the RCP 8.5 climate scenario reduces precipitation more than the RCP 4.5 scenario, and since the precipitation factor received the second highest score in the multicriteria analysis and is expressed by an increasing linear function, it resulted in a situation in which the most pessimistic climate scenario (RCP 8.5) simulated fewer environmentally vulnerable areas.
Regarding the current scenario, it is clear that environmental vulnerability for future scenarios tends to have smaller areas in the very high vulnerability class. This may also be associated with a reduction of more than 300 mm in the average annual precipitation for the period 2020–2050, both in RCP 4.5 and RCP 8.5.
In a study that evaluated the average annual rainfall erosivity (R factor) until the year 2099, for all of South America, considering regional ETA models in a scenario of high emissions (RCP 8.5), a reduction in the R factor was estimated in the southeast region of Brazil [106]. This reduction is attributed to the substantial decrease in average annual precipitation. A similar result was observed in [107], the authors of which predicted a decrease in the R factor for both the RCP 4.5 and RCP 8.5 scenarios for the Tocantins–Araguaia basin in central Brazil.
Likewise, in an investigation of the influence of climate change on erosion in the Vranjska Valley, Serbia, the authors identified a tendency to reduce total precipitation by 19% in the region with a consequent decrease in the predicted rainfall erosivity by around 17.19% in 2100 compared to 2015 [85]. Also, the projections reduced average soil loss by 41.84% in 2100, compared to 2015, emphasizing that the decrease in precipitation is linked to the decrease in surface runoff and erosion [85,108].
Furthermore, ref. [107] also showed that the projection of reduced rainfall erosivity occurs due to the decrease in the amount of precipitation in the region; however, it is emphasized that extreme events may still occur intensely. The authors argue that although the reduction in rainfall is a positive aspect of the issue of soil erosion, it can negatively impact agriculture, and therefore, adaptation measures to the effects of climate change must be adopted.
Several actions can be considered to mitigate damage and adapt to future climatic conditions, such as the use of more resistant crops (plant genetic improvement) [109]; improving the efficiency of irrigation systems and evaluating sowing dates to mitigate water stress in agriculture [110]; water monitoring, such as inspecting water withdrawals; controlling water loss in water distribution and supply systems and encouraging the reuse of wastewater and rainwater harvesting [111]; and developing fire detection and monitoring programs [112].
Although all simulated future scenarios project a relative reduction in environmental vulnerability compared to the current scenario, it should be kept in mind that environmental systems have complex relationships, and the reduction in precipitation and the rise in temperature for the study area can imply changes in soil vegetation cover conditions and encourage the occurrence of erosion processes.
For instance, if, on the one hand, the increase in CO2 concentrations in the atmosphere and the consequent increase in temperature increases the evapotranspiration rates, reduces soil moisture, and increases the water infiltration rate, influencing the reduction of surface runoff and erosion [21,113], on the other hand, the increase in temperature can result in less water availability for plants, known as water stress, which reduces plant development and increases the erosion rate [114], since unprotected soils will be more vulnerable to soil loss during rainfall events [97]. Therefore, besides the complexity of the aforementioned interactions, which can be affected by multiple factors, there are uncertainties associated with climate projections that are still considerable, even in regional climate models.
Finally, it was also verified that when the reforestation of RL areas is simulated, the environmental vulnerability in these areas is mitigated. In future scenarios 2 and 4, in which this condition is evaluated, the RLs had an average EVI of 1.97 and 1.91, respectively. The EVI values observed in these areas, in the other scenarios analyzed, were 2.53 for scenario 1, 2.57 for scenario 3, and 2.55 for the current scenario. Therefore, these results corroborate the requirement of the Brazilian legislation, Federal Law No. 12,651 of 2012, which determines that rural landowners maintain a proportion of land protected as areas of native vegetation (PPAs and RLs) [25]. Furthermore, economic stimulus programs, such as Payment for Environmental Services (PES), should also be encouraged to promote environmental restoration.
As a limitation of this work, we considered that despite using a regional climate model and bias correction, errors might arise due to the larger scale of the data and the resampling required to make it compatible with other input data. Additionally, we utilized precipitation on an annual basis, whereas other patterns of precipitation, such as the intensity of extreme events and their potential modification of environmental vulnerability, could be incorporated.

4. Conclusions

By analyzing the results obtained, the following can be concluded:
  • Reductions in the basin’s average annual rainfall of more than 300 mm and an increase in the average annual temperature of up to 2 °C are predicted for the period 2020–2050.
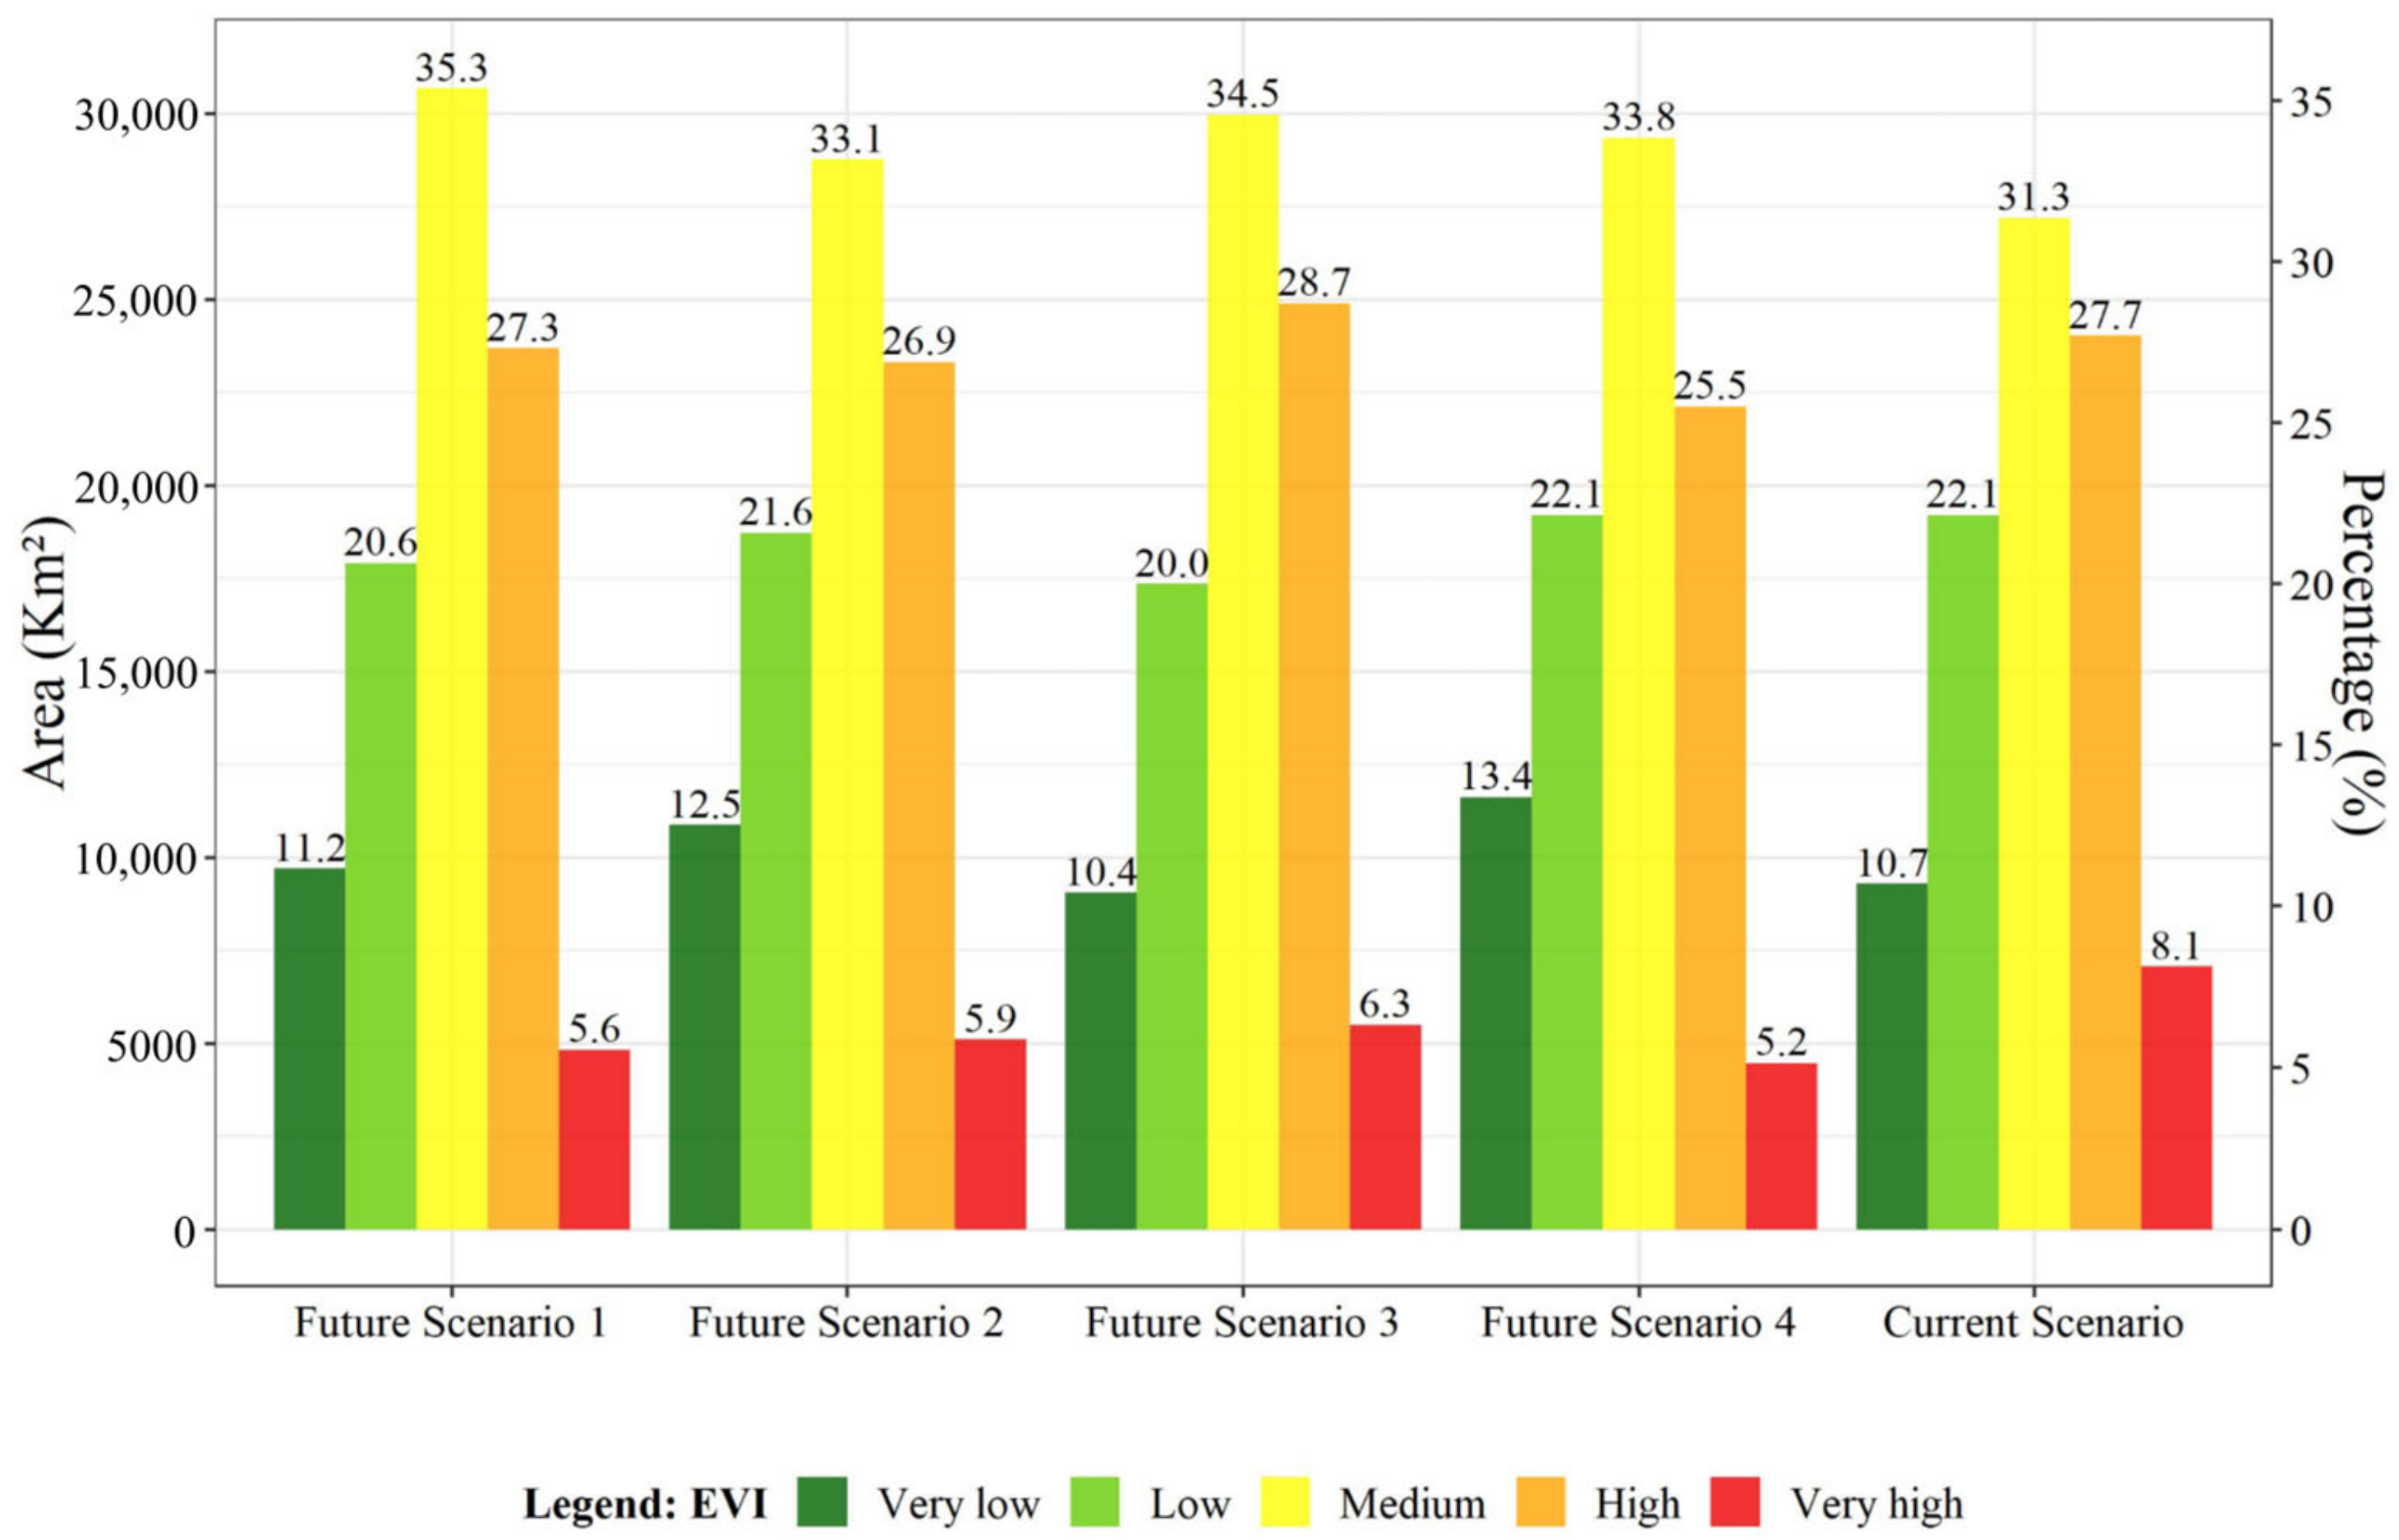
  • Future scenario 4, with RCP 8.5 and land use and land cover for 2050 with reforested legal reserves, had the highest percentage of area in the low and very low environmental vulnerability classes, while future scenario 3, with RCP 4.5 and land use and land cover for 2050, simulated the largest area of the basin in the high and very high vulnerability classes.
  • For all simulated future scenarios, a relative improvement in environmental vulnerability was predicted for 2050 compared to the current scenario due to the precipitation reduction. However, it is important to consider their complex relationships.
  • The results obtained in this study may serve as a subsidy for the adoption of measures to mitigate environmental damage and adapt to future climatic conditions in the Doce River Basin.
  • Future investigations can be implemented to develop models for early warning systems and disaster response plans, which can contribute to better preparation of the region for extreme weather events.

Supplementary Materials

The following supporting information can be downloaded at https://www.mdpi.com/article/10.3390/w16101459/s1: Table S1: Reclassification of MapBiomas land use and land cover classes adopted in the present study; Table S2: Description of fuzzy functions; Table S3: Reclassification of categorical variables; Table S4: Performance metrics of bias correction compared to the observed data of the monthly total precipitation variable for the Eta HadGEM2-ES, Eta Miroc5, and Ensemble climate models, corrected by the EQM, GQM, and LS methods, and raw data; Table S5: Performance metrics of bias correction compared to the observed data of the monthly average temperature variable for the climate models Eta HadGEM2-ES, Eta Miroc5, and Ensemble, corrected by the EQM, and LS methods, and raw data; Table S6: Scores of the factors used in the present study; Figure S1: Mean monthly precipitation (2020–2050) for Ensemble, Eta-HadGEM2-ES, and Eta-Miroc5 climate models and historical observed data (1980–2005): (a) RCP 4.5 and (b) RCP 8.5; Figure S2: Mean monthly temperature (2020–2050) for Ensemble, Eta-HadGEM2-ES, and Eta-Miroc5 climate models and historical observed data (1980–2005): (a) RCP 4.5 and (b) RCP 8.5; Figure S3: Land use and land cover (LULC) for the Doce River Basin for (a) year 2000; (b) year 2019; (c) predicted for the year 2050; and d) predicted for the year 2050 considering the reforestation of the legal reserves (RLs); Figure S4: Standardized natural factors used in the present study: (a) slope; (b) elevation; (c) relief dissection; (d) pedology; and (e) geology; Figure S5: Standard anthropogenic factors used in the present study: (a) land use and land cover (LULC) according to projections for the year 2050 and (b) LULC for the year 2050 with reforested RLs; (c) distance from urban areas for the year 2020; (d) distance from urban areas for the year 2050; (e) distance from roads; Figure S6: Standardized climatic factors used in the present study: (a) mean annual precipitation (2020–2050) in RCP 4.5 and (b) RCP 8.5; (c) mean annual temperature (2020–2050) in RCP 4.5 and, (d) RCP 8.5; (e) historical mean annual precipitation (1990–2020); (f) historical mean annual temperature (1990–2020); Reference: [9] Campos, J.A.; da Silva, D.D.; Fernandes Filho, E.I.; Pires, G.F.; Amorim, R.S.S.; de Menezes Filho, F.C.M.; de Melo Ribeiro, C.B.; Uliana, E.M.; Aires, U.R.V. Environmental Vulnerability Assessment of the Doce River Basin, Southeastern Brazil. Environ. Monit. Assess. 2023, 195, 1119. https://doi.org/10.1007/s10661-023-11782-w.

Author Contributions

Conceptualization, J.A.C.; methodology, J.A.C.; software, J.A.C.; validation, J.A.C.; writing—original draft preparation, J.A.C.; writing—review and editing, D.D.d.S., G.F.P., E.I.F.F., R.S.S.A., F.C.M.d.M.F., C.B.d.M.R., J.F.L. and. U.R.V.A.; supervision, D.D.d.S. All authors have read and agreed to the published version of the manuscript.

Funding

This research was funded by the Conselho Nacional de Desenvolvimento Científico e Tecnológico (CNPq), grant number 140418/2020-2, and the Coordenação de Aperfeiçoamento de Pessoal de Nível Superior—Brasil (CAPES)—Finance Code 001.

Data Availability Statement

The raw data supporting the conclusions of this article will be made available by the authors on request.

Conflicts of Interest

The authors declare no conflict of interest.

References

  1. Trevisan, D.P.; Bispo, P.d.C.; Almeida, D.; Imani, M.; Balzter, H.; Moschini, L.E. Environmental Vulnerability Index: An Evaluation of the Water and the Vegetation Quality in a Brazilian Savanna and Seasonal Forest Biome. Ecol. Indic. 2020, 112, 106163. [Google Scholar] [CrossRef]
  2. Anjinho, P.d.S.; Barbosa, M.A.G.A.; Costa, C.W.; Mauad, F.F. Environmental Fragility Analysis in Reservoir Drainage Basin Land Use Planning: A Brazilian Basin Case Study. Land Use Policy 2021, 100, 104946. [Google Scholar] [CrossRef]
  3. Rockström, J.; Steffen, W.; Noone, K.; Persson, Å.; Chapin, F.S.; Lambin, E.F.; Lenton, T.M.; Scheffer, M.; Folke, C.; Schellnhuber, H.J.; et al. A Safe Operating Space for Humanity. Nature 2009, 461, 472–475. [Google Scholar] [CrossRef] [PubMed]
  4. Balogun, A.L.; Yekeen, S.T.; Pradhan, B.; Wan Yusof, K.B. Oil Spill Trajectory Modelling and Environmental Vulnerability Mapping Using GNOME Model and GIS. Environ. Pollut. 2021, 268, 115812. [Google Scholar] [CrossRef] [PubMed]
  5. Wei, W.; Shi, S.; Zhang, X.; Zhou, L.; Xie, B.; Zhou, J.; Li, C. Regional-Scale Assessment of Environmental Vulnerability in an Arid Inland Basin. Ecol. Indic. 2020, 109, 105792. [Google Scholar] [CrossRef]
  6. Sahoo, S.; Dhar, A.; Debsarkar, A.; Kar, A. Future Scenarios of Environmental Vulnerability Mapping Using Grey Analytic Hierarchy Process. Nat. Resour. Res. 2019, 28, 1461–1483. [Google Scholar] [CrossRef]
  7. Adger, W.N. Vulnerability. Glob. Environ. Chang. 2006, 16, 268–281. [Google Scholar] [CrossRef]
  8. Wanyama, D.; Kar, B.; Moore, N.J. Quantitative Multi-Factor Characterization of Eco-Environmental Vulnerability in the Mount Elgon Ecosystem. GIScience Remote Sens. 2021, 58, 1571–1592. [Google Scholar] [CrossRef]
  9. Campos, J.A.; da Silva, D.D.; Fernandes Filho, E.I.; Pires, G.F.; Amorim, R.S.S.; de Menezes Filho, F.C.M.; de Melo Ribeiro, C.B.; Uliana, E.M.; Aires, U.R.V. Environmental Vulnerability Assessment of the Doce River Basin, Southeastern Brazil. Environ. Monit. Assess. 2023, 195, 1119. [Google Scholar] [CrossRef]
  10. Luo, D.; Caldas, M.M.; Goodin, D.G. Estimating Environmental Vulnerability in the Cerrado with Machine Learning and Twitter Data. J. Environ. Manag. 2021, 289, 112502. [Google Scholar] [CrossRef]
  11. Liou, Y.-A.; Nguyen, A.K.; Li, M.-H. Assessing Spatiotemporal Eco-Environmental Vulnerability by Landsat Data. Ecol. Indic. 2017, 80, 52–65. [Google Scholar] [CrossRef]
  12. Nguyen, K.-A.; Liou, Y.-A. Global Mapping of Eco-Environmental Vulnerability from Human and Nature Disturbances. Sci. Total Environ. 2019, 664, 995–1004. [Google Scholar] [CrossRef]
  13. Zhu, H.; Yao, J.; Meng, J.; Cui, C.; Wang, M.; Yang, R. A Method to Construct an Environmental Vulnerability Model Based on Multi-Source Data to Evaluate the Hazard of Short-Term Precipitation-Induced Flooding. Remote Sens. 2023, 15, 1609. [Google Scholar] [CrossRef]
  14. Rorato, A.C.; Escada, M.I.S.; Camara, G.; Picoli, M.C.A.; Verstegen, J.A. Environmental Vulnerability Assessment of Brazilian Amazon Indigenous Lands. Environ. Sci. Policy 2022, 129, 19–36. [Google Scholar] [CrossRef]
  15. Orozco, I.; Martínez, A.; Ortega, V. Assessment of the Water, Environmental, Economic and Social Vulnerability of a Watershed to the Potential Effects of Climate Change and Land Use Change. Water 2020, 12, 1682. [Google Scholar] [CrossRef]
  16. Zhao, J.; Fan, S.; Shi, Y.; Feng, J.; Wang, Z. Prediction of Eco-Environmental Vulnerability in Mainland China under the Future Scenarios. Pol. J. Environ. Stud. 2022, 31, 3941–3953. [Google Scholar] [CrossRef]
  17. IPCC—Intergovernmental Panel on Climate Change. Summary for Policymakers. In Climate Change 2021: The Physical Science Basis. Contribution of Working Group I to the Sixth Assessment Report of the Intergovernmental Panel on Climate Change; Cambridge University Press: Cambridge, UK; New York, NY, USA, 2021; pp. 3–32. [Google Scholar]
  18. Pruski, F.F.; Nearing, M.A. Climate-Induced Changes in Erosion during the 21st Century for Eight U.S. Locations. Water Resour. Res. 2002, 38, 34-1–34-11. [Google Scholar] [CrossRef]
  19. Mullan, D.; Favis-Mortlock, D.; Fealy, R. Addressing Key Limitations Associated with Modelling Soil Erosion under the Impacts of Future Climate Change. Agric. For. Meteorol. 2012, 156, 18–30. [Google Scholar] [CrossRef]
  20. Nearing, M.A.; Jetten, V.; Baffaut, C.; Cerdan, O.; Couturier, A.; Hernandez, M.; Le Bissonnais, Y.; Nichols, M.H.; Nunes, J.P.; Renschler, C.S.; et al. Modeling Response of Soil Erosion and Runoff to Changes in Precipitation and Cover. Catena 2005, 61, 131–154. [Google Scholar] [CrossRef]
  21. Li, Z.; Fang, H. Impacts of Climate Change on Water Erosion: A Review. Earth-Sci. Rev. 2016, 163, 94–117. [Google Scholar] [CrossRef]
  22. Souza, E.; Machado Pontes, L.; Inácio Fernandes Filho, E.; Ernesto Goncalves Reynaud Schaefer, C.; Elizabet dos Santos, E. Spatial and Temporal Potential Groundwater Recharge: The Case of the Doce River Basin, Brazil. RBCS-Rev. Bras. De Ciências Do Solo 2019, 43, 1–27. [Google Scholar] [CrossRef]
  23. ECOPLAN-LUME. Plano Integrado de Recursos Hídricos Da Bacia Hidrográfica Do Rio Doce; Consórcio Ecoplan/LUME: Belo Horizonte, Brazil, 2010. [Google Scholar]
  24. IBAMA—Instituto Brasileiro do Meio Ambiente e dos Recursos Naturais Renováveis Rompimento Da Barragem de Fundão. Documentos Relacionados Ao Desastre Da Samarco Em Mariana/MG. Available online: https://www.ibama.gov.br/informes/rompimento-da-barragem-de-fundao#pareceres (accessed on 10 May 2023).
  25. Brazil Lei N° 12.651, De 25 De Maio De 2012. Available online: http://www.planalto.gov.br/ccivil_03/_Ato2011-2014/2012/Lei/L12651.htm (accessed on 8 September 2020).
  26. CBH-DOCE. Comitê da Bacia Hidrográfica do Rio Doce. A Bacia Hidrográfica Do Rio Doce. Available online: http://www.cbhdoce.org.br/institucional/a-bacia (accessed on 5 May 2022).
  27. Ribeiro, S.M.C.; Rajão, R.; Nunes, F.; Assis, D.; Neto, J.A.; Marcolino, C.; Lima, L.; Rickard, T.; Salomão, C.; Filho, B.S. A Spatially Explicit Index for Mapping Forest Restoration Vocation (FRV) at the Landscape Scale: Application in the Rio Doce Basin, Brazil. Sci. Total Environ. 2020, 744, 140647. [Google Scholar] [CrossRef] [PubMed]
  28. MapBiomas. Projeto MapBiomas Coleção 6—Série Anual de Mapas de Cobertura e Uso de Solo Do Brasil. Available online: http://mapbiomas.org/ (accessed on 5 October 2021).
  29. SOS Mata Atlântica; INPE—Instituto Nacional de Pesquisas Espaciais. Atlas Dos Remanescentes Florestais Da Mata Atlântica—Período 2020–2021; SOS/INPE: São Paulo, Brazil, 2022; 72p, ISBN 9780874216561. [Google Scholar]
  30. ANA—Agência Nacional de Águas. Encarte Especial Sobre a Bacia Do Rio Doce. Rompimento Da Barragem Em Mariana/MG; Superintendência de Planejamento de Recursos Hídricos—SPR: Brasília, Brazil, 2016; 50p. [Google Scholar]
  31. Carmo, F.F.d.; Kamino, L.H.Y.; Junior, R.T.; Campos, I.C.d.; Carmo, F.F.d.; Silvino, G.; Castro, K.J.d.S.X.d.; Mauro, M.L.; Rodrigues, N.U.A.; Miranda, M.P.d.S.; et al. Fundão Tailings Dam Failures: The Environment Tragedy of the Largest Technological Disaster of Brazilian Mining in Global Context. Perspect. Ecol. Conserv. 2017, 15, 145–151. [Google Scholar] [CrossRef]
  32. Lima, H.S.; Cavalcante, J.P.C.M.; Silva, L.C.F.; da Silva, M.d.C.S.; de Paula, S.O.; Kasuya, M.C.M.; da Silva, C.C. Structure and Putative Function of a Soil Microbial Community Impacted by the Deposition of Tailings and Subsequent Revegetation after the Rupture of the Fundao Dam. Land Degrad. Dev. 2022, 33, 1235–1248. [Google Scholar] [CrossRef]
  33. Aires, U.R.V.; Santos, B.S.M.; Coelho, C.D.; da Silva, D.D.; Calijuri, M.L. Changes in Land Use and Land Cover as a Result of the Failure of a Mining Tailings Dam in Mariana, MG, Brazil. Land Use Policy 2018, 70, 63–70. [Google Scholar] [CrossRef]
  34. Rudorff, N.; Rudorff, C.M.; Kampel, M.; Ortiz, G. Remote Sensing Monitoring of the Impact of a Major Mining Wastewater Disaster on the Turbidity of the Doce River Plume off the Eastern Brazilian Coast. ISPRS J. Photogramm. Remote Sens. 2018, 145, 349–361. [Google Scholar] [CrossRef]
  35. Macedo, D.R.; Hughes, R.M.; Kaufmann, P.R.; Callisto, M. Development and Validation of an Environmental Fragility Index (EFI) for the Neotropical Savannah Biome. Sci. Total Environ. 2018, 635, 1267–1279. [Google Scholar] [CrossRef] [PubMed]
  36. Guimarães, F.S.; Cordeiro, C.M.; Bueno, G.T.; Carvalho, V.L.M.; Nero, M.A. Uma Proposta Para Automatização Do Índice de Dissecação Do Relevo. Rev. Bras. De Geomorfol. 2017, 18, 155–167. [Google Scholar] [CrossRef]
  37. IBGE—Instituto Brasileiro de Geografia e Estatística. Mapa Digital de Solos Do Brasil. Escala 1:250,000. Available online: https://geoftp.ibge.gov.br/informacoes_ambientais/pedologia/vetores/escala_250_mil/ (accessed on 25 June 2019).
  38. IBGE—Instituto Brasileiro de Geografia e Estatística. Mapa Geológico Digital Do Brasil. Escala 1:250,000. Available online: https://geoftp.ibge.gov.br/informacoes_ambientais/geologia/levantamento_geologico/vetores/escala_250_mil/ (accessed on 25 June 2019).
  39. Ross, J.L.S. Análise Empírica Da Fragilidade de Ambientes Naturais e Antropizados. Geogr. Dep. Univ. Sao Paulo 1994, 8, 63–74. [Google Scholar] [CrossRef]
  40. Crepani, E.; Medeiros, J.S.; Filho, P.H.; Gallotti, T.; Valdete, F.; Cláudio, D.; Faria Barbosa, C. Sensoriamento Remoto e Geoprocessamento Aplicados Ao Zoneamento Ecológico-Econômico e Ao Ordenamento Territorial; INPE: São José dos Campos, Brazil, 2001; 124p. [Google Scholar]
  41. IBGE—Instituto Brasileiro de Geografia e Estatística. Bases Cartográficas Contínuas Do Brasil. Escala 1:250,000. Versão 2021. Available online: https://www.ibge.gov.br/geociencias/cartas-e-mapas/bases-cartograficas-continuas/15759-brasil.html?=&t=downloads (accessed on 18 November 2021).
  42. Pruski, F.F. Conservação de Solo e Água, 2nd ed.; Editora UFV: Viçosa, Brazil, 2009; 279p. [Google Scholar]
  43. INPE—Instituto Nacional de Pesquisas Espaciais. PROJETA (Projeções de Mudança Do Clima Para a América Do Sul Regionalizadas Pelo Modelo ETA). Available online: https://projeta.cptec.inpe.br/#/dashboard (accessed on 25 June 2020).
  44. Collins, W.J.; Bellouin, N.; Doutriaux-Boucher, M.; Gedney, N.; Halloran, P.; Hinton, T.; Hughes, J.; Jones, C.D.; Joshi, M.; Liddicoat, S.; et al. Development and Evaluation of an Earth-System Model—HadGEM2. Geosci. Model Dev. 2011, 4, 1051–1075. [Google Scholar] [CrossRef]
  45. Watanabe, M.; Suzuki, T.; O’ishi, R.; Komuro, Y.; Watanabe, S.; Emori, S.; Takemura, T.; Chikira, M.; Ogura, T.; Sekiguchi, M.; et al. Improved Climate Simulation by MIROC5: Mean States, Variability, and Climate Sensitivity. J. Clim. 2010, 23, 6312–6335. [Google Scholar] [CrossRef]
  46. Chou, S.C.; Lyra, A.; Mourão, C.; Dereczynski, C.; Pilotto, I.; Gomes, J.; Bustamante, J.; Tavares, P.; Silva, A.; Rodrigues, D.; et al. Assessment of Climate Change over South America under RCP 4.5 and 8.5 Downscaling Scenarios. Am. J. Clim. Chang. 2014, 3, 512–527. [Google Scholar] [CrossRef]
  47. Chou, S.C.; Lyra, A.; Mourão, C.; Dereczynski, C.; Pilotto, I.; Gomes, J.; Bustamante, J.; Tavares, P.; Silva, A.; Rodrigues, D.; et al. Evaluation of the Eta Simulations Nested in Three Global Climate Models. Am. J. Clim. Chang. 2014, 3, 438–454. [Google Scholar] [CrossRef]
  48. Mesinger, F.; Chou, S.C.; Gomes, J.L.; Jovic, D.; Bastos, P.; Bustamante, J.F.; Lazic, L.; Lyra, A.A.; Morelli, S.; Ristic, I.; et al. An Upgraded Version of the Eta Model. Meteorol. Atmos. Phys. 2012, 116, 63–79. [Google Scholar] [CrossRef]
  49. IPCC—Intergovernmental Panel on Climate Change. Climate Change 2013—The Physical Science Basis; Cambridge University Press: Cambridge, UK, 2013; ISBN 9781107415324. [Google Scholar]
  50. Smith, M.R.; Myers, S.S. Impact of Anthropogenic CO2 Emissions on Global Human Nutrition. Nat. Clim. Chang. 2018, 8, 834–839. [Google Scholar] [CrossRef]
  51. Xavier, A.C.; King, C.W.; Scanlon, B.R. Daily Gridded Meteorological Variables in Brazil (1980–2013). Int. J. Climatol. 2016, 36, 2644–2659. [Google Scholar] [CrossRef]
  52. Almagro, A.; Oliveira, P.T.S.; Rosolem, R.; Hagemann, S.; Nobre, C.A. Performance Evaluation of Eta/HadGEM2-ES and Eta/MIROC5 Precipitation Simulations over Brazil. Atmos. Res. 2020, 244, 105053. [Google Scholar] [CrossRef]
  53. Paredes-Trejo, F.; Barbosa, H.A.; Giovannettone, J.; Lakshmi Kumar, T.V.; Thakur, M.K.; Buriti, C.d.O.; Uzcátegui-Briceño, C. Drought Assessment in the São Francisco River Basin Using Satellite-Based and Ground-Based Indices. Remote Sens. 2021, 13, 3921. [Google Scholar] [CrossRef]
  54. Avila-Diaz, A.; Benezoli, V.; Justino, F.; Torres, R.; Wilson, A. Assessing Current and Future Trends of Climate Extremes across Brazil Based on Reanalyses and Earth System Model Projections. Clim. Dyn. 2020, 55, 1403–1426. [Google Scholar] [CrossRef]
  55. Mendez, M.; Maathuis, B.; Hein-Griggs, D.; Alvarado-Gamboa, L.F. Performance Evaluation of Bias Correction Methods for Climate Change Monthly Precipitation Projections over Costa Rica. Water 2020, 12, 482. [Google Scholar] [CrossRef]
  56. Jong, P.d.; Barreto, T.B.; Tanajura, C.A.S.; Oliveira-Esquerre, K.P.; Kiperstok, A.; Andrade Torres, E. The Impact of Regional Climate Change on Hydroelectric Resources in South America. Renew. Energy 2021, 173, 76–91. [Google Scholar] [CrossRef]
  57. Zou, T.; Yoshino, K. Environmental Vulnerability Evaluation Using a Spatial Principal Components Approach in the Daxing’anling Region, China. Ecol. Indic. 2017, 78, 405–415. [Google Scholar] [CrossRef]
  58. GEE—Google Earth Engine. Introduction: Google Earth Engine API—Google Developers. Available online: https://earthengine.google.com/ (accessed on 1 June 2017).
  59. Mihi, A.; Benarfa, N.; Arar, A. Assessing and Mapping Water Erosion-Prone Areas in Northeastern Algeria Using Analytic Hierarchy Process, USLE/RUSLE Equation, GIS, and Remote Sensing. Appl. Geomat. 2020, 12, 179–191. [Google Scholar] [CrossRef]
  60. Alvarado, A.; Esteller, M.V.; Quentin, E.; Expósito, J.L. Multi-Criteria Decision Analysis and GIS Approach for Prioritization of Drinking Water Utilities Protection Based on Their Vulnerability to Contamination. Water Resour. Manag. 2016, 30, 1549–1566. [Google Scholar] [CrossRef]
  61. Cruz, B.B.; Manfré, L.A.; Ricci, D.S.; Brunoro, D.; Appolinario, L.; Quintanilha, J.A. Environmental Fragility Framework for Water Supply Systems: A Case Study in the Paulista Macro Metropolis Area (SE Brazil). Environ. Earth Sci. 2017, 76, 441. [Google Scholar] [CrossRef]
  62. Xu, Y. R Package, Version 1.4.3. Hyfo: Hydrology and Climate Forecasting. R Foundation for Statistical Computing: Vienna, Austria, 2020.
  63. Teutschbein, C.; Seibert, J. Bias Correction of Regional Climate Model Simulations for Hydrological Climate-Change Impact Studies: Review and Evaluation of Different Methods. J. Hydrol. 2012, 456–457, 12–29. [Google Scholar] [CrossRef]
  64. Déqué, M. Frequency of Precipitation and Temperature Extremes over France in an Anthropogenic Scenario: Model Results and Statistical Correction According to Observed Values. Glob. Planet. Chang. 2007, 57, 16–26. [Google Scholar] [CrossRef]
  65. Themeßl, M.J.; Gobiet, A.; Heinrich, G. Empirical-Statistical Downscaling and Error Correction of Regional Climate Models and Its Impact on the Climate Change Signal. Clim. Chang. 2012, 112, 449–468. [Google Scholar] [CrossRef]
  66. Piani, C.; Haerter, J.O.; Coppola, E. Statistical Bias Correction for Daily Precipitation in Regional Climate Models over Europe. Theor. Appl. Climatol. 2010, 99, 187–192. [Google Scholar] [CrossRef]
  67. Akhter, J.; Das, L.; Deb, A. CMIP5 Ensemble-Based Spatial Rainfall Projection over Homogeneous Zones of India. Clim. Dyn. 2017, 49, 1885–1916. [Google Scholar] [CrossRef]
  68. Zambrano-Bigiarini, M. R Package, Version 0.4-0. HydroGOF: Goodness-of-Fit Functions for Comparison of Simulated and Observed Hydrological Time Series. R Foundation for Statistical Computing: Vienna, Austria, 2020.
  69. Taylor, K.E. Summarizing Multiple Aspects of Model Performance in a Single Diagram. J. Geophys. Res. Atmos. 2001, 106, 7183–7192. [Google Scholar] [CrossRef]
  70. Eastman, J.R. Manual TerrSet2020. Geospatial Monitoring and Modeling System; Clark Labs: Worcester, MA, USA, 2020; 389p. [Google Scholar]
  71. Azari, M.; Billa, L.; Chan, A. Multi-Temporal Analysis of Past and Future Land Cover Change in the Highly Urbanized State of Selangor, Malaysia. Ecol. Process. 2022, 11, 2. [Google Scholar] [CrossRef]
  72. Leta, M.K.; Demissie, T.A.; Tränckner, J. Modeling and Prediction of Land Use Land Cover Change Dynamics Based on Land Change Modeler (LCM) in Nashe Watershed, Upper Blue Nile Basin, Ethiopia. Sustainability 2021, 13, 3740. [Google Scholar] [CrossRef]
  73. Azareh, A.; Sardooi, E.R.; Gholami, H.; Mosavi, A.; Shahdadi, A.; Barkhori, S. Detection and Prediction of Lake Degradation Using Landscape Metrics and Remote Sensing Dataset. Environ. Sci. Pollut. Res. 2021, 28, 27283–27298. [Google Scholar] [CrossRef] [PubMed]
  74. Silva, L.P.e.; Xavier, A.P.C.; da Silva, R.M.; Santos, C.A.G. Modeling Land Cover Change Based on an Artificial Neural Network for a Semiarid River Basin in Northeastern Brazil. Glob. Ecol. Conserv. 2020, 21, e00811. [Google Scholar] [CrossRef]
  75. Rodrigues, A.L.M.; Reis, G.B.; dos Santos, M.T.; da Silva, D.D.; dos Santos, V.J.; de Siqueira Castro, J.; Calijuri, M.L. Influence of Land Use and Land Cover’s Change on the Hydrological Regime at a Brazilian Southeast Urbanized Watershed. Environ. Earth Sci. 2019, 78, 595. [Google Scholar] [CrossRef]
  76. Floreano, I.X.; de Moraes, L.A.F. Land Use/Land Cover (LULC) Analysis (2009–2019) with Google Earth Engine and 2030 Prediction Using Markov-CA in the Rondônia State, Brazil. Environ. Monit. Assess. 2021, 193, 239. [Google Scholar] [CrossRef]
  77. SICAR. Sistema Nacional de Cadastro Ambiental Rural. Available online: https://www.car.gov.br/publico/imoveis/index (accessed on 18 February 2020).
  78. Xavier, A.C.; Scanlon, B.R.; King, C.W.; Alves, A.I. New Improved Brazilian Daily Weather Gridded Data (1961–2020). Int. J. Climatol. 2022, 42, 8390–8404. [Google Scholar] [CrossRef]
  79. Saaty, T.L. The Analytic Hierarchy Process: Planning, Priority Setting, Resource Allocation; McGraw-Hill International: New York, NY, USA, 1980. [Google Scholar]
  80. Nguyen, A.K.; Liou, Y.-A.; Li, M.-H.; Tran, T.A. Zoning Eco-Environmental Vulnerability for Environmental Management and Protection. Ecol. Indic. 2016, 69, 100–117. [Google Scholar] [CrossRef]
  81. França, L.C.d.J.; Lopes, L.F.; Morais, M.S.d.; Lisboa, G.d.S.; Rocha, S.J.S.d.; Junior, V.T.M.d.M.; Santana, R.C.; Mucida, D.P. Environmental Fragility Zoning Using GIS and AHP Modeling: Perspectives for the Conservation of Natural Ecosystems in Brazil. Conservation 2022, 2, 349–366. [Google Scholar] [CrossRef]
  82. Saaty, T.L. How to Make a Decision: The Analytic Hierarchy Process. Eur. J. Oper. Res. 1990, 48, 9–26. [Google Scholar] [CrossRef]
  83. Morales, F.; Vries, W.T.d. Establishment of Land Use Suitability Mapping Criteria Using Analytic Hierarchy Process (AHP) with Practitioners and Beneficiaries. Land 2021, 10, 235. [Google Scholar] [CrossRef]
  84. Sutadian, A.D.; Muttil, N.; Yilmaz, A.G.; Perera, B.J.C. Using the Analytic Hierarchy Process to Identify Parameter Weights for Developing a Water Quality Index. Ecol. Indic. 2017, 75, 220–233. [Google Scholar] [CrossRef]
  85. Perović, V.; Kadović, R.; Djurdjević, V.; Braunović, S.; Čakmak, D.; Mitrović, M.; Pavlović, P. Effects of Changes in Climate and Land Use on Soil Erosion: A Case Study of the Vranjska Valley, Serbia. Reg. Environ. Chang. 2019, 19, 1035–1046. [Google Scholar] [CrossRef]
  86. Eastman, J.R. IDRISI Selva Tutorial; Clark University: Worcester, MA, USA, 2012; 354p. [Google Scholar]
  87. Alizadeh-Choobari, O.; Qadimi, M.; Marjani, S. Evaluation of 2-m Temperature and Precipitation Products of the Climate Forecast System Version 2 over Iran. Dyn. Atmos. Ocean. 2019, 88, 101105. [Google Scholar] [CrossRef]
  88. Hamed, M.M.; Nashwan, M.S.; Shahid, S. Inter-comparison of Historical Simulation and Future Projections of Rainfall and Temperature by CMIP5 and CMIP6 GCMs over Egypt. Int. J. Climatol. 2021, 42, 4316–4332. [Google Scholar] [CrossRef]
  89. Lovino, M.A.; Müller, O.V.; Berbery, E.H.; Müller, G.V. Evaluation of CMIP5 Retrospective Simulations of Temperature and Precipitation in Northeastern Argentina. Int. J. Climatol. 2018, 38, e1158–e1175. [Google Scholar] [CrossRef]
  90. Chou, S.C.; de Arruda Lyra, A.; Gomes, J.L.; Rodriguez, D.A.; Alves Martins, M.; Costa Resende, N.; da Silva Tavares, P.; Pereira Dereczynski, C.; Lopes Pilotto, I.; Martins, A.M.; et al. Downscaling Projections of Climate Change in Sao Tome and Principe Islands, Africa. Clim. Dyn. 2020, 54, 4021–4042. [Google Scholar] [CrossRef]
  91. Luo, M.; Liu, T.; Meng, F.; Duan, Y.; Frankl, A.; Bao, A.; De Maeyer, P. Comparing Bias Correction Methods Used in Downscaling Precipitation and Temperature from Regional Climate Models: A Case Study from the Kaidu River Basin in Western China. Water 2018, 10, 1046. [Google Scholar] [CrossRef]
  92. Knapp, A.K.; Beier, C.; Briske, D.D.; Classen, A.T.; Luo, Y.; Reichstein, M.; Smith, M.D.; Smith, S.D.; Bell, J.E.; Fay, P.A.; et al. Consequences of More Extreme Precipitation Regimes for Terrestrial Ecosystems. BioScience 2008, 58, 811–821. [Google Scholar] [CrossRef]
  93. Shepherd, T.G. Atmospheric Circulation as a Source of Uncertainty in Climate Change Projections. Nat. Geosci. 2014, 7, 703–708. [Google Scholar] [CrossRef]
  94. Sooraj, K.P.; Annamalai, H.; Kumar, A.; Wang, H. A Comprehensive Assessment of CFS Seasonal Forecasts over the Tropics. Weather Forecast. 2012, 27, 3–27. [Google Scholar] [CrossRef]
  95. Chen, J.; Brissette, F.P.; Chaumont, D.; Braun, M. Finding Appropriate Bias Correction Methods in Downscaling Precipitation for Hydrologic Impact Studies over North America. Water Resour. Res. 2013, 49, 4187–4205. [Google Scholar] [CrossRef]
  96. Lyra, A.; Tavares, P.; Chou, S.C.; Sueiro, G.; Dereczynski, C.; Sondermann, M.; Silva, A.; Marengo, J.; Giarolla, A. Climate Change Projections over Three Metropolitan Regions in Southeast Brazil Using the Non-Hydrostatic Eta Regional Climate Model at 5-Km Resolution. Theor. Appl. Climatol. 2018, 132, 663–682. [Google Scholar] [CrossRef]
  97. Oliveira, V.A.d.; de Mello, C.R.; Beskow, S.; Viola, M.R.; Srinivasan, R. Modeling the Effects of Climate Change on Hydrology and Sediment Load in a Headwater Basin in the Brazilian Cerrado Biome. Ecol. Eng. 2019, 133, 20–31. [Google Scholar] [CrossRef]
  98. Landis, J.R.; Koch, G.G. The Measurement of Observer Agreement for Categorical Data. Biometrics 1977, 33, 159–174. [Google Scholar] [CrossRef] [PubMed]
  99. Ministério Público Federal Brasil. Termo de Transação e Ajustamento de Conduta (TTAC). Available online: https://www.ibama.gov.br/phocadownload/emergenciasambientais/termo_de_transacao_e_de_ajustamento_de_conduta_completo.pdf (accessed on 2 April 2024).
  100. Cavalcante, R.B.L.; Nunes, S.; Viademonte, S.; Rodrigues, C.M.F.; Gomes, W.C.; Ferreira, J.d.S.; Pontes, P.R.M.; Giannini, T.C.; Awade, M.; de S. Miranda, L.; et al. Multicriteria Approach to Prioritize Forest Restoration Areas for Biodiversity Conservation in the Eastern Amazon. J. Environ. Manag. 2022, 318, 115590. [Google Scholar] [CrossRef]
  101. Crouzeilles, R.; Santiami, E.; Rosa, M.; Pugliese, L.; Brancalion, P.H.S.; Rodrigues, R.R.; Metzger, J.P.; Calmon, M.; Scaramuzza, C.A.d.M.; Matsumoto, M.H.; et al. There Is Hope for Achieving Ambitious Atlantic Forest Restoration Commitments. Perspect. Ecol. Conserv. 2019, 17, 80–83. [Google Scholar] [CrossRef]
  102. Raj, A.D.; Kumar, S.; Sooryamol, K.R. Modelling Climate Change Impact on Soil Loss and Erosion Vulnerability in a Watershed of Shiwalik Himalayas. Catena 2022, 214, 106279. [Google Scholar] [CrossRef]
  103. Cecílio, R.A.; Pimentel, S.M.; Zanetti, S.S. Modeling the Influence of Forest Cover on Streamflows by Different Approaches. Catena 2019, 178, 49–58. [Google Scholar] [CrossRef]
  104. Pires, A.P.F.; Rezende, C.L.; Assad, E.D.; Loyola, R.; Scarano, F.R. Forest Restoration Can Increase the Rio Doce Watershed Resilience. Perspect. Ecol. Conserv. 2017, 15, 187–193. [Google Scholar] [CrossRef]
  105. Campos, J.A.; Silva, D.D.d.; Moreira, M.C.; Filho, F.C.M.d.M. Environmental Fragility and Land Use Capacity as Instruments of Environmental Planning, Caratinga River Basin, Brazil. Environ. Earth Sci. 2021, 80, 264. [Google Scholar] [CrossRef]
  106. Riquetti, N.B.; Mello, C.R.; Beskow, S.; Viola, M.R. Rainfall Erosivity in South America: Current Patterns and Future Perspectives. Sci. Total Environ. 2020, 724, 138315. [Google Scholar] [CrossRef] [PubMed]
  107. Santos, W.P.d.; Avanzi, J.C.; Viola, M.R.; Chou, S.C.; Acuña-Guzman, S.F.; Pontes, L.M.; Curi, N. Projections of Rainfall Erosivity in Climate Change Scenarios for the Largest Watershed within Brazilian Territory. Catena 2022, 213, 106225. [Google Scholar] [CrossRef]
  108. Serpa, D.; Nunes, J.P.; Santos, J.; Sampaio, E.; Jacinto, R.; Veiga, S.; Lima, J.C.; Moreira, M.; Corte-Real, J.; Keizer, J.J.; et al. Impacts of Climate and Land Use Changes on the Hydrological and Erosion Processes of Two Contrasting Mediterranean Catchments. Sci. Total Environ. 2015, 538, 64–77. [Google Scholar] [CrossRef] [PubMed]
  109. Heinemann, A.B.; Costa-Neto, G.; Fritsche-Neto, R.; da Matta, D.H.; Fernandes, I.K. Enviromic Prediction Is Useful to Define the Limits of Climate Adaptation: A Case Study of Common Bean in Brazil. Field Crops Res. 2022, 286, 108628. [Google Scholar] [CrossRef]
  110. Babaeian, F.; Delavar, M.; Morid, S.; Srinivasan, R. Robust Climate Change Adaptation Pathways in Agricultural Water Management. Agric. Water Manag. 2021, 252, 106904. [Google Scholar] [CrossRef]
  111. Siqueira, P.P.; Oliveira, P.T.S.; Bressiani, D.; Meira Neto, A.A.; Rodrigues, D.B.B. Effects of Climate and Land Cover Changes on Water Availability in a Brazilian Cerrado Basin. J. Hydrol. Reg. Stud. 2021, 37, 100931. [Google Scholar] [CrossRef]
  112. Oliveira-Júnior, J.F.d.; Mendes, D.; Correia Filho, W.L.F.; Silva Junior, C.A.d.; Gois, G.d.; Jardim, A.M.d.R.F.; Silva, M.V.d.; Lyra, G.B.; Teodoro, P.E.; Pimentel, L.C.G.; et al. Fire Foci in South America: Impact and Causes, Fire Hazard and Future Scenarios. J. South Am. Earth Sci. 2021, 112, 103623. [Google Scholar] [CrossRef]
  113. Zhang, S.; Li, Z.; Hou, X.; Yi, Y. Impacts on Watershed-Scale Runoff and Sediment Yield Resulting from Synergetic Changes in Climate and Vegetation. Catena 2019, 179, 129–138. [Google Scholar] [CrossRef]
  114. Shrestha, B.; Cochrane, T.A.; Caruso, B.S.; Arias, M.E.; Piman, T. Uncertainty in Flow and Sediment Projections Due to Future Climate Scenarios for the 3S Rivers in the Mekong Basin. J. Hydrol. 2016, 540, 1088–1104. [Google Scholar] [CrossRef]
Figure 1. Location map of the study area (a) highlighting the Doce River Basin in Brazil and (b) the Doce River Basin’s main river and elevation.
Water 16 01459 g001
Figure 2. Methodology applied in this work. AHP: Hierarchical Process Analysis; EVI: environmental vulnerability index; GIS: Geographic Information System; LCM: Land Change Modeler; WLC: Weighted Linear Combination.
Water 16 01459 g002
Figure 3. Taylor diagram for (a) mean monthly precipitation and (b) mean monthly temperature, observed with and without bias correction in the calibration period of the climate models Eta HadGEM2-ES, Eta Miroc5, and Ensemble for the Doce River Basin.
Water 16 01459 g003
Figure 4. Average annual precipitation (2020–2050) for (a) RCP 4.5 and (b) RCP 8.5; the difference between the future period (2020–2050) and the observed historical period (1980–2005), in mm, for (c) RCP 4.5 and (d) RCP 8.5; percent change between the future period (2020–2050) and observed historical period (1980–2005) for (e) RCP 4.5 and (f) RCP 8.5. Acronym: SD: standard deviation.
Water 16 01459 g004
Figure 5. Average annual temperature (2020–2050) for (a) RCP 4.5 and (b) RCP 8.5; the difference between the future period (2020–2050) and observed historical period (1980–2005), in °C, for (c) RCP 4.5 and (d) RCP 8.5; percent change between the future period (2020–2050) and observed historical period (1980–2005) for (e) RCP 4.5 and (f) RCP 8.5. Acronym: SD: standard deviation.
Water 16 01459 g005
Figure 6. Gains and losses between land use and land cover between 2000 and 2019 (a) by area for each land use and land cover for the years 2000 and 2019 (b), considering the predicted scenarios for 2050 with and without reforested legal reserves (RLs).
Water 16 01459 g006
Figure 7. Spatial distribution of environmental vulnerability in the Doce River Basin for (a) future scenario 1; (b) future scenario 2; (c) future scenario 3; (d) future scenario 4; (e) current scenario.
Water 16 01459 g007
Figure 8. Area of each environmental vulnerability class of the Doce River Basin in the different evaluated scenarios.
Water 16 01459 g008
Disclaimer/Publisher’s Note: The statements, opinions and data contained in all publications are solely those of the individual author(s) and contributor(s) and not of MDPI and/or the editor(s). MDPI and/or the editor(s) disclaim responsibility for any injury to people or property resulting from any ideas, methods, instructions or products referred to in the content.

