1. Introduction
Surface water bodies (SWBs), encompassing a wealth of natural lakes and widely distributed artificial reservoirs, bear crucial freshwater resources. SWBs are fundamental to China’s geographical environment, ecosystems, and socio-economic development. Statistically, China’s surface water bodies store substantial freshwater, playing a decisive role in national water resource security and ecological balance. In the complex hydrological cycle, surface water bodies serve a key role, regulating precipitation runoff, groundwater replenishment, and regional water balance. Additionally, they significantly contribute to carbon cycling [
1], sediment and nutrient transport [
2], and react markedly to climate change [
3] by influencing local climatic conditions [
4,
5]. SWBs also foster unique and diverse ecosystems [
6], providing extensive ecosystem services, such as food and water supply. The surface area of SWBs is a crucial attribute, as it is the medium through which SWBs interact with many earth system processes and is closely linked to methane emissions, heat flux, and evaporation [
7,
8].
Lake surface area as the main role of SWBs’ features and their driving mechanisms are significant topics in water resource management, ecological environmental protection, and climate change response studies. Recently, with the increase in the number of bands in remote sensing imagery and the growing global demand for water resource research, large-scale extraction of water bodies has become a focal point. Studies by Chen Chen et al., Mo Guifen et al., and Wang Lixuan et al., based on Landsat TM/ETM+ and OLI remote sensing images, revealed the spatiotemporal dynamics of surface water areas in the Altai Mountain ice lakes, the Central Asian countries, and the Sichuan–Tibet transportation corridor glaciers and analyzed their driving forces. They showed that ice lakes in the Altai region are highly sensitive to climate change; surface water area changes in the Central Asian countries are mainly influenced by socio-economic factors, with climate factors having a negligible impact; glacier melting intensity in the Sichuan–Tibet corridor varies significantly at different altitudes, with accelerated glacier area retreat and simultaneous expansion of surface water area in the 4501–5000 and 5001–5500 m elevation ranges [
9,
10,
11]. Shi Jiancong et al. and Yuan Ruiqiang et al., based on Landsat series data, analyzed the spatiotemporal variations and driving factors of surface water in the Aral Sea basin and Inner Mongolia, showing a decreasing trend in the Aral Sea basin’s surface water area, mainly driven by temperature among climate factors, while surface water changes in Inner Mongolia are complex, caused by both climate and human activities, with human activities being the main factor in the reduction of surface water area and lake shrinkage [
12,
13]. Shunburiji et al., based on 2009–2018 HJ-1A/B remote sensing data, studied the changes in surface water area in various leagues (cities) of the Inner Mongolia Autonomous Region, showing that the surface water area in Inner Mongolia continuously increased from 2009 to 2013 and sharply decreased from 2013 to 2017, with rainfall, runoff, reservoir construction, landfilling, and river diversion all being driving factors of these changes [
14].
Existing research shows that the area of surface water bodies (SWBs) varies due to natural and climatic factors, exhibiting significant spatiotemporal differences. The Yellow River Basin is a critical area for China’s ecological security and water resource management, providing essential support for agriculture, industry, and the livelihoods of millions. Moreover, the basin showcases a variety of ecological environments and climatic conditions, serving as an ideal natural laboratory for understanding the complex interactions between water bodies and climate change. It includes areas with diverse precipitation patterns, from arid deserts in the upper reaches to more humid climates downstream, offering a unique opportunity to study the impact of different meteorological conditions on lake dynamics. Additionally, the Yellow River Basin is experiencing significant environmental changes due to natural processes and human activities, including climate change, water diversion, and land-use change, further highlighting the need for a comprehensive analysis of its lake ecosystems. Understanding the spatiotemporal variability of lake surface areas in this region and identifying the meteorological factors driving these changes are crucial for developing sustainable water resource management strategies and adapting to climate change impacts. Zhang et al. developed a new combined extraction rule to build an entire annual-scale open-surface water body dataset for 1986–2020 in the Yellow River Basin using all of the available Landsat images [
15], and Deng et al. used Landsat series images on the Google Earth Engine (GEE) platform, along with the HydroLAKES and China Reservoir datasets, to establish an extraction process for surface water bodies from 1986 to 2021 in the Yellow River Basin [
16].
Based on current SWBs’ surface area research, although extensive research has been conducted on the dynamics of SWBs’ surface area using remote sensing technology, current studies focus on annual scale changes, with relatively less attention given to the detailed characteristics, storage dynamics, and responses to climate change of SWBs on a monthly scale [
17,
18].
This is mainly attributed to the following limitations of remote sensing imagery: (1) Temporal resolution: Not all remote sensing satellites can provide the necessary temporal resolution to capture changes in lake area each month, and cloud cover and atmospheric conditions can limit the ability to obtain clear images [
19]. (2) Cloud cover and atmospheric conditions: one of the main limitations of optical remote sensing is cloud obstruction, which complicates the accurate identification of lake boundaries [
20]. (3) Image processing and data gaps: extracting water bodies from satellite imagery requires complex processing steps, and technical issues can lead to data gaps, affecting the creation of continuous monthly time series [
21]. (4) Seasonal variability and dynamic water surfaces: changes in lake areas are influenced by seasonal precipitation, evaporation, and human activities, requiring precise remote sensing data and complex hydrological models to capture these changes [
22]. (5) Spatial resolution: high-resolution imagery is necessary for monitoring changes in small lakes, but satellites with high-resolution imaging have lower coverage frequencies, which may not support monthly global monitoring [
23]. Therefore, monthly scale research on SWBs’ surface area based on optical imagery faces significant challenges. The presence of these issues poses significant challenges for current research on monthly scale surface water bodies’ (SWBs’) area time series based on optical imagery. To address these challenges, synthetic aperture radar (SAR) data, which can penetrate cloud cover, offers a viable alternative for water body detection methods that are not easily obstructed by clouds [
24]. This approach can be enhanced by integrating data from multiple satellite systems and utilizing advanced cloud-penetrating radar imagery. To address these challenges, SAR has become a valuable tool because it can penetrate cloud cover [
25]. The method of detecting water bodies using SAR data is not affected by cloud cover, allowing researchers to combine data from multiple satellite systems and use advanced radar imagery that can penetrate clouds. For example, researchers have analyzed global monthly scale surface water bodies’ (SWBs’) area using frequent, high-resolution C-band SAR observations provided by the Copernicus Sentinel-1 mission.
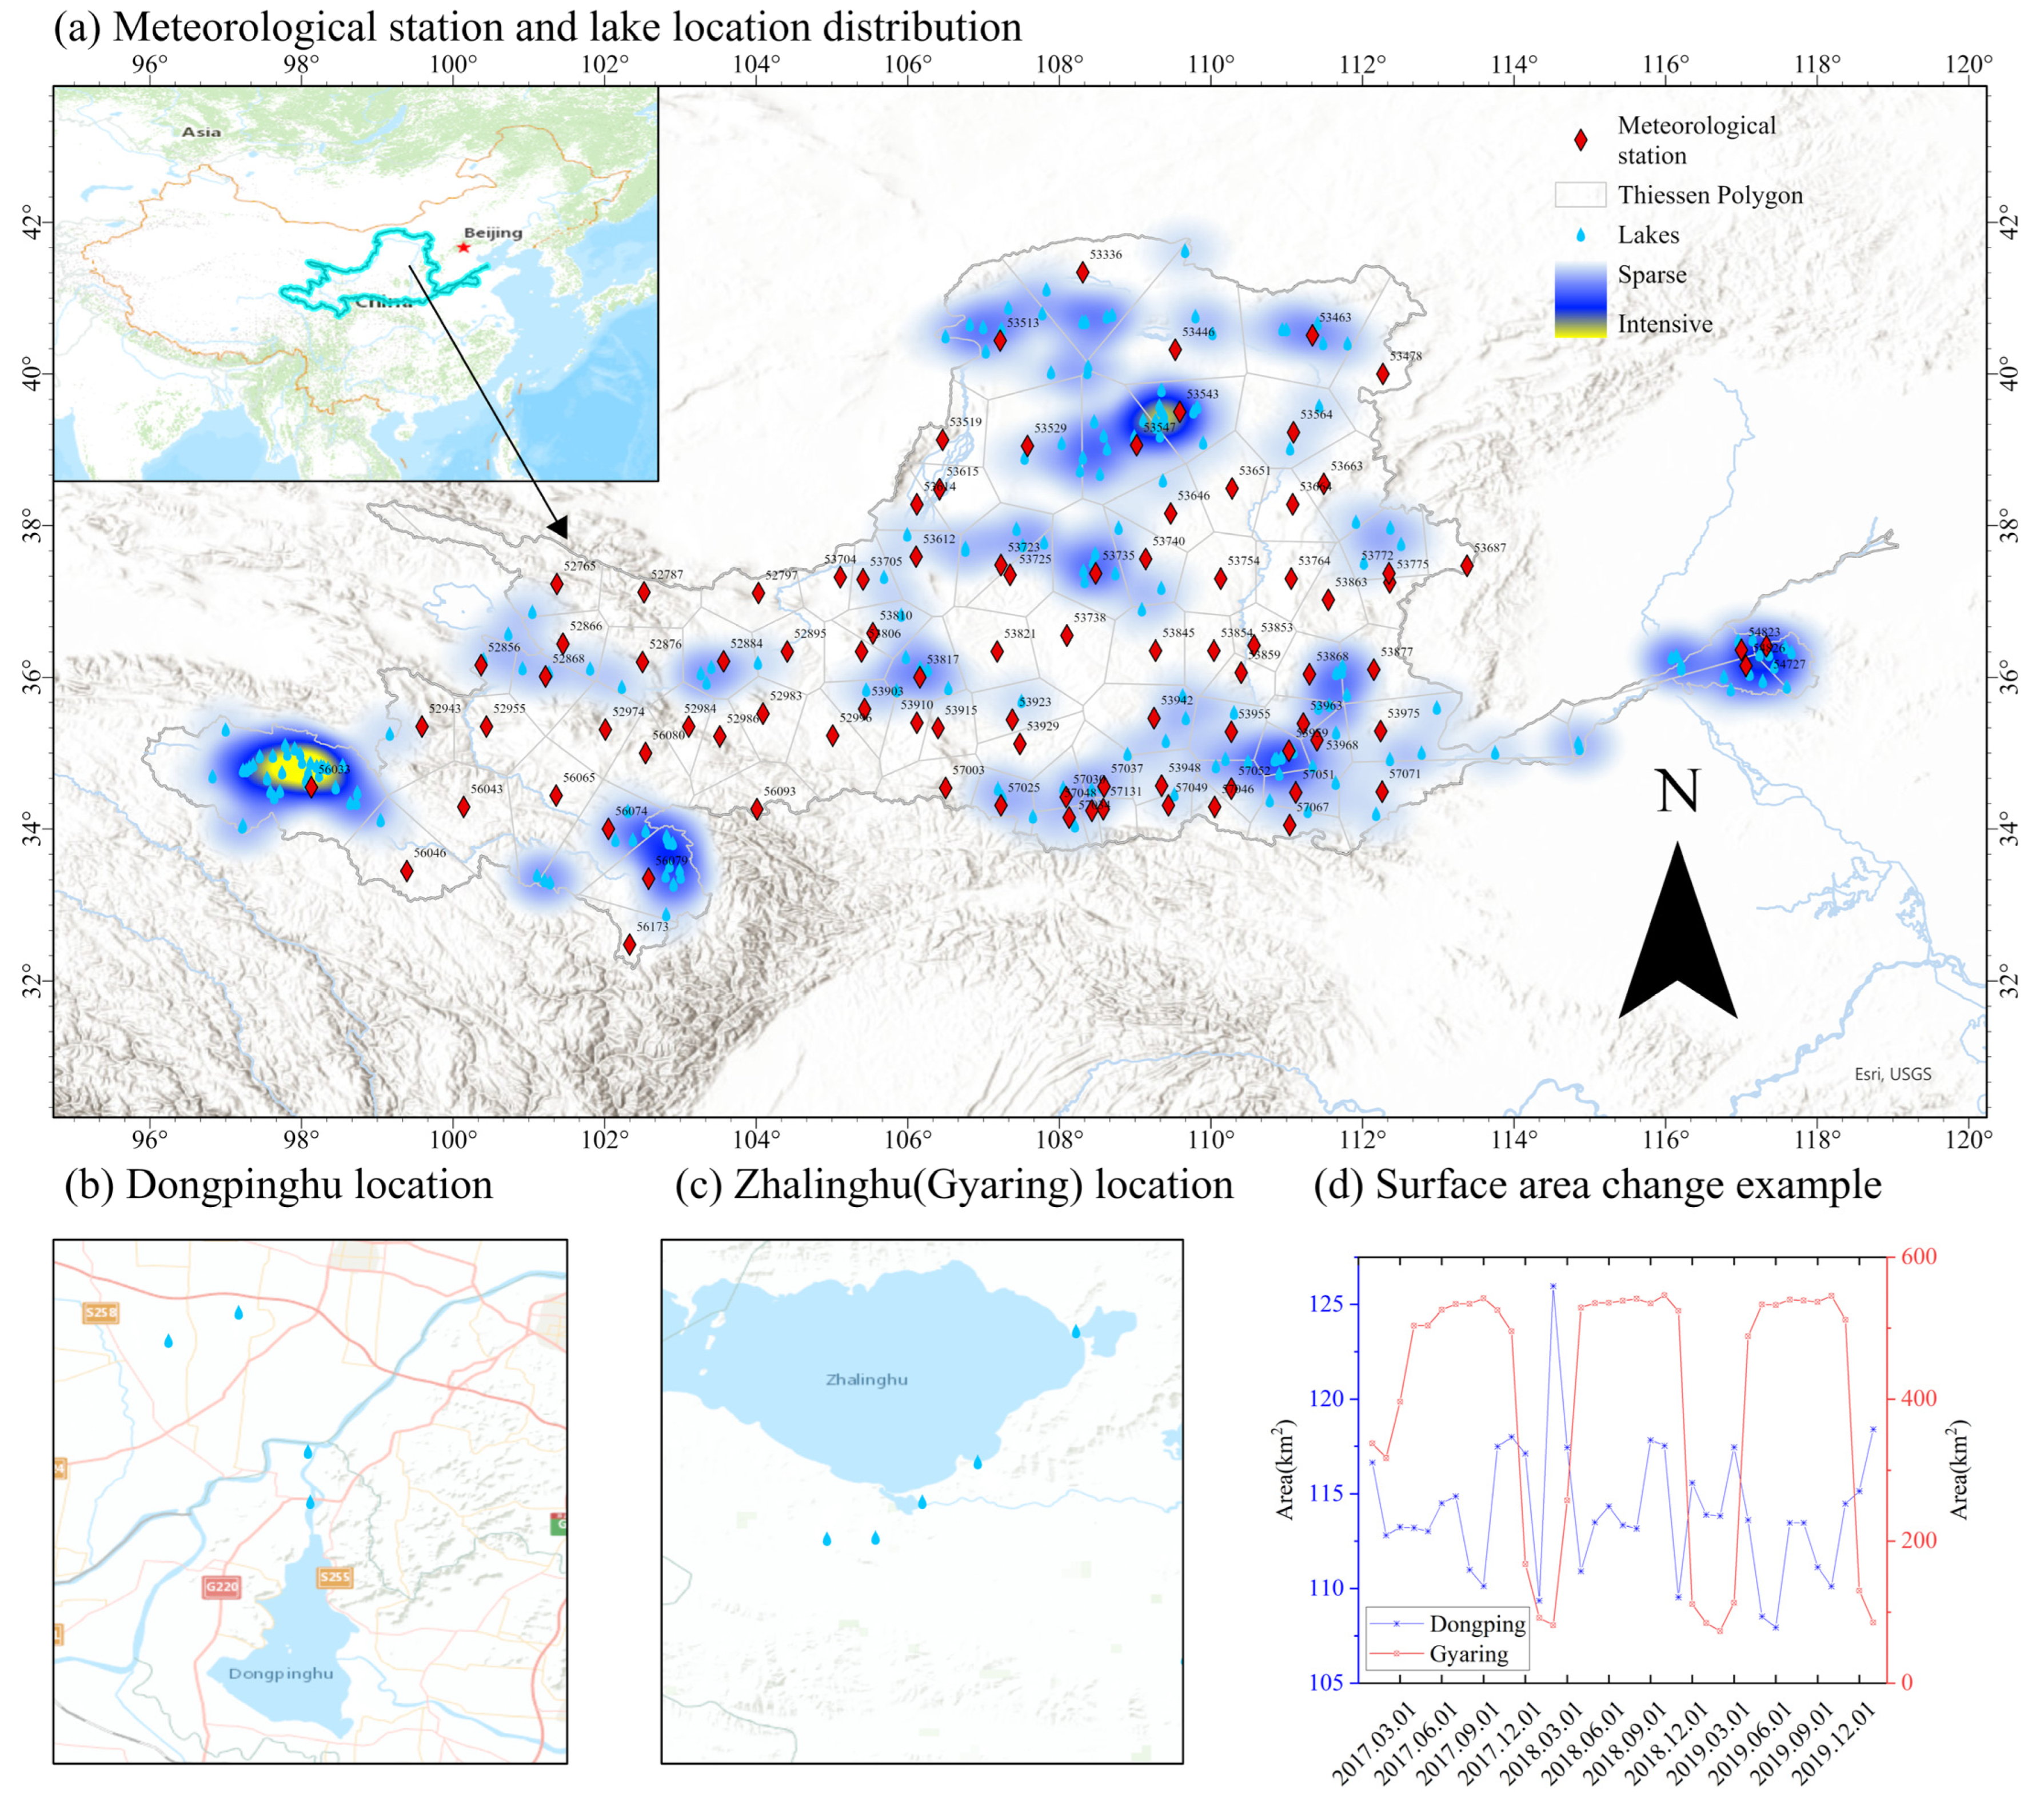
In summary, this study focuses on the Yellow River Basin in China, integrating previous research that utilized frequent, high-resolution C-band SAR observations from the Copernicus Sentinel-1 mission to analyze the lake surface area data of the Yellow River Basin, along with a meteorological dataset for the region. It aims to reveal the variability of lake water bodies in the Yellow River Basin and their climatic driving factors. The overall goal is to answer the following fundamental Earth science questions: What are the characteristics of monthly scale surface area changes in the Yellow River Basin? What are the meteorological driving factors behind the changes in natural lake surface areas, and how do they each contribute? The research findings are expected to provide valuable insights into the scientific understanding of hydrological and climatic processes in the Yellow River Basin, offering valuable information for policymakers and stakeholders involved in environmental protection and water resource planning in the region.
3. Results
3.1. Surface Area Characteristics of Lakes in the Yellow River Basin
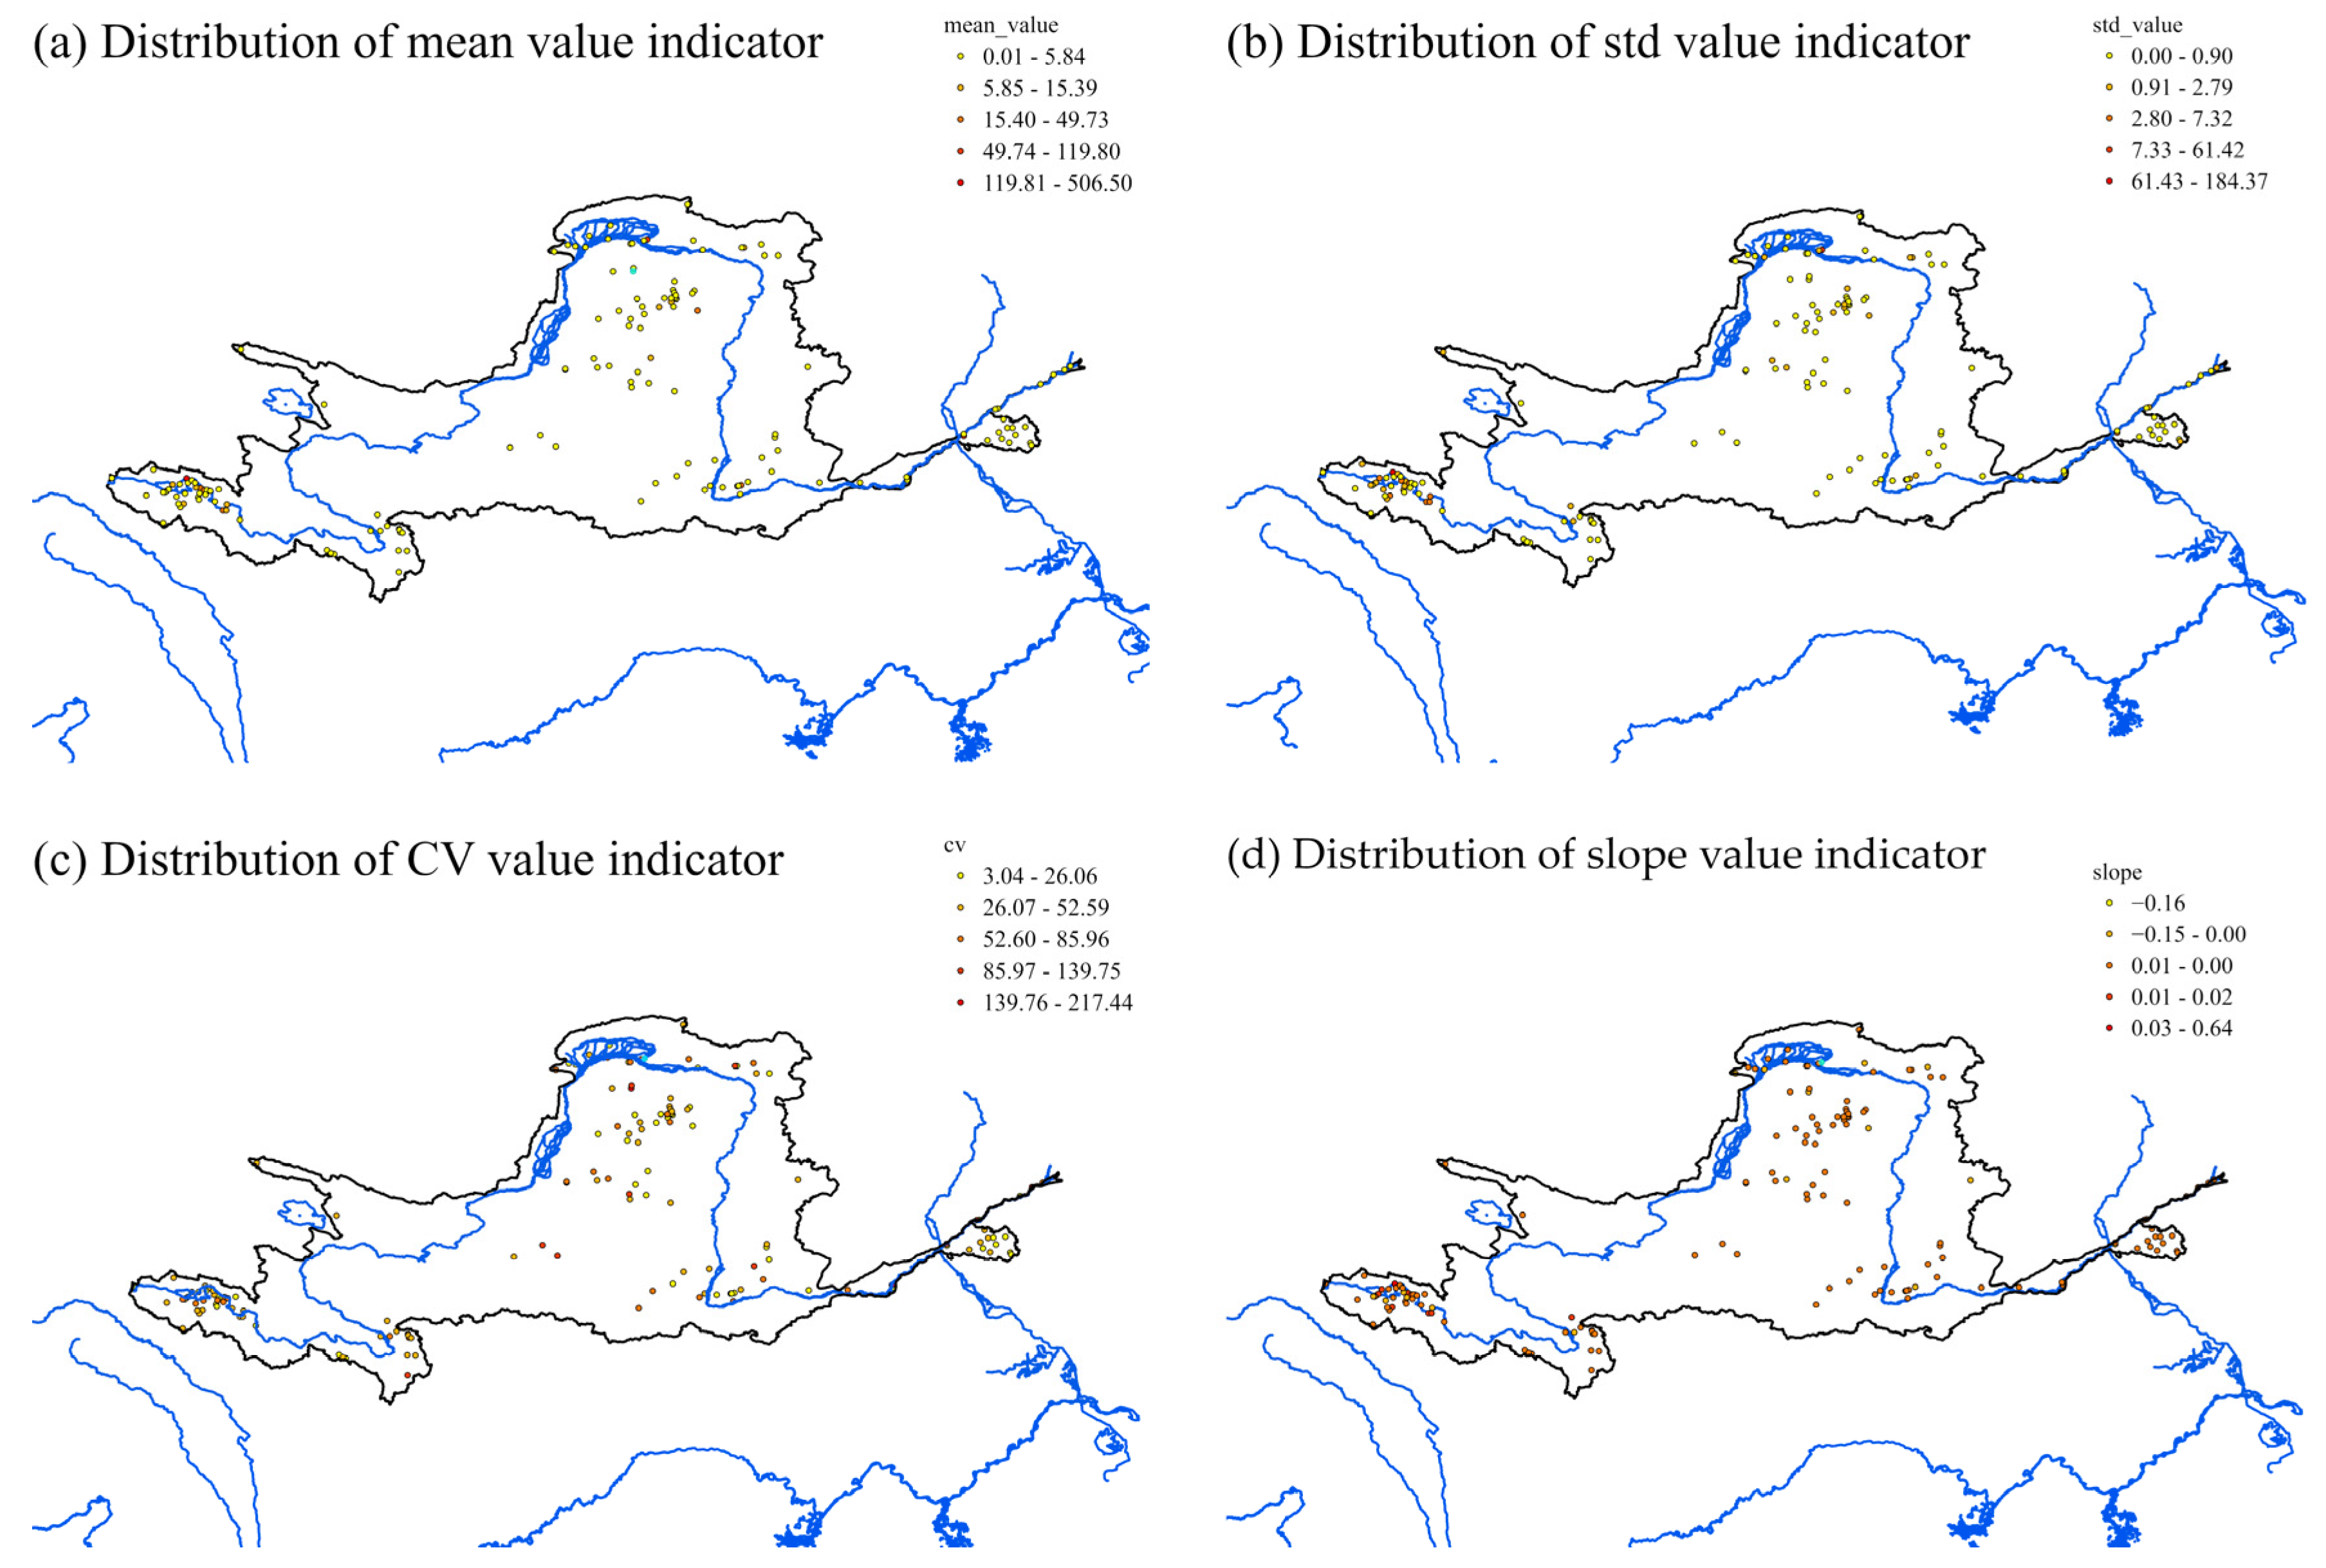
Figure 2 shows the spatial distribution characteristics of the mean surface area, standard deviation (std), coefficient of variation (CV), and slope of 151 natural lakes in the Yellow River Basin over 37 months.
In the Yellow River basin, the average lake area varies from 0.009 km
2 (HyLake_ID 174904) to 506.497 km
2 (HyLake_ID 1377: Ngoring) as illustrated in
Figure 2a. Larger average values are predominantly observed in the western plateau region, exemplified by HyLake_ID 1377: Ngoring and HyLake_ID 1385: Gyaring (403.265 km
2), reflecting the characteristic distribution of expansive lakes in the upper reaches of the Yellow River. Conversely, smaller average values are mainly found in the lower Yellow River and eastern areas, which may be associated with higher human activity and lower precipitation levels in these regions.
The standard deviation of lake area ranges from 0.003 km
2 (HyLake_ID 174904) to 184.372 km
2 (HyLake_ID 1385), with the spatial distribution of standard deviation exhibiting good consistency with the mean values (
Figure 2a,b). This consistency suggests that the physical size of lakes (mean surface area) and their variability over time (indicated by standard deviation) may be influenced by similar natural and anthropogenic factors, which affect the stability and variability of lakes on a large scale. For instance, larger lakes within broad geographic regions may be more exposed to the impacts of large-scale climatic pattern changes, such as seasonal fluctuations in precipitation, directly affecting lake surface areas.
The coefficient of variation, as a key indicator of the stability of lake area changes, spans widely in this dataset from 3.043 (HyLake_ID 1359) to 217.436 (HyLake_ID 172846) (
Figure 2c). This range not only reveals the relative stability differences in lake area fluctuations but also reflects the sensitivity of lakes to external environmental changes. Lakes with higher coefficients of variation, such as HyLake_ID 172846, HyLake_ID 173698, and HyLake_ID 174535, exhibit distinct spatial clustering characteristics, primarily concentrated in specific areas of the Yellow River basin: the Mu Us Desert and the Zhengzhou to Bohai segment of the river’s lower reaches. This distribution pattern not only reflects the regional characteristics of geographical and climatic factors’ impact on lake area changes but also suggests the presence of similar ecological conditions and hydrological dynamics in these regions.
During the study period in the Yellow River basin, the slope of lake area change trends exhibited significant variability, ranging from −0.161 (HyLake_ID 1314: Wu-liang-su) to 0.635 (HyLake_ID 1385: Gyaring) (
Figure 2d). This variation unveils the differing trends of lake area expansion or reduction over time within the region, reflecting the unique hydrological and environmental conditions of individual lakes. Specifically, lakes with a positive slope, such as Lake Gyaring (HyLake_ID 1385), demonstrated a noticeable increase in surface area during the observation period. This growth could be closely related to regional increases in precipitation, accelerated snowmelt processes due to rising temperatures, and other changes in the watershed’s hydrological cycle. These shifts indicate that some lakes are experiencing accumulations and expansions of water, which could have significant implications for local ecosystems and water resource management. In contrast, lakes with a negative slope, such as Wu-liang-su Lake (HyLake_ID 1314), showed a decreasing trend, possibly indicating water body shrinkage and lake degradation. This reduction could result from the overexploitation of water resources, such as irrigation and industrial water use, or due to climate change-induced decreases in precipitation and increased evaporation rates. These findings underscore the importance of sustainable water resource management and the urgent need for climate change adaptation strategies.
Analysis of the relationship models between various indicators and geographic coordinates (
Figure 3 and
Table 1) indicates that most indicators show either minimal explanation for data variability or lack statistical significance in relation to latitude and longitude. This may suggest that these indicators are less influenced by geographic coordinates or that other unconsidered factors are affecting them. Models of standard deviation against latitude, standard deviation against longitude, and slope against longitude revealed some statistical significance, especially the relationship between standard deviation (Std_value) and longitude, which was most pronounced. This suggests that data variability (standard deviation) and change trends (slope) might vary to some extent across different geographic locations.
3.2. Indicator Selection
Figure 4 presents the results of a principal component analysis (PCA) examining the correlations between various meteorological indicators and lake surface area, including a scree plot of the variance contributions of each principal component to the total dataset variance and a biplot. The analysis reveals that the first principal component (PC1) accounts for 55.16% of the variability in the data, and the second principal component (PC2) captures an additional 17.75%. When considering the three principal components (PC1–PC3) together, they account for 81.217% of the total variation in the dataset (
Figure 4a). This significant proportion suggests that these components are sufficient to represent the majority of the information and structure within the dataset, making them pivotal in understanding the underlying patterns.
Figure 4b illustrates the distribution of sample scores along the first principal component (principal component 1, horizontal axis) and the second principal component (principal component 2, vertical axis). The biplot in
Figure 4b displays the dispersion of samples primarily along the horizontal axis, captured by PC1, which accounts for the largest proportion of variability. In contrast, PC2 reveals the second-largest proportion of variability along the vertical direction. PC3 offers an additional perspective on the distribution of data points in the depth dimension (
Figure 4c).
In terms of component loadings, 20-20 hourly precipitation (mm) and #maximum daily precipitation (mm) exhibit high loadings on PC1, indicating their significant contribution to this component. For PC2, variables such as hours of sunshine and maximum wind speed (m/s) demonstrate high loadings, signifying their pivotal role on this axis. On PC3, minimum relative humidity (%) and average 2-minute wind speed (m/s) show high loadings (
Table 2).
After evaluating the contributions of individual variables to each principal component, this study identifies the top two variables with the highest loadings from each of the three principal components analyzed, totaling six primary indicators for subsequent spatiotemporal correlation and modeling analyses.
3.3. Correlation Analysis
Taking Lake HyLake_ID 1377 (Ngoring, mean area = 506.500 km
2) and HyLake_ID 174771 (mean area = 2.960 km
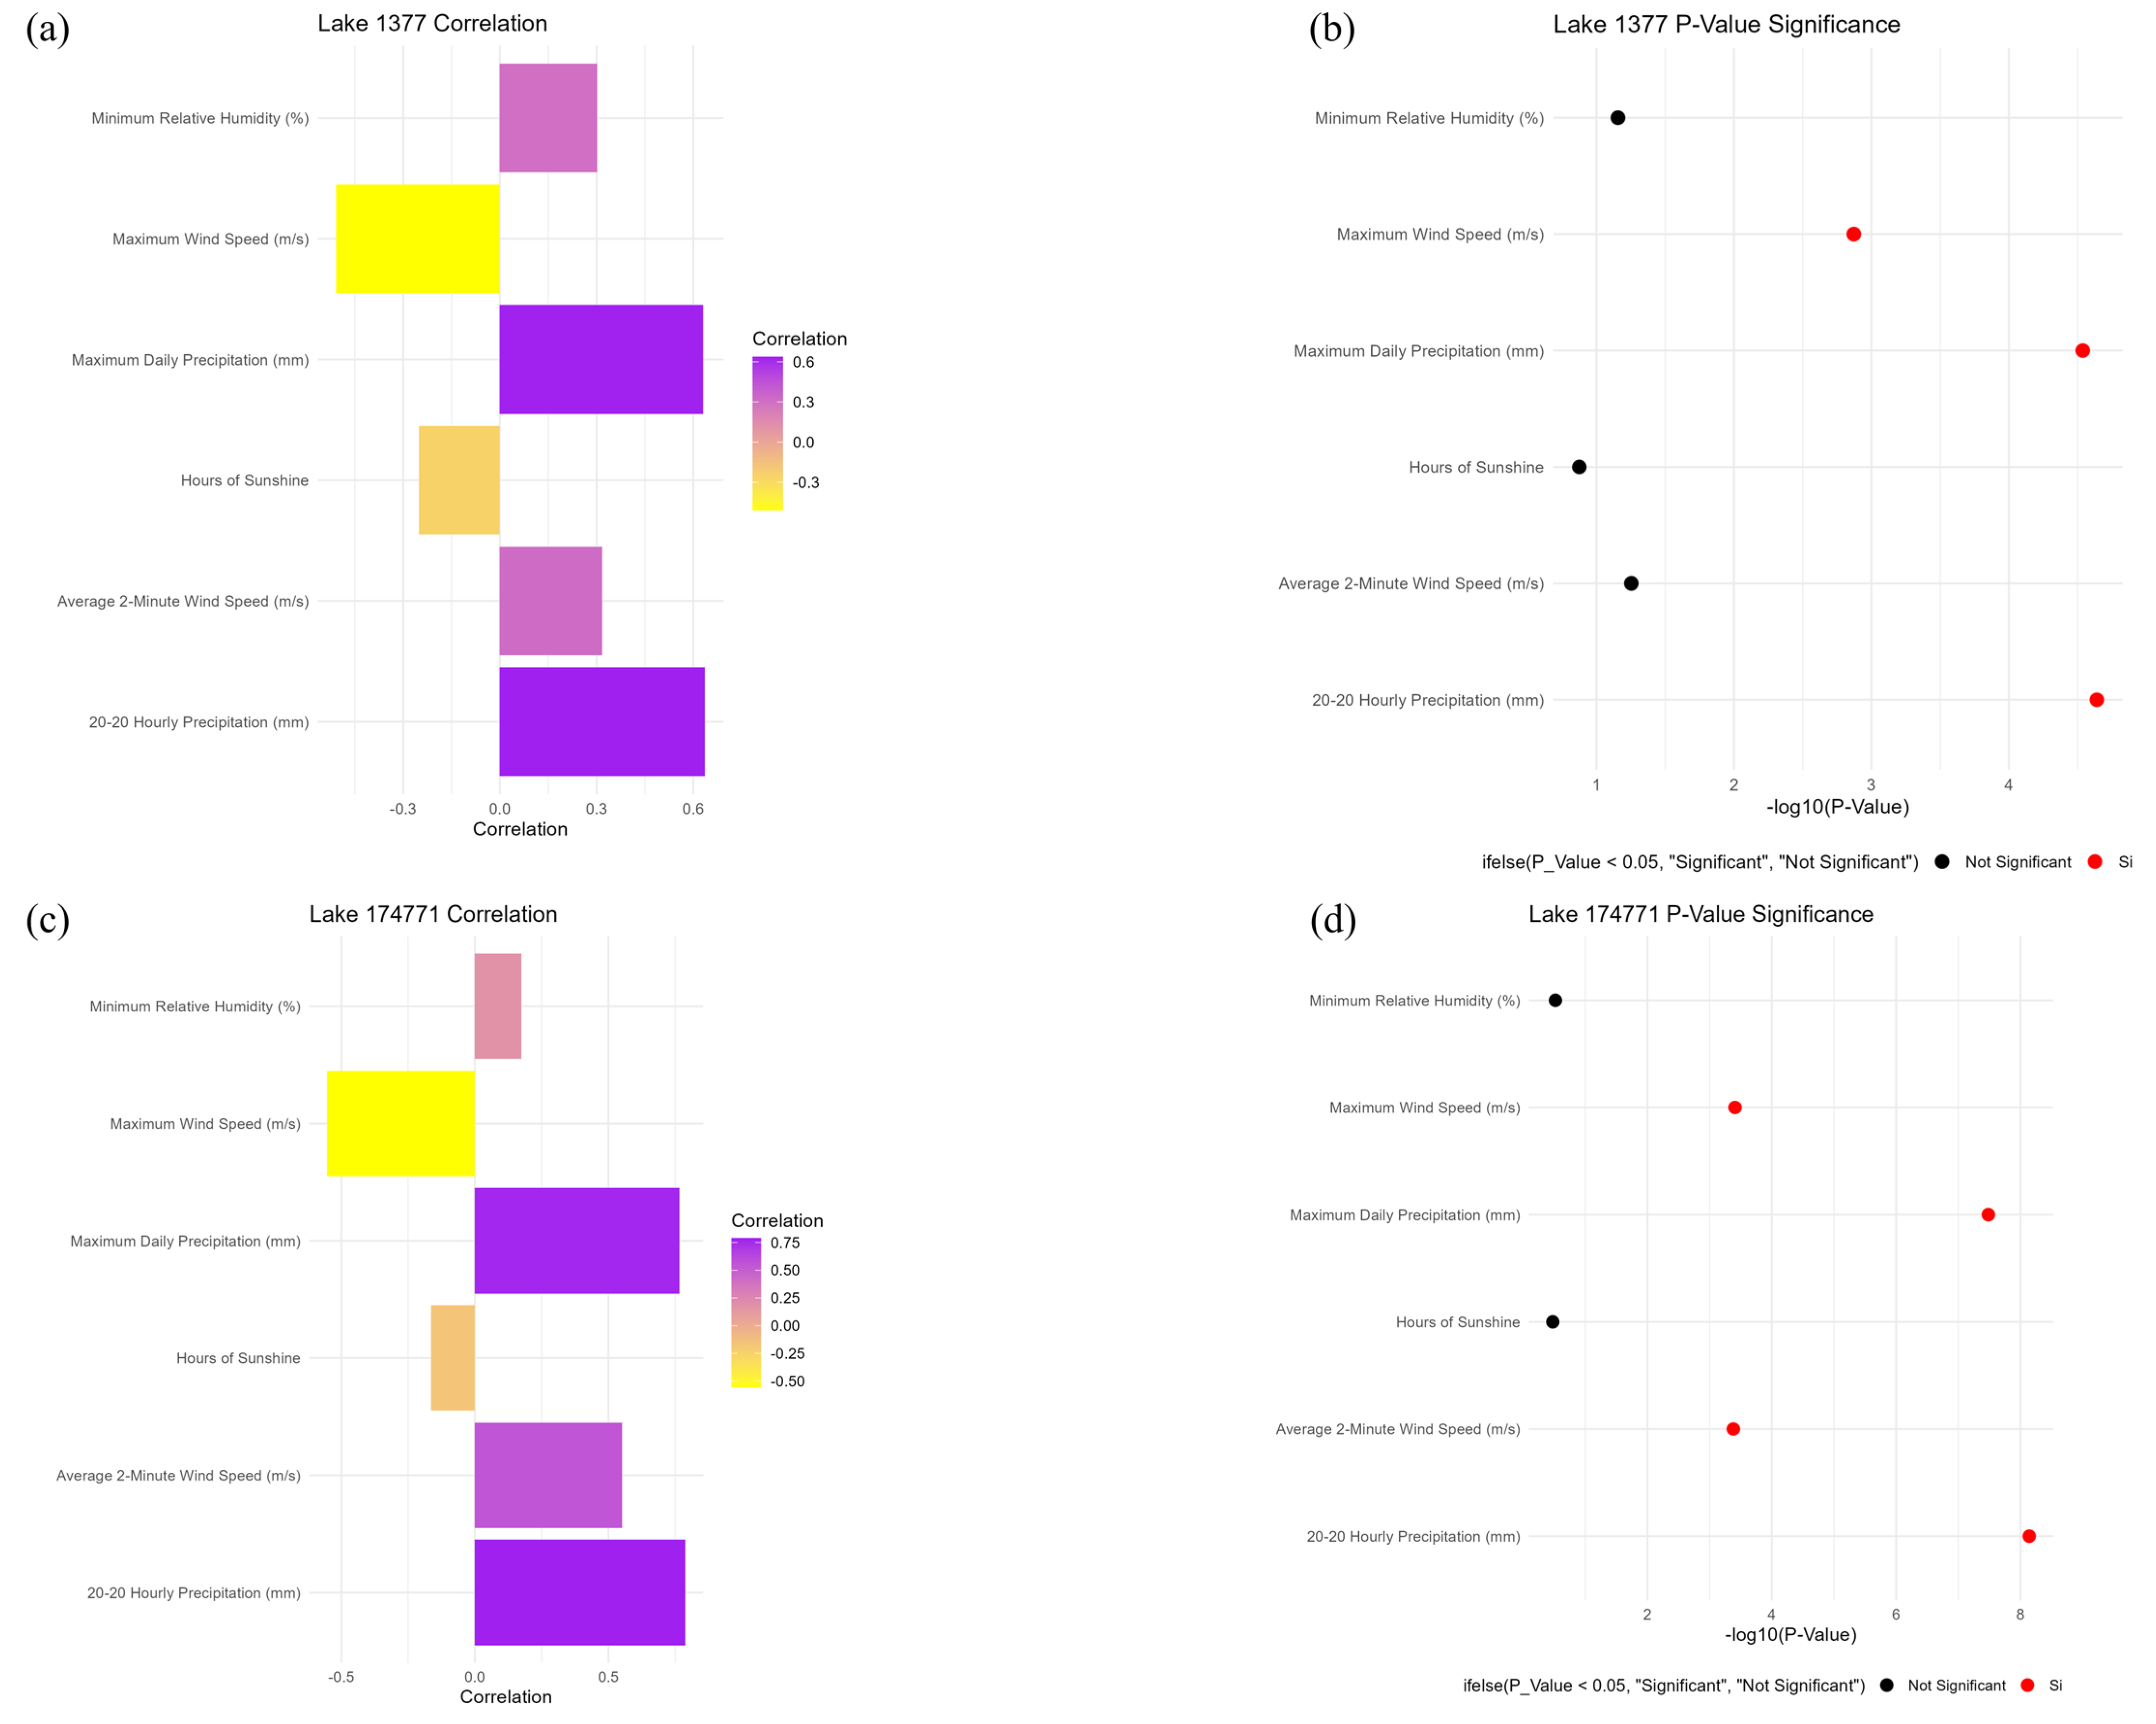
2) as examples, the analysis demonstrates significant correlations between meteorological factors and lake surface areas for these distinct environments (
Figure 5).
For HyLake_ID 1377, there is a strong positive correlation between “20-20 hourly precipitation” and the lake surface area, with a correlation coefficient of 0.6364 and a p-value < 0.01, suggesting that increased precipitation is associated with an expansion of the lake surface area. Conversely, “maximum wind speed” shows a moderate negative correlation (correlation coefficient of −0.508, p-value < 0.01), indicating that higher wind speeds may be associated with a reduction in lake surface area. Other meteorological factors, such as “hours of sunshine” and “maximum daily precipitation”, also show strong positive correlations with the lake surface area, with correlation coefficients of 0.6303 (p-value < 0.01) and 0.3015 (p-value = 0.070), respectively. However, the correlation between “minimum relative humidity” and lake surface area is weaker, with a correlation coefficient of 0.3015 and a p-value of 0.070, suggesting a less significant relationship.
Similarly, for HyLake_ID 174771, significant correlations are observed between meteorological factors and lake surface area. “20-20 hourly precipitation” shows a strong positive correlation with the lake surface area (correlation coefficient of 0.788, p-value < 0.01), reinforcing the idea that precipitation is a critical factor in lake surface dynamics. Unlike Lake 1377, “maximum wind speed” for Lake 174771 exhibits a slightly weaker negative correlation with the lake surface area (correlation coefficient of −0.553, p-value < 0.01), which may indicate a different impact of wind on smaller lakes. Furthermore, “hours of sunshine” and “maximum daily precipitation” have substantial positive correlations with the lake surface area, with correlation coefficients of 0.766 (p-value < 0.01) and 0.1745 (p-value = 0.302), respectively. The correlation between “minimum relative humidity” and lake surface area, similar to Lake 1377, remains weaker and not significant, with a correlation coefficient of 0.175 and a p-value of 0.302, indicating minimal impact on the lake’s size.
These findings suggest that, despite the considerable size difference between Lakes 1377 and 174771, both lakes exhibit similar trends in the influence of meteorological factors on their surface areas. 20-20 hourly precipitation, maximum daily precipitation and maximum wind speed significantly impact lake surface areas, whereas wind speed shows moderate negative correlations, and relative humidity appears to have minimal effects.
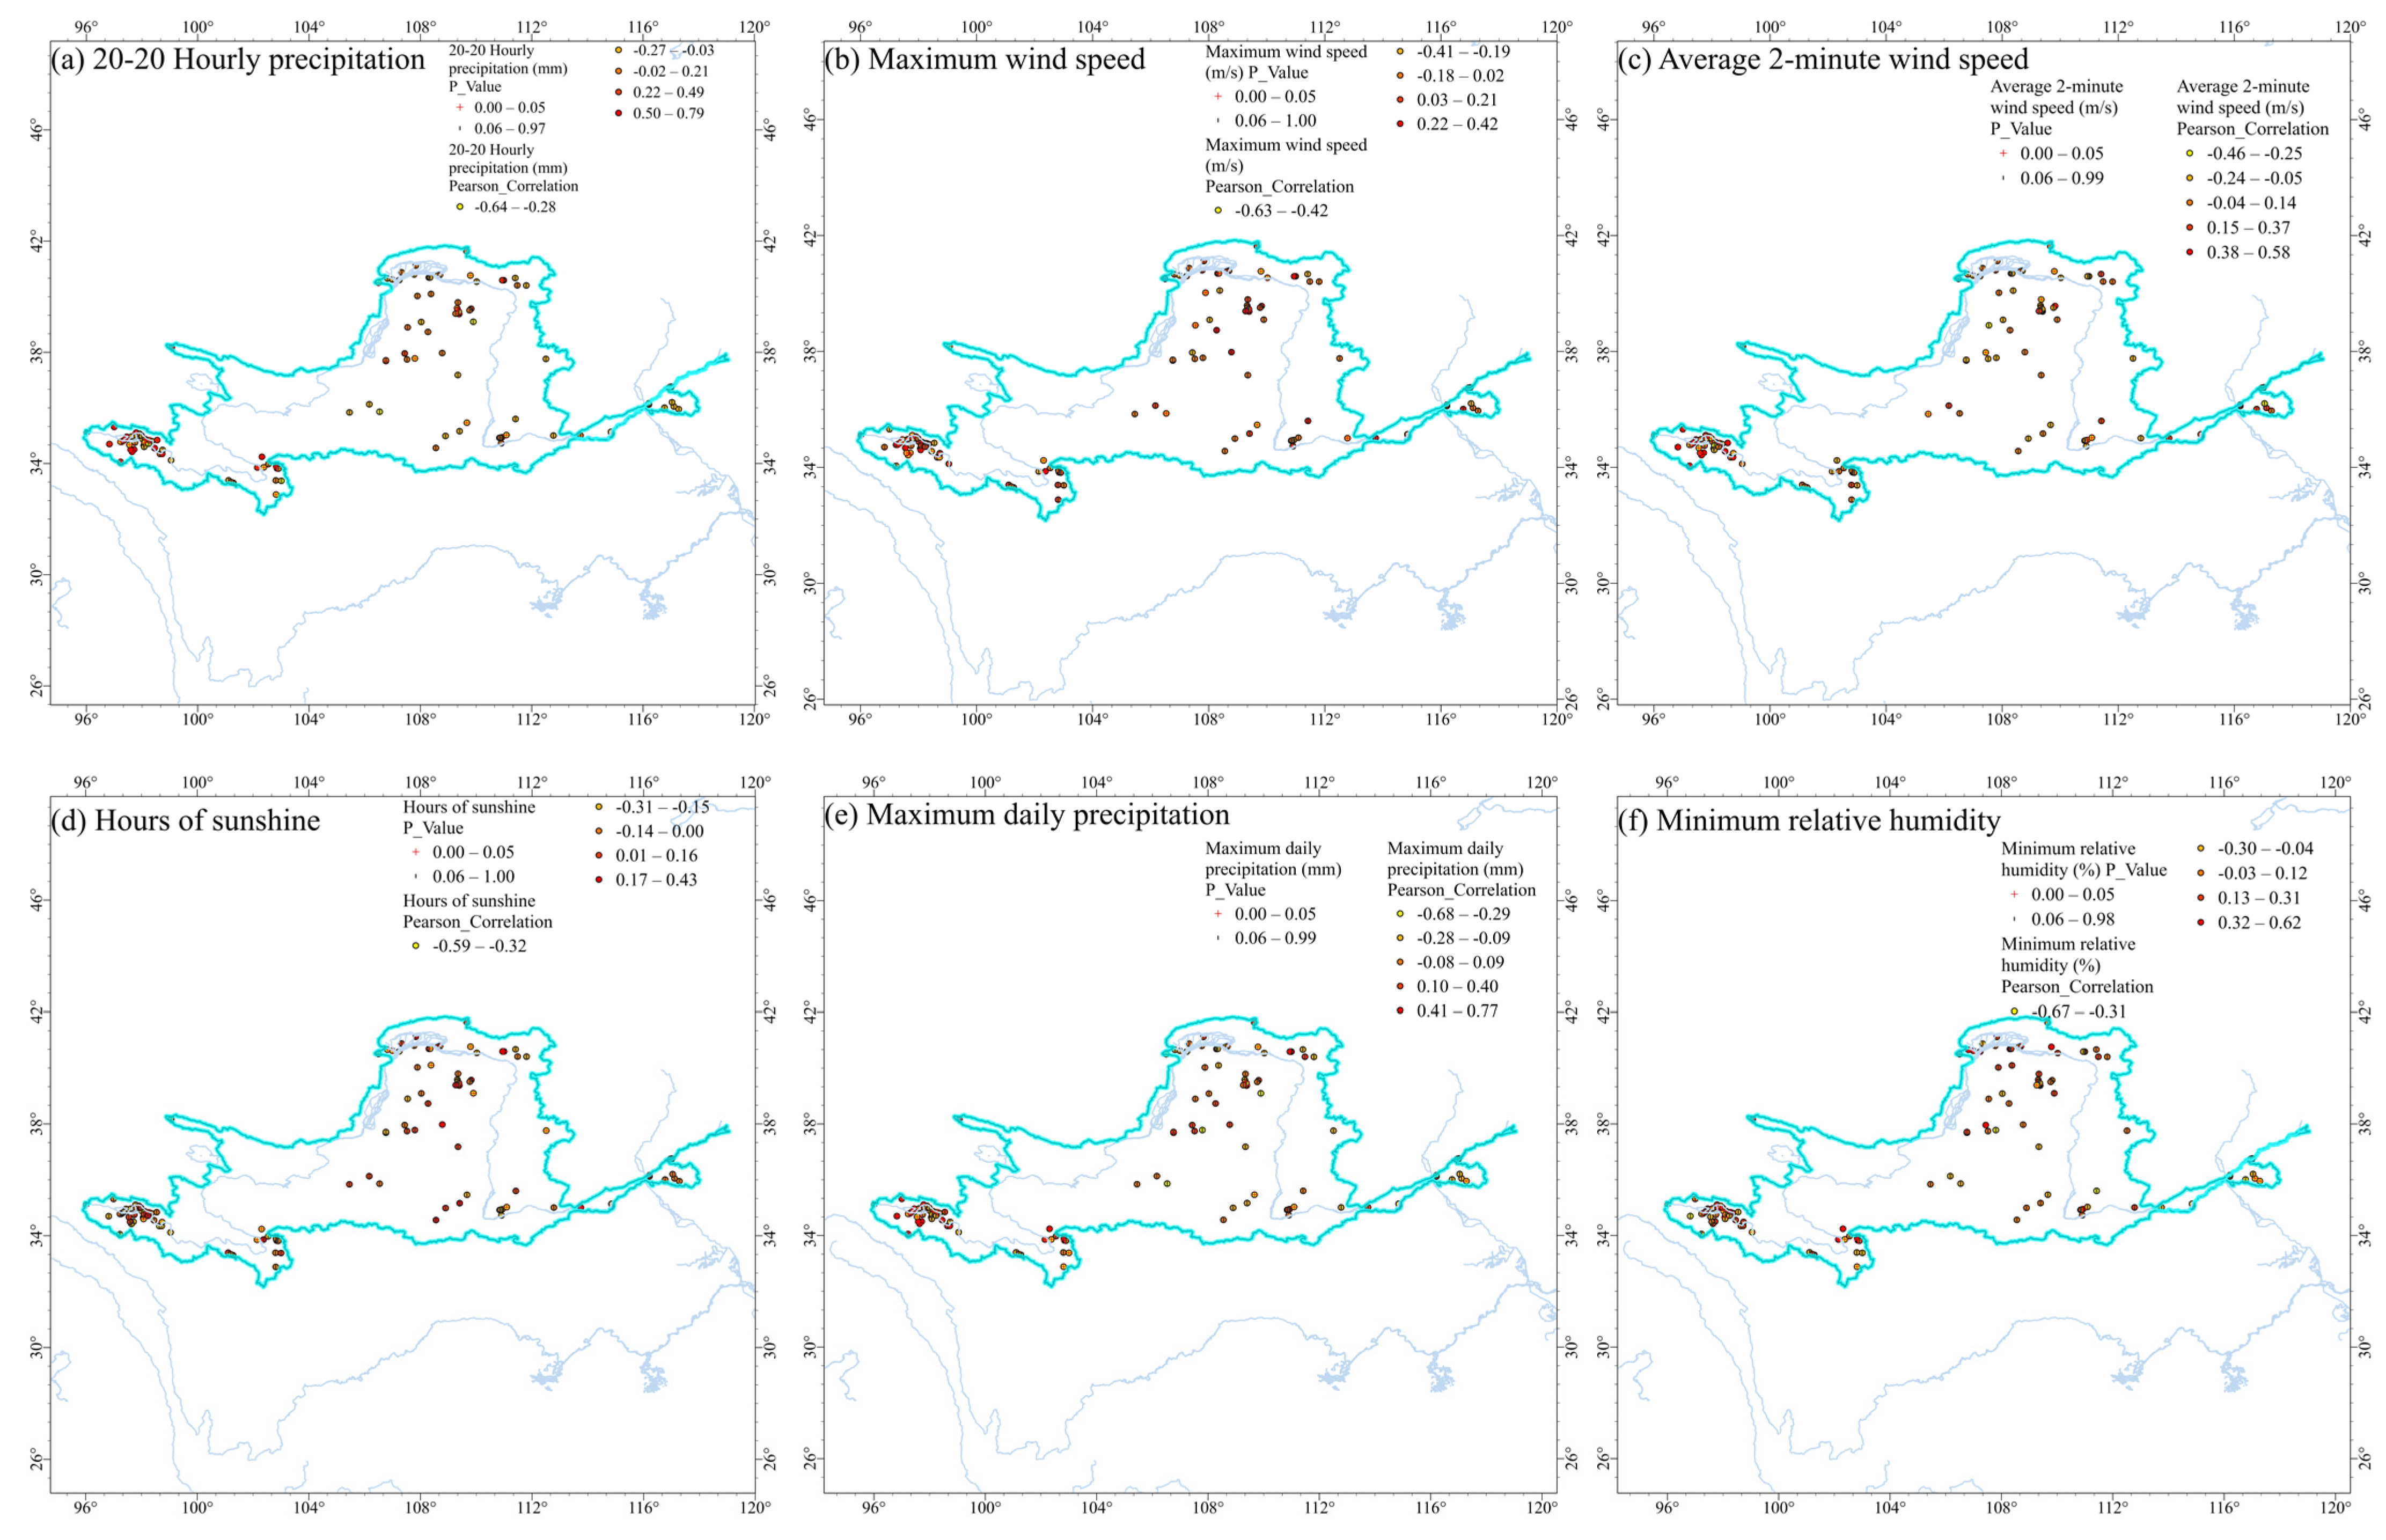
To elucidate the spatial distribution characteristics of the correlation and significance between lake surface areas and meteorological factors in the Yellow River Basin, we created a distribution map showing the correlation and significance between lakes in the Yellow River Basin and changes in meteorological factors, as illustrated in
Figure 6. For the 20-20 hourly precipitation (mm), among 118 lakes, 38 exhibited significant correlations, with 22 positively correlated (correlation coefficients ranging from 0.41 to 0.79, average 0.59) and 16 negatively correlated (correlation coefficients ranging from −0.36 to −0.64, average −0.43). Spatially, lakes in the source region of the Yellow River generally showed a significant positive correlation. For maximum wind speed (m/s), 28 lakes showed significant correlations, with five positive and twenty-three negative correlations (correlation coefficients ranging from −0.34 to −0.63, average −0.47), indicating an overall negative correlation between lake surface area and maximum wind speed. For average 2-minute wind speed (m/s) and hours of sunshine, 25 and 22 lakes, respectively, showed significant correlations without a clear pattern. For maximum daily precipitation (mm), 36 lakes had 21 showing a positive correlation, indicating a positive correlation between lake surface area and daily precipitation in larger lakes. For minimum relative humidity (%), 24 lakes exhibited significant correlations but without a discernible pattern.
3.4. Multivariate Regression Analysis
Taking Lake HyLake_ID 1377 (Ngoring, mean area = 506.500 km
2) and HyLake_ID 173250 (mean area = 1.620 km
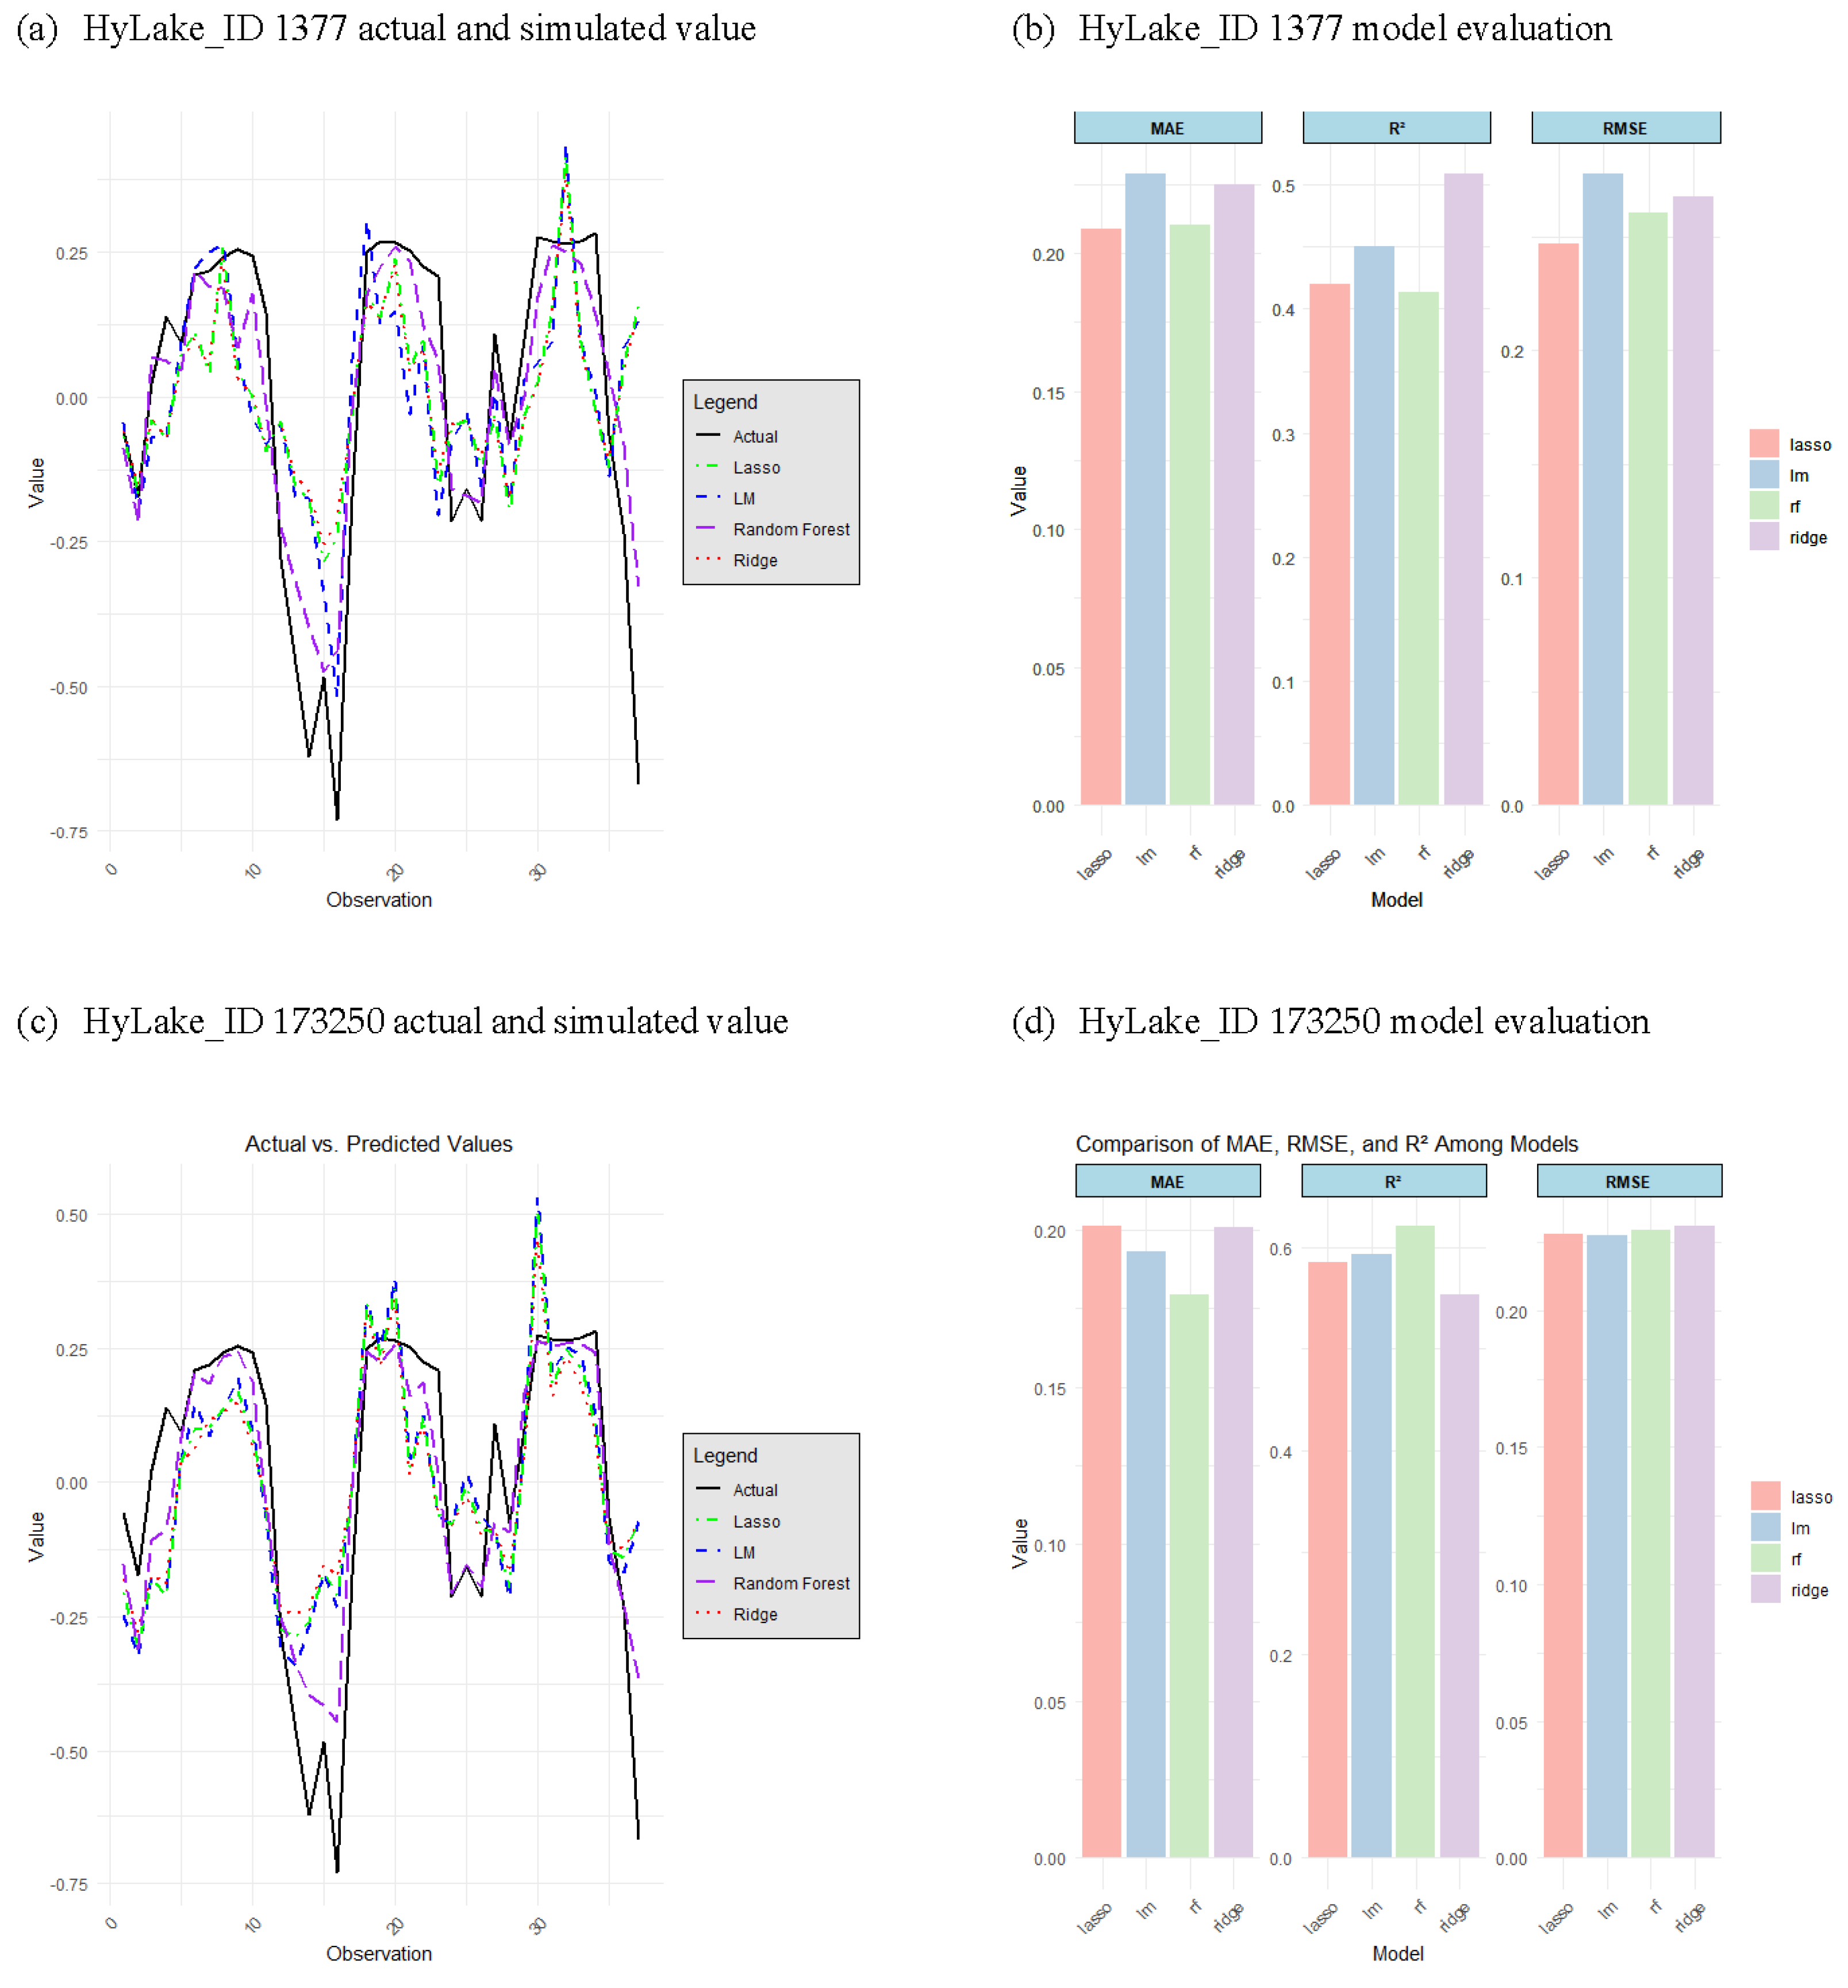
2) as examples, the model analysis results are presented in
Figure 7. For HyLake_ID 1377, the lasso model demonstrates the lowest average root mean square error (RMSE) of 0.247, outperforming other models in this analysis. Its consistent and low error rate across different validation sets indicates superior stability and generalization ability. In contrast, for HyLake_ID 173250, the linear regression model achieves the lowest average RMSE of 0.227, marking it as the best performer in this instance. This comparison highlights the variability in model responses across different lakes within the basin, underscoring the importance of model selection tailored to specific lake characteristics.
Figure 8 reflects the optimal model fitting results for the surface area of lakes in the Yellow River Basin. The random forest (RF) model performs best in 65 lakes, demonstrating its superiority in dealing with the relationship between the surface area of lakes in the Yellow River Basin and meteorological factors. The strength of the random forest model lies in its ability to handle a large number of input variables and automatically select variables, thus providing deep insights into complex data relationships. Ridge regression is best for 28 lakes, indicating that the introduction of L2 regularization can effectively improve the model’s predictive accuracy and stability when data exhibit multicollinearity. Lasso regression performs best for 20 lakes; its use of L1 regularization helps in simplifying variables and enhancing the model’s interpretability, which is particularly important in determining the impact of key meteorological factors on the changes in lake surface area. Although the linear model is only best for four cases, it remains the foundation for analyzing linear relationships, providing us with an initial benchmark for model comparison (
Figure 7a). These results suggest that nonlinear models (such as RF) might be more suitable for capturing the complex dynamic relationships between the surface area of lakes in the Yellow River Basin and meteorological factors. The random forest model provides the best fit due to its ability to handle a large number of feature variables and consider their interactions, thereby offering the best fitting effect. Meanwhile, regularized linear models (lasso and ridge) demonstrate robustness in datasets with high multicollinearity, which is crucial for reducing model overfitting and improving prediction accuracy.
In comparing the fitting results of the average surface area of lakes in the Yellow River Basin across different models, the Lasso model exhibits relatively lower average surface area values, with data points primarily clustered in the lower range and with relatively minor dispersion. The linear model (LM) results show a wider distribution, with data points stretching from values close to 0 up to higher values, though most remain concentrated in the lower range of average surface area. The random forest (RF) model outcomes are scattered across the entire range of values, with a notably higher outlier point visible in the graph, suggesting that the random forest model may predict larger average lake surface areas in certain cases. The ridge regression (ridge) model displays relatively greater variability, with data points concentrated across various average surface area values, including some higher ones (
Figure 7b). Overall, there are certain disparities in the fitting effects of the models on the average surface area of lakes in the Yellow River Basin.
4. Discussion
This study conducts a comprehensive analysis of the variability of lake surface area in the Yellow River Basin and its influencing factors through the integrated application of spatial distribution analysis, principal component analysis (PCA), correlation analysis, and multiple regression models. Due to the abundance and accessibility of precipitation and temperature data, many studies have identified precipitation and temperature as the primary climatic factors, demonstrating their significant impact on lake surface area [
32,
33,
34]. Our research further selects the main factors from a large set of meteorological factors, identifying maximum wind speed (m/s), average 2-minute wind speed (m/s), hours of sunshine, and minimum relative humidity (%) as key elements affecting changes in lake surface area. It quantifies the specific impact of these main meteorological elements on lake area and establishes regression models to analyze the combined effects of multiple meteorological factors.
Previous studies on changes in lake surface area often focused on uniform change patterns within a large scale, such as considering the variations over many years, while research on how monthly-scale meteorological conditions affect lake systems based on high-resolution C-band SAR observations from the Copernicus Sentinel-1 is relatively scarce [
35,
36]. Our study captures the rapid response of lake surface area to seasonal meteorological condition changes. This fine-grained temporal-scale analysis provides a more acute and timely understanding of the hydrological cycle and ecosystem changes in lakes, aiding in a better comprehension of the short-term responses of lakes to climate change.
This discovery of a negative correlation between lake area and maximum wind speed prompts a deeper consideration of how lake ecosystems respond to climatic factors. This negative correlation may reflect the influence of climatic conditions around the lake on the lake’s hydrodynamics and hydrological processes. Firstly, the negative correlation could be associated with evaporation from the lake surface. Under conditions of higher wind speeds, the rate of evaporation from the water surface may increase, leading to a decrease in water levels or increased evaporation, which could result in a reduction in lake area, thereby showing a negative correlation with maximum wind speed [
37,
38]. Secondly, higher wind speeds are often associated with cyclonic systems in the climate, which can be accompanied by precipitation events [
39]. During precipitation, lake water levels might rise, causing an expansion of lake area [
40]. Therefore, the negative correlation between lake water levels and wind speed might reflect these climate-driven hydrological processes, where lake water level changes are influenced by both wind speed and cyclonic systems. In summary, the negative correlation between lake water bodies and maximum wind speed indicates the sensitivity of lake ecosystems to climatic changes. Further research could explore how lake hydrological processes are affected by climate change and extreme weather events, and how these changes impact the stability and functionality of lake ecosystems.
Analysis of the results from our models shows differences in the capacity to fit relationships between lake surface area and meteorological factors across the Yellow River Basin due to the individual differences in lakes as entities within ecosystems. It is challenging to explain their internal variation rules with a unified regional-scale model. Our study focuses on individual lakes within the research scale, establishing specific surface area change meteorological driving models for different lakes, highlighting the individual differences in each lake as an independent ecosystem. This approach overcomes the problem of unified regional-scale models failing to explain all lakes’ internal variation rules. By customizing models for each lake, our method provides a basis for implementing targeted environmental management strategies. This customized approach is more likely to successfully address the specific issues faced by particular lakes, thereby improving resource utilization efficiency and conservation effects.
Despite providing new insights into the variability of lake surface areas in the Yellow River Basin, we also recognize the limitations of our study. Firstly, although we considered multiple meteorological factors in our models, the lack of consideration for anthropogenic factors and other potential influences, such as contributions from groundwater flow and ice/snow melt to lake water volumes, were not covered in this analysis. Secondly, due to limitations in climate models and data acquisition capabilities, predictions of lake area changes under future climate change scenarios remain uncertain. Future research should aim at more refined models and more comprehensive data collection to reveal these complex dynamic processes.
