Abstract
Rainfall runoff may be captured and stored for later use, but the quality of this water can be detrimental in some uses without the use of appropriately designed first-flush diverters. The rainfall runoff water quality was measured on nineteen new small-scale and two aged commercial roofs located near high traffic highways. Roof coverings included asphalt shingles, sheet metal, clay tiles, and tar and gravel. Runoff samples were evaluated for polycyclic aromatic hydrocarbons (PAHs), phosphorus flame retardants (PFRs), and pyrethroid insecticides. Eighteen small-scale roofs were subjected to a range of simulated rainfall events, while natural runoff was sampled on the commercial roofs and one small-scale roof. Runoff was analyzed for pH, conductivity, turbidity, total suspended solids, boron, iron, copper, zinc, manganese, sodium adsorption ratio, nitrate-nitrogen, seventeen PAHs, tris(2-chloroethyl) phosphate, tris(1,3-dichloro-2-propyl)phosphate, bifenthrin, cypermethrin, and lambda-cyhalothrin. Samples from four natural storm events were also analyzed for total coliforms and Escherichia coli. In addition, soils below seventeen existing gutter downspouts were sampled to determine long-term pollutant accumulation. Atmospheric deposition was the main contributor of pollutants in the roof runoff. A majority of samples fell within the U.S. EPA guidelines for non-potable urban and agricultural water reuse. Trace levels of PAHs, PFRs, and insecticides were detected, but all detections were three orders of magnitude below the USGS health-based screening level benchmark concentrations. Results indicate that diverting the first flush, based on turbidity, total suspended solids, or conductivity, can improve the overall water quality and reduce the concentrations of PAHs in harvested rainwater. Downspout soil sampling showed potential for the long-term accumulation of PAHs at concentrations exceeding the minimum human-health risk-based screening levels at these high runoff-loading locations.
1. Introduction
Rainwater harvesting captures and stores rainwater for later use. As rainwater harvesting gains popularity worldwide as both a non-potable and potable source of water, the quality of the runoff is of increasing concern for end users. Roof runoff is considered to play a significant role in contributing to and serving as a pathway for nonpoint source pollution in urban runoff [1,2,3]. Metals, cations, and nutrients can be leached from the roofing material [2,3,4,5], while elevated concentrations of zinc in roof runoff can have detrimental effects on local ecosystems [6]. Metal concentrations are also of concern when using harvested rainwater for irrigation, as there is potential for metal buildup in the soil [5,7]. In Australia, areas with low population densities rely on rainwater harvesting as the primary source of drinking water [8]. Rooftop rainwater harvesting also provides potable water in many developing countries. When using harvested rainwater as a potable source of water, heavy metals, trace organic pollutants, and microbiological contamination are of concern [9]. There are many variables that affect the overall water quality in harvested rainwater, including roof type, age, location (i.e., urban, rural), care and maintenance, industrial treatments, local climate, orientation, slope, atmospheric pollution, the antecedent dry period, and surrounding vegetation [4,10,11,12,13,14]. While the roofing material itself can be a source of pollutants, atmospheric deposition is often the main contributor of pollutants in roof runoff [1,15,16,17,18,19].
Polycyclic aromatic hydrocarbons (PAHs) are ubiquitous in the environment and are formed primarily through the incomplete combustion of biomass and fossil fuel [20]. PAHs are of concern due to their toxicity, mutagenicity, carcinogenicity, and bioaccumulation potential [21]. PAHs are hydrophobic compounds that can sorb onto particulates, which may then be transported by water on suspended sediment or through the air on dust particles [22]. Numerous studies have observed PAHs in urban runoff, including roof runoff [1,3,12,19,23,24,25,26,27].
Phosphorus flame retardants (PFRs) are also contaminants of concern that are observed in urban runoff, including roof runoff [28,29,30,31]. PFRs were proposed as alternatives to brominated flame retardants (BFRs),k due to BFRs persistence and toxicity in the environment and bioaccumulative properties. However, PFRs have been shown to exhibit some of the same characteristics as BFRs [28]. Tris(2-chloroethyl) phosphate (TCEP) is a chlorinated PFR and plasticizer used in polyvinyl choride (PVC), cellulose, coatings, polyester resins, textiles, and polyurethane foam. TCEP is toxic to aquatic organisms and has been identified as a potential human carcinogen by the European Union (EU) [29]. While TCEP has slowly been phased out of use, it is still present in the environment [30,31]. Tris (1,3-dichloro-2-propyl) phosphate (TDCPP) is another chlorinated PFR found in plastic, textiles, and polyurethane foam [28]. TDCPP has limited degradation in natural waters and meets the criteria to be persistent or very persistent in the environment by the EU yet does not meet the criteria of being bioaccumulative or toxic in the environment [28]. The concentrations of TDCPP were observed in rainfall and lakes in Italy, where it was hypothesized that atmospheric deposition was the cause of pollution [31].
Pyrethroid insecticides are synthetic chemicals commonly used for pest control in urban environments by both professionals and consumers [32,33]. Due to their wide-spread use, pyrethroids, such as bifenthrin and cypermethrin, have been observed in residential urban runoff at concentrations exceeding the toxicity thresholds for sensitive invertebrates [33]. While the concentrations do not necessarily come from rooftop runoff, the atmospheric deposition of the insecticides onto rooftops during application on residential properties can potentially occur. Research has shown that insecticide residues can remain on rough surfaces for prolonged periods, allowing for the contamination of later runoff [34]. Lambda-cyhalthrin is another pyrethroid insecticide of concern due to its widespread use and potential impact on aquatic ecosystems [33].
This research evaluated the occurrence of PAHs, PFRs, and pyrethroid insecticides in roof runoff and soils receiving roof runoff and quantified a first flush recommendation. Runoff samples were collected and evaluated from both new small-scale structures and existing commercial roofs representing metal, asphalt shingle, clay tile, and tar and gravel roofs under simulated and actual storm events. Seventeen soil samples were collected from beneath roof downspouts, with a paired sample taken away from the downspout. The water quality results were compared to USEPA non-potable urban water reuse, USEPA irrigation water reuse guidelines, and USGS health-based screening levels, while the soil samples were compared to USEPA risk-based screening levels of PAHs for residential soils and are presented. The first-flush recommendations, along with a study on the accumulation of PAHs in soils receiving roof runoff, are presented in the companion paper [35].
2. Materials and Methods
2.1. Rainfall Simulations: Site Description and Sampling Procedures
Simulated rainfall events were performed on eighteen small-scale roof structures, in a field located at the Oklahoma State University (OSU) Agronomy Farm in Stillwater, Oklahoma, approximately 300 m north of State Highway 51 (Figure 1). The structures were simple hip-roofs with each side a 0.91 m square, and a total area of 1.67 m2. New Elite Glass-Seal® three tab asphalt shingles (Tamko®, Joplin, MO, USA), new MasterRib® acrylic coated Galvalume Plus® metal sheeting (Severstal Sparrows Point, LLC, Sparrows Point, MD, USA), and sixty year-old clay tiles (Reddick Roofing and Guttering, Enid, OK, USA) were installed on the structures and replicated six times each. Nine roofs, consisting of three replicates of each roofing material, were oriented north–south (NS) while the remaining nine roofs were oriented east–west (EW). This arrangement provided a test to determine if roof orientation, relative to the prevailing wind direction, had a significant impact on the water quality. Vinyl gutters collected the runoff while Teflon tubing connected to a PVC funnel hanging at the lower end of each gutter directed runoff into sampling bottles.
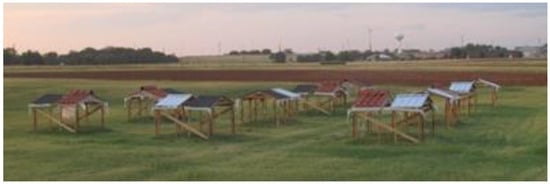
Figure 1.
Eighteen constructed roof structures representing metal, asphalt shingle, and clay tile roofing materials used in the simulated rainfall events study.
A portable rainfall simulator was built to simulate natural rainfall events on the constructed roofs (Figure 2). The rainfall simulator consisted of a PVC constructed boom, fitted with three separate spray nozzles, and raised three meters into the air via square metal tubing. Tap water, treated with an RO filter, was used for the simulations and stored in a 3785 L plastic tank attached to the trailer. Water was pumped from the tank through vinyl tubing to the boom and spray nozzles. In order to minimize interference from the wind on the spray pattern, a 4.6 m wind block was constructed and erected around the roofs during each simulation event.
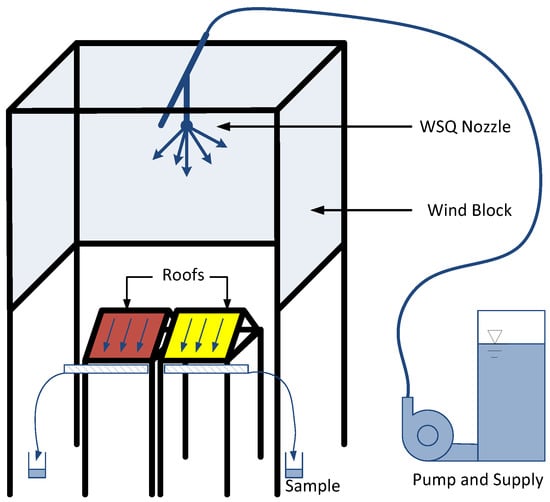
Figure 2.
Schematic of the rainfall simulator with portable wind block.
Previous research showed that a 50 WSQ nozzle was capable of producing drops within 2% of terminal velocity when placed three meters high at 28 kPa operating nozzle pressure [36]. This same nozzle was used in another study and was able to maintain critical intensity, distribution, and the energy characteristic of natural rainfall [37]. The WSQ nozzle emits a wide, square spray pattern, which was needed to adequately rain onto two roofs at the same time. Three different spray nozzles were tested and used for the rainfall simulations here: 30 WSQ, 24 WSQ, and 14 WSQ (Spraying Systems Co., Wheaton, IL, USA). They provided an average intensity of 64, 38, and 28 mm/h, respectively. Uniformity tests were performed on each nozzle prior to the field simulations to determine the average intensity and uniformity provided by each nozzle at a pressure of 34 kPa.
The 64 mm/h simulations were performed in August 2011, the 38 mm/h simulations in November 2011, and the 28 mm/h simulations in February 2012. Due to the limits of the spray coverage from the nozzles, only two roofs were sampled at a time. This resulted in a total of five simulations each day over two consecutive days per intensity. For the 64 and 38 mm/h simulations, the NS structures were sampled on the first day and the EW structures on the second day. The 28 mm/h simulation had the order of the roofs sampled reversed due to adverse field conditions. An antecedent dry period (ADP) of 8 days was observed for the NS structures on the 64 and 38 mm/h simulations and 9 days ADP for the EW structures. The 28 mm/h simulation had an ADP of 8 days for the EW and 9 days for the NS structures.
In total, 6 samples were manually collected from each roof during each rainfall simulation. The first 5 samples were collected in 2 L glass amber bottles. The sixth and final sample varied from 10 to 36.2 L, depending on the rainfall intensity and roofing material, and was collected in 36.2 L clear glass carboys. Each of the 6 samples were split in the field for the various water quality tests and placed on ice until sample processing could occur. The 64 mm/h simulation was run for 21.4 min, which was the time required to completely fill all 6 sample bottles from the metal roofs, while the 38 and 28 mm/h intensity rainfall simulations were run for 30 min.
2.2. Field Sampling: Site Description and Sampling Procedures
The field sampling of roof runoff during actual storm events was conducted at the OSU Oklahoma City campus, approximately 200 m west of Interstate 44. Three roofs were sampled (Figure 3). These were a 29-year-old flat commercial tar and gravel roof (Figure 3a), an 8-year-old commercial metal roof (Figure 3b), and a 1-year-old asphalt shingle test roof (Figure 3c). The roof areas were 92, 88, and 9.3 m2, respectively. The asphalt shingle roof was constructed on site strictly for research purposes and placed near the tar and gravel roof, while the tar and gravel roof had not been resurfaced since its original construction in 1983. The metal roof was located within 100 m of the tar and gravel and asphalt shingle roofs while the tar and gravel roof was approximately 17 m from the asphalt shingle roof.

Figure 3.
Tar and gravel roof building (a), metal roof building (b), and asphalt shingle roof (c) used for the field sampling events.
A downspout from each roof was modified with a 45 degree wye and inverted syphon manifold (Figure 4). A water-quality sonde (Hydrolab MS5; Hach®, Loveland, CO, USA) was placed inside the wye and took continuous measurements of conductivity, turbidity, and temperature.
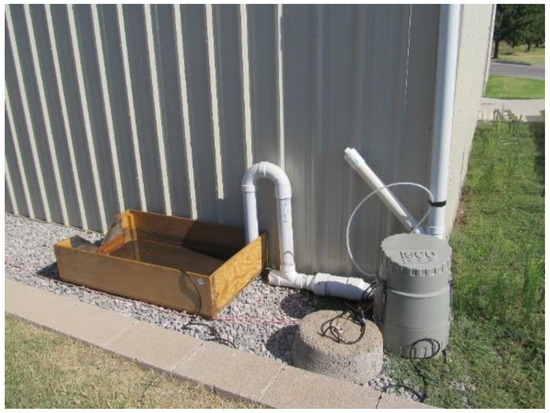
Figure 4.
Example of the modified downspout and field sampling arrangement at the metal roof.
Portable samplers (6712, Teledyne Isco, Lincoln, NE, USA) were programmed to take sequential samples at irregular time intervals, with the majority collected during the beginning of the storm. Programing aimed for 24 one-liter paired samples during each storm event over 3.27 h. The second sample of each pair was collected within one minute of the first. Teflon-lined tubing was used for the suction line and was inserted into the side of the downspouts, after the sondes. Prior to collecting each sample, the suction line was rinsed twice. If no water was detected after three attempts, the sampler moved on to the next programmed sample.
In order to measure the runoff volume from each storm event, the depth behind a 90° contracted V-notch weir the were recorded by a submerged differential pressure transducer (720 Submerged Probe Flow Module (Teledyne Isco, Lincoln, NE, USA)). The weir was installed at one end of a 150 × 92 × 30 cm constructed plywood box placed at the outlet of each downspout following recommendations from the United States Department of the Interior Bureau of Reclamation. The Cone equation [38] was used to calculate the discharge over the weir as:
where Q is the discharge over the weir (ft3/s) and h1 is the head on the weir (ft). Once Q was calculated, the values were converted to metric units (m3/s) for subsequent calculations. The head on the weir readings were provided by the probe, with the distance from the bottom of the V-notch weir to the bottom of the box (7.6 cm) subtracted from the measured readings. For level readings < 7.6 cm, the continuity equation was used to calculate the flow rate inside the weir box as:
where V is the velocity in m/s and A is the weir box area, in m2. V was determined by calculating the change in level readings and dividing the time increment recorded for each 1 min. level reading.
Rain gauges (674; Teledyne Isco, Lincoln, NE, USA) were used to record rainfall data at each site. Initially, only one rain gauge was installed at the asphalt shingle roof when the submerged probes were used to signal the samplers to begin sampling. When the submerged probes proved ineffective in starting the samplers in an appropriate amount of time, rain gauges were also installed at the metal and tar and gravel roofs and were used to start the samplers.
Rainfall activity was monitored from Stillwater using real-time data from the Oklahoma Mesonet Oklahoma City West station (OKCW), which is located within 300 m of all three roofs. Both pump and discharge tubing in the samplers were replaced with clean tubing before each collection event, as were the sample bottles. The Teflon suction lines between the downspouts and the sampler were not replaced as they were considered part of the downspout. The weir boxes were drained and the downspouts were rinsed and re-filled with tap water in order to keep the water-quality sondes wet. All samples were collected from the field within 12 h of a storm event and immediately placed on ice. Flowlink® 5.1 (Teledyne Isco, Lincoln, NE, USA) was used to select six paired samples chosen from each roof based on when the samples were taken during the storm event. Samples were brought back to Stillwater, OK, USA, where they were immediately split for the various water quality tests. Samples were collected from 11 storm events between April and July.
2.3. Water Quality Testing
All samples were analyzed for pH, conductivity, nitrate-nitrogen (NO3-N), boron (B), sodium (Na), calcium (Ca), magnesium (Mg), iron (Fe), copper (Cu), zinc (Zn), manganese (Mn), total suspended solids (TSS), and turbidity, as well as for the presence of seventeen PAHs (Σ17PAHs): naphthalene; 2-methyl naphthalene; acenaphthylene; acenaphthene; fluorene; phenanthrene; anthracene; fluoranthene; pyrene; benz(a)anthracene; chrysene; benzo(b)fluoranthene; benzo(k)fluoranthene; benzo(a)pyrene; ideno(1,2,3-cd)pyrene; dibenz(a,h)anthracene and benzo(g,h,i)perylene; phosphorus flame retardants tris(2-chloroethyl) phosphate (TCEP); tris(1,3-dichloro-2-propyl) phosphate (TDCPP); and pyrethroid insecticides bifenthrin, cypermethrin, and lambda-cyhalothrin. Field samples were additionally tested for the presence of total coliforms (TC) and Escherichia coli (EC) bacteria when samples could be analyzed within 48 h of initial collection [39]. A summary of methods used for water sample analysis are listed in Table 1. A detailed summary of how the samples were processed for the PAHs, PFRs, and pyrethroid insecticides can be found in the companion paper [35].

Table 1.
Methods used for analyzing the water samples.
2.4. Water Quality Control and Method Development
Rainfall simulation sample replicates were collected at ten percent of the 64 mm/h simulation samples for inorganic analyses and at ten percent of the 38 mm/h and 28 mm/h simulations for turbidity and TSS analyses. Field sampling replicates on the inorganics, turbidity, TSS, and bacteria samples were taken at approximately 11–20% of all field samples; of the eighty-two samples used for data analysis (n = 41 for TC and EC), there were ten replicates on inorganics and TSS, nine turbidity replicates, and three bacteria replicates. No replicates were performed on samples for PAHs, PFRs, or pyrethroid insecticides due to limitations in the sample volumes required for the analysis. Instead, lab matrix spikes were performed on three sets of duplicates from the sixth sample of three simulation samples, representing each roofing material from the August simulation. A total of twelve field blanks were taken from the simulation site; three field blanks were taken at the field sampling site. All glass and plastic bottles, bottle lids, and tubing used in the study for sample collections were thoroughly cleaned prior to use with laboratory-grade soap, acetone, and 10% nitric acid solution, followed by deionized water. The equipment was then allowed to air-dry before use.
2.5. Downspout Soils Analysis
A soil study was conducted in order to determine if PAHs had the potential for long-term accumulation in soils that received roof runoff. Seventeen paired soil samples were analyzed for the presence of Σ17PAHs, as well as for TCEP, TDCPP, bifenthrin, cypermethrin, and lambda-cyhalothrin. Approximately 200 g soil samples were taken from beneath each downspout from a 0.1 m2 area, with a paired sample taken in an area nearby that did not receive downspout drainage. Samples were taken from the first 3 cm of topsoil beneath downspouts for asphalt shingle-, metal-, and flat tar and gravel-roofed buildings in Oklahoma City, OK, USA and Stillwater, OK, USA. Samples were stored frozen at −20 °C until extractions took place.
Each soil sample was thawed and well-mixed prior to removing 1.5 g of soil for the analysis. Each sample received 100 µL of p-Terphenyl as a surrogate in two 50 µL increments in order to fully saturate the soil. A mortar and pestle were used to mix the soil with 750 mg of diatomaceous earth, 900 mg of Florisil, and 50 mg of primary secondary amine-bounded silica. A column was constructed using a hollow solid-phase extraction tube filled with 500 mg of activated silica gel, followed by 1.0 g of sodium sulfate, then the soil mixture on top. The column was then eluted with 15 mL of hexane:ethyl ether (1:2, v/v) into test tubes. The eluate was then evaporated down to 0.5 mL using a stream of nitrogen and analyzed by GC-MS, similar to Hileman [40]. Concentrations were compared to USEPA risk-based screening levels of polycyclic aromatic hydrocarbons for residential soils.
2.6. Statistical Analysis
Two sample t-tests (α = 0.05) were used to compare turbidity and TSS results from the NS and EW simulation samples to determine if roof orientation, in relation to the prevailing wind direction, had a significant impact on rooftop runoff quality. Samples from each NS roof were compared to the corresponding EW samples from the same roofing material for each simulation intensity. Both groups had a sample size of n = 3 for each two-sample t-test performed [41]. When comparing TSS, samples with detections below the reporting limit were replaced with half the reporting limit, i.e., 0.5 mg/L.
Spearman’s Rho correlations (α = 0.05) were performed to see if any trends existed between the water quality parameters/constituents and roof type (simulation and field samples) and simulation intensity (simulation samples). Ranked data were used in order to account for non-detects. [42] Spearman’s Rho (rs) values were computed in Minitab and critical rs values were calculated based on Student’s t critical values (α = 0.05) for a given sample size using:
where t is the Student’s t critical value, rs is the Spearman’s rho value, and n is the sample size [43]. The majority of samples were left highly censored, therefore, data were summarized following nonparametric methods after censoring at the highest reporting limit [42]. Binary methods were used to summarize the number of samples greater than the reporting limit and the frequency of detections, and the maximum values were also reported.
Tukey–Kramer (α = 0.05 for all comparisons) was used for statistical comparisons on simulation samples based on the intensity, roof type, and runoff depth, and field samples based on roof type and runoff depth with ADP as a covariate using the ANOVA-GLM in Minitab v. 16 (Minitab Inc., State College, PA, USA). For censored data, a Kruskal–Wallis test (α = 0.05) was first performed to determine if significant differences existed using ranked data. If there was a significant difference (p < 0.05), pairwise comparisons were performed using Tukey–Kramer with the ranked censored data. Parameters not having a significant difference were not included in the ANOVA-GLM and Tukey–Kramer analysis.
3. Results and Discussion
3.1. Quality Control and Method Development
The RO system used to filter the simulation water was discovered to have been installed incorrectly, resulting in some simulation field blanks containing levels of conductivity, NO3-N, B, Fe, Cu, Zn, Mn, and TSS; background levels for all except conductivity were subtracted from the sample concentrations. Naphthalene was the only PAH detected in five of the simulation field blanks (35–79 ng/L). There were no other detections of the organic compounds of interest in the blanks. Three lab blanks were performed during the field sampling events for PAHs, PFRs, and the pyrethroid insecticides, with one detection of naphthalene (33 ng/L) in one of the three lab blanks. The field sampling blanks had no detections of the organic compounds.
The average recovery of the surrogate p-Terphenyl was 86.3% (±22) for the simulation samples, 89.7% (±19.5) for the field samples, and 83.8% (±8) for the six laboratory spikes. The average lab matrix spike recoveries ranged between 61.5% (±21.3) and 96.3% (±25.6) for the PAH compounds and between 89.3% (±33) and 109.8% (±17.8) for the pyrethroid insecticides. There were no detections of TCEP or TDCPP in the simulation samples, therefore, there were no recoveries in the matrix study. The average recovery of p-Terphenyl in soil samples was 89.8% (±14.6). Detailed recoveries on matrix spikes, lab spikes, and replicate results for PAHs, PFRs, and the pyrethroid insecticides can be found in Appendix A for the water samples and Appendix C for the soil samples in Lay [44].
3.2. Simulation & Field Sampling Collection Summaries
The roof runoff volumes yielded from the simulated rainfall events were dependent on the rainfall intensity and roofing material, as summarized in Table 2. The asphalt shingle and clay tile roofs had 108 samples each, whereas the metal roof had 107 samples due to an issue not allowing for a sixth sample to be collected during one of the 28 mm/h rainfall simulations.

Table 2.
Summary of the runoff depths represented based on the sample number, the mean runoff volumes from each roof type, and the mean harvesting efficiency from each roof type based on the rainfall simulation intensity.
Table 3 provides the dates, antecedent dry periods (ADP), roofs sampled, harvesting efficiency, and rainfall measurements from each site for the field sampling events. Attempts were made to collect six pairs of samples from each roof at irregular time intervals during a storm event to characterize the roof runoff. As samples were taken at pre-programmed time intervals, it was not always guaranteed that samples would be taken while the runoff was flowing. This resulted in not always having six pairs of samples from each roof. The total number of paired samples collected from each roof were 21, 39, and 22, for the asphalt shingle, metal, and tar and gravel roofs, respectively. Asphalt shingle samples were collected from runoff depths ranging between 0.59 to 12.4 mm, metal samples between 0.34 to 26.0 mm, and tar and gravel samples between 0.06 to 2.53 mm. Data from the field samples have been categorized by the same runoff depth values as the simulation samples when comparing water quality results.

Table 3.
Description of the storm events, runoff volumes, and harvesting efficiencies from the asphalt shingle, metal, and tar and gravel from the field sampling events.
Roof harvesting efficiencies observed in the field sampling events (Table 3) were much lower than those suggested by Farreny et al. for all three roofs; in that study, the authors produced global runoff coefficients of 0.84 ± 0.01, 0.92 ± 0.00, and 0.62 ± 0.04, for clay tile, metal, and flat gravel roofs, respectively, and estimated asphalt shingles to have a runoff coefficient of 0.9 [10]. The lower harvesting efficiencies for the metal roof were observed when the measured rainfall amounts at the metal roof were low and when the rainfall amounts from the asphalt shingle rain gauge were used. There is a possibility that the metal roof did not receive as much rainfall as the asphalt shingle roof during those storm events, which would explain why the harvesting efficiencies were low. The observed efficiencies for the asphalt shingle roof could be a result of the low slope (7°) of the roof. Flat tar and gravel roofs have a higher initial abstraction due to the porosity provided by the gravel, allowing for a high water retention capacity and detention/abstraction values ranging between 2.5 to 7.5 mm [10]. These high initial abstraction values for tar and gravel roofs explain why extremely low harvesting efficiencies were observed in this study for this type of roof.
3.3. Water Quality Results
3.3.1. pH
The runoff pH was significantly different for all three rainfall simulation intensities and the asphalt shingle runoff pH was significantly different from the metal and clay tile. Figure 5 provides a summary of the pH values observed in the runoff samples from each of the three roofs for all three rainfall intensities combined, along with Tukey–Kramer results comparing the pH between runoff depths. All three simulations had different background pH levels. The simulation water (background) pH levels were 7.20 (64 mm/h), 7.15 (38 mm/h), and 6.42 (28 mm/h). As each simulation event was performed at different times of the year, and the water used for the simulations was city tap water processed through an RO filter, the changes in pH are most likely seasonal in nature.
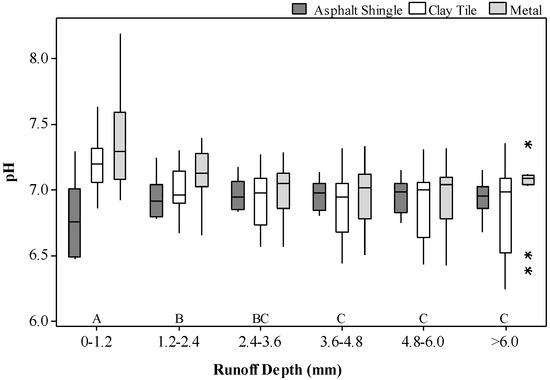
Figure 5.
Observed pH based on the runoff depth and roof type from all of the simulated rainfall events. Runoff depths that do not share a letter are significantly different (α = 0.05). * represents an outlier.
For the field samples, the pH from the metal roof runoff was significantly different from the asphalt shingle roofs, while the pH from the asphalt shingle and tar and gravel roof runoff were statistically the same. Figure 6 shows the pH values observed throughout the storm events by runoff depth for each of the three roofs, along with the Tukey–Kramer results comparing the pH between runoff depths.
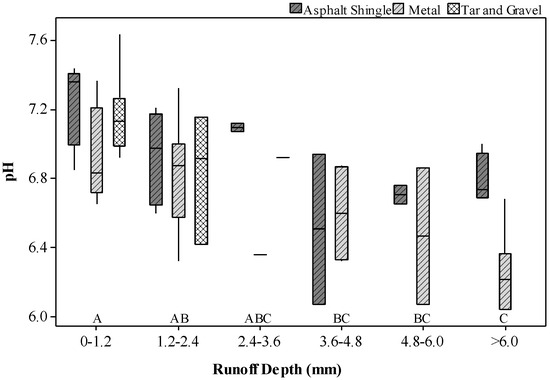
Figure 6.
pH levels observed during the field sampling study based on the runoff depth during each storm event. Runoff depths that do not share a letter are significantly different (α = 0.05).
Several studies have observed that roof runoff tends to have higher pH levels compared to ambient rainfall [4,5,9,10,11,12,45]. The neutralization of the simulation water was most noticeable from the 28 mm/h simulation as the water was at a much lower pH level (6.42) initially compared to the average values observed in the initial runoff samples (6.96–7.32). Ambient rainfall samples were not collected from the field sampling site for comparisons between the ambient conditions and roof runoff due to field limitations. However, the average pH of rainfall for central Oklahoma has been reported to be 6.4 [46]. When comparing results to the average pH of rainfall in Oklahoma, all three field-sampling roofs appeared to have a neutralizing effect on the rainfall. The pH observed from both the simulation and field samples all fell within the EPA suggested range of 6.0 to 9.0 for both non-potable urban and agricultural water reuse guidelines [46].
3.3.2. Conductivity
The conductivity of the runoff was significantly different (α = 0.05) for all three rainfall simulation intensities and between all three roof types. Figure 7 provides a summary of the range of conductivities measured based on the roof type and runoff depth for all three intensities combined and the Tukey–Kramer results comparing the conductivity between runoff depths. The significant difference in conductivity between runoff depths indicates the presence of a first-flush effect. Mendez et al. also observed the conductivity of the first flush to be significantly higher than the rainwater harvested after the first flush for shingle, metal, and cool pilot-scale roofs [13].
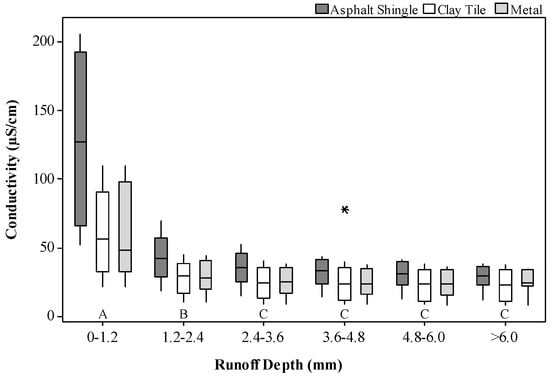
Figure 7.
Comparison of the conductivity (µS/cm) results based on the roof type and sample number from each roof type. Runoff depths that do not share a letter are significantly different (α = 0.05). * represents an outlier.
The asphalt shingle was significantly different from the metal and tar and gravel roofs in the field samples. An average EC of 34 µS/cm was observed in rainfall samples collected in an ambient sampler in Austin, TX, USA [12]. When comparing the observed conductivity in this study to the Austin measurements, the results in Figure 8 show the initial roof runoff having higher conductivity.
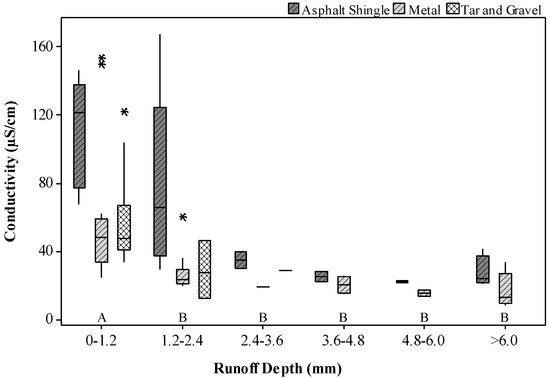
Figure 8.
Field sampling results for conductivity from all three roofs. Runoff depths that do not share a letter are significantly different (α = 0.05). * represents an outlier.
The EPA water reuse guidelines state that there is no restriction for irrigation when the conductivity is less than 700 µS/cm [46]. The conductivity values observed in the discrete-sampled simulation runoff and field samples meet the proposed recommendations, regardless of the roofing material or runoff depth. However, during the continuous conductivity monitoring during the field sampling, runoff from the asphalt shingle roof during Storm Event 11 had an initial concentration of 752 µS/cm, which falls into the “slight to moderate” category of 700 to 3000 µS/cm, after an ADP of 17 days [46]. Nevertheless, the conductivity fell below 700 µS/cm within 0.59 mm of runoff depth. Further information on the results of the continuous conductivity monitoring can be found in the companion paper [35].
3.3.3. Dissolved Metals, B, SAR, and Nitrate-N
There were numerous non-detects of Fe, Cu, Zn, Mn, B, Ca, Na, and Mg, and NO3-N in both the simulation and field studies. Table 4 provides a summary of the frequency of detection, the maximum value, and the 90th percentile of concentrations observed, substituting the sodium adsorption ratio (SAR) value for Ca, Na, and Mg concentrations. Table 5 provides a summary of the Tukey–Kramer comparisons for both simulation and field samples.

Table 4.
Summary of the dissolved metals, B, SAR, and NO3-N concentrations observed in rainfall simulation samples and field samples.

Table 5.
Summary of the Tukey–Kramer comparisons (α = 0.05) for dissolved metals, B, SAR, and NO3-N concentrations observed in simulation and field samples. Different letters indicate a significant difference. The grey box indicates no rainfall simulations on field sites.
In both the simulation and field sampling, Fe, Cu, and Mn were detected in higher frequencies in the asphalt shingle runoff compared to the other roofing materials. In a study by Nicholson et al., asphalt fiberglass shingles roofs had more Cu in the runoff compared to galvanized metal or green roofs [5]. Mendez et al. also observed similar results in comparing asphalt shingle roofs to metal, tile, cool, and green roofs, and suggested that the shingle roof was a source of Cu [12]. Also in the study, the asphalt shingle roofs also had higher concentrations of Fe compared to the other roofs. The metal roofs in the rainfall simulation study had the highest detection of Zn due to the metallic coating containing 40–48% of Zn. In the field study, the tar and gravel roof had the highest detection of Zn. This could be due to HVAC equipment located on top of the roof, which was not present on the asphalt shingle and metal roofs. Boron was only detected in runoff from the asphalt shingle roofs, possibly indicating that the shingles were a source of B in the study. A study by Palawatt et al. indicated that the proximity to roadway was not a significant variable related to the As and Pb concentrations in rooftop runoff [47]. This would be supported by the results from this field study that was located directly next to an interstate highway overpass (elevation was below the highway), where similar concentrations on all roofs could be expected if the proximity to the highway was the primary driver for metal concentrations.
Fe, Cu, Zn, and Mn concentrations from both simulation and field samples were below the maximum concentrations for irrigation water recommended by the EPA water reuse guidelines, which are 5.0, 0.2, 2.0, and 0.2 ppm, respectively. When comparing the B, the SAR, and NO3-N results to irrigation water quality recommendations, all samples fell into the no degree of restriction on irrigation category, which required B < 0.7 ppm, SAR < 3 when conductivity is also <700 µS/cm, and NO3-N < 5 ppm [46].
3.3.4. TC and EC Bacteria
TC and EC samples were collected and analyzed from the field sampling roofs during Storm Events 8, 9, 10, and 11. TC were detected in all samples from the asphalt shingle (n = 13) and tar and gravel roofs (n = 10) and in 94% of the metal roof samples (n = 18). EC was detected in 31, 17, and 80% of samples from the asphalt shingle, metal, and tar and gravel roofs, respectively. Figure 9 provides a summary of TC and EC concentrations observed from each roof. The asphalt shingle and metal roofs were statistically similar when comparing TC concentrations, as were asphalt shingle and the tar and gravel roofs. The asphalt shingle and metal roofs were statistically similar while the tar and gravel roof was significantly different when comparing EC concentrations. No significant difference was found for TC (p = 0.673) or EC (p = 0.261) when comparing the results to runoff depths. This could be due to the fluctuating runoff volumes, a result of varying rainfall intensities, throughout a single storm event, and the discrete sampling technique used in the study.
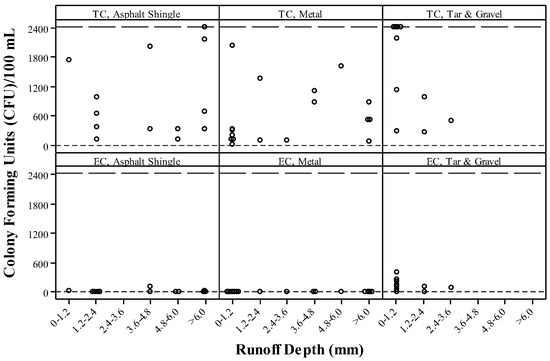
Figure 9.
TC and EC bacteria results from field samples collected during Storm Events 8, 9, 10, and 11. The upper and lower reporting limits are marked by the dashed lines. Tar and gravel roof samples located along the 2419 CFU/100 mL upper reporting limit were actually too numerous to count (TNTC).
The tar and gravel roof had the highest detection and concentrations of EC. This could be attributed to the close proximity of trees to the roof, which allowed for an increased probability of contamination from birds, squirrels, or rodents [13]. There was also a high presence of geese near the field sites throughout the study. The flat nature of the roof also allowed for higher levels of pollutants to accumulate over time without being washed away, as was observed by Farreny et al. when comparing the runoff water quality between flat and sloped roofs [10].
The recommendations on the presence of fecal coliforms in non-potable urban water reuse and agricultural reuse supplies is to not exceed 14 fecal CFU/100 mL [46]. This study only examined for the presence of EC and, therefore, results cannot be compared to the fecal coliform guidelines. However, due to the high presence of TC and the occasional presence of EC in the runoff samples, if the harvested rainwater were to be used in any contact with humans through either direct contact or through food crops meant for raw consumption, it is recommended that the water first be treated.
3.3.5. Turbidity and TSS
There was a significant difference in turbidity between the 64 and 38 mm/h simulations and the 28 mm/h simulation, while the three different roof types were statistically the same. Figure 10 shows the turbidities observed based on the runoff depth and roof type for all simulation events combined; a first-flush effect in turbidity can be observed.
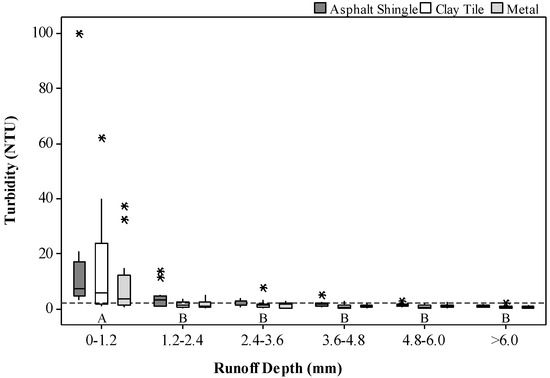
Figure 10.
Turbidity results from each roof type and the corresponding sample number for all three simulation intensities. The dashed line represents 2 NTU. The different letters located above the runoff depths indicate that a significant difference was observed (α = 0.05). * represents an outlier.
Samples from the field events showed that the turbidities observed from the asphalt shingle and tar and gravel roofs were statistically the same, while the metal and tar and gravel roofs were statistically the same. Figure 11 shows the turbidities observed based on roof type and runoff depth for each storm event. No significant difference in turbidities between runoff depths was found.
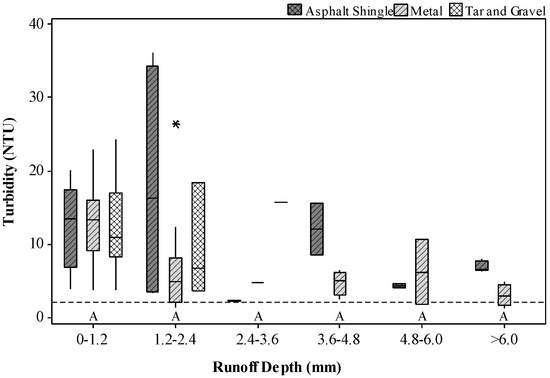
Figure 11.
Turbidity results from field sampling events. The dashed line represents 2 NTU. The different letters located above the runoff depths indicate that a significant difference was observed (α = 0.05). * represents an outlier.
Only samples from the 38 and 28 mm/h simulation events were analyzed for TSS. Ninety-four percent of TSS samples collected from the asphalt shingle (n = 72) were above the reporting limit of 1 mg/L, with a maximum value of 89 mg/L. Seventy-nine percent of TSS samples from the metal roofs (n = 71) were above the reporting limit, with a maximum value of 92 mg/L. Lastly, TSS samples from the clay tile roofs (n = 72) had seventy-two percent above the reporting limit, with a maximum value of 68 mg/L. While asphalt shingle samples had the highest detection frequency of TSS, the metal roofs had the highest concentrations. There was a significant difference in TSS samples between the asphalt shingle roof and the metal and clay tile roofs, which were statistically the same. Figure 12 provides a summary of the TSS concentrations observed in the simulation samples, along with Tukey–Kramer results comparing the TSS between runoff depths.
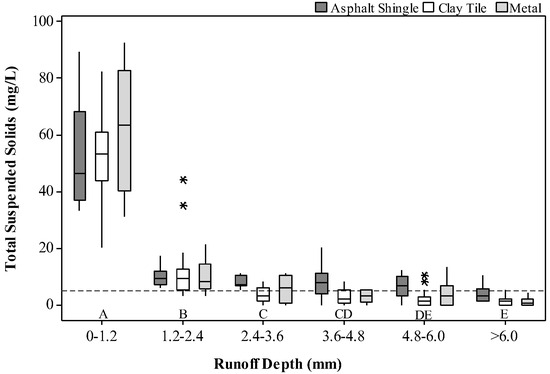
Figure 12.
Total suspended solids results from each roof type and corresponding sample number for the 38 mm/h and 28 mm/h rainfall simulations. The dashed line represents 5 mg/L. The different letters located above the runoff depths indicate that a significant difference was observed (α = 0.05). * represents an outlier.
Field samples did not always follow the same trend in TSS as the simulation samples, as is shown in Figure 13. It is thought that the field samples behaved differently due to varying intensities that occurred throughout a single storm event, whereas the simulation samples had one intensity through each simulation, allowing for a more controlled and even wash off of any particles. The asphalt shingle TSS values were statistically different from the metal and tar and gravel roofs, which were statistically the same. Results comparing turbidity and TSS data between the north–south and east–west oriented roofs showed that roof orientation did not significantly affect the water quality of the samples.
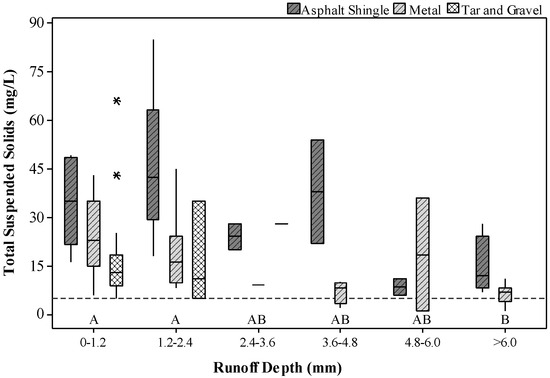
Figure 13.
Total suspended solids results from field sampling events. The different letters located above the runoff depths indicate that a significant difference was observed (α = 0.05). * represents an outlier.
In a study on build-up and wash-off process on roof surfaces, it was observed that the highest concentrations of particulate matter were measured during the initial period of a runoff event [16]. This was also observed in both the turbidity and TSS data from the simulation samples, but not in the field samples. All of the runoff was sampled from each roof during the simulations, whereas only portions of the runoff were sampled during the storm events for the field samples. Additionally, the simulation events were performed in a more controlled environment compared to the field sampling. Had the field samples collected all of the runoff from the storm events, the same trend in turbidity and TSS may have been observed in the field samples.
For unrestricted urban reuse and agricultural reuse for food crops, the average turbidity should be ≤2 NTU over a 24 h time period, without exceeding 5 NTU at any time, or the TSS should not exceed 5 mg/L [46]. A summary of samples meeting these recommendations is provided in Table 6. The simulation samples show a majority of the samples meeting the turbidity recommendation as the runoff depth increases, whereas, in comparison, the field samples rarely met the recommended turbidity. However, when looking at the TSS data, there are fewer simulation and field samples meeting the minimum requirements compared to the turbidity data. The data shows that incorporating a first-flush diversion when harvesting rainwater can assist in reducing the overall turbidity and TSS of the collected rainwater.

Table 6.
Comparison of the simulation and field samples by runoff depth to EPA recommended turbidity and TSS concentrations for non-potable urban water reuse guidelines [46]. Missing data not measured.
3.3.6. Polycyclic Aromatic Hydrocarbons, Phosphorus Flame Retardants, and Pyrethroid Insecticides
Only samples one, two, three, and six were analyzed for organic compounds from each of the eighteen roofs and each simulation event, except one metal roof during the 38 mm/h simulation event where a sixth sample was not collected due to field issues. Table 7 provides a summary of the Tukey–Kramer comparisons for both simulation and field samples. Comparisons were not performed on bifenthrin or cypermethrin due to either low or no frequency of detection in samples. Table 8 provides summaries of the occurrence of PAHs, PFRs, and pyrethroids observed in the simulation and field samples.

Table 7.
Tukey–Kramer results for the simulation and field samples and the occurrence of PAHs, TDCPP, and lambda-cyhalothrin. The grey box indicates no rainfall simulations on field sites. Like letters represent sample sets that are not statistically different.

Table 8.
Summary of the occurrence of selected polycyclic aromatic hydrocarbons, phosphorus flame retardants, and pyrethroid insecticides measured in water samples collected from roofs during the simulated rainfall events and field sampling events.
The asphalt shingle roofs were significantly different from the metal and clay tile roofs for PAH and TSS concentrations. Van Metre and Mahler observed no evidence that asphalt shingles were a source of PAHs in urban runoff [1]. Therefore, the PAHs observed in the roof runoff is likely due to atmospheric deposition. The rougher surface texture of asphalt shingles compared to the metal and clay tile materials appears to be the main reason why there was a significant difference in the roofing material for PAH and TSS concentrations. The rougher surface texture of the shingles allowed for particulates to be deposited in the various pore spaces within the surface. Egodawatta, Thomas, and Goonetilleke observed that finer particle sizes are bonded to roof surfaces and are only mobilized during relatively high rainfall intensity events [16]. This could explain the differences observed TSS and PAHs concentrations between the different intensities.
The detections of PAHs and pyrethroid insecticides were compared to Health-Based Screening Levels (HBSLs) to determine if runoff concentrations would be of potential concern for human health. The HBSLs were developed by the United States Geological Survey (USGS) in collaboration with the U.S. Environmental Protection Agency (USEPA), New Jersey Department of Environmental Protection, and Oregon Health and Science University in order to supplement the existing Federal drinking-water standards and guidelines [48]. HBSLs are calculated using three standard USEPA Office of Water equations used to establish drinking-water guideline values, based on Lifetime Health Advisory and Cancer Risk Concentrations and the latest, USEPA peer-reviewed, publicly available human-health toxicity information. The HBSL dataset only contains calculations for contaminants that do not have USEPA Maximum Contaminant Levels (MCLs). All detections were three orders of magnitude below the HBSL benchmark concentrations. Nevertheless, PAHs, PFRs, and pyrethroid insecticides were detected throughout the study at both sites. Significant differences were observed to exist in the concentrations of the organic compounds between runoff depths in the simulation samples, indicating a first-flush effect.
3.4. Correlation Matrices
Correlation matrices were calculated to compare the water quality results from the simulation and field samples. Tables listing the critical values used to determine whether a correlation existed between parameters for both the simulation and field sampling data, the results of the correlation matrices, and rs values can be found in the Appendix E of Lay [44]. Turbidity and TSS had positive correlations for both simulation and field samples, which was expected as turbidity is often used as a surrogate for TSS. The majority of parameters were positively correlated with one another when comparing the results from all roofs and all three simulation events, with exceptions of some comparisons for pH and SAR. Bifenthrin showed no correlation to any parameters, while cypermethrin and lambda-cyhalothrin had no detections in simulation samples. Positive correlations exist between all PAH detections, TSS, turbidity, and conductivity samples for all matrix comparisons for the simulation samples. Field samples did not have as many positive correlations between parameters when comparing results from all three roofs together. This is most likely due to the irregularity in sampling dates and times between the roof tests. Positive correlations were observed between PAH detections, TSS, and turbidity for all matrix comparisons between roofs from the field sampling. There were positive correlations between conductivity and PAHs, TSS, and turbidity for the asphalt shingle and metal roofs, with the only exception being that conductivity had no correlation to the PAH fluoranthene for the metal roofs.
3.5. Downspout Soil Study
Approximately 70% of the paired soil samples had higher PAH concentrations in the soils that were sampled from underneath a roof’s downspout (Table 9). The differences in these concentrations are likely due to PAHs that were atmospherically deposited onto the roof via dust and later washed during a storm event. These results indicate that there is a potential for the long-term accumulation of PAHs in soils that receive roof runoff. The presence of PAHs in downspout soil samples shows the ubiquitous nature of PAHs in the environment. It is noted that some of the “away” soils may not have been from the same time period as the “downspout” soils, as some locations had recently been re-sodded prior to sample collections. Of the 34 samples taken, there was only one detection of TCEP in a downspout sample (28.3 ng/gsoil at a 10 ng/gsoil RL) from the Public Information building and one detection of bifenthrin in a downspout sample (76.7 ng/gsoil at a 3.33 ng/gsoil RL) from Residential House 2.

Table 9.
PAH concentrations (ng/gsoil) observed in soils, where D indicates the downspout soil sample and A indicates the paired sample taken away from the downspout area.
Table 10 lists risk-based screening levels of 14 PAHs for residential soils and the frequency at which soil samples exceeded these minimum risk-based screening levels. These screening levels are based on human-health risks calculated by the USEPA to determine whether or not levels of contamination measured at the Comprehensive Environmental Response, Compensation, and Liability Act (CERCLA) hazardous waste sites warranted further investigation or site cleanup; screening levels were not listed for all 17 PAHs in the study [49]. These screening levels are not mandatory and are only meant to serve as a baseline for risk assessment. While the concentrations of PAHs in the roof runoff were observed to be three orders of magnitude below HBSLs, the soil sampling showed that there is potential for the long-term accumulation of PAHs at concentrations exceeding minimum human-health risk-based screening levels in residential soils receiving roof runoff. The heavier-weighted PAHs were those found in excess of the screening levels, with greater detections in the soils sampled from beneath a roof’s downspout. Further research is suggested in the area of PAH accumulation in soils receiving harvested rainwater from rooftops.

Table 10.
Regional screening levels (SL) of PAHs for residential soils compared to the frequency of downspout soil samples (D) and paired samples taken away (A) from the DS samples having concentrations greater than the minimum SL listed [49]. Missing data in gray boxes not measured.
4. Conclusions
- The rainfall simulations provided more detailed results of the occurrence of pollutants in roof runoff compared to the field sampling study. Improvements in the field sampling design are recommended for future research.
- Atmospheric deposition was observed to be the main contributor of pollutants in the roof runoff.
- The pH, Fe, Cu, Zn, Mn, B, SAR, and NO3-N observed in the simulation and field samples all fell within the U.S. EPA-suggested guidelines for non-potable urban water reuse and agricultural reuse suggested guidelines. The conductivity observed in the discrete sampled simulation runoff and field samples had no degree of restriction on irrigation, while runoff from the asphalt shingle roof during one storm event briefly had a “slight to moderate” restriction on irrigation according to the recommended irrigation water reuse guidelines.
- In total, 60, 75, and 80% of asphalt shingle, metal, and clay tile simulation samples, respectively, met the urban and agricultural water reuse turbidity guidelines of ≤2 NTU, whereas only 15% of the metal field samples met this recommendation. In total, 31, 55, and 58% of asphalt shingle, metal, and clay tile simulation samples met the TSS guidelines of <5 mg/L, while only 15% and <1% of metal and tar and gravel field samples met the guidelines. The first-flush effects of turbidity and TSS were observed in the simulation samples between runoff depths.
- TC and EC in runoff were analyzed only for four of the eleven storm events. TC and EC were present in field samples, with the majority of EC detections in the tar and gravel roof runoff most likely due to the flat nature of the roof, the high presence of geese in the field sampling location, and the close proximity of trees to the roof. It is recommended that harvested rainwater first be treated if the end use has direct contact with humans or food crops meant for raw consumption.
- Trace levels (ng/L) of PAHs, PFRs, and pyrethroid insecticides were detected in roof runoff samples in both the simulation and field samples. TCEP and TDCPP were only observed in 3% and 27% of the simulation samples, respectively, and in 23% of the field samples. Lambda-cyhalothrin was undetected in the simulation samples and in only 7% of all the field samples. Bifenthrin was detected in <1% of the simulation samples and in none of the field samples. Cypermethrin was not detected in the simulation or field samples. When comparing PAH and pyrethroid insecticides to USGS HBSLs, all detections were three orders of magnitude below the benchmark concentrations.
- The water quality data shows that incorporation of a first-flush diversion in a rainwater harvesting system can assist in improving the overall water quality of the harvested rainwater.
- Positive correlations were observed to exist between PAHs, TSS, turbidity, and conductivity samples for all matrix comparisons for the simulation samples and between PAHs, TSS, and turbidity for all matrix comparisons between roofs from the field sampling. Therefore, a first-flush diversion based on turbidity, TSS, or conductivity has the potential to also reduce the concentrations of PAHs in the harvested rainwater. Recommendations on first-flush diversions based on results from the simulation and field samples are provided in the companion paper [35].
- Soils sampled from beneath downspouts had higher concentrations of PAHs than the paired sample taken away from the downspout in 70% of the samples, indicating a potential for long-term accumulation of PAHs in soils that receive roof runoff. The soil study also revealed the potential for soils receiving roof runoff to contain PAH levels exceeding minimum human-health risk-based screening levels for PAH concentrations in residential soils. Further research is suggested in the area of PAH accumulation in soils receiving harvested rainwater from rooftops.
- Note that further research is needed to expand this research beyond these sites in Oklahoma and to further compare the simulated results to actual field results with variable intensity storms so that results from the controlled simulations can be properly applied to real-world rainwater harvesting installations.
Author Contributions
Conceptualization, J.J.L. and J.R.V.; Methodology, All; Formal Analysis, J.J.L., J.R.V. and D.E.S.; Investigation, J.J.L., J.R.V. and J.B.B.; Funding, J.R.V., J.B.B., G.O.B. and D.E.S.; Original Draft Preparation, J.J.L.; Review and Editing, J.R.V. and G.O.B.; Administration, J.R.V. All authors have read and agreed to the published version of the manuscript.
Funding
Funding for this research was provided by the Oklahoma Water Resources Research Institute, the Oklahoma Water Resources Board, and the Oklahoma Agricultural, Experiment Station. Additionally, Jessica J. Lay was supported by a U.S. National Science Foundation Graduate Research Fellowship.
Data Availability Statement
All data and supporting results are contained in, Lay, J.J., Water Quality and the First-flush Effect in Roof-based Rainwater Harvesting, Master of Science Thesis, Oklahoma State University, 2014. https://shareok.org/handle/11244/14959, accessed on 1 March 2024. The use of trade names is for informational purposes only and does not constitute an endorsement by Oklahoma State University, the University of Oklahoma, or the authors.
Acknowledgments
Oliver Roofing and Cundiff Custom Fabrication in Stillwater, OK, USA, donated asphalt shingle and metal roofing materials for the research. The Staff of the Biosystems and Agricultural Engineering Laboratory, led by Wayne Kiner, were instrumental in the construction and installation of the field experiments, while numerous undergraduate and graduate students in Biosystems Engineering assisted with the field and lab work.
Conflicts of Interest
The authors declare no conflicts of interest.
References
- Van Metre, P.C.; Mahler, B.J. The contribution of particles washed from rooftops to contaminant loading to urban streams. Chemosphere 2003, 52, 1727–1741. [Google Scholar] [CrossRef] [PubMed]
- Clark, S.; Steele, K.; Spicher, J.; Siu, C.; Lalor, M.; Pitt, R.; Kirby, J. Roofing materials’ contributions to storm-water runoff pollution. J. Irrig. Drain. Eng. 2008, 134, 638–645. [Google Scholar] [CrossRef]
- De Buyck, P.J.; Van Hulle, S.W.H.; Dumoulin, A.; Rousseau, D.P. Roof runoff contamination: A review on pollutant nature, material leaching and deposition. Rev. Environ. Sci. Biotechnol. 2021, 20, 549–606. [Google Scholar] [CrossRef]
- Chang, M.; McBroom, M.W.; Scott Beasley, R. Roofing as a source of nonpoint water pollution. J. Environ. Manag. 2004, 73, 307–315. [Google Scholar] [CrossRef] [PubMed]
- Nicholson, N.; Clark, S.; Long, B.; Spicher, J.; Steele, K. Rainwater harvesting for non-potable use in gardens: A comparison of runoff water quality from green vs. traditional roofs. In World Environmental and Water Resources Congress 2009; ASCE: Reston, VA, USA, 2009; pp. 1–10. [Google Scholar]
- Schriewer, A.; Horn, H.; Helmreich, B. Time focused measurements of roof runoff quality. Corros. Sci. 2008, 50, 384–391. [Google Scholar] [CrossRef]
- Deng, Y. Pollution in rainwater harvesting: A challenge for sustainability and resilience of urban agriculture. J. Hazard. Mater. Lett. 2021, 2, 100037. [Google Scholar] [CrossRef]
- Kus, B.; Kandasamy, J.; Vigneswaran, S.; Shon, H. Analysis of first flush to improve the water quality in rainwater tanks. Water Sci. Technol. 2010, 61, 421–428. [Google Scholar] [CrossRef]
- Meera, V.; Ahammed, M.M. Water quality of rooftop rainwater harvesting systems: A review. J. Water Supply Res. Technol. 2006, 55, 257–268. [Google Scholar] [CrossRef]
- Farreny, R.; Morales-Pinzon, T.; Guisasola, A.; Taya, C.; Rieradevall, J.; Gabarrell, X. Roof selection for rainwater harvesting: Quantity and quality assessments in Spain. Water Res. 2011, 45, 3245–3254. [Google Scholar] [CrossRef]
- Ward, S.; Barr, S.; Memon, F.; Butler, D. Rainwater harvesting in the UK: Exploring water-user perceptions. Urban Water J. 2013, 10, 112–126. [Google Scholar] [CrossRef]
- Mendez, C.B.; Klenzendorf, J.B.; Afshar, B.R.; Simmons, M.T.; Barrett, M.E.; Kinney, K.A.; Kirisits, M.J. The effect of roofing material on the quality of harvested rainwater. Water Res. 2011, 45, 2049–2059. [Google Scholar] [CrossRef] [PubMed]
- de Kwaadsteniet, M.; Dobrowsky, P.H.; van Deventer, A.; Khan, W.; Cloete, T.E. Domestic rainwater harvesting: Microbial and chemical water quality and point-of-use treatment systems. Water Air Soil Pollut. 2013, 224, 19. [Google Scholar] [CrossRef]
- Ranaee, E.; Abbasi, A.A.; Tabatabaee Yazdi, J.; Ziyaee, M. Feasibility of rainwater harvesting and consumption in a middle eastern semiarid urban area. Water 2021, 13, 2130. [Google Scholar] [CrossRef]
- Lye, D.J. Rooftop runoff as a source of contamination: A review. Sci. Total Environ. 2009, 407, 5429–5434. [Google Scholar] [CrossRef] [PubMed]
- Egodawatta, P.; Thomas, E.; Goonetilleke, A. Understanding the physical processes of pollutant build-up and wash-off on roof surfaces. Sci. Total Environ. 2009, 407, 1834–1841. [Google Scholar] [CrossRef] [PubMed]
- Förster, J. Variability of roof runoff quality. Water Sci. Technol. 1999, 39, 137–144. [Google Scholar] [CrossRef]
- Thomas, P.R.; Green, G.R. Rainwater Quality from Different Roof Catchments. Water Sci. Technol. 1993, 28, 291–299. [Google Scholar] [CrossRef]
- Rocher, V.; Azimi, S.; Gasperi, J.; Beuvin, L.; Muller, M.; Moilleron, R.; Chebbo, G. Hydrocarbons and metals in atmospheric deposition and roof runoff in central Paris. Water Air Soil Pollut. 2004, 159, 67–86. [Google Scholar] [CrossRef]
- Lima, A.L.C.; Farrington, J.W.; Reddy, C.M. Combustion-derived polycyclic aromatic hydrocarbons in the environment: A review. Environ. Forensics 2005, 6, 109–131. [Google Scholar] [CrossRef]
- Haritash, A.K.; Kaushik, C.P. Biodegradation aspects of polycyclic aromatic hydrocarbons (PAHs): A review. J. Hazard. Mater. 2009, 169, 1–15. [Google Scholar] [CrossRef]
- Van Metre, P.C.; Mahler, B.J.; Furlong, E.T. Urban sprawl leaves its PAH signature. Environ. Sci. Technol. 2000, 34, 4064–4070. [Google Scholar] [CrossRef]
- Brown, J.N.; Peake, B.M. Sources of heavy metals and polycyclic aromatic hydrocarbons in urban stormwater runoff. Sci. Total Environ. 2006, 359, 145–155. [Google Scholar] [CrossRef]
- Grynkiewicz, M.; Polkowska, Ż.; Namieśnik, J. Determination of polycyclic aromatic hydrocarbons in bulk precipitation and runoff waters in an urban region (Poland). Atmos. Environ. 2002, 36, 361–369. [Google Scholar] [CrossRef]
- Hwang, H.-M.; Foster, G.D. Characterization of polycyclic aromatic hydrocarbons in urban stormwater runoff flowing into the tidal Anacostia River, Washington, DC, USA. Environ. Pollut. 2006, 140, 416–426. [Google Scholar] [CrossRef]
- Stein, E.D.; Tiefenthaler, L.L.; Schiff, K. Watershed-based sources of polycyclic aromatic hydrocarbons in urban storm water. Environ. Toxicol. Chem. 2006, 25, 373–385. [Google Scholar] [CrossRef]
- Van Dolah, R.F.; Riekerk, G.H.M.; Levisen, M.V.; Scott, G.I.; Fulton, M.H.; Bearden, D.; Sivertsen, S.; Chung, K.W.; Sanger, D.M. An evaluation of polycyclic aromatic hydrocarbon (PAH) runoff from highways into estuarine wetlands of South Carolina. Arch. Environ. Contam. Toxicol. 2005, 49, 362–370. [Google Scholar] [CrossRef]
- van der Veen, I.; de Boer, J. Phosphorus flame retardants: Properties, production, environmental occurrence, toxicity and analysis. Chemosphere 2012, 88, 1119–1153. [Google Scholar] [CrossRef]
- Regnery, J.; Püttmann, W. Occurrence and fate of organophosphorus flame retardants and plasticizers in urban and remote surface waters in Germany. Water Res. 2010, 44, 4097–4104. [Google Scholar] [CrossRef]
- Wicke, D.; Matzinger, A.; Sonnenberg, H.; Caradot, N.; Schubert, R.-L.; Dick, R.; Heinzmann, B.; Dünnbier, U.; von Seggern, D.; Rouault, P. Micropollutants in urban stormwater runoff of different land uses. Water 2021, 13, 1312. [Google Scholar] [CrossRef]
- Bacaloni, A.; Cucci, F.; Guarino, C.; Nazzari, M.; Samperi, R.; Laganà, A. Occurrence of Organophosphorus flame retardant and plasticizers in three volcanic lakes of central Italy. Environ. Sci. Technol. 2008, 42, 1898–1903. [Google Scholar] [CrossRef] [PubMed]
- Weston, D.P.; Holmes, R.W.; Lydy, M.J. Residential runoff as a source of pyrethroid pesticides to urban creeks. Environ. Pollut. 2009, 157, 287–294. [Google Scholar] [CrossRef]
- He, L.-M.; Troiano, J.; Wang, A.; Goh, K. Environmental chemistry, ecotoxicity, and fate of lambda-cyhalothrin. In Reviews of Environmental Contamination and Toxicology; Whitacre, D., Road, B., Bennett, E., Ross, P., Eds.; Springer: Cham/Heideberg, Switzerland, 2008; pp. 71–91. [Google Scholar]
- Jiang, W.; Lin, K.; Haver, D.; Qin, S.; Ayre, G.; Spurlock, F.; Gan, J. Wash-off potential of urban use insecticides on concrete surfaces. Environ. Toxicol. Chem. 2010, 29, 1203–1208. [Google Scholar] [CrossRef]
- Lay, J.; Vogel, J.R.; Belden, J.B.; Brown, G.O.; Storm, D.E. Water quality and the first-flush effect in roof-based rainwater harvesting Part II: First flush. Water 2023, 15. [Google Scholar]
- Shelton, C.H.; Bernuth, R.D.v.; Rajbhandari, S.P. A continuous-application rainfall simulator. Trans. ASAE 1985, 28, 1115–1119. [Google Scholar] [CrossRef]
- Humphry, J.B.; Daniel, T.C.; Edwards, D.R.; Sharpley, A.N. A portable rainfall simulator for plot-scale runoff studies. Appl. Eng. Agric. 2002, 18, 199. [Google Scholar] [CrossRef]
- Dodge, R. Fully contracted standard 90-degree V-notch weir. In Water Measurement Manual; U.S. Department of the Interior, Bureau of Reclamation: Washington, DC, USA, 2001. [Google Scholar]
- Pope, M.L.; Bussen, M.; Feige, M.A.; Shadix, L.; Gonder, S.; Rodgers, C.; Chambers, Y.; Pulz, J.; Miller, K.; Connell, K.; et al. Assessment of the effects of holding time and temperature on escherichia coli densities in surface water samples. Appl. Environ. Microb. 2003, 69, 6201–6207. [Google Scholar] [CrossRef]
- Hileman, S. Polycyclic Aromatic Hydrocarbon Accumulation in Soil Receiving Rooftop Runoff. Master’s Thesis, Oklahoma State University, Stillwater, OK, USA, 2016. [Google Scholar]
- de Winter, J.C.F. Using the Student’s t-test with extremely small sample sizes. Pract. Assess. Res. Eval. 2013, 18, 10. [Google Scholar]
- Helsel, D.R. Statistics for Censored Environmental Data Using Minitab(R) and R, 2nd ed.; John Wiley & Sons: New York, NY, USA, 2012. [Google Scholar]
- Zar, J.H. Significance testing of the spearman rank correlation coefficient. J. Am. Stat. Assoc. 1972, 67, 578–580. [Google Scholar] [CrossRef]
- Lay, J.J. Water Quality and the First-Flush Effect in Roof-Based Rainwater Harvesting. Master’s Thesis, Oklahoma State University, Stillwater, OK, USA, 2014. [Google Scholar]
- Sharpley, A.N.; Smith, S.J.; Menzel, R.G.; Berg, W.A.; Jones, O.R. The pH of rainfall in the Southern Plains. Proc. Okla. Acad. Sci. 1984, 64, 40–42. [Google Scholar]
- USEPA. Guidelines for Water Reuse; U.S. Environmental Protection Agency: Washington, DC, USA, 2012. Available online: https://www.epa.gov/waterreuse/guidelines-water-reuse (accessed on 1 March 2024).
- Palawat, K.; Root, R.A.; Cortez, L.I.; Foley, T.; Carella, V.; Beck, C.; Ramírez-Andreotta, M.D. Patterns of contamination and burden of lead and arsenic in rooftop harvested rainwater collected in Arizona environmental justice communities. J. Environ. Manage. 2023, 337, 117747. [Google Scholar] [CrossRef]
- Norman, J.E.; Toccalino, P.L.; Morman, S.A. Health-Based Screening Levels: Benchmarks for Evaluating Water-Quality Data, 2nd ed.; U.S. Geological Survey: Washington, DC, USA, 2018. Available online: https://water.usgs.gov/water-resources/hbsl (accessed on 1 March 2024).
- USEPA. Regional Screening Level (RSL) for Resident Soil Table (TR = 1E-6, THQ = 1); U.S. Environmental Protection Agency: Washington, DC, USA, 2015. Available online: https://semspub.epa.gov/work/HQ/404061.pdf (accessed on 1 March 2024).
Disclaimer/Publisher’s Note: The statements, opinions and data contained in all publications are solely those of the individual author(s) and contributor(s) and not of MDPI and/or the editor(s). MDPI and/or the editor(s) disclaim responsibility for any injury to people or property resulting from any ideas, methods, instructions or products referred to in the content. |
© 2024 by the authors. Licensee MDPI, Basel, Switzerland. This article is an open access article distributed under the terms and conditions of the Creative Commons Attribution (CC BY) license (https://creativecommons.org/licenses/by/4.0/).