Article

Toward Decontamination in Coastal Regions: Groundwater Quality, Fluoride, Nitrate, and Human Health Risk Assessments within Multi-Aquifer Al-Hassa, Saudi Arabia

by
Mohamed A. Yassin
1,2,
Sani I. Abba
1,*,
Syed Muzzamil Hussain Shah
1,
Abdullahi G. Usman
3,
Johnbosco C. Egbueri
4,5,
Johnson C. Agbasi
4,
Abid Khogali
2,
Husam Musa Baalousha
2,
Isam H. Aljundi
1,6,
Saad Sha. Sammen
7 and
Miklas Scholz
8,9
1
Interdisciplinary Research Centre for Membranes and Water Security, King Fahd University of Petroleum and Minerals, Dhahran 31261, Saudi Arabia
2
Department of Geosciences, College of Petroleum Engineering and Geosciences, King Fahd University of Petroleum and Minerals, Dhahran 31261, Saudi Arabia
3
Operational Research Centre in Healthcare, Near East University, Nicosia 99138, Turkey
4
Department of Geology, Chukwuemeka Odumegwu Ojukwu University, Uli 431124, Anambra State, Nigeria
5
Research Management Office (RMO), Chukwuemeka Odumegwu Ojukwu University, Uli 431124, Anambra State, Nigeria
6
Department of Chemical Engineering, King Fahd University of Petroleum and Minerals, Dhahran 31261, Saudi Arabia
7
Department of Civil Engineering, College of Engineering, University of Diyala, Baqubah 32001, Diyala Governorate, Iraq
8
Department of Civil Engineering Science, School of Civil Engineering and the Built Environment, Faculty of Engineering and the Built Environment, University of Johannesburg, Kingsway Campus, P.O. Box 524, Aukland Park 2006, Johannesburg, South Africa
9
Department of Urban Drainage, Bau & Service Oberursel (BSO), Postfach 1280, 61402 Oberursel (Taunus), Germany
*
Author to whom correspondence should be addressed.
Water 2024, 16(10), 1401; https://doi.org/10.3390/w16101401
Submission received: 27 March 2024 / Revised: 2 May 2024 / Accepted: 7 May 2024 / Published: 14 May 2024
(This article belongs to the Special Issue Research on Coastal Water Quality Modelling)

Abstract

:
Contamination in coastal regions attributed to fluoride and nitrate cannot be disregarded, given the substantial environmental and public health issues they present worldwide. For effective decontamination, it is pivotal to identify regional pollution hotspots. This comprehensive study was performed to assess the spatial as well as indexical water quality, identify contamination sources, hotspots, and evaluate associated health risks pertaining to nitrate and fluoride in the Al-Hassa region, KSA. The physicochemical results revealed a pervasive pollution of the overall groundwater. The dominant water type was Na-Cl, indicating saltwater intrusion and reverse ion exchange impact. Spatiotemporal variations in physicochemical properties suggest diverse hydrochemical mechanisms, with geogenic factors primarily influencing groundwater chemistry. The groundwater pollution index varied between 0.8426 and 4.7172, classifying samples as moderately to very highly polluted. Similarly, the synthetic pollution index (in the range of 0.5021–4.0715) revealed that none of the samples had excellent water quality, with various degrees of pollution categories. Nitrate health quotient (HQ) values indicated chronic human health risks ranging from low to severe, with infants being the most vulnerable. Household use of nitrate-rich groundwater for showering and cleaning did not pose significant health risks. Fluoride HQ decreased with age, and children faced the highest risk of fluorosis. The hazard index (HI) yielded moderate- to high-risk values. Nitrate risks were 1.21 times higher than fluoride risks, as per average HI assessment. All samples fell into the vulnerable category based on the total hazard index (THI), with 88.89% classified as very high risk. This research provides valuable insights into groundwater quality, guiding water authorities, inhabitants, and researchers in identifying safe water sources, vulnerable regions, and human populations. The results highlight the need for appropriate treatment techniques and long-term coastal groundwater management plans.

1. Introduction

Groundwater, being a crucial resource for human consumption, agriculture, and industrial use, offers a dependable and frequently favored option compared to surface water sources. It plays a vital role as the primary source in various sectors across numerous regions globally. Additionally, Li et al. [1] highlighted that approximately half of the global drinking water demand is met by groundwater systems. However, as evidenced in different regions across the globe, its quality is susceptible to contamination from various anthropogenic and natural sources [2,3,4,5], which can pose significant health risks to communities relying on it. The deterioration of this crucial resource’s quality can be attributed to various human activities, including alterations in land use, discharge of industrial and domestic effluents, use of fertilizers, and excessive exploitation of subsurface water [6,7,8]. The forecasted outcomes of climate change often anticipate future years with reduced precipitation, which can exacerbate these conditions [6,9].
The Al-Hassa area, located in the Eastern region of Saudi Arabia, is distinguished by an intricate hydrogeological system encompassing multiple aquifers. Studies have indicated that coastal regions accommodate approximately 44% of the global population [10]. These regions heavily rely on groundwater availability for various critical purposes, such as sustaining ecosystems, ensuring food and energy security, supporting agricultural irrigation, and facilitating industrial processes [11]. Given their significance as hydrogeological units, coastal areas often face substantial water demands due to population growth [12]. The features of coastal groundwater are influenced by a range of natural factors and widespread human activities [13,14], which contribute to the intricate nature of coastal groundwater quality assessment. Consequently, it is of paramount importance to comprehend the impact of concurrent seawater intrusion and significant human activities on the hydrogeochemistry of coastal groundwater, as well as the contamination levels of fluoride and nitrate, particularly in the context of increasing salinization trends [12].
Water, being the primary carrier of pollutants, has the potential to transmit up to 70% of pollution, and water pollution is responsible for many illnesses and approximately 20% of cancer cases [15,16]. Nitrate and fluoride are widely recognized as global contaminants in drinking water across various regions. Fluorine as a trace element is vital for human health, playing a beneficial role in metabolism and disease prevention [17]. Nevertheless, extended contact to higher levels can interfere with the enzymes responsible for vitamin metabolism, resulting in adverse effects on bones, as well as the degeneration of brain tissues, kidneys, and the central nervous system [18,19]. The undue buildup of fluoride presents a considerable hazard to the welfare of local communities and the enduring progress and advancement of national economies. Consequently, fluoride contamination has become an environmental issue that warrants global attention [17,18]. Unfortunately, the present study area, particularly the Al Hassa region, faces a scarcity of research on the migration and enrichment patterns of fluorine in coastal groundwater aquifers.
As has been reported by previous studies, various anthropogenic activities lead to high-level enrichment of natural waters with nitrate [17,19,20]. Nitrogen, a crucial nutrient for improving crop productivity and stimulating plant growth, may exist in groundwater in various forms, including nitrate, nitrite, or ammonium [21]. Nevertheless, the excessive application of nitrogen-rich fertilizers in agricultural practices can pose a significant risk of water pollution [17]. Multiple studies have provided evidence indicating that nitrate pollution in the water could originate from both localized and diffuse sources [21]. For instance, [22] conducted a study on nitrate contamination and found a significant increase in groundwater nitrate concentration due to the abundant usage of land. Likewise, [23] conducted research revealing a positive link between the use of nitrogen-rich fertilizers in a specific area and elevated nitrate concentrations in groundwater. Recent studies have similarly established connections, expanding beyond fertilizer application to include various other human-induced processes and activities [17]. Despite the fact that nitrogen is advantageous in agricultural productivity, the contamination of water systems by nitrate can result in the degradation and impairment of ecosystems, prompting studies on nitrate removal [24].
Various techniques such as spatial mapping, graphical plotting, drinking water quality indexing, and machine learning are useful to accurately assess the current status of water resources [25,26]. As demonstrated by previous studies, spatial mapping techniques can have a substantial influence on assessing the water quality, enabling the identification of contamination hotspots and providing valuable insights into the spatial distribution of contaminants [27,28]. By mapping the contaminant concentrations, it becomes easier to identify areas with high levels of pollution, which can help prioritize mitigation/decontamination measures and target interventions where they are most needed. Indexical methods such as the water quality index (WQI), groundwater pollution index (GPI), and Synthetic Pollution Index (SPI) have been utilized to evaluate the appropriateness of groundwater for residential use [17,29,30]. Assessment of health risk has remained of particular significance, as it aims to estimate the potential risks faced by water users [7,17,21,31,32]. By considering exposure pathways and the levels of contamination in groundwater, it is easier for researchers to assess health risks associated with long-term use of contaminated water. Undoubtedly, this assessment provides critical information for policymakers and public healthcare professionals to safeguard the health of local human populations. Further, several multivariate statistical analyses often aid in identifying potential sources of contamination, thus facilitating effective remediation strategies [33,34].
It is worth mentioning that little work in the Al-Hassa area has been carried out to investigate the evaporation of lakes and its impact on agricultural water usage [35], the hydrogeologic characteristics [36], the hydro-chemical characteristics [37], and the spatial association between some chemical species (ions) and salinity [38]. While these studies have provided valuable insights into hydrogeology and overall groundwater quality, they did not undertake comprehensive health risk assessments to evaluate the potential risks posed to the local population. Understanding these critical issues is crucial for sustainable water management. Research on integrated water management strategies is highly needed to address the water quality challenges in Al Hassa. Therefore, this research aims to address these gaps by integrating classical techniques for (1) index-based groundwater quality assessment, (2) assessing contaminant enrichment processes, (3) assessing the fluoride and nitrate human health risk levels to water users, and (4) spatial mapping to identify contamination hotspots. By integrating graphical plotting, multivariate statistical analyses, indexical methods, and spatial mapping, the study seeks to provide a clear understanding of the subject matter. The findings of this research are therefore believed to contribute to the informed decision-making processes that could facilitate and ensure safe and sustainable groundwater resources in the region.

2. Materials and Methods

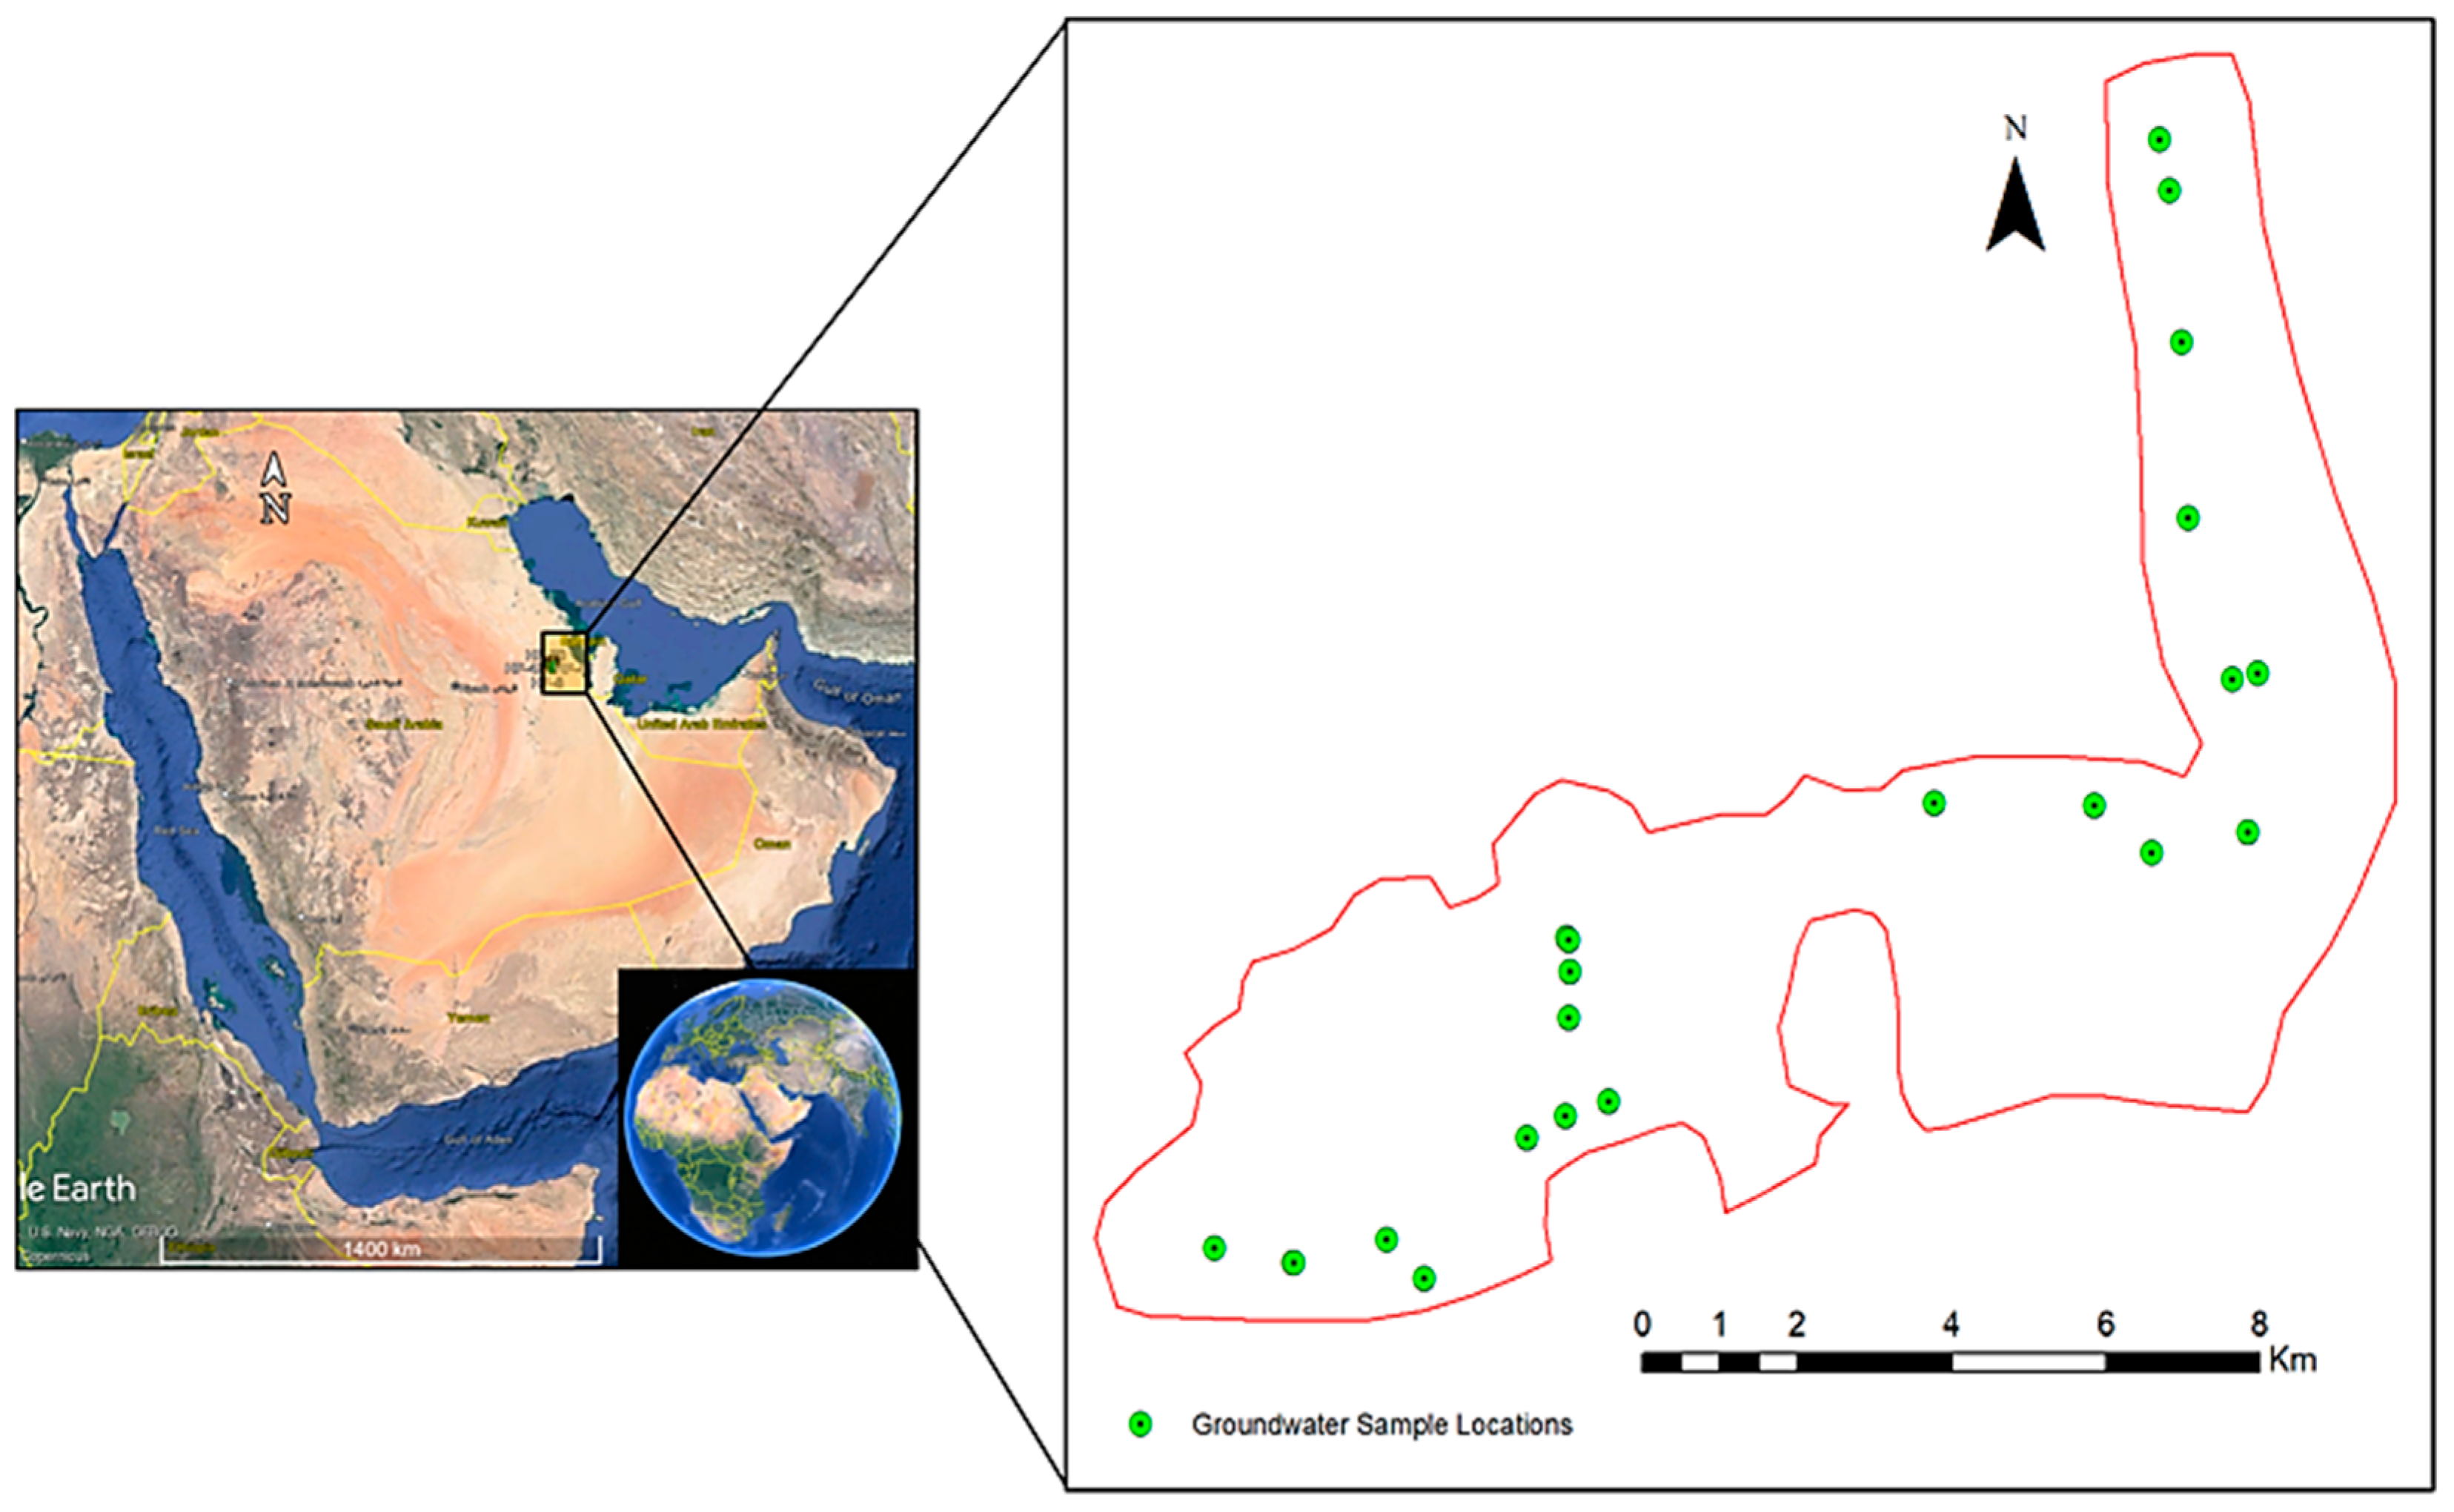
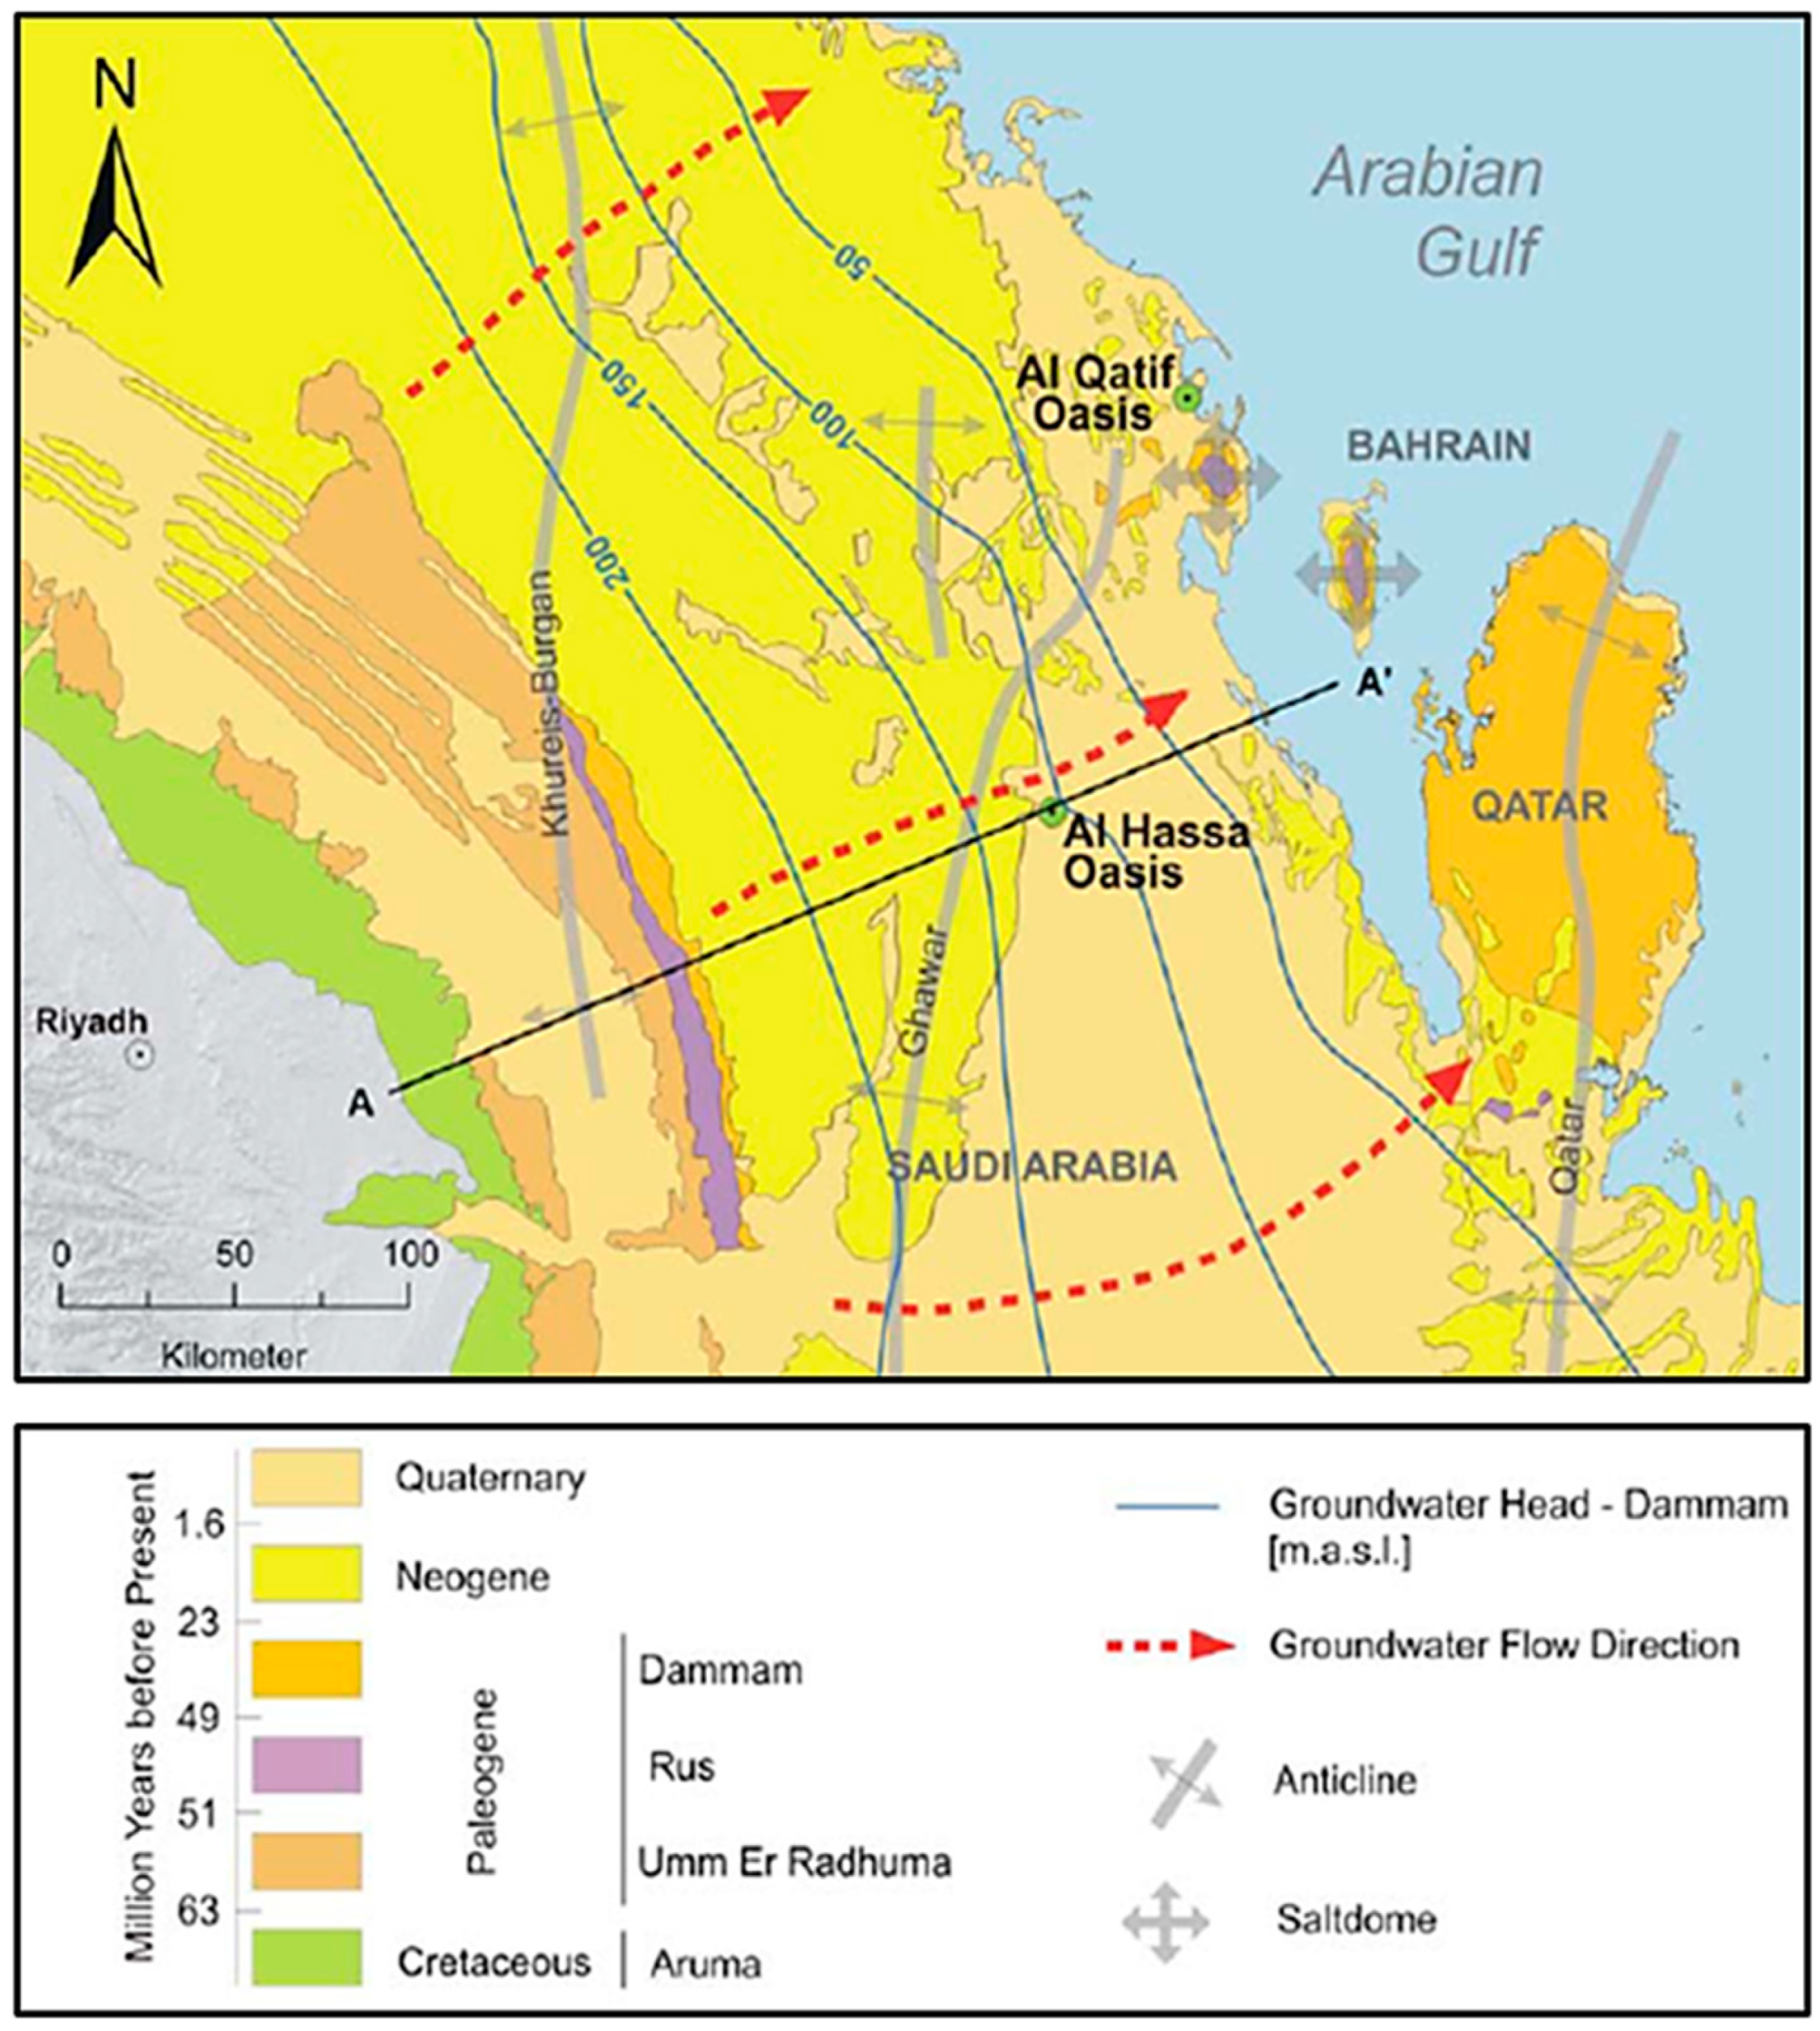
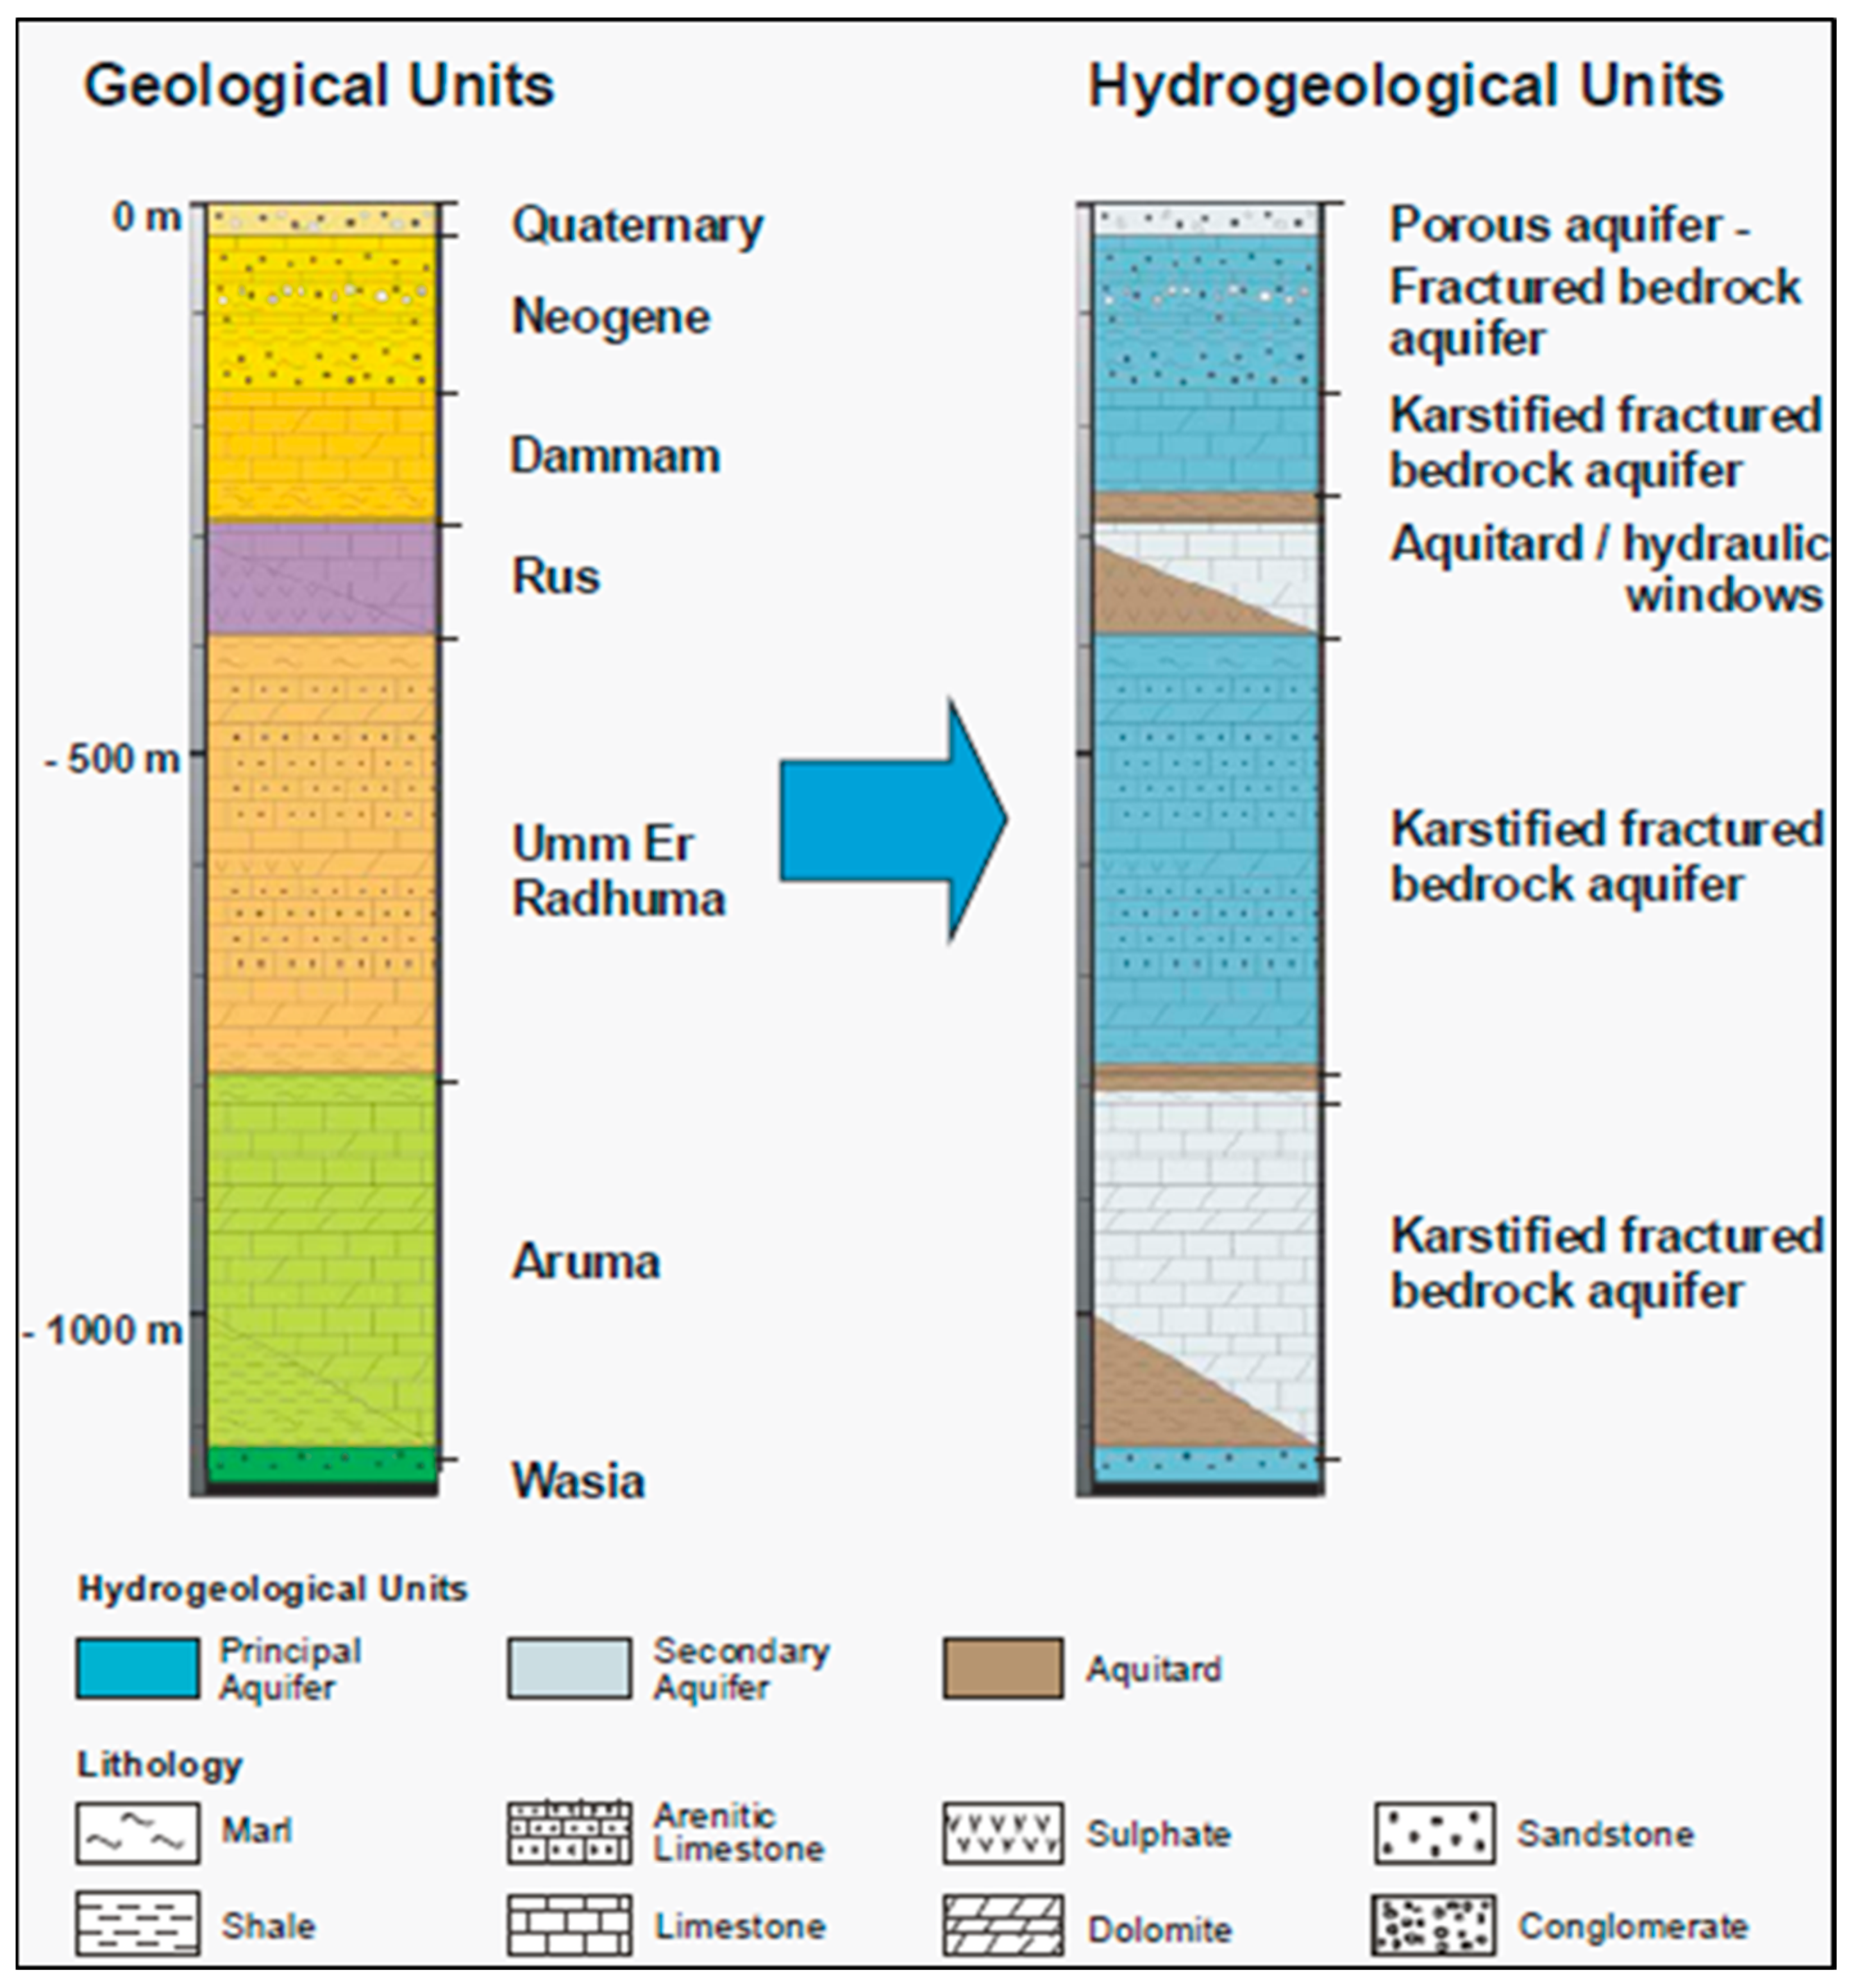
2.1. Study Area Description

The study area is positioned at about 320 km east of Riyadh and almost 70 km west of the Arabian Gulf coastline (Figure 1). Positioned at an elevation of roughly 130 to 160 m above sea level, it is sloping gradually towards the Gulf coast, between longitudes from 49°30′ to 49°50′ E and latitudes 25°20′ to 25°40′ N. The shape of the oasis is somewhat similar to the English alphabet “L”, with an axis length of around 30 km in the south–northeast direction and around 18 km from the west to the east. The total is 260 square kilometers [39]. The primary city in the region is Al-Hofuf City, located at the junction of two different axes at the southwest part of the oasis.
The climate of this region is subject to considerable variations across seasons and years. It is categorized by Mansour as being situated in the sub-tropical desert area, having cold, dry winters and very hot, dry summers, as per observation made by [40]; winter occurs from November to March month, with an average temperature of around 22 °C to 7.5 °C; meanwhile, from May to August, it lies in the range between 45 °C and 24 °C [39]. The country acknowledges the summer season as its hottest period. The relative humidity level fluctuates between 21% and 29% in the summer, rising to 31% to 55% in the winter, with a monthly average of 38%. Rainfall is most frequent in the winter and spring, with an average annual total of 85 mm.
The complicated multi-aquifer groundwater system in the Al-Hassa area is made up of Late Cretaceous and Tertiary formations such Aruma, Umm Er Radhuma, Rus, Dammam, and Neogene. The Rus Formation acts as a barrier between the Umm Er Radhuma and Dammam aquifers, preventing full interconnection between these aquifers. Limestone, marls, and evaporates make up the Rus formation (Figure 2) [41]. The primary direction of groundwater flow within the aquifer system is oriented from southwest to northeast (Figure 2) [41].
There are four partially linked aquifers that make up the groundwater system in the research region. The Neogene aquifer complex comprises porous clastic aquifers and karstified fractured bedrock aquifers. The Umm Er Radhuma aquifer is characterized by a karstified fractured bedrock, and the Dammam aquifer complex features a partially karstified fractured bedrock aquifer (Figure 3) [41]. The three formations that make up the Neogene aquifer are Hofuf, Dam, and Hadrukh. The Hofuf Formation has a thickness ranching from 20 to 100 m, while the Dam and Hadrukh formations have a thickness ranging from 100 to 200 m. These formations are highly fissured and have considerable secondary porosity. While the recharge region in this aquifer stretches to the southwest, the subsurface water mainly flows northeast.

2.2. Sampling of Groundwater and Testing of Physicochemical Variables

To perform physical and hydrochemical analyses, groundwater samples collected from Neogene aquifer were assessed at the lab. To remove any standing water, the groundwater wells were drained for 15 min prior to measurement. In a field survey, 30 groundwater samples from wells randomly chosen across the research region were collected and examined. Following the procedures set by the global standards (US-EPA) [42], several physicochemical parameters of the collected water samples were assessed that are indicative of water quality. For instance, the pH, electrical conductivity (EC), total dissolved solids (TDS), and turbidity were all measured in situ using Hanna GPS Multiparameter Meter (HI9829). The concentration of bicarbonate was evaluated using acid titration techniques, and the ions contained in the groundwater samples were identified using ion chromatography. Chlorine (Cl), sodium (Na+), magnesium (Mg2+), calcium (Ca2+), potassium (K+), and bicarbonate (HCO3) were among the water characteristics that were evaluated.

2.3. Drinking Water Suitability Assessment

2.3.1. Groundwater Quality Pollution Index

It has been observed in a few studies [30] that the groundwater pollution index (PIG) is taken into consideration as a surveillance and evaluation tool for ensuring the safety of drinking water [43,44]. The evaluation of PIG involved five sequential stages. Initially, the relative weight (Rw) of the investigated parameters was estimated using a rating system ranging from 1 to 5 (Table 1), with the assignment of weights with respect to the parameters’ relevance and impact on possible human health [30]. Afterward, the subsequent steps outlined in Equations (1)–(4) were executed accordingly.
W p = R w Σ R w
S c = C D s
O w = W p × S c
P I G = Σ O w
where Wp = the weight parameter allocated to every individual groundwater quality parameter; Rw represents the relative weight assigned to a specific variable; Sc refers to the concentration status of a given variable; C = the level of the examined parameter for an individual sample; Ds highlights specific parameter’s drinking water quality acceptable boundary (World Health Organization (WHO); Ow denotes overall quality of individual samples.

2.3.2. Synthetic Pollution Index

Similar to the PIG, numerous scientists have effectively utilized the synthetic pollution index (SPI) to estimate contamination levels of water resources [17,45,46] and determine their suitability for drinking purposes. The assessment of SPI involved employing three mathematical formulas (Equations (5)–(7)):
i = 1 n V o V s × W i
W i = K V s
K = 1 / i = 1 n 1 V s
In the above equations, K = proportionality constant; vs. represents the recommended (World Health Organization (WHO) 2011) concentration for each groundwater variable; the variable n shows the total count of considered groundwater factors; Vo denotes level of each individual variable; and Wi = each variable’s weight coefficient [29].

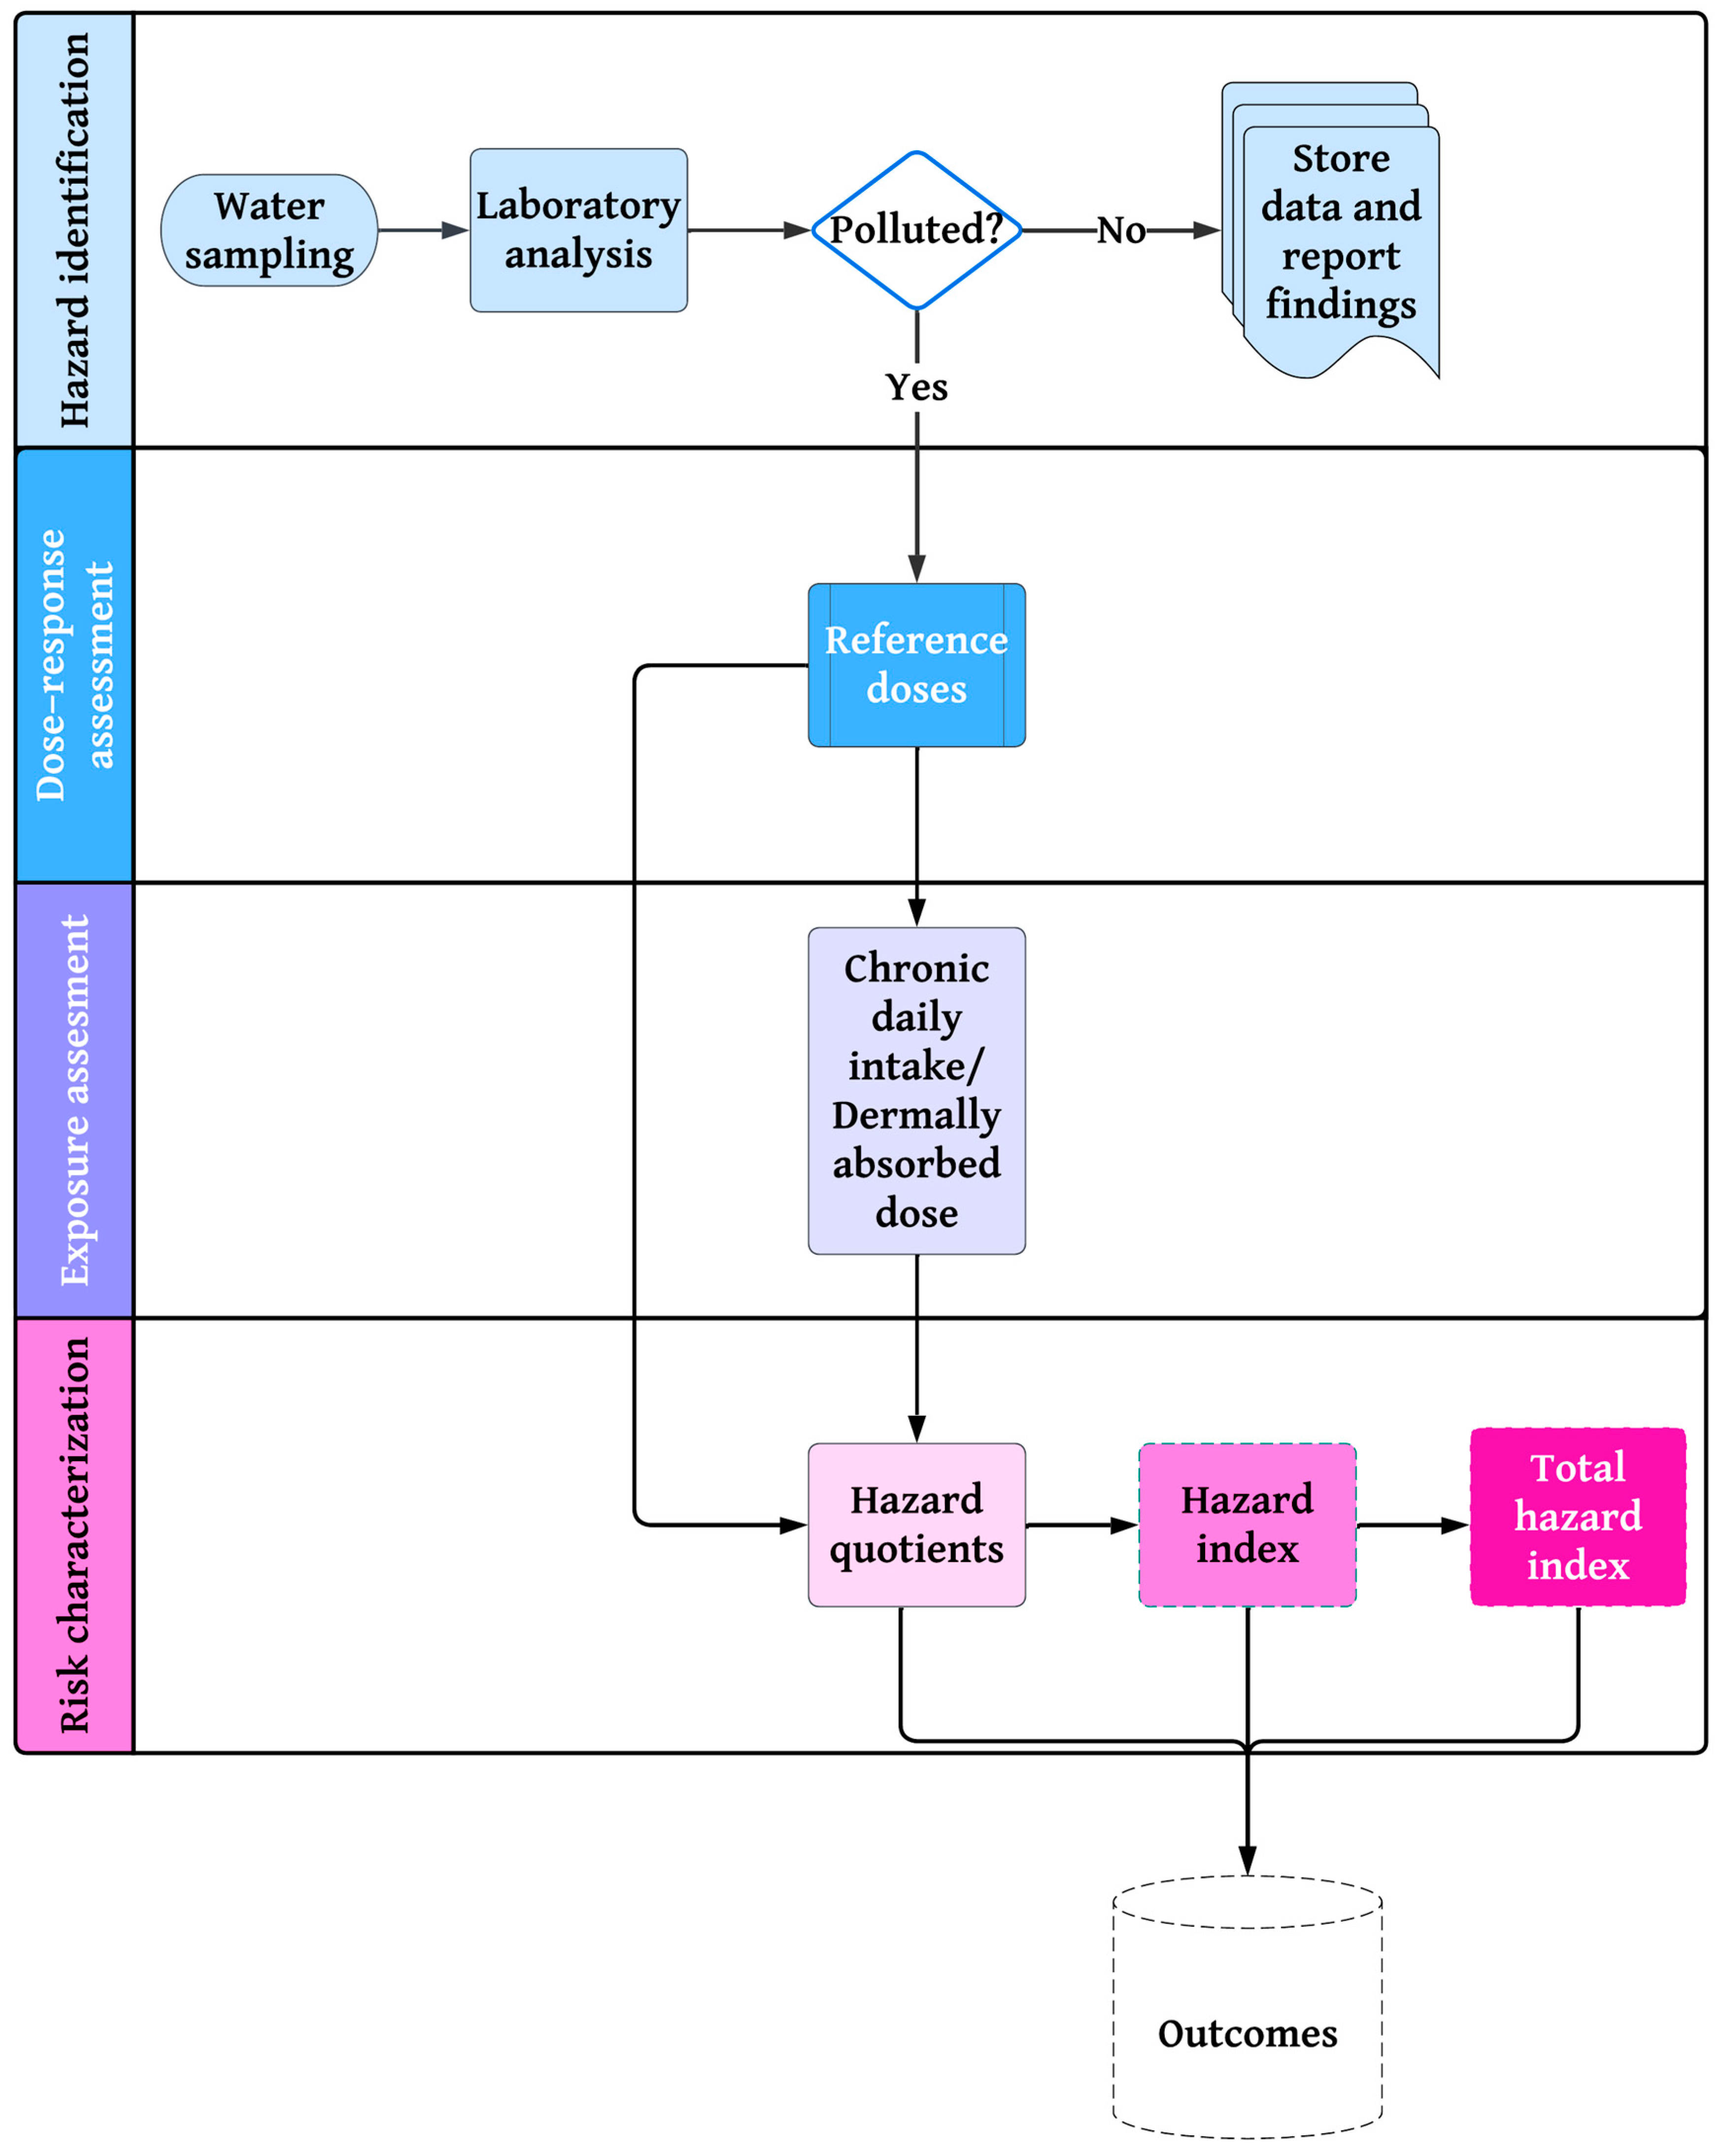
2.4. Human Health Risk Assessment

2.4.1. Human Health Risks Due to Fluoride and Nitrate Ingestion

Human health risk assessment (HHRA), formed by the USEPA (United States Environmental Protection Agency) 1989), is a powerful probabilistic approach for identifying extremely dangerous bacterial groups in drinking water and possible related health impacts on the ecosystem. It has been used throughout the last three decades to evaluate the long-term health consequences of water pollution [47]. In compliance with the USEPA (United States Environmental Protection Agency) 1989), hazardous species are categorized as either non-carcinogenic or carcinogenic, with F and NO3 belonging to the first category. Non-carcinogen-contaminated water poses a risk to human health when consumed or comes in direct contact with the skin [48]. However, oral ingestion has been identified by studies as the most dangerous exposure path [17,31]. Consequently, this study examined the health hazards caused by F and NO3 via the oral route in three age categories: infants (<2 years), children (2–16 years), and adults (>16 years) [17,31]. The summary of the HHRA model used in this study is presented in Figure 4. The non-carcinogenic hazards relating to F and NO3 polluted groundwater were calculated using Equations (8)–(11).
C D I = C × I R × E F × E D B W × E T
where CDI symbolizes the chronic daily intake; C = F and NO3 levels in groundwater; the ingestion rate is called IR; the exposure frequency is denoted by the symbol EF; ED means the exposure length; BW = the mean weight of a person; and ET signifies the typical duration of exposure. Table 2a shows the numerical values of each variable represented in Equation (8).
Equation (9) was used to calculate the fluoride and nitrate hazard quotients (HQs) for all age categories.
H Q i n g e s t i o n = C D I R f D  
In the scenario above, RfD signifies the reference dosage.
Next, Equation (10) was employed to calculate the cumulative health hazard index (HIcumulative) for fluoride and nitrate present in the analyzed groundwater resources [17].
H I c u m u l a t i v e = i = 1 n H Q i n g e s t i o n i t h   a g e   g r o u p s  
Additionally, the total hazard index (THI) values were computed using Equation (11) to assess the long-term risks associated with fluoride and nitrate [31,32,52].
T H I i n g e s t i o n = ( H I N O 3 + H I F )  
When the total hazard index (THI) value is greater than 1, it indicates a high chronic health risk. Conversely, a THI value below 1 signifies a negligible health risk (USEPA (United States Environmental Protection Agency) 1997) [31,32,52].

2.4.2. Human Health Risks Due to Nitrate Dermal Absorption

The associated health risks of nitrate via the dermal route were determined for children, women, and men using the three mathematical formulas presented in this section (Equations (12)–(14)) [27,31,32,52].
D A D = C × T C × K i × E V × E F × E D × S S A × C F B W × A T  
The definitions and numerical values representing the variables in Equation (12) can be found in Table 2b.
Equation (13) was utilized to calculate the dermal HQ for nitrate.
H Q d e r m a l   ( N O 3 ) = D A D R f D  
The aggregate health risk from cutaneous nitrate uptake was calculated using Equation (14) [17].
H I c u m u l a t i v e = i = 1 n H Q d e r m a l i t h   a g e   g r o u p s  

2.5. Spatial Mapping for Identification of Contamination Hotspots

The methodology for producing maps for the spatial analysis of water quality involved a few steps in the ArcGIS software (version 10.3). Firstly, the water quality indices calculated for various sampling points across the study area were prepared. The data points were then georeferenced using geographical positioning system (GPS) coordinates. Subsequently, the spatial kriging interpolation technique was employed to predict water quality values at locations where measurements were not taken, utilizing the available measured data [38]. These interpolated values were then utilized to generate a continuous surface, portraying the distribution of water quality throughout the study area. Finally, the water quality surface was visualized through thematic mapping techniques, employing color gradients to represent different levels or categories of water quality.

2.6. Graphical and Chemometric Techniques for Contamination Source Identification

Several studies have reported that geochemical plots could be viable methods for determining spatial trends of various pollution [17]. To demonstrate the relationships between the evaluated groundwater quality variables and their likely sources, multivariate and bivariate charts were created. In addition to ionic charting, chemometric analysis has been an effective approach to exploring pollutant origins in water supplies [53]. In the present research, two chemometric approaches, namely (i) Pearson’s correlation and (ii) principal component analysis were applied to achieve the aforementioned purposes. Using IBM SPSS Statistics (v. 22), chemometric methods were implemented on the groundwater quality data.

3. Results

3.1. General Groundwater Quality Characterization

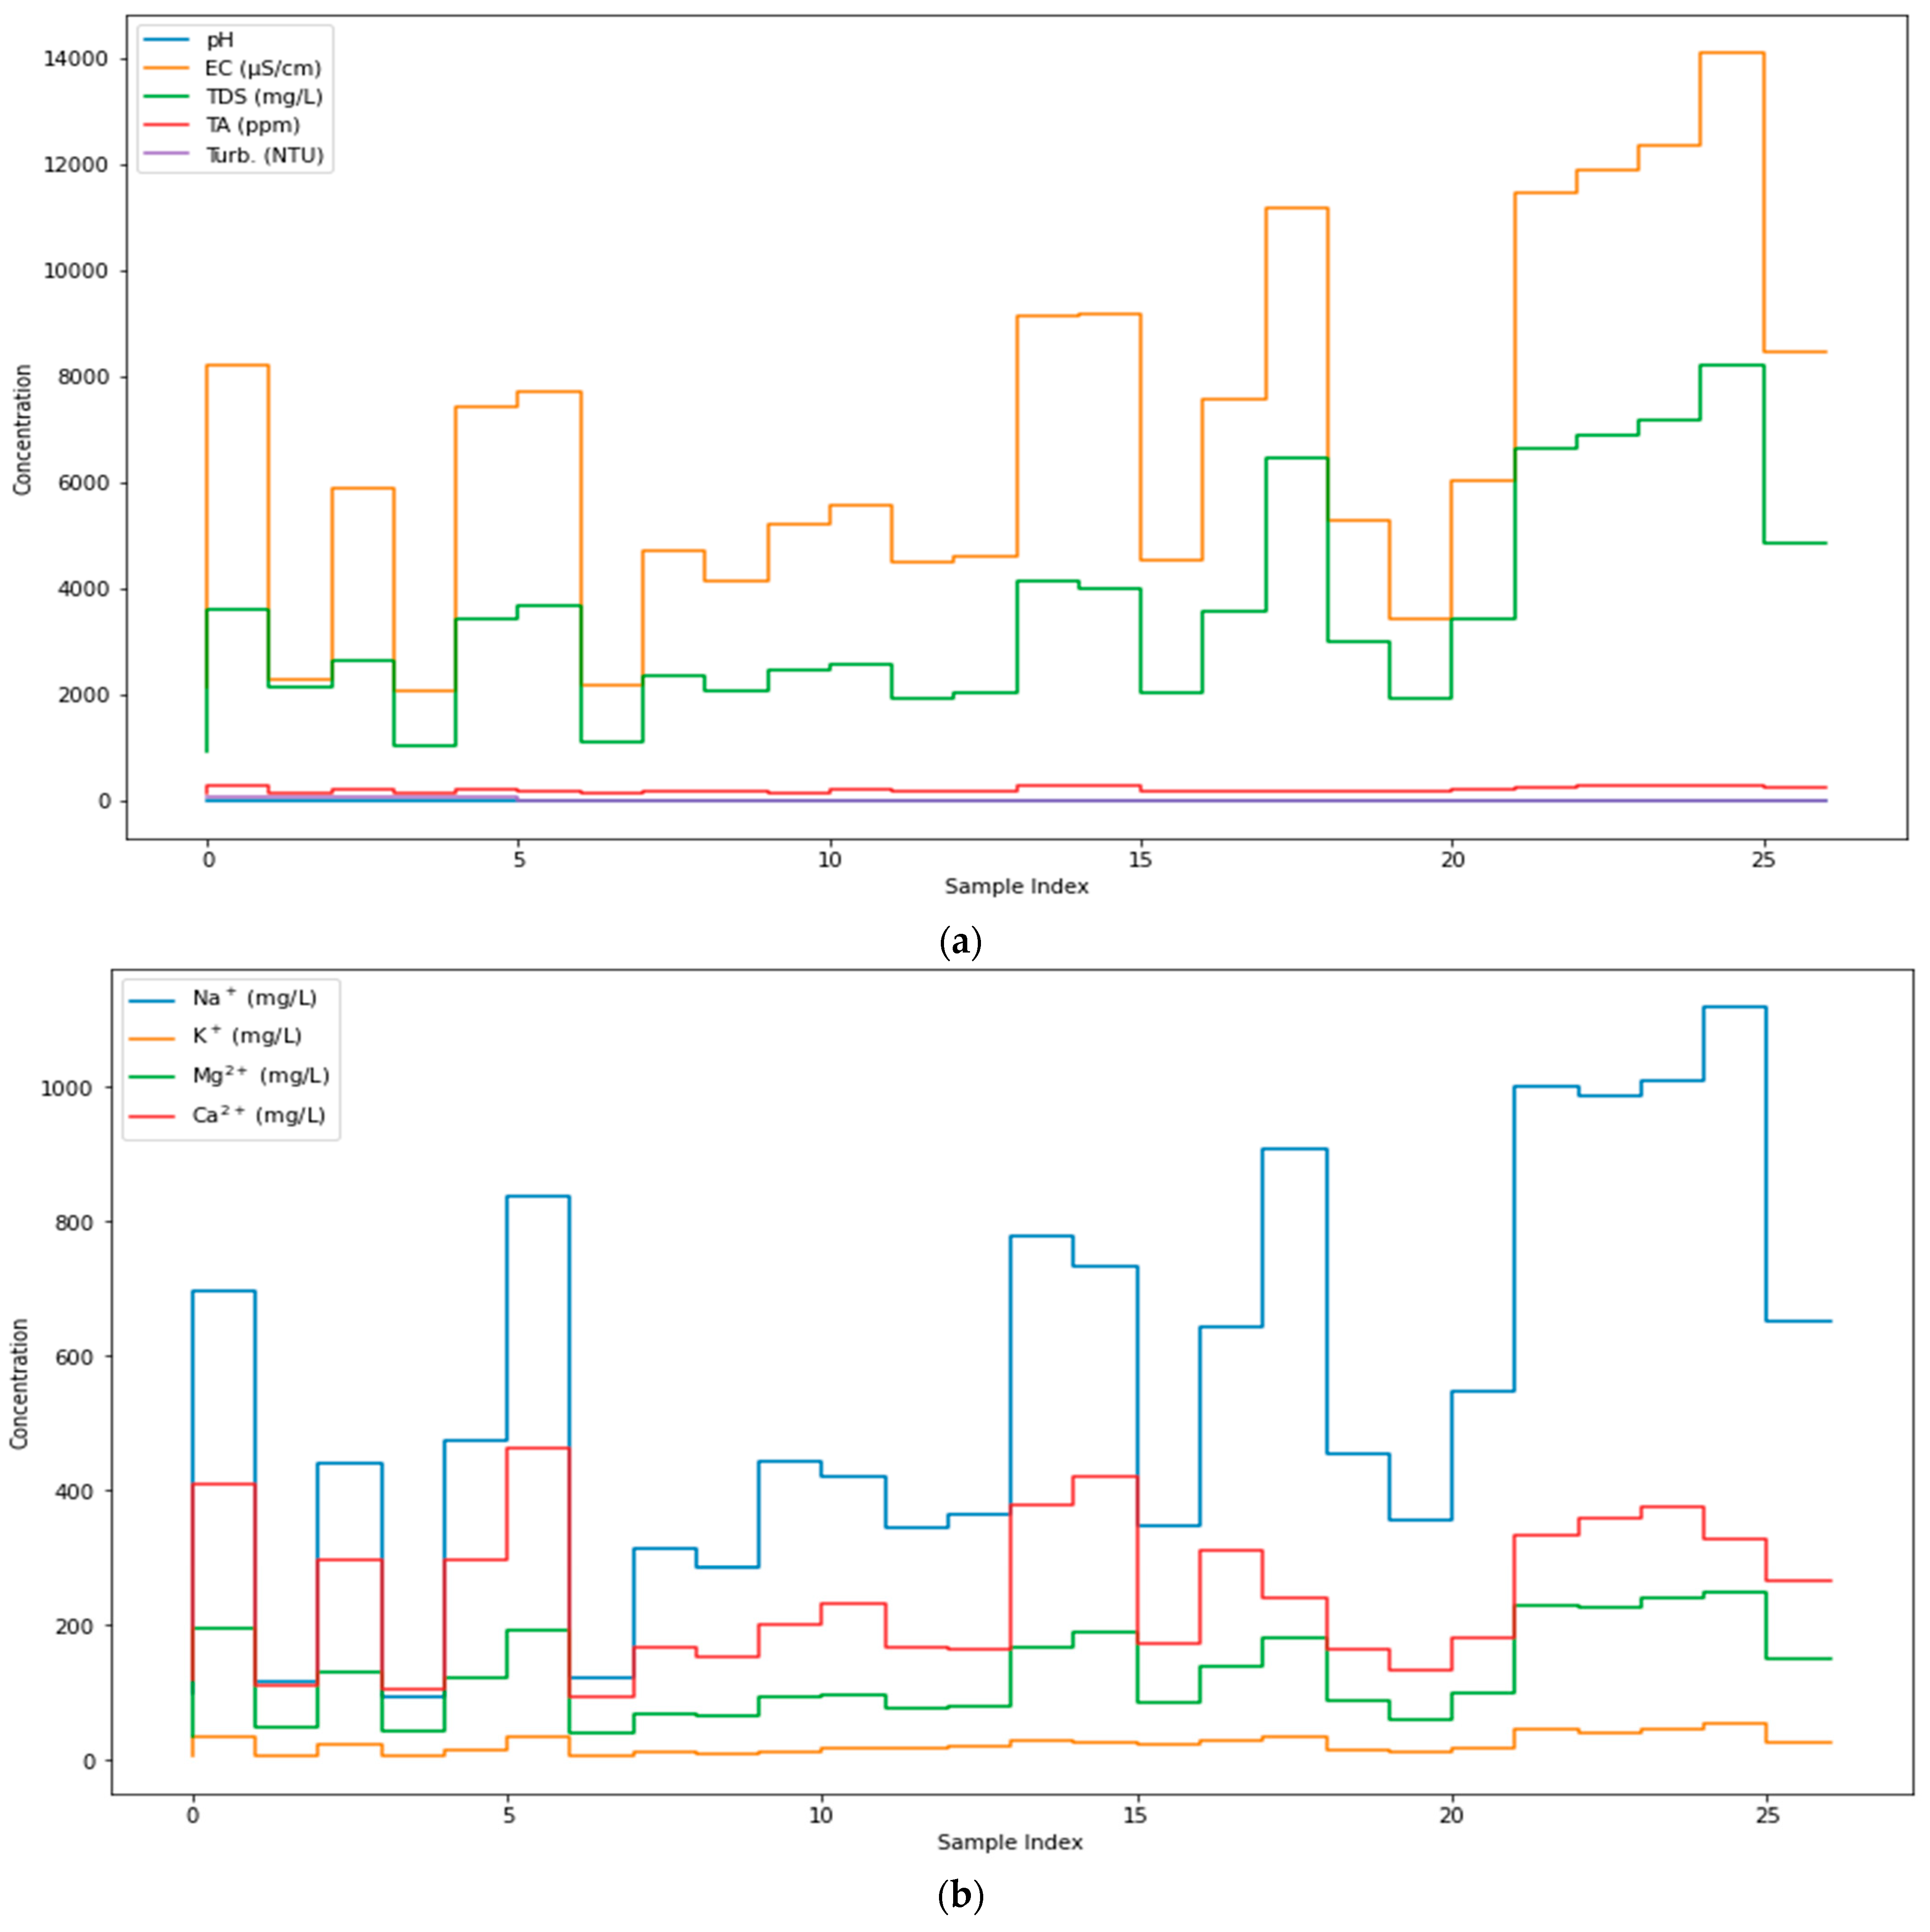
3.1.1. Physical Parameters

The quality of groundwater was assessed following the World Health Organization (World Health Organization (WHO) 2011) criteria, and the statistical analysis is presented in Table 3. The physical parameters’ distribution can be visualized in Figure 5a. The pH levels ranged between 6.57 and 7.40, averaging 7.06. These pH measurements align with the WHO guidelines, indicating that the groundwaters fall within the acceptable range. These findings were in compliance with a recent study conducted in a neighboring area by [17] where the average pH reading was reported as 7.12. Moreover, investigations carried out in coastal regions of China [54] and Bangladesh [55] have reported a similar average pH range of 7–8.
In terms of electrical conductivity (EC), readings varied from 2062.97 µS/cm to 14,114.58 µS/cm, averaging 6715.78 µS/cm, exceeding the permissible limit. A recent study on coastal groundwater in Bhola District, Bangladesh, reported an average EC of 588.15 µS/cm [55], indicating a notable difference between the two reports. However, the EC values observed in this study align with those found in coastal aquifers of Southern Kenya [56], Western Cape Province, South Africa [57], and South India [58]. Typically, fresh groundwater unaffected by saltwater intrusion exhibits mild salinity and, thus, low EC values. Therefore, elevated EC values in coastal groundwater are often associated with seawater intrusion. Ref. [59] suggested that if the coastal aquifer is overexploited, the freshwater-saltwater interface gradually moves inland, intensifying the impact of saltwater intrusion.
Similarly, total dissolved solids (TDS) readings ranged between 928 mg/L to 8226.97 mg/L, averaging 3492.38 mg/L, surpassing the allowable limit and indicating that the groundwater is inappropriate. Upon comparison with the former studies performed in western Saudi Arabia, the average TDS readings were 866.38 mg/L in Makkah province [60] and 1714.29 mg/L in Wadi Fatimah [61]. Regarding groundwater turbidity, it ranged between 0.27 NTU and 85.07 NTU, averaging 18.43 NTU. The majority of the samples were found to be within the acceptable turbidity range, with only six samples (AHF-1 to 6) exhibiting high turbidity levels (Table 3). Nevertheless, based on the average ratings, the overall physical properties of the Al Hassa groundwater samples exceeded the WHO’s permissible limits (WHO).

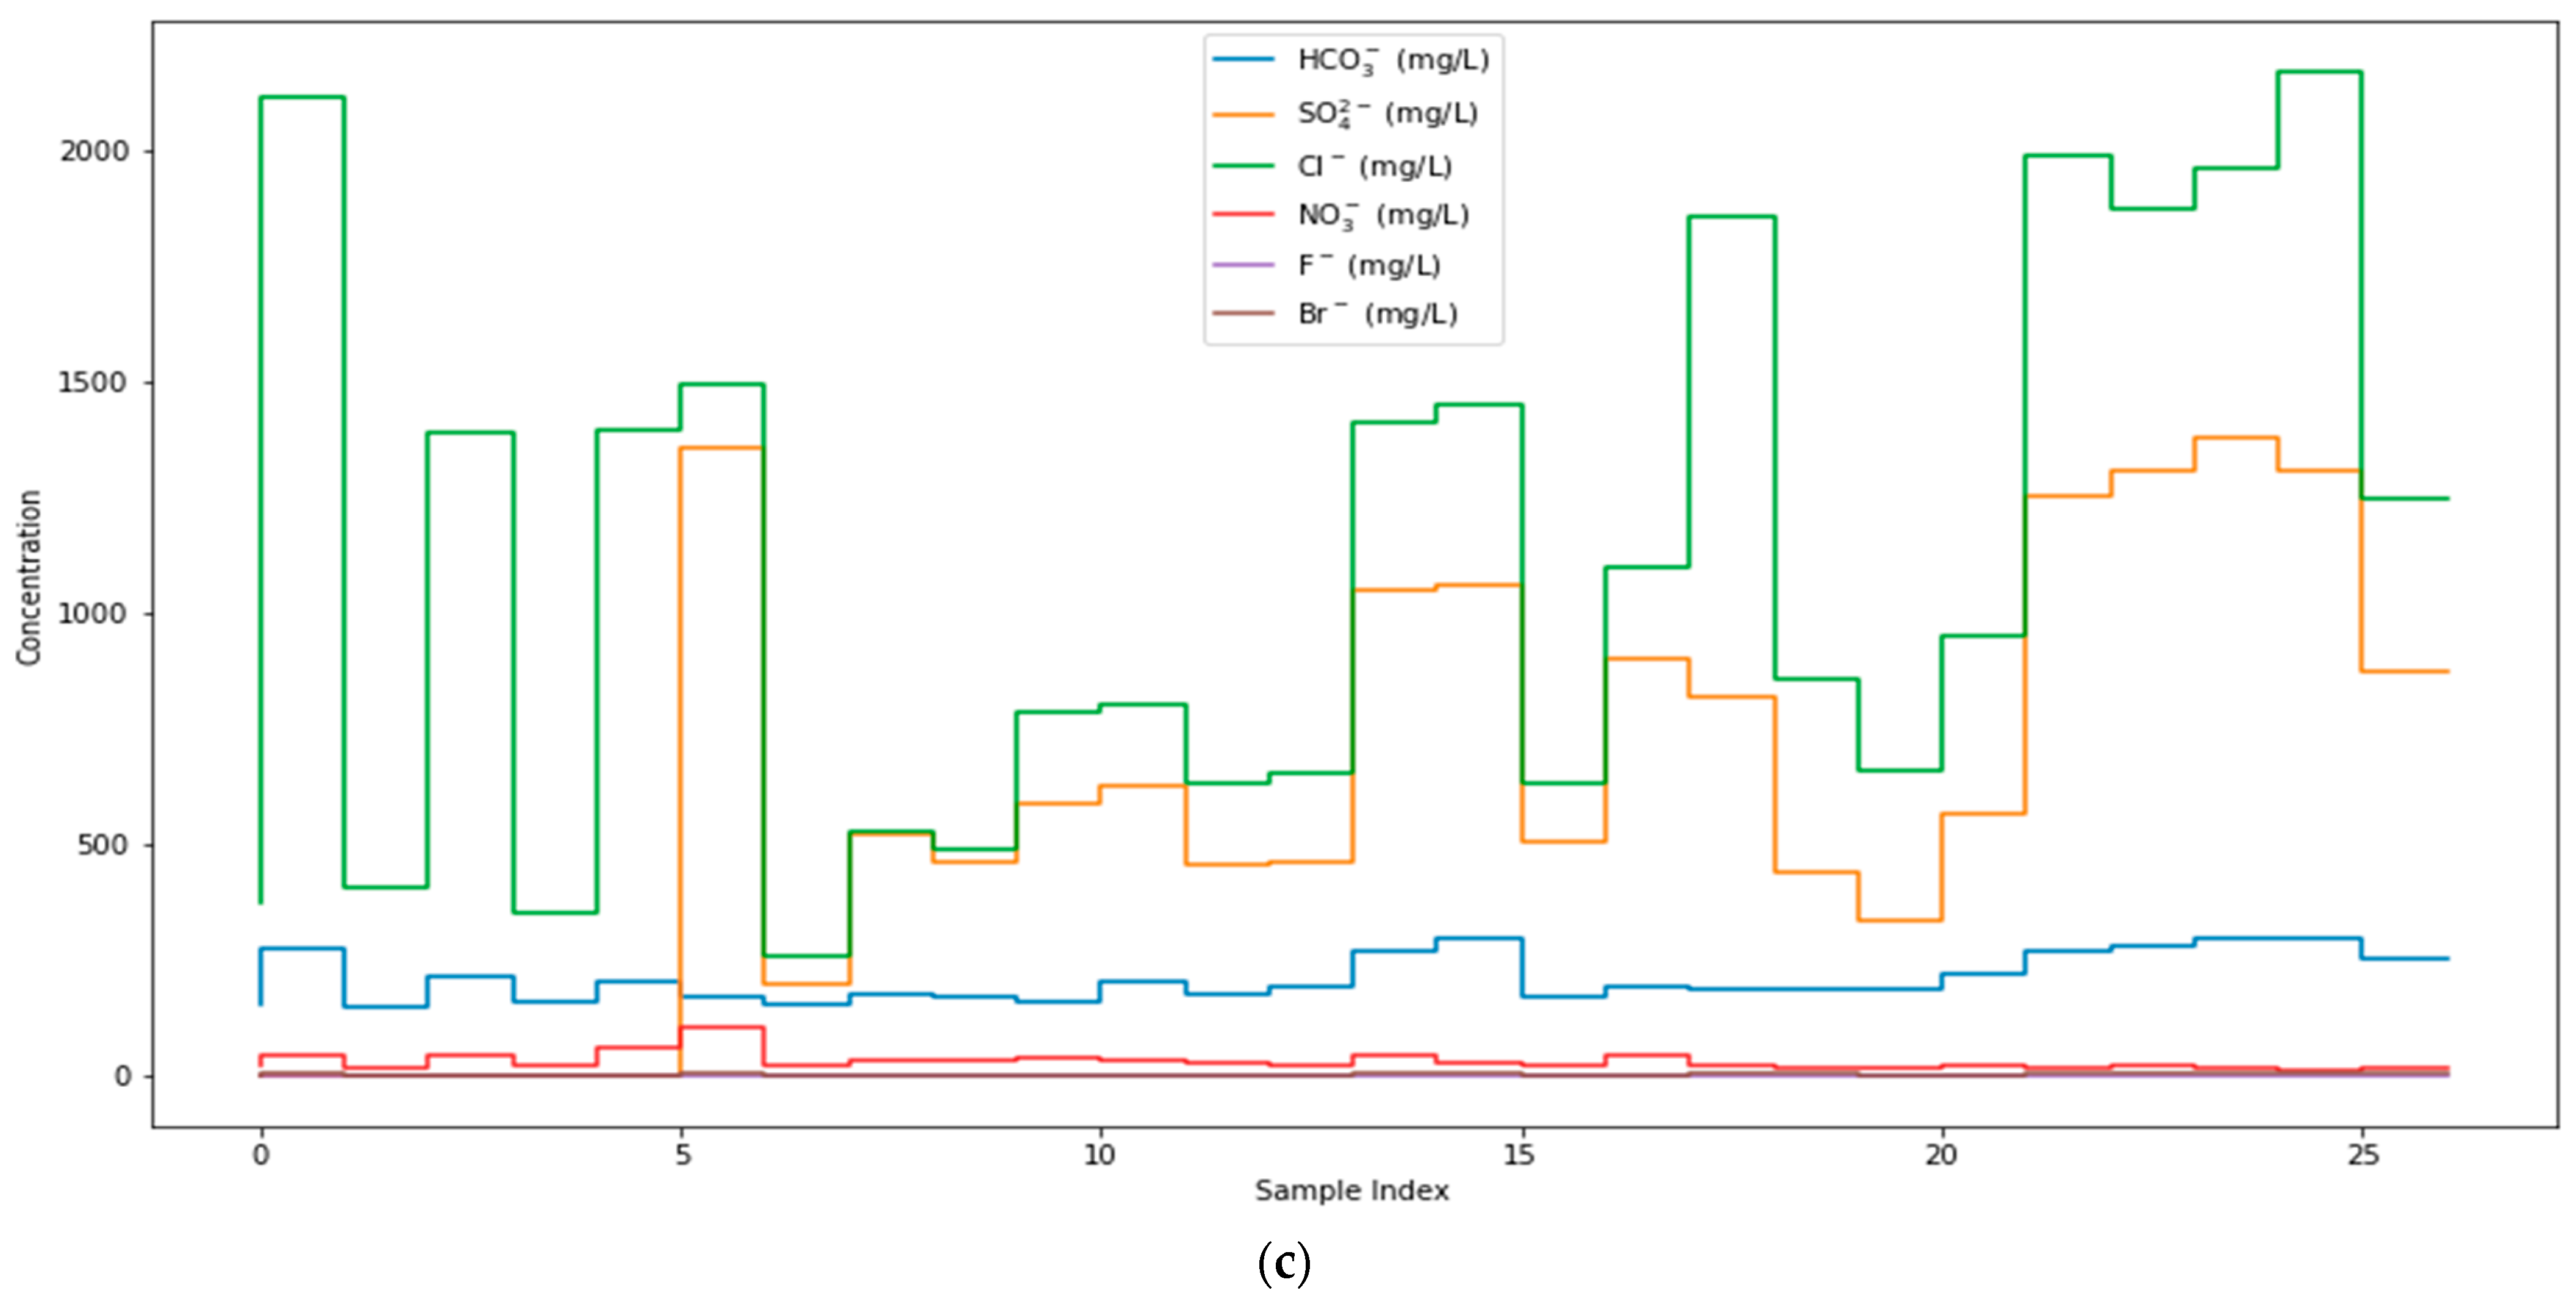
3.1.2. Chemical Parameters

Chemical species play a crucial role in hydrogeochemical processes, involving mechanisms such as disintegration, bidirectional ion exchanges, evaporation, and condensation. The ions identified in this study include Na+, K+, Mg2+, Ca2+, HCO3, SO42−, Cl, NO3, F, and Br. Among the cations studied, the prevalence in groundwater followed the order: Na+ > Ca2+ > Mg2+ > K+, highlighting Na+ as the most abundant cation, followed by Ca2+ and Mg2+ (Figure 5b). Na+ is widely recognized as a significant cation in the field of chemistry. In this research, Na+ concentrations exhibited considerable regional variation, ranging from 95.03 mg/L to 1120.09 mg/L. Moreover, more than 85% of the groundwater samples exceeded the permissible maximum limit of 200 mg/L for Na+. High levels of Na+ can be attributed to processes such as halite dissolution, silicate weathering, and excessive extraction of coastal groundwater [14,62,63]. K+, originating from the decomposition of potassium feldspar and clay materials in the subsurface [64], displayed a range from 6.30 mg/L to 53.68 mg/L. Approximately 70.37% of the groundwater samples surpassed the allowable threshold of 12 mg/L for K+. The dissolution of dolomite and weathering of silicates are common sources of Mg2+, which fluctuated in concentrations from 33.59 mg/L to 248.40 mg/L. However, in coastal areas, the intrusion of seawater with elevated Mg2+ concentrations can contribute to higher levels of Mg2+ in groundwater [14]. Ca2+ levels in groundwater samples ranged from 94.83 mg/L to 464.05 mg/L. The presence of Ca2+ can be attributed to the breakdown of CaMg(CO3)2 and CaCO3 precipitates during groundwater recharge [65].
The average concentrations of the anions were found to follow this order: Cl > SO42− > HCO3 > NO3 > Br > F (Figure 5c). The cation and anion concentrations show that Na+-Cl and Na+-SO42− water types persist in the research region. This finding supports the notion that salt accumulation mechanisms might have a major impact on the quality of groundwater. Moreover, it further indicates that NaCl and Na2SO4 salts may precipitate and exist in the coastal groundwaters. It is also sufficient to state that two types of calcium salts (CaCl2 and CaSO4) are abundant in the aqueous ecosystem. As a result, there may be a surplus of Ca2+-SO42− and Ca2+-Cl varieties of groundwater in the region.

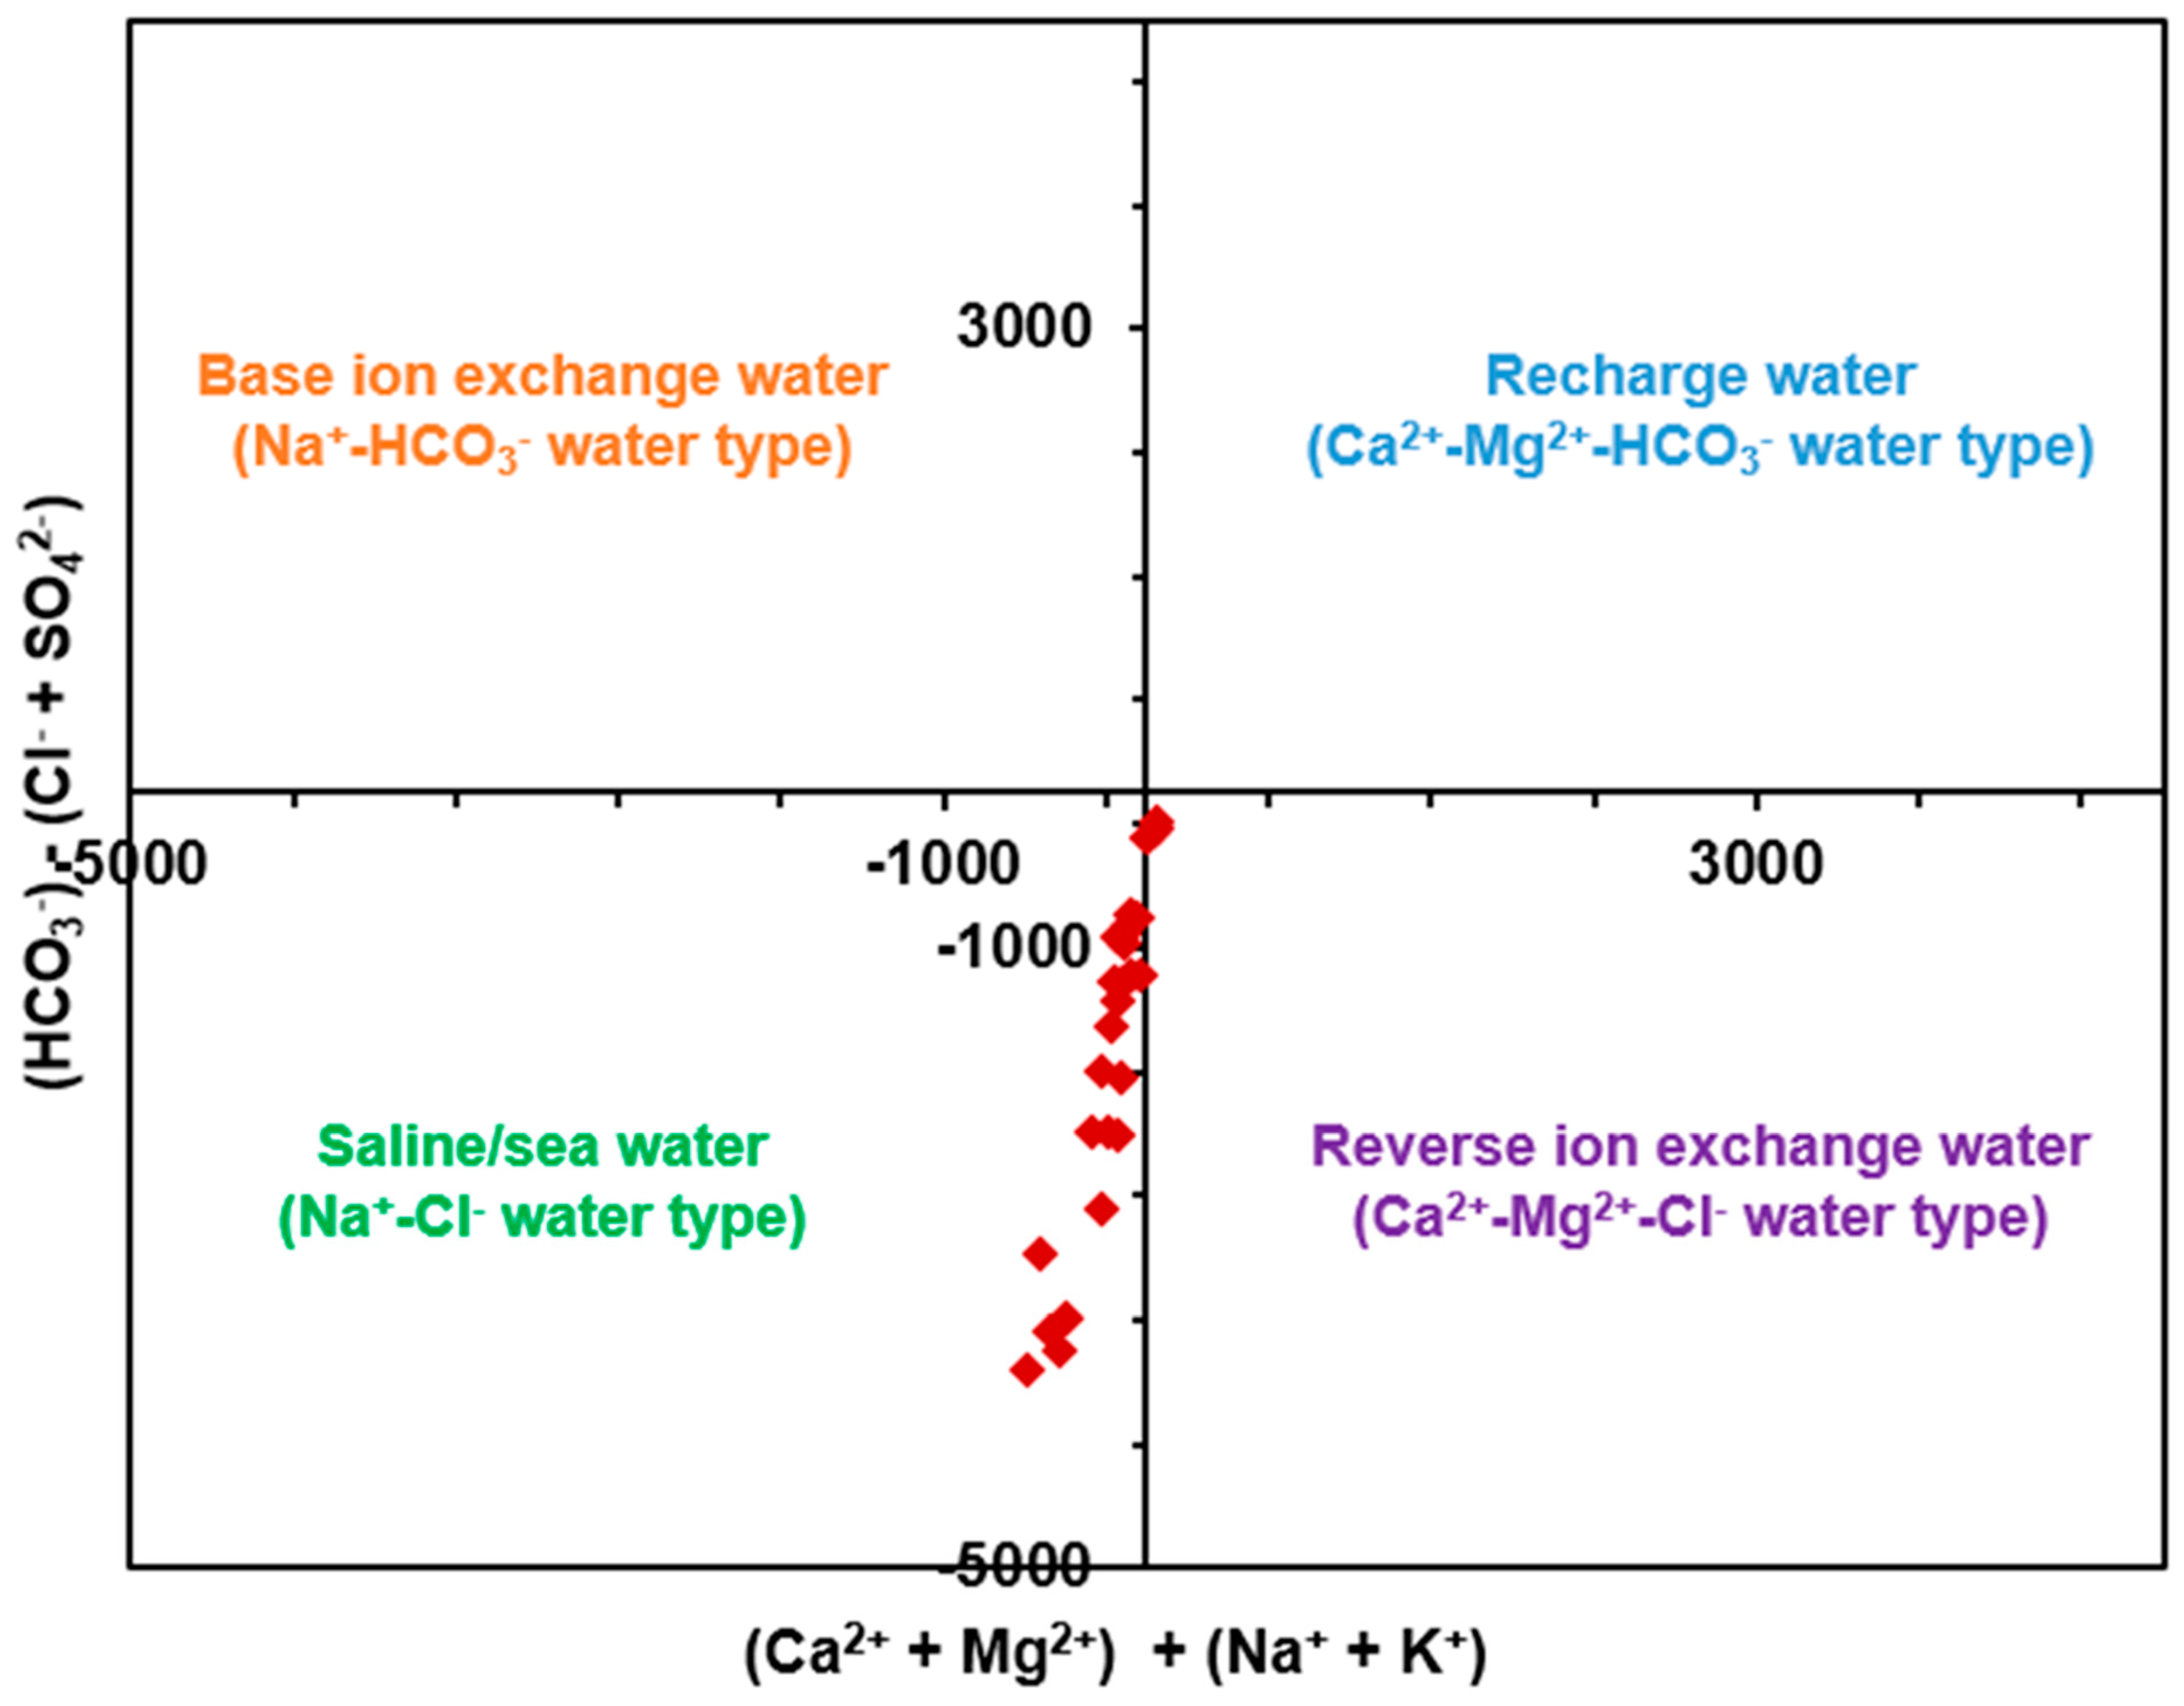
3.1.3. Prevalent Water Type

To understand geochemical processes, a Chadha (1999) geochemical plot was produced (Figure 6). In several regions of the world, this plot has been found to be very useful in characterizing water types and potential contamination factors [17,33]. The plot demonstrates that the analyzed groundwater samples are primarily divided into two sets: one characterized by a Na–Cl water type whereas another by a Ca–Mg–Cl water type. Most samples clustered around the Na–Cl water type, indicating that saltwater intrusion plays a predominant role in the hydrochemistry, with a secondary contribution from the reverse ion exchange mechanism. Similar conclusions have been reported in coastal regions of India during different seasons, for instance, the Southwest Monsoon in Nagapattinam district [58] and summer in South Chennai [14]. Water consumption with high salinity could lead to health issues, including skin infections, severe respiratory infections, vomiting, elevated blood pressure, and unsuccessful pregnancies [23,66]. Furthermore, there is no apparent influence of base ion exchange mechanisms or recharge water flow on either of the samples. Considering the primary types of water observed in locality, it is clear that climate factors are vital in hydrological dynamics. Moreover, the observed differences in physical and chemical properties across the research region suggest spatiotemporal variations in the mechanisms that impact groundwater quality throughout the entire area.

3.2. Drinking Water Suitability Assessment

3.2.1. Pollution Index of Groundwater

The PIG index was used to evaluate the groundwater condition at Al-Hassa oasis for consumption purposes, as shown in Table 4. According to studies that have utilized the PIG [49], the values can be interpreted in terms of pollution levels as very high (PIG greater than 2.5), high (PIG between 2.0 and 2.5), moderate (PIG between 1.5 and 2.0), low (PIG between 1.0 and 1.5), and insignificant pollution (PIG less than one). The PIG value ranged from 0.8426 to 4.7172, with sample AHF-29 having the highest value, indicating unfit water (Table 4). In summary, the categorization method pointed out that the samples are polluted in the following ways: insignificant (3.70%), low (7.41%), moderate (33.33%), high (7.41%), and very high (48.15%). As stated by [30], the Ow value can be used to understand the individual contributions of groundwater variables on the overall water quality. In this study, EC and fluoride were identified as the most and least influential parameters (Table 4). The contributions of all variables can be visualized in Figure 7a.

3.2.2. Synthetic Pollution Index

The SPI classifies the classification of groundwater samples into several categories. Group 1 represents appropriate drinking water, characterized by an SPI value of less than 0.2. Group 2 comprises slightly polluted water with SPI values ranging from 0.2 to 0.5. Moderately polluted drinking water falls under Group 3, with SPI values ranging from 0.5 to 1.0. Highly polluted water is categorized as Group 4, with SPI values ranging from 1.0 to 3.0. Lastly, Group 5 represents extremely polluted and inappropriate drinking water, with an SPI value exceeding 3.0. These classifications have been documented in studies conducted by [29]. The summarized results of the SPI analysis presented in Table 5 reveal that 0% have neither excellent quality nor are slightly polluted, 48.15% are moderately polluted, about 33.33% fall into the highly polluted class, and the remaining 18.52% are deemed to be unsuitable drinking waters. Based on the mean individual parameters’ SPI scores, it was found that turbidity (44.55% contribution) and barium (26.43% contribution) were the major influencers of the groundwater quality (Table 5; Figure 7b). Conversely, EC (0.25% contribution), TDS (0.13% contribution), and (0.12% contribution) had the least impact on the overall water quality. In comparison with other studies that have utilized the SPI, this region has a less desired groundwater quality than reports in Hailun, China [67], Southern Nigeria [68] and Northwest Nigeria [69]. Nevertheless, the reports of this study are better than those of [17] in Al-Qatif, Saudi Arabia; [70] in Taluka Larkana, Pakistan; and [71] in Baiji Province, Iraq.

3.3. Human Health Risk Assessment

In accordance with the Environmental Protection Agency (USEPA (United States Environmental Protection Agency) 1989), the evaluation of non-carcinogenic health risks in groundwater involves the utilization of the hazard index (HI), which determines the degree of exposure. The categorization is as follows: high risk (HI ≥ 4), moderate risk (4 > HI ≥ 1), low risk (1 > HI ≥ 0.1), and negligible risk (HI < 0.1), respectively. In the following subsections, the non-carcinogenic impacts of groundwater nitrate and fluoride on the health of Al-Hassa residents are discussed in detail.

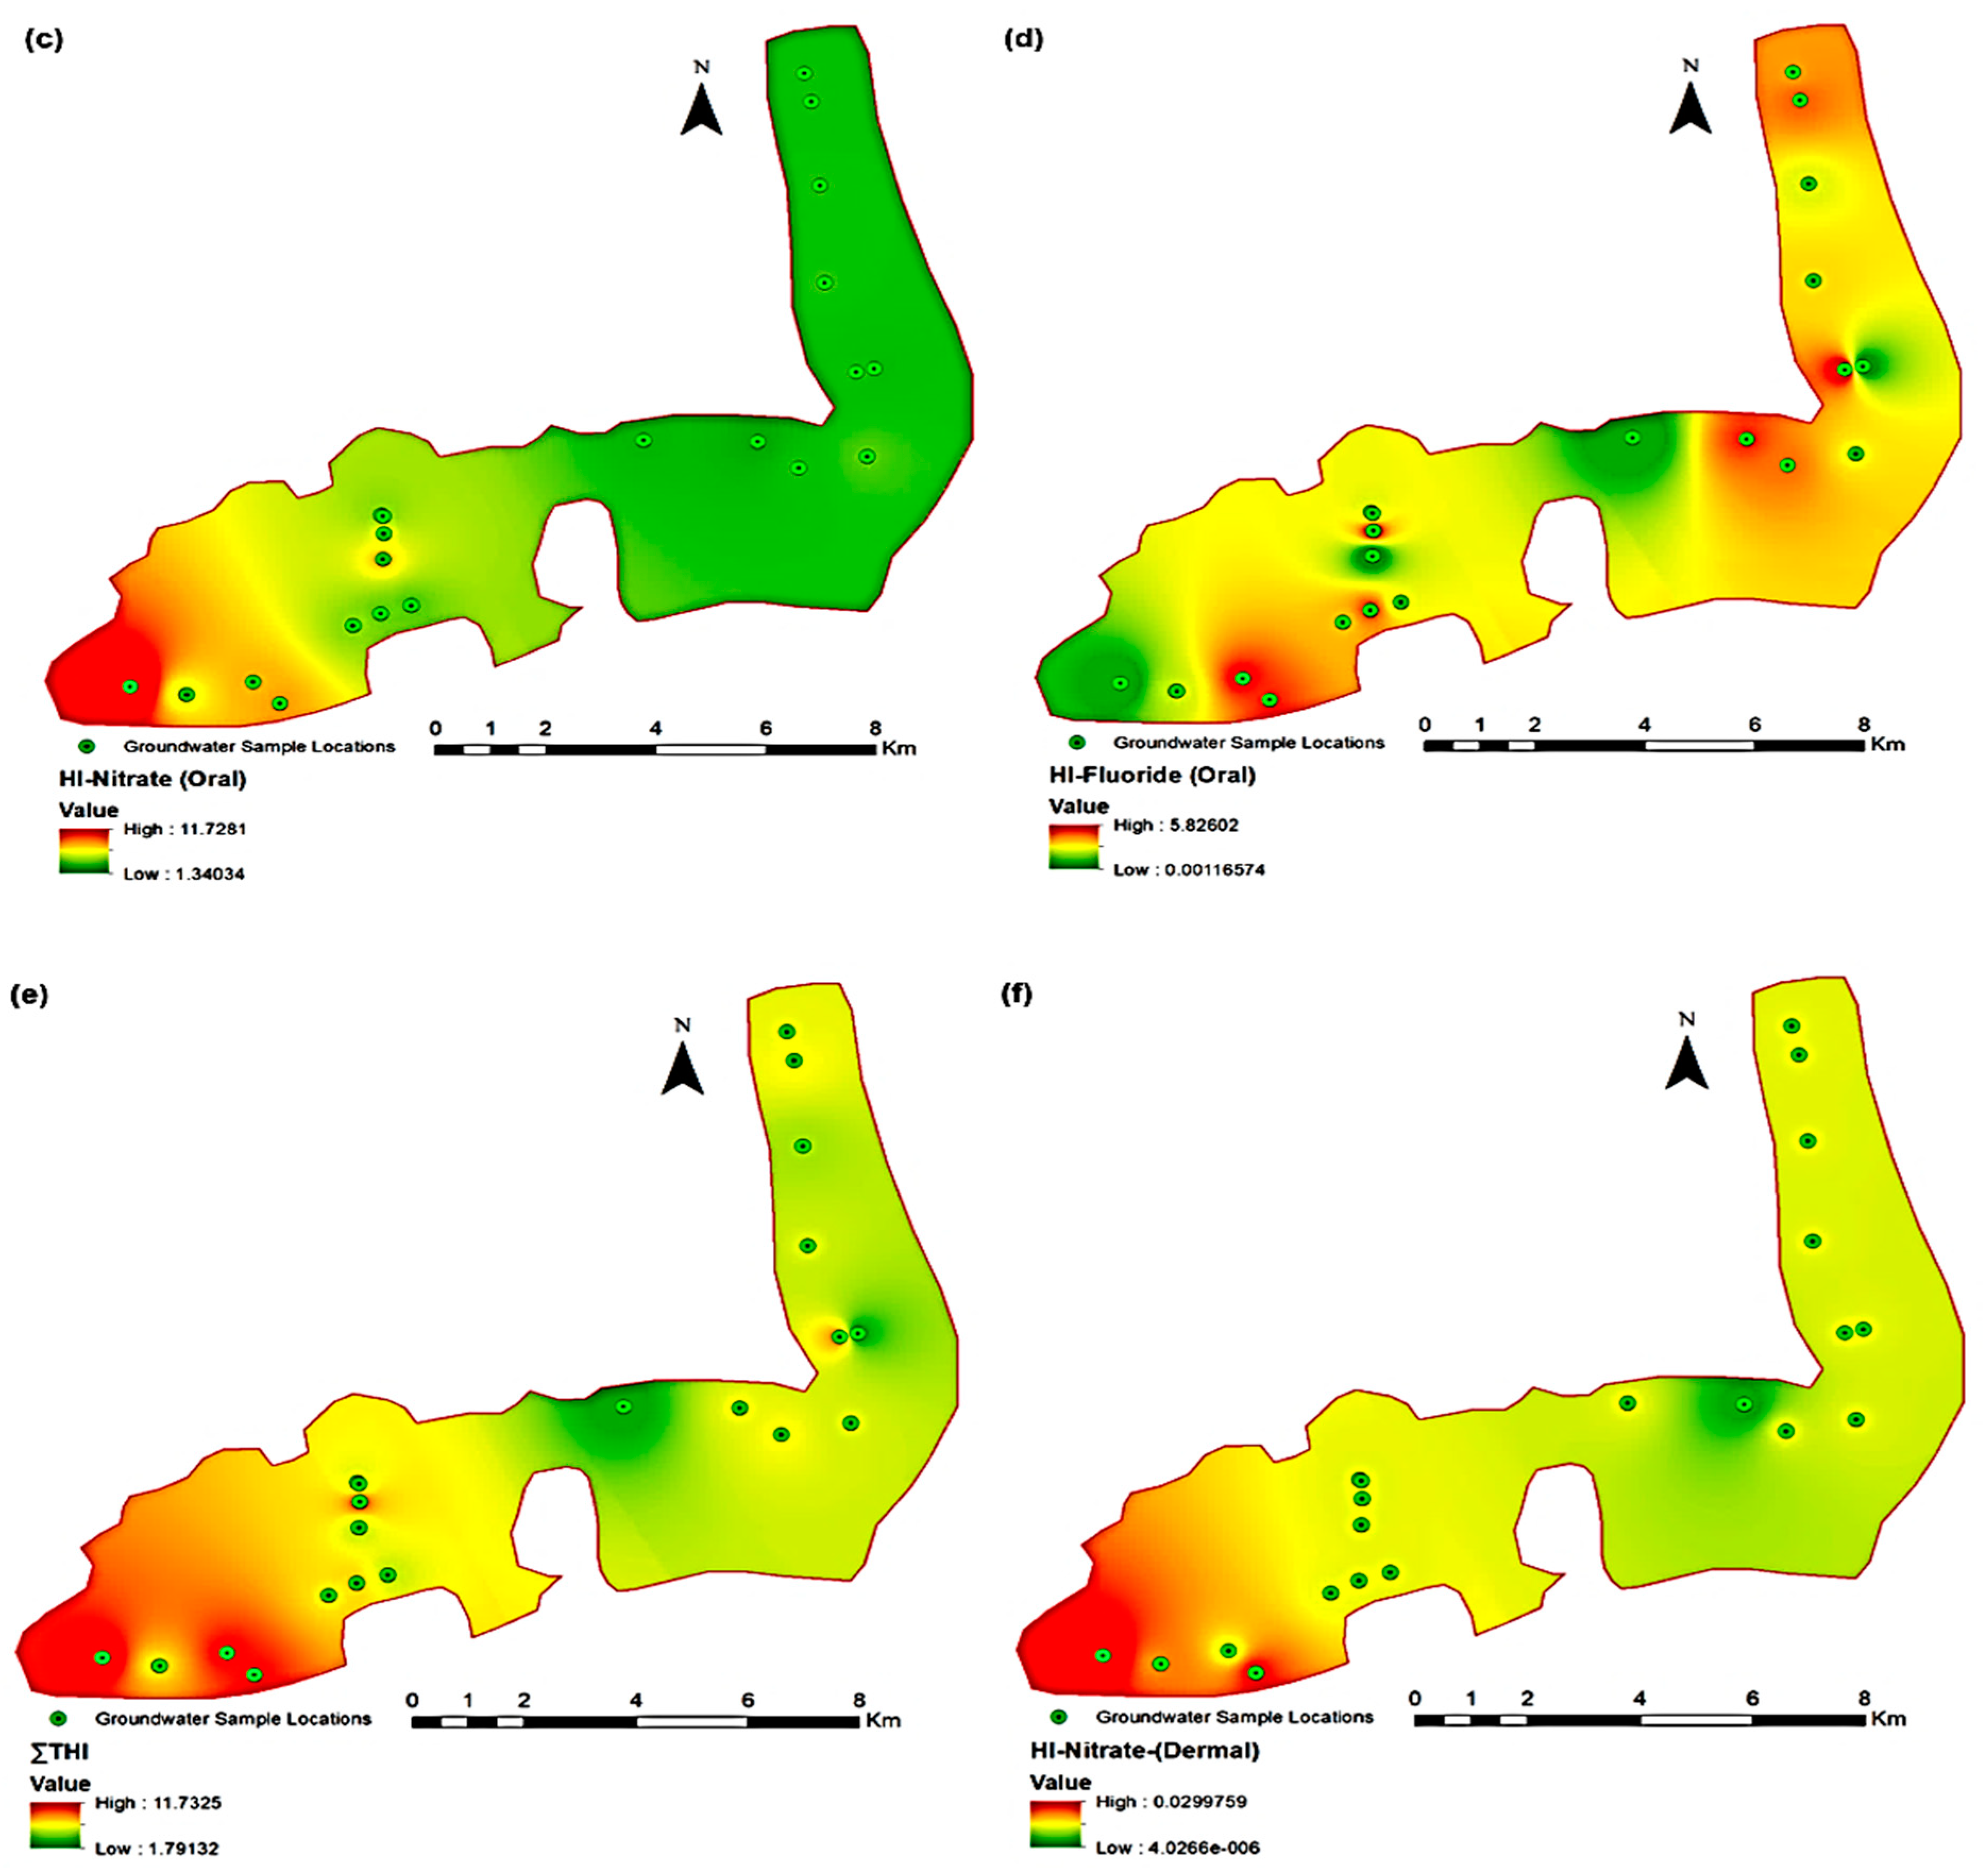
3.3.1. Nitrate Health Risk Due to Ingestion

Prolonged consumption of nitrate in drinking water can lead to enduring health issues [21]. In the present investigation, probable chronic nitrate risk was assessed using USEPA conventional metrics and techniques. The findings of the assessment are displayed in Table 6a. The HQ results for the three demographic groups ranged from 0.23 to 11.74. Specifically, across the three age groups, the HQ values indicate <2 years (low to high risk), 2–16 years (low to moderate risk), and >16 years (low to moderate risk). This suggests that the inhabitants in the region have a spectrum from low to severe chronic health risks as a result of NO3 in the coastal groundwater. In terms of HQ values, infants under 2 years old had a larger danger to their health from NO3 intake than other age groups. This result was largely due to children having smaller bodies than adults. The results of the study imply that the NO3 level of drinking groundwater ought to be decreased to preserve human health, particularly that of infants (below 2 years). Furthermore, the HI scores varied among the groundwater samples, ranging from 1.34 to 11.74, suggesting a moderate to high risk to human health. Elevated chronic hazards are projected to be higher in locations with higher NO3 levels, especially around communities with insufficient residential sewage treatment and extensive agricultural activities. Swiftly implementing remedial actions in affected areas is crucial for mitigating heightened nitrate levels in groundwater. Based on the spatial and temporal patterns of NO3 distribution in coastal aquifers, the implementation of remedial actions to address health risks associated with NO3 can commence by prioritizing locations with higher HI scores. In addition, it is crucial to enhance the biodegradable waste disposal services in the impacted areas. The implementation of strategies for rehabilitation should be carried out in a manner that aligns with the attainment of sustainable development objectives, as highlighted by [72].
Additionally, the results of the present investigation were compared to prior research on coastal groundwaters conducted across the world. In northern China, [12] found that hazards of nitrate in more than 85 percent of groundwater samples were unsatisfactory for the whole human population in the vicinity. According to recent research carried out along the Red Sea coast in Northwest Saudi Arabia, HI of nitrate was over the safety level of 1, implying increased non-cancer health risk concerns in kids as well as grownups [73]. In the Indo-Bangladesh Ramsar Site, researchers found a low to moderate susceptibility to nitrate-related health concerns in humans [74]. Compared to the aforementioned studies, it was realized that the nitrate HI reported in this study was lower than those of [12,73]. Conversely, this study displayed a higher nitrate risk than the report of [74]. Moreover, a closer look revealed that none of the coastal regions were completely free from health concerns related to nitrate, implying that nitrate may be a common issue in coastal groundwater. In accordance with the investigations described above, anthropogenic activities (particularly agricultural operations) were identified as the predominant source of NO3 contamination incidents.

3.3.2. Fluoride Health Risk Due to Ingestion

Excessive consumption of fluoride can result in the development of long-term health conditions like fluorosis. Skeletal or dental fluorosis affects a significant number of individuals globally, with millions of people experiencing its effects due to prolonged consumption of water that is enriched with fluoride. Table 6b presents the calculated risk values associated with groundwater resources impaired by fluoride (F). In the <2 years age bracket, the fluoride hazard quotient (F HQ) varied from 0.00 to 2.99, with a mean of 1.49. For the age group of 2–16 years, the F HQ ranged from 0.00 to 1.85, with a mean of 0.92. Individuals above 16 years of age exhibited F HQ values ranging from 0.00 to 0.99, with a mean of 0.49. The study results suggest that the health risks associated with fluoride consumption diminish with increasing age.
In the age group of <2 years, none of the groundwater samples were classified as having high health risks, while 77.78% were categorized as moderate, 0% as low, and 22.22% as negligible risks. For the age group of 2–16 years, none of the samples posed high health risks; 51.85% were classified as moderate, 25.93% as low, and 22.22% as negligible risks. However, when considering the combined <16 years age bracket, none of the samples were found to pose high and moderate health risks, while 77.78% were categorized as low and 22.22% as negligible risks. These results indicate that infants face a higher risk of fluorosis compared to children and adults in the region. The computation of the cumulative hazard quotient (HI) yielded higher risk values, ranging from 0.00 to 5.84, with a mean of 2.91. The health risk assessment of fluoride (F) indicated that approximately 33.33% of the groundwater samples posed high risks, 44.44% were classified as moderate risks, none were low risks, and 22.22% were negligible risks. Surprisingly, a similar trend was observed for both nitrate (NO3) and fluoride risks, where the risk levels followed the order: infants > children > adults.
However, it was noted that the risk associated with nitrate intake surpassed that of fluoride ingestion in the study area for all human populations. This finding is similar to reports in Kakhk City and its rural areas in Iran [75], Northwest Saudi Arabia [63], and Anantapur District, South India [76]. However, the reports by [17] in Al-Qatif, Saudi Arabia, South Punjab, Pakistan [52], and [77] in the mica belt of Jharkhand, India, during post-monsoon associated higher risks with fluoride than nitrate. The ongoing use of fluoride-polluted groundwater exposes the entire population in the study region to various risks. One of these risks is dental fluorosis, which can develop when fluoride accumulates in teeth due to the consumption of substances loaded with fluoride [31,78]. Fluoride buildup in the enamel’s space lattice produces hypo-mineralization, resulting in enamel pores [17,79]. Discolored dentition progressively becomes white, with dispersed spots or microscopic specks appearing on the surfaces. Food particles penetrate the hollow spaces of the teeth, creating brownish tints and enamel deterioration (Dean HT 1942). Fluorosis manifestations may become significantly more widespread in the vicinity in the near future, even in areas where fluoride levels in groundwater are under the allowed level of 1.5 mg/L [78]. Extensive research conducted in coastal regions, which share similar circumstances to the present study area, has also reported cases of fluorosis. To illustrate the severity of the issue, in Changyi City, China, alarming statistics reveal an estimated 93,388 documented instances of skeletal or dental fluorosis in 2001, while in Laizhou City, there were approximately 15,600 cases of skeletal or dental fluorosis during the same period [80].

3.3.3. Total Hazard Index for Ingestion Pathway

The total hazard index (THI) of F and NO3 on human well-being was analyzed to indicate the aggregate danger that groundwater users face. The findings of the analysis are presented in Table 6c. For the <2 years age bracket, the THI values range from 0.92 to 6.03, with a mean score of 3.30. In the 2–16 years age bracket, the THI values range from 0.57 to 3.73, with a mean rating of 2.04. The >16 years age bracket has THI values ranging from 0.30 to 1.99, with a mean value of 1.09. Additionally, the THI values for all three age brackets were combined, resulting in a range from 1.79 to 11.74, with a mean rating of 6.43. The THI is considered safe when it is below 1.0, as higher levels are believed to represent a threat to the well-being of humans [31]. The computed THI values show that, for the <2 years age group, 25.92% of the groundwater samples present high chronic health risks, while 66.67%, 7.41%, and 0% of the samples represent moderate, low, and negligible risks, respectively, whereas 0%, 88.89%, 11.11%, and 0% of the water samples, accordingly, indicate high, moderate, low, and negligible chronic health concerns for children aged 2 to 16 years. Similarly, for the human population above 16 years, none of the samples indicate high or negligible risks, 55.56% present moderate risks, and 44.44% present low risks. These findings suggest that infants are more susceptible to possible health risks than adults and children, perhaps due to their lower body weight.
In terms of the overall intensity of aggregate health risks, the research region can be divided into two main categories: a vulnerable zone (with ∑THI > 1) and a safe zone (with ∑THI < 1). Within the vulnerable zone, there are further subclasses, including a very high health risk zone (∑THI > 3), high health risk zone (∑THI = 2–3), and moderate health risk zone (∑THI = 1–2). Based on these criteria, all samples (100%) fell within the vulnerable zone category. Moreover, 88.89% of the samples were classified as being in the very high-risk zone, 3.70% were in the high-risk zone, and 7.41% were in the moderate-risk zone.
The research findings consistently demonstrate a trend of higher health risks in the following order: infants, children, and adults, when considering the health risk calculations associated with F and NO3 polluted groundwater resources. This trend has also been observed and reported by various scholars in different regions worldwide [17,27,31]. The coefficient of determination (R2 = 0.074) revealed a weak correlation between the two variables, indicating a significant discrepancy between the effects of the two elements (Figure 8). By comparing the average HI of F and NO3, it shows that nitrate risk is 1.21 times higher than fluoride, confirming the inferences drawn from the linear regression. Contrarily, the recent research [17] in Saudi Arabia showed that fluoride risk was higher than nitrates.

3.3.4. Nitrate Health Risk Due to Dermal Absorption

The outcome of the health risk assessment for dermal contact with nitrate is presented in Table 6d. The cumulative hazard index (HI) and the hazard quotient (HQ) values for all age groups were found to be <0.1. Based on the HI system of categorization, it can be concluded that all groundwater samples offer minor short and long-term concerns to groundwater users. This means that residents are not in danger of severe health problems when they utilize nitrate-rich groundwater for household uses like showering, scrubbing, and other activities that would ordinarily expose their bodies to the pollutants in water.

3.4. Spatial Mapping for Identification of Contamination Hotspots

In this study, Geographic Information System (GIS)-oriented maps were generated using comprehensive data on several key parameters, including PIG, SPI, HI-nitrate (oral), HI-fluoride (oral), ∑THI, and HI-nitrate (dermal) (Figure 9). This spatial analysis and mapping approach provide valuable insights into the spatial patterns and water quality variations, aiding in the identification of pollution hotspots, assessment of environmental impacts, and development of targeted management strategies. Analyzing the overall groundwater quality and contamination status, the PIG and SPI indicators revealed elevated contamination levels in the east and west of the study area (Figure 9a,b). Figure 9c highlights that nitrate pollution is most prevalent in the region’s western part, predominantly attributed to intensive man-made activities in that area. Conversely, fluoride contamination displayed a wider distribution, even extending into the far northern part of the study region, where groundwater quality is considered optimal (Figure 9d). The presence of fluoride in the region is mainly attributed to geogenic sources, primarily naturally occurring fluoride deposits in the area. To evaluate the aggregated spatial effects of fluoride and nitrate contamination, a ∑THI map was produced, revealing a clear pattern of increasing health risks covering the northern to western part of the study area (Figure 9e). On the other hand, the HI-nitrate (dermal) map yielded much lower health concerns. Nevertheless, similar inferences were drawn from its analysis, as depicted in Figure 9f. As the spatial maps have indicated portions of the study area with higher pollution and health risks, it is essential to prioritize mitigation strategies in these portions rather than in other places with lower stakes.

3.5. Chemometric and Graphical Techniques for Contamination Source Identification

3.5.1. Correlation Analysis

Pearson’s correlation was performed to investigate the interrelationships between the various groundwater quality parameters in the Al-Hassa coastal region of the Eastern Province. The correlation matrix in Table 7, which includes the correlation coefficients between different parameters, was examined in this analysis. Any correlation value (r) > 0.75 was considered strong; r value between 0.5 and 0.75 represented moderate correlation, whereas r < 0.5 was weak. The correlation matrix revealed significant relationships between the pH and turbidity, EC and TDS, EC and total alkalinity, and TDS and total alkalinity (Table 7). The positive correlation between pH and turbidity suggests that an increase in turbidity in groundwater is associated with a rise in pH levels. Meanwhile, the positive correlation between EC and TDS indicates that as the total minerals dissolved in water increase, the conductivity of the water also increases [17]. The positive correlation between EC and total alkalinity implies a link between the water’s conductivity and alkalinity. Further, the positive correlation between TDS and total alkalinity suggests that the water’s alkalinity also increases as the total dissolved solids increase.
The high positive correlations observed among the physical parameters significantly affect groundwater quality. For instance, the positive correlation between pH and turbidity suggests that higher turbidity levels could increase the acidity of the groundwater, which can lead to health problems for humans and the water environment. Similarly, the positive correlations between the EC and TDS, EC and total alkalinity, and TDS and total alkalinity imply that the influencers of these parameters are likely to be similar increases [17] and their levels may increase or decrease together. As for the most likely influencer, geogenic factors are usually the primary source of these groundwater physical variables in coastal regions, but human-related factors such as industrial activities, agricultural practices, and municipal waste disposal can also contribute to contamination [81]. The correlation matrix also showed a positive correlation between pH and turbidity, indicating that an increase in pH leads to higher turbidity levels in the groundwater.
Significant correlations were also observed between the physical parameters, cations, and anions, including Br (Table 7). The scientific significance of these correlations is noteworthy and implies that geogenic factors are probably the primary origin of contamination in the Al-Hassa region. A positive correlation between the major cations and anions in the groundwater samples indicates an everyday basis of origin for these ions. The correlation matrix suggests that physical parameters such as pH, EC, and turbidity significantly influence the concentration of these ions. For instance, the correlation between TDS and the ions indicates that the increase in ions is associated with an increase in the cations, anions, and hydroxide ions concentrations, etc., usually through geochemical processes [37,53,64]. It is recalled that the area is characterized by a karstified geological setting, which implies that limestone weathering and carbonate dissolution are prevalent. Water pH, EC, and TDS play a crucial role in influencing ionic concentrations of water [82]. Nevertheless, human-related factors may also enrich the cations and anions [7,10,14]. Further investigation may be necessary to determine the exact sources of contamination and develop effective strategies to ensure groundwater sustainability in the region.
It was noticed that no significant correlation exists between F and NO3, alongside other groundwater quality variables, including the TDS, EC, pH, alkalinity, and other ions (Table 7). This finding is significant because it suggests that the sources of contamination for these two parameters may differ from those of different physical and chemical parameters. As has been identified in several other regions, geogenic factors are usually the primary source of fluoride contamination, but human-related factors can also contribute to it [52,77,83]. On the other hand, NO3 in groundwater is commonly attributed to human-related factors such as sewage disposal, agriculture, and improper municipal waste management [12,32,53,84]. Natural geochemical processes have also been noted to influence nitrate concentration in groundwater [85].

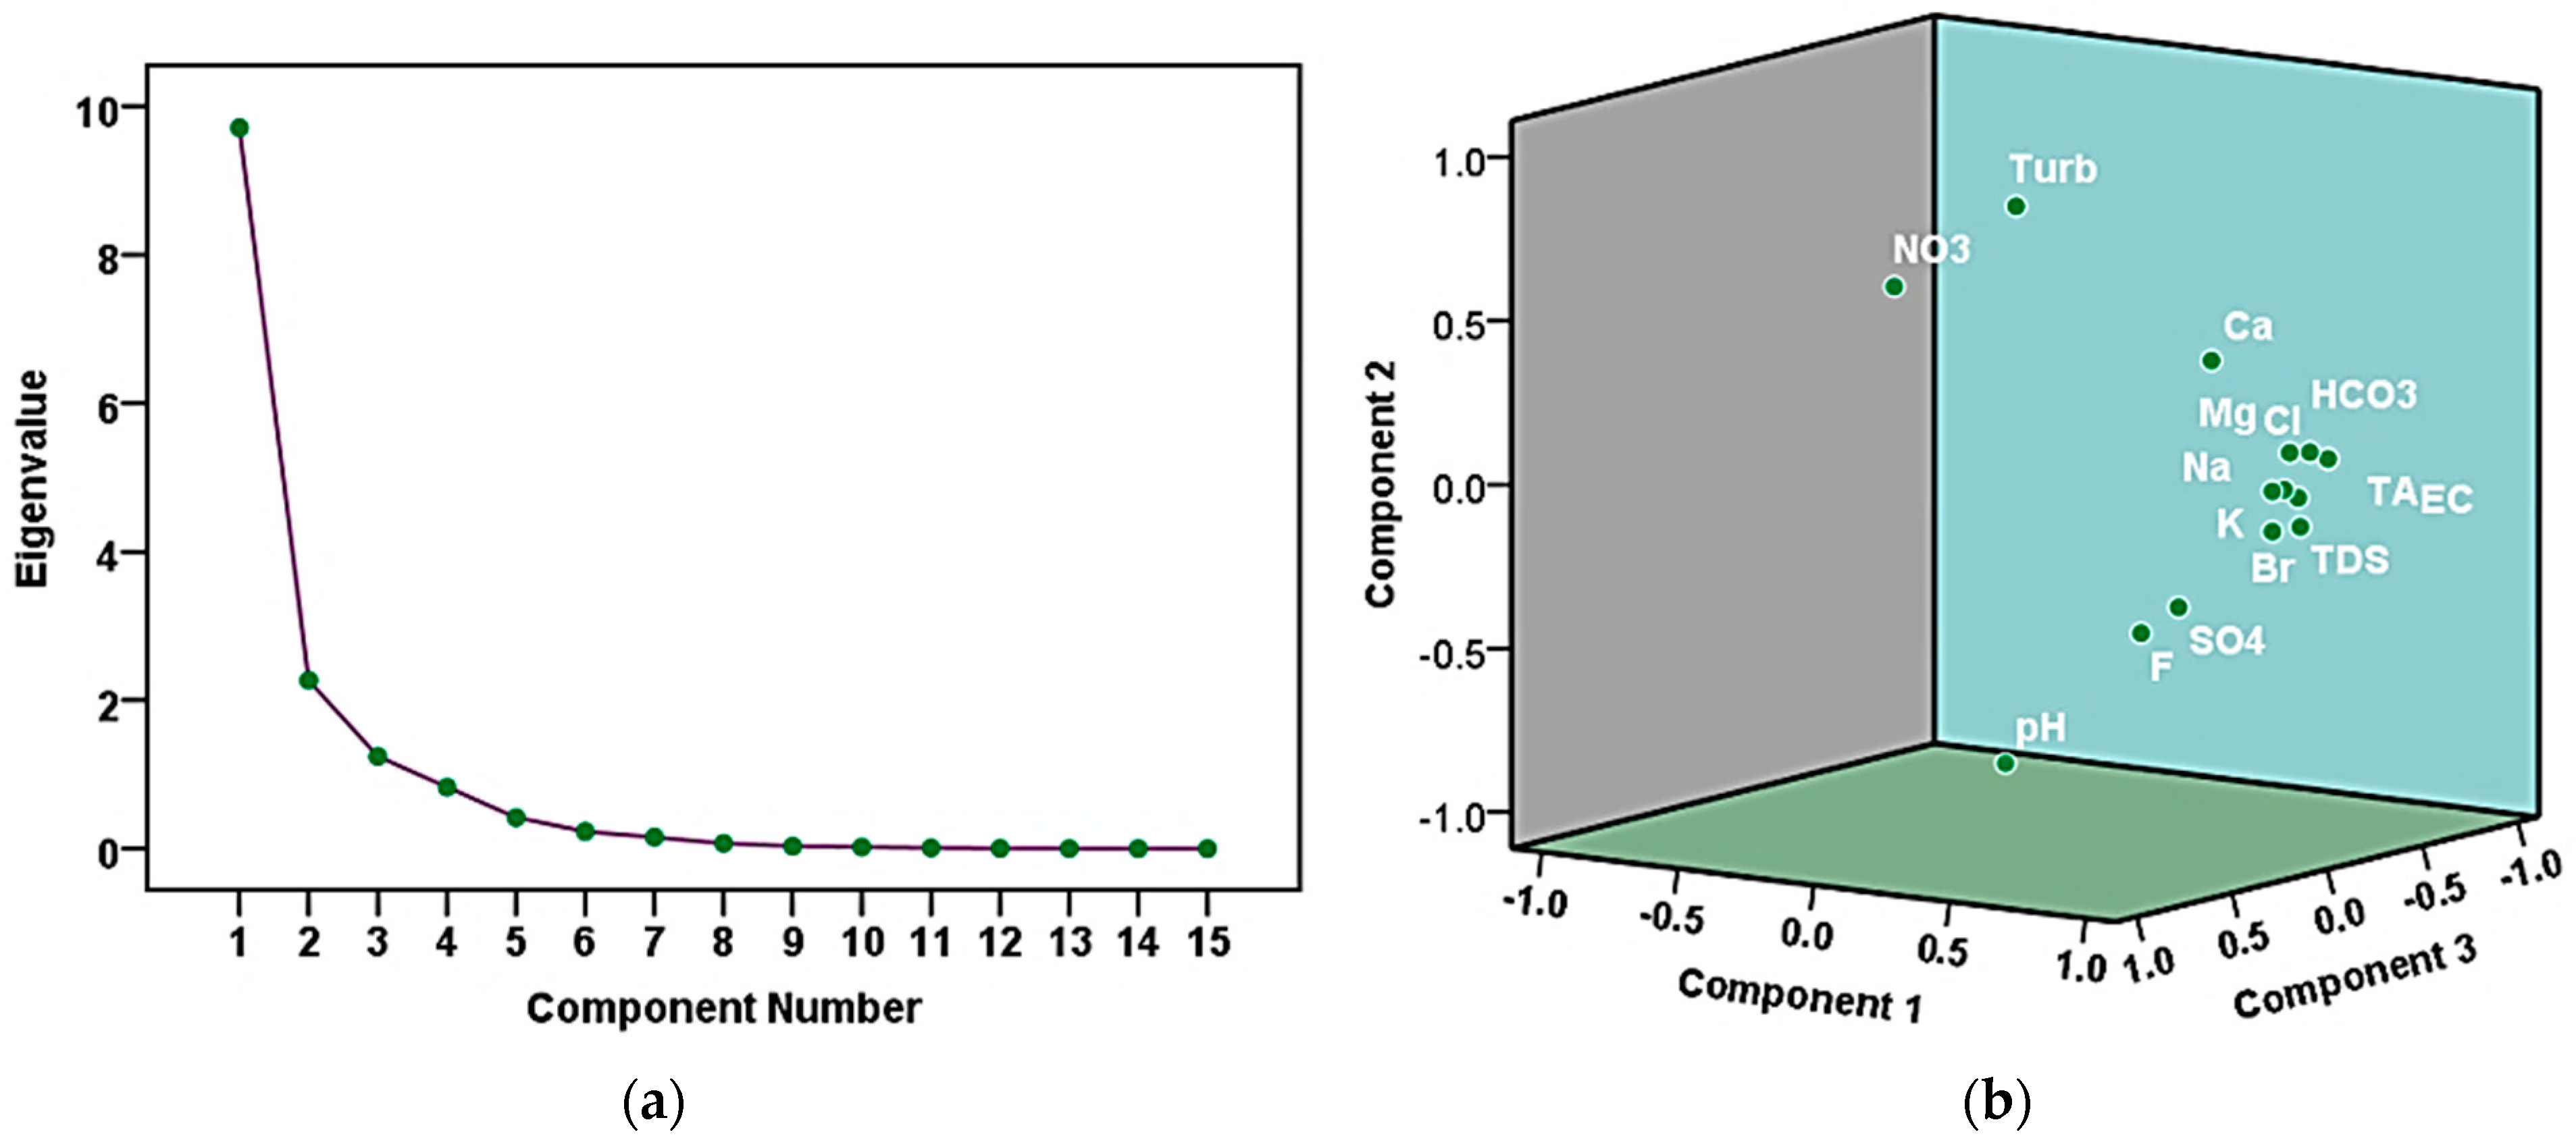
3.5.2. Principal Component Analysis

In this investigation, principal component analysis was additionally carried out to delve deeper into the intricate connections among diverse physical and chemical parameters influencing groundwater quality in our study region. By reducing the dimensionality of the data and identifying underlying patterns, this study aimed to gain insights into the sources and mechanisms of contamination that could inform the effective management of natural groundwater resources. In this report, the principal component loadings, scree plots, and 3D distribution plots of the principal components are presented in Table 8, Figure 10a, and Figure 10b, respectively. Three principal components were considered, and their eigenvalues, variabilities, and cumulative percentages are also given in Table 8. PC loading <0.5 was a weak loading, PC loading ranging between 0.5 and 0.75 represented a moderate loading, and PC loading >0.75 was a strong loading. The significant positive loadings of PC1 on parameters such as EC, TDS, TA, HCO3, Na, K, Mg, Ca, SO4, Cl, and Br confirm that these parameters are highly correlated (Table 8). These parameters are typically associated with saline intrusion, natural mineralization, and weathering processes taking place in groundwater aquifers, as well as anthropogenic activities [28,37,52]. The high values of these parameters obtained for the multi-aquifer groundwater system herein could be indicative of contamination from sources such as wastewater, fertilizers, pesticides, and road salt [86,87].
The significant positive loadings of turbidity and NO3 in PC2 (Table 8) suggest a common source of origin. This may result from agricultural practices, such as the application of fertilizers and animal waste, or industrial activities [23,28].
The significant negative loading of pH in PC2 (Table 8) could be due to acid rain or acid drainage, which may be caused by natural mineralization or anthropogenic activities [7]. The significant loading of PC3 on NO3 (Table 8) suggests that there is a distinct source of contamination for this parameter that is not shared with the parameters in PC1 and PC2. This seems to confirm that nitrate contamination in the groundwater is more indicative of human-induced sources than other parameters. Moreover, the lack of significant loadings on other parameters in PC3 suggests that nitrate contamination is the dominant factor contributing to the variability observed in PC3.
In this research, it was noticed that fluoride had no significant loading in any of the PCs. The reason why fluoride had no significant loading on any of the PCs is not explicitly known. However, it is believed that F-contamination in the groundwater system was not strongly associated with any of the sources of pollution identified in the study. Alternatively, there may be other factors affecting the presence and distribution of fluoride in the groundwater that were not accounted for in the principal component analysis. Studies have identified the presence of fluorite mineral as a common influencer of fluoride in groundwater [88,89,90]. Further research may be necessary to fully understand why fluoride did not load significantly on any of the PCs. It is important to mention that the findings of the principal component analysis are consistent with those of Pearson’s correlation analysis.

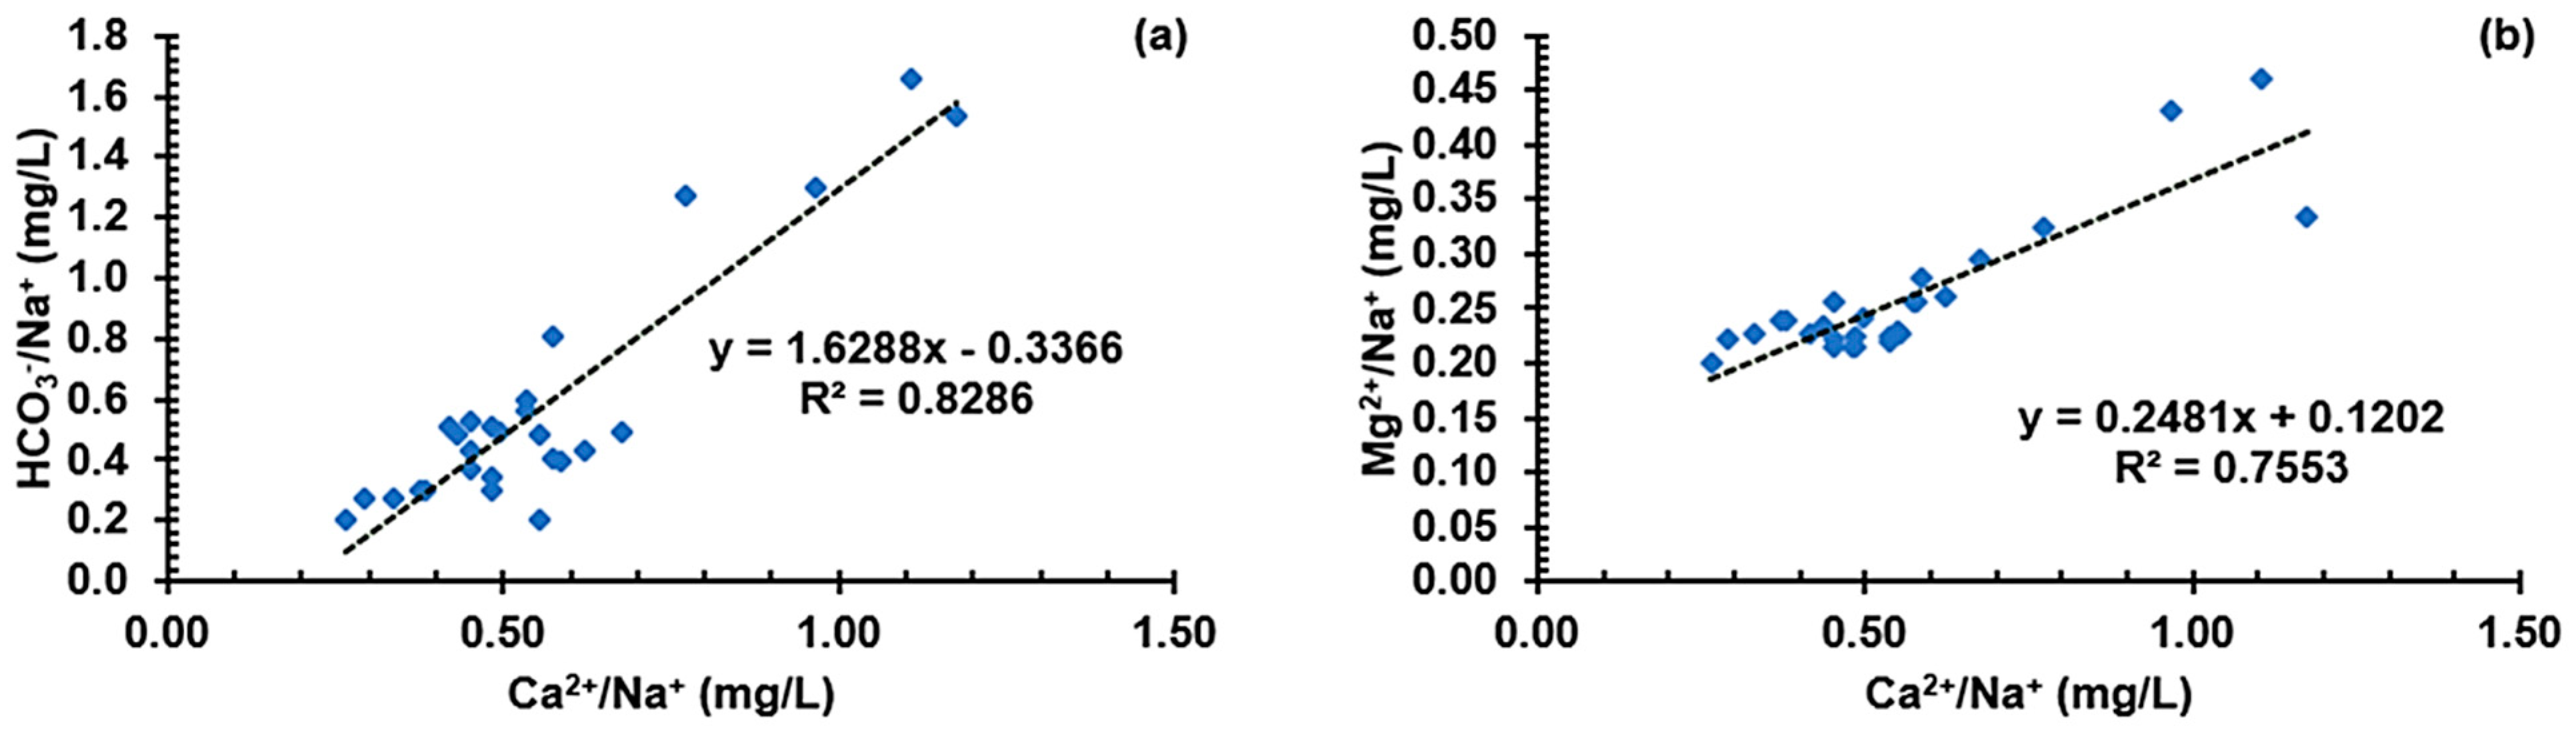
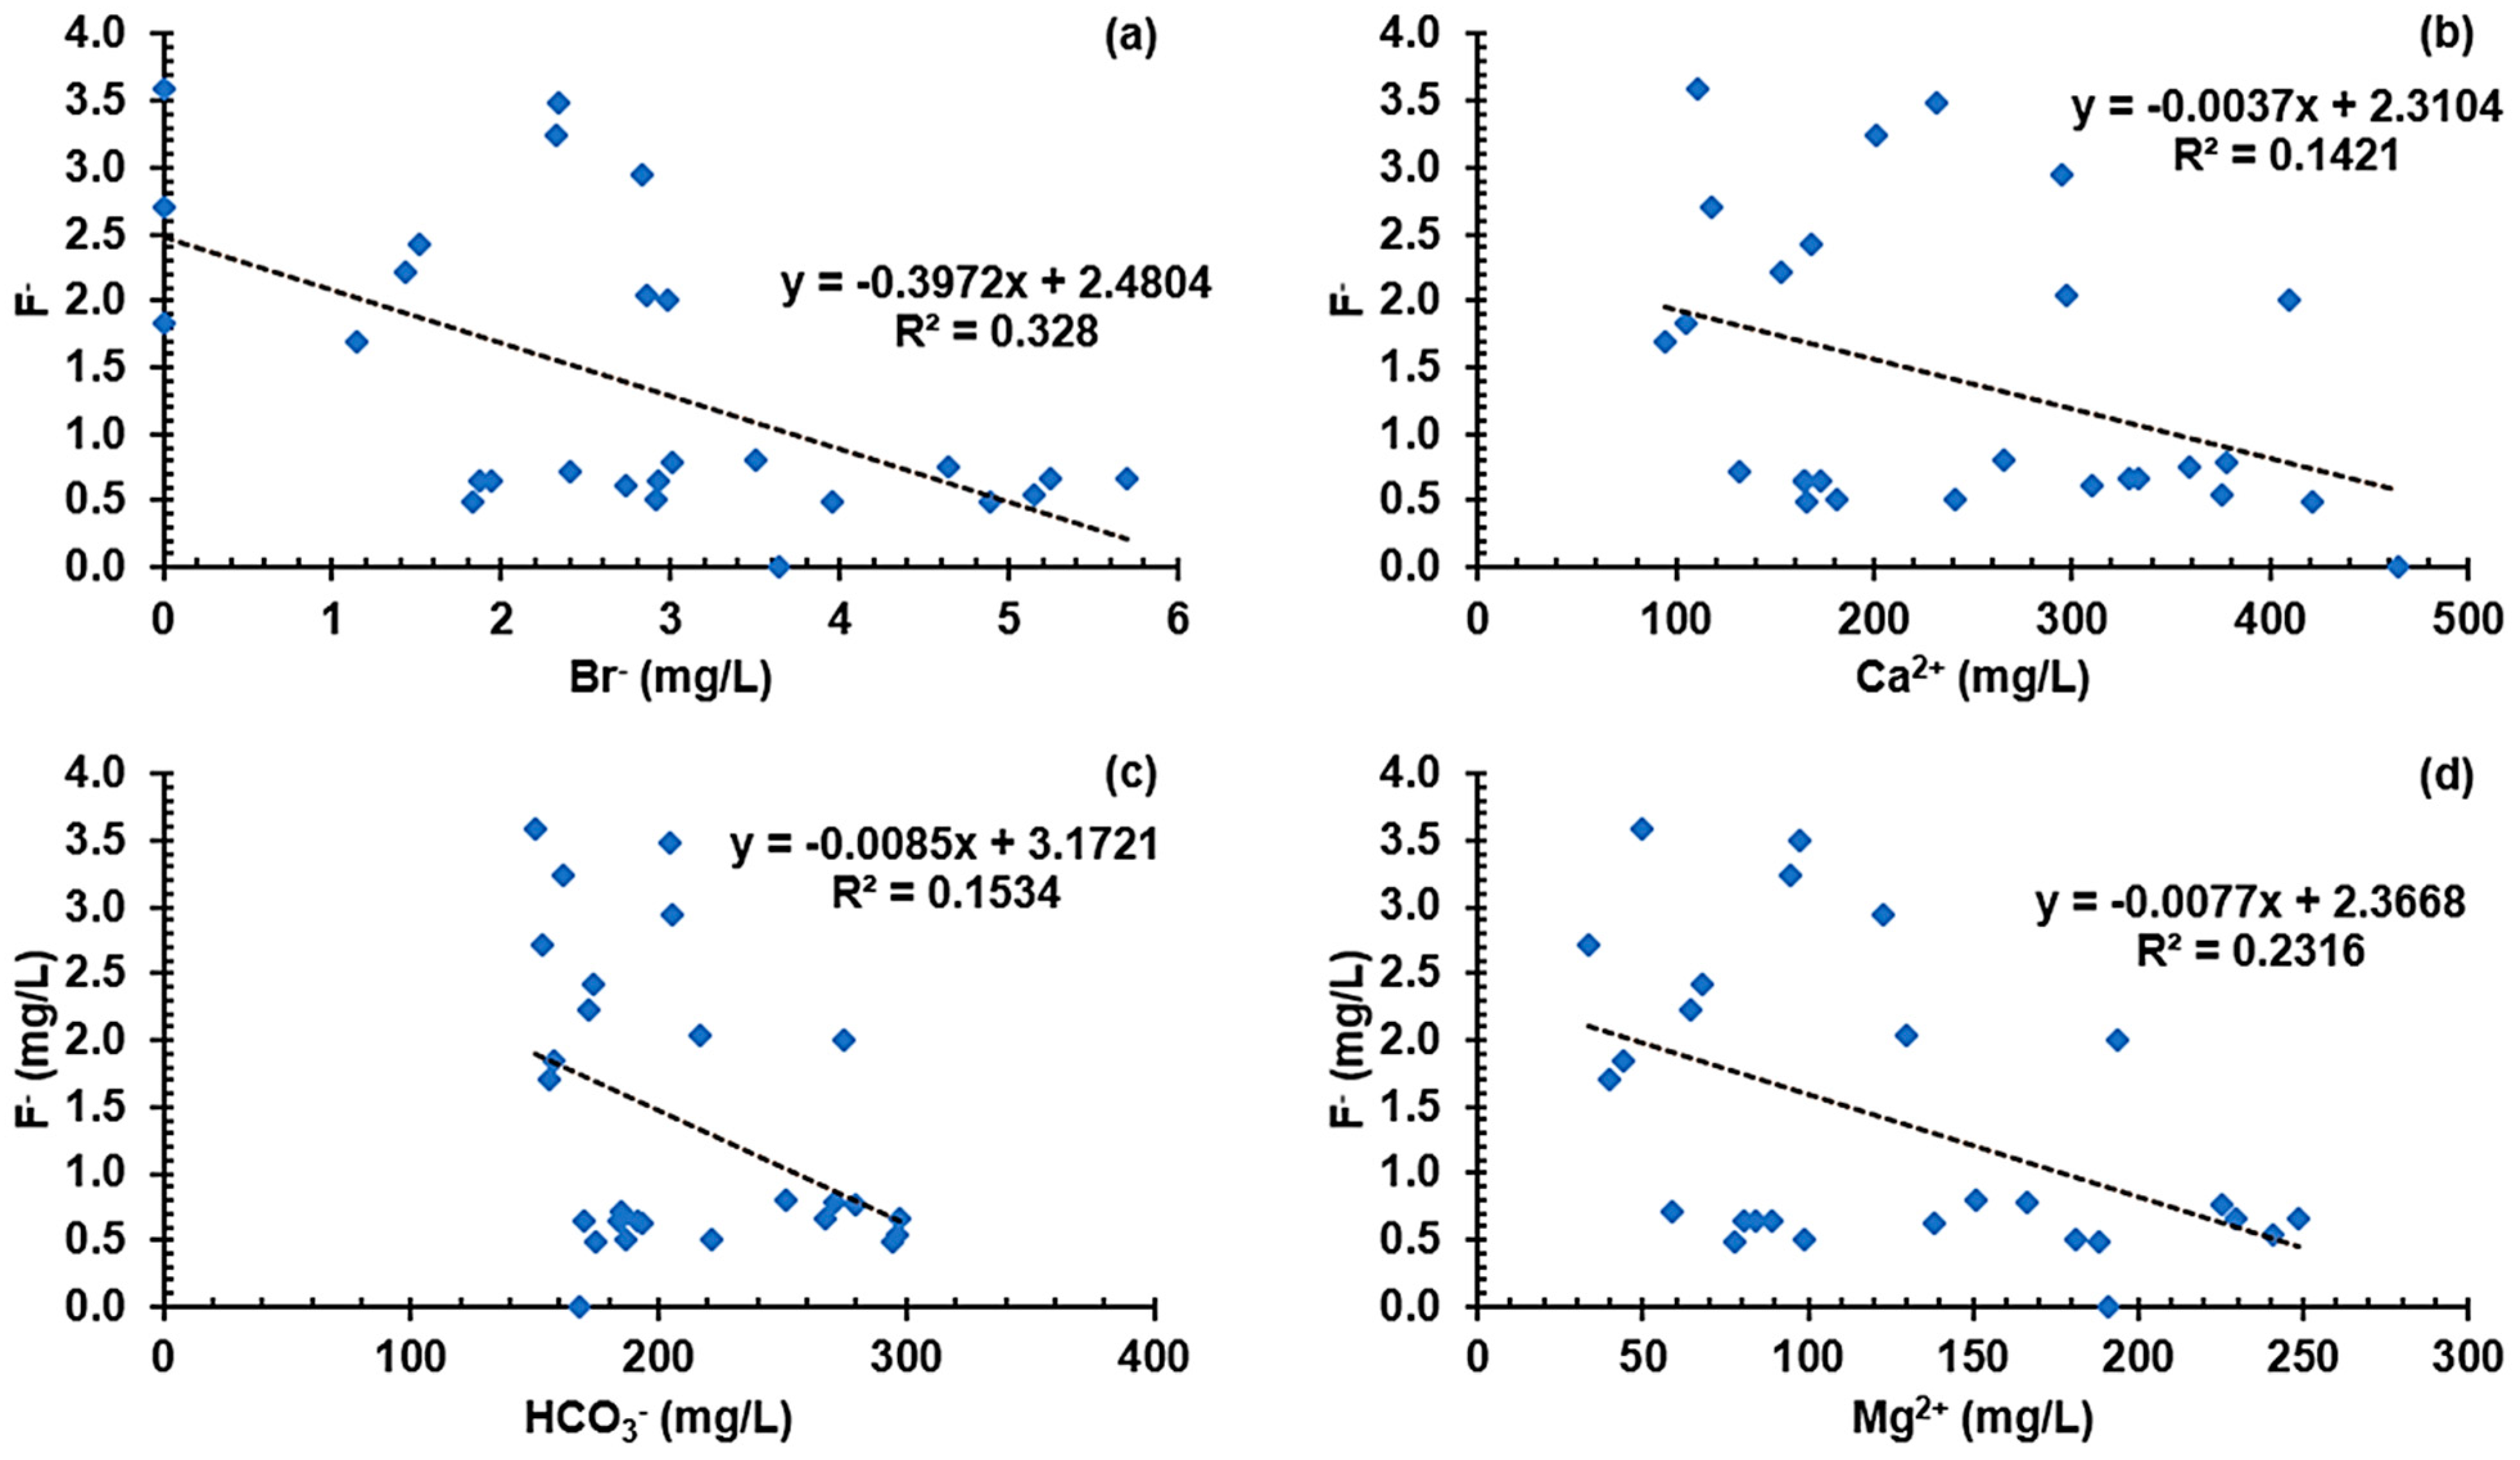
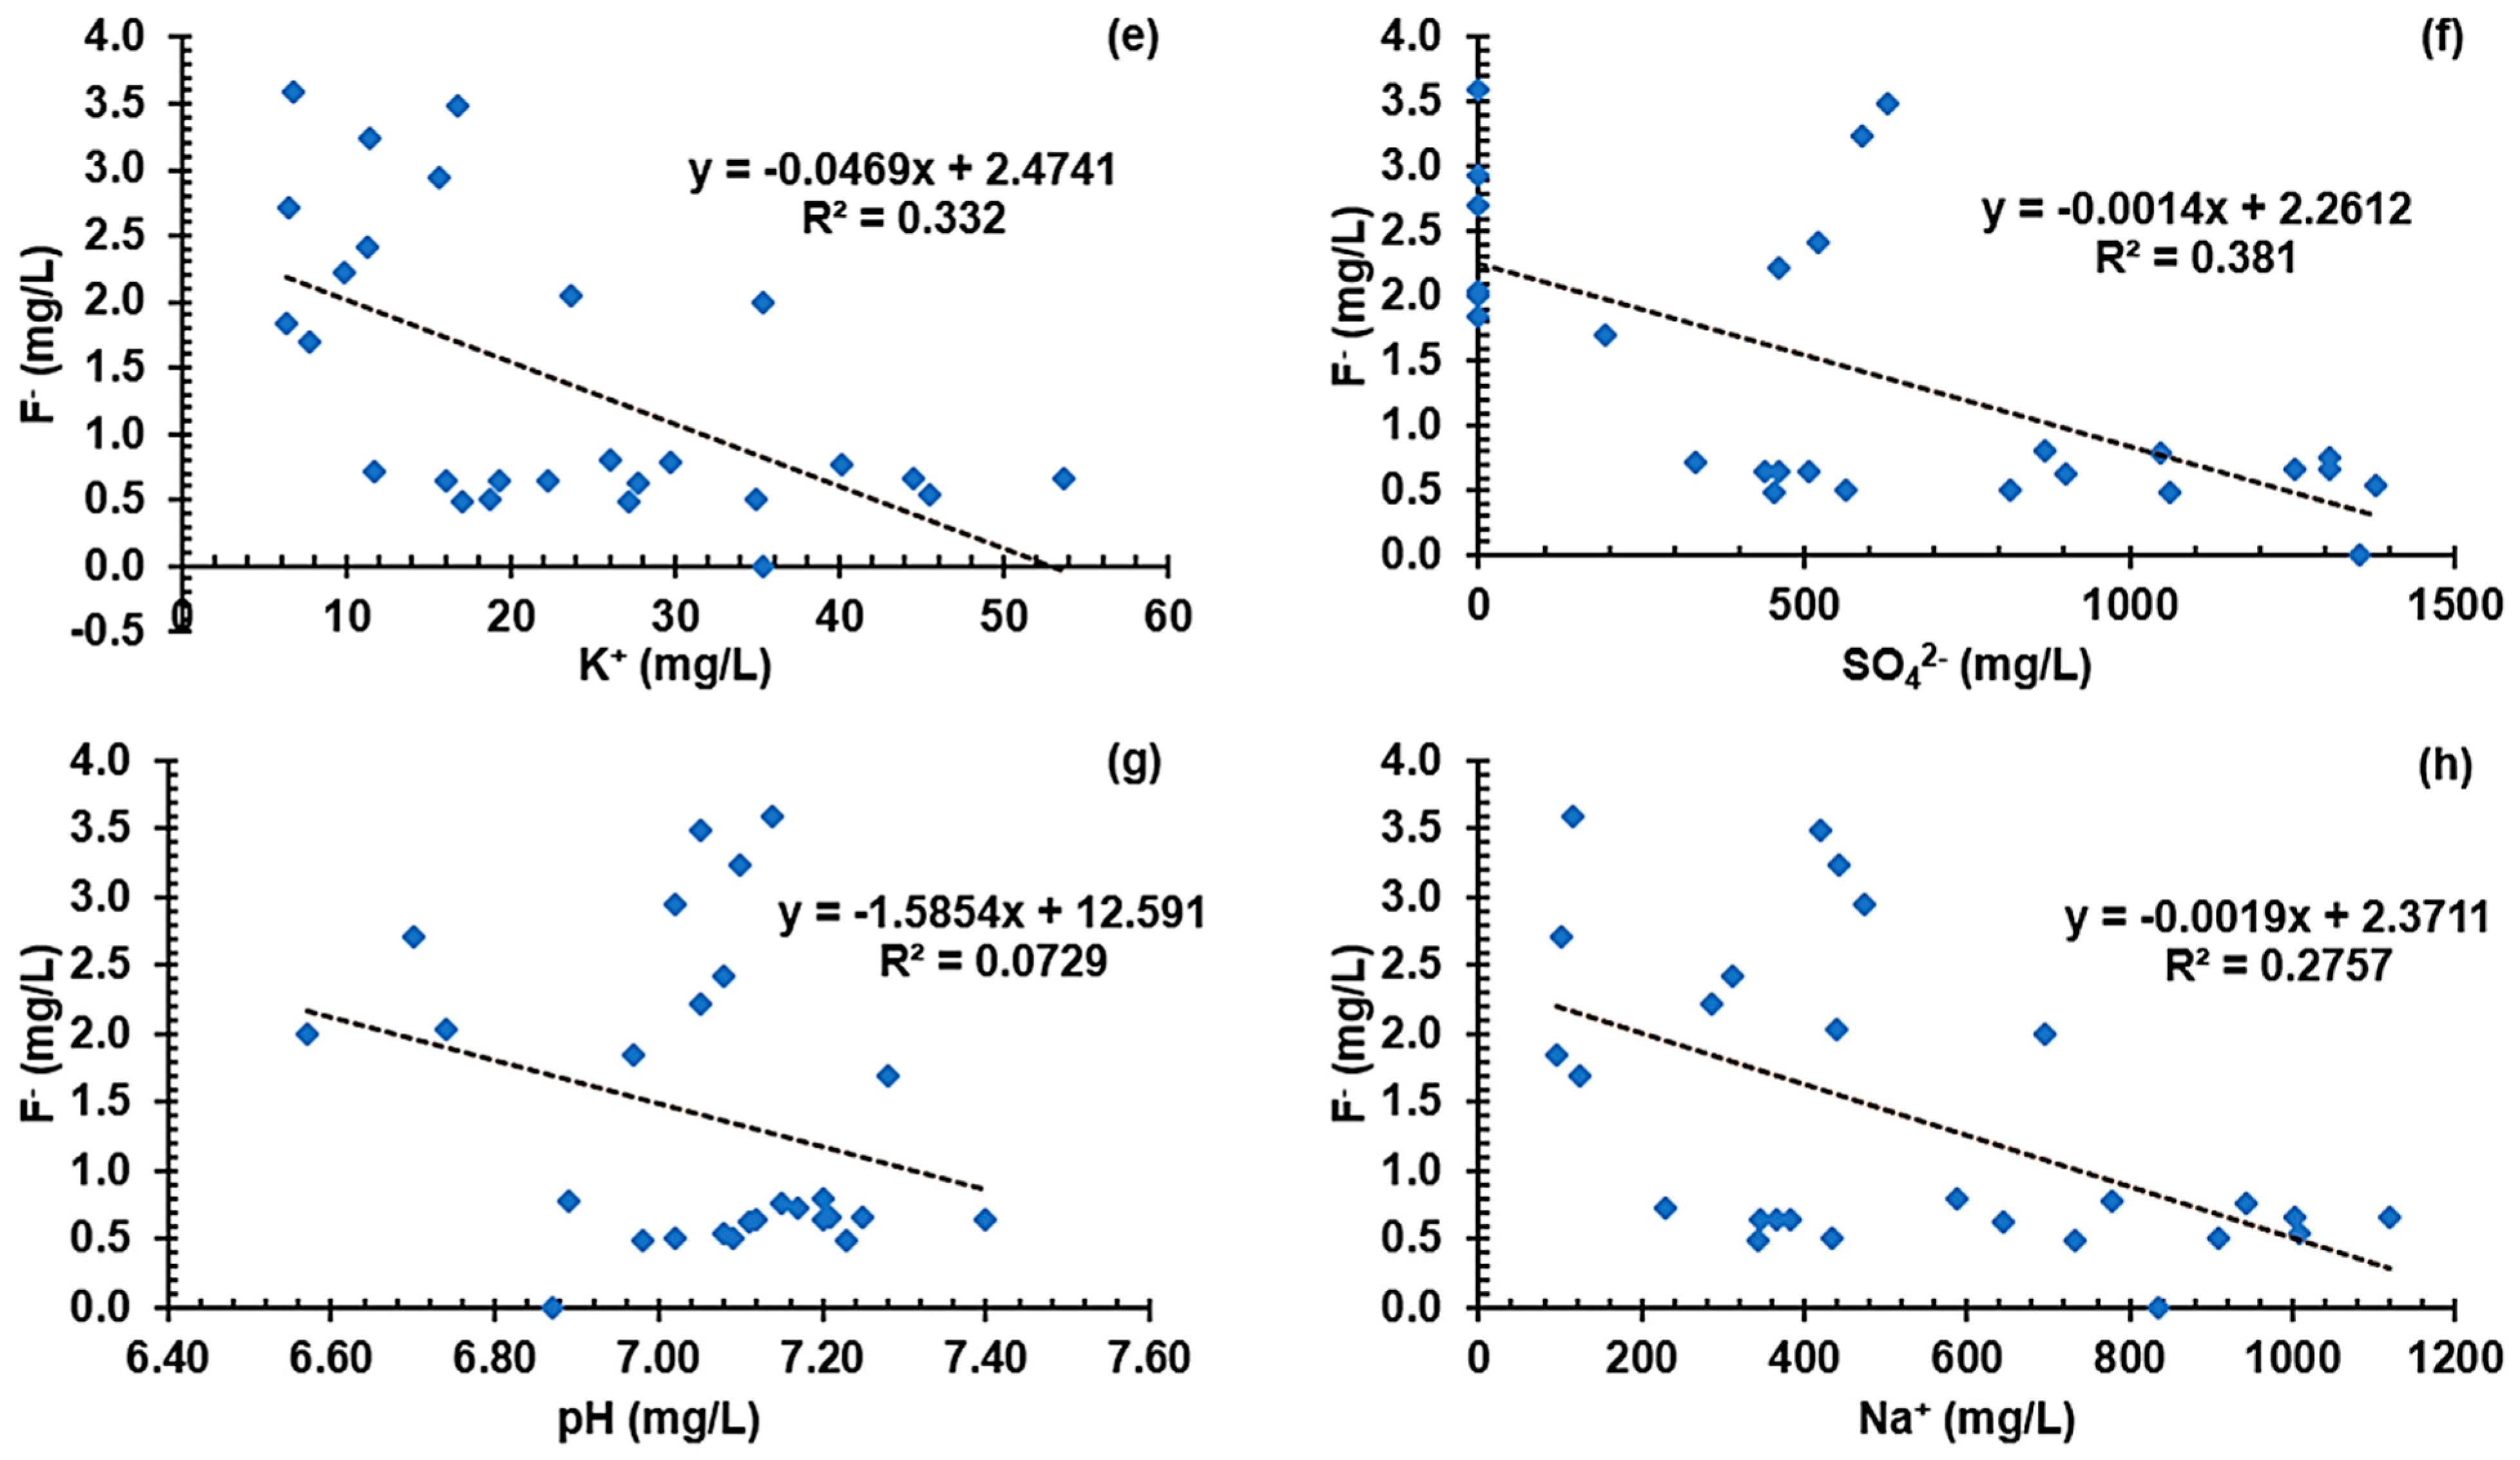
3.5.3. Graphical Characterization of Possible Contaminant Sources

Graphical plots serve as invaluable tools in the study of hydrogeochemistry, enabling clear visualization and analysis of complex data patterns, trends, and relationships, thereby enhancing our understanding of the intricate processes governing groundwater composition and behavior [17,33,34,53]. The geochemical plots shown in Figure 11, Figure 12 and Figure 13 are indicative of the predominance of geogenic factors determining the geochemistry of the groundwater in the study area. This observation is consistent with Chadha’s plot (Figure 6) and the findings of the correlation matrix and principal component analyses. Worthy of note is that an inverse relationship exists between F and NO3 (Figure 12c). The varied origins of the analyzed elements are further corroborated, with F primarily affected by geological processes in the groundwater aquifers, while NO3 enrichment is predominantly attributed to human-related activities in the region. Anthropogenic inputs can influence Cl and NO3 concentrations in groundwater. As illustrated in Figure 12a, human activities seem to exert significant control over the dissolved ions defining the groundwater chemistry. As has been cited earlier and reiterated in Figure 13, F exhibits minimal association with other chemical species whose presence is noted to be influenced by geological-related processes. This could be further confirming the variability of the origin of F in the groundwater. Further, the pH influence on the enrichment of F is negligible. This aligns with the results of [17] but is contrary to the reports of [91].

4. Summary, Conclusions, and Recommendations

This study sought to fill knowledge gaps in groundwater pollution in the Al-Hassa region of Saudi Arabia by employing an integrated classical study approach. Standard procedures were considered and followed in the sampling and analysis of groundwater samples. Although pH values were mostly within acceptable limits, the physicochemical results generally indicated that the groundwater system was polluted. The elevated levels of EC (ranging from 2062.97 µS/cm to 14,114.58 µS/cm) and TDS (ranging from 928.00 mg/L to 8226.97 mg/L) observed in this study were attributed to saline water intrusion and excessive exploitation of groundwater resources. The average values of the TDS, EC, and turbidity exceeded allowable boundaries set by the WHO. Na+ was the most abundant cation, followed by Ca2+ and Mg2+, while the anions order was Cl > SO42− > HCO3 > NO3 > Br > F. Na-Cl water type dominated, highlighting the impact of saltwater intrusion and reverse ion exchange. The high-salinity water poses potential health risks. Moreover, variations in physicochemical properties suggest spatiotemporal variations in the hydrogeochemical mechanisms affecting the groundwater. The graphical and multivariate statistical methods confirmed a predominant influence of geogenic factors over anthropic factors regarding the dynamics in groundwater hydrogeochemistry. The PIG values varied from 0.8426 to 4.7172, representing most samples classified as moderately to very highly polluted. Similarly, the SPI results (ranging from 0.5021 to 4.0715) indicated that none of the samples exhibited excellent water quality, as 48.15%, 33.33%, and 18.52% were in slightly, highly, and extremely unsuitable drinking water categories, respectively.
The nitrate HQ results varied between 0.23 and 11.74 for the three demographic groups. The results indicated a range of chronic health risks from low to severe among the inhabitants. Infants under two years old were particularly vulnerable to the health risks from NO3 intake compared to other age groups. The HI scores ranged from 1.34 to 11.74, indicating a moderate to high risk to human health. However, using nitrate-rich groundwater for household activities like showering and cleaning did not pose a significant health risk. On the other hand, the fluoride HQ ranged from 0.00 to 2.99. The health risks were found to decrease with increasing age, with infants facing the highest risk of fluorosis. The HI yielded higher risk values ranging from 0.00 to 5.84, with a mean of 2.91. The F health risk assessment indicated that approximately 33.33%, 44.44%, and 22.22% of the analyzed samples posed high, moderate, and negligible risks, respectively. The same risk trends were observed for both NO3 and F: infants > children > adults. Nevertheless, nitrate risk was 1.21 times higher than fluoride risk, based on the average HI. All samples fell within the vulnerable category based on the THI, with 88.89%, 3.70%, and 7.41% classified as very high, high, and moderate risk, respectively.
This study offers valuable insights into the quality of the multi-aquifer groundwater system, aiding water authorities, residents, and researchers in identifying safe groundwater sources. Also, it pinpointed the vulnerable regions, and human populations at risk from using the contaminated water. Implementing appropriate treatment techniques before usage is strongly recommended while governing authorities can use the findings to develop long-term coastal groundwater management plans. Moreover, the western region, where nitrate pollution is most prevalent, requires interventions focused on reducing agricultural or industrial inputs. The northern part, where fluoride contamination is more prominent, should utilize treatment methods targeting geogenic sources. Furthermore, ongoing groundwater quality monitoring in the region, especially in the identified hotspot areas, is crucial to track the effectiveness of the decontamination strategies and make any necessary adjustments to the interventions. Together, the decontamination strategies will help ensure the long-term sustainability and success of the regional groundwater management plan.

Author Contributions

Conceptualization, S.I.A. and M.A.Y.; data curation, S.M.H.S., S.I.A., M.A.Y. and A.G.U.; funding acquisition, M.S. and S.S.S.; investigation, S.I.A., J.C.A. and J.C.E.; methodology, S.I.A., S.M.H.S., M.A.Y., A.K. and H.M.B.; project administration, I.H.A.; resources, I.H.A.; supervision, I.H.A., S.I.A. and M.A.Y.; writing—original draft, S.I.A., S.M.H.S., A.G.U. and M.A.Y., writing—review and editing, S.I.A., M.S., S.S.S., J.C.A. and J.C.E. All authors have read and agreed to the published version of the manuscript.

Funding

This research was funded by the Deanship of Research Oversight and Coordination (DROC) at King Fahd University of Petroleum & Minerals (KFUPM) under the Interdisciplinary Research Center for Membranes and Water Security [Grant Number: INMW2411].

Data Availability Statement

The data presented in this study are available on request from the corresponding author.

Acknowledgments

The authors would like to acknowledge all support from the Interdisciplinary Research Center for Membranes and Water Security, King Fahd University of Petroleum and Minerals.

Conflicts of Interest

The authors declare no conflicts of interest.

References

  1. Li, P.; He, X.; Li, Y.; Xiang, G. Occurrence and Health Implication of Fluoride in Groundwater of Loess Aquifer in the Chinese Loess Plateau: A Case Study of Tongchuan, Northwest China. Expo. Health 2018, 11, 95–107. [Google Scholar] [CrossRef]
  2. Rehman, F.; Abdelazeem, M.; Gobashy, M.M.; Harby, H.; Rehman, F.; Abuelnaga, H.S.O. Application of magnetic method to define the structural setting controlling the contaminated area of Wadi Bani Malik, east Jeddah, Saudi Arabia. Boll. Geofis. Teor. Appl. 2019, 60, 97–122. [Google Scholar] [CrossRef]
  3. Rehman, F.; Subyani, A.M.; Cheema, T.; Harbi, H.M.; Azeem, T.; Naseem, A.A.; Rehman, F.; Ullah, M.F.; Riaz, O.; ur Rehman, S. Contribution to the comparative study of treated and untreated wastewater: A case study (Wadi Fatima and Al Misk Lake) in Saudi Arabia. Arab. J. Geosci. 2020, 13, 842. [Google Scholar] [CrossRef]
  4. Samanta, A.; Chatterjee, A.; Singh, M.K. A Study on the Coexistence of Anthropogenic and Natural Sources in a Three-Dimensional Aquifer. Water 2024, 16, 177. [Google Scholar] [CrossRef]
  5. Agbasi, J.C.; Egbueri, J.C.; Pande, C.B.; Khan MY, A.; Ighalo, J.O.; Uwajingba, H.C.; Abba, S.I. Review of the Potential Effects and Remediation Strategies of Microplastic Pollutants in Drinking Water Sources. Anal. Lett. 2024, 1–41. [Google Scholar] [CrossRef]
  6. Amiri, V.; Sohrabi, N.; Li, P.; Amiri, F. Groundwater Quality for Drinking and Non-Carcinogenic Risk of Nitrate in Urban and Rural Areas of Fereidan, Iran. Expo. Health 2022, 15, 807–823. [Google Scholar] [CrossRef]
  7. Ukah, B.U.; Egbueri, J.C.; Unigwe, C.O.; Ubido, O.E. Extent of heavy metals pollution and health risk assessment of groundwater in a densely populated industrial area, Lagos, Nigeria. Int. J. Energy Water Resour. 2019, 3, 291–303. [Google Scholar] [CrossRef]
  8. Yang, M.; Zhao, A.; Ke, H.; Chen, H. Geo-Environmental Factors’ Influence on the Prevalence and Distribution of Dental Fluorosis: Evidence from Dali County, Northwest China. Sustainability 2023, 15, 1871. [Google Scholar] [CrossRef]
  9. Hagan, G.B.; Minkah, R.; Yiran, G.A.B.; Dankyi, E. Assessing groundwater quality in peri-urban Accra, Ghana: Implications for drinking and irrigation purposes. Groundw. Sustain. Dev. 2022, 17, 100761. [Google Scholar] [CrossRef]
  10. Yang, Q.; Li, Z.; Ma, H.; Wang, L.; Martín, J.D. Identification of the hydrogeochemical processes and assessment of groundwater quality using classic integrated geochemical methods in the Southeastern part of Ordos basin, China. Environ. Pollut. 2016, 218, 879–888. [Google Scholar] [CrossRef] [PubMed]
  11. Xiao, J.; Wang, L.; Chai, N.; Liu, T.; Jin, Z.; Rinklebe, J. Groundwater hydrochemistry, source identification and pollution assessment in intensive industrial areas, eastern Chinese loess plateau. Environ. Pollut. 2021, 278, 116930. [Google Scholar] [CrossRef]
  12. Sheng, D.; Meng, X.; Wen, X.; Wu, J.; Yu, H.; Wu, M.; Zhou, T. Hydrochemical characteristics, quality and health risk assessment of nitrate enriched coastal groundwater in northern China. J. Clean. Prod. 2023, 403, 136872. [Google Scholar] [CrossRef]
  13. Duraisamy, S.; Govindhaswamy, V.; Duraisamy, K.; Krishinaraj, S.; Balasubramanian, A.; Thirumalaisamy, S. Hydrogeochemical characterization and evaluation of groundwater quality in Kangayam taluk, Tirupur district, Tamil Nadu, India, using GIS techniques. Environ. Geochem. Health 2018, 41, 851–873. [Google Scholar] [CrossRef]
  14. Sajil Kumar, P.J.; Elango, L.; James, E.J. Assessment of hydrochemistry and groundwater quality in the coastal area of South Chennai, India. Arab. J. Geosci. 2013, 7, 2641–2653. [Google Scholar] [CrossRef]
  15. De Zuane, P.E.J. Appendix A-II: World Health Organization Guidelines. In Handbook of Drinking Water Quality; Wiley: Hoboken, NJ, USA, 1996; pp. 527–534. [Google Scholar] [CrossRef]
  16. Lan, T.; Hu, Y.; Cheng, L.; Chen, L.; Guan, X.; Yang, Y.; Guo, Y.; Pan, J. Floods and diarrheal morbidity: Evidence on the relationship, effect modifiers, and attributable risk from Sichuan Province, China. J. Glob. Health 2022, 12, 11007. [Google Scholar] [CrossRef] [PubMed]
  17. Abba, S.I.; Egbueri, J.C.; Benaafi, M.; Usman, J.; Usman, A.G.; Aljundi, I.H. Fluoride and nitrate enrichment in coastal aquifers of the Eastern Province, Saudi Arabia: The influencing factors, toxicity, and human health risks. Chemosphere 2023, 336, 139083. [Google Scholar] [CrossRef] [PubMed]
  18. Qu, X.; Zhai, P.; Shi, L.; Qu, X.; Bilal, A.; Han, J.; Yu, X. Distribution, enrichment mechanism and risk assessment for fluoride in groundwater: A case study of Mihe-Weihe River Basin, China. Front. Environ. Sci. Eng. 2022, 17, 70. [Google Scholar] [CrossRef]
  19. Ayejoto, D.A.; Egbueri, J.C. Human health risk assessment of nitrate and heavy metals in urban groundwater in Southeast Nigeria. Acta Ecol. Sin. 2023, 44, 60–72. [Google Scholar] [CrossRef]
  20. Dai, H.; Ju, J.; Gui, D.; Zhu, Y.; Ye, M.; Cui, J.; Hu, B.X. A two-step Bayesian network-based process sensitivity analysis for complex nitrogen reactive transport modeling. J. Hydrol. 2024, 632, 130903. [Google Scholar] [CrossRef]
  21. Ayejoto, D.A.; Agbasi, J.C.; Egbueri, J.C.; Echefu, K.I. Assessment of oral and dermal health risk exposures associated with contaminated water resources: An update in Ojoto area, southeast Nigeria. Int. J. Environ. Anal. Chem. 2022, 104, 641–661. [Google Scholar] [CrossRef]
  22. Babiker, I. Assessment of groundwater contamination by nitrate leaching from intensive vegetable cultivation using geographical information system. Environ. Int. 2004, 29, 1009–1017. [Google Scholar] [CrossRef] [PubMed]
  23. Rahmati, O.; Samani, A.N.; Mahmoodi, N.; Mahdavi, M. Assessment of the Contribution of N-Fertilizers to Nitrate Pollution of Groundwater in Western Iran (Case Study: Ghorveh–Dehgelan Aquifer). Water Qual. Expo. Health 2014, 7, 143–151. [Google Scholar] [CrossRef]
  24. Zhu, Y.; Dai, H.; Yuan, S. The competition between heterotrophic denitrification and DNRA pathways in hyporheic zone and its impact on the fate of nitrate. J. Hydrol. 2023, 626, 130175. [Google Scholar] [CrossRef]
  25. Wen, Z.; Wang, Q.; Ma, Y.; Jacinthe, P.A.; Liu, G.; Li, S.; Shang, Y.; Tao, H.; Fang, C.; Lyu, L.; et al. Remote estimates of suspended particulate matter in global lakes using machine learning models. Int. Soil Water Conserv. Res. 2024, 12, 200–216. [Google Scholar] [CrossRef]
  26. Zhang, K.; Li, Y.; Yu, Z.; Yang, T.; Xu, J.; Chao, L.; Ni, J.; Wang, L.; Gao, Y.; Hu, Y.; et al. Xin’anjiang Nested Experimental Watershed (XAJ-NEW) for Understanding Multiscale Water Cycle: Scientific Objectives and Experimental Design. Engineering 2021, 18, 207–217. [Google Scholar] [CrossRef]
  27. Unigwe, C.O.; Egbueri, J.C.; Omeka, M.E. Geospatial and statistical approaches to nitrate health risk and groundwater quality assessment of an alluvial aquifer in SE Nigeria for drinking and irrigation purposes. J. Indian Chem. Soc. 2022, 99, 100479. [Google Scholar] [CrossRef]
  28. Alum, O.L.; Abugu, H.O.; Onwujiogu, V.C.; Ezugwu, A.L.; Egbueri, J.C.; Aralu, C.C.; Ucheana, I.A.; Okenwa, J.C.; Ezeofor, C.C.; Orjiocha, S.I.; et al. Characterization of the Hydrochemistry, Scaling and Corrosivity Tendencies, and Irrigation Suitability of the Water of the Rivers Karawa and Iyiaji. Sustainability 2023, 15, 9366. [Google Scholar] [CrossRef]
  29. Solangi, G.S.; Siyal, A.A.; Babar, M.M.; Siyal, P. Evaluation of drinking water quality using the water quality index (WQI), the synthetic pollution index (SPI) and geospatial tools in Thatta district, Pakistan. Desalinat. Water Treat. 2019, 160, 202–213. [Google Scholar] [CrossRef]
  30. Subba Rao, N. PIG: A numerical index for dissemination of groundwater contamination zones. Hydrol. Process. 2012, 26, 3344–3350. [Google Scholar] [CrossRef]
  31. Kom, K.P.; Gurugnanam, B.; Bairavi, S. Non-carcinogenic health risk assessment of nitrate and fluoride contamination in the groundwater of Noyyal basin, India. Geod. Geodyn. 2022, 13, 619–631. [Google Scholar] [CrossRef]
  32. Xiao, Y.; Hao, Q.; Zhang, Y.; Zhu, Y.; Yin, S.; Qin, L.; Li, X. Investigating sources, driving forces and potential health risks of nitrate and fluoride in groundwater of a typical alluvial fan plain. Sci. Total Environ. 2022, 802, 149909. [Google Scholar] [CrossRef] [PubMed]
  33. Chakraborty, M.; Tejankar, A.; Coppola, G.; Chakraborty, S. Assessment of groundwater quality using statistical methods: A case study. Arab. J. Geosci. 2022, 15, 1136. [Google Scholar] [CrossRef]
  34. Onjia, A.; Huang, X.; Trujillo González, J.M.; Egbueri, J.C. Editorial: Chemometric approach to distribution, source apportionment, ecological and health risk of trace pollutants. Front. Environ. Sci. 2022, 10, 1107465. [Google Scholar] [CrossRef]
  35. Ben Ali, M.; Hamdi, N.; Rodriguez, M.A.; Mahmoudi, K.; Srasra, E. Preparation and characterization of new ceramic membranes for ultrafiltration. Ceram. Int. 2018, 44, 2328–2335. [Google Scholar] [CrossRef]
  36. Dirks, H.; Al Ajmi, H.; Kienast, P.; Rausch, R. Hydrogeology of the Umm Er Radhuma Aquifer (Arabian peninsula). Grundwasser 2018, 23, 5–15. [Google Scholar] [CrossRef]
  37. Al-Omran, A.M.; Mousa, M.A.; AlHarbi, M.M.; Nadeem, M.E.A. Hydrogeochemical characterization and groundwater quality assessment in Al-Hasa, Saudi Arabia. Arab. J. Geosci. 2018, 11, 79. [Google Scholar] [CrossRef]
  38. Alhawas, I.; Hassaballa, A. Representation of the spatial association between salinity and water chemical properties in Al-Hassa Oasis. Int. J. Agric. Biol. Eng. 2020, 13, 168–174. [Google Scholar] [CrossRef]
  39. Ismail AI, H.; Hassaballa, A.A.; Almadini, A.M.; Daffalla, S. Analyzing the Spatial Correspondence between Different Date Fruit Cultivars and Farms’ Cultivated Areas, Case Study: Al-Ahsa Oasis, Kingdom of Saudi Arabia. Appl. Sci. 2022, 12, 5728. [Google Scholar] [CrossRef]
  40. Wang, G.; Su, W.; Hu, B.; AL-Huqail, A.; Majdi, H.S.; Algethami, J.S.; Jiang, Y.; Ali, H.E. Assessment in carbon-based layered double hydroxides for water and wastewater: Application of artificial intelligence and recent progress. Chemosphere 2022, 308, 136303. [Google Scholar] [CrossRef]
  41. Al Tokhais, A.; Rausch, R. The Hydrogeology of Al Hassa Springs. 2008. Available online: https://www.researchgate.net/profile/Randolf-Rausch/publication/267386708_The_Hydrogeology_of_Al_Hassa_Springs/links/55f150c908aef559dc47075d/The-Hydrogeology-of-Al-Hassa-Springs.pdf (accessed on 12 January 2024).
  42. APHA. Standard Methods for the Examination of Water and Wastewater; APHA: Cincinnati, OH, USA, 2012; 1496p. [Google Scholar]
  43. Oyedele, A.A.; Ayodele, O.S.; Olabode, O.F. Groundwater quality assessment and characterization of shallow basement aquifers in parts of Ado Ekiti metropolis, Southwestern Nigeria. SN Appl. Sci. 2019, 1, 669. [Google Scholar] [CrossRef]
  44. Rao, N.S.; Sunitha, B.; Rambabu, R.; Rao PV, N.; Rao, P.S.; Spandana, B.D.; Sravanthi, M.; Marghade, D. Quality and degree of pollution of groundwater, using PIG from a rural part of Telangana State, India. Appl. Water Sci. 2018, 8, 227. [Google Scholar] [CrossRef]
  45. Egbueri, J.C.; Unigwe, C.O. An integrated indexical investigation of selected heavy metals in drinking water resources from a coastal plain aquifer in Nigeria. SN Appl. Sci. 2019, 1, 1422. [Google Scholar] [CrossRef]
  46. Singh, P.S. Small-Angle Scattering Techniques (SAXS/SANS). In Membrane Characterization; Elsevier B.V.: Amsterdam, The Netherlands, 2017. [Google Scholar] [CrossRef]
  47. Raja, V.; Neelakantan, M.A. Evaluation of groundwater quality with health risk assessment of fluoride and nitrate in Virudhunagar district, Tamil Nadu, India. Arab. J. Geosci. 2021, 14, 52. [Google Scholar] [CrossRef]
  48. Naderi, M.; Jahanshahi, R.; Dehbandi, R. Two distinct mechanisms of fluoride enrichment and associated health risk in springs’ water near an inactive volcano, southeast Iran. Ecotoxicol. Environ. Saf. 2020, 195, 110503. [Google Scholar] [CrossRef]
  49. Egbueri, J.C.; Agbasi, J.C.; Ikwuka, C.F.; Chiaghanam, O.I.; Khan, M.I.; Khan MY, A.; Khan, N.; Uwajingba, H.C. Nitrate health risk and geochemical characteristics of water in a semi-urban: Implications from graphical plots and statistical computing. Int. J. Environ. Anal. Chem. 2023, 1–21. [Google Scholar] [CrossRef]
  50. Egbueri, J.C.; Agbasi, J.C.; Ayejoto, D.A.; Khan, M.I.; Khan, M.Y.A. Extent of anthropogenic influence on groundwater quality and human health-related risks: An integrated assessment based on selected physicochemical characteristics. Geocarto Int. 2023, 38, 2210100. [Google Scholar] [CrossRef]
  51. Mukherjee, I.; Singh, U.K. Fluoride Abundance and their Release Mechanisms in Groundwater along with Associated Human Health Risks in a Geologically Heterogeneous Semi-Arid Region of East India. Microchem. J. 2020, 152, 104304. [Google Scholar] [CrossRef]
  52. Iqbal, J.; Su, C.; Wang, M.; Abbas, H.; Baloch MY, J.; Ghani, J.; Ullah, Z.; Huq, M.E. Groundwater fluoride and nitrate contamination and associated human health risk assessment in South Punjab, Pakistan. Environ. Sci. Pollut. Res. 2023, 30, 61606–61625. [Google Scholar] [CrossRef]
  53. Rao, N.S.; Dinakar, A.; Kumari, B.K. Appraisal of vulnerable zones of non-cancer-causing health risks associated with exposure of nitrate and fluoride in groundwater from a rural part of India. Environ. Res. 2021, 202, 111674. [Google Scholar] [CrossRef]
  54. Luo, M.; Zhang, Y.; Li, H.; Hu, W.; Xiao, K.; Yu, S.; Zheng, C.; Wang, X. Pollution assessment and sources of dissolved heavy metals in coastal water of a highly urbanized coastal area: The role of groundwater discharge. Sci. Total Environ. 2022, 807, 151070. [Google Scholar] [CrossRef]
  55. Shaibur, M.R.; Ahmmed, I.; Sarwar, S.; Karim, R.; Hossain, M.M.; Islam, M.S.; Shah, M.S.; Khan, A.S.; Akhtar, F.; Uddin, M.G.; et al. Groundwater Quality of Some Parts of Coastal Bhola District, Bangladesh: Exceptional Evidence. Urban Sci. 2023, 7, 71. [Google Scholar] [CrossRef]
  56. Oiro, S.; Comte, J.-C. Drivers, patterns and velocity of saltwater intrusion in a stressed aquifer of the East African coast: Joint analysis of groundwater and geophysical data in southern Kenya. J. Afr. Earth Sci. 2019, 149, 334–347. [Google Scholar] [CrossRef]
  57. Mokoena, P.; Manyama, K.; van Bever Donker, J.; Kanyerere, T. Investigation of groundwater salinity using geophysical and geochemical approaches: Heuningnes catchment coastal aquifer. Western Cape Province, South Africa. Environ. Earth Sci. 2021, 80, 191. [Google Scholar] [CrossRef]
  58. Gopinath, S.; Srinivasamoorthy, K. Application of Geophysical and Hydrogeochemical Tracers to Investigate Salinisation Sources in Nagapatinam and Karaikal Coastal Aquifers, South India. Aquat. Procedia 2015, 4, 65–71. [Google Scholar] [CrossRef]
  59. Himi, M.; Tapias, J.; Benabdelouahab, S.; Salhi, A.; Rivero, L.; Elgettafi, M.; El Mandour, A.; Stitou, J.; Casas, A. Geophysical characterization of saltwater intrusion in a coastal aquifer: The case of Martil-Alila plain (North Morocco). J. Afr. Earth Sci. 2017, 126, 136–147. [Google Scholar] [CrossRef]
  60. Alqarawy, A.; El Osta, M.; Masoud, M.; Elsayed, S.; Gad, M. Use of Hyperspectral Reflectance and Water Quality Indices to Assess Groundwater Quality for Drinking in Arid Regions, Saudi Arabia. Water 2022, 14, 2311. [Google Scholar] [CrossRef]
  61. Alshehri, F.; Abdelrahman, K. Integrated approach for the investigation of groundwater quality using hydrochemical and geostatistical analyses in Wadi Fatimah, western Saudi Arabia. Front. Earth Sci. 2023, 11, 1166153. [Google Scholar] [CrossRef]
  62. Hem, J.D. Study and Interpretation the Chemical of Natural of Characteristics Water. USGS Sci. A Chang. World 1985, 272, 2254. [Google Scholar]
  63. Zhang, S.; Bai, X.; Zhao, C.; Tan, Q.; Luo, G.; Wang, J.; Li, Q.; Wu, L.; Chen, F.; Li, C.; et al. Global CO2 Consumption by Silicate Rock Chemical Weathering: Its Past and Future. Earth’s Future 2021, 9, e2020EF001938. [Google Scholar] [CrossRef]
  64. Karmakar, B.; Singh, M.K.; Choudhary, B.K.; Singh, S.K.; Egbueri, J.C.; Gautam, S.K.; Rawat, K.S. Investigation of the hydrogeochemistry, groundwater quality, and associated health risks in industrialized regions of Tripura, northeast India. Environ. Forensics 2021, 24, 285–306. [Google Scholar] [CrossRef]
  65. Lakshmanan, E.; Kannan, R.; Senthil Kumar, M. Major ion chemistry and identification of hydrogeochemical processes of ground water in a part of Kancheepuram district, Tamil Nadu, India. Environ. Geosci. 2003, 10, 157–166. [Google Scholar] [CrossRef]
  66. Ashrafuzzaman, M.; Gomes, C.; Guerra, J. The Changing Climate Is Changing Safe Drinking Water, Impacting Health: A Case in the Southwestern Coastal Region of Bangladesh (SWCRB). Climate 2023, 11, 146. [Google Scholar] [CrossRef]
  67. Hui, T.; Du, J.; Sun, Q.; Liu, Q.; Kang, Z.; Jin, H. Using the Water Quality Index (WQI), and the Synthetic Pollution Index (SPI) to Evaluate the Groundwater Quality for Drinking Purpose in Hailun, China. Sains Malays. 2020, 49, 2383–2401. [Google Scholar] [CrossRef]
  68. Agbasi, J.C.; Egbueri, J.C. Assessment of PTEs in water resources by integrating HHRISK code, water quality indices, multivariate statistics, and ANNs. Geocarto Int. 2022, 37, 10407–10433. [Google Scholar] [CrossRef]
  69. Grema, H.M.; Hamidu, H.; Suleiman, A.; Kankara, A.I.; Umaru, A.O.; Abdulmalik, N.F. Cadmium geochemistry and groundwater pollution status evaluation using indexing and spatial analysis for Keffe community and Environs Sokoto Basin, North Western Nigeria. Niger. J. Basic Appl. Sci. 2022, 30, 5–23. [Google Scholar] [CrossRef]
  70. Jamali, M.Z.; Solangi, G.S.; Keerio, M.A.; Keerio, J.A.; Bheel, N. Assessing and mapping the groundwater quality of Taluka Larkana, Sindh, Pakistan, using water quality indices and geospatial tools. Int. J. Environ. Sci. Technol. 2022, 20, 8849–8862. [Google Scholar] [CrossRef]
  71. Abed, M.F.; Zarraq, G.A.; Ahmed, S.H. Assessment of Groundwater Pollution using Aqueous Geo-Environmental Indices, Baiji Province, Salah Al-Din, Iraq. Iraqi Geol. J. 2022, 55, 94–104. [Google Scholar] [CrossRef]
  72. Choudhary, M.; Muduli, M.; Ray, S. A comprehensive review on nitrate pollution and its remediation: Conventional and recent approaches. Sustain. Water Resour. Manag. 2022, 8, 113. [Google Scholar] [CrossRef]
  73. Alharbi, T.; Abdelrahman, K.; El-Sorogy, A.S.; Ibrahim, E. Contamination and health risk assessment of groundwater along the Red Sea coast, Northwest Saudi Arabia. Mar. Pollut. Bull. 2023, 192, 115080. [Google Scholar] [CrossRef]
  74. Biswas, T.; Pal, S.C.; Chowdhuri, I.; Ruidas, D.; Saha, A.; Islam AR, M.T.; Shit, M. Effects of elevated arsenic and nitrate concentrations on groundwater resources in deltaic region of Sundarban Ramsar site, Indo-Bangladesh region. Mar. Pollut. Bull. 2023, 188, 114618. [Google Scholar] [CrossRef]
  75. Qasemi, M.; Darvishian, M.; Nadimi, H.; Gholamzadeh, M.; Afsharnia, M.; Farhang, M.; Allahdadi, M.; Darvishian, M.; Zarei, A. Characteristics, water quality index and human health risk from nitrate and fluoride in Kakhk city and its rural areas, Iran. J. Food Compos. Anal. 2023, 115, 104870. [Google Scholar] [CrossRef]
  76. Sunitha, V. Geochemical and health risk assessment of fluoride and nitrate toxicity in semi-arid region of Anantapur District, South India. Environ. Chem. Ecotoxicol. 2020, 2, 150–161. [Google Scholar] [CrossRef]
  77. Giri, S.; Mahato, M.K.; Singh, P.K.; Singh, A.K. Non-carcinogenic health risk assessment for fluoride and nitrate in the groundwater of the mica belt of Jharkhand, India. Hum. Ecol. Risk Assess. Int. J. 2021, 27, 1939–1953. [Google Scholar] [CrossRef]
  78. Hossain, M.; Patra, P.K. Hydrogeochemical characterisation and health hazards of fluoride enriched groundwater in diverse aquifer types. Environ. Pollut. 2020, 258, 113646. [Google Scholar] [CrossRef] [PubMed]
  79. Fejerskov, O.; Larsen, M.J.; Richards, A.; Baelum, V. Dental Tissue Effects of Fluoride. Adv. Dent. Res. 1994, 8, 15–31. [Google Scholar] [CrossRef]
  80. Chen, Q.; Lu, Q.; Song, Z.; Chen, P.; Cui, Y.; Zhang, R.; Li, X.; Liu, J. The levels of fluorine in the sediments of the aquifer and their significance for fluorosis in coastal region of Laizhou Bay, China. Environ. Earth Sci. 2013, 71, 4513–4522. [Google Scholar] [CrossRef]
  81. Tajwar, M.; Uddin, A.; Lee, M.-K.; Nelson, J.; Zahid, A.; Sakib, N. Hydrochemical Characterization and Quality Assessment of Groundwater in Hatiya Island, Southeastern Coastal Region of Bangladesh. Water 2023, 15, 905. [Google Scholar] [CrossRef]
  82. Li, S.; Zhang, Q. Geochemistry of the upper Han River basin, China, 1: Spatial distribution of major ion compositions and their controlling factors. Appl. Geochem. 2008, 23, 3535–3544. [Google Scholar] [CrossRef]
  83. Zhang, Y.P.; Li, P.P.; Liu, P.F.; Zhang, W.Q.; Wang, J.C.; Cui, C.X.; Li, X.J.; Qu, L.B. Fast and simple fabrication of superhydrophobic coating by polymer induced phase separation. Nanomaterials 2019, 9, 411. [Google Scholar] [CrossRef]
  84. Yu, G.; Wang, J.; Liu, L.; Li, Y.; Zhang, Y.; Wang, S. The analysis of groundwater nitrate pollution and health risk assessment in rural areas of Yantai, China. BMC Public Health 2020, 20, 437. [Google Scholar] [CrossRef]
  85. Egbueri, J.C.; Agbasi, J.C. Data-driven soft computing modeling of groundwater quality parameters in southeast Nigeria: Comparing the performances of different algorithms. Environ. Sci. Pollut. Res. 2022, 29, 38346–38373. [Google Scholar] [CrossRef] [PubMed]
  86. Li, Q.; Lu, L.; Zhao, Q.; Hu, S. Impact of Inorganic Solutes’ Release in Groundwater during Oil Shale In Situ Exploitation. Water 2023, 15, 172. [Google Scholar] [CrossRef]
  87. Liu, Z.; Xu, Z.; Zhu, X.; Yin, L.; Yin, Z.; Li, X.; Zheng, W. Calculation of carbon emissions in wastewater treatment and its neutralization measures: A review. Sci. Total Environ. 2024, 912, 169356. [Google Scholar] [CrossRef] [PubMed]
  88. Rafique, T.; Naseem, S.; Usmani, T.H.; Bashir, E.; Khan, F.A.; Bhanger, M.I. Geochemical factors controlling the occurrence of high fluoride groundwater in the Nagar Parkar area, Sindh, Pakistan. J. Hazard. Mater. 2009, 171, 424–430. [Google Scholar] [CrossRef] [PubMed]
  89. Rasool, A.; Farooqi, A.; Xiao, T.; Ali, W.; Noor, S.; Abiola, O.; Ali, S.; Nasim, W. A review of global outlook on fluoride contamination in groundwater with prominence on the Pakistan current situation. Environ. Geochem. Health 2017, 40, 1265–1281. [Google Scholar] [CrossRef]
  90. Yadav, K.K.; Kumar, S.; Pham, Q.B.; Gupta, N.; Rezania, S.; Kamyab, H.; Yadav, S.; Vymazal, J.; Kumar, V.; Tri, D.Q.; et al. Fluoride contamination, health problems and remediation methods in Asian groundwater: A comprehensive review. Ecotoxicol. Environ. Saf. 2019, 182, 109362. [Google Scholar] [CrossRef]
  91. Liu, J.; Peng, Y.; Li, C.; Gao, Z.; Chen, S. A characterization of groundwater fluoride, influencing factors and risk to human health in the southwest plain of Shandong Province, North China. Ecotoxicol. Environ. Saf. 2021, 207, 111512. [Google Scholar] [CrossRef]
Figure 1. A map indicating the Al-Hassa area along with the locations of the samples.
Water 16 01401 g001
Figure 2. The study area’s geology and hydrogeology are depicted in the map, illustrating key geological units [41].
Water 16 01401 g002
Figure 3. Hydrogeological units of the aquifer system in the study area [41].
Water 16 01401 g003
Figure 4. Simplified flowchart of the steps utilized in the HHRA method.
Water 16 01401 g004
Figure 5. (a) Graphical representation of physical parameters’ distribution in groundwater. (b) Graphical representation of cation distribution in groundwater. (c) Graphical representation of anions trend in Al-Hassa groundwater.
Water 16 01401 g005aWater 16 01401 g005b
Figure 6. Hydrogeochemical species plotted on a Chadha’s diagram for unraveling the prevalent processes influencing the water chemistry.
Water 16 01401 g006
Figure 7. Percentage (%) contributions of physicochemical variables to the overall groundwater quality as evidenced by (a) PIG and (b) SPI.
Water 16 01401 g007
Figure 8. Relationship between F and NO3 cumulative HI values.
Water 16 01401 g008
Figure 9. Spatial distribution of groundwater quality and contamination hotspots based on (a) PIG, (b) SPI, (c) HI-nitrate (oral), (d) HI-fluoride (oral), (e) ∑THI, and (f) HI-nitrate (dermal).
Water 16 01401 g009aWater 16 01401 g009b
Figure 10. Visual representations of principal components: (a) the scree plot, (b) the 3D component plot.
Water 16 01401 g010
Figure 11. Graph showing the geochemical associations amongst (a) HCO3/Na+ vs. Ca2+/Na+, and (b) Mg2+/Na+ vs. Ca2+/Na+.
Water 16 01401 g011
Figure 12. Linear relationships between (a) (NO3 + Cl)/HCO3 vs. TDS, (b) Cl/Na+ vs. NO3/Na+, (c) NO3 vs. F, and (d) NO3/Cl vs. Cl.
Water 16 01401 g012
Figure 13. Linear relationships between (a) F vs. Br, (b) F vs. Ca2+, (c) F vs. HCO3, (d) F vs. Mg2+, (e) F vs. K+, (f) F vs. SO42−, (g) F vs. pH, and (h) F vs. Na+.
Water 16 01401 g013aWater 16 01401 g013b
Table 1. The assigned weights for physicochemical parameters for PIG calculation.
S/No.ParameterWHO (2022, 2017) StandardUnitRwWp
1pH6.5–8.5-30.0555
2EC1000µS/cm40.0740
3TDS1000mg/L40.0740
4Turbidity4NTU30.0555
5HCO3250mg/L40.0740
6Na+200mg/L40.0740
7K+12mg/L40.0740
8Mg2+50mg/L40.0740
9Ca2+75mg/L40.0740
10SO42−250mg/L40.0740
11Cl250mg/L40.0740
12NO350mg/L40.0740
13F1.5mg/L40.0740
14Br2mg/L40.0740
Rw = 54Wp = 1.00
Table 2. Parameters used to calculate non-carcinogenic health hazards in accordance with (USEPA (United States Environmental Protection Agency) 2018; 2000; 1989) recommendations.
(a) Parameters for NO3 and F Ingestion Health Risk Assessment [17,31,32,49]
ParameterUnitInfants (<2 Years)Children (2–16 Years)Adults (>16 Years)
Chronic daily intake (CDI)mg/kg/day
Concentration in groundwater (C)mg/L
Ingestion rate of water (IR)L/day0.651.502.00
Exposure frequency (EF)days/year365365365
Exposure duration (ED)year0.506.0030.00
Average body weight (BW)kg6.9425.9064.70
Average time (AT)day182.502190.0010,950.00
Reference dose (RfD) (NO3)mg/kg/day1.61.61.6
Reference dose (RfD) (F)mg/kg/day0.040.040.04
(b) Parameters for NO3 dermal health risk assessment [19,31,32,49,50,51]
ParameterUnitChildrenWomenMen
Dermally absorbed dose (DAD)mg/kg/day
Concentration in groundwater (C)mg/L
Duration of the contact (TC)hr/day0.40.40.4
Rate of bathing (EV)time/day111
Dermal adsorption parameter (Ki)cm/h0.0010.0010.001
Skin surface area (SSA)cm212,00016,60016,600
Exposure duration (ED)year126764
Exposure frequency (EF)days/year365365365
Unit conversion factors (CF)0.0010.0010.001
Average body weight (BW)kg155565
Average time (AT)day438024,45523,360
Reference dose (RfD)mg/kg/day1.61.61.6
Table 3. Dataset of the measured groundwater physicochemical parameters for this study.
Sample IDpHEC (µS/cm)TDS (mg/L)TA (ppm)Turb. (NTU)HCO3 (mg/L)Na+ (mg/L)K+ (mg/L)Mg2+ (mg/L)Ca2+ (mg/L)SO42− (mg/L)Cl (mg/L)NO3 (mg/L)F (mg/L)Br (mg/L)
AHF-16.72135.82928153.4180.9153.41100.316.4633.59117.960.00371.3324.030.000.00
AHF-26.578203.253592274.6883.03274.68695.8535.31194.11409.680.002111.0346.020.972.98
AHF-37.142271.11215615084.1150115.036.7549.66111.370.00405.1817.050.000.00
AHF-46.745892.842636216.4356.2216.43440.7023.66129.73297.530.001388.5743.350.002.86
AHF-56.972062.971020157.5184157.5195.036.3043.89105.110.00350.2722.580.930.00
AHF-67.027422.713413205.5685.07205.56473.9815.58122.52295.200.001394.0759.190.002.83
AHF-106.877703.73675168.231.11168.23836.5035.39191.21464.051353.351493.93102.930.003.65
AHF-117.282187.851114155.710.95155.71122.817.7339.6994.83195.18256.2121.270.581.15
AHF-127.084727.232345173.640.66173.64312.8611.2568.30168.10522.09529.4135.710.761.52
AHF-137.054154.832060171.640.74171.64285.949.8564.16153.36459.39489.3233.480.501.44
AHF-147.15216.372480161.730.97161.73441.8611.4795.05200.75589.31785.2140.130.902.32
AHF-157.055570.212562204.351.38204.35420.4416.7397.25232.01627.46803.2034.701.092.34
AHF-167.234508.671931174.630.88174.63344.0617.1077.57166.53453.47633.8226.240.531.83
AHF-177.24623.152054191.810.84191.81364.4919.2480.84165.37461.09655.5124.470.581.87
AHF-186.899129.54130270.840.27270.84777.9529.72166.20377.531046.891410.143.981.073.01
AHF-196.989181.534014294.370.82294.37732.9627.21188.20421.371060.71448.4925.800.733.96
AHF-207.44539.892032170.120.98170.12347.0422.2984.00172.98505.50630.2223.260.831.94
AHF-217.117568.413577193.350.85193.35644.3527.73138.09310.06902.841099.4545.601.092.73
AHF-227.0911,179.736462.92187.071.63187.07908.3834.88181.18241.21817.181856.819.480.584.89
AHF-237.125278.812988.71184.441.17184.44453.3016.0088.95165.35437.78858.5018.390.882.93
AHF-247.173436.721924.95184.91.24184.9356.3011.6458.91132.22333.32659.0118.930.782.40
AHF-257.026038.543430.38221.611.98221.61546.3018.7599.21181.26563.70950.6020.010.692.91
AHF-267.2111,450.326624.58267.361.12267.361001.7244.56229.26333.651253.691986.318.651.285.25
AHF-277.1511,887.426886.15279.140.46279.14986.6040.17225.44359.211305.531869.722.400.654.65
AHF-287.0812,366.167173.24296.683.15296.681008.7845.49241.17375.941379.521956.818.810.865.15
AHF-297.2514,114.588226.97297.151.11297.151120.0953.68248.40328.731308.412169.611.740.975.70
AHF-307.28473.844857.47251.831.91251.83652.9026.10150.59265.08871.221245.315.670.003.50
Minimum6.572062.97928.00150.000.27150.0095.036.3033.5994.830.00256.2111.740.000.00
Maximum7.4014,114.588226.97297.1585.07297.151120.0953.68248.40464.051379.522169.60102.931.285.70
Mean7.066715.783492.38209.5618.43209.56540.2423.00125.45246.16609.171104.0030.880.642.73
Notes: EC: electrical conductivity; TDS: total dissolved solids; TA: total alkalinity; Turb.: turbidity.
Table 4. Overall quality of groundwater samples and its influencers based on PIG model.
Sample IDOw
(pH)
Ow
(EC)
Ow
(TDS)
Ow
(Turb.)
Ow
(HCO3)
Ow
(Na+)
Ow
(K+)
Ow
(Mg2+)
Ow
(Ca2+)
Ow
(SO42−)
Ow
(Cl)
Ow
(NO3)
Ow
(F)
Ow
(Br)
PIG
AHF-10.05310.15810.06871.12250.04540.03710.03980.04970.11640.00000.10990.03560.00000.00001.8363
AHF-20.05210.60700.26581.15200.08130.25750.21770.28730.40420.00000.62490.06810.04800.11044.1763
AHF-30.05660.16810.15951.16690.04440.04260.04160.07350.10990.00000.11990.02520.00000.00002.0082
AHF-40.05340.43610.19510.77980.06410.16310.14590.19200.29360.00000.41100.06420.00000.10582.9039
AHF-50.05530.15270.07551.16550.04660.03520.03890.06490.10370.00000.10370.03340.04600.00001.9213
AHF-60.05570.54930.25261.18030.06080.17540.09610.18130.29130.00000.41260.08760.00000.10463.4476
AHF-100.05450.57010.27200.01540.04980.30950.21830.28300.45790.40060.44220.15230.00000.13493.3603
AHF-110.05770.16190.08240.01320.04610.04540.04770.05870.09360.05780.07580.03150.02840.04240.8426
AHF-120.05610.34980.17350.00920.05140.11580.06940.10110.16590.15450.15670.05290.03730.05621.5497
AHF-130.05590.30750.15240.01030.05080.10580.06070.09500.15130.13600.14480.04950.02470.05311.3978
AHF-140.05630.38600.18350.01350.04790.16350.07070.14070.19810.17440.23240.05940.04450.08601.8568
AHF-150.05590.41220.18960.01910.06050.15560.10320.14390.22890.18570.23770.05130.05380.08651.9840
AHF-160.05730.33360.14290.01220.05170.12730.10540.11480.16430.13420.18760.03880.02620.06771.5642
AHF-170.05710.34210.15200.01170.05680.13490.11870.11960.16320.13650.19400.03620.02840.06901.6201
AHF-180.05460.67560.30560.00370.08020.28780.18330.24600.37250.30990.41740.06510.05260.11133.1656
AHF-190.05530.67940.29700.01140.08710.27120.16780.27850.41580.31400.42880.03820.03610.14663.2271
AHF-200.05870.33600.15040.01360.05040.12840.13750.12430.17070.14960.18650.03440.04100.07191.6533
AHF-210.05640.56010.26470.01180.05720.23840.17100.20440.30590.26720.32540.06750.05360.10112.6848
AHF-220.05620.82730.47830.02260.05540.33610.21510.26810.23800.24190.69520.02880.02850.18103.6724
AHF-230.05650.39060.22120.01620.05460.14120.09870.13160.16310.12960.32160.02720.04350.10841.9041
AHF-240.05680.25430.14240.01720.05470.08490.07180.08720.13050.09870.19510.02800.03850.08891.3490
AHF-250.05570.44690.25380.02750.06560.16050.11560.14680.17880.16690.34720.02960.03400.10772.1366
AHF-260.05720.84730.49020.01550.07910.37060.27480.33930.32920.37110.73430.02760.06310.19414.1934
AHF-270.05670.87970.50960.00640.08260.34870.24770.33370.35440.38640.70040.03320.03200.17204.1433
AHF-280.05610.91510.53080.04370.08780.37320.28050.35690.37090.40830.74200.02780.04220.19054.4260
AHF-290.05751.04450.60880.01540.08800.41440.33100.36760.32430.38730.80210.01740.04800.21094.7172
AHF-300.05710.62710.35950.02650.07450.21720.16090.22290.26150.25790.46500.02320.00000.12942.8827
Minimum0.05210.15270.06870.00370.04440.03520.03890.04970.09360.00000.07580.01740.00000.00000.8426
Maximum0.05871.04450.60881.18030.08800.41440.33100.36760.45790.40830.80210.15230.06310.21094.7172
Mean0.05600.49700.25840.25570.06200.19410.14180.18570.24290.18030.36350.04570.03150.10112.6157
Contribution (%)2.140518.99929.88019.77432.37147.42125.42257.09819.28546.893513.89661.74741.20403.8658
Table 5. SPI ratings of groundwater variables and overall water quality.
Sample IDSPI
(pH)
SPI (EC)SPI (TDS)SPI (Turb.)SPI (HCO3)SPI
(Na+)
SPI
(K+)
SPI
(Mg2+)
SPI
(Ca2+)
SPI
(SO42−)
SPI
(Cl)
SPI
(NO3)
SPI
(F)
SPI
(Br)
Final SPI
AHF-10.07970.00120.00052.94790.00140.00150.02620.00780.01220.00000.00350.00560.00000.00003.0876
AHF-20.07820.00480.00213.02550.00260.01010.14290.04530.04250.00000.01970.01070.25210.43494.0715
AHF-30.08500.00130.00133.06450.00140.00170.02730.01160.01150.00000.00380.00400.00000.00003.2133
AHF-40.08020.00340.00152.04790.00200.00640.09580.03030.03080.00000.01300.01010.00000.41672.7381
AHF-50.08290.00120.00063.06090.00150.00140.02550.01020.01090.00000.00330.00530.24150.00003.4451
AHF-60.08350.00430.00203.09990.00190.00690.06310.02860.03060.00000.01300.01380.00000.41223.7598
AHF-100.08170.00450.00210.04040.00160.01220.14330.04460.04810.01260.01390.02400.00000.53140.9606
AHF-110.08660.00130.00060.03460.00150.00180.03130.00930.00980.00180.00240.00500.14930.16690.5021
AHF-120.08420.00280.00140.02400.00160.00460.04560.01590.01740.00490.00490.00830.19620.22130.6331
AHF-130.08390.00240.00120.02700.00160.00420.03990.01500.01590.00430.00460.00780.12960.20920.5464
AHF-140.08450.00300.00140.03530.00150.00640.04640.02220.02080.00550.00730.00940.23370.33860.8162
AHF-150.08390.00320.00150.05030.00190.00610.06770.02270.02400.00590.00750.00810.28270.34060.9062
AHF-160.08600.00260.00110.03210.00160.00500.06920.01810.01730.00420.00590.00610.13760.26690.6538
AHF-170.08570.00270.00120.03060.00180.00530.07790.01890.01710.00430.00610.00570.14900.27200.6783
AHF-180.08200.00530.00240.00980.00250.01130.12030.03880.03910.00980.01320.01030.27650.43831.0596
AHF-190.08310.00540.00230.02990.00270.01070.11020.04390.04370.00990.01350.00600.18940.57731.1280
AHF-200.08800.00260.00120.03570.00160.00510.09030.01960.01790.00470.00590.00540.21530.28320.7766
AHF-210.08460.00440.00210.03100.00180.00940.11230.03220.03210.00840.01030.01060.28170.39841.0192
AHF-220.08440.00650.00380.05940.00170.01320.14120.04230.02500.00760.02190.00450.14950.71291.2740
AHF-230.08470.00310.00170.04260.00170.00560.06480.02070.01710.00410.01010.00430.22850.42710.9162
AHF-240.08530.00200.00110.04520.00170.00330.04710.01370.01370.00310.00610.00440.20240.35010.7794
AHF-250.08350.00350.00200.07210.00210.00630.07590.02310.01880.00530.01090.00470.17850.42430.9111
AHF-260.08580.00670.00390.04080.00250.01460.18040.05350.03460.01170.02310.00430.33140.76451.5578
AHF-270.08510.00690.00400.01680.00260.01370.16260.05260.03720.01220.02210.00520.16790.67751.2664
AHF-280.08420.00720.00420.11480.00280.01470.18420.05620.03900.01290.02340.00440.22150.75041.5198
AHF-290.08630.00820.00480.04040.00280.01630.21730.05790.03410.01220.02530.00270.25190.83101.5912
AHF-300.08570.00490.00280.06960.00230.00860.10570.03510.02750.00810.01470.00370.00000.50970.8784
Min.0.07820.00120.00050.00980.00140.00140.02550.00780.00980.00000.00240.00270.00000.00000.5021
Max.0.08800.00820.00483.09990.00280.01630.21730.05790.04810.01290.02530.02400.33140.83104.0715
Mean0.08400.00390.00200.67150.00200.00760.09310.02930.02550.00570.01150.00720.16540.39831.5070
Cont. (%)5.57560.25980.135144.55480.12970.50746.17941.94131.69300.37710.76010.477910.976326.4323-
Table 6. Summary of the non-carcinogenic (chronic) health risk assessment.
Sample ID(a) NO3 Ingestion Health Risk(b) F Ingestion Health Risk(c) THI Due to NO3 and F Ingestion(d) NO3 Dermal Health Risk
HQ (<2 yrs.)HQ (2–16 yrs.)HQ (>16 yrs.)HI (∑HQ)HQ (<2 yrs.)HQ (2–16 yrs.)HQ (>16 yrs.)HI (∑HQ)THI (<2 yrs.)THI (2–16 yrs.)THI (>16 yrs.)∑THIHQ (Children)HQ (Women)HQ (Men)HI (∑HQ)
AHF-11.410.870.462.740.000.000.000.001.410.870.462.740.000.000.000.01
AHF-22.691.670.895.252.281.410.754.444.973.071.649.690.010.000.000.02
AHF-31.000.620.331.940.000.000.000.001.000.620.331.940.000.000.000.01
AHF-42.541.570.844.940.000.000.000.002.541.570.844.940.010.000.000.01
AHF-51.320.820.442.582.181.350.724.253.502.171.166.830.000.000.000.01
AHF-63.462.141.146.750.000.000.000.003.462.141.146.750.010.000.000.02
AHF-106.033.731.9911.740.000.000.000.006.033.731.9911.740.020.010.010.03
AHF-111.250.770.412.431.350.830.452.632.591.600.865.050.000.000.000.01
AHF-122.091.290.694.071.771.100.593.453.862.391.277.530.010.000.000.01
AHF-131.961.210.653.821.170.720.392.283.131.941.036.100.010.000.000.01
AHF-142.351.450.784.582.111.310.704.124.462.761.478.690.010.000.000.01
AHF-152.031.260.673.962.551.580.844.984.592.841.518.930.010.000.000.01
AHF-161.540.950.512.991.240.770.412.422.781.720.925.420.010.000.000.01
AHF-171.430.890.472.791.350.830.442.622.781.720.925.410.000.000.000.01
AHF-182.571.590.855.022.501.540.824.875.073.141.679.880.010.000.000.01
AHF-191.510.930.502.941.711.060.563.333.221.991.066.280.010.000.000.01
AHF-201.360.840.452.651.951.200.643.793.312.051.096.440.000.000.000.01
AHF-212.671.650.885.202.551.570.844.965.213.221.7210.160.010.000.000.02
AHF-221.140.710.382.221.350.840.452.632.491.540.824.850.000.000.000.01
AHF-231.080.670.362.102.071.280.684.023.141.941.046.120.000.000.000.01
AHF-241.110.690.372.161.831.130.603.562.941.820.975.720.000.000.000.01
AHF-251.170.720.392.281.611.000.533.142.781.720.925.430.000.000.000.01
AHF-261.090.680.362.132.991.850.995.844.092.531.357.960.000.000.000.01
AHF-271.310.810.432.561.520.940.502.962.831.750.935.510.000.000.000.01
AHF-281.100.680.362.152.001.240.663.903.101.921.026.050.000.000.000.01
AHF-290.690.430.231.342.281.410.754.432.961.830.985.770.000.000.000.00
AHF-300.920.570.301.790.000.000.000.000.920.570.301.790.000.000.000.01
Min.0.690.430.231.340.000.000.000.000.920.570.301.790.000.000.000.00
Max.6.033.731.9911.742.991.850.995.846.033.731.9911.740.020.010.010.03
Average1.811.120.603.521.490.920.492.913.302.041.096.430.010.000.000.01
Table 7. The levels of relationship between the parameters under test are displayed in the Pearson’s correlation matrix.
Parameter pHECTDSTATurbidityHCO3Na+K+Mg2+Ca2+SO42−ClNO3FBr
pH1.000
EC0.0401.000
TDS0.1450.971 **1.000
TA−0.1090.840 **0.784 **1.000
Turbidity−0.574 **−0.331−0.321−0.1901.000
HCO3−0.1090.840 **0.784 **1.000 **−0.1901.000
Na+0.0000.981 **0.938 **0.792 **−0.3690.792 **1.000
K+0.0210.945 **0.916 **0.799 **−0.3120.799 **0.965 **1.000
Mg2+−0.0810.968 **0.923 **0.848 **−0.2500.848 **0.981 **0.966 **1.000
Ca2+−0.3450.791 **0.666 **0.749 **−0.1340.749 **0.844 **0.801 **0.887 **1.000
SO42−0.2860.790 **0.778 **0.600 **−0.697 **0.600 **0.834 **0.776 **0.771 **0.646 **1.000
Cl−0.0780.961 **0.951 **0.816 **−0.1690.816 **0.944 **0.939 **0.960 **0.767 **0.659 **1.000
NO3−0.470 *−0.005−0.142−0.1590.116−0.1590.1180.0450.1230.480 *0.060−0.0141.000
F0.2210.2850.2510.331−0.413 *0.3310.3060.3010.2510.1200.3450.219−0.2721.000
Br0.1220.951 **0.926 **0.778 **−0.466 *0.778 **0.945 **0.911 **0.925 **0.742 **0.787 **0.931 **−0.0040.2911.000
Notes: ** Correlation is significant at the 0.01 level (two-tailed). * Correlation is significant at the 0.05 level (two-tailed).
Table 8. Principal component loadings that illustrate the degrees of relationship between the parameters under test.
ParameterCommunalityPrincipal Components (PCs)
PC1PC2PC3
pH0.7880.023−0.8770.137
EC0.9690.9840.007−0.028
TDS0.9120.945−0.095−0.095
TA0.8880.8770.070−0.338
Turbidity0.868−0.3810.691−0.496
HCO30.8880.8770.070−0.338
Na+0.9810.9840.0460.107
K+0.9280.9630.0350.015
Mg2+0.9880.9820.1500.014
Ca2+0.9370.8330.4450.211
SO42−0.9040.826−0.2850.374
Cl0.9350.9480.126−0.140
NO30.9420.0170.6600.711
F0.3670.340−0.486−0.124
Br0.9250.955−0.0860.066
Eigenvalue9.7112.2661.244
Variability (%)64.74015.1078.291
Cumulative (%)64.74079.84788.138
Disclaimer/Publisher’s Note: The statements, opinions and data contained in all publications are solely those of the individual author(s) and contributor(s) and not of MDPI and/or the editor(s). MDPI and/or the editor(s) disclaim responsibility for any injury to people or property resulting from any ideas, methods, instructions or products referred to in the content.

