Article

Water Point and Non-Point Nitrogen Pollution Due to Land-Use Change and Nitrate Deposition in China from 2000 to 2020

1
School of Geographical Sciences, Nanjing University of Information Science and Technology, Nanjing 210044, China
2
Institute of Grain Crops, Xinjiang Academy of Agricultural Sciences, Urumqi 830091, China
3
Institute of Soil Science, Leibniz University of Hannover, Herrenhäuser Straße, 230419 Hannover, Germany
4
School of Chemical Engineering and Materials, Changzhou Institute of Technology, No. 666 Liaohe Road, Changzhou 213032, China
5
College of Biology and the Environment, Nanjing Forestry University, Nanjing 210037, China
6
Co-Innovation Center for the Sustainable Forestry in Southern China, Nanjing Forestry University, Nanjing 210037, China
7
National Positioning Observation Station of Hung-tse Lake Wetland Ecosystem in Jiangsu Province, Huaian 223100, China
*
Author to whom correspondence should be addressed.
Water 2024, 16(10), 1396; https://doi.org/10.3390/w16101396
Submission received: 7 March 2024 / Revised: 8 May 2024 / Accepted: 10 May 2024 / Published: 14 May 2024

Abstract

:
Water N-NO3 (mg L−1) pollution is attracting global concern in the face of combating climate change and human health risks. However, there have been comparatively few comprehensively researched studies on water N-NO3 pollution with respect to N-NO3 deposition, soil nitrogen, and land-use changes. We collected a total of 7707 published sampling points on N-NO3 surface and groundwater during flooding and non-flooding seasons during 2000–2020 in China. The types of water N-NO3 pollution (>20) can be categorized as point pollution (ΔTN ≤ 0 or > 1.5) and non-point pollution (0 < ΔTN ≤ 1.5), which were then assessed with respect to soil nitrogen (ΔTN g kg−1) and water N-NO3 changes in this study. We found non-point pollution was concentrated in the Huaihe River Basin and Haihe River Basin with higher urbanization (+6%, +4%), cropland (72%, 45%), nitrogen fertilization (g m−2 yr−1) (>10), and increased wet N-NO3 deposition (WND) (kg ha−1 yr−1) (+4.6, +3). The Haihe River Basin was found to have the highest N-NO3 on its surface (306) and in its groundwater (868) and nitrogen fertilization (32). Point pollution was concentrated in the Songhua and Liaohe River Basin with the highest WND (+7.9) but slow urbanization (+1%). N-NO3 increased during the flooding season compared with the no-flooding season in serious pollution areas. N-NO3 increased in the Liaohe River and middle and low Yangtze River but was reduced in the Weihe River. Therefore, stringent criteria and management, especially during the flooding season are urgently required to mitigate the degree of N-NO3 water pollution that occurs due to intensive agriculture and urbanization with increased N-NO3 deposition.

1. Introduction

Land management, especially fertilization in agroecosystems, is a main controller of nitrogen input into a water system where nitrate (N-NO3) is the main pollutant [1,2]. The overuse of chemical nitrogen (N) fertilizers in agricultural land results in an increase in nitrate in soil drainage and subsequently in groundwater (GW) [3] and surface water (SW) [4], thereby causing the well-known eutrophication problem [5,6].
The cropland area in China, which is approximately 8.6% of the global cropland area [7], has increased from 130 × 106 to 136 × 106 ha between 2000 and 2020. The Chinese croplands consume approximately 22.8% of global chemical N fertilizers, which is three times the world average level [8]. This value can be compared with the application of N fertilizers in India and the United States, which possess 10.8% and 10.3% of the global cropland area, respectively, but only consume 18% and 10% of the global inorganic N fertilizers [7]. Excluding its croplands, the Chinese urban land area is more than 21 × 106 ha, which is larger than the area of the entire United Kingdom, with a per capita settlement of more than 35% the area of Japan [9]. The urban areas and municipal waste can also provide a significant source of nitrate to the water system. For example, the growth rate of nitrate concentration in the Mississippi River was between 5% and 13% due to urbanization between 2000 and 2008 [10]. Approximately 64% of the nitrate in the water systems of Slovenia came from domestic wastewater and the agricultural sector [11]. As an example, in China, the N content of the urban rivers in Hangzhou were three to five times greater than what was found in the rivers which were not influenced by cities [12]. The extremely rapid urban land area expansions in China, the U.S., and India account for 43% of the world’s total urban sprawl [13]. Therefore, such rapid urbanization in China, which is expected to continue in the future, raises further concerns regarding nitrate pollution.
Nitrogen deposition is affected by land use and results in pollution to water systems [14]. The average annual atmospheric nitrate deposition has increased by 60% from 1980 (13 kg ha−2) to 2010 (21 kg ha−2) [15] in China. The relatively high average of N-NO3− deposition (7 kg ha−2) in China [16] is especially acute in the economic and urbanized regions [17,18], e.g., the Pearl River Delta [19]. Croplands are one of the primary sources of nitrogen deposition [20]. Nitrogen compounds are easily volatilized in gaseous form and are subsequently deposited into soils and water bodies with precipitation following the application of fertilizers and pesticides on farmlands [21], thereby becoming significant contributors to nitrogen deposition. The nitrogen deposition caused by nitrogen overuse accounted for 10% to 20% of the total nitrogen deposition in hotspot regions, which includes China, India, and the United States [22]. It was found that 11.9% of the N surplus in the surface soil of Indian farmlands was because of atmospheric N-NO3 deposition [23]. The conversion of agricultural land into urban residential or industrial areas in peri-urban regions alters land-use patterns, thereby affecting both the mode and flux of nitrogen deposition. In the Sichuan region of China, the nitrogen deposition flux in underdeveloped areas was only 40% of that which occurred in developed cities [24]. Nitrogen deposition was also found to be a significant factor contributing to water pollution and lake sediment [25,26]. There were 5–8 kg of N ha−1 y−1 transported to the lake sediments in the Colorado Rocky Mountains region of the United States [27], and more than 30% of the nitrate nitrogen pollution in the water bodies of Jincheng came from atmospheric nitrogen deposition [14]. Nitrogen compounds, upon deposition into water bodies, induce eutrophication and threaten the safety of drinking water, thus posing risks to human health [28].
Precipitation has a significant impact on N pollution and concentration in water systems [27], and it also changes total N loading [29]. For example, approximately 10% to 35% of the total nitrogen output from the agricultural basins in the northeastern United States was due to precipitation [30]. The nitrate concentrations in the surface water in Beijing, China, in 2009 and 2010 showed a significant negative correlation (p < 0.05) to the amount of precipitation [31]. Flooding events, in particular, may increase nitrate transport. For example, during the flooding season of 2011, the N-NO3 content in the urban rivers of Chongqing, China, showed a 14–24% increase [32], and the average nitrate concentration in groundwater of the North China Plain increased by three times during the flooding season compared with the non-flooding season in 2012 [33].
N-NO3 pollution is a threat to all human health; however, the threat is even more prominent in vulnerable groups such as children and pregnant women. High concentrations of N-NO3 in drinking water lead to birth defects and induce cancer in infants [34], as well as increase the chances of high hemoglobin cancers, diabetes, thyroid diseases, and spontaneous abortions [35]. In 2017, the World Health Organization (WHO) issued a new specification to adjust an appropriate NO3 concentration of 10 mg L−1 in drinking water [36]. In China, a nitrate concentration of less than 10 mg L−1 in drinking water is considered appropriate, which can be relaxed to 20 mg L−1 in areas with difficult access to drinking water [33]. However, the regional N-NO3 concentrations in China are unfortunately higher than the optimum levels. For example, the average N-NO3 concentration in the groundwater of the middle of the Guanzhong Plain of Shaanxi Province was 29 mg L−1 [37]. The higher N-NO3 concentration in the groundwaters in Hailun District, Heilongjiang Province, was 123 mg L−1 [38,39], and the average N-NO3 concentration in the groundwater in Shandong Province was 26 mg L−1 [15].
Although there are numerous, separate studies on the concentration of nitrate in groundwater and surface water, as well as on their involved mechanisms, few studies have tried to provide a comprehensive dataset on the spatial and temporal changes in nitrate concentrations in soil and water systems, particularly with respect to land-use change, N deposition, and regional water regimes. Through using the published data on the N-NO3 concentrations in water and the changes in soil N content between 2000 and 2020, we have tried to (1) reveal the point and non-point sources of nitrate pollution in groundwater and surface waters; (2) analyze the effects of land use and nitrate nitrogen deposition on the N-NO3 concentrations in GW and SW; and (3) provide feasible management actions for the purpose of avoiding higher nitrogen pollution in water systems.

2. Materials and Methods

2.1. Study Site

The study site is the whole main Chinese water system. Topographically, China’s elevation gradually decreases from west to east (Figure 1a). Based on precipitation trends, May through to October is considered the flooding season, and November through April is the non-flooding season [40]. In this study, China was divided into the Huaihe River Basin (A), Haihe River Basin (B), Songhua and Liaohe River Basins (C), Yellow River Basin (D), Yangtze River Basin (E), Pearl River Basin (F), Southeast Basin (G), Southwest Basin (H), and Continental Basin (I) according to the nine major water systems (Figure 1b) [41].

2.2. Data

The total soil nitrogen content in 1990–2000 and the basic attribute dataset of a high-resolution national soil information grid with a 1 km spatial resolution (2010–2018) were collected from the National Data Centre for Earth System Science (http://www.geodata.cn/ accessed on 18 September 2022). Information on the nitrogen content (g N kg−1 soil), the soil depth (cm), and the bulk density (g cm−3) were collected. The annual changes in the China Land Cover Dataset (CLCD) were produced from Landsat images on the Google Earth Engine at a 30 m spatial resolution from 2000 to 2020 [41].
The point data of the groundwaters and surface waters were retrieved from papers published in the Web of Science and the China National Knowledge Infrastructure (CNKI) (2000–2020) using different keywords, i.e., combinations of “rivers”, “groundwater”, “surface water”, “China”, and “nitrogen”. The N-NO3 (mg L−1) data were retrieved from 3034 published papers. The collected data for this research were based on the following criteria: (a) a clear determination of concentrations, (b) a clear sampling period, and (c) clear latitude and longitude coordinates. In total, 7707 measured N-NO3 data points were available from 2000 to 2020.
The population data in China from 2000 to 2020 were from the LandScan Program (https://landscan.ornl.gov/ accessed on 1 September 2023). The N fertilizer use data in 2000–2018 were obtained from the Nation Ecosystem Science Data Center (http://www.geodata.cn/ accessed on 23 July 2023) at a 5 km spatial resolution.

2.3. Data Analysis and Methodology

2.3.1. Calculating Changes in the Soil Nitrogen Content

The variation in the soil N content in the top 0–30 cm layers (ZN) was calculated by the Equations (1) and (2):
Z N = i i × C o n t e n t i i i
where i is the soil depth, i.e., 5 (0–5 cm), 10 (5–15 cm), and 15 (15–30 cm); and Content is the N content (g kg−1) at depth I;
Δ T N = Z N 2018 Z N 1990
where ΔTN is the change in the soil total N (g kg−1).

2.3.2. Tracing the Point and No-Point Pollution Sources

The increased soil TN in Chinese agricultural fields after years of fertilization was found to be less than 1.5 g N kg−1 [42]. Therefore, when the increased soil TN was higher than 1.5 or less than 0, but the water N-NO3 was higher than 20 (>20 mg L−1), the sampling points were categorized as point pollution. Accordingly, the water data were categorized as point pollutions when the ΔTN ≤ 0 or ΔTN > 1.5 and as non-point pollutions if 0 < ΔTN ≤ 1.5 [42].

2.3.3. Calculation of the Average Population Density and Nitrogen Fertilizer Application over Multiple Years

P e r i = n i n
where P e r i is the average annual population or fertilization, and n is the number of years.

3. Results

3.1. Spatial and Temporal Distribution of Nitrate

3.1.1. Spatial and Temporal Distribution and Variation of Nitrate during Flooding Seasons

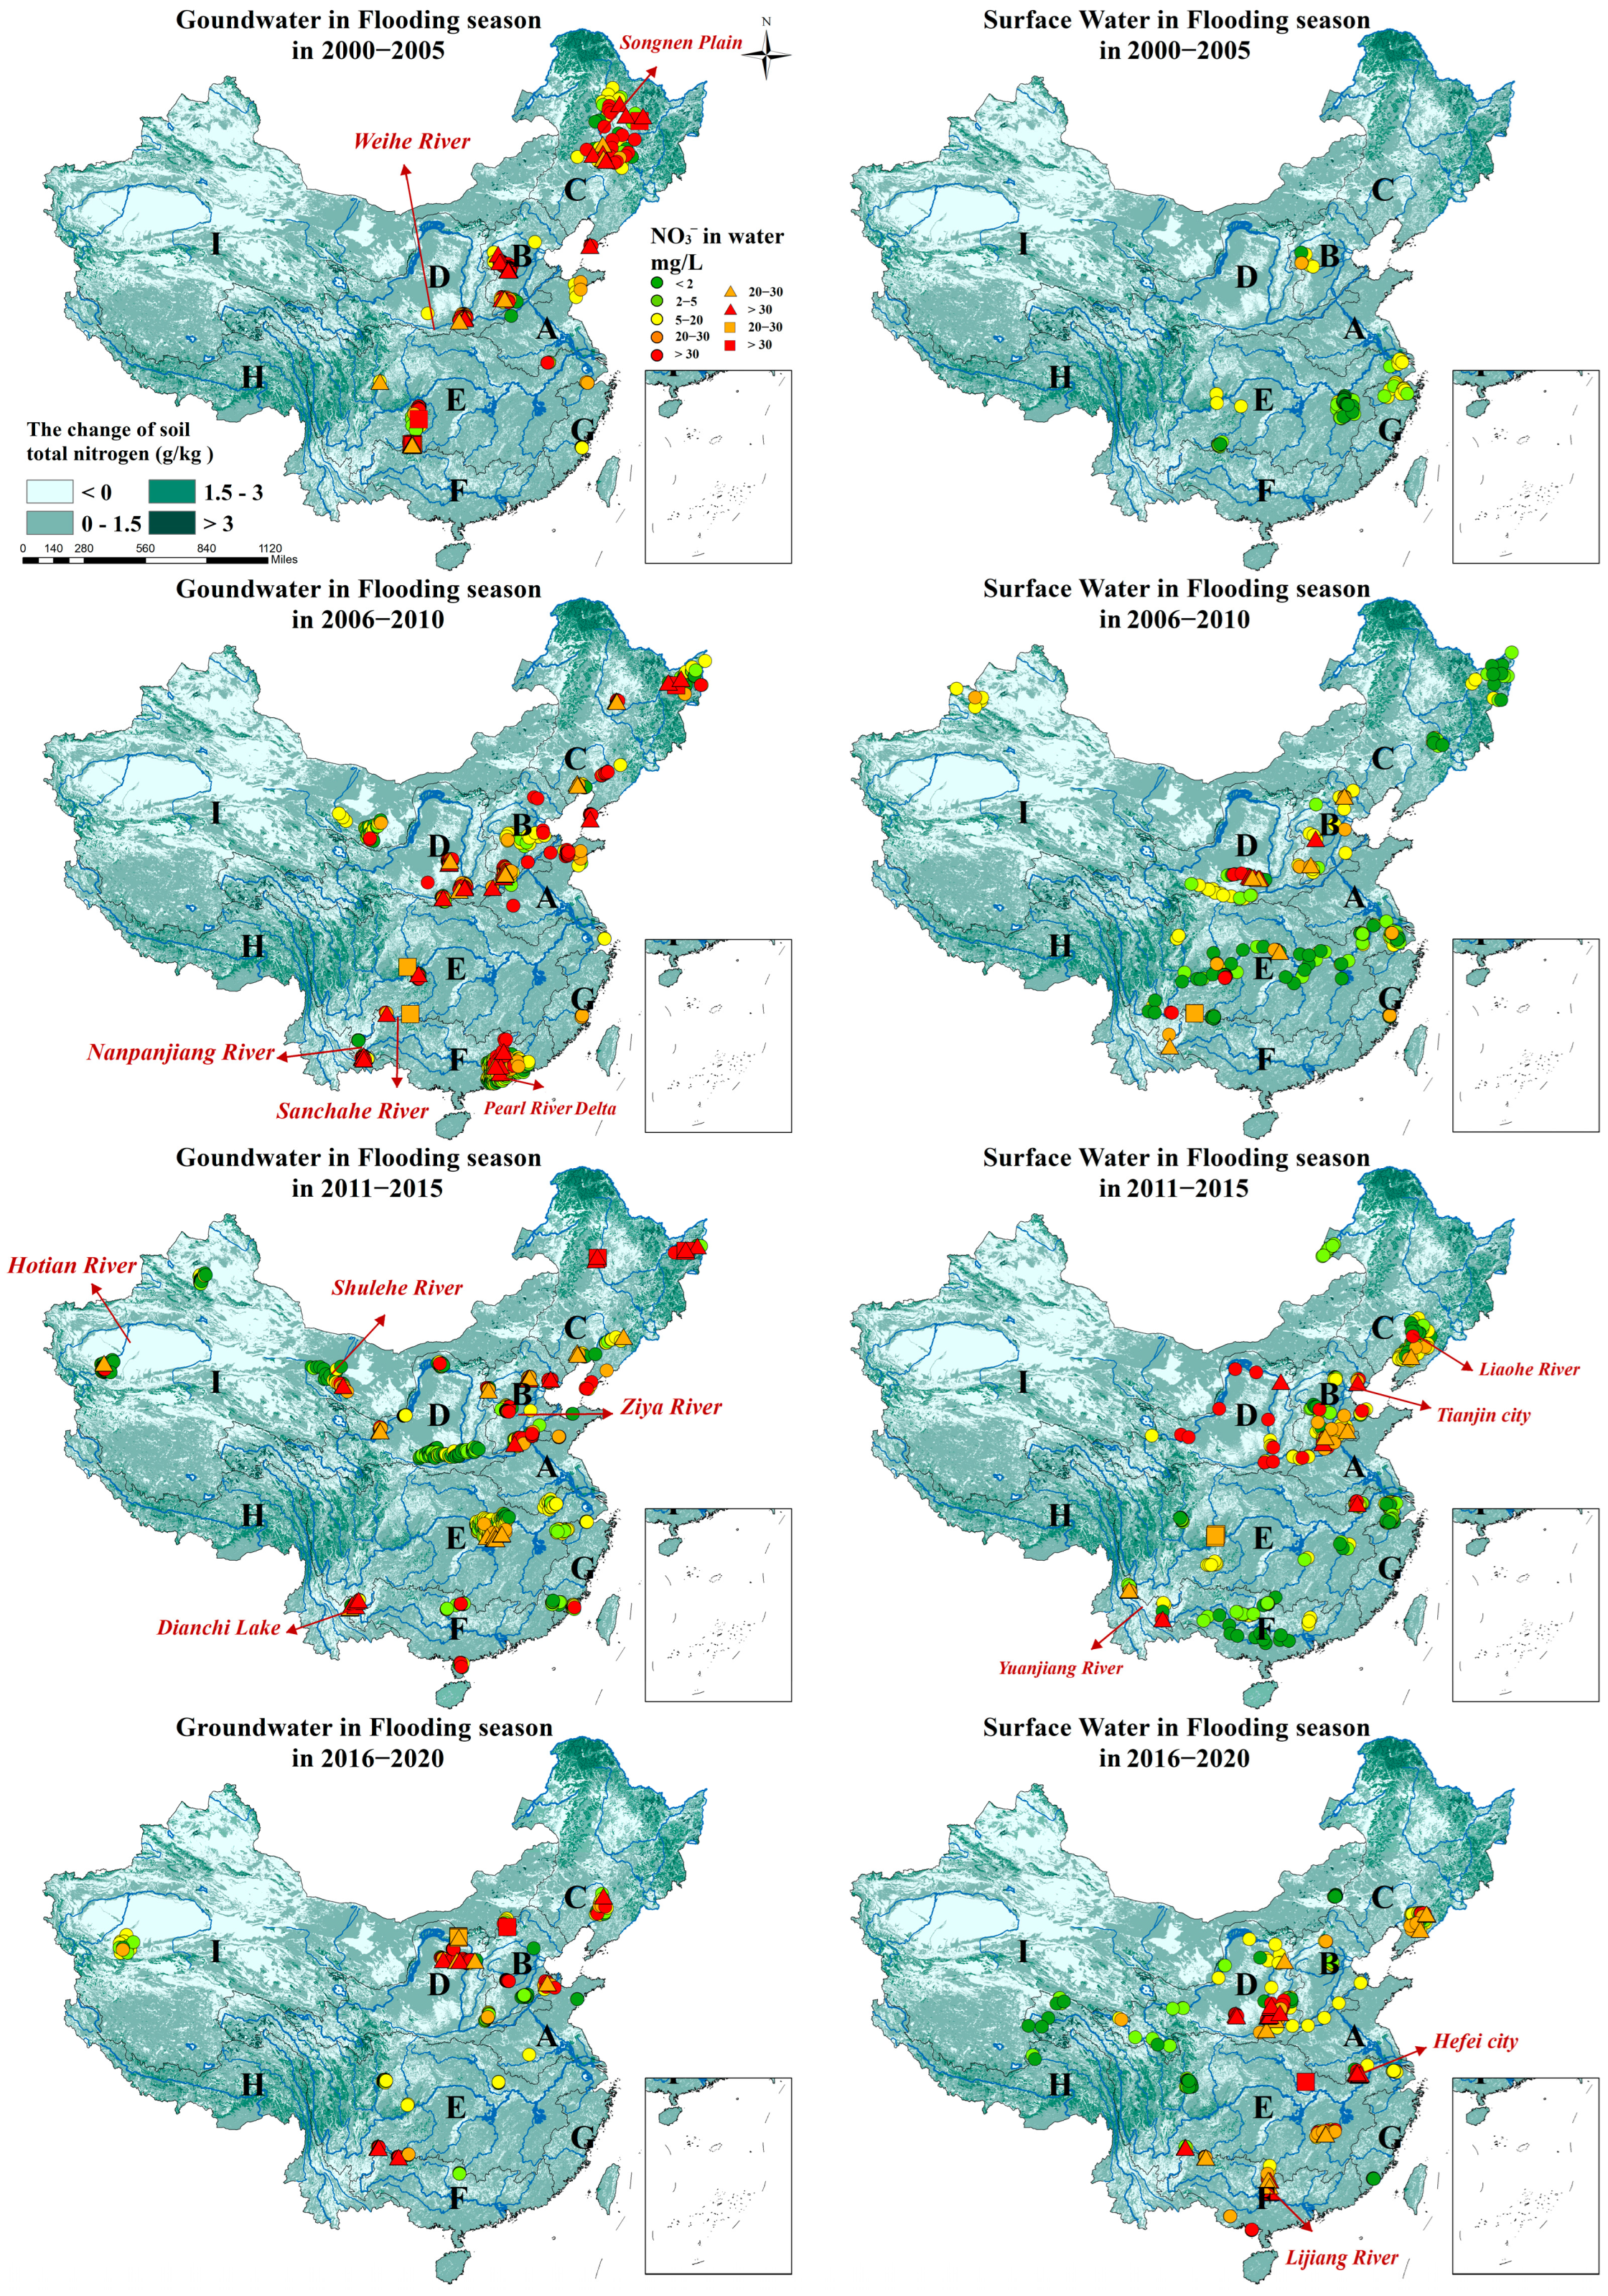
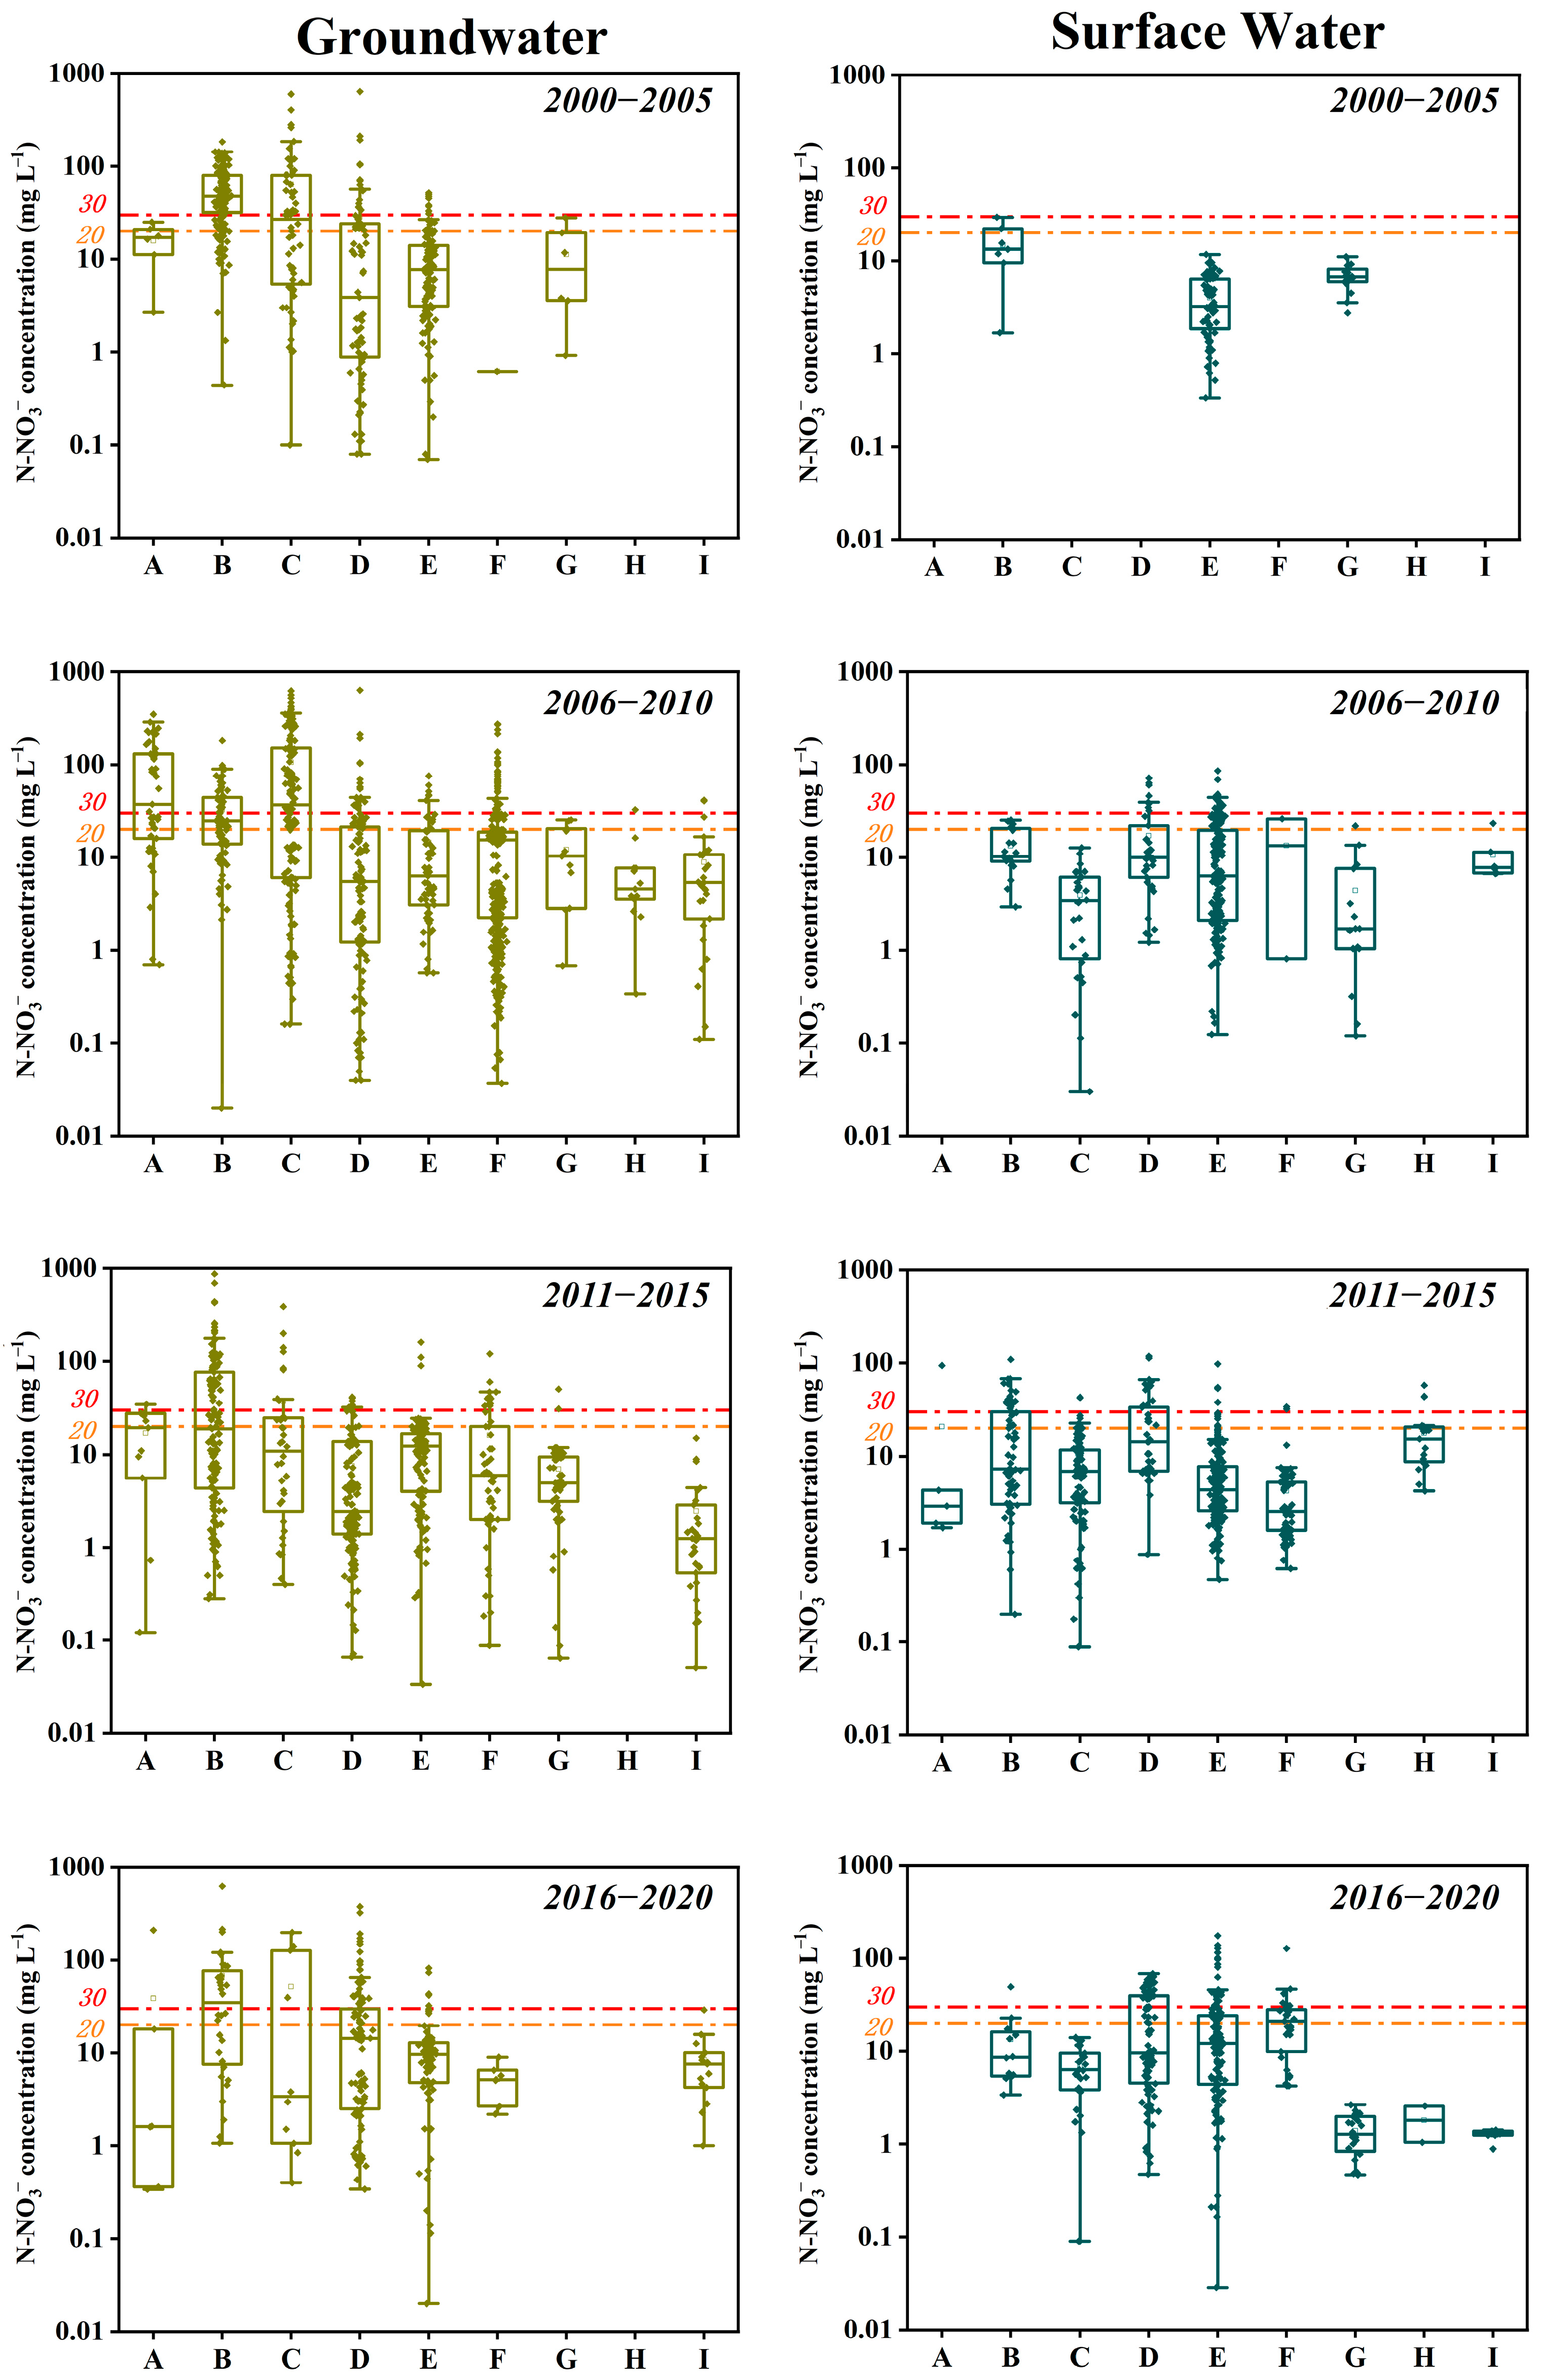
During the flooding seasons of 2006 to 2020, the observed N-NO3 pollution of >20 mg L−1 was mainly distributed in the Huaihe River Basin (A), Haihe River Basin (B), Songhua and Liaohe River Basin (C), Yellow River Basin (D), Yangtze River Basin (E), and Pearl River Basin (F). Furthermore, 13% of the GW sampled sites in Basin C were detected as point pollutions from 2000 to 2020 (Figure 2). Basin C faced severe point pollutions in 2000–2020, where 10% of the N-NO3 point pollution sites of GW and SW especially in the Songnen Plain with 16% of the GW point pollutions (Figure 2) had the highest N-NO3 concentration in GW (624 mg L−1) during the flooding seasons (Figure 3). Basin B had the most severe N-NO3 pollution, where 64% of the GW sampled sites had N-NO3 concentration > 20 mg L−1 and approximately 52% of the sites had severe N-NO3 concentration > 30 mg L−1 (Figure 3). The Basin B area, in particular, experienced the most significant N pollution in 2000–2005, and this was even when 83% of the GW sampled sites had N-NO3 concentration > 20 mg L−1. The N-NO3 concentration in GW was found to be the highest (868 mg L−1) in the Ziya River, which is in the center of the Haihe River Basin (B) in 2011–2015 (Figure 2). There were severe GW point pollutions (25 sampled sites) in the southwestern areas of E and in the upper river water system in the northwestern part of F, such as Dianchi Lake, Sanchahe River, and Nanpanjiang River. Even the remote areas in the northwest of China, 6% of the sampling sites, which were near rivers in the western (Hotan River) and central (Shulehe River) regions of Basin I, had point pollutions in 2011–2015 (Figure 2).
During the flooding seasons, the N-NO3 concentration in surface water (SW) saw the highest concentration at 175 mg L−1 in Heifei city in the Basin E region in 2016–2020 (Figure 3). Basin E experienced increased N-NO3 pollution from 2000 to 2020, where the percentage of point pollution sites increased from 24% (2006–2010) to 32% (2016–2020). Since 2011, in the southwest of the Basin E region, point pollutions was observed in the Sanchahe River, the upstream of the Nanpanjiang River, and the downstream of Basin E. Approximately 11% of the SW sampled sites from 2011 to 2015 experienced point pollutions in Basin B, with the highest-valued data in the central parts, i.e., the Ziya River (109), and the northeastern parts, including Tianjin city and its surroundings (67). The surface water point pollutions increased from 7% (2011–2015) to 23% (2016–2020) in Basin C areas concentrated in the Liaohe River. The SW point pollution was 31% from 2016 to 2020 in the Li River of Basin F, as well as in nine of the sites from 2011 to 2015 in the Basin B region (the southwest of China). There were no SW sampled sites with severe pollution, i.e., the N-NO3 concentration > 30 mg L−1, in the Basin G region between 2000 and 2020 (Figure 2).

3.1.2. Spatial and Temporal Distribution and Variation of the Nitrate during the Non-Flooding Seasons

During the non-flooding seasons from 2011 to 2015, the N-NO3 concentration in the GW was at its highest in the Ziya River at 619 mg L−1, which is at the center of the Haihe River Basin (B) (Figure 4 and Figure 5). Over 38% of the GW sampled sites in Basin B saw N-NO3 pollutions concentrated in the Ziya River (2000–2011), Luan River (2006–2015), and Yongding River (2016–2020). The GW sampled sites for N-NO3 pollution were the most severe in the Huaihe River Basin (A), where 68% of the sampled sites had N-NO3 concentration > 20 mg L−1, and 52% saw N-NO3 concentration > 30 mg L−1 (Figure 5). The majority of the GW N-NO3 pollution was concentrated in Shandong Peninsula, which is located in the northeast of Basin A, during 2000–2005 and 2011–2020; however, in 2006–2010, the majority of the GW N-NO3 pollution was concentrated in the Northern China Plain, which is west of Basin A. The point pollutions were approximately 17% in the sampled sites in Basin C, and these sited were concentrated in the northern (Songhua River) parts in 2006–2010 and the central (Songnen Plain) parts in 2016–2020. The N-NO3 point pollutions in Basin E (mostly in the eastern and the southwestern parts) and in Basin F were approximately 50% and 41%, respectively, from 2000 to 2020 (Figure 4).
During the non-flooding seasons, the N-NO3 concentration in the SW had the highest value near Beijing city in Basin B from 2011 to 2015 (306 mg L−1) (Figure 4 and Figure 5). The SW N-NO3 pollutions increased from 4% (2006–2010) to 40% (2016–2020) in Basin B. The SW N-NO3 pollution was 14% near the Liaohe River of Basin C from 2011 to 2020, where 12% of the sample sites were found to have been affected by point pollutions from 2016 to 2020. In Basin D, 37% of the SW sampled sites showed N-NO3 pollution, of which 27% represented severe pollutions (N-NO3 > 30 mg L−1). However, the average N-NO3 concentration in the SW was improved in the Weihe River of Basin D, which reduced, on average, from 23 mg L−1 (2011–2015) to 17 mg L−1 (2016–2020) (Figure 4 and Figure 5); however, the average N-NO3 concentration in the GW did not change much (i.e., a decrease from 35 to 34 mg L−1 between 2011–2015 and 2016–2020). Conversely, the SW N-NO3 pollutions were found to be deteriorating in the middle and lower regions of Basin E; there, the N-NO3 pollutions increased from 5% in 2000–2005 to 21% in 2016–2020, where 12% of the sampling sites had severe N-NO3 pollution (N-NO3 > 30 mg L−1). In Basin E, the SW point pollutions were over 30% in the sampled sites from 2000 to 2020, and this was mainly observed near the cities in the main stem of the Yangtze River. The SW pollution was concentrated in the Li River of Basin F from 2016 to 2020, where the point pollution was 26%.

3.2. The Land-Use Change and Nitrate Nitrogen Deposition on Nitrogen Pollution in Chinese Water Systems

3.2.1. The Land-Use Change and Urbanization from 2000 to 2020

The percentage of cropland decreased by 5.8%, 4.7%, and 1.5% in Basins A, B, and E, respectively (Figure 6), but the percentage of urban land increased by 5.5%, 4.5%, and 1.3% from 2000 to 2020. The urban land increased by 1.2%, 1.3%, and 2.8% in Basins C, F, and G from 2000 to 2020. Basin A had the highest percentage of cropland area (77.7%) among the nine basins in 2000, where the cropland decreased the most by 5.8%; however, the urban land increased the most by 5.5% from 2000 to 2020 (Figure 6). Basin D saw a decreased percentage of cropland area (–2.4%) with an increase of urban land (+1.3%). Basin H showed the smallest percentage of cropland (4%) in 2011, which increased by 0.7% from 2011 to 2020 (Figure 7). The percentage of urban land increased by more than three times in Basins H (0.02–0.06%) and I (0.06–0.23%) from 2000 to 2020.
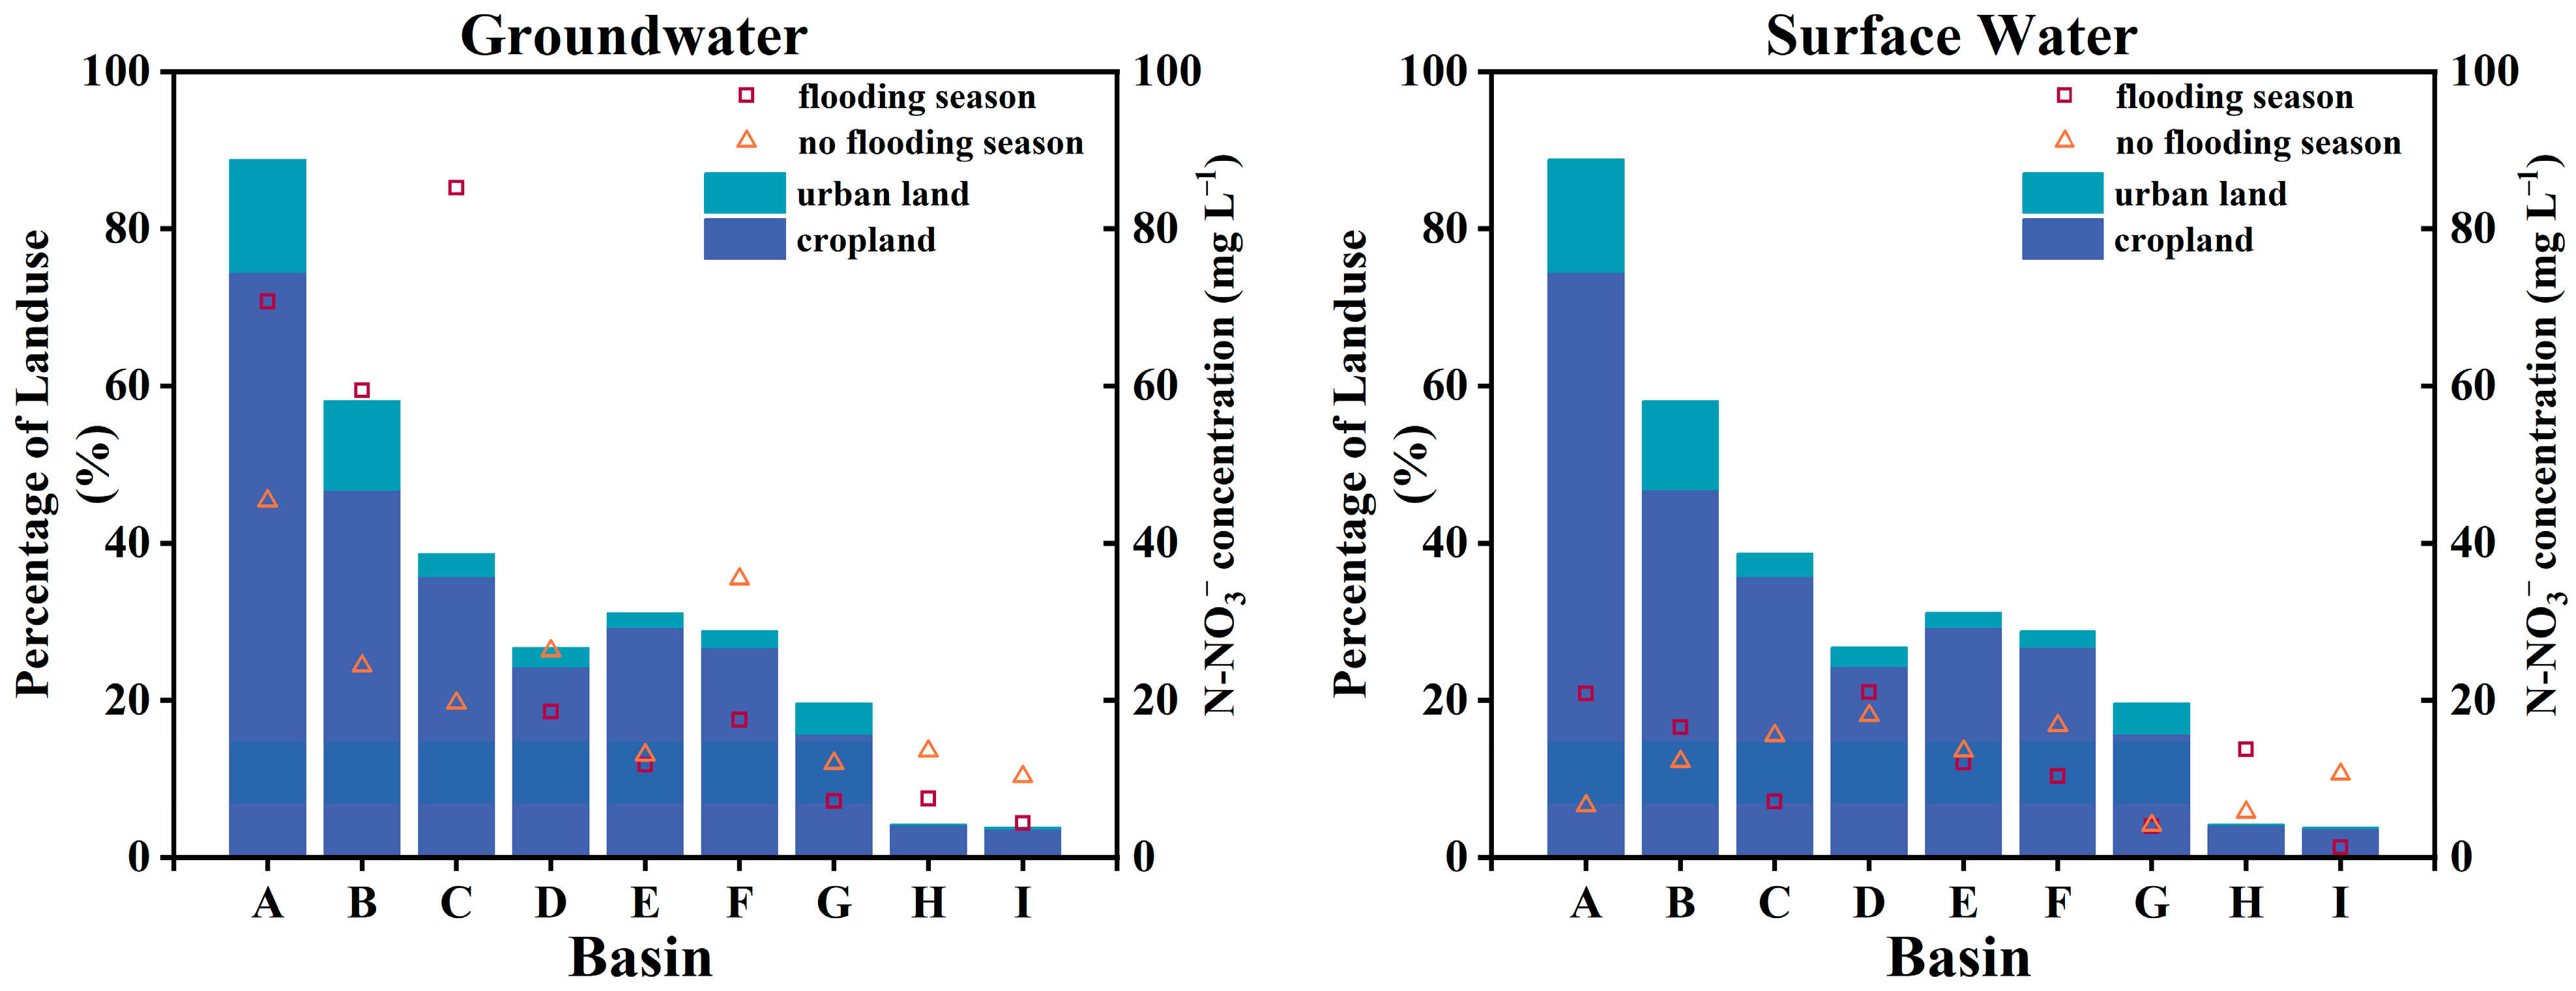
The concentrations of nitrate nitrogen (N-NO3) in the groundwater (GW) in Basins A and B during the flooding season were 25 mg L−1 and 35 mg L−1 higher than that during the non-flooding season, respectively (Figure 8). In the surface water (SW), the concentration of N-NO3 was 14 and 4 mg L−1 higher during the flooding season compared with the non-flooding season (Figure 8). The concentration of N-NO3 in the GW in Basin C increased the most during the flooding season, i.e., it was 65 mg L−1 higher than in the non-flooding season (Figure 8). In other basins, the N-NO3 concentration in the GW during the flooding season was lower than that during the non-flooding season from 2000 to 2020. In this research, the N-NO3 concentrations in the SW during the flooding season was higher than that during the non-flooding season in Basins A, B, C, and H, with increases of 14.3, 4.5, 3.4, and 10.3 mg L−1, respectively (Figure 8). The research revealed a correlation (p < 0.05) between the concentration of N-NO3 in the GW and the proportion of cropland and urban land (R = 0.8). When linear fitting was performed on the percentage of SW to cropland and urban land (excluding Basins C and E, which demonstrated evident point pollution), it was found that the concentration of N-NO3 in the SW in the remaining basins was correlated with the ratio of cropland and urban land (p < 0.05), wherein they yield a correlation coefficient of R = 0.75 (Figure 9).

3.2.2. Population Density and Agricultural Nitrogen Application

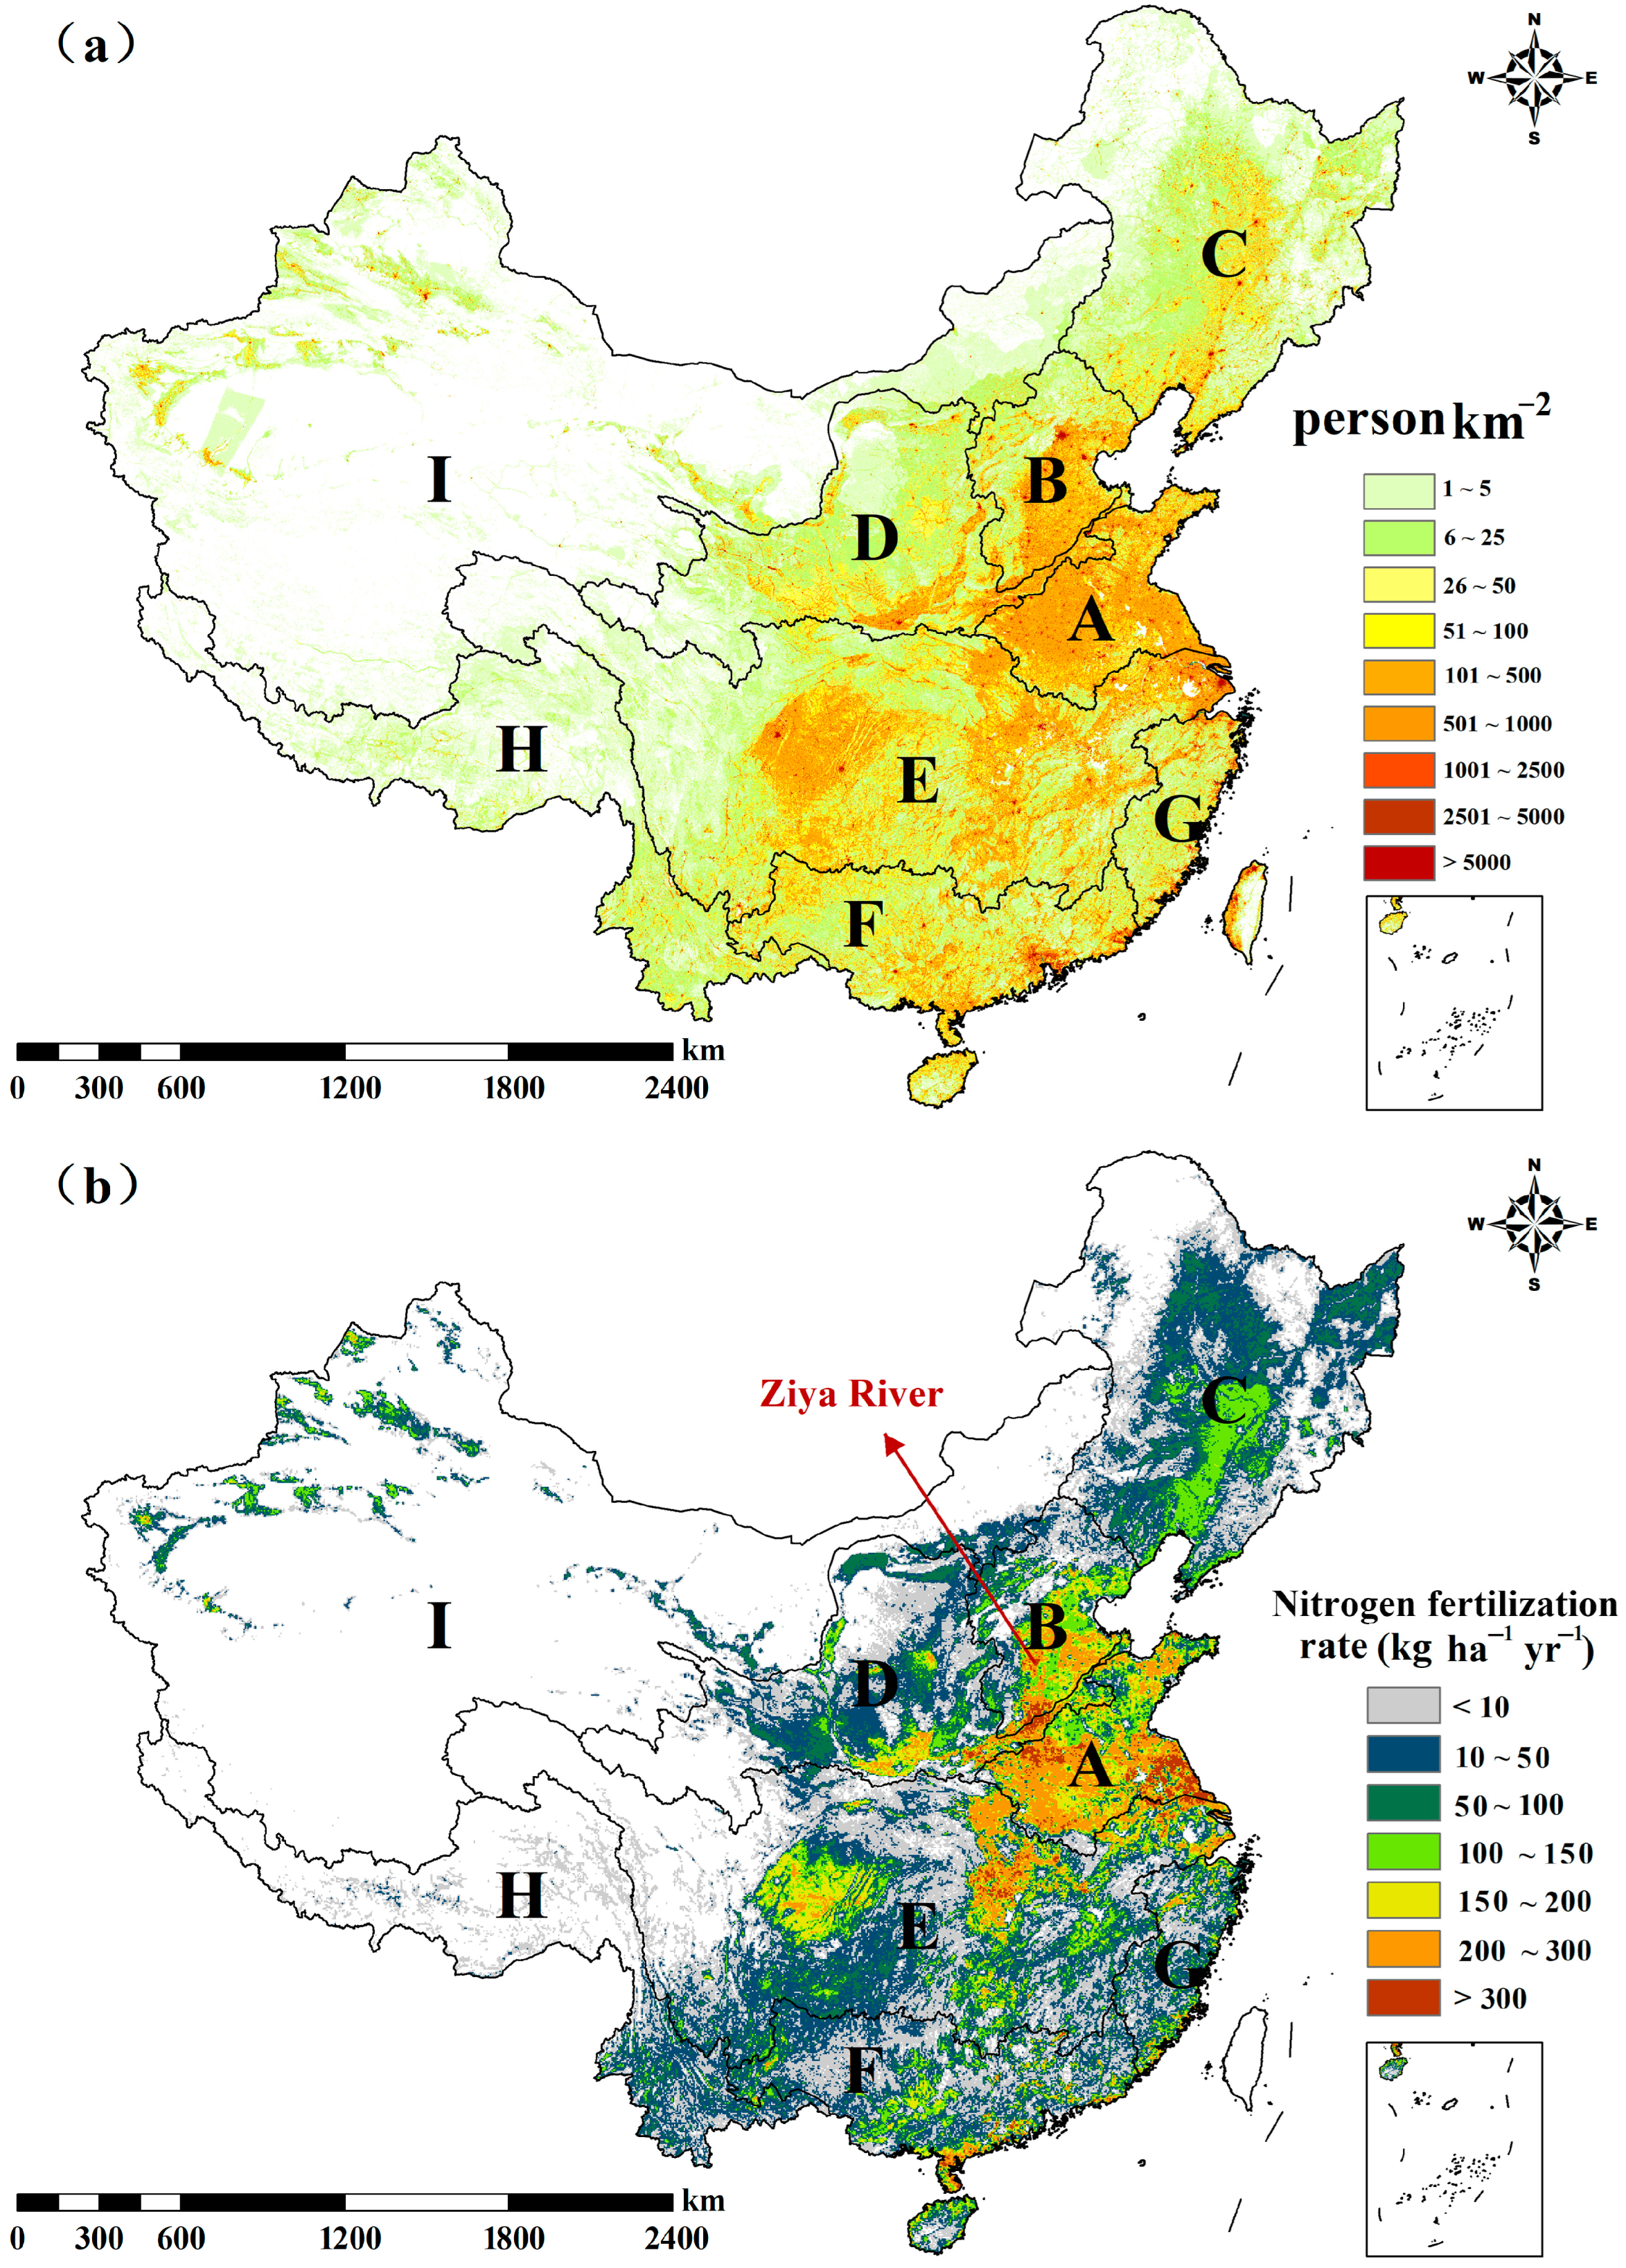
The highest average population aggregation (436 persons km−2) and the highest average N fertilizer use (175 kg ha−1 yr−1) was found in the Huaihe River Basin (A) (Table 1). However, China’s more densely populated areas are concentrated in the middle and lower reaches of the Haihe River Basin, including the Ziya River (>288 persons km−2), the downstream areas of the Yellow River Basin, its central areas such as the Weihe River (>106 persons km−2), the middle and lower reaches of the Yangtze River Basin, the upstream Sichuan and Chongqing areas (>185 persons km−2), the Pearl River Delta region (>240 persons km−2), and the Southeast Basin (>276 persons km−2) (Figure 10a,b). However, the nitrogen fertilization rate in the Yangtze River Basin (43.5 kg ha−1 yr−1), the Pearl River Basin (44.1 kg ha−1 yr−1), and the Southeast Basin (45.3 kg ha−1 yr−1), which are not predominantly agricultural areas, were on average low (Table 1).

3.2.3. N-NO3 Dry and Wet Deposition from 2006 to 2015

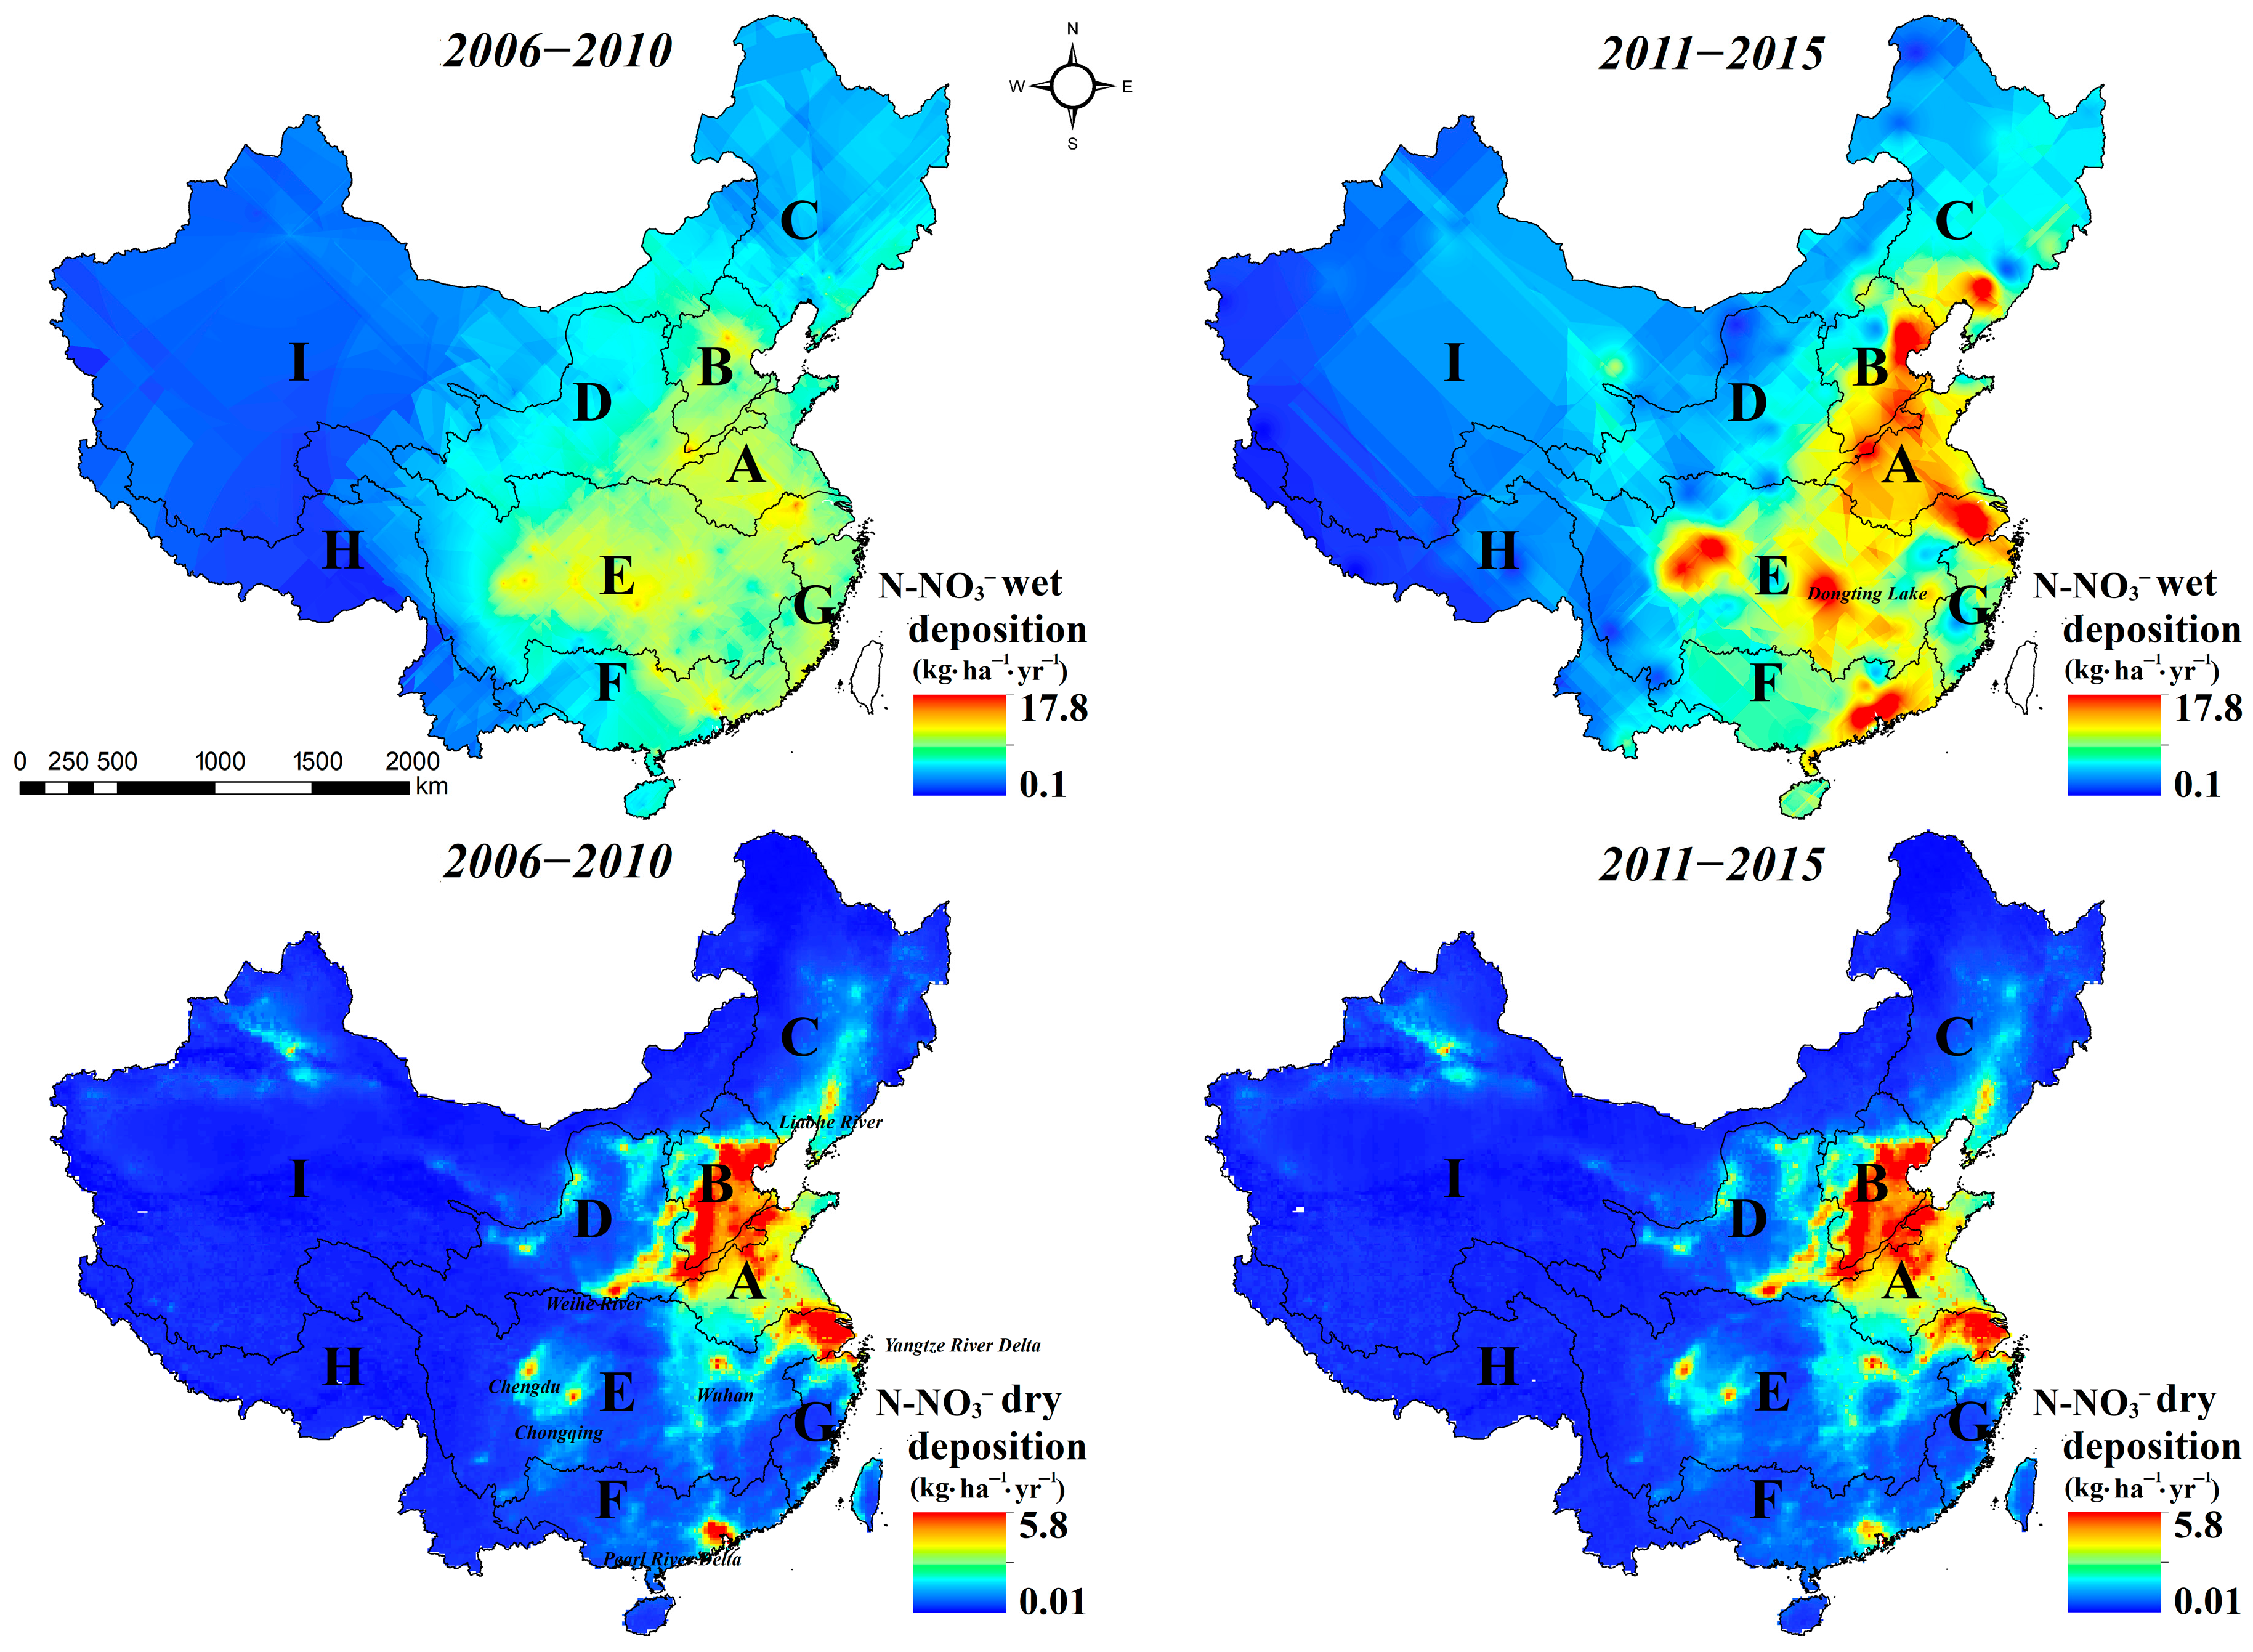
The main N-NO3 deposition was wet deposition (0.1–17.8 kg ha−1) from 2006 to 2015, and it was more than three time higher than the dry deposition (0.01–5.8 kg ha−1) (Figure 11). The change in the N-NO3 wet deposition was much more pronounced during the period of 2006–2010 (0.3–14.6 kg ha−1) to 2011–2015 (0.1–17.8 kg ha−1), when the more serious deposition sites appeared in Basins A, B, C, E, and F. The highest deposition (kg ha−1 yr−1) and the highest increasing trend in N-NO3 wet deposition (+kg ha−1 yr−1) were concentrated in Basin A (13.4, +4.6), B (16.5, +3.0), the middle and lower reaches of the Yangtze River of Basin E (17.8, +4.9), the south of Basin C (16.4, +7.9), and the Pearl River Delta of Basin F (17.4, +2.7) from 2006–2010 to 2011–2015. These areas also had the highest N-NO3 dry deposition (Figure 11). The N-NO3 dry deposition stayed relatively constant from 2006–2010 (0.01–5.8 kg ha−1) to 2011–2015 (0.01–5.5 kg ha−1). The N-NO3 dry deposition in the Pearl River Delta (F) appeared to decrease (–0.9 kg ha−1 yr−1) during 2006–2010 to 2011–2015.

4. Discussion

4.1. The Nitrate Pollution Sources in the Nine Water Basins

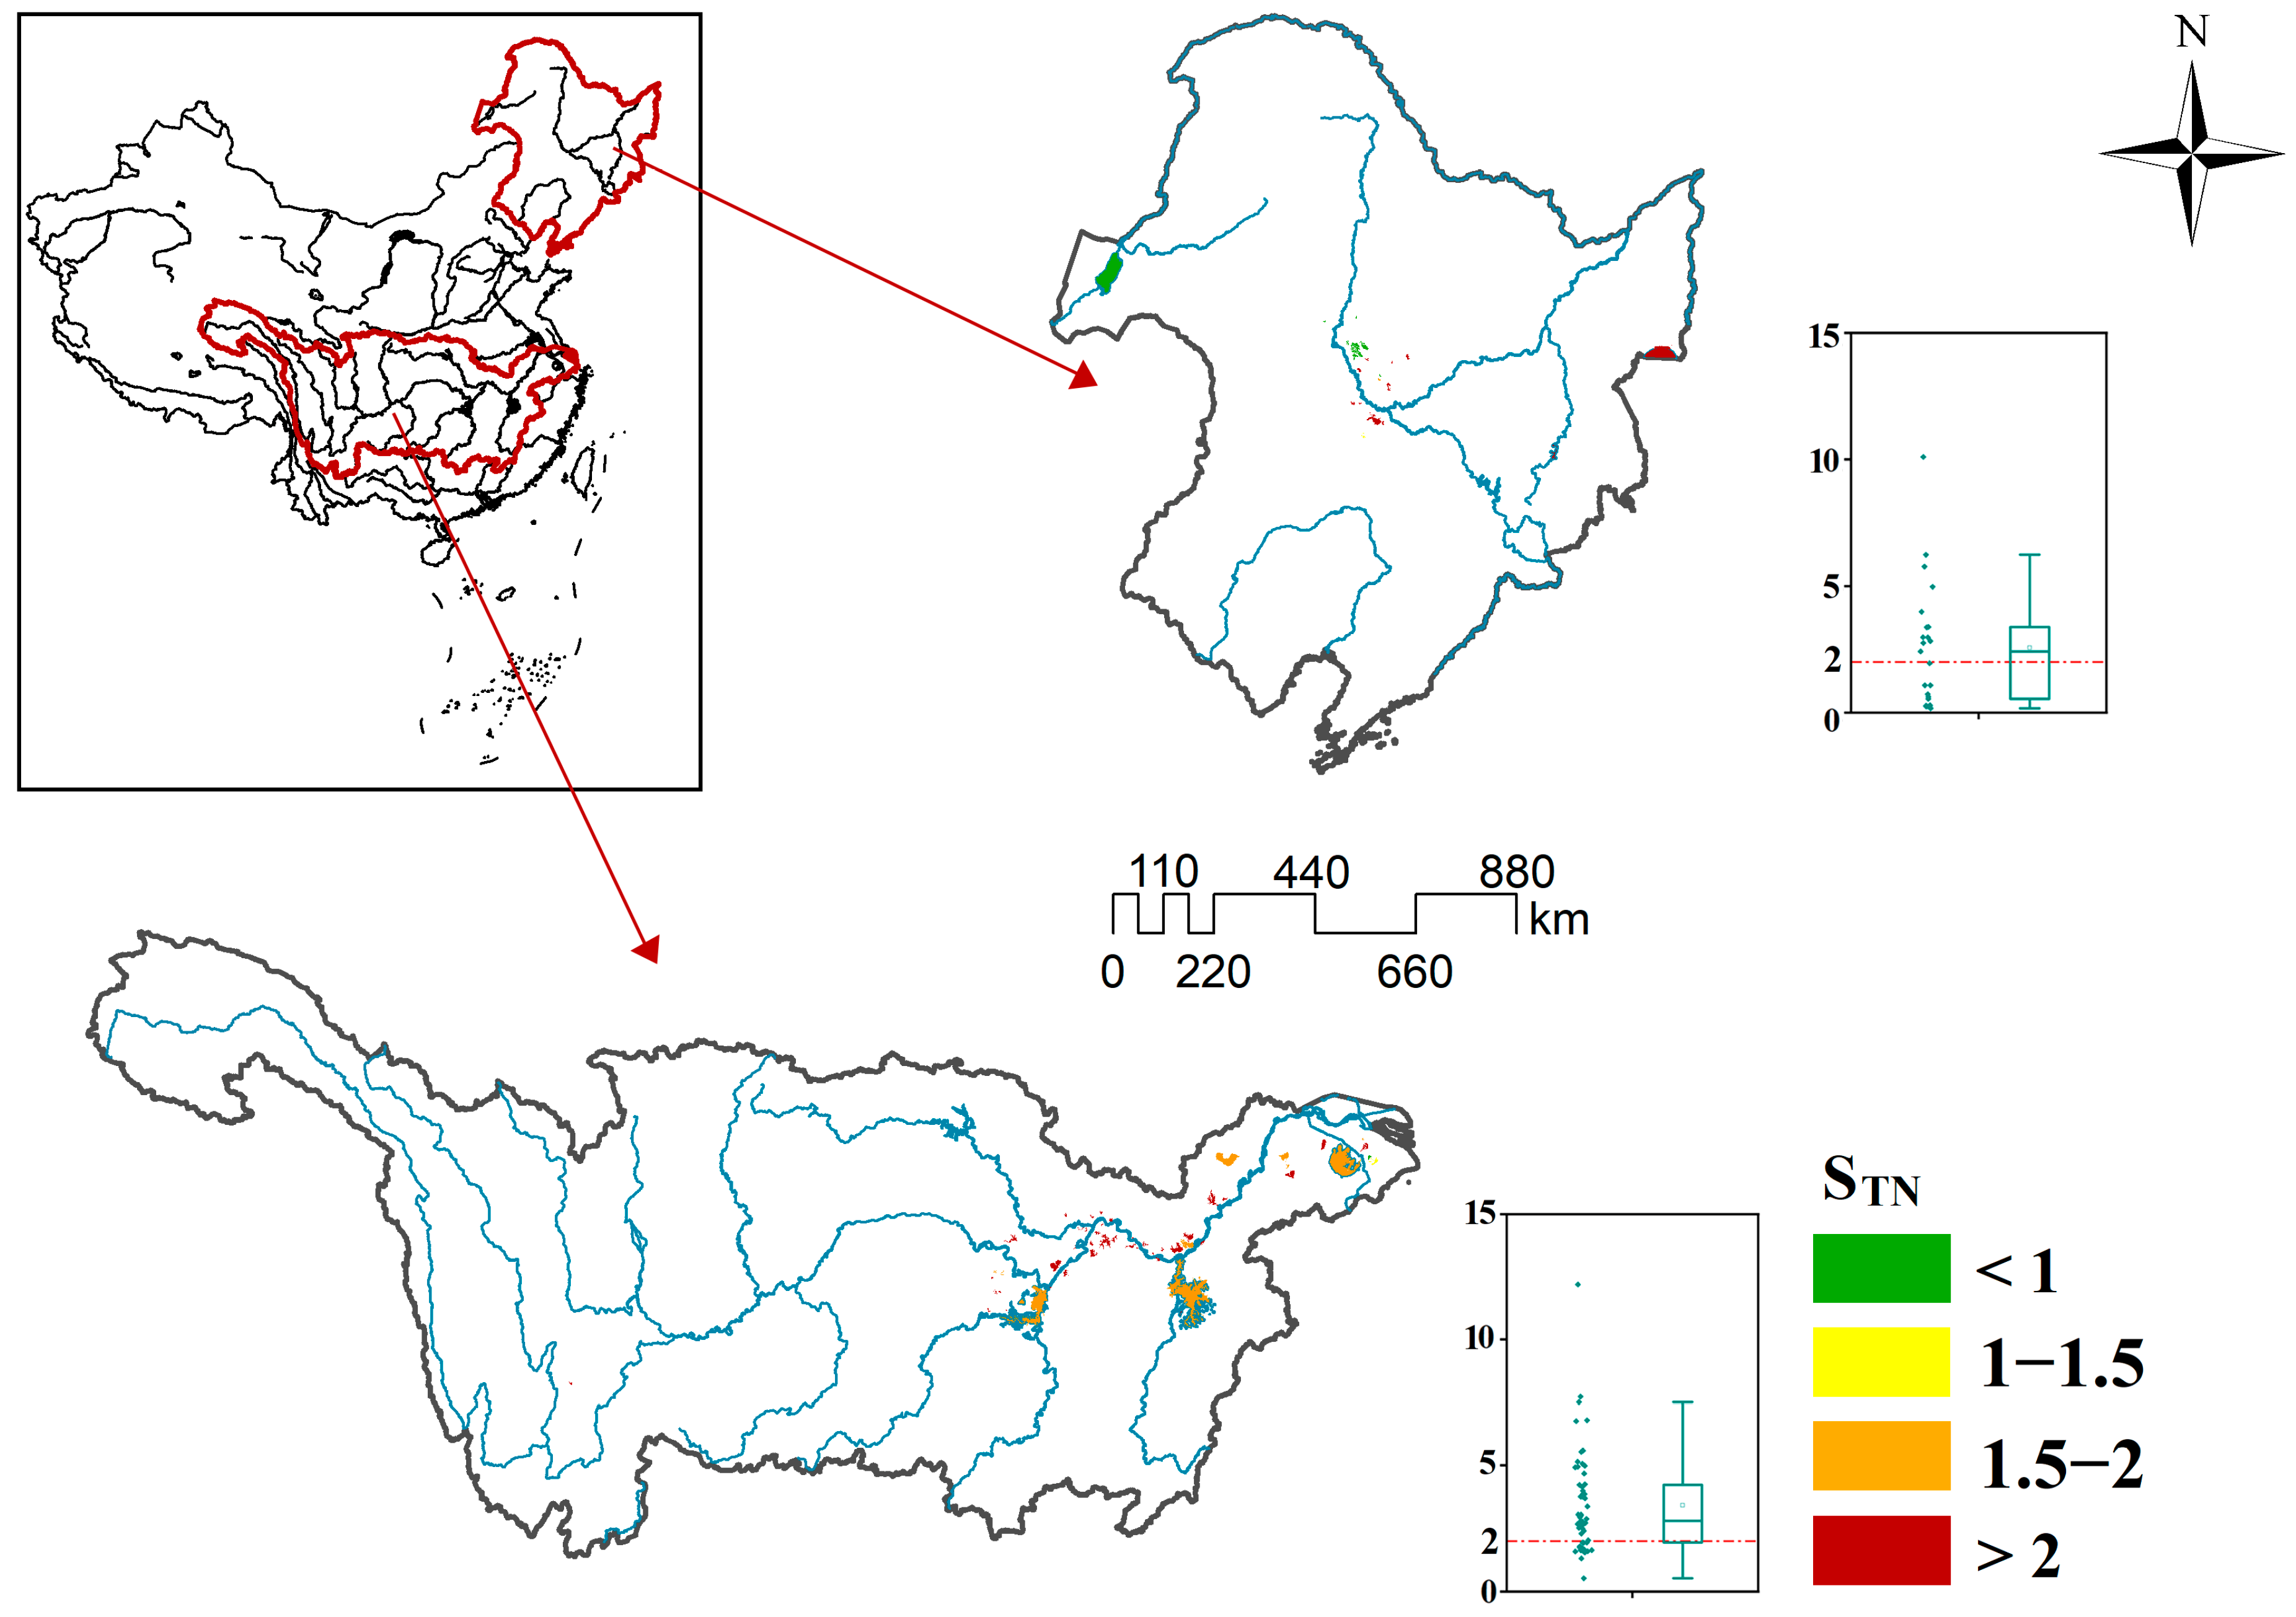
The studied N-NO3 pollution in the water systems included the main non-point pollutions (e.g., A and B) and point pollutions (e.g., C and the southwest of China) (Figure 2 and Figure 4). Basin B had the most severe N-NO3 pollution in the GW and SW among the nine basins from 2000 to 2020 and also the highest proportion of pollution (40% N-NO3 pollution), where the highest N-NO3 concentration in the GW was 868 mg L−1 in the flooding seasons and 306 mg L−1 in the SW in the non-flooding seasons (Figure 2 and Figure 4). Basin B had had the highest nitrate pollution among the other basins mainly because of its urban land cover [45], which increased from 9% to 13% in 2000–2020 and was accompanied by the highest increase in N-NO3 wet deposition (+3 kg ha−1 yr−1) (Figure 9) and a high population density (288 persons km−2) (Table 1). In particularly, the Ziya River in the central part of Basin B featured extensive cropland cover (Figure 6), which is also where the highest nitrogen fertilizer usage took place (320 kg km−2 yr−1) (Figure 10b). Basin A had the most severe non-point nitrogen pollution because more than 80% of the region was utilized for urban areas and croplands in 2000. The nitrogen pollution in the water systems made it extremely easy for lake sediment deposits. Thus, the lake sediment pollution index of TN (STN), which is affected by the amount of urban land, was 60% higher than that in the unaffected regions [46]. However, in the middle and lower reaches of the Songhua River, the STN values ranged from 0.2 to 10.1 (Figure 12) with a high N-NO3 concentration in the GW; this region also contained a lower degree of population (59 persons km−2) and a lower average N fertilization rate (26 kg km−2 yr−1) (Figure 10a,b; Table 1). These conditions suggest that the industry and urban areas in the region greatly contributed to the point pollution in Basin C, especially during the time the government relocated the polluting industries to the southern parts of Basin C [47]. Therefore, the percentage of SW N-NO3 pollution (>20 mg L−1) in the Liaohe River of Basin C exhibited a severe increasing trend of 9% in 2011–2015 to 24% in 2016–2020 (Figure 3). The urban land in the Yangtze River Basin had a huge impact on the pollution of the water system; the concentration of urban areas and dense population (Figure 6 and Figure 10) were the main reasons for the continuous rise of surface water from 2000 to 2020. Specifically, the lake sediment pollution index of TN (STN) in the downstream regions of Basin E was higher than Basin C, which had STN values ranging from 0.5 to 12.2 (Figure 12). The N-NO3 pollution of the GW and SW became worse in Basins C and E from 2000 to 2020; however, they were mitigated in the Weihe River of Basin D (Figure 2 and Figure 4). The improved N-NO3 pollution in the SW in the Weihe River of Basin D during the non-flooding season was in contrast to the polluted GW (Figure 4), which implied a potentially higher point pollution. The mitigation of point pollution in the Weihe River was attributed to the governmental policies that were implemented along the Weihe River from 2008, including the shutting down of highly polluting factories and the implementation of environmental protection projects (e.g., beach remediation, river dredging, ecological restoration, and wetland construction) [48].

4.2. The Risk of Nitrate Pollution in the Groundwater and Surface Water during the Flooding and Non-Flooding Seasons

Precipitation greatly increased the water N-NO3 concentration because of the dilution that occurs during the flooding season [27]. In Basins A and B, which have high urban land and cropland areas, increased precipitation increased the N-NO3 concentrations in the groundwater (+25 mg L−1; +35 mg L−1) and surface water (+14 mg L−1; +4 mg L−1). The highest GW N-NO3 concentrations increased by 65 mg L−1 in the point pollution of Basin C during the flooding season in comparison with the non-flooding season. Therefore, in the heavily polluted areas, the increased precipitation made the GW N-NO3 pollution worse. This was also demonstrated in other regions because of the intensified land use of urban land and croplands. For example, the GW N-NO3 concentration in the UK increased by 30% from 1976 to 2006, which peaked after precipitation [50]; in addition, GW N-NO3 concentrations also increased in South Korea by up to 22% after precipitation [51]. In these examples, the large areas of urban land, high levels of fertilizer application, and severe urban and industrial pollution were understood as major factors [52]. In addition to these major factors, however, the development of tourism, particularly in Erhai Lake in Basin H, drove land-use changes, thereby resulting in a decreased soil conservation rate and an increased SW nitrogen rate [53]. Therefore, the SW N-NO3 concentration was 8 mg L−1 higher during the flooding season than in the non-flooding season in Basin H (Figure 2 and Figure 4), and these particular regions were predominantly concentrated in Erhai Lake [54].
The groundwater nitrogen pollution in China was found to be positively correlated with the proportion of land use (specifically cropland and urban land) (r = 0.8). The pollution in surface water was also found to be correlated in areas where non-point pollution was not the main source, except in Basin C and E (r = 0.75) (Figure 9). Non-point pollution has a lag effect [55], and the N retention capacity of groundwater is prominent [56]. Therefore, compared with surface water with its stronger mobility, the groundwater was more severely affected by anthropogenic nitrogen input.

4.3. Water Quality and Pollution Control Strategies

The N-NO3 pollution in China water system originates from human activities mainly because of distribution of cropland and urban land (Figure 9) [57]. A (88%) and B (58%) with highest cropland and urban land areas have the worse N-NO3 concentrations in GW than in SW, where the percentage of GW N-NO3 pollution is higher than SW. Excessive N fertilization increases soil N content [58] due to stimulated nitrification [59], which consequently exacerbates the concentration of N-NO3 in surrounding water systems, and it is not only China but also the United States and India that are facing the environmental problems caused by massive fertilizer application [7,60]. Therefore, it is necessary to reduce the amount of N fertilization [61] by adopting reasonable field management practices, such as increasing the use of organic fertilizers, e.g., manure and returning straw [62], as well as incorporating biochar [63] and implementing reduced and precision fertilization [64], especially in Basins A, B, and C.
In densely populated urban land areas, such as fast urbanization areas, N-NO3 pollution originates from the discharges of industrial pollutants and home sewage [65]. This occurred in Basins A and B, the middle and lower reaches of Basins C and E, and the Pear River Delta of Basin F, as well as in southwestern China (Figure 2 and Figure 4). Therefore, it is imperative to manage industrial wastewater and improve standards in the flooding and non-flooding seasons, which should include optimizing urban layouts such as the relocation of industrial areas away from the city, as well as the establishment of wooden shelterbelts [66] and NOx emission indicators [67]. The results of such proper management strategies can be seen, for example, in Basin G. Despite the fast urbanization in Basin G (which has seen the area of urban land during 2000 to 2020 doubled from 2.5% to 5.2% and where the population density (288 persons km−2) is among the highest in China), the GW and SW N-NO3 concentration rates have remained constant and have shown a less significant degree of N-NO3 pollution. This appears to be mainly because of the relatively higher percentage of forests and grasslands in Basin G (75%), which also provide a good example for the control of N-NO3 pollution. These findings are consistent with the management plans utilized in the United States, where net nitrogen input is more easily retained, such as in the case of the Mississippi River basin, which has reached an 80% [60] net nitrogen iuput. From 2000 to 2020, the nitrogen fertilizer application rate in India increased from 13% worldwide to 18% [7], and this type of management should be followed even more in regions where nitrogen fertilizer usage is increasing.

5. Conclusions

The rapid agriculture and economic development in China has led to the accumulation of a substantial amount of nitrogen in groundwater (GW) and surface water (SW). Based on 7707 published studies on the N-NO3 concentration of surface and groundwater during the flooding and non-flooding season from 2000 to 2020 in China, we found that non-point pollution was concentrated in the Huaihe River Basin (A) and Haihe River Basin (B), and that point pollution was concentrated in the Songhua and Liaohe River Basin (C). Basin B saw the most severe N-NO3 pollution in more than 40% of the GW and SW studied sites. The N-NO3 concentrations in Basin B were even as high as 868 mg L−1 in the GW during the flooding seasons and as high as 306 mg L−1 in the SW during the non-flooding seasons. Industrial emissions have the most significant impact on N-NO3 wet deposition at +7.9 kg N ha−1 yr−1 in Basin C, which lead to the highest increase in the GW N-NO3 during the flooding season (+66 mg L−1). In contrast, the high forest and grassland coverage (75%) in the Southeast Basin caused a small change in N-NO3 wet deposition (+1 kg ha−1 yr−1), even when subjected to intensive urbanization (+2.8%). Facing serious water N-NO3 pollution necessitates taking on stricter criteria for the management of sewage discharge, nitrogen fertilizer application, and control of the industrial emissions of ammonia and nitrous oxides.

Author Contributions

X.Z.: Funding acquisition, Writing—Review and Editing, Conceptualization, Resources, Supervision. J.S.: Formal analysis, Software, Writing—Original Draft, Visualization. L.X.: Funding acquisition, Writing—Review and Editing. W.L.: Formal analysis, Validation. K.Z.: Writing—Review and Editing. J.H.: Writing—Review and Editing. S.C.: Funding acquisition, Writing—Review and Editing. All authors have read and agreed to the published version of the manuscript.

Funding

This research was funded by the National Natural Science Foundation of China [grant number 42150410386]; the Xinjiang Tianchi Specially Appointed Professor Project; Jiangsu Provincial Science and Technology Innovation Special Fund Project of Carbon Emission Peak and Carbon Neutralization (frontier and basis) [Grant Number BK20220016]; and the National Natural Science Foundation of China [grant number 32060433, 42161144003].

Data Availability Statement

Data is contained within the article.

Conflicts of Interest

The authors declare that there are no known conflicts of interest that could affect this manuscript.

References

  1. Harding, J.S.; Benfield, E.F.; Bolstad, P.V.; Helfman, G.S.; Jones, E.B., 3rd. Stream biodiversity: The ghost of land use past. Proc. Natl. Acad. Sci. USA 1998, 95, 14843–14847. [Google Scholar] [CrossRef] [PubMed]
  2. Turunen, J.; Markkula, J.; Rajakallio, M.; Aroviita, J. Riparian forests mitigate harmful ecological effects of agricultural diffuse pollution in medium-sized streams. Sci. Total Environ. 2019, 649, 495–503. [Google Scholar] [CrossRef] [PubMed]
  3. Kou, X.Y.; Ding, J.J.; Li, Y.Z.; Li, Q.Z.; Mao, L.L.; Xu, C.Y.; Zheng, Q.; Zhuang, S. Tracing nitrate sources in the groundwater of an intensive agricultural region. Agric. Water Manag. 2021, 250, 106826. [Google Scholar] [CrossRef]
  4. Xue, D.M.; De Baets, B.; Van Cleemput, O.; Hennessy, C.; Berglund, M.; Boeckx, P. Use of a Bayesian isotope mixing model to estimate proportional contributions of multiple nitrate sources in surface water. Environ. Pollut. 2012, 161, 43–49. [Google Scholar] [CrossRef] [PubMed]
  5. Li, X.D.; Masuda, H.; Koba, K.; Zeng, H.A. Nitrogen isotope study on nitrate-contaminated groundwater in the Sichuan Basin, China. Water Air Soil Pollut. 2007, 178, 145–156. [Google Scholar] [CrossRef]
  6. Yuan, D.; Hu, Y.; Jia, S.N.; Li, W.W.; Zamanian, K.; Han, J.A.; Huang, F.; Zhao, X.N. Microbial Properties Depending on Fertilization Regime in Agricultural Soils with Different Texture and Climate Conditions: A Meta-Analysis. Agronomy 2023, 13, 764. [Google Scholar] [CrossRef]
  7. FAO. World Food and Agriculture—Statistical Yearbook 2022. In Food and Agriculture Organization of the United Nations FAO; FAO: Rome, Italy, 2022. [Google Scholar] [CrossRef]
  8. Cui, S.H.; Shi, Y.L.; Groffman, P.M.; Schlesinger, W.H.; Zhu, Y.G. Centennial-scale analysis of the creation and fate of reactive nitrogen in China (1910–2010). Proc. Natl. Acad. Sci. USA 2013, 110, 2052–2057. [Google Scholar] [CrossRef] [PubMed]
  9. Gong, P.; Li, X.C.; Zhang, W. 40-Year (1978–2017) human settlement changes in China reflected by impervious surfaces from satellite remote sensing. Sci. Bull. 2019, 64, 756–763. [Google Scholar] [CrossRef]
  10. Blevins, D.W.; Wilkison, D.H.; Niesen, S.L. Pre- and post-impoundment nitrogen in the lower Missouri River. Hydrol. Process. 2014, 28, 2535–2549. [Google Scholar] [CrossRef]
  11. Ogrinc, N.; Tamse, S.; Zavadlav, S.; Vrzel, J.; Jin, L.X. Evaluation of geochemical processes and nitrate pollution sources at the Ljubljansko polje aquifer (Slovenia): A stable isotope perspective. Sci. Total Environ. 2019, 646, 1588–1600. [Google Scholar] [CrossRef]
  12. Zhang, X.H.; Wu, Y.Y.; Gu, B.J. Urban rivers as hotspots of regional nitrogen pollution. Environ. Pollut. 2015, 205, 139–144. [Google Scholar] [CrossRef] [PubMed]
  13. Liu, X.P.; Hu, G.H.; Chen, Y.M.; Li, X.; Xu, X.C.; Li, S.Y.; Pei, F.S.; Wang, S.J. High-resolution multi-temporal mapping of global urban land using Landsat images based on the Google Earth Engine Platform. Remote Sens. Environ. 2018, 209, 227–239. [Google Scholar] [CrossRef]
  14. Zhang, X.Q.; Qi, Y.; Li, H.Y.; Wang, X.; Yin, Q.W. Assessing the response of non-point source nitrogen pollution to land use change based on SWAT model. Ecol. Indic. 2024, 158, 111391. [Google Scholar] [CrossRef]
  15. Liu, H.F.; Pan, W.Y.; Tian, X.P.; Zhu, R.Q.; Fan, A.P.; Jiao, Z.; Xu, Z.H. Temporal and Spatial Distribution of Nitrate Content in Shallow Groundwater in Well Irrigation Area. Jinan Daxue Xuebao Ziran Kexueban 2024, 38, 132–139. [Google Scholar] [CrossRef]
  16. Yu, G.R.; Jia, Y.L.; He, N.P.; Zhu, J.X.; Chen, Z.; Wang, Q.F.; Piao, S.L.; Liu, X.J.; He, H.L.; Guo, X.B.; et al. Stabilization of atmospheric nitrogen deposition in China over the past decade. Nat. Geosci. 2019, 12, 424–429. [Google Scholar] [CrossRef]
  17. Luo, Y.; Yang, X.; Carley, R.J.; Perkins, C. Effects of geographical location and land use on atmospheric deposition of nitrogen in the State of Connecticut. Environ. Pollut. 2003, 124, 437–448. [Google Scholar] [CrossRef] [PubMed]
  18. Joyce, E.E.; Walters, W.W.; Le Roy, E.; Clark, S.C.; Schiebel, H.; Hastings, M.G. Highly concentrated atmospheric inorganic nitrogen deposition in an urban, coastal region in the US. Environ. Res. Commun. 2020, 2, 11. [Google Scholar] [CrossRef]
  19. Huang, J.; Zhang, W.; Zhu, X.M.; Gilliam, F.S.; Chen, H.; Lu, X.K.; Mo, J.M. Urbanization in China changes the composition and main sources of wet inorganic nitrogen deposition. Environ. Sci. Pollut. Res. 2015, 22, 6526–6534. [Google Scholar] [CrossRef]
  20. Lv, J.L.; Buerkert, A.; Benedict, K.B.; Liu, G.J.; Lv, C.Y.; Liu, X.J. Comparison of nitrogen deposition across different land use types in agro-pastoral catchments of western China and Mongolia. Atmos. Environ. 2019, 199, 313–322. [Google Scholar] [CrossRef]
  21. Liu, J.; Li, J.M.; Ma, Y.B.; Wang, E.L.; Liang, Q.; Jia, Y.H.; Li, T.S.; Wang, G.C. Crop Productivity and Nitrogen Balance as Influenced by Nitrogen Deposition and Fertilizer Application in North China. Sustainability 2019, 11, 1347. [Google Scholar] [CrossRef]
  22. Liu, L.; Xu, W.; Lu, X.K.; Zhong, B.Q.; Guo, Y.X.; Lu, X.; Zhao, Y.H.; He, W.; Wang, S.H.; Zhang, X.Y.; et al. Exploring global changes in agricultural ammonia emissions and their contribution to nitrogen deposition since 1980. Proc. Natl. Acad. Sci. USA 2022, 119, e2121998119. [Google Scholar] [CrossRef] [PubMed]
  23. Prasad, V.K.; Badarinath, K.V.S. Soil surface nitrogen losses from agriculture in India: A regional inventory within agroecological zones (2000–2001). Int. J. Sustain. Dev. World Ecol. 2006, 13, 173–182. [Google Scholar] [CrossRef]
  24. Wang, H.B.; Yang, F.M.; Shi, G.M.; Tian, M.; Zhang, L.M.; Zhang, L.Y.; Fu, C.A. Ambient concentration and dry deposition of major inorganic nitrogen species at two urban sites in Sichuan Basin, China. Environ. Pollut. 2016, 219, 235–244. [Google Scholar] [CrossRef] [PubMed]
  25. Sheeder, S.A.; Lynch, J.A.; Grimm, J. Modeling atmospheric nitrogen deposition and transport in the Chesapeake Bay watershed. J. Environ. Qual. 2002, 31, 1194–1206. [Google Scholar] [CrossRef] [PubMed]
  26. Whitall, D.; Hendrickson, B.; Paerl, H. Importance of atmospherically deposited nitrogen to the annual nitrogen budget of the Neuse River estuary, North Carolina. Environ. Int. 2003, 29, 393–399. [Google Scholar] [CrossRef] [PubMed]
  27. Mgelwa, A.S.; Hu, Y.L.; Ngaba, M.Y. Patterns of nitrogen concentrations and their controls in two southern China urban river ecosystems. Glob. Ecol. Conserv. 2020, 23, e01112. [Google Scholar] [CrossRef]
  28. Guo, X.M.; Zhang, Q.M.; Zhao, T.Q.; Jin, C. Fluxes, characteristics and influence on the aquatic environment of inorganic nitrogen deposition in the Danjiangkou reservoir. Ecotoxicol. Environ. Saf. 2022, 241, 113814. [Google Scholar] [CrossRef] [PubMed]
  29. Sinha, E.; Michalak, A.M.; Balaji, V. Eutrophication will increase during the 21st century as a result of precipitation changes. Science 2017, 357, 405–408. [Google Scholar] [CrossRef] [PubMed]
  30. Howarth, R.W.; Swaney, D.P.; Boyer, E.W.; Marino, R.; Jaworski, N.; Goodale, C. The influence of climate on average nitrogen export from large watersheds in the Northeastern United States. Biogeochemistry 2006, 79, 163–186. [Google Scholar] [CrossRef]
  31. Ren, Y.F.; Xu, Z.W.; Zhang, X.Y.; Wang, X.K.; Sun, X.M.; Ballantine, D.J.; Wang, S.Z. Nitrogen pollution and source identification of urban ecosystem surface water in Beijing. Front. Environ. Sci. Eng. 2014, 8, 106–116. [Google Scholar] [CrossRef]
  32. Zhang, Q.Q.; Wang, X.K.; Sun, F.X.; Sun, J.C.; Liu, J.T.; Ouyang, Z.Y. Assessment of temporal and spatial differences of source apportionment of nitrate in an urban river in China, using δ15N and δ18O values and an isotope mixing model. Environ. Sci. Pollut. Res. 2015, 22, 20226–20233. [Google Scholar] [CrossRef] [PubMed]
  33. Zhang, Y.; Li, F.D.; Zhang, Q.Y.; Li, J.; Liu, Q. Tracing nitrate pollution sources and transformation in surface- and ground-waters using environmental isotopes. Sci. Total Environ. 2014, 490, 213–222. [Google Scholar] [CrossRef] [PubMed]
  34. Johnson, P.T.J.; Townsend, A.R.; Cleveland, C.C.; Glibert, P.M.; Howarth, R.W.; McKenzie, V.J.; Rejmankova, E.; Ward, M.H. Linking environmental nutrient enrichment and disease emergence in humans and wildlife. Ecol. Appl. 2010, 20, 16–29. [Google Scholar] [CrossRef] [PubMed]
  35. Li, D.F.; Zhai, Y.Z.; Lei, Y.; Li, J.; Teng, Y.G.; Lu, H.; Xia, X.L.; Yue, W.F.; Yang, J. Spatiotemporal evolution of groundwater nitrate nitrogen levels and potential human health risks in the Songnen Plain, Northeast China. Ecotoxicol. Environ. Saf. 2021, 208, 10. [Google Scholar] [CrossRef] [PubMed]
  36. World Health Organization. Guidelines for Drinking-Water Quality: Fourth Edition Incorporating the First Addendum; World Health Organization: Geneva, Switzerland, 2017; License: CC BY-NC-SA 3.0 IGO. [Google Scholar]
  37. Zhang, Y.T.; Wu, J.H.; Xu, B. Human health risk assessment of groundwater nitrogen pollution in Jinghui canal irrigation area of the loess region, northwest China. Environ. Earth Sci. 2018, 77, 12. [Google Scholar] [CrossRef]
  38. Li, W.; Zhou, J.; Xu, Z.; Liang, Y.; Shi, J.; Zhao, X. Climate impact greater on vegetation NPP but human enhance benefits after the Grain for Green Program in Loess Plateau. Ecol. Indic. 2023, 157, 111201. [Google Scholar] [CrossRef]
  39. Li, K.; Liu, E.F.; Zhang, E.L.; Li, Y.L.; Shen, J.; Liuc, X.Q. Historical variations of atmospheric trace metal pollution in Southwest China: Reconstruction from a 150-year lacustrine sediment record in the Erhai Lake. J. Geochem. Explor. 2017, 172, 62–70. [Google Scholar] [CrossRef]
  40. Yuan, X.F.; Jian, J.S.; Jiang, G. Spatiotemporal Variation of Precipitation Regime in China from 1961 to 2014 from the Standardized Precipitation Index. ISPRS Int. J. Geo-Inf. 2016, 5, 194. [Google Scholar] [CrossRef]
  41. Zhang, Z.X.; Chen, X.; Xu, C.Y.; Yuan, L.F.; Yong, B.; Yan, S.F. Evaluating the non-stationary relationship between precipitation and streamflow in nine major basins of China during the past 50 years. J. Hydrol. 2011, 409, 81–93. [Google Scholar] [CrossRef]
  42. Jia, S.N.; Yuan, D.; Li, W.W.; He, W.; Raza, S.; Kuzyakov, Y.; Zamanian, K.; Zhao, X.N. Soil Chemical Properties Depending on Fertilization and Management in China: A Meta-Analysis. Agronomy 2022, 12, 2501. [Google Scholar] [CrossRef]
  43. Jia, Y.; Yu, G.; Gao, Y.; He, N.; Wang, Q.; Jiao, C.; Zuo, Y. Global inorganic nitrogen dry deposition inferred from ground- and space-based measurements. Sci. Rep. 2016, 6, 19810. [Google Scholar] [CrossRef]
  44. Jia, Y.; Wang, Q.; Zhu, J.; Chen, Z.; He, N.; Yu, G. A spatial and temporal dataset of atmospheric inorganic nitrogen wet deposition in China (1996–2015). China Sci. Data 2019, 4, 21. [Google Scholar] [CrossRef]
  45. He, J. Creative Industry Districts: An Analysis of Dynamics, Networks and Implications on Creative Clusters in Shanghai. In Creative Industry Districts; Springer: Berlin/Heidelberg, Germany, 2013. [Google Scholar]
  46. Cheng, J.; Dai, S.; Ye, X. Spatiotemporal heterogeneity of industrial pollution in China. China Econ. Rev. 2016, 40, 179–191. [Google Scholar] [CrossRef]
  47. Ren, J.; Ma, Y. Studies on the spatiotemporal dynamics of industrial pollution in Northeast China. Huanjing Kexue Xuebao/Acta Sci. Circumstantiae 2018, 38, 2108–2118. [Google Scholar] [CrossRef]
  48. Wang, S.J.; Lu, A.G.; Dang, S.H.; Chen, F.L. Ammonium nitrogen concentration in the Weihe River, central China during 2005–2015. Environ. Earth Sci. 2016, 75, 512. [Google Scholar] [CrossRef]
  49. Wang, Y.; Xu, W.; Han, C.; Hu, W. Distribution of Nitrogen and Phosphorus in Lake Chaohu Sediments and Pollution Evaluation. Huan Jing Ke Xue 2020, 42, 699–711. [Google Scholar] [CrossRef] [PubMed]
  50. Roy, S.; Speed, C.; Bennie, J.; Swift, R.; Wallace, P. Identifying the significant factors that influence temporal and spatial trends in nitrate concentrations in the Dorset and Hampshire Basin Chalk aquifer of Southern England. Q. J. Eng. Geol. Hydrogeol. 2007, 40, 377–392. [Google Scholar] [CrossRef]
  51. Koh, E.H.; Kaown, D.; Mayer, B.; Kang, B.R.; Moon, H.S.; Lee, K.K. Hydrogeochemistry and Isotopic Tracing of Nitrate Contamination of Two Aquifer Systems on Jeju Island, Korea. J. Environ. Qual. 2012, 41, 1835–1845. [Google Scholar] [CrossRef] [PubMed]
  52. Wick, K.; Heumesser, C.; Schmid, E. Groundwater nitrate contamination: Factors and indicators. J. Environ. Manag. 2012, 111, 178–186. [Google Scholar] [CrossRef]
  53. Li, Z.L.; Zeng, Z.Q.; Tian, D.S.; Wang, J.S.; Fu, Z.; Zhang, F.Y.; Zhang, R.Y.; Chen, W.N.; Luo, Y.Q.; Niu, S.L. Global patterns and controlling factors of soil nitrification rate. Glob. Chang. Biol. 2020, 26, 4147–4157. [Google Scholar] [CrossRef]
  54. Chen, X.K.; Liu, X.B.; Li, B.G.; Peng, W.Q.; Dong, F.; Huang, A.P.; Wang, W.J.; Cao, F. Water quality assessment and spatial-temporal variation analysis in Erhai lake, southwest China. Open Geosci. 2021, 13, 1643–1655. [Google Scholar] [CrossRef]
  55. Basu, N.B.; Van Meter, K.J.; Byrnes, D.K.; Van Cappellen, P.; Brouwer, R.; Jacobsen, B.H.; Jarsjö, J.; Rudolph, D.L.; Cunha, M.C.; Nelson, N.; et al. Managing nitrogen legacies to accelerate water quality improvement. Nat. Geosci. 2022, 15, 97–105. [Google Scholar] [CrossRef]
  56. Sebilo, M.; Mayer, B.; Nicolardot, B.; Pinay, G.; Mariotti, A. Long-term fate of nitrate fertilizer in agricultural soils. Proc. Natl. Acad. Sci. USA 2013, 110, 18185–18189. [Google Scholar] [CrossRef]
  57. Gutiérrez, M.; Biagioni, R.N.; Alarcón-Herrera, M.T.; Rivas-Lucero, B.A. An overview of nitrate sources and operating processes in arid and semiarid aquifer systems. Sci. Total Environ. 2018, 624, 1513–1522. [Google Scholar] [CrossRef]
  58. Vasbieva, M.T. Effect of Long-Term Application of Organic and Mineral Fertilizers on the Organic Carbon Content and Nitrogen Regime of Soddy-Podzolic Soil. Eurasian Soil Sci. 2019, 52, 1422–1428. [Google Scholar] [CrossRef]
  59. Lu, L.; Han, W.Y.; Zhang, J.B.; Wu, Y.C.; Wang, B.Z.; Lin, X.G.; Zhu, J.G.; Cai, Z.C.; Jia, Z.J. Nitrification of archaeal ammonia oxidizers in acid soils is supported by hydrolysis of urea. ISME J. 2012, 6, 1978–1984. [Google Scholar] [CrossRef]
  60. Hobbie, S.E.; Finlay, J.C.; Janke, B.D.; Nidzgorski, D.A.; Millet, D.B.; Baker, L.A. Contrasting nitrogen and phosphorus budgets in urban watersheds and implications for managing urban water pollution. Proc. Natl. Acad. Sci. USA 2017, 114, 4177–4182. [Google Scholar] [CrossRef]
  61. Jones, C.S.; Drake, C.W.; Hruby, C.E.; Schilling, K.E.; Wolter, C.F. Livestock manure driving stream nitrate. Ambio 2019, 48, 1143–1153. [Google Scholar] [CrossRef]
  62. Yang, Z.H.; Hu, Y.; Zhang, S.; Raza, S.; Wei, X.R.; Zhao, X.N. The Thresholds and Management of Irrigation and Fertilization Earning Yields and Water Use Efficiency in Maize, Wheat, and Rice in China: A Meta-Analysis (1990–2020). Agronomy 2022, 12, 709. [Google Scholar] [CrossRef]
  63. Barth, G.; von Tucher, S.; Schmidhalter, U.; Otto, R.; Motavalli, P.; Ferraz-Almeida, R.; Sattolo, T.M.S.; Cantarella, H.; Vitti, G.C. Performance of nitrification inhibitors with different nitrogen fertilizers and soil textures. J. Plant Nutr. Soil Sci. 2019, 182, 694–700. [Google Scholar] [CrossRef]
  64. Yu, Q.G.; Ma, J.W.; Zou, P.; Lin, H.; Sun, W.C.; Yin, J.Z.; Fu, J.R. Effects of combined application of organic and inorganic fertilizers plus nitrification inhibitor DMPP on nitrogen runoff loss in vegetable soils. Environ. Sci. Pollut. Res. 2015, 22, 472–481. [Google Scholar] [CrossRef]
  65. Shi, P.; Zhang, Y.; Song, J.X.; Li, P.; Wang, Y.S.; Zhang, X.M.; Li, Z.B.; Bi, Z.L.; Zhang, X.; Qin, Y.L.; et al. Response of nitrogen pollution in surface water to land use and social-economic factors in the Weihe River watershed, northwest China. Sustain. Cities Soc. 2019, 50, 9. [Google Scholar] [CrossRef]
  66. Wang, S.H.; Ma, Y.K.; Zhang, X.Y.; Yu, Y.; Zhou, X.H.; Shen, Z.Y. Nitrogen transport and sources in urban stormwater with different rainfall characteristics. Sci. Total Environ. 2022, 837, 11. [Google Scholar] [CrossRef]
  67. Winiwarter, W.; Klimont, Z. The role of N-gases (N2O, NOx, NH3) in cost-effective strategies to reduce greenhouse gas emissions and air pollution in Europe. Curr. Opin. Environ. Sustain. 2011, 3, 438–445. [Google Scholar] [CrossRef]
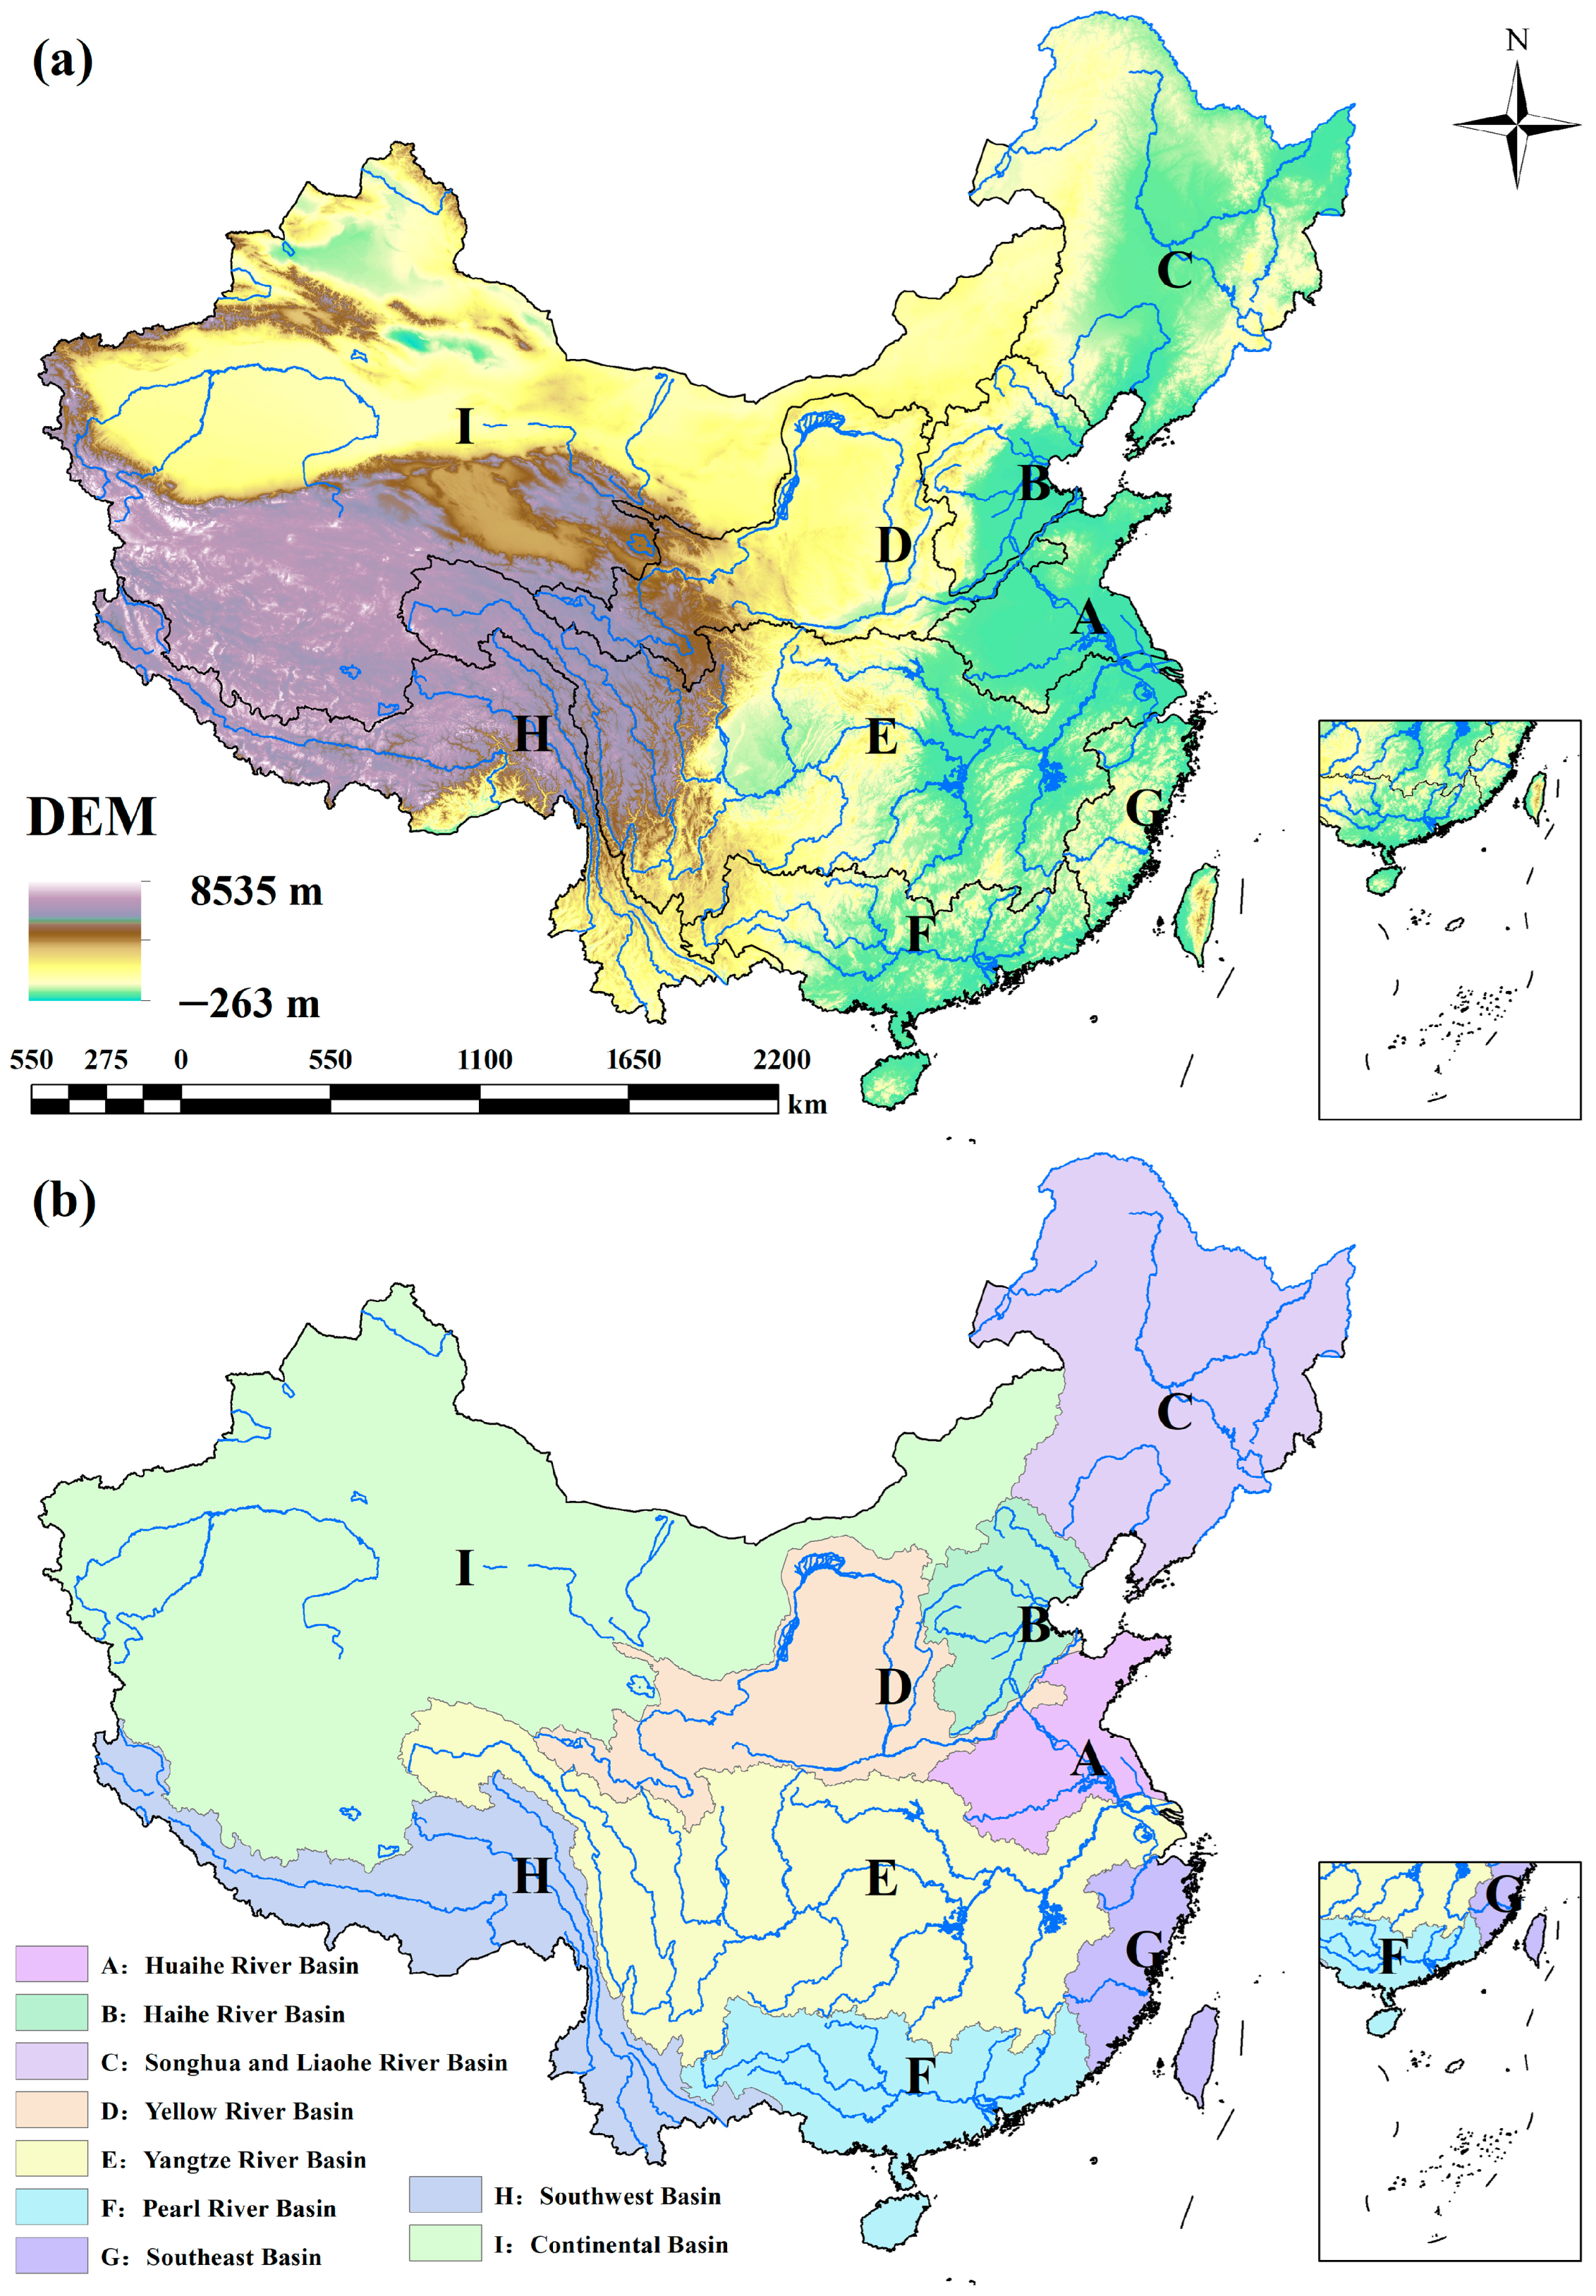
Figure 1. The topography (a) and nine basins of China (b). The maps were generated based on the data sourced from the National Ecosystem Science Data Center (https://www.resdc.cn/ accessed on 11 December 2022) (a) and Geospatial Data Cloud (http://geodata.pku.edu.cn/ accessed on 11 November 2022) (b).
Water 16 01396 g001
Figure 2. The distribution and concentration of nitrate (N-NO3, mg L−1) in the groundwater and surface water during the flooding seasons in the main nine basins of China from 2000 to 2020. GW: groundwater, SW: surface water; orange color: 20 < N-NO3 ≤ 30; and red color: N-NO3 > 30. The triangles with orange or red colors represent point pollution, where the ΔTN is ≤ 0 (g kg−1) over 20 years. The circles with orange or red color are non-point pollution, where 0 < ΔTN ≤ 1.5. The squares with orange or red color represent point and non-point pollution, where ΔTN > 1.5. The maps were based on the data sourced from the National Earth System Science Data Center (https://www.resdc.cn/ accessed on 18 September 2022).
Water 16 01396 g002
Figure 3. The concentration of N-NO3 in the groundwater and surface water during the flooding season in the main nine basins of China from 2000 to 2020. The whiskers represent the threshold of the N-NO3 concentrations in the sampling point. Orange whisker: N-NO3 = 20 mg L−1 and red whisker: N-NO3 = 30 mg L−1.
Water 16 01396 g003
Figure 4. The distribution and concentration of nitrate (N-NO3, mg L−1) in groundwater and surface water during the non-flooding seasons in the main nine basins of China from 2000–2020. GW: groundwater; SW: surface water; orange color: 20 < N-NO3 ≤ 30; and red color: N-NO3 > 30. The triangles with orange or red colors represent point pollutions, where the ΔTN is ≤ 0 (g kg−1) over 20 years. The circles with orange or red colors represent non-point pollution, where 0 < ΔTN ≤ 1.5. The squares with orange or red colors represent point and non-point pollution, where ΔTN > 1.5. The maps were based on the data sourced from the National Earth System Science Data Center (https://www.resdc.cn/ accessed on 18 September 2022).
Water 16 01396 g004
Figure 5. The concentration of N-NO3 in the groundwater and surface water during the non-flooding season in the main nine basins of China from 2000 to 2020. The whiskers represent the threshold of N-NO3 concentration in the sampling point. Orange whisker: N-NO3 = 20 mg L−1 and red whisker: N-NO3 = 30 mg L−1.
Water 16 01396 g005
Figure 6. Distribution of the croplands and urban areas in the nine basins of China during 2000 (a), 2005 (b), 2010 (c), 2015 (d), and 2020 (e). The maps were based on the maps data sourced from the annual China land cover dataset (https://www.earth-system-science-data.net/ accessed on 22 November 2022).
Water 16 01396 g006
Figure 7. The percentage of land-use changes in the croplands (green) and urban lands (red) from 2000 to 2020. ((A): Huaihe River Basin, (B): Haihe River Basin, (C): Songhua and Liaohe River Basin, (D): Yellow River Basin, (E): Yangtze River Basin, (F): Pearl River Basin, (G): Southeast Basin, (H): Southwest Basin, (I): Continental Basin; The linear graph was based on the maps data, as shown in Figure 6, sourced from the annual China land cover dataset (https://www.earth-system-science-data.net/ accessed on 22 November 2022)).
Water 16 01396 g007
Figure 8. The N-NO3 concentration in the groundwater and surface water during flooding and non-flooding seasons, as well as the percentage of land use.
Water 16 01396 g008
Figure 9. The correlation coefficient ® between N-NO3 concentration (mg L−1) in groundwater and surface water of China and the percentage of urban land and cropland from total land area.
Water 16 01396 g009
Figure 10. The average population density (person km−2) in China between 2000 and 2020 (The map data were sourced from the LandScan Population Density Dataset (https://landscan.ornl.gov/ accessed on 1 September 2023)) (a). The annual average nitrogen fertilization rates (kg ha−1 yr−1) in 1 km intervals from 2000 to 2018 (The map data were sourced from the Historical nitrogen fertilizer use in China from 1952 to 2018 (http://www.geodata.cn/ accessed on 23 July 2023)) (b).
Water 16 01396 g010
Figure 11. Annual average N-NO3 wet and dry deposition from 2006 to 2015 (the map data were sourced from datasets [43,44].
Water 16 01396 g011
Figure 12. The nitrogen sediment index of TN (STN) of Chinese lakes from 2014 to 2018. Basin C: The Songhua and Liaohe River Basin and Basin E: the Yangtze River Basin. (STN = CTN/CS, where STN is the lake sediment pollution index of TN, CTN (mg kg−1) is the measured TN in lake sediment content, CS (mg kg−1) is 1000, which is the reference value of the TN content) [49]. Map data were sourced from 2014–2018 Chinese Lake Sediment Dating Dataset (https://www.geodata.cn/ accessed on 21 June 2023).
Water 16 01396 g012
Table 1. The average population density between 2000 and 2020, as well as the nitrogen fertilization rates between 2000 and 2018 (the data in Table 1), were sourced from the LandScan Population Density Dataset (https://landscan.ornl.gov/ accessed on 1 September 2023) (a). Historical nitrogen fertilizer use in China from 1952 to 2018 (http://www.nesdc.org.cn/ accessed on 23 July 2023) (b).
BasinsPopulation Density
(person km−2)
T Nitrogen Fertilization Rate (kg ha−1 yr−1)
A436175.57
B28885.10
C5925.85
D10634.46
E18543.54
F24044.09
G27645.33
H196.08
I62.93
Disclaimer/Publisher’s Note: The statements, opinions and data contained in all publications are solely those of the individual author(s) and contributor(s) and not of MDPI and/or the editor(s). MDPI and/or the editor(s) disclaim responsibility for any injury to people or property resulting from any ideas, methods, instructions or products referred to in the content.