Article

Hydrogeochemical Characteristics of the Geothermal System in the Woka-Cuona Rift Zone, Tibet

1
Institute of Exploration Technology, Chinese Academy of Geological Sciences, Chengdu 611734, China
2
College of Management Science, Chengdu University of Technology, Chengdu 610051, China
*
Authors to whom correspondence should be addressed.
Water 2024, 16(10), 1395; https://doi.org/10.3390/w16101395
Submission received: 15 April 2024 / Revised: 7 May 2024 / Accepted: 11 May 2024 / Published: 14 May 2024
(This article belongs to the Special Issue Isotope Geochemistry of Groundwater: Latest Advances and Prospects)

Abstract

:
The Woka-Cuona rift zone on the southeastern side of the Qinghai-Tibet Plateau is characterized by complex geological background conditions, comprising three independent or semi-grabens that traverse from south to north across the Himalayan and Gangdise terranes. Conducting research on the distribution patterns and genesis mechanisms of geothermal resources within the Woka-Cuona rift zone has certain guiding significance for understanding the genesis mechanisms of the geothermal system in the southern Tibetan rift and its exploitation. This paper utilized methods such as data collection, ground investigations, and geochemical analyses to analyze the distribution characteristics and evolutionary processes of geothermal waters in the Cuona rift area based on the geological background conditions of the study area. The research findings demonstrate a significant correlation between the occurrence of geothermal waters in the Cuona rift zone and geological structures, with most geothermal waters primarily distributed near intersections of graben boundary faults and east–west-trending faults. Different regions exhibit variations in the intensity of geothermal activity and geochemical characteristics, with the genesis of geothermal waters associated with deep magmatic activity, characterized by Na+ and K+ as the primary cations and Cl as the primary anions. Geothermal waters mainly originate from atmospheric precipitation and snowmelt water from surrounding mountainous areas, with recharge elevations ranging from 4500 to 6200 m and an average elevation of 5400 m.

1. Introduction

The late 1960s and early 1970s witnessed a surge in global interest in geothermal energy due to the oil crisis. China, with its substantial geothermal activity, boasts potential geothermal reserves constituting 7.9% of the global total. However, these reserves are unevenly distributed and influenced by various factors [1,2,3]. Consequently, the exploration and assessment of China’s geothermal resources have progressively garnered attention from scientists both domestically and internationally.
Situated on the edge of two global tectonic plates in the tropics, the Qinghai-Tibet Plateau is rich in geothermal resources. The eastern Taiwan geotropics belong to the western Pacific Island arc-type plate edge geotropics, while the Himalayan geotropics in the southwest represent the eastern part of the Mediterranean Himalayan land plate collision type geotropics [4]. This geological setting, characterized by strong plate collision, fosters robust geothermal activity, particularly pronounced in southern Tibet and western Yunnan [5,6]. Southern Tibet, in particular, is renowned for its medium to high-temperature hydrothermal activity.
The distribution pattern of geothermal water in the region resembles a bead-like pattern along major regional faults, predominantly exposed at fault intersections, indicating a close relationship with tectonic activity. Notably, areas with the strongest hydrothermal activity, such as hydrothermal explosions, geysers, and boiling springs, are spatially associated with the near north–south fault basins [7]. This concentration of high-temperature geothermal water underscores the significant role played by the near north–south rift in controlling geothermal energy in Tibet.
Regarding the origin of geothermal water, White [8] proposed a classic genetic model. According to this model, under conditions of high terrestrial heat flow, meteoric water infiltrates downward through fracture zones or long, deep fissures. Driven by head pressure, it traverses surrounding rocks or deep heat sources, heating up and forming geothermal water. Subsequently, it ascends to the surface along dominant structural positions, guided by thermodynamic effects. This intricate process involves a continuous exchange of matter and energy between infiltrating meteoric water and the subsurface environment, leading to alterations in hydrogeochemical characteristics. Hence, hydrogeochemical characteristics play a crucial role in analyzing the circulation, water–rock interaction, runoff path, and accumulation environment of groundwater [9,10,11].
Hydrochemical and isotopic geochemical characteristics are significant in elucidating the genetic mechanism of geothermal water. Since the 1950s, isotope hydrology has been employed in hydrogeological research to unveil the origin, occurrence, distribution, migration, and circulation modes of water in the hydrosphere, as well as its interaction with other Earth spheres.
Despite numerous studies analyzing the distribution characteristics of hydrothermal activity in the Himalayan tropics and exploring the genesis model of geothermal systems, there is limited research on the geothermal system of the easternmost Woka-Chana rift. Therefore, this study focuses on the geothermal system within the Woka-Cuona rift zone, aiming to systematically delineate the distribution of geothermal water and investigate its hydrogeochemical characteristics. The primary objective of this research is to provide comprehensive support for the scientific exploration of geothermal resources by elucidating the formation mechanisms of the geothermal system in the Woka-Cuona rift zone.

2. Overview of the Study Area

At 63–65 Ma, the Indian continent and Eurasia continent collided positively in the middle of the Yarlung Zangbo River suture zone, and then a diachronic collision occurred on the east and west sides [12]. The collision and continuous convergence of the Indian continent and Eurasia continent in the Cenozoic era formed the Gangdise main collision tectonic belt and the Tethys Himalayan tectonic belt with the Yarlung Zangbo River suture zone as the boundary [13]; its evolution process has gone through three stages: main collision (41–65 Ma), late collision (26–40 Ma), and post-collision (0–25 Ma) [14]. The series of nearly north–south-trending rifts developed in the southern part of the Qinghai-Tibet Plateau are large-scale extensional structures under the continuous compression of the Indo-Eurasian continent and are also important objects for revealing the evolution process of post-plateau collision structures. The nearly north–south oriented rift almost crosses all east–west structural units and its southern end cuts through the southern Tibetan detachment system to reach the high Himalayas. To the north, it passes through the Lhasa and Qiangtang terrains and can intermittently extend to the vicinity of the Jinsha River suture zone. At present, research on north–south oriented rifts mainly focuses on the Shuanghu rift, Dangjiayongcuo-Kongcuo rift, Shenzha-Dingjie rift, Yadong-Gulu rift, and Woka-Cuona rift.
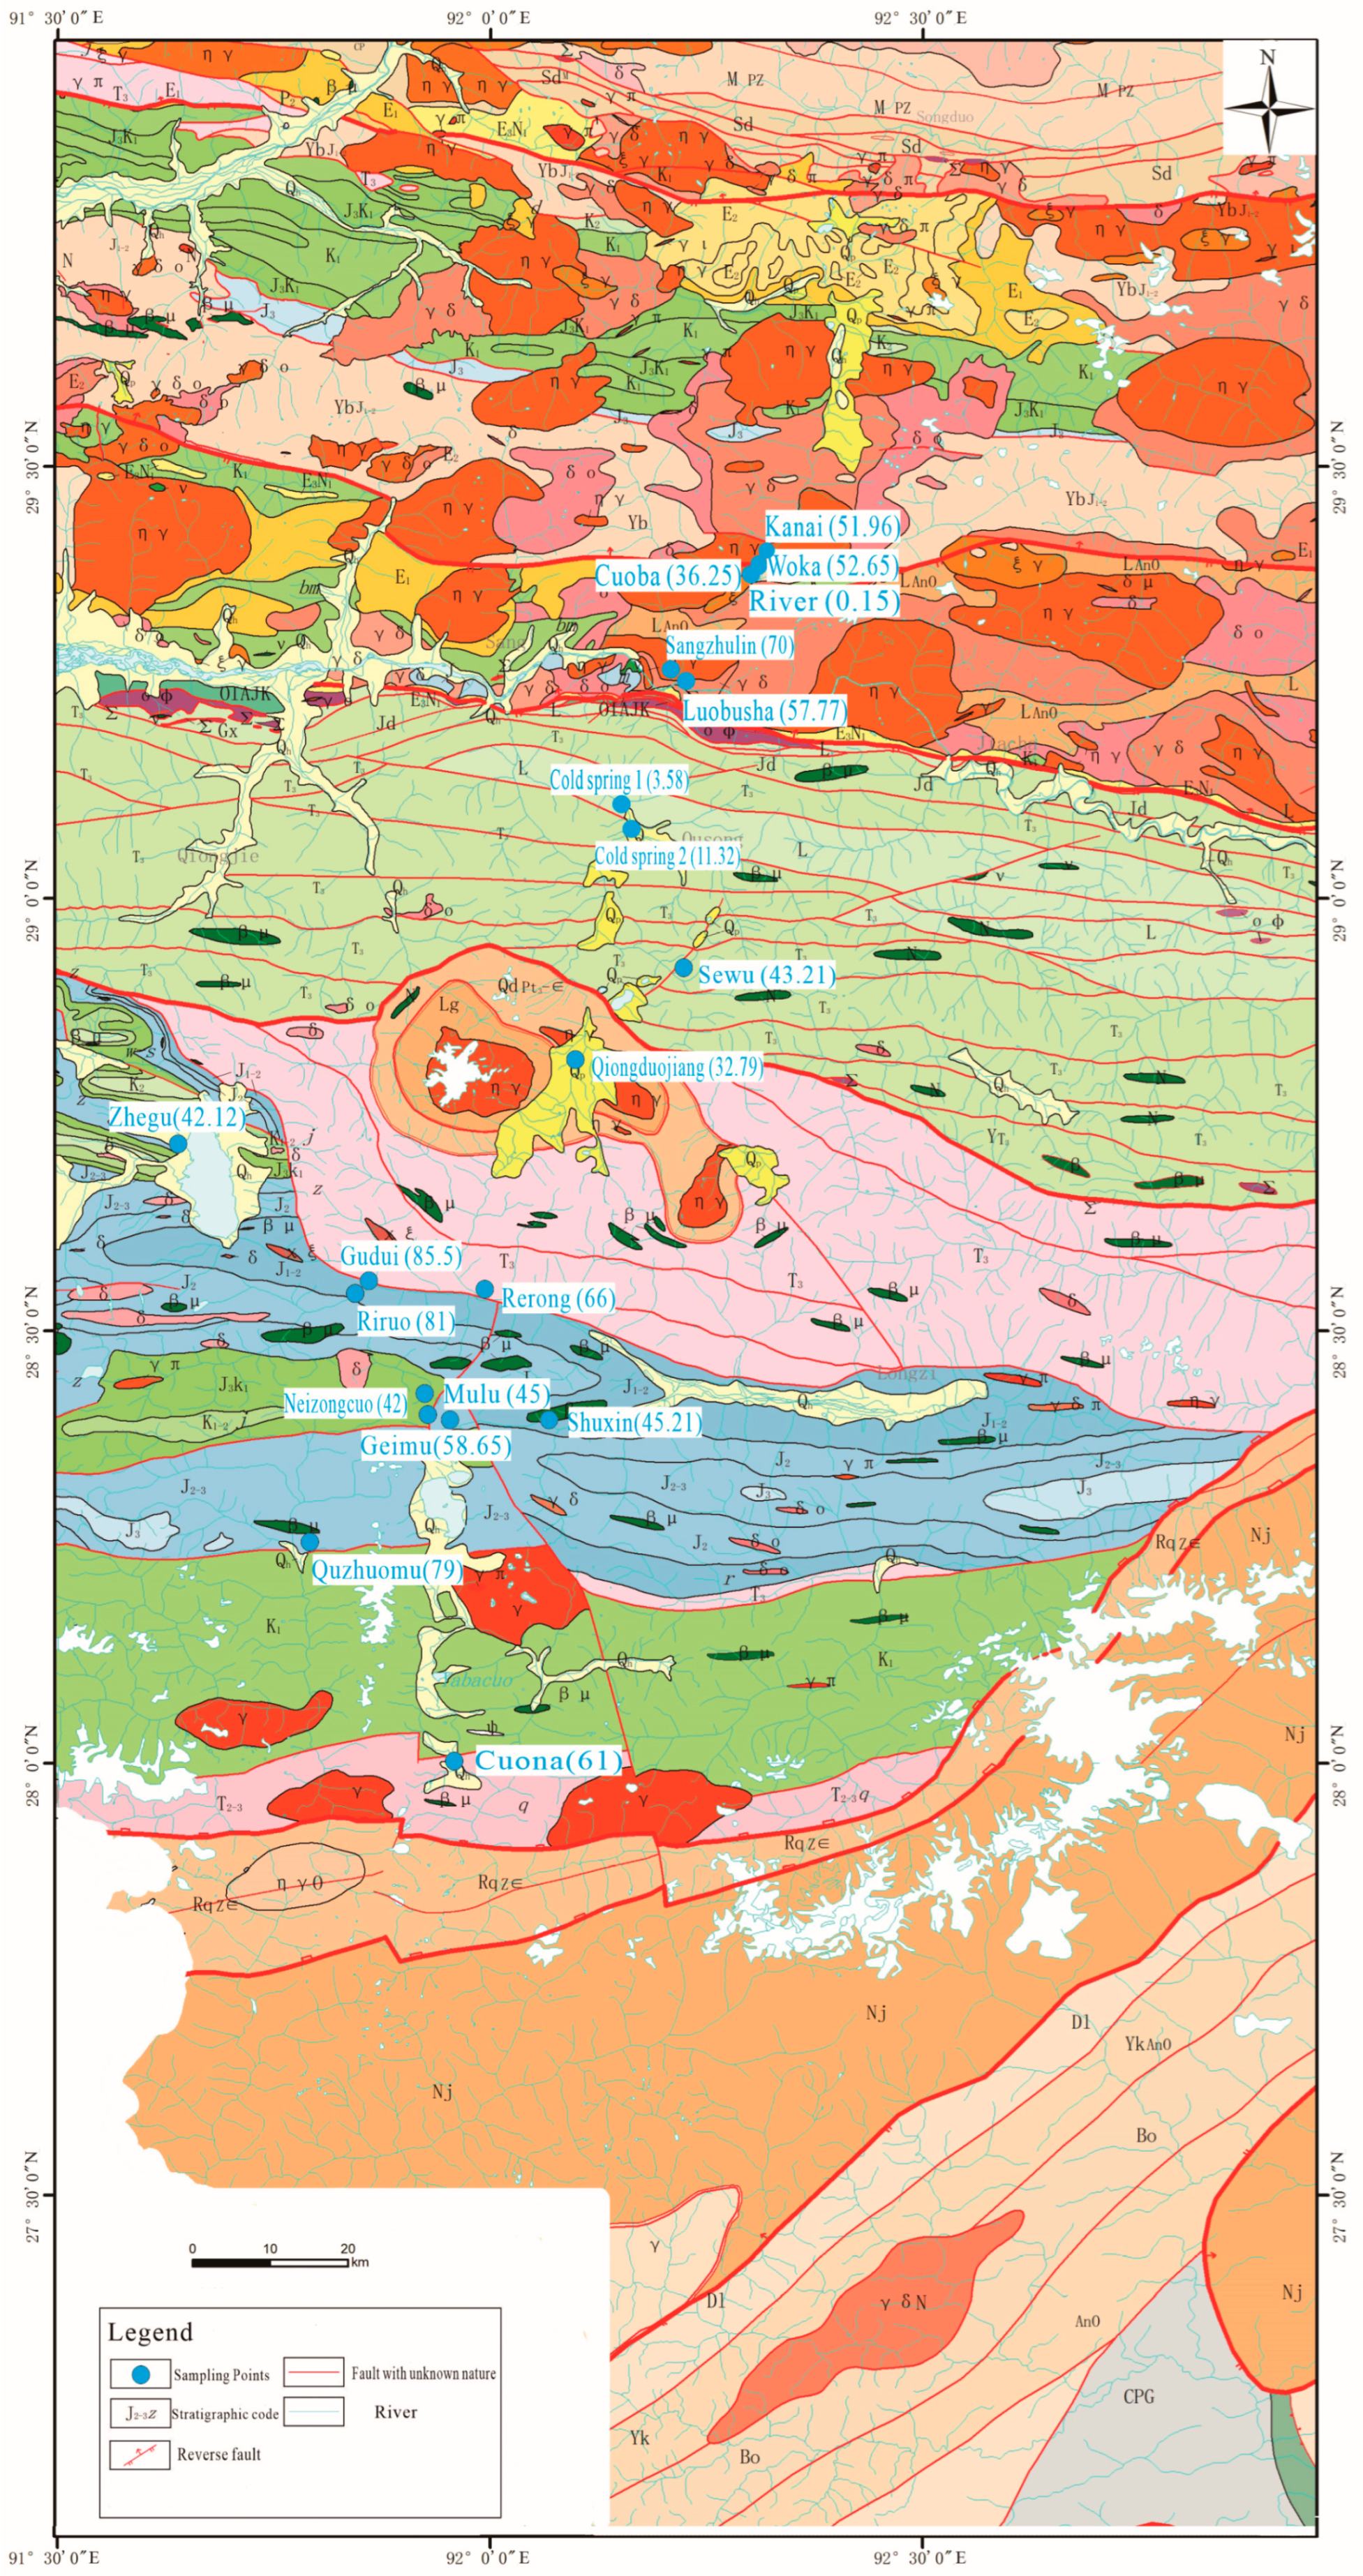
The Woka-Cuona rift valley is located at the easternmost end of southern Tibet, with a high southern and western section and a low northern and eastern section, with an average elevation of about 5000 m. The terrain features are obvious. The Yarlung Zangbo River traverses the area from west to east (Figure 1). The northern portion experiences a plateau temperate subhumid climate, while the southern border area has a plateau subtropical humid climate characterized by well-defined rainy and dry seasons, with the rainy period lasting from July to September. Additionally, the area receives an average annual precipitation of 300–450 mm and maintains an average annual temperature of around 6 °C.
The exposed strata in the study area are predominantly Mesozoic, followed by some Paleozoic and Quaternary strata. The oldest exposed Precambrian strata, including the Duizala Formation (Pt1y), the Nyalam Group (Pt1–2Nl), and the Qudegong Formation (Pt3Єq), consist of metamorphic core complexes. The Mesozoic strata, comprising the Nieru (T3n), Qulonggongba (T2–3q), Ridang (J1r), Lure (J1–2l), Jiabula (Klj), and Zongzhuo (K3z) formations, are characterized by sandstones, siltstones, and slates. The Quaternary strata primarily consist of alluvial (Qhal) and proluvial (Qhpl) deposits.
The study area is characterized by well-developed structures, including nearly east–west-trending faults, nearly north–south-trending faults, and dome structures. There are eight nearly east–west-trending faults in the study area, with all but one (STDS) exhibiting tensional characteristics. The nearly north–south-trending faults are grabens, with their bounding faults being normal faults that also exhibit tensional characteristics. The developed dome structures also show tensional features. Moving from south to north, the study area features two major first-order faults (Figure 2): the southern Tibetan detachment system and the Yarlung Zangbo suture zone. These are followed by second-order faults, including the Maizhokunggar-Gongbo’gyamda, Zhegucuo-Longzi, and Quzhuomu-Juela faults. Notably, the southern Tibetan detachment system and the Maizhokunggar-Gongbo’gyamda fault control the southern and northern boundaries of the geothermal water exposed in the study area.
The tectonic activity in the study area is very strong, resulting in more complex burial conditions, occurrence characteristics, and recharge and discharge characteristics of groundwater. Shallow circulating groundwater and deep circulating geothermal water are both exposed in the area. According to the classification criteria for aquifer media and groundwater dynamic characteristics, the groundwater in the study area can be categorized into unconsolidated rock pore water and bedrock (clastic and intrusive rocks) fissure water. The former, primarily recharged by river water, is predominantly found in sandy gravel layers dominated by sandstones in the Quaternary terraces along basins and river valleys. The latter, mainly recharged by meteoric water and characterized by relatively low water content, is primarily present as confined water in the fissures of clastic and intrusive rocks, with granites being the dominant lithotype. The lateral runoff of bedrock fissure water also provides partial replenishment for loose rock pore water. The lateral runoff conditions are mainly controlled by the terrain conditions, and the groundwater in the Quaternary system moves downstream from the mountain front to the center of the basin under the action of gravity. The main way of excretion is through evaporation, followed by discharge to low-lying areas on the surface in the form of springs. Deep circulation geothermal water is mainly controlled by the fault structural system, and after receiving replenishment, it migrates deep along the fault zone or rock contact zone. The runoff path is long, and the circulation depth is large. During this process, it obtains heat from additional heat sources in the deep and is ultimately mostly exposed in the form of spring clusters at the intersection of faults.

3. Materials and Methods

The field survey and collected data indicate the presence of 16 geothermal water sites or geothermal fields spreading across the Woka-Cuona rift zone. Utilizing the distribution and temperature indications of geothermal water, river basin characteristics, and regional structural characteristics, geothermal water in the Woka-Cuona rift zone was categorized into three parts: geothermal water in the Woka, Qiongduojiang, and Cuona grabens.
Based on geological surveys, this study collected geothermal water samples from the Woka-Cuona rift zone during the period from December 2019 to February 2020. The analysis of these geothermal water samples included field testing, total analysis, and hydrogen, oxygen, and carbon isotope analyses. As a point of comparison, geothermal water from Zhegu outside the grabens was sampled as contrast samples. Additionally, river and cold-spring water within the rift zone was sampled for comparative analysis as background factors. The information of the collected samples is provided in Table 1.
For on-site water quality analysis, this study utilized an American SMARTROLL handheld multi-parameter water quality monitor as a portable water quality analyzer. The total analysis of the samples was performed by Sino Shaanxi Nuclear Industry Group Comprehensive Analysis and Testing Co., Ltd., Xi′an, China. The water samples were stored in polyethylene bottles. In the case of polyethylene bottles with a volume of 600 mL, the same water samples would be stored in two bottles, with one sample mixed with 5 mL of a 1:1 nitric acid solution.
Polyethylene bottles with a volume of 50 mL were used to store samples for hydrogen and oxygen isotope analysis. These bottles were initially rinsed three times with water to be sampled before filling to avoid air bubbles. Hydrogen and oxygen isotopes were determined using a MAT-253 stable isotope ratio mass spectrometer with a precision level better than 0.05%. Additionally, samples for δ13C dating were stored in polyethylene bottles with a volume of 50 mL, containing 1‰ of saturated HgCl2 solution. The δ13C was determined using a MAT-253 stable isotope ratio mass spectrometer and a Gas Bench II universal online gas preparation and introduction system, with an absolute error below 0.15‰. All testing procedures were performed by the Karst Geological Resources and Environment Supervision and Testing Center, Ministry of Natural Resources.
For quality control, internationally recognized standard substances were used as references. All analyses were conducted in laboratories that comply with the quality management system requirements specified in reference [15]. The specific instrument models, manufacturers, countries of origin, and testing accuracies are as follows:
Ion chromatograph: Dionex ICS-2100 Ion Chromatograph; manufacturer: Thermo Fisher Scientific; city of origin: Waltham, MA, USA; accuracy: ±1%.
Hydrogen and oxygen isotope ratio mass spectrometer: Thermo Scientific MAT 253 Isotope Ratio Mass Spectrometer; manufacturer: Thermo Fisher Scientific; city of origin: Waltham, MA, USA; accuracy: 0.05‰.
Gas chromatograph mass spectrometer: Agilent 7890A GC/5975C MSD Gas Chromatograph Mass Spectrometer; manufacturer: Agilent Technologies; city of origin: Santa Clara, CA, USA; accuracy: 0.1%.

4. Results

4.1. Major Elements

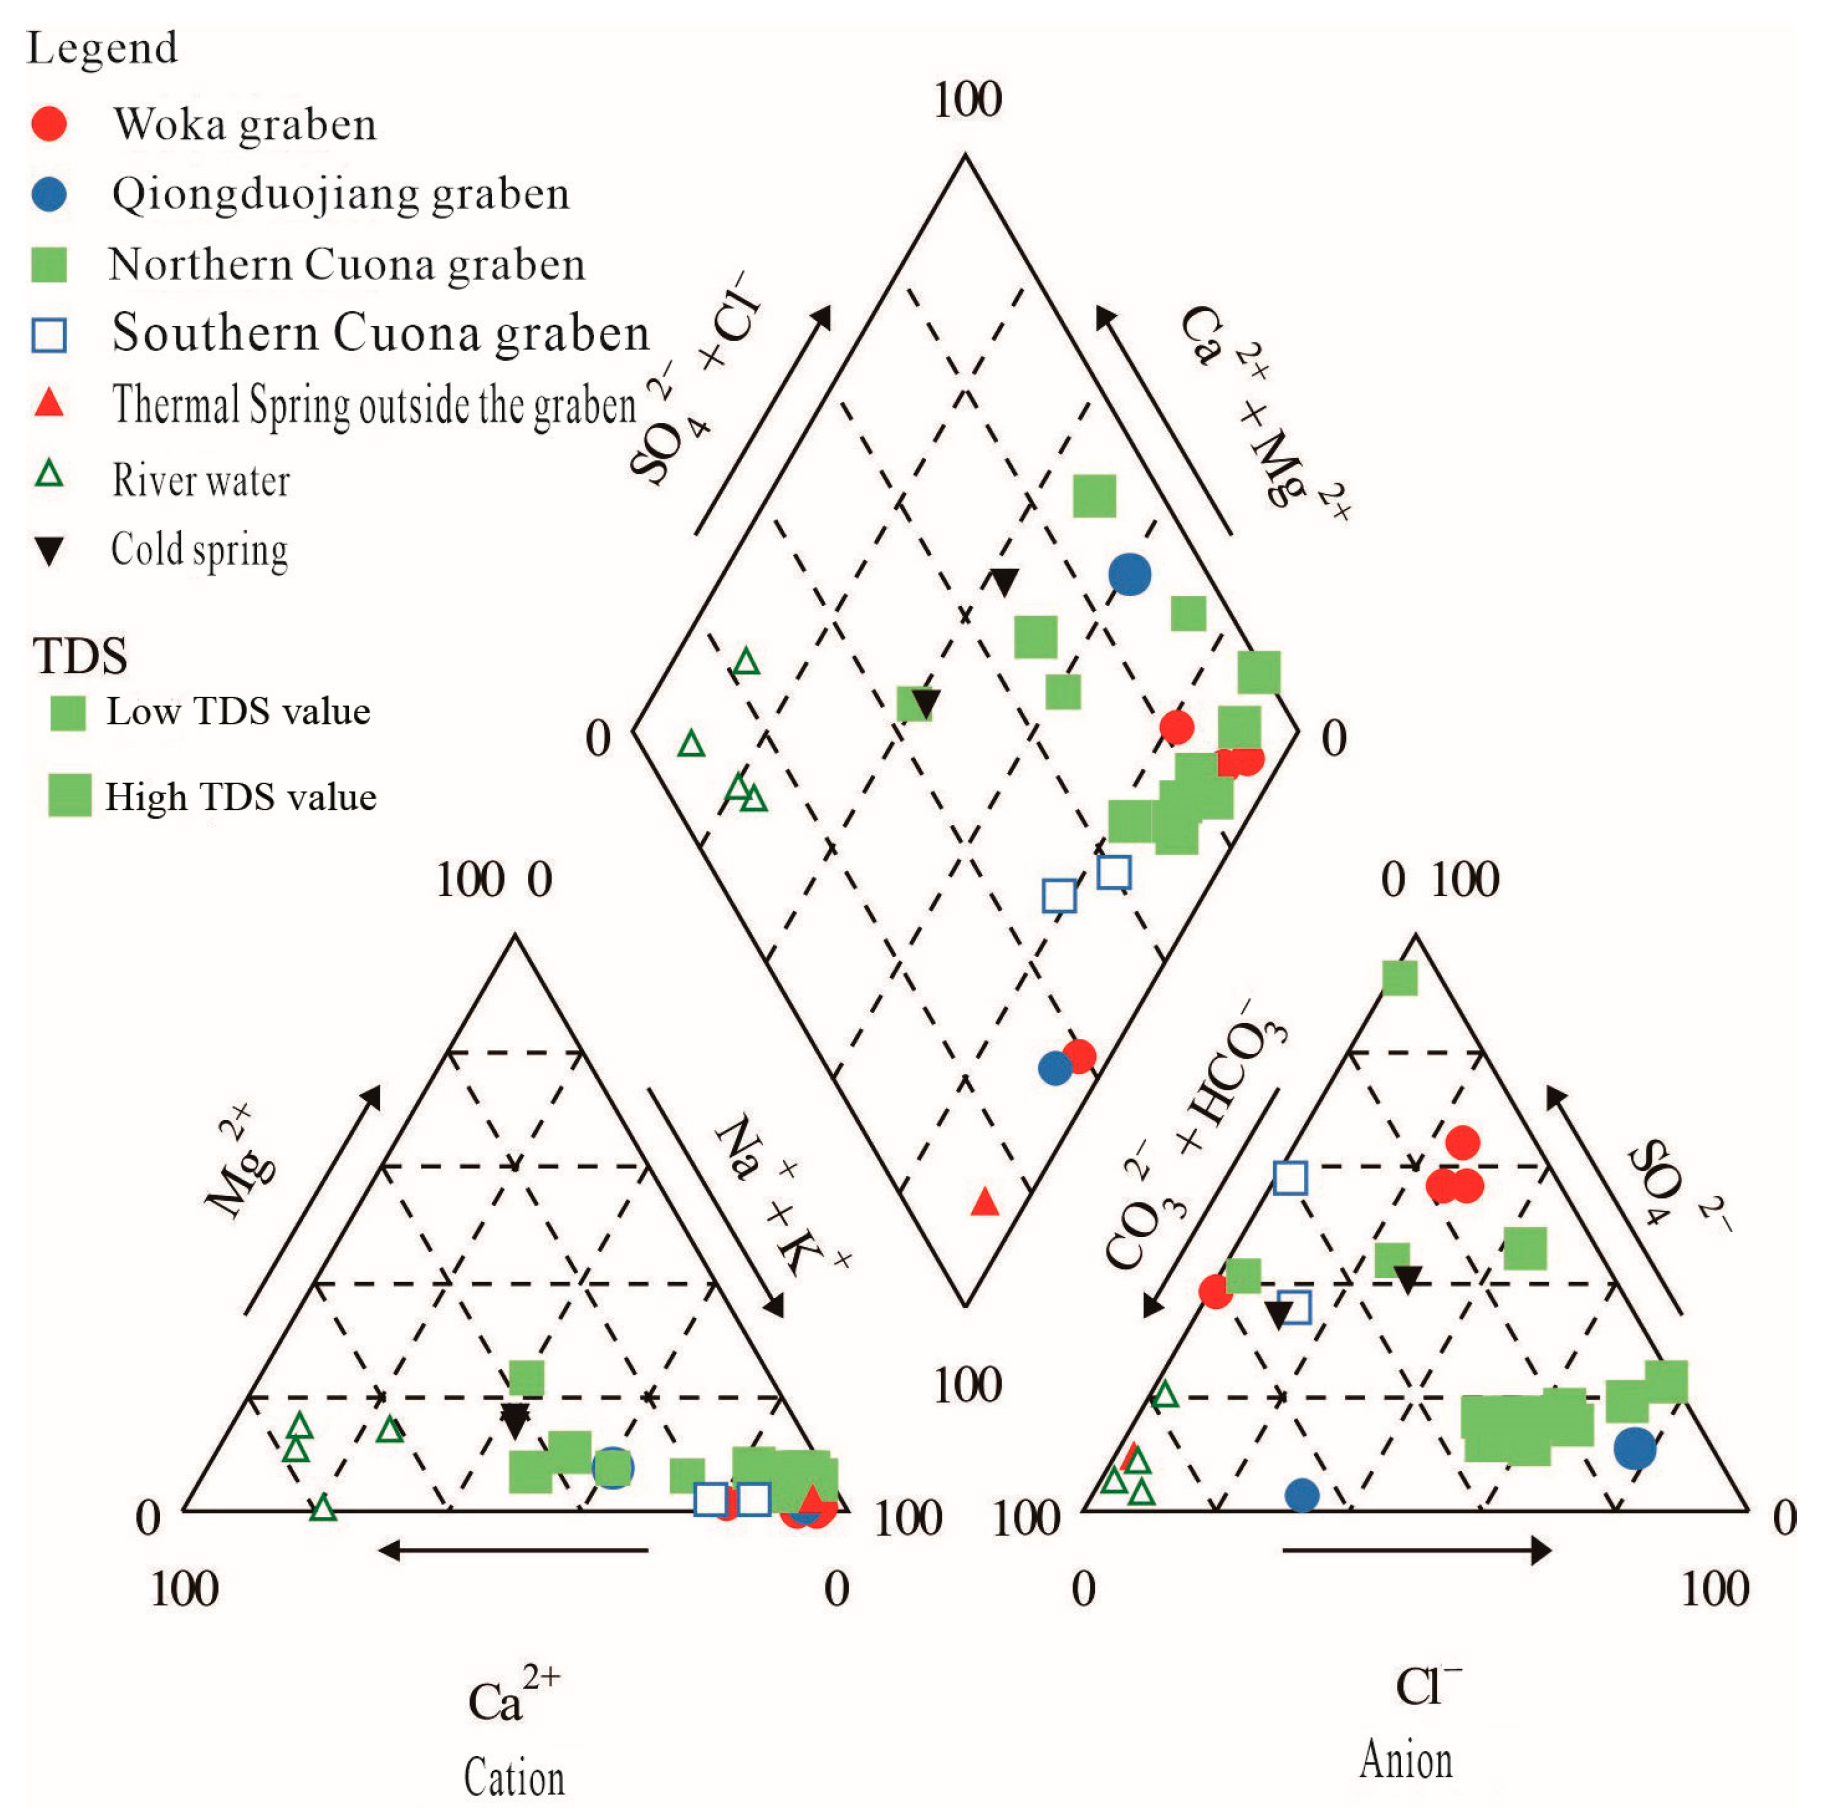
To comprehensively understand the genetic mechanism of the geothermal water system throughout the entire rift zone, this study elucidated the physicochemical parameters and major-element characteristics of geothermal, cold-spring, and surface waters in Table 2. The Woka-Cuona rift zone was divided into the Woka, Qiongduojiang, northern Cuona, and southern Cuona grabens, and Piper diagrams were generated to describe the hydrochemical characteristics, as illustrated in Figure 3.
According to the calculated results, geothermal water samples from the study area contained major cations represented by Na+ and K+, followed by Ca2+ and Mg2+, while major anions included Cl, succeeded by HCO3 and SO42−. Notably, Na+, K+, and Cl were identified as critical ions determining the total dissolved solids (TDS) content of the geothermal water samples. In the Woka graben, Na+ and SO42− were predominant in the geothermal water samples. The hydrochemical types of sampling sites Sewu and Qiuduojiang in the Qiongduojiang graben were identified as HCO3·Cl-Na and Cl-Na·Ca types, respectively, indicating different sources of hydrothermal resources. The geothermal water samples from the northern Cuona graben displayed major cations of Na+, followed by Ca2+, K+, and Mg2+, along with major anions of Cl, succeeded by HCO3 and SO42−, suggesting diverse hydrochemical types. Surface and borehole water samples from Cuona in the southern Cuona graben were classified as SO4·HCO3-Na and HCO3·SO4-Na types, respectively. Geothermal water sampled outside the grabens exhibited the HCO3·SO4-Na type.
(1)
Woka graben
Geothermal water samples from the Woka graben exhibited temperatures ranging from 36 to 70 °C (average: 54 °C), pH values falling between 7.95 and 9.25 (average: 8.43; predominantly neutral to slightly alkaline), and TDS contents varying from 120 to 327 mg/L (average: 248.25 mg/L). Various hydrochemical types were observed within the graben, with the SO4·Cl-Na type predominant in Kanai, Woka, and Cuoba and the HCO3·SO4-Na type in Sangzhuling. In terms of hydrochemical types, the prevalent cation and anion in the geothermal water of the Woka graben are Na+ and SO42−, respectively.
(2)
Qiongduojiang graben
Geothermal water samples from Sewu and Qiuduojiang within the Qiongduojiang graben displayed different hydrochemical indicators. Sewu has a pH of 7.67, while Qiuduojiang has a pH of 6.69. The TDS values of Sewu and Qiuduojiang are 344 and 1739, respectively. The HCO3 concentrations are slightly different, with 177 mg/L for Sewu and 189 mg/L for Qiuduojiang and temperatures of 43 °C and 33 °C, respectively. Additionally, the concentrations of Na+, K+, Ca2+, Mg2+, Cl, and SO42− in the geothermal water of Qiuduojiang were considerably higher than those in the geothermal water of Sewu. Hydrochemical types for Sewu and Qiuduojiang were identified as HCO3·Cl-Na and Cl-Na·Ca types, respectively.
(3)
Northern Cuona graben
Geothermal water samples from the northern Cuona graben exhibited temperatures ranging from 42 to 85.5 °C (average: 76 °C), pH values falling between 6.34 and 8.67 (average: 7.54; predominantly neutral to slightly alkaline), and TDS contents varying from 169 to 1777 mg/L (average: 1198 mg/L). On average, these samples contained major cations of Na+ and Ca2+, followed by K+ and Mg2+, and major anions of Cl, followed by HCO3 and SO42−. The HCO3- concentrations varied from 12.0 mg/L to 593.9 mg/L for geothermal waters. Specifically, the geothermal water from the ZK251 borehole displayed a temperature of up to 163 °C and TDS content of 1777 mg/L, with higher concentrations of Na+, K+, Cl, and TDS content compared to other geothermal water in the graben. Conversely, the geothermal water from Geimu showed a minimum TDS value of 169 mg/L, suggesting significant mixing with low-TDS-content cold water.
(4)
Southern Cuona graben
Geothermal water samples from two sites in the southern Cuona graben presented slightly different hydrochemical indicators, with temperatures of 56 °C and 55 °C, pH values of 8.83 and 8.93, and TDS contents of 240 mg/L and 175 mg/L, respectively. In comparison to water from a borehole drilled in Cuona, spring water from Cuona exhibited higher concentrations of Na+, K+, HCO3, and SO42−, lower concentrations of Ca2+ and Cl, and equal concentrations of Mg2+. The geothermal water from the southern Cuona graben showed lower conventional ion contents compared to that from the northern Cuona graben. The hydrochemical types of geothermal water in the Cuona graben were identified as SO4·HCO3-Na and HCO3·SO4-Na types.
(5)
Geothermal water outside the grabens
Geothermal water outside the grabens was exclusively sampled from Zhegu, revealing a temperature of 42 °C, a nearly neutral pH value of 7.45, Na+-dominant cations, and HCO3-dominant anions. Its TDS content was 401 mg/L, higher than that of geothermal water from the southern Cuona graben and cold-spring water but lower than the average TDS contents of geothermal water from the Woka, Qiongduojiang, and northern Cuona grabens. The geothermal water outside the grabens was categorized as the HCO3·SO4-Na type.
(6)
Cold-spring water
Cold-spring water was solely sampled from the Woka graben and the south side of the Yarlung Zangbo suture zone. Water samples from Nos. 1 and 2 cold springs exhibited temperatures of 4 °C and 11 °C, pH values of 7.73 and 7.35, and TDS contents of 365 mg/L and 173 mg/L, respectively. The water samples from the No. 1 cold spring had higher concentrations of conventional ions compared to those from the No. 2 cold spring. The hydrochemical types of the two cold springs were identified as SO4·Cl·HCO3-Ca·Na and HCO3·SO4-Ca·Na types, respectively, without any significant dominant ions.
(7)
River water
River water samples displayed temperatures ranging from 4 to 11 °C (average: 7 °C), pH values between 7.76 and 9.65 (average: 8.38; slightly alkaline), and TDS contents ranging from 13 to 85 mg/L, with an average of 56 mg/L. Due to the fast flow rate of river water and low degree of water–rock interaction, the TDS contents of river water are considerably lower than those of geothermal and cold-spring water samples. Cation and anion concentrations ranked as follows: Ca2 > Na+ > Mg2+ > K+ and HCO3 > SO42− > Cl. Their dominant anions and cations were notably distinct from those in geothermal and cold-spring water samples. The hydrochemical types of river water samples were identified as HCO3-Ca·Na for Zengqiqu and HCO3-Ca for Jiaboxiongqu, Qienaqu, and Cuonaqu.

4.2. Isotopic Characteristics

(1)
Hydrogen and oxygen isotopes
Geothermal water samples from the study area exhibited δD values (Table 3) ranging from −161‰ to −128‰ (average: −147‰) and δ18O values varying from −20.2‰ to −12.0‰ (average: −17.7‰). Water samples from the Nos. 1 and 2 cold springs displayed δD values of −132.0‰ and −142‰ and δ18O values of −17.0‰ and −17.8‰, respectively. River water samples showed δD and δ18O values of −146‰ and −18.8‰, respectively.
(2)
Carbon isotopes
Geothermal water samples from the study area exhibited δ13C values between −7.3‰ and 2.5‰, averaging −2.5‰. Within the Woka graben, geothermal water samples showed δ13C values ranging from −6.5‰ to −3.5‰, with an average of −5.4‰. Despite both Sewu and Qiuduojiang being in the Qiongduojiang graben, their geothermal water exhibited significantly different δ13C values of −7.3‰ and 0.5‰, indicating distinct carbon sources. The northern Cuona graben’s geothermal water samples showed δ13C values ranging from −1.5‰ to 2.5‰ (average: 0‰), whereas Cuona’s samples displayed relatively constant δ13C values, suggesting a shared source. The geothermal water sample of Zhegu, located outside the grabens, exhibited a δ13C value of −4‰, and the river water samples from Zengqiqu yielded a δ13C value of −7.4‰.

5. Discussion

5.1. Recharge Source and Elevation of Geothermal Water

Due to the inherent presence of deuterium (D) and oxygen (O) as components of water, they offer a natural advantage in tracing the water source [16]. Craig [17] initially proposed a global meteoric water line (Equation (1)), widely employed for identifying water sources. Zheng SH et al. [18] established China’s meteoric water line (Equation (2)). Ning AF et al. [19] obtained a meteoric water line for the Lhasa River region based on the δD and δ18O values from 21 sets of meteoric water samples (Equation (3)), also testing the δD and δ18O values of meteoric water from various years monitored at the Lhasa rainfall monitoring station.
δD = 8 × δ18O + 10
δD = 7.9 × δ18O + 8.2
δD = 7.2 × δ18O + 12.36
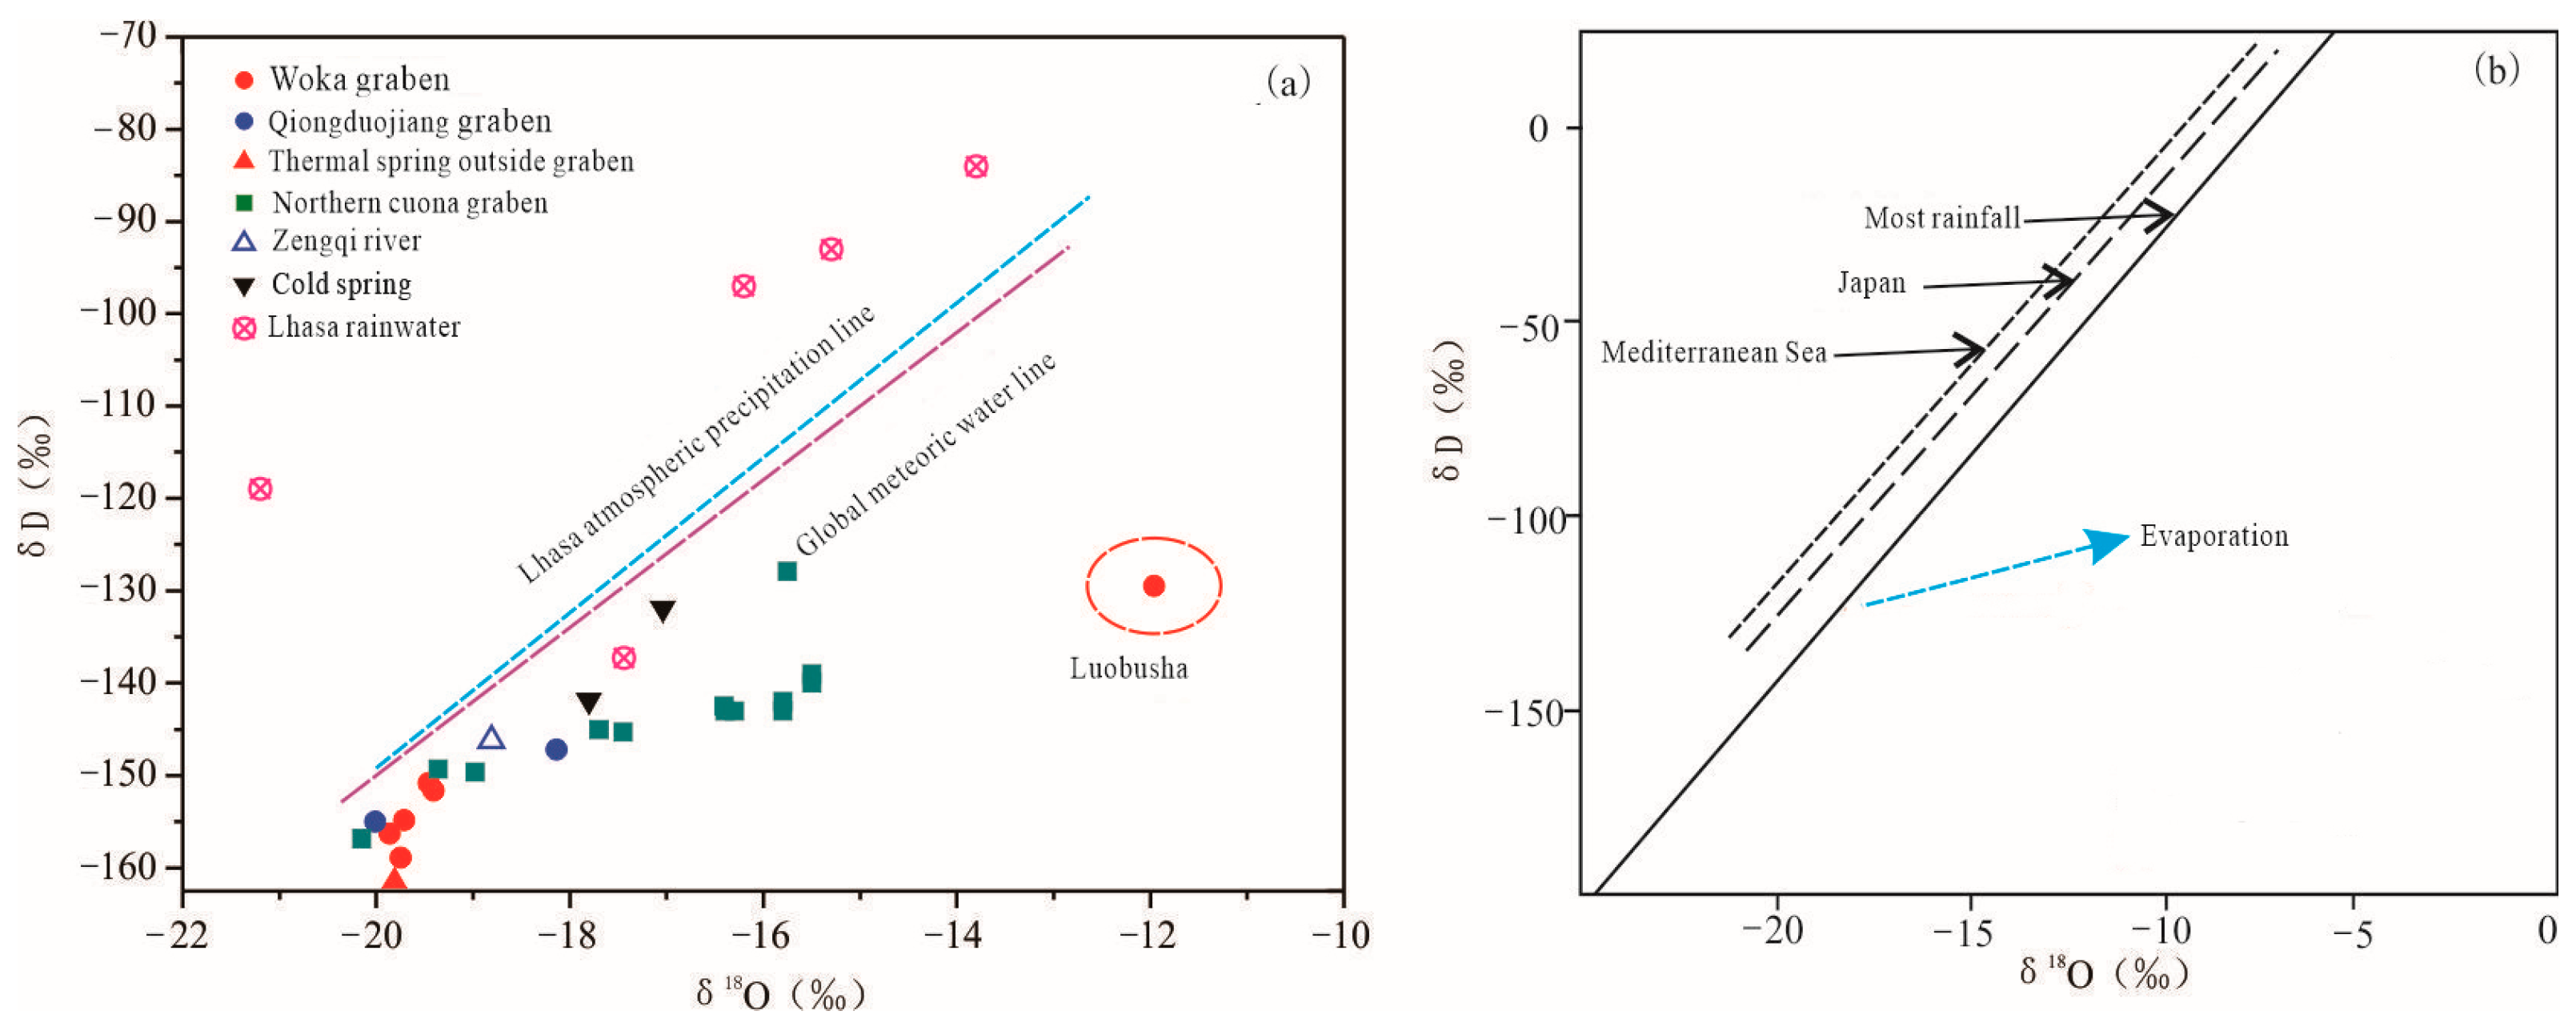
Generally, the δD and δ18O values of geothermal water typically deviate from meteoric water lines [20]. As illustrated in Figure 4a, the δD and δ18O values of geothermal water from all sampling sites in the study area fall to the right of the global, China’s, and Lhasa River region’s meteoric water lines. They are distributed along the evaporation line (Figure 4b), indicating that the recharge source of geothermal water at the sampling sites in the study area predominantly originates from meteoric water. However, all geothermal water samples exhibited lower δD and δ18O values compared to Lhasa’s meteoric water samples [20], suggesting that the recharge source is likely meteoric water formed from meteoric water at higher elevations. If cold-spring and river water in the study area had solely received recharge from meteoric water, their δD and δ18O values would be close to those of meteoric water or higher due to evaporation. However, they exhibited lower δD and δ18O values compared to the meteoric water monitored at the Lhasa meteoric water monitoring station. This suggests that they also received recharge from snowmelt at higher elevations, which subsequently mixed with local meteoric water.
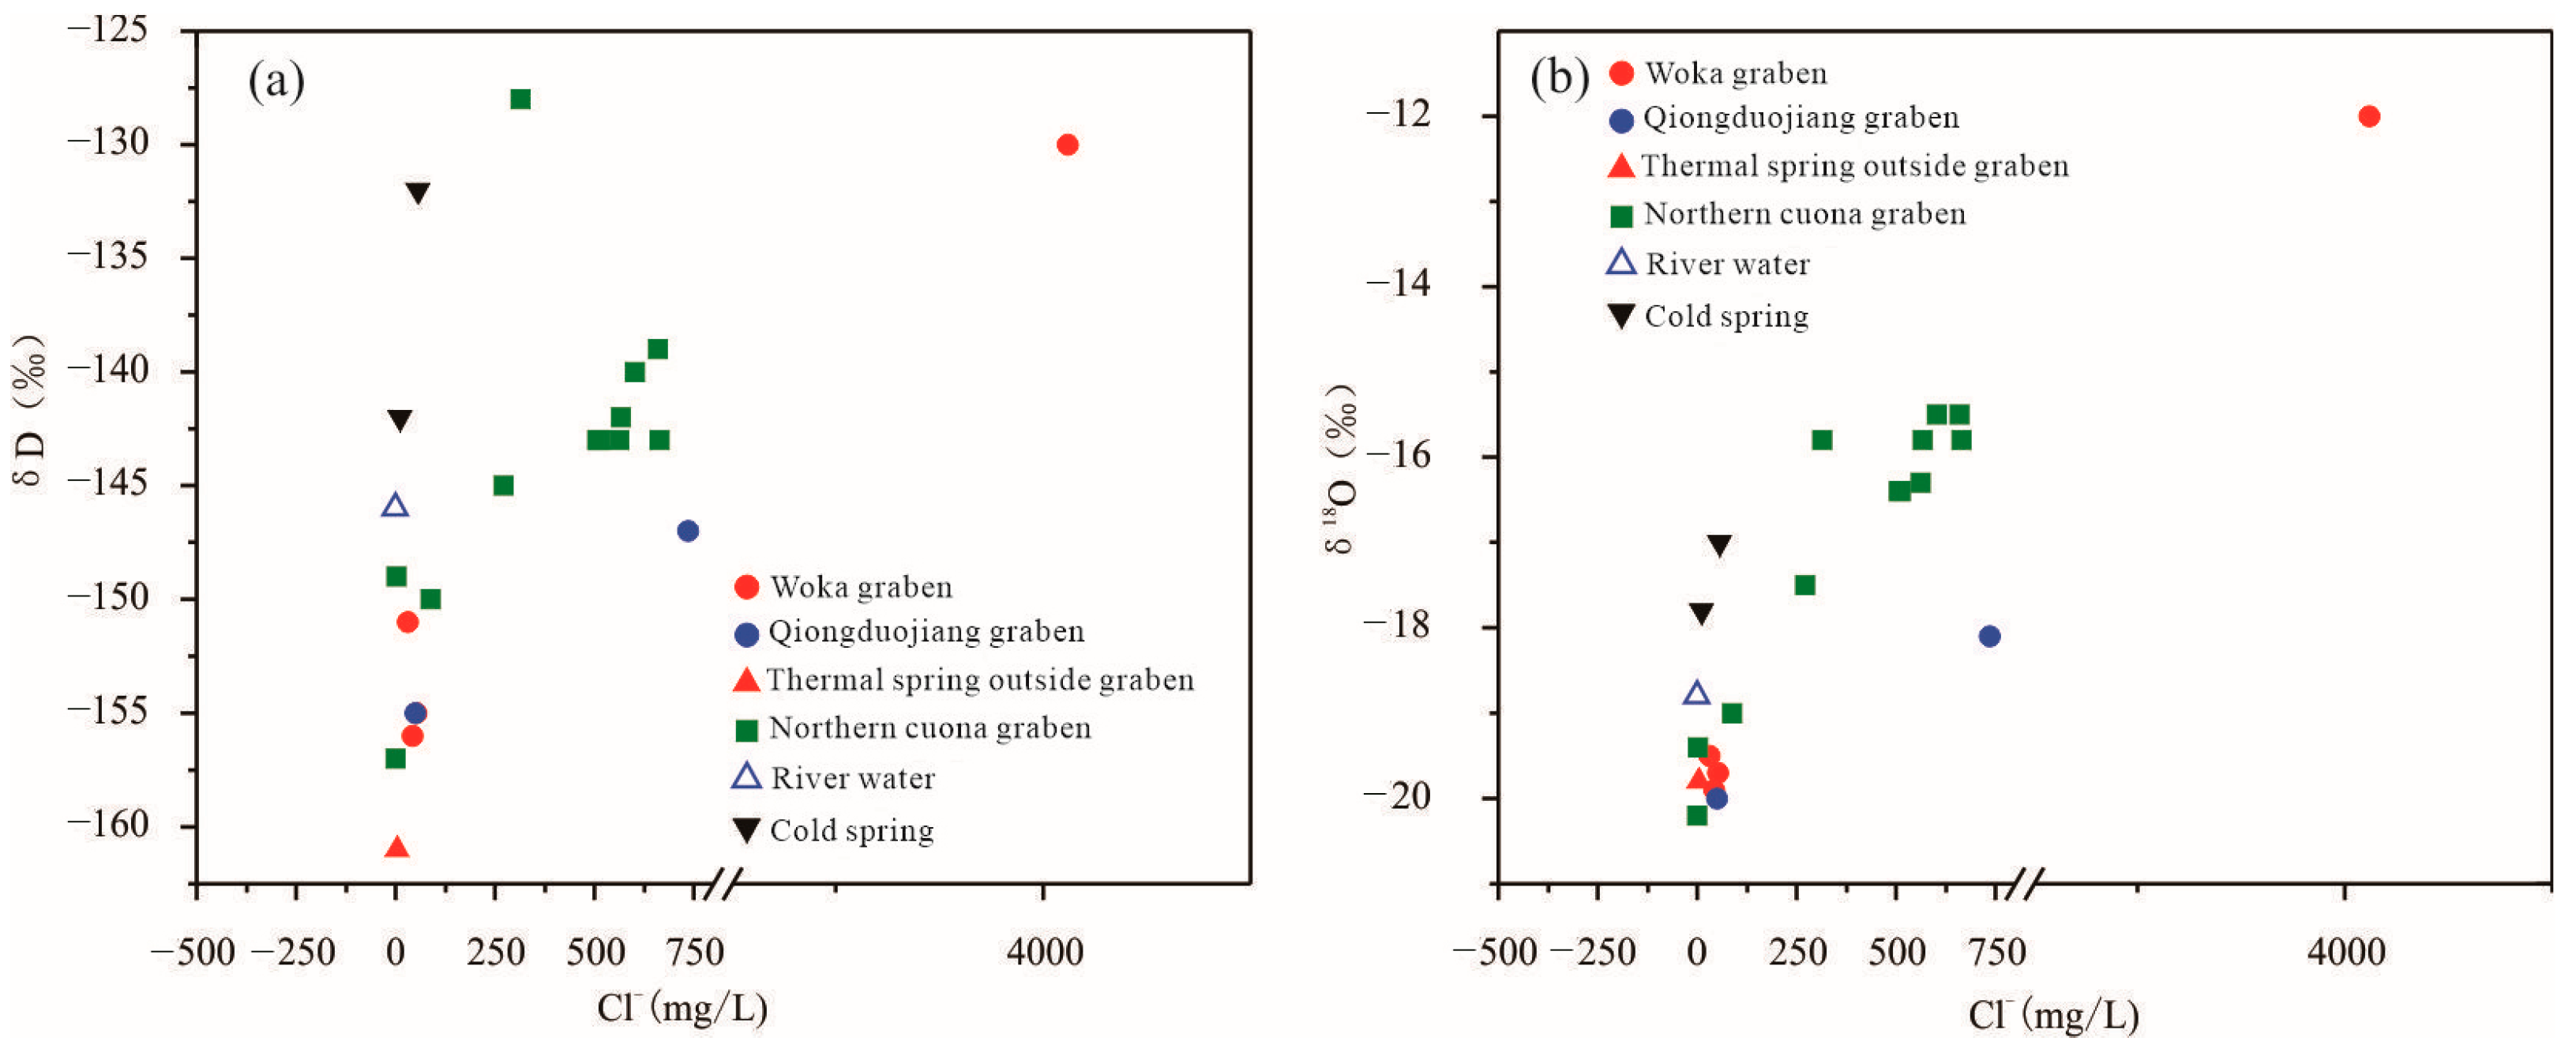
Considering that Cl is relatively stable and not easily adsorbed, it can be effectively used to examine the recharge source and evolution of geothermal water, particularly when combined with the end-element mixing model for stable isotopes [9]. The sources of Cl in geothermal water can be mainly divided into two categories: (1) magmatic volatiles and (2) Dissolution of salt minerals. When there is no rock salt formation in the local hot water circulation runoff pathway, the Cl content is usually positively correlated with the temperature of geothermal water. Based on the geological lithology and geochemical characteristics of geothermal water in the study area, it is indicated that the genesis of the geothermal water system in the study area is related to deep magmatic activity. Figure 5 illustrates the δD versus Cl (a) and δ18O versus Cl (b) relationships of geothermal water from the sampling sites in the study area. Overall, the δD and δ18O values of geothermal water exhibited an increase with rising Cl concentrations. A positive correlation was observed between Cl and water temperature, and the characteristic components of groundwater also showed an increase with higher Cl concentrations. This suggests that the participation of Cl, F, H2SiO3, Li, and B and the enrichment of δ18O in geothermal water originate from the same process. In this process, meteoric water likely recharged groundwater along fissure and fracture zones, accompanied by the involvement of thermal fluids enriched in Cl, F, H2SiO3, Li, B, and heavy isotopes at different depths. This led to more substantial water–rock interactions and higher geothermal reservoir temperatures. Geothermal water in the Woka and Cuona grabens exhibited low concentration, as illustrated in Figure 5a, indicating that they belong to distinct geothermal water systems.
The hydrogen and oxygen isotopic characteristics of groundwater recharged by meteoric water exhibit a significant elevation effect, calculated as follows:
H = δ G δ p K + h
where H denotes the calculated elevation of the recharge area for a groundwater sampling site. Considering that 18O in geothermal water is prone to react with surrounding rocks and generate “oxygen drift” during the cyclic runoff process, a more stable D is used to calculate the elevation of the geothermal water supply. δG represents the measured δD value of the groundwater in a sampling site, ‰; δp signifies the δD value of local meteoric water, ‰; h means the actual elevation of a sampling site, m; and K stands for the height-varying δD value of meteoric water, i.e., the height gradient, ‰/100 m. Owing to the monsoon climate of the study area, a warm and wet air current moves along the Yarlung Zangbo River valley and is influenced by the elevation effect (the uplift of the Qinghai-Tibet Plateau). This results in a gradual decrease in δD values of meteoric water, with a decline rate of −0.26‰/100 m with altitude [21]. The δD value of meteoric water in this study is −126‰, sourced from the meteoric water data of the Lhasa Meteorological Station [19].
The calculation results indicate that the recharge elevation of geothermal water in the study area varies from 4500 m to 6200 m, with an average value of 5400 m. Specifically, the recharge elevation is 5100–5300 m (average: 5200 m) in the Woka graben, 4500–6200 m (average: 5400 m) in the northern Cuona graben, and 5300–5500 m in the Qiongduojiang graben and outside the grabens (Table 4). Furthermore, the calculated recharge elevations of river and cold-spring water exceed their actual altitudes, supporting the notion that rivers and cold springs also received meteoric water recharge from higher elevations.

5.2. Subsurface Retention Time and Occurrence Environmentra of Geothermal Water

Throughout their migration, water vapor and precipitation may undergo changes in environmental conditions, resulting in an imbalance in the fractionation of gas- and liquid-phase isotopes. This leads to varying degrees of deviation between meteoric water lines of different regions and the global meteoric water line in terms of slope and intercept [22,23]. The deuterium excess parameter of geothermal water, also known as d, is the intercept of the local atmospheric precipitation line and an overall reflection of the degree of water–rock oxygen isotope exchange in the region. Therefore, it can be used to explore the degree of interaction between geothermal water and rock and then analyze the circulating runoff time of geothermal water [24]. The δ18O values of groundwater indicate its retention time in the same aquifer, allowing the d values to be employed for investigating water–rock interactions, groundwater dynamics, and surface runoff dynamics [25].
d = δD − 8 × δ18O
The slopes of the δD and δ18O fitted lines of geothermal water in the Woka and northern Cuona grabens are 3.28 (R2 = 0.93; p < 0.01) and 3.46 (R2 = 0.65; p < 0.01), respectively, showcasing typical geothermal water characteristics [26]. To analyze the deuterium excess parameter (d value) of geothermal water in the study area, the global meteoric water equation (d = 10‰) and the characteristics corresponding to d equaling to −40‰, −30‰, −20‰, 0‰, 10‰, and 20‰ were plotted. This facilitated the derivation of the δ18O-δD relationships of geothermal, cold-spring, and river water (Figure 6).
The d values of geothermal water from the Woka and northern Cuona grabens ranged from −0.86‰ to 4.88‰ (average: 2.63‰) and −16.6–5.58‰ (average: −7.51‰), respectively, confirming a longer subsurface retention time for geothermal water in the northern Cuona graben. Besides the retention time of groundwater in aquifers, the groundwater occurrence environment, such as temperature, also significantly influences the δ18O values of geothermal water. At low temperatures (<60 °C), the lagging isotope exchange between water and rock makes achieving isotopic equilibrium challenging, resulting in non-significant effects on δ18O values. Conversely, at high temperatures (>80 °C), groundwater can absorb energy from the surrounding environment during the runoff process. This leads to the destruction of hydrogen and oxygen atomic bonds inside water molecules, accelerating isotope exchange, causing increased δ18O values (oxygen drift) and reduced d values [27]. In Figure 6, it is observed that some geothermal water from northern Cuona grabens had a positive oxygen shift. This result may be due to the water–rock oxygen isotope exchange and boiling or steam loss during ascent. The d values of cold-spring and river water samples were between 0.5‰ and 4.42‰, indicating the influence of evaporation.

5.3. Carbon Sources of Groundwater

Dissolved inorganic carbon in groundwater primarily originates from atmospheric CO2, soil CO2 (mainly from root respiration, microbial activity, and organic matter decomposition), and carbonate rocks [28]. In active fault zones, geothermal water has a unique carbon source—mantle-derived CO2—compared to ordinary cold groundwater [29]. The δ13C values of atmospheric CO2, soil CO2, carbonate rocks, and mantle-derived CO2 are approximately −7‰, −25‰ (within a range of −16–−28‰), −3–3‰, and −11–−4‰, respectively [30].
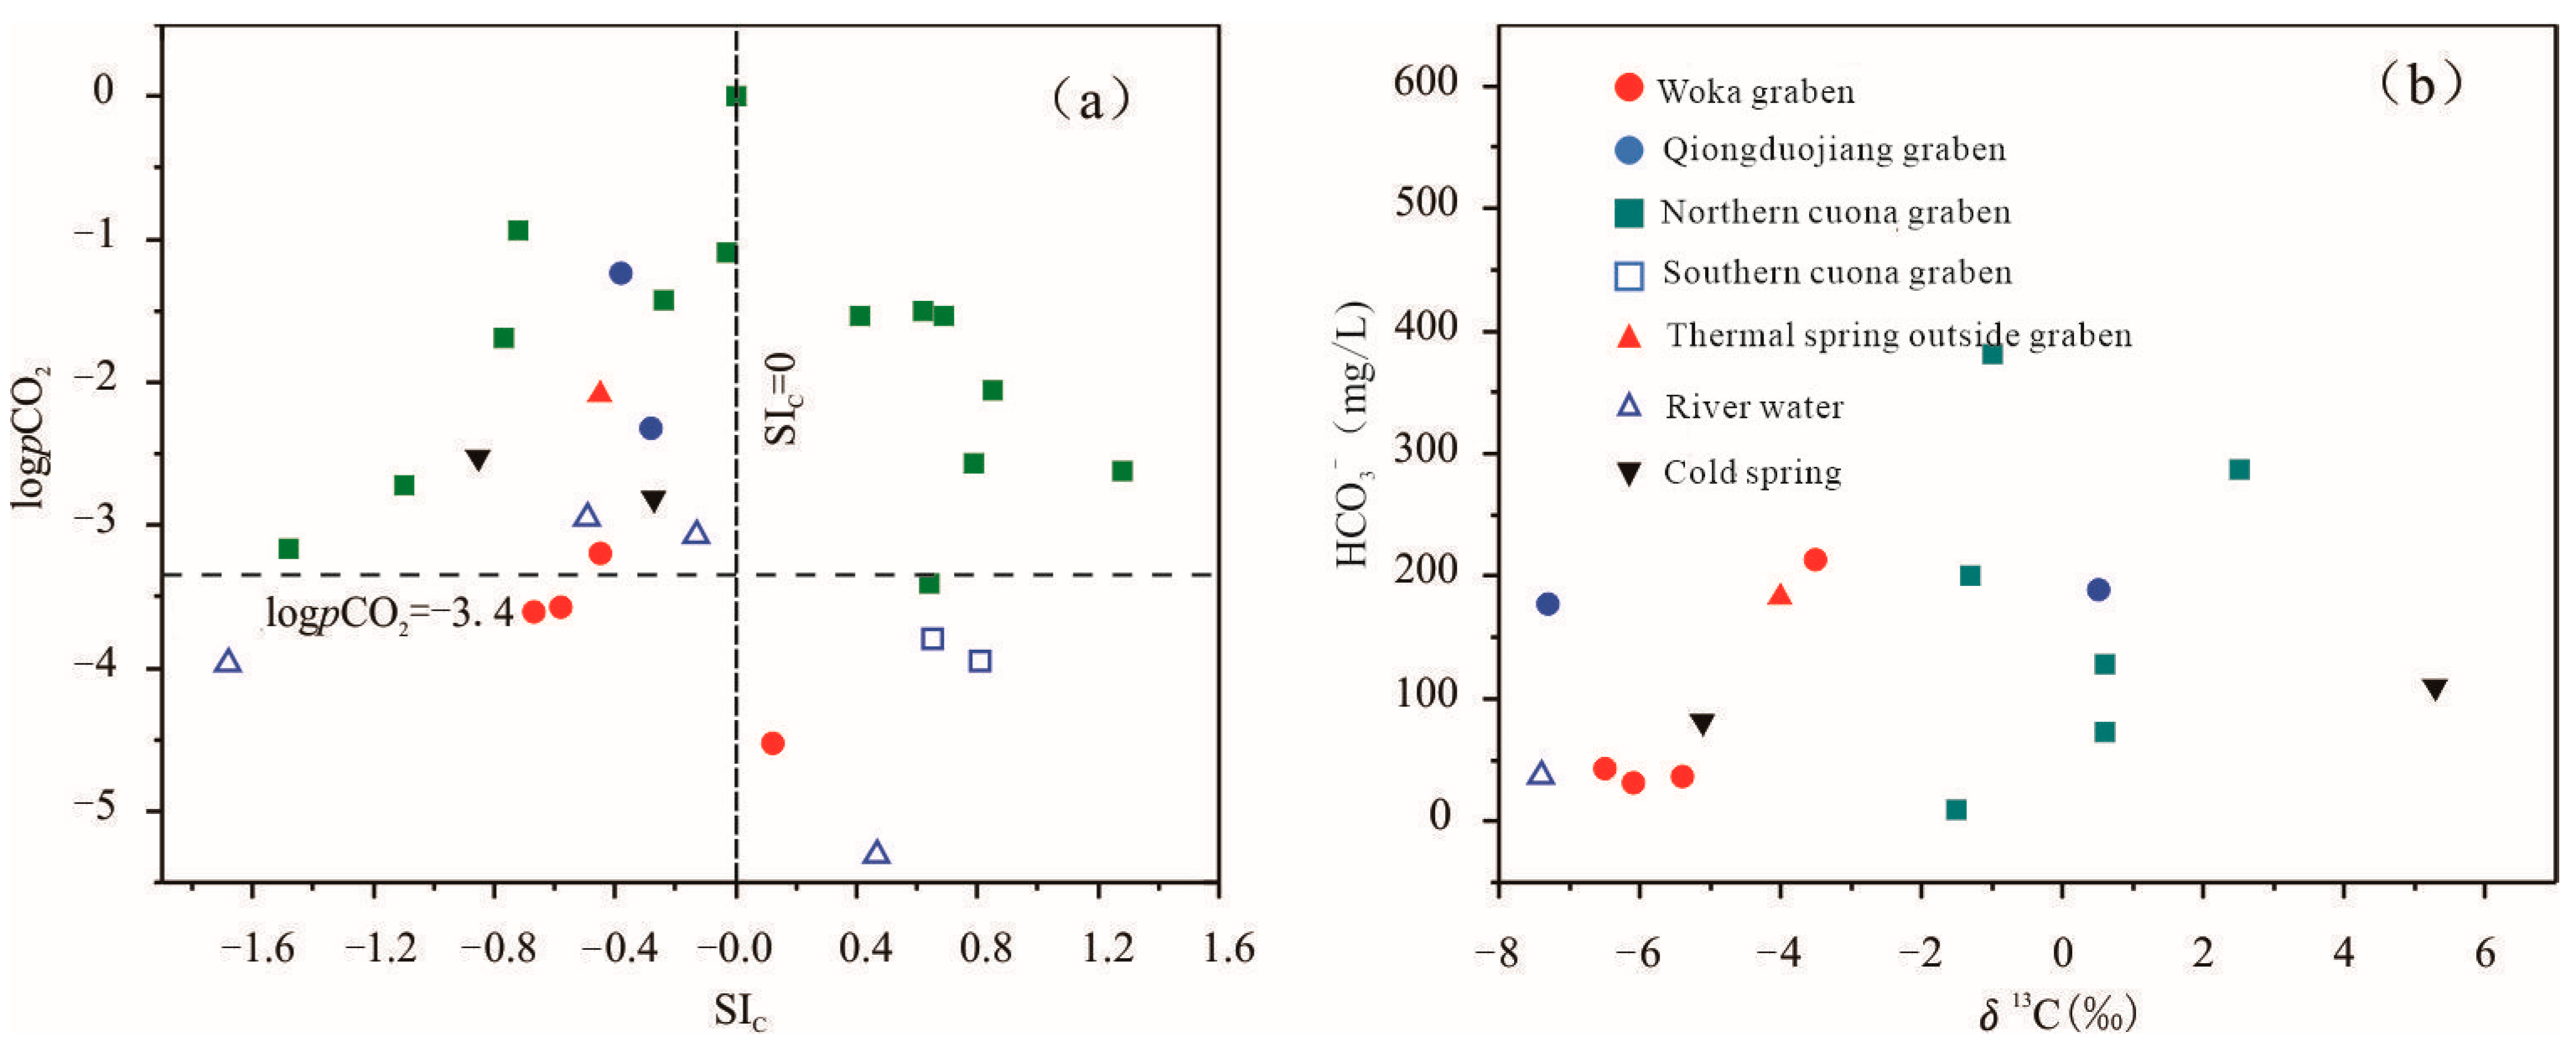
The calculated partial pressure of carbon dioxide (logpCO2) for geothermal water samples in the study area ranged from −4.5 to 0, with an average value of −2.4 (Figure 7a). The global atmospheric logpCO2 is approximately −3.4, while the high-altitude Qinghai-Tibet Plateau should have a lower logpCO2 value (<−3.4). Therefore, it is likely that most of the geothermal water in the study area underwent degassing after flowing out of the ground, suggesting minimal influence from atmospheric CO2. The δ13C values of geothermal water ranged from −7.3‰ to 2.5‰, averaging −2.5‰, which significantly deviated from the −25‰ of soil CO2, indicating negligible influence from soil CO2. The weak correlation between δ13C and HCO3 in geothermal water (Figure 7b) implies that the carbon in geothermal water is not solely derived from metamorphic carbon in carbonate rocks [31]. Considering the hydrogeological and geological conditions of geothermal water exposed in various locations, it is hypothesized that metamorphic carbon in carbonate rocks and mantle-derived CO2 are two carbon sources for geothermal water in the study area.
The proportions of the two sources of geothermal water can be approximately determined using the law of conservation of isotope mass (Equation (6)).
δ13Ctest = f × δ13Cmetamorphic + (1 − f)δ13Cmantle
where δ13Ctest denotes the actual test value of δ13C in geothermal water at a sampling site; δ13Cmetamorphic represents the δ13C value of carbonate rocks; δ13Cmantle signifies the δ13C value of mantle-derived CO2; f indicates the proportion of carbonate rock-derived metamorphic carbon in geothermal water; and 1 − f means the proportion of carbon from mantle-derived CO2 in geothermal water. As the δ13C values of carbonate rocks and mantle-derived CO2 in the study area were not analyzed, the δ13Cmetamorphic and δ13Cmantle values were assumed as 3‰ and −7.5‰, respectively, based on regional characteristics and previous findings [30].
Table 5 presents the following results of the calculation. In geothermal water samples from the Woka graben, the carbon predominantly originated from mantle-derived CO2, constituting 61–90% and averaging 80%. The geothermal water from two sampling sites in the Qiongduojiang graben exhibited distinct carbon sources, with mantle-derived CO2 accounting for 98% in Sewu and only 24% in Qiuduojiang, indicating differing carbon origins for the two sites. Geothermal water samples from the northern Cuona graben showed 5–42% (average: 29%) of mantle-derived CO2 and 58–95% (average: 71%) of metamorphic carbon from carbonate rocks, suggesting the latter as the predominant carbon source. Additionally, geothermal water from Zhegu outside the grabens was predominantly composed of mantle-derived CO2, constituting 67%.

5.4. Migration Pathways Indicated by Carbon Isotopes in Geothermal Water

In regions characterized by active crustal movements, such as those affected by volcanoes and earthquakes, CO2 originating from the deep Earth can be released to the surface through deep-seated fault zones. This results in geothermal water along active fault zones being enriched with mantle-derived CO2 [32]. The hydrothermal activity in Tibet is a consequence of the collisional orogeny between the Eurasian and the Indosinian plates, leading to geothermal fluids in the gas–liquid phase containing valuable information about the upper crust and mantle materials [33]. Geothermal water samples from the Woka graben, Sewu within the Qiongduojiang graben, and Zhegu outside the grabens were predominantly influenced by mantle-derived CO2. This suggests the presence of deep-seated fault zones serving as ascending pathways for mantle-derived CO2, indicating high connectivity between the crust and mantle. In contrast, geothermal water samples from the northern Cuona graben and Qiuduojiang within the Qiongduojiang graben displayed relatively high proportions of metamorphic carbon from carbonate rocks. Analyzing calcite, dolomite, and gypsum saturation indices, average values calculated from geothermal water samples of the Woka graben were −0.39, −1.99, and −2.43, respectively. These values suggest active water–rock interactions and a smooth flow of geothermal water in the Woka graben. Conversely, geothermal water samples from Gudui and Quzhuomu within the northern Cuona graben indicated calcite and dolomite saturation indices above 0, suggesting delayed water–rock interactions. In such cases, when geothermal water reaches the surface, mineral precipitation occurs due to rapid CO2 degassing, aligning with the sinter sedimentation at spring orifices. Furthermore, the boundary fault F5 in the northern portion of the Gudui geothermal field is an N-dipping high-angle normal fault. Along this fault, a set of carbonate rock interlayers is exposed, with thicknesses ranging from 50 to 100 m and an E–W extension of nearly 30 km. During the ascent of geothermal water along the fault, some carbonate rocks may dissolve in the runoff process, contributing to an increase in the calcite and dolomite saturation indices.

6. Conclusions

In this study, we conducted a comprehensive investigation of the geothermal system in the Woka-Cuona rift zone of southern Tibet. Through an integrated analysis of hydrogeochemical characteristics, isotopic features, and geological structures of geothermal waters, we have derived the following key findings:
  • The study area was divided into four distinct geothermal water system zones, each exhibiting unique hydrogeochemical characteristics. Geothermal waters in the Woka graben are characterized by elevated concentrations of Na+ and SO42−, indicative of high-temperature systems. Similarly, geothermal waters in the southern portion of the Qiongduojiang graben resemble those of the Woka graben, with Na+ as the dominant cation. Conversely, geothermal waters in the northern Cuona graben exhibit the highest temperatures and total dissolved solids content, along with significantly elevated levels of Na+, K+, and Cl, suggesting influence from deep magmatic activity.
  • Isotopic analyses reveal that geothermal waters primarily originate from meteoric water at higher elevations. Analysis of recharge elevations indicates that the grabens predominantly receive meteoric water from the surrounding mountains. Furthermore, discernible differences in isotopic values between geothermal waters in the Woka and northern Cuona grabens suggest an extended subsurface retention time for the latter.
  • Carbon isotopic analysis highlights diverse carbon sources. In the northern Cuona graben, carbon primarily originates from metamorphic carbon in carbonate rocks, whereas in other zones, carbon in geothermal waters is predominantly derived from mantle-derived CO2.
In summary, our study provides important insights into the origin mechanisms and hydrogeochemical characteristics of the geothermal system in the Woka-Cuona rift zone of southern Tibet. These findings hold significant implications for the scientific exploration and utilization of geothermal energy resources and offer new perspectives for further research in this field.

Author Contributions

Conceptualization, W.Z., J.P. and Y.L.; methodology, J.P. and Y.L.; software, W.Z.; validation, W.Z., Y.L. and J.P.; formal analysis, W.Z. and Y.L.; investigation, W.Z., J.P. and Y.L.; resources, W.Z.; data curation, Y.L. and J.P.; writing—original draft preparation, W.Z.; writing—review and editing, J.P.; visualization, W.Z.; supervision, Y.L.; project administration, W.Z. All authors have read and agreed to the published version of the manuscript.

Funding

This research was funded by the scientific research project entitled Research and Demonstration of Geological Disaster Prevention and Control Technologies for Tibet Autonomous Region, initiated by the Department of Natural Resources of Tibet Autonomous Region (grant No. [2020] 0890-1).

Data Availability Statement

The data presented in this study are available on request from the corresponding author. The data are not publicly available due to the sensitivity of the original data in the manuscript.

Acknowledgments

The authors wish to express their thanks to the director of the Department of Natural Resources of Tibet Autonomous Region, for his valuable assistance.

Conflicts of Interest

The authors declare no conflicts of interest.

References

  1. Chen, M.X.; Wang, J.Y.; Deng, X. Geothermal system type map and brief explanation in China. Geol. Sci. 1996, 2, 114–121. (In Chinese) [Google Scholar]
  2. Wang, G.L.; Zhang, W.; Liang, J.Y.; Lin, W. Evaluation of geothermal resource potential in China. Acta Geol. Sin. 2017, 38, 449–459. (In Chinese) [Google Scholar]
  3. Yang, B.; Li, W.; Xiong, J.; Yang, J.; Huang, R.; Xie, P. Health Risk Assessment of Heavy Metals in Soil of Lalu Wetland Based on Monte Carlo Simulation and ACPS-MLR. Water 2023, 15, 4223. [Google Scholar] [CrossRef]
  4. Pang, Z.H. Origin of High-Temperature Geothermal System in the Eastern Himalayan Structural Belt; Institute of Geology and Geophysics, Chinese Academy of Sciences: Beijing, China, 2020. (In Chinese) [Google Scholar]
  5. Wang, G.L.; Liu, Y.G.; Zhu, X. Current Status and Development Trends of Geothermal Resources in China. J. Earth Sci. Front. 2020, 27, 1–9. [Google Scholar]
  6. Tong, W.; Zhang, Z.F.; Zhang, M.T.; Liao, Z.J.; You, M.Z.; Zhu, M.X.; Guo, J.Y.; Liu, S.B. Geothermal Belt of the Himalayas. J. Peking Univ. 1978, 1, 76–89. (In Chinese) [Google Scholar]
  7. Tang, Z.M.; Han, T.L. Preliminary Division and Structural Characteristics of the Qinghai-Tibet Plateau. Bull. Chin. Acad. Geol. Sci. 1990, 21, 121–126. [Google Scholar]
  8. White, D. Hydrology, Activity, and Heat Flow of the Steamboat Springs Thermal System, Washoe County, Nevada; Center for Integrated Data Analytics: Middleton, WI, USA, 1968; pp. 1–116.
  9. Gu, W.Z.; Pang, Z.H.; Wang, Q.J.; Song, X.F.; Ye, L.J.; Zhang, Z.G.; Lu, J.J.; Lu, B.H.; Zhai, S.M. Isotope Hydrology; Science Press: Beijing, China, 2011. (In Chinese) [Google Scholar]
  10. Li, H.; Liu, M.; Jiao, T.; Xiang, D.; Yan, X.; Tang, Z.; Yang, J. Using Clustering, Geochemical Modeling, and a Decision Tree for the Hydrogeochemical Characterization of Groundwater in an In Situ Leaching Uranium Deposit in Bayan-Uul, Northern China. Water 2023, 15, 4234. [Google Scholar] [CrossRef]
  11. Sultan, K.; Faraj, T.; Zaman, Q. Ferric Oxyhydroxylsulfate Precipitation Improves Water Quality in an Acid Mining Lake: A Hydrogeochemical Investigation. Water 2023, 15, 4273. [Google Scholar] [CrossRef]
  12. Ding, L.; Satybaev, M.; Cai, F.L.; Wang, H.Q.; Song, P.P.; Ji, W.Q.; Xu, Q.; Zhang, L.Y.; Qasim, M.; Baral, U. Timing, Closure Style, and Process of the Initial Collision between India and Eurasia. Chin. Sci. Earth Sci. 2017, 47, 293–309. [Google Scholar]
  13. Zhang, J.; Santosh, M.; Wang, X.; Guo, L.; Yang, X.; Zhang, B. Tectonics of the Northern Himalaya since the India-Asia Collision. Gondwana Res. 2012, 21, 939–960. [Google Scholar] [CrossRef]
  14. Hou, Z.Q.; Cook, N.J. Metallogenesis of the Tibetan Collisional Orogen: A Review and Introduction to the Special Issue. Ore Geol. Rev. 2009, 36, 2–24. [Google Scholar] [CrossRef]
  15. ISO/IEC 17025:2017; General Requirements for the Competence of Testing and Calibration Laboratories. International Organization for Standardization: Geneva, Switzerland, 2017.
  16. Ren, K.; Pan, X.; Yuan, D.; Zeng, J.; Liang, J.; Peng, C. Nitrate sources and nitrogen dynamics in a karst aquifer with mixed nitrogen inputs (Southwest China): Revealed by multiple stable isotopic and hydro-chemical proxies. Water Res. 2022, 210, 118000. [Google Scholar] [CrossRef] [PubMed]
  17. Craig, H. Standards for reporting concentrations of deuterium and oxygen-18 in natural waters. Science 1961, 133, 1833–1834. [Google Scholar] [CrossRef] [PubMed]
  18. Zheng, S.H.; Hou, F.G.; Ni, B.L. Hydrogen and oxygen stable isotopes in precipitation in China. Chin. Sci. Bull. 1983, 13, 801–806. [Google Scholar]
  19. Ning, A.F.; Yin, G.; Liu, T.C. Distribution characteristics of atmospheric precipitation isotopes in the Lhasa River region. Acta Mineral. Sin. 2000, 20, 95–99. [Google Scholar]
  20. Zheng, S.H.; Zhang, Z.F.; Ni, B.L.; Hou, F.G.; Shen, M.Z. Hydrogen and oxygen stable isotope study of geothermal waters in Tibet. Acta Sci. Nat. Univ. Pekin. 1982, 1, 99–106. [Google Scholar]
  21. Liu, Z.; Tian, L.; Yao, T.; Gong, T.; Yin, C.; Yu, W. Temporal and spatial variations of δ18O in precipitation in the Yarlung Zangbo River basin. Acta Geogr. Sin. 2007, 62, 510–517. [Google Scholar] [CrossRef]
  22. Torres-Martínez, J.A.; Mora, A.; Knappett, P.S.; Ornelas-Soto, N.; Mahlknecht, J. Tracking nitrate and sulfate sources in groundwater of an urbanized valley using a multi-tracer approach combined with a Bayesian isotope mixing model. Water Res. 2020, 182, 115962. [Google Scholar] [CrossRef] [PubMed]
  23. Zhang, J.; Genty, D.; Sirieix, C.; Michel, S.; Minster, B.; Régnier, E. Quantitative assessments of moisture sources and temperature governing rainfall δ18O from 20 years′ monitoring records in SW-France: Importance for isotopic-based climate reconstructions. J. Hydrol. 2021, 591, 125327. [Google Scholar] [CrossRef]
  24. Liu, Z. Study on the Formation Mechanism of Typical High-Temperature Geothermal Systems in the Nimu-Nagqu Geothermal Belt, Tibet; Chinese Academy of Geological Sciences: Beijing, China, 2014. [Google Scholar]
  25. Yin, G.; Ni, S.J.; Zhang, Q.C. Deuterium excess parameter and its hydrogeological significance—A case study of Jiuzhaigou and Yele in Sichuan. J. Chengdu Univ. Technol. 2001, 28, 251–254. [Google Scholar]
  26. Wang, S.Q. Hydrogeochemical Processes and Formation Mechanisms of High-Temperature Geothermal Systems in Tibet; China University of Geosciences: Beijing, China, 2017. [Google Scholar]
  27. Xiao, K.; Shen, L.C.; Wang, P. Hydrogen and oxygen isotopes of lakes and geothermal waters in the arid region of southern Tibet. Environ. Sci. 2014, 35, 2952–2958. [Google Scholar]
  28. Ren, K.; Pan, X.D.; Zeng, J.; Jiao, Y.J.; Peng, C.; Liang, J.P. Carbon isotope geochemical characteristics of groundwater under different land uses in karst areas and their ecological significance. Environ. Sci. 2019, 40, 4523–4531. (In Chinese) [Google Scholar]
  29. Shangguan, Z.G.; Gao, S.J. Carbon isotope seismogeochemical characteristics of hot springs in the Dianxi experimental field. Earthquake 1987, 6, 27–37. [Google Scholar]
  30. Liu, Z.H.; Yuan, D.X.; He, S.Y.; Zhang, M.L.; Zhang, J.G. Geochemical characteristics of the geothermal CO2-water-carbonate rock system and its CO2 sources—A case study of Huanglonggou Kangding in Sichuan and Xiagei in Yunnan. Sci. China 2000, 30, 209–214. [Google Scholar]
  31. Zhang, Y.H. Genesis and Exploitation of the Kangding-Moxi Segment of the Xianyu River Fault Geothermal System; Chengdu University of Technology: Chengdu, China, 2018. (In Chinese) [Google Scholar]
  32. Frondini, F.; Caliro, S.; Cardellini, C.; Chiodini, G.; Morgantini, N. Carbon dioxide degassing and thermal energy release in the Monte Amiata volcanic-geothermal area (Italy). Appl. Geochem. 2009, 24, 860–875. [Google Scholar] [CrossRef]
  33. Shen, L.C.; Wu, K.Y.; Xiao, Q.; Yuang, D.X. CO2 degassing in the geothermal anomaly area of Tibet: A case study of Langju and Dagejia geothermal areas. Chin. Sci. Bull. 2011, 56, 2198–2208. [Google Scholar]
Figure 1. Location map showing geological formations and topography of the study area.
Water 16 01395 g001
Figure 2. Geologic sketch map of the study area.
Water 16 01395 g002
Figure 3. Water chemistry Piper diagram illustrating the composition of water samples in terms of major ions (The TDS of water samples in the northern Cuona graben were detected, with TDS values reflected by the size of the symbol. TDS unit: mg/L).
Water 16 01395 g003
Figure 4. Dissolved oxygen (D-O) relationship among sampling points within the study area. (a) Illustrates the δD and δ18O values of geothermal water from all sampling sites in the study area. (b) Displays the distribution of these values along the evaporation line. ((b) adapted from [20]).
Water 16 01395 g004
Figure 5. Correlation between isotopic composition (δD and δ18O) and chloride concentration (Cl) at sampling points. (a) Illustrates the δD versus Cl relationship of geothermal water from the sampling sites in the study area. (b) Illustrates the δ18O versus Cl relationship of geothermal water from the sampling sites in the study area.
Water 16 01395 g005
Figure 6. Spatial distribution of δ values across sampling points.
Water 16 01395 g006
Figure 7. Relationship between saturation index for calcite (SIc) and the logarithm of partial pressure of CO2 (logpCO2) (a), and between the isotopic composition of bicarbonate (δ13C-HCO3) at sampling points (b).
Water 16 01395 g007
Table 1. Information on the collected samples, including sample type, location, elevation of spring outlet, the elevation of the borehole, and the temperature.
LocationNameSample TypeElevation/mTemperature/
°C
Woka grabenKanaiHot spring393351.96
Cuo BaHot spring398836.25
WokaHot spring392052.65
Qiongduojiang grabenSewuHot spring440043.21
QiongduojiangHot spring444032.79
Geothermal water outside the grabensZheguHot spring460042.12
Northern Cuona grabenRiruoHot spring444081
Re RongHot spring424866
GuDui Q003Hot spring438885.1
GuDui Q006Hot spring438885.7
GuDui Q007Hot spring438885.3
GuDui Q012Hot spring438885.3
GuDui Q010Hot spring438884.9
GuDui ZK251Borehole water437585.5
Neizong CuoHot spring502042.0
GeimuHot spring495058.65
MuluHot spring470045.0
ShuxinHot spring432045.21
Qu Zhuo MuHot spring436079.0
Woka grabenZengqiquSurface water40280.15
Woka grabenCold spring 1Cold spring39543.58
Cold spring 2Cold spring387511.32
Table 2. Hydrochemical properties and main chemical constituents of water samples from the study area (temperature in °C, and other parameters in mg/L except pH).
LocationName pHTDSCaMgNaKClSO4HCO3
Woka grabenKanai8.253235.240.03110.901.9031.042.5147.00
Cuo Ba8.253277.690.09106.001.9743.052.7137.00
Woka7.9522312.20.4463.851.4837.031.894.4
Qiongduojiang grabenSewu7.673449.921.0185.004.43177.0049.95.2
Qiongduojiang6.691739219.7031.62452.7070.75189.00735.00135.00
Geothermal water outside the grabensZhegu7.45116911.41.57267.0011.5183.003.914.3
Northern Cuona grabenRiruo7.17152029.37.77370.0042.412.00511.00203.00
Re Rong7.44132824.5619.15455.2067.88381.36560.72201.82
GuDui Q0038.6715369.6417.54405.5473.71115.32562.53201.81
GuDui Q0068.3716269.6417.54490.2585.57299.84602.52180.80
GuDui Q0077.57152919.8221.44489.6079.11461.29562.24223.36
GuDui Q0128.37164932.1417.54486.1575.35288.31558.82214.43
GuDui Q0107.46177754.6323.39456.8573.95593.90565.67177.15
GuDui ZK2518.5132817.5423.41566.7085.95512.54658.54168.18
Neizong Cuo7.2116939.537.17150.6016.79.01.0108.00
Geimu6.7999332.3812.3838.673.2773.02.7042.7
Mulu6.63695160.0027.29246.0025.91287.00272.00118.00
Shuxin6.34125585.7312.38182.8013.25201.0088.1212.00
Qu Zhuo Mu7.471169177.6016.46205.3033.06128.00315.00444.00
Woka grabenZengqiqu9.654212.31.614.981.0937.01.102.60
Woka grabenCold spring 17.7336558.1712.7864.083.77110.057.60114.0
Cold spring 27.3517332.748.1937.020.5982.011.1042.3
Table 3. Isotope composition (δD and δ18O) and d values of sampling points in the study area.
LocationThermal SpringδD/‰δ18O/‰Elevation/mReference Value/‰d Value/‰
Woka grabenKanai−156−19.93933−1262.6
Cuo Ba−151−19.53988−1264.9
Woka−155−19.73920−1262.9
Qiongduojiang grabenSewu−155−20.04400−1265.1
Qiongduojiang−147−18.14440−126−2.1
Geothermal water outside the grabensZhegu−161−19.84600−126−2.9
Northern Cuona grabenRiruo−143−16.44440−126−11.2
Re Rong−145−17.74248−126−3.4
GuDui Q003−143−16.44388−126−11.8
GuDui Q006−140−15.54388−126−16.0
GuDui Q007−143−16.34388−126−12.6
GuDui Q012−143−15.84388−126−16.6
GuDui Q010−142−15.84388−126−15.6
GuDui ZK251−139−15.54375−126−15.0
Neizong Cuo−157−20.25020−1264.4
Geimu−149−19.44950−1265.6
Mulu−145−17.54700−126−5.7
Shuxin−150−19.04320−1262.2
Qu Zhuo Mu−128−15.84360−126−1.9
ZengqiquRiver Water−146−18.84028−1264.3
Cold-spring waterCold spring 1−132−17.03954−1264.4
Cold spring 2−142−17.83875−1260.5
Table 4. Elevation of geothermal water recharge in different zones.
NumberRegion NameRecharge Elevation (m)Surrounding Peaks
1Woka graben5100–5300 m, averaging 5200 m5200–5500 m
2Qiongduojiang graben5300–5500 m5200–5700 m, with the highest peak at 6635 m (La Xiangbo Qingri Peak)
3Northern Cuona graben4500–6200 m, averaging 5450 m4300~6400 m, with the highest peak at 6537 m (Kongbu Gangri Peak)
4Extrathermal-Zhegu6000 m6635 m (La Xiangbo Qingri Peak)
Table 5. δ13C values, proportions of metamorphic carbon, and mantle-derived carbon.
LocationThermal SpringSICSIDSIGlog(pCO2)δ13CMetamorphic Carbon ProportionMantle-Derived Carbon Proportion
Woka grabenKanai−0.67−3.27−2.41−3.61−6.113%87%
Woka−0.58−2.73−2.32−3.57−6.510%90%
Cuoba−0.45−2.04−2.17−3.20−5.420%80%
Sangzhuling0.12−0.40−3.35−4.53//
Qiongduojiang grabenSewu−0.28−1.20−3.59−2.32−7.32%98%
Qiongduojiang−0.24−0.97−1.28−1.430.576%24%
Northern Cuona grabenRiruo−1.10−2.82−1.53−2.72 71%29%
Gudui Q0040.410.84−1.79−1.54−1.062%38%
Gudui Q0050.641.49−2.09−3.41///
Gudui Q0060.791.86−2.23−2.57///
Gudui Q0070.621.25−1.80−1.50///
Gudui H0081.282.30−1.63−2.62///
Gudui Q0100.691.34−1.65−1.54///
Gudui ZK2510.000.000.000.00///
Neizongcuo−1.48−3.36−1.75−3.16−1.558%42%
Geimu−0.77−1.71−2.08−1.690.677%23%
Mulu−0.03−0.48−1.35−1.092.595%5%
Shuxin−0.72−1.93−1.27−0.94−1.360%40%
Quzhuomu0.850.69−0.59−2.060.677%23%
Southern Cuona grabenCuona spring0.650.55−2.24−3.79///
Cuona-drilling0.810.79−2.46−3.95///
Geothermal water outside the grabensZhegu−0.45−1.42−3.13−2.09−4.033%67%
RiverZengqi river0.47−0.05−3.60−5.31−7.4//
Jiaboxiong river−0.13−0.99−3.21−3.08///
Qiena river−1.68−99.99−4.97−3.97///
Cuona river−0.49−1.89−2.63−2.95///
Note: ‘/’ denotes missing data.
Disclaimer/Publisher’s Note: The statements, opinions and data contained in all publications are solely those of the individual author(s) and contributor(s) and not of MDPI and/or the editor(s). MDPI and/or the editor(s) disclaim responsibility for any injury to people or property resulting from any ideas, methods, instructions or products referred to in the content.