Abstract
Variable and complex marine environmental loads combined with wave resistance and the insufficient controllability of large caisson structures pose serious challenges during maritime towing. Cable breakage events are common, and improper behaviors could give rise to a variety of accidents. This work explored the dynamic responses of large caisson structures following towing cable breakage under irregular waves combined with harsh currents. Two types of cable breakage, i.e., main bridle and towing bridle breakage, were taken into account. Four potential wave–current combinations were assumed for each situation according to direction. The obtained results show that drag rope breakage could give rise to lateral shifts in the structure, which can become a serious condition when exposed to angled waves. Additionally, following breakage, significant force fluctuations took place in the remaining intact cables. For main cable breakage, both lateral and backward displacements were observed in the structure, which gradually entered a ‘flowing with the wave’ state. Furthermore, under the two abovementioned cable breakage conditions, the structure air gap consistently exceeded 2.3 m, ignoring the possibility of a wave slamming event.
1. Introduction
Caisson towing, which is extensively employed in maritime operations such as offshore operations and port construction, includes the transportation of large watertight structures under water for different reasons and goals. During this process, however, several challenges can be faced. One critical challenge is towing cable breakage under harsh environmental conditions, wear, fatigue, and high tension. Such breakage events could incur great economic loss due to potential damage to the vessel and caisson, as well as replacement expenses, which pose serious threats to crew safety, undersea infrastructure, and marine ecosystems [1,2]. Understanding the challenges and importance of caisson towing in maritime activities makes it urgent to perform detailed investigations on this topic. Hence, the aim of the current review was to explore the intricate studies performed on caisson towing and of the frequently faced cable breakage phenomenon in marine engineering, with special focus on repercussions, complexities, and prospective solutions.
A study on large-scale marine structure towing has provided significant insights into their drag resistance and stability. The works of Park [3,4,5] and Lyu [6] revealed the importance of the drag coefficient, power requirements, and stability during the towing process, suggesting reliable and practical methods for the wet-towing process. Strandhagen et al. [7] applied the linear theory to evaluate the stability of a towing system and suggested adjustments for improving it. Also, Inoue et al. [8,9,10] considered the elasticities of towing lines and the weights of towed objects as key factors in multi-tugboat towing systems.
The effect of waves on caisson motion responses has also been studied. Huang et al. [11,12] investigated anchor and cable systems for huge caisson installations, while Ko-take et al. [13] applied a complex interaction model to evaluate the motions of small caissons. Meneses et al. [14] developed a dynamic positioning control system for floating caissons during sinking, focusing on its effect on maneuver success and safety. Nakamura et al. [15] proved a beneficial caisson oscillation modulation in irregular waves by employing extended footings. Also, Heo [16] studied wet-towed caisson deck wetness under such wave conditions.
Recently, the dynamic responses of various marine installations during wet towing have been studied. Ding et al. [17] explored the stability of submerged tension leg platform wind turbines (STLPWTs) under harsh sea conditions, while Le et al. [18] studied the favorable towing performance of submerged floating offshore wind turbines (SFOWTs) under the effect of waves 5 m in height. Previous research works were found to be mainly focused on the forces exerted on the cables attached to marine structures and safety issues during the process of caisson towing. However, few research studies have been conducted on cable breakage during structure floatation. In the current work, the ANSYS AQWA (2019 R3) software was applied to study a caisson, specifically focusing on structure movement responses after cable breakage under extreme current conditions. Variations in dynamic parameters related to floatation safety, such as the structure speed, air gap, and movement trajectory under two special scenarios of bridle cable breakage and main cable breakage were the primary areas of interest.
2. Numerical Methods and Verification
The time-domain equation of the motion of the caisson structure during towing can be expressed as follows:
where is the total kinematic mass matrix of the structure, is the mass matrix of the main body of the structure; is the additional mass matrix, is the wave radiation damping matrix, is the linear damping matrix, is the hydrostatic stiffness matrix, is the displacement vector; is the vector function, and is the excitation force. Specific components are given in the following equation:
where is the wind force; is the flow force; is the wave force; and is the other external forces.
In numerical simulations, the potential flow theory was applied to calculate wave radiation and diffraction forces on the structure, while fluid viscous forces were determined using the below equation. Due to the small wind-affected area of the structure, the influence of the wind force was ignored.
where is the seawater density (1025 kg/m3 in this research), is the sea’s current speed relative to the structure, and are the longitudinal and lateral projected areas of the structure beneath the still water surface, respectively, is the caisson length, and , , and are yawing, surge, and sway moment coefficients on the structure under the effect of sea currents, respectively. For more details on the numerical computation theory, refer to the AQWA Theory Manual and the research performed by Gu [19].
The Joint North Sea Wave Project (JONSWAP) spectrum was employed as a wave spectrum. Experimental parameters γ and α, along with the peak frequency, were also employed. The spectral ordinate at any frequency was expressed as follows:
where is the peak frequency, is the peak enhancement factor, and is a constant value depending on the peak frequency of the wave spectrum and wind speed. The following equations were also stated:
The starting and ending frequencies were stated as follows:
where is the weighting function, and weighting function values against are available in the AQWA Theory Manual.
In order to verify the effectiveness of the proposed numerical computational model in dealing with the towing motion response problem of marine structures, numerical model validation was carried out with reference to the results of the physical modeling test of Zhu et al. [20] on the towing of a triangular-type power transmission platform. The numerical computational model based on the actual dimensions is shown in Figure 1. Considering that the coupling effect between the motion of the tugboat structure and the motion response of the structure was not addressed in the original literature, the tugboat structure was replaced by a node moving at a constant speed in the numerical simulation. The wave elements and speed parameters for numerical calculations are the same as those in the literature, i.e., forward regular waves, a wave height of 2 m, a wave period between 4.5 s and 8.5 s (varying every 1 s), and a towing speed of 2 m/s. The motion responses of the anchor structure and the platform structure in the longitudinal oscillation, pendulum oscillation, and longitudinal rocking directions for the various working conditions are compared with the results of the physical model tests. The RAOs (Response Amplitude Operators) of the anchor structure and platform structure in the longitudinal, vertical, and longitudinal rocking directions for each working condition are shown in Figure 2.
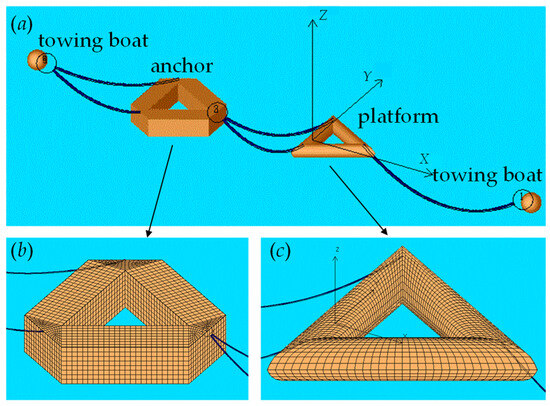
Figure 1.
Numerical model of Zhu’s towing system. Note: (a) total towing system; (b) numerical model of anchor; (c) numerical model of platform.
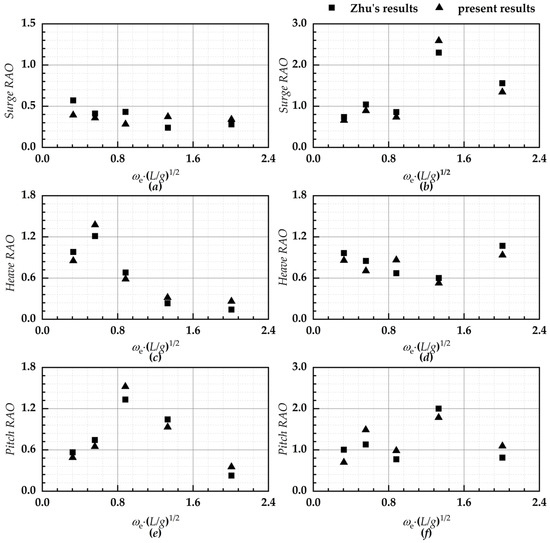
Figure 2.
A xomparison of the RAOs between Zhu’s experimental results and the present results. Note: (a,c,e) the results of the anchor; (b,d,f) the results of the platform.
Figure 2 demonstrates a comparison between the numerical calculation results in this paper and the test results of the physical model in the literature. In the figure, the numerical calculation results are in good agreement with the test results under most working conditions, and the error is within 10%. The error is mainly due to the fact that in the literature, the structure in the start-up phase of the towing belt quickly enters the towing belt stability under the action of artificial assistance, and it is difficult to make the numerical calculation and the test completely consistent, so there is a difference between the numerical calculation in the start-up phase and the test results. At the same time, the stabilized towing time for each group of tests is not long, which makes the results of the start-up phase account for a larger part of the statistical results. These reasons lead to the difference between the numerical calculation and the statistical results of the test.
3. Numerical Model and Working Conditions
3.1. Caisson Model
The coordinate systems used in the research are listed in Figure 3. Also, Figure 4 illustrates the towing system investigated in the current work. The towing rope was made of a mix of steel wire with a large diameter, and its cross-section is shown in Figure 5. One end of the bridle cable was attached to the caisson with the main parameters presented in Table 1, while the other end was connected to the main cable through a triangular plate. Surface elements were applied to model all studied structures. The surface element size was set to be 1 m based on the findings of the grid sensitivity analysis presented in [20].
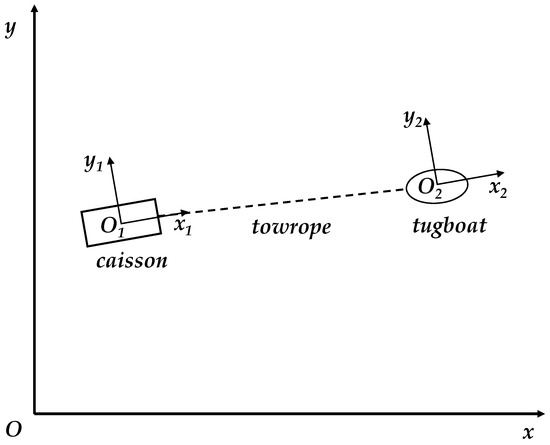
Figure 3.
The coordinate systems applied in the research.
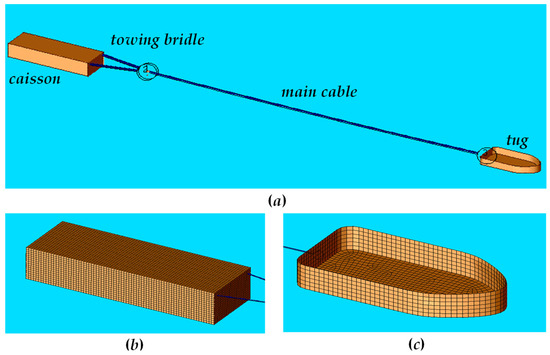
Figure 4.
Numerical model of wet-towing system. Note: (a) wet-towing system; (b) elements of caisson; (c) elements of tug.
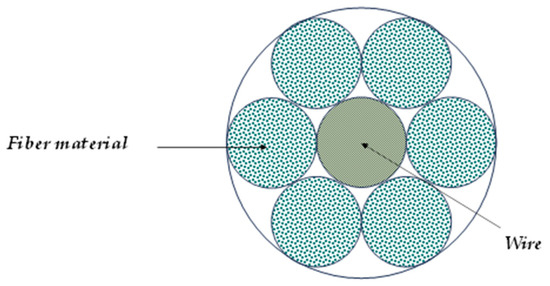
Figure 5.
A schematic diagram of the cross section of the cable.

Table 1.
The main parameters of the caisson.
Zhao et al. [21] conducted a model test study on the towing performance of a 200,000-ton floating production, storage, and offloading (FPSO) unit in the South China Sea using a 1:80 scale model. They meticulously measured the FPSO’s sway and pitch under static water conditions and sea state five, focusing on three configurations of whisker cable angles—significantly greater than 60°, close to 60°, and significantly less than 60°. The study discovered that at a whisker cable angle close to 60°, the FPSO exhibited optimal sway performance in both static water and sea state five conditions. Zhang et al. [22] investigated the effect of towing point locations on the structural motion response of a 2 m high meteorological mast platform during transit. Their results showed that a towing point near the static water surface reduced the pitch motion, whereas positions that were either too low or too high exacerbated it. According to the CCS towing guidelines [23], the appropriate lengths for whisker and main cables are 20 m and 150 m, respectively, with towing points ideally positioned near the static waterline on both sides of the structure.
3.2. Working Conditions
During towing at high water flow speeds, both the towing system cable tension and structure drag resistance were correspondingly increased, resulting in a higher possibility of a cable breakage phenomenon. In this research, variations in structural motion responses under the two conditions [24] of main cable breakage and towing bridle breakage were investigated. It was supposed that the cable breakage moment occurred 1.5 h after the beginning of stable towing. When investigating towing bridle breakage, the broken cable was the one which was exposed to greater force at the breakage moment. All of the towing plans are presented in Figure 6.
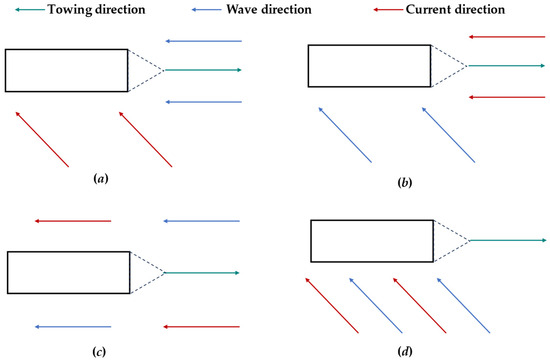
Figure 6.
Wave and current direction distribution diagram. Note: (a) TWD_180; (b) TWD_135; (c) TWS_180; (d) TWS_135.
This study assumes that the towing engineering construction site is located in the South China Sea region. According to the Ministry of Natural Resources South China Sea Bureau [25], the annual average significant wave height from 1991 to 2021 was 1.1 m, categorized as sea state three. Additionally, the research by Huang et al. [26] indicates that the peak period of the wave spectrum in some areas of the South China Sea ranges from 6 s to 10 s. Considering the potential resonance phenomena when the wave period is close to the structure’s natural period, this study selects a wave spectrum peak period of 7 s. Details of the specific sea conditions are presented in Table 2.

Table 2.
Cases that were studied.
4. Numerical Results
4.1. Caisson’s Dynamic Responses after Towing Bridle Breakage
Firstly, an in-depth analysis of the dynamic response was conducted after the towed structure changed due to towing bridle breakage. Specifically, it was assumed that no manual interventions were made following bridle cable breakage; i.e., the towing vessel speed remained constant. Figure 7 shows fluctuations in the velocity of the structure along the X, Y, and Z axes within the first 30 min after bridle cable failure. Figure 8 shows the changes in both the structure movement trajectory and air gap size during this time period. Furthermore, Figure 9 presents a detailed account of how the forces on the remaining two unbroken cables changed during the towing process after one bridle cable failed.
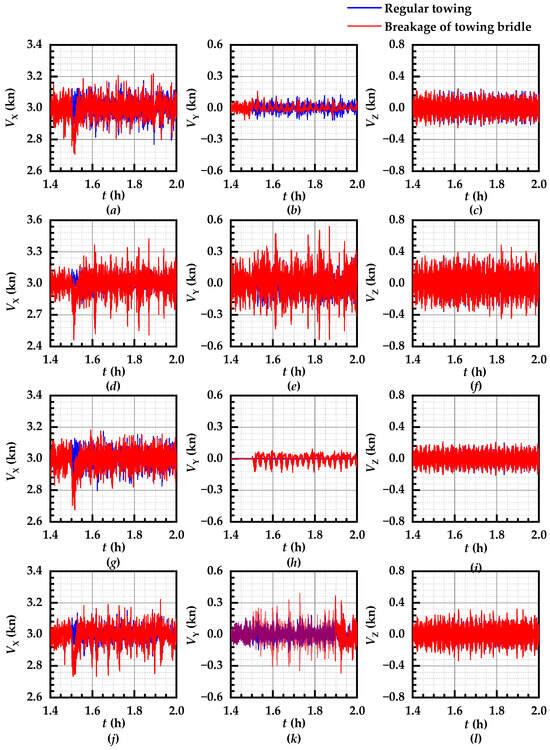
Figure 7.
Caisson speed curves after one towing bridle broke. Note: (a–c) TWD_180; (d–f) TWD_135; (g–i) TWS_180; (j–l) TWS_135.
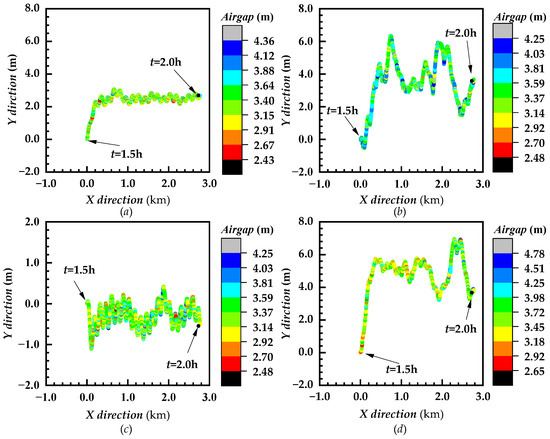
Figure 8.
The trajectory of a caisson after the breaking of one towing bridle. Note: (a) TWD_180; (b) TWD_135; (c) TWS_180; (d) TWS_135.
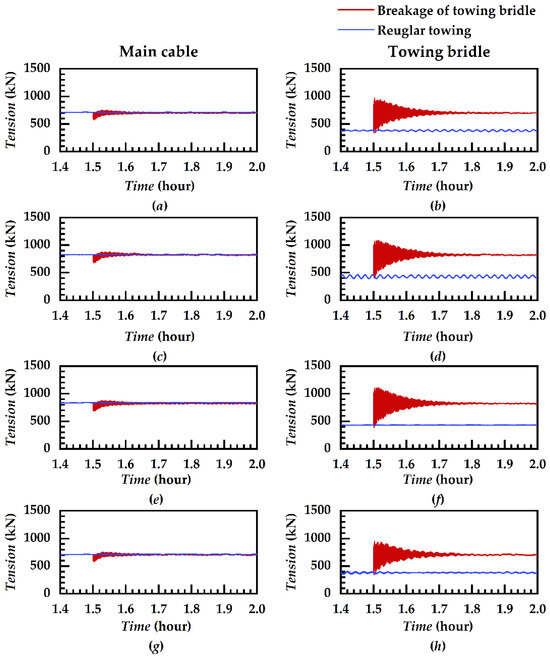
Figure 9.
History curves of unbroken cable force. Note: (a,b) TWD_180; (c,d) TWD_135; (e,f) TWS_180; (g,h) TWS_135.
Figure 7 illustrates the variation curves of the structure velocity along the X, Y, and Z directions half an hour after towing bridle breakage under different combined wave flow conditions. In the figure, the blue and red curves denote the structure movement speed during normal towing and the structure speed after towing bridle breakage.
Figure 7a–c present the structure velocity variation curves during positive wave towing after towing bridle breakage under various conditions of wave and flow directions, respectively. As seen in the figures, following towing bridle breakage, the structure’s original equilibrium state was disrupted. The structure was unstable, and when reentering equilibrium, the structure continued to move forward, although it was driven by another towing cable force, but the sway speed fluctuated around the towing speed of 3 kn. The structure shifted negatively along the Y axis direction in the transverse direction. The sway speed first increased gradually and then decreased under the dragging action of the cable, and it finally fluctuated around zero, generating a novel equilibrium state. Since the structure’s heave speed was in the normal direction of the wave and water flow force plane, heave motion responses were not influenced by towing bridle breakage, which could be verified from the curves before and after the breakage in the figure.
Under a fixed wave flow condition during oblique wave towing, structure variation curves along three-direction speeds after towing bridle breakage are illustrated in Figure 7d–f. Under such conditions, the longitudinal structure was mainly influenced by the water flow load, and the original equilibrium state was disrupted after towing bridle breakage. The variation in the structure area facing the current caused greater fluctuations in the structure sway speed compared to that under the aforementioned positive towing condition. Simultaneously, when towing bridle breakage started, the structure moved towards the Y axis due to the oblique variation in the wave force and its own inertia. The sway speed first increased and then decreased by the cable and finally oscillated in the range of −0.5 kn to 0.5 kn, making the achievement of stable equilibrium difficult and increasing the speed fluctuation range. The structure’s heave variation speed was similar to the aforementioned conditions.
Figure 7g–i illustrate the change curves of three-direction speeds of the structure during positive wave towing after towing bridle breakage via changing wave flow conditions under consistent wave and water flow directions. In the beginning of cable breakage, the sway speed was slightly increased because of the imbalance of the wave force, water flow force, and inertia, and then structure’s sway speed fluctuation occurred due to the constant variation in the structure area facing the current. The structure’s sway direction movement was the same as the aforementioned conditions, with negative shifting in the structure along the Y axis direction at cable breakage initiation. However, the difference was that the structure’s sway speed fluctuation decreased and eventually stabilized at about zero.
Figure 7j–l present the change rules of the structure’s three-direction motion speed after towing bridle breakage when the wave and flow directions were similar and wave towing was oblique. This was similar to the change rules of corresponding results for different wave and flow directions; however, the difference was that the structure speed change fluctuation was decreased at this time. This could be due to the fact that under the same wave and flow directions, the wave and water flow forces were in the same direction, the water flow force fluctuation was weak, and its proportion was larger.
A comparison of speed curves under the above four conditions revealed that, even after towing bridle breakage, the overall structure speed change trend was similar, and different wave and current combinations also had different effects on the structure speed. Following towing bridle breakage, the original dynamic balance of the structure was disrupted, and speeds along both the horizontal X and Y directions fluctuated significantly, especially within 10 min following towing bridle breakage, and the surge speed was decreased with a minimum value of about 80% of the towing speed, while the maximum sway speed was about 50% of the towing speed. Simultaneously, following towing bridle breakage, the surge and sway speed variations in the structure under frequent oblique wave action were higher than those under positive wave action. Whether the cable broke or not, there was little difference in the heave speed of the structure. This indicated that towing bridle breakage did not have a significant effect on the structure heave motion.
Figure 8 illustrates changes in the plane motion trajectory of a caisson structure within half an hour after the breakage of one towing bridle. As seen in Figure 8, under the effect of complex floating environments, after the breakage of one towing bridle, a change occurred in cable tension throughout the towing system. This change caused the structure to migrate along the Y direction due to asymmetric external forces. The migration trajectory presented a gradually reducing fluctuation pattern, finally reaching a novel steady state. Along the surge direction, the structure continued to move forward under tug drag, and the movement distance was basically consistent with tug displacement, hardly affected by towing bridle breakage.
The dynamics of lateral movements were changed under different wave and flow directions. During head sea towing under different wave and flow directions, the main reason for structure lateral movement following towing bridle breakage was the action of oblique fluid force, with the wave impact playing a weaker role. In this regard, structure lateral displacement measured approximately 2.6 m (Figure 6a). However, under oblique wave towing and different wave and flow directions, the structure’s lateral swaying motion was strongly affected by the waves. At this time, the structure’s lateral displacement was notably increased to around 6.4 m (Figure 6b). Compared to the maximum lateral displacement illustrated in Figure 6a, the one in Figure 6b was increased by about 2.5 times.
For head sea towing under similar flow and wave directions, following towing bridle breakage, a certain lateral displacement was witnessed in the structure because of uneven lateral forces (Figure 8c), and the maximum lateral deviation was slightly greater than that illustrated in Figure 8a. For oblique wave towing and similar flow and wave directions (Figure 8d), the structure’s lateral swaying motion is strongly affected by waves.
In addition, a comparison of the structure’s air gap values following cable breakage under the four conditions revealed that, generally, the structure’s air gap values under different conditions were not much different, with an air gap value of about 3 m. A possible reason for this consistency could be the minimal effect of towing bridle breakage on structure heave motion. Also, half an hour after the breakage, maximum sway displacement reached 7.3 m, and the minimum air gap value was 2.43 m. These metrics suggested a decreased risk of capsizing due to small air gap and no slamming phenomena were witnessed under these conditions.
Figure 9 illustrates the force variation curves of the remaining unbroken cables following the breakage of one towing bridle. Immediately after towing bridle breakage, the main cable tension state was relieved and the cable force slightly decreased. Simultaneously, the structure was under an unbalanced force state, the oncoming flow area changed at any time, and a certain fluctuation in the main cable tension was observed. With the progression of the towing process, the structure once again entered a stable towing stage. Different directions of flows and waves led to small differences in the structure’s oncoming flow area during the stable towing stage; also, certain differences were observed in the main cable towing force.
Significant diverges were observed in the force dynamics of an intact towing bridle from those of the main cable following bridle breakage. Under such conditions, the remaining intact towing bridle plays the role of the main cable. This causes its cable force to instantly match that of the main cable. This sudden imbalance could result in intense fluctuations, with amplitudes comparable to a normal cable force and maximum values reaching about 200% of the standard towing force. As towing was stabilized, the towing bridle force was gradually aligned with that of the main cable. However, initial intense fluctuations following bridle breakage increased the fatigue failure risk, necessitating immediate countermeasures.
4.2. Caisson’s Dynamic Response after Breakage of Main Cable
In the second scenario investigated in this research, the focus was shifted to changes in structure dynamic responses under steady-state towing conditions after main cable failure. Specifically, Figure 10 shows the fluctuations in the structure velocity along the X, Y, and Z axes within the first 30 min following the main cable failure. In addition, Figure 11 shows a comprehensive depiction of the changes in both the structure movement trajectory and air gap after cable failure.
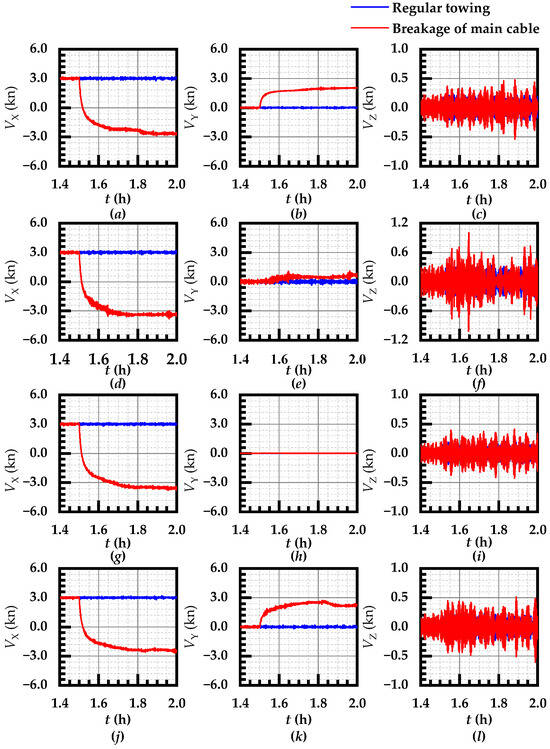
Figure 10.
Caisson’s speed curves after main bridle breakage. Note: (a–c) TWD_180; (d–f) TWD_135; (g–i) TWS_180; (j–l) TWS_135.
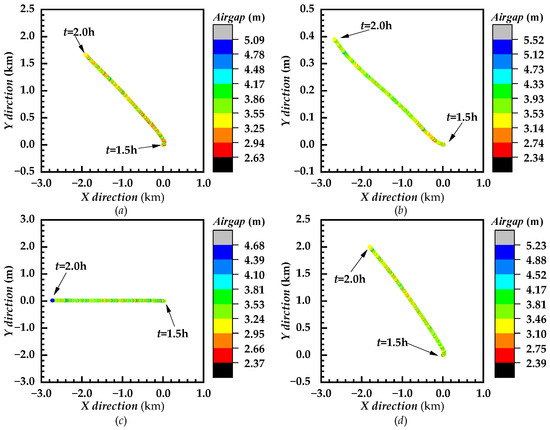
Figure 11.
Tracks of caisson after main cable breakage. Note: (a) TWD_180; (b) TWD_135; (c) TWS_180; (d) TWS_135.
Figure 10 illustrates the structure velocity change curves along the longitudinal sway, lateral sway, and vertical sway directions within half an hour following main cable breakage under various towing scenarios. The blue curves in the figure denote the speed of the unbroken cable and normal towing while the red curves present that after cable breakage.
Following main cable breakage, the structure traction force disappeared instantly. Under water flow resistance, the speed along the surge direction of the structure rapidly decreased to zero, and then it increased to a speed equivalent to the water flow and wave split speed along the X direction. Simultaneously, because of the wave force’s periodic fluctuation properties, there was still a certain speed fluctuation when the structure stably moved with the water flow along the X direction.
The velocity along the structure lateral sway direction differed from the velocity change law along the longitudinal sway direction. Following main cable breakage, the structure lateral sway speed was closely connected to the lateral hydrodynamic force it received. After cable breakage at a water flow direction of 135°, a lateral force analysis revealed a high lateral (positive direction of Y axis) water flow splitting force, which generated lateral acceleration, which increased the lateral sway speed. At this point, for different water flow and wave directions (Figure 10b), the structure speed increase was relatively low. After the structure lateral sway speed was increased to move with flow, small fluctuations were observed in speed. However, for a similar direction of wave and water flow (Figure 10k), the structure’s lateral speed increased faster, and the wave force periodic effect was stronger, decelerating the process after the structure speed increased more than the water flow speed. For a water flow direction of 180° and a similar direction of wave and water flow at this time (Figure 10h), theoretically, the lateral force on the structure was symmetrically balanced, and the structure did not present lateral movement. For different directions of wave and water flow (Figure 10e), following cable breakage, the structure first moved along the positive direction of the Y axis under the action of the wave force, and then it was accelerated due to the variations in the oncoming flow area of the structure. Finally, the structure accelerated along the direction of the Y axis under the action of asymmetric flow force to reach the ‘flowing with the wave’ state.
Figure 11 illustrates the trajectory of structure motion within half an hour following main cable breakage under the abovementioned four operating conditions. As seen in the figure, for a water flow direction of 135° and the existence of a lateral component of the water flow force (Figure 11a,d), the structure presented large displacements along the lateral direction, and the lateral offset within half an hour was over 1500 m. For a water flow direction of 180°, similar to the wave direction (shown in Figure 11c), the structure was basically symmetrically loaded from left to right, and then structure displacement along the lateral direction was small, and lateral displacement within half an hour was about zero. For different directions of wave and water flow (shown in Figure 11b), following cable breakage, the structure first moved along the positive direction of the Y axis due to oblique water flow force, and then a certain degree of deflection was observed in the structure because of the combined action of water flow and wave forces. The shape of the oncoming flow area of the structure changed, and the caisson came to reach the ‘flowing with the wave’ state, with a 400 m lateral offset within half an hour.
Unlike the above-mentioned lateral movement, no traction from the tugboat was observed for the structure’s longitudinal movement following cable breakage, and the structure moved downstream due to wave flow. Among them, the longest longitudinal movement distance for the similar directions of wave flow and head wave towing was 3 km, while the shortest longitudinal movement distance for the same wave flow and oblique wave towing was only 2 km, where the former was about 1.5 times higher than the latter.
5. Conclusions
The current research mainly analyzed the towing dynamic responses of caissons for two cable breakage types during towing at a 1.25 m wave height, a 1.5 m/s water flow speed, and a 3 kn sailing speed, describing the variations in parameters such as the air gap value, motion trajectory, structure movement speed, and towing cable force after the occurrence of unexpected conditions. The below conclusions were drawn from this research.
Following towing bridle breakage, the structure maintained a forward motion due to tug pull and an intact cable. Both the lateral and longitudinal rocking speeds presented great fluctuations, with the maximum longitudinal and lateral rocking speeds being 110% and 20% of the towing speed, respectively. Longitudinal displacement was closely aligned with the tug movement, while the lateral movement skewed on the Y axis. Under oblique flow, lateral displacement increased to a maximum of 7.2 m. In addition, dramatic changes occurred in intact towing bridle shortly after other breakages with a maximum force of 200% of the normal towing force. This surge increased the fatigue fracture risk, necessitating immediate preventative measures.
After main cable breakage, the structure started drifting downstream along the negative X axis, thereby entering a state best described as ‘flowing with the wave’. The longitudinal dynamics of the structures were predominantly guided by the water’s directional flow, while its lateral movements displayed strong correlations with the trajectory of incoming waves. It is important to note that a marked increase in lateral displacement was witnessed when the wave approach diverged from the structure’s original navigational direction.
Within the ambit of the four conditions of wave and water flow scrutinized in this study, a pair of salient observations emerged. Under the ‘TWS_180’ scenario, the longitudinal drift of the structure reached an unparalleled extent, stretching up to 3 km. Conversely, under the ‘TWS-135’ scenario, lateral displacements swelled to an exceptional 400 m, which is about 20-fold the lateral width of the structure.
In addition, following main cable failure, the minimum air gap value for the structure exceeded 2.3 m. This metric signified that adequate clearance was maintained between the structure’s bottom and water surface, mitigating wave pounding or submersion incident risks.
In summary, it was observed that even in the event of cable failures, the structures do not submerge immediately, thereby providing a substantial possibility for rescue operations. Specifically, when the towing bridle breaks, the structure exhibits significant oscillations and the cable tension experiences substantial fluctuations, which increase the risk of further exacerbating the situation. To prevent worsening conditions, it is recommended to implement measures such as reducing the towing speed and adjusting the angle between the towing direction and the current. In the event of main bridle breakage, the structure will gradually enter a drifting state. Rescue operations should consider the direction of waves and currents and focus search efforts downstream. During the rescue process, it is important to consider the large mass of the structure, which results in significant initial kinetic energy and challenges in maneuverability, potentially leading to serious secondary collision incidents. Therefore, these complex factors must be taken into account to ensure a safe and effective response to potential risks.
Author Contributions
Software, H.G.; formal analysis, H.W.; investigation, Q.X.; writing—original draft preparation, H.G.; supervision, W.F. All authors have read and agreed to the published version of the manuscript.
Funding
This research was funded by the project titled ‘Research on rapid capture and utilization of nearshore and nearshore hydrologic information’, grant number 8091B022123, and the APC was funded by the Department of Science, Technology and Information Technology, Ministry of Education.
Data Availability Statement
The data presented in this study are available upon request to the corresponding author due to privacy restrictions.
Conflicts of Interest
Author Qingyun Xu was employed by the company China Harbour Engineering Company Ltd. The remaining authors declare that the research was conducted in the absence of any commercial or financial relationships that could be construed as a potential conflict of interest.
Abbreviations
| Symbols List | |
| total kinematic mass matrix of structure | |
| mass matrix of main body of structure | |
| additional mass matrix | |
| wave radiation damping matrix | |
| linear damping matrix | |
| hydrostatic stiffness matrix | |
| displacement vector | |
| excitation force | |
| wind force | |
| flow force | |
| wave force | |
| forces other than wind, wave, and current forces | |
| surge force on structure under effect of sea currents | |
| sway force on structure under effect of sea currents | |
| yawing moment on structure under effect of sea currents | |
| yawing moment coefficients on structure under effect of sea currents | |
| surge force coefficients on structure under effect of sea currents | |
| sway force coefficients on structure under effect of sea currents | |
| seawater density | |
| sea current speed relative to structure | |
| longitudinal projected areas of structure beneath still water | |
| surface | |
| lateral projected areas of structure beneath still water surface | |
| caisson length | |
| peak frequency | |
| peak enhancement factor | |
| constant value depending on peak frequency of wave spectrum and wind | |
| speed | |
| starting frequencies of irregular wave | |
| ending frequencies of irregular wave | |
| Acronym List | |
| STLPWT | submerged tension leg platform wind turbine |
| SFOWT | floating offshore wind turbine |
| JONSWAP | Joint North Sea Wave Project |
References
- The Transportation Safety Board of Canada. Marine Investigation Report M08M0010. Nova Scotia, Canada, 2008. Available online: https://www.tsb.gc.ca/eng/rapports-reports/marine/2008/m08m0010/m08m0010.html (accessed on 5 March 2024).
- Liu, X. Reasons for the High Frequency of Tugboat Accidents. China Ship Surv. 2015, 5, 72–74. (In Chinese) [Google Scholar]
- Park, H.H. A method for estimating the gear shape of a mid-water trawl. Ocean Eng. 2007, 34, 470–478. [Google Scholar] [CrossRef]
- Park, S.H.; Lee, S.J.; Lee, S. Experimental investigation of towing-and course-stability of a FPSO towed by a tug-boat with lateral motion. Int. J. Nav. Archit. Ocean Eng. 2021, 13, 12–23. [Google Scholar] [CrossRef]
- Park, C.W.; Seo, J.; Hyung Rhee, S. Model Tests of a Caisson in Wet Towing for Assessing Resistance and Stability in Calm Water and Waves. J. Offshore Mech. Arct. Eng. 2018, 140, 051301. [Google Scholar] [CrossRef]
- Lyu, W.; Ying, Z.; Wang, X.; Guo, H. Numerical Calculation of Water Resistance of Immersed Tube Element in Towing. In Proceedings of the ISOPE International Ocean and Polar Engineering Conference, Honolulu, HI, USA, 16–21 June 2019. ISOPE-I-19-022. [Google Scholar]
- Strandhagen, A.; Schoenherr, K.E.; Kobayashi, F.M. The Dynamic Stability on Course of Towed Ship. SNAME 1950, 58, 32–66. [Google Scholar]
- Inoue, S.; Kakizaki, S.; Kasai, H.; Kubota, T.; Yamashita, Y. The Course Stability of Towed Boats. Trans. West JPN Soc. Nav. Archit. 1971, 42, 11–26. [Google Scholar]
- Inoue, S.; Lim, S.T. The Course Stability of Towed Boats (Continued). Trans. West JPN Soc. Nav. Archit. 1971, 43, 35–44. [Google Scholar]
- Inoue, S.; Lim, S.T. The Course Stability of Towed Boats-When the Mass of Tow Rope is Continued. Trans. West JPN Soc. Nav. Archit. 1972, 44, 129–140. [Google Scholar]
- Huang, Z.; Liu, C.; Kurniawan, A.; Tan, S.K.; Nah, E. Responses of a Floating Rectangular Caisson to Regular Waves. In Proceedings of the Asian and Pacific Coasts, Singapore, 13–16 October 2009. [Google Scholar]
- Huang, X.; Zhang, W.; Jiang, B.; Lv, Y. Experimental Study on the Offshore Positioning and Installing of Large Caisson. Appl. Mech. Mater. 2014, 580–583, 2129–2133. [Google Scholar] [CrossRef]
- Kotake, Y.; Oomukai, Y.; Matsumura, A.; Nakamura, T. A Study on the Behaviour of a Relatively Small Caisson Floating in Wave Fields and its Effective Installation Method. In Proceedings of the Coasts, Marine Structures and Breakwaters Conference: Realising the Potential, Liverpool, UK, 5–7 September 2017. [Google Scholar]
- Meneses, L.; Sarmiento, J.; Dolores, D.d.L.; Blanco, D.; Guanche, R.; Losada, J.; de Segovia, M.F.R.; Ruiz, M.J.; Martín, M.A.; Conde, M.J.; et al. Large Scale Physical Modelling for a Floating Concrete Caisson in Marine Works. In Proceedings of the International Conference on Offshore Mechanics and Arctic Engineering, Madrid, Spain, 17–22 June 2018. V07AT06A025. [Google Scholar]
- Nakamura, T.; Mizutani, N. Development of Fluid-Sediment-Seabed Interaction Model and its Application. In Proceedings of the 34th International Conference on Coastal Engineering, Seoul, Republic of Korea, 15–20 September 2014. [Google Scholar]
- Heo, J.K.; Park, C.W. Time Domain Analysis on Deck Wetness of a Caisson Wet-Towed in Irregular Waves. J. Korean Soc. Coast. Ocean Eng. 2016, 28, 27–33. [Google Scholar] [CrossRef]
- Ding, H.; Han, Y.; Le, C.; Zhang, P. Dynamic Analysis of a Floating Wind Turbine in Wet Tows Based on Multi-Body Dynamics. J. Renew. Sustain. Energy 2017, 9, 033301. [Google Scholar] [CrossRef]
- Le, C.; Ren, J.; Wang, K.; Zhang, P.; Ding, H. Towing Performance of the Submerged Floating Offshore Wind Turbine under Different Wave Conditions. J. Mar. Sci. Eng. 2021, 9, 633. [Google Scholar] [CrossRef]
- Gu, H.; Wang, H.; Zhai, Q.; Feng, W.; Cao, J. Study on the Dynamic Responses of a Large Caisson during Wet-Towing Transportation. Water 2021, 13, 126. [Google Scholar] [CrossRef]
- Zhu, H.; Hu, C. A unified seakeeping and maneuvering analysis of multiple linked towing system with triangular Bodies. Ocean Eng. 2021, 222, 108577. [Google Scholar] [CrossRef]
- Zhao, Z.; Fan, Y.; Kuang, X.; Zhou, C. Model test on towing performance of deepwater FPSO. China Offshore Platf. 2018, 33, 84–88. (In Chinese) [Google Scholar]
- Zhang, P.; Peng, Y.; Ding, H.; Hu, R.; Shi, J. Numerical analysis of offshore integrated meteorological mast for wind farms during wet towing transportation. Ocean Eng. 2019, 188, 106271. [Google Scholar] [CrossRef]
- CCS. Guidelines for Towing at Sea; CCS: Beijing, China, 2011. [Google Scholar]
- DNVGL-OS-E301; DNV GL: Bærum, Norway, 2020.
- Ministry of Natural Resources South China Sea Bureau. Marine Disaster Bulletin of the South China Sea District; Ministry of Natural Resources South China Sea Bureau: Guangzhou, China, 2022. [Google Scholar]
- Huang, B.; Shi, X.; Xie, B. Study on the relationships of ocean wave periods in the South China Sea based on the observed data. J. Mar. Sci. 2016, 34, 6–10. [Google Scholar]
Disclaimer/Publisher’s Note: The statements, opinions and data contained in all publications are solely those of the individual author(s) and contributor(s) and not of MDPI and/or the editor(s). MDPI and/or the editor(s) disclaim responsibility for any injury to people or property resulting from any ideas, methods, instructions or products referred to in the content. |
© 2024 by the authors. Licensee MDPI, Basel, Switzerland. This article is an open access article distributed under the terms and conditions of the Creative Commons Attribution (CC BY) license (https://creativecommons.org/licenses/by/4.0/).