
Synergy Assessment of River Health Values from a Symbiotic Perspective: A Case Study of the Yellow River Basin in China


Abstract
:1. Introduction
2. Methodology
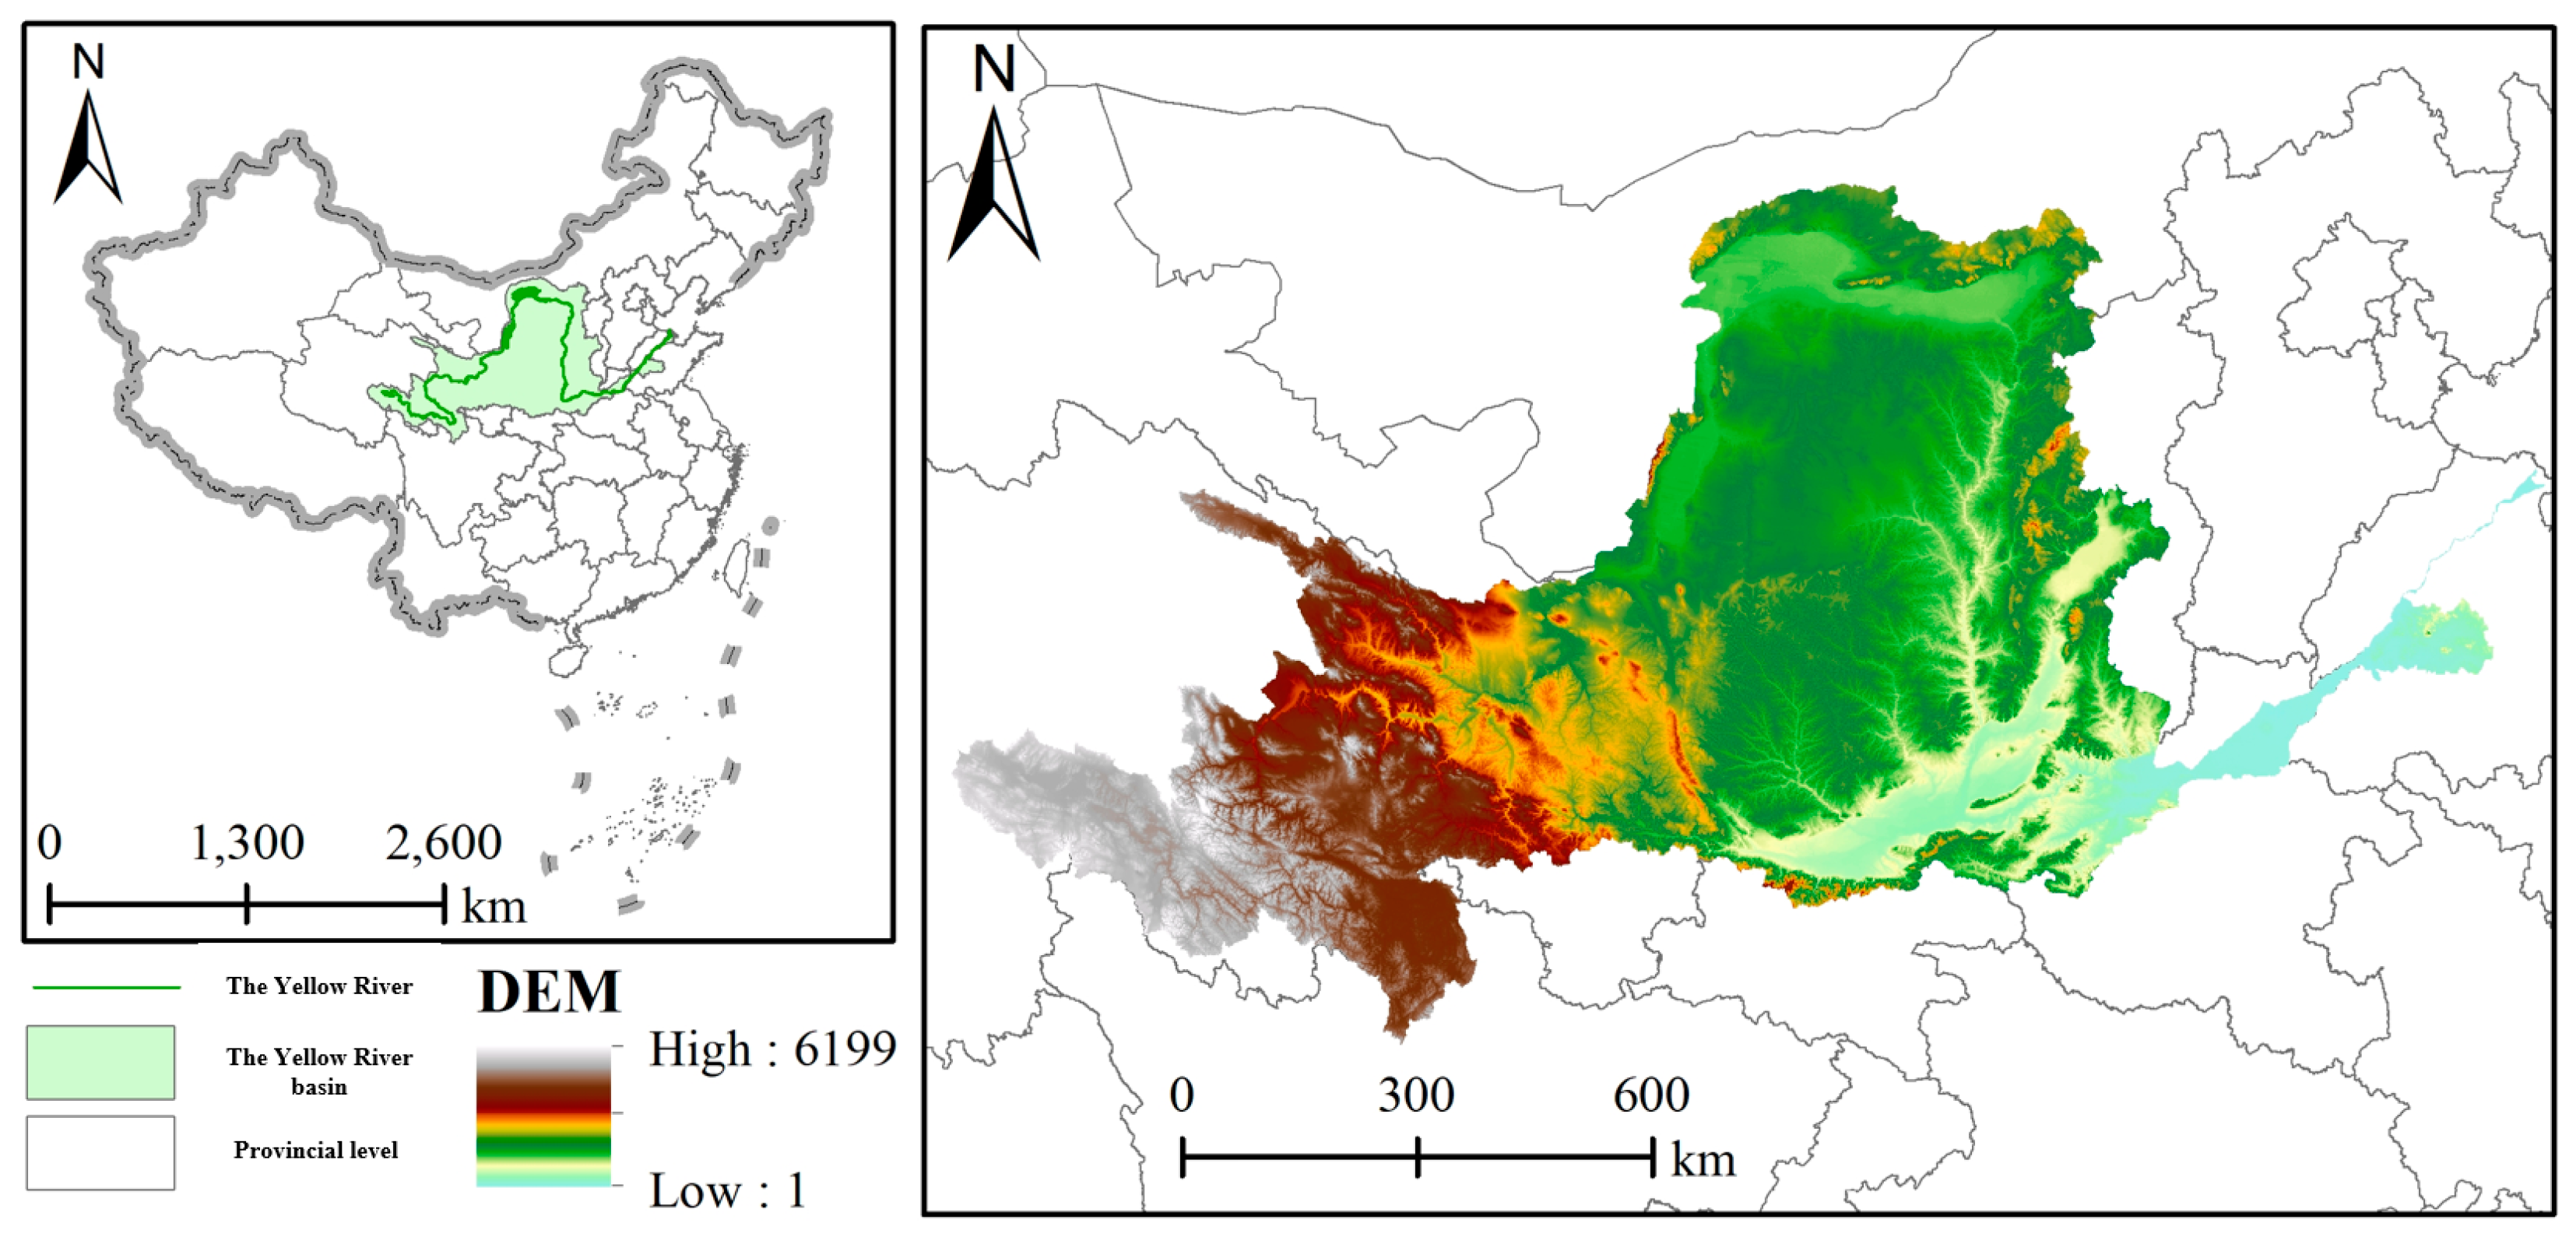
2.1. Study Area and Data
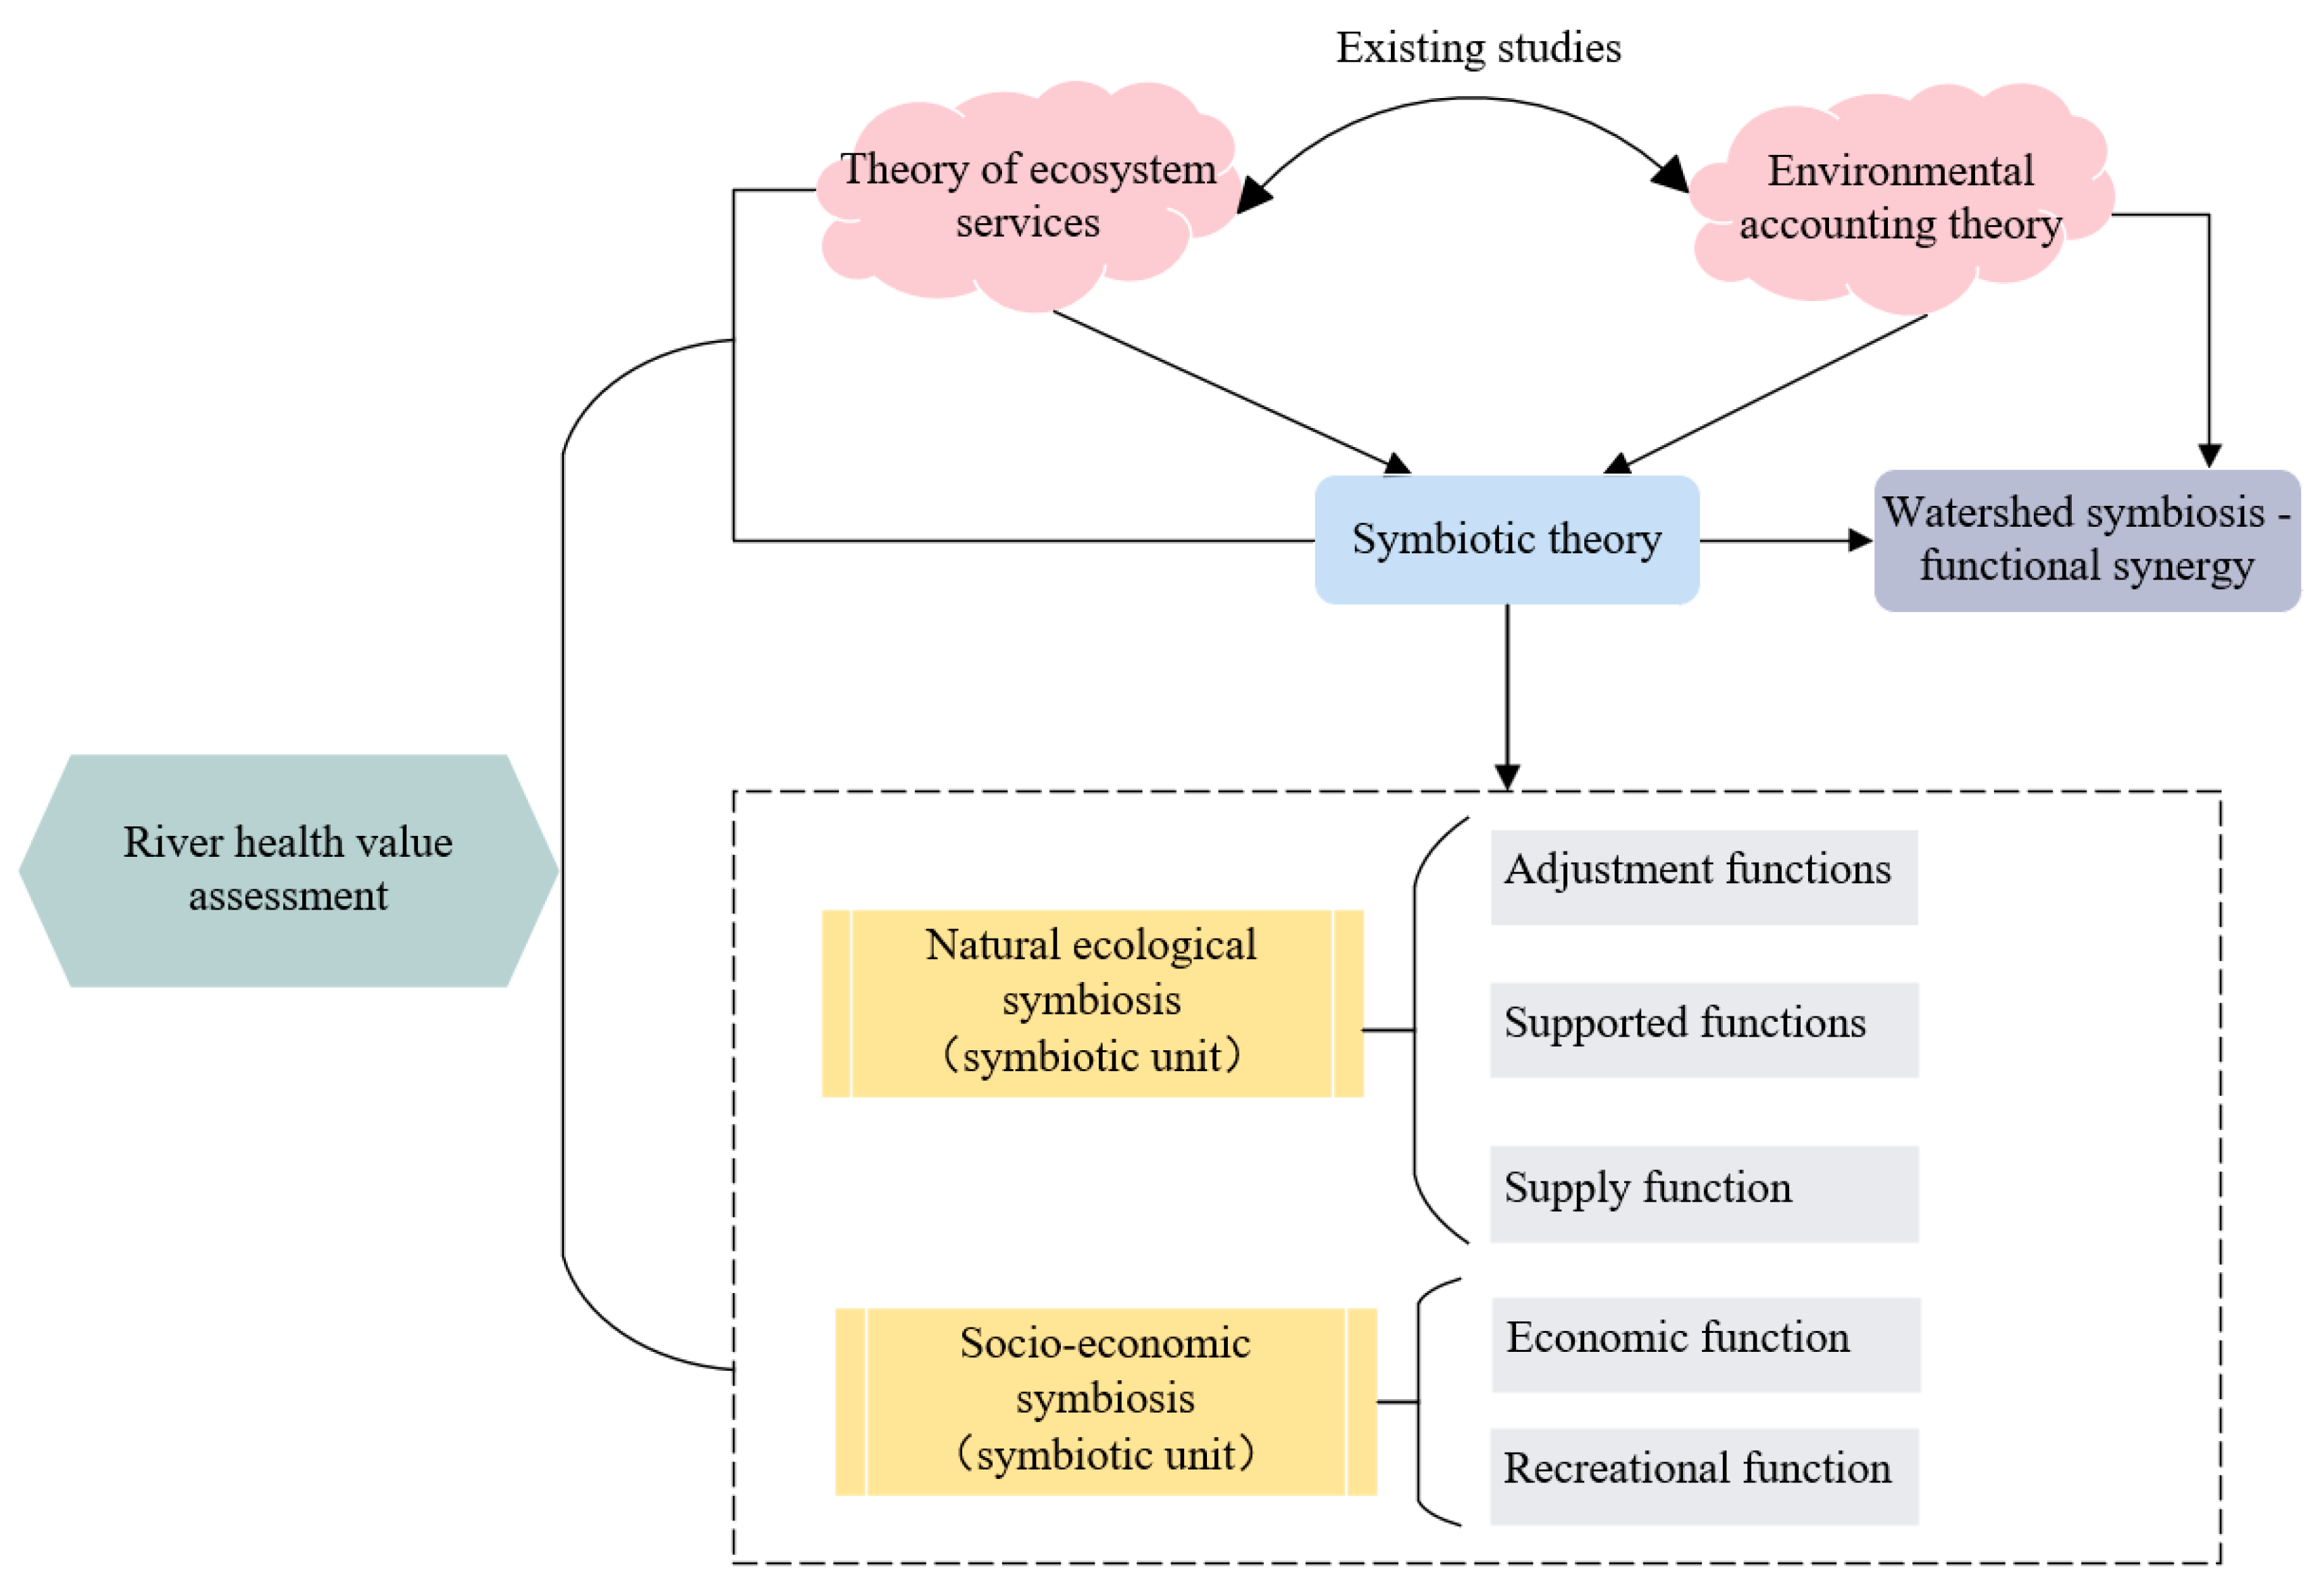
2.2. Model Setting
2.3. Data Sources and Methods
- (1)
- Estimation of the value of the supply function
- ①
- Methods for estimating the value of biological resourcesRivers are among the most productive of natural ecosystems, and the biological resources they provide are mainly aquatic products. Based on the data in the Rural Statistics Yearbook [15], the market value method [21] was applied to calculate the economic value of aquatic product production, using the following formula:where V1 is the total value of biological resources, unit: CNY; T is the production of the main biological resources of the river, unit: tons/year; and P is the market unit price of the corresponding biological resources, unit: CNY/kg. In this study, based on the availability of data, P was selected as a price indicator of the average price of the key monitoring aquatic products of the Ministry of Agriculture in 2017, and the fluctuation range of the average price was 15.50~17.50 CNY/kg with an average value of 16.33 CNY/kg.
- ②
- Methods for estimating the value of water resourcesRivers not only provide important water resources for human life and agricultural irrigation, but also play an indispensable role in flood control. The formula for calculating the value of river water resources is as follows:where V2 is the total value of water resources, unit: CNY; Qi is the amount of water abstracted by each industry, unit: t/m3; and Pi is the unit price of water for the corresponding industry, unit: CNY/m3. This study adopted the market value method, and according to the availability of data, the non-agricultural water supply in accordance with the average raw water price of 0.125 CNY/m3 as stipulated in the document Development and Reform Price [2013] [22] No. 540, and the agricultural water supply in accordance with the raw water price of 0.01 CNY/m3 as stipulated in the document Development and Reform Price [2005] [23] No. 582.
- (2)
- Estimating the value of regulatory functions
- ①
- Methods for estimating the value of climate regulationRiver systems transport a steady stream of water and air to the atmosphere through evaporation of water from the river surface, thereby increasing air humidity and decreasing air temperature to achieve climate regulation. The river climate regulation value was calculated by using the following formula:where V3 is the total value of climate regulation, unit: CNY; E is the evaporation of the river water surface, unit: mm; S is the area of the river water body, unit: km2; and P is the unit price of water resources. This study adopted the opportunity cost method [24], based on the data availability, in accordance with the raw water price standard stipulated in the document Development and Reform Price [2013] No. 540 [22], that is, taking the average price of non-agricultural water supply as 0.125 CNY/m3.
- ②
- Methods for estimating the value of water purificationThe Yellow River is an important water source in China and plays an important role in the socio-economic development of the nine provinces along the river. The value of purified water quality in the Yellow River Basin was calculated by using the following formula:where V4 is the value of river purification water quality, unit: CNY; W is the volume of bearing wastewater discharge, unit: t; P is the operating cost of wastewater treatment plant, unit: CNY/t. This study adopted the alternative cost method, and the data on wastewater discharge came from the China Environmental Statistics Yearbook. After investigating, we found that the current operating costs of domestic wastewater treatment plants range from 0.51 CNY/t to 3.01 CNY/t, with an average operating cost of 1.38 CNY/t, including an average of 0.37 CNY/t for construction costs, 0.81 CNY/t for wastewater treatment costs, and 0.20 CNY/t for sludge treatment costs [25].
- ③
- Methods for estimating the value of sand transport capacitySediment is regarded as an abundant natural renewable resource, and the demand for sand in the field of construction engineering has gradually risen in the past few years. Accordingly, the potential for exploitation of sediment resources is huge, bringing significant economic benefits. The value of the river sand transfer capacity was calculated by using the following formula:where V5 is the total value of sand transport capacity, unit: CNY; S is the amount of sand transport, unit: t; and P is the price of sand and gravel transported by ship, unit: CNY/t. This study adopted the market value method, and the data on sand transport were sourced from the China River Sediment Bulletin. Through comprehensive analysis of the main domestic waterways, sand and gravel types, transport distance, and other factors, we determined the average value of China’s inland waterway ship transport of sand and gravel to be 30 CNY/t [26].
- ④
- Methods for estimating the value of flood storageThe Yellow River Basin Water Conservancy Hub Project has played a great role in flood storage and other aspects, and the value of flood storage in the Yellow River Basin was calculated by using the following formula:where V6 is the value of flood regulation in the basin, unit: CNY; C is the total reservoir capacity of completed reservoirs, unit: m3; and P is the price of constructing reservoir capacity, unit: CNY/m3. In this study, the shadow engineering method was used to calculate the reservoir capacity of the Yellow River Basin Water Conservancy Hub as its annual flood regulation volume, and according to the statistical analysis of the construction costs of water conservancy projects in China, the national average annual input cost of reservoir capacity was determined to be 0.67 CNY/m3 [27].
- (3)
- Estimation of the value of economic functions
- ①
- Methods for estimating the value of electricity generation from water facilitiesThe Yellow River Basin Water Conservancy Hub is a comprehensive water conservancy project integrating power generation, irrigation, flood control, and bulldozing prevention, which provides abundant power to the provinces along the Yellow River Basin while playing other functional roles. The value of power generation in the Yellow River Basin was calculated by using the following formula:where V7 is the total value of electricity generated by water conservancy facilities, unit: CNY; Q is the social electricity consumption, unit: Kw-h; and P the average feed-in tariff of the national power generation enterprises, unit: CNY/Kw-h. This study adopted the market value method, and the electricity consumption of the whole society was determined from the Electric Power Statistical Yearbook. According to the survey statistics, the average feed-in tariff of national power generation enterprises is 0.39 CNY/Kw-h.
- ②
- Methods for estimating the value of river navigationYellow River shipping is of great significance for local transportation along the nine provinces (regions) of the Yellow River. Promoting the economic development of the basin, optimizing the layout of transportation, and developing river navigation help to protect the health of the Yellow River. The formula for calculating the value of river navigation in the Yellow River Basin was as follows:where V8 is the total value of river shipping, unit: CNY; Y is the turnover of shipping various loads; and P is the average value of the unit of water transportation of various loads, unit: CNY/ton. This study used the market value method, the turnover of shipping various loads came from the China Statistical Yearbook, and the average price of the unit of loads came from a sample survey of the Yellow River’s passenger and cargo transportation, giving us a result of 0.06 CNY/ton.
- ③
- Methods for estimating the value of fisheriesCalculation of fisheries using the market value method can be performed based on data from the China Fisheries Statistical Yearbook [19]. There are a total of 121 species (or subspecies) of fish in the main stream of the Yellow River, and there are 98 species of pure freshwater fish in the main stream, accounting for 78.4% of the total. The main economic fish species are Wah’s yarrowfish, northern copperfish (pigeonfish), carp, and crucian carp.
- (4)
- Estimating the value of support functions
- ①
- Methodology for estimating the conservation value of biodiversityRiver basins interact with river water bodies in terms of water quantity through surface water and groundwater, and changes in water levels directly shape the ecological characteristics and landscape patterns of rivers. This means rivers present diverse types, have rich biological species and other characteristics, and play a crucial role in biodiversity and other aspects. The calculation formula for the biodiversity conservation value of the Yellow River Basin is as follows:where V10 is the value of river biodiversity conservation, unit: CNY; H is the area of water bodies in the Yellow River Basin, unit: hm2; and P is the value of biological habitat per unit area, unit: CNY/hm2.
- (5)
- Estimated value of recreational functions
- ①
- Methods for estimating the value of teaching and researchThe watershed is considered to be the birthplace of natural science civilization, and it is rich in cultural heritage and historical value. It has long been the first choice of domestic and foreign researchers and scholars for learning and teaching, and it is generally one of the most fruitful and diverse centers of research in the current academic world. The value of teaching and research in the watershed was calculated by using the following formula:where V11 is the value of teaching and research, unit: CNY; H is the watershed area, unit: hm2; and P is the value of education and research per unit area of the watershed, unit: CNY/hm2. In this study, the results reference method was adopted. Due to the lack of specific statistical data, the average educational and scientific research value of China’s wetland ecosystems estimated by Chen Zhongxin et al. was used as a reference [28], that is, 382 CNY/hm2.
- ②
- Recreation value estimation methodThe Yellow River Basin has beautiful natural landscapes along the route, with rich natural ecological resources and scenery, possessing high tourism value and expected to create significant economic gains. The leisure tourism value of the Yellow River Basin was calculated by using the following formula:where V12 is the recreational value, unit: CNY; A is the area of water bodies in the Yellow River Basin, unit: hm2; and P is the recreational value per unit area of the watershed, unit: CNY/hm2. This study adopted the result reference method, due to the lack of specific statistical data, making reference to Xie Gao Di et al. [29]. These scholars estimated China’s lakes and wetland resources to have an educational and scientific research value of 3840.2 CNY/hm2.
3. Logistic Coevolutionary Model of River Health Values
- ①
- The 12 indicators in the indicator stratum were standardized, mainly using the extreme value standardization method:
- ②
- Indicator weights were calculated. The weight of the jth indicator (or column) in year (or row) i was Pij:
- ③
- We found the entropy value of the indicator. The entropy value Ej of the jth indicator was as follows:
- ④
- We found the coefficient of variation of the indicator Dj:
- ⑤
- We calculated the weighting result Wj:
4. Results
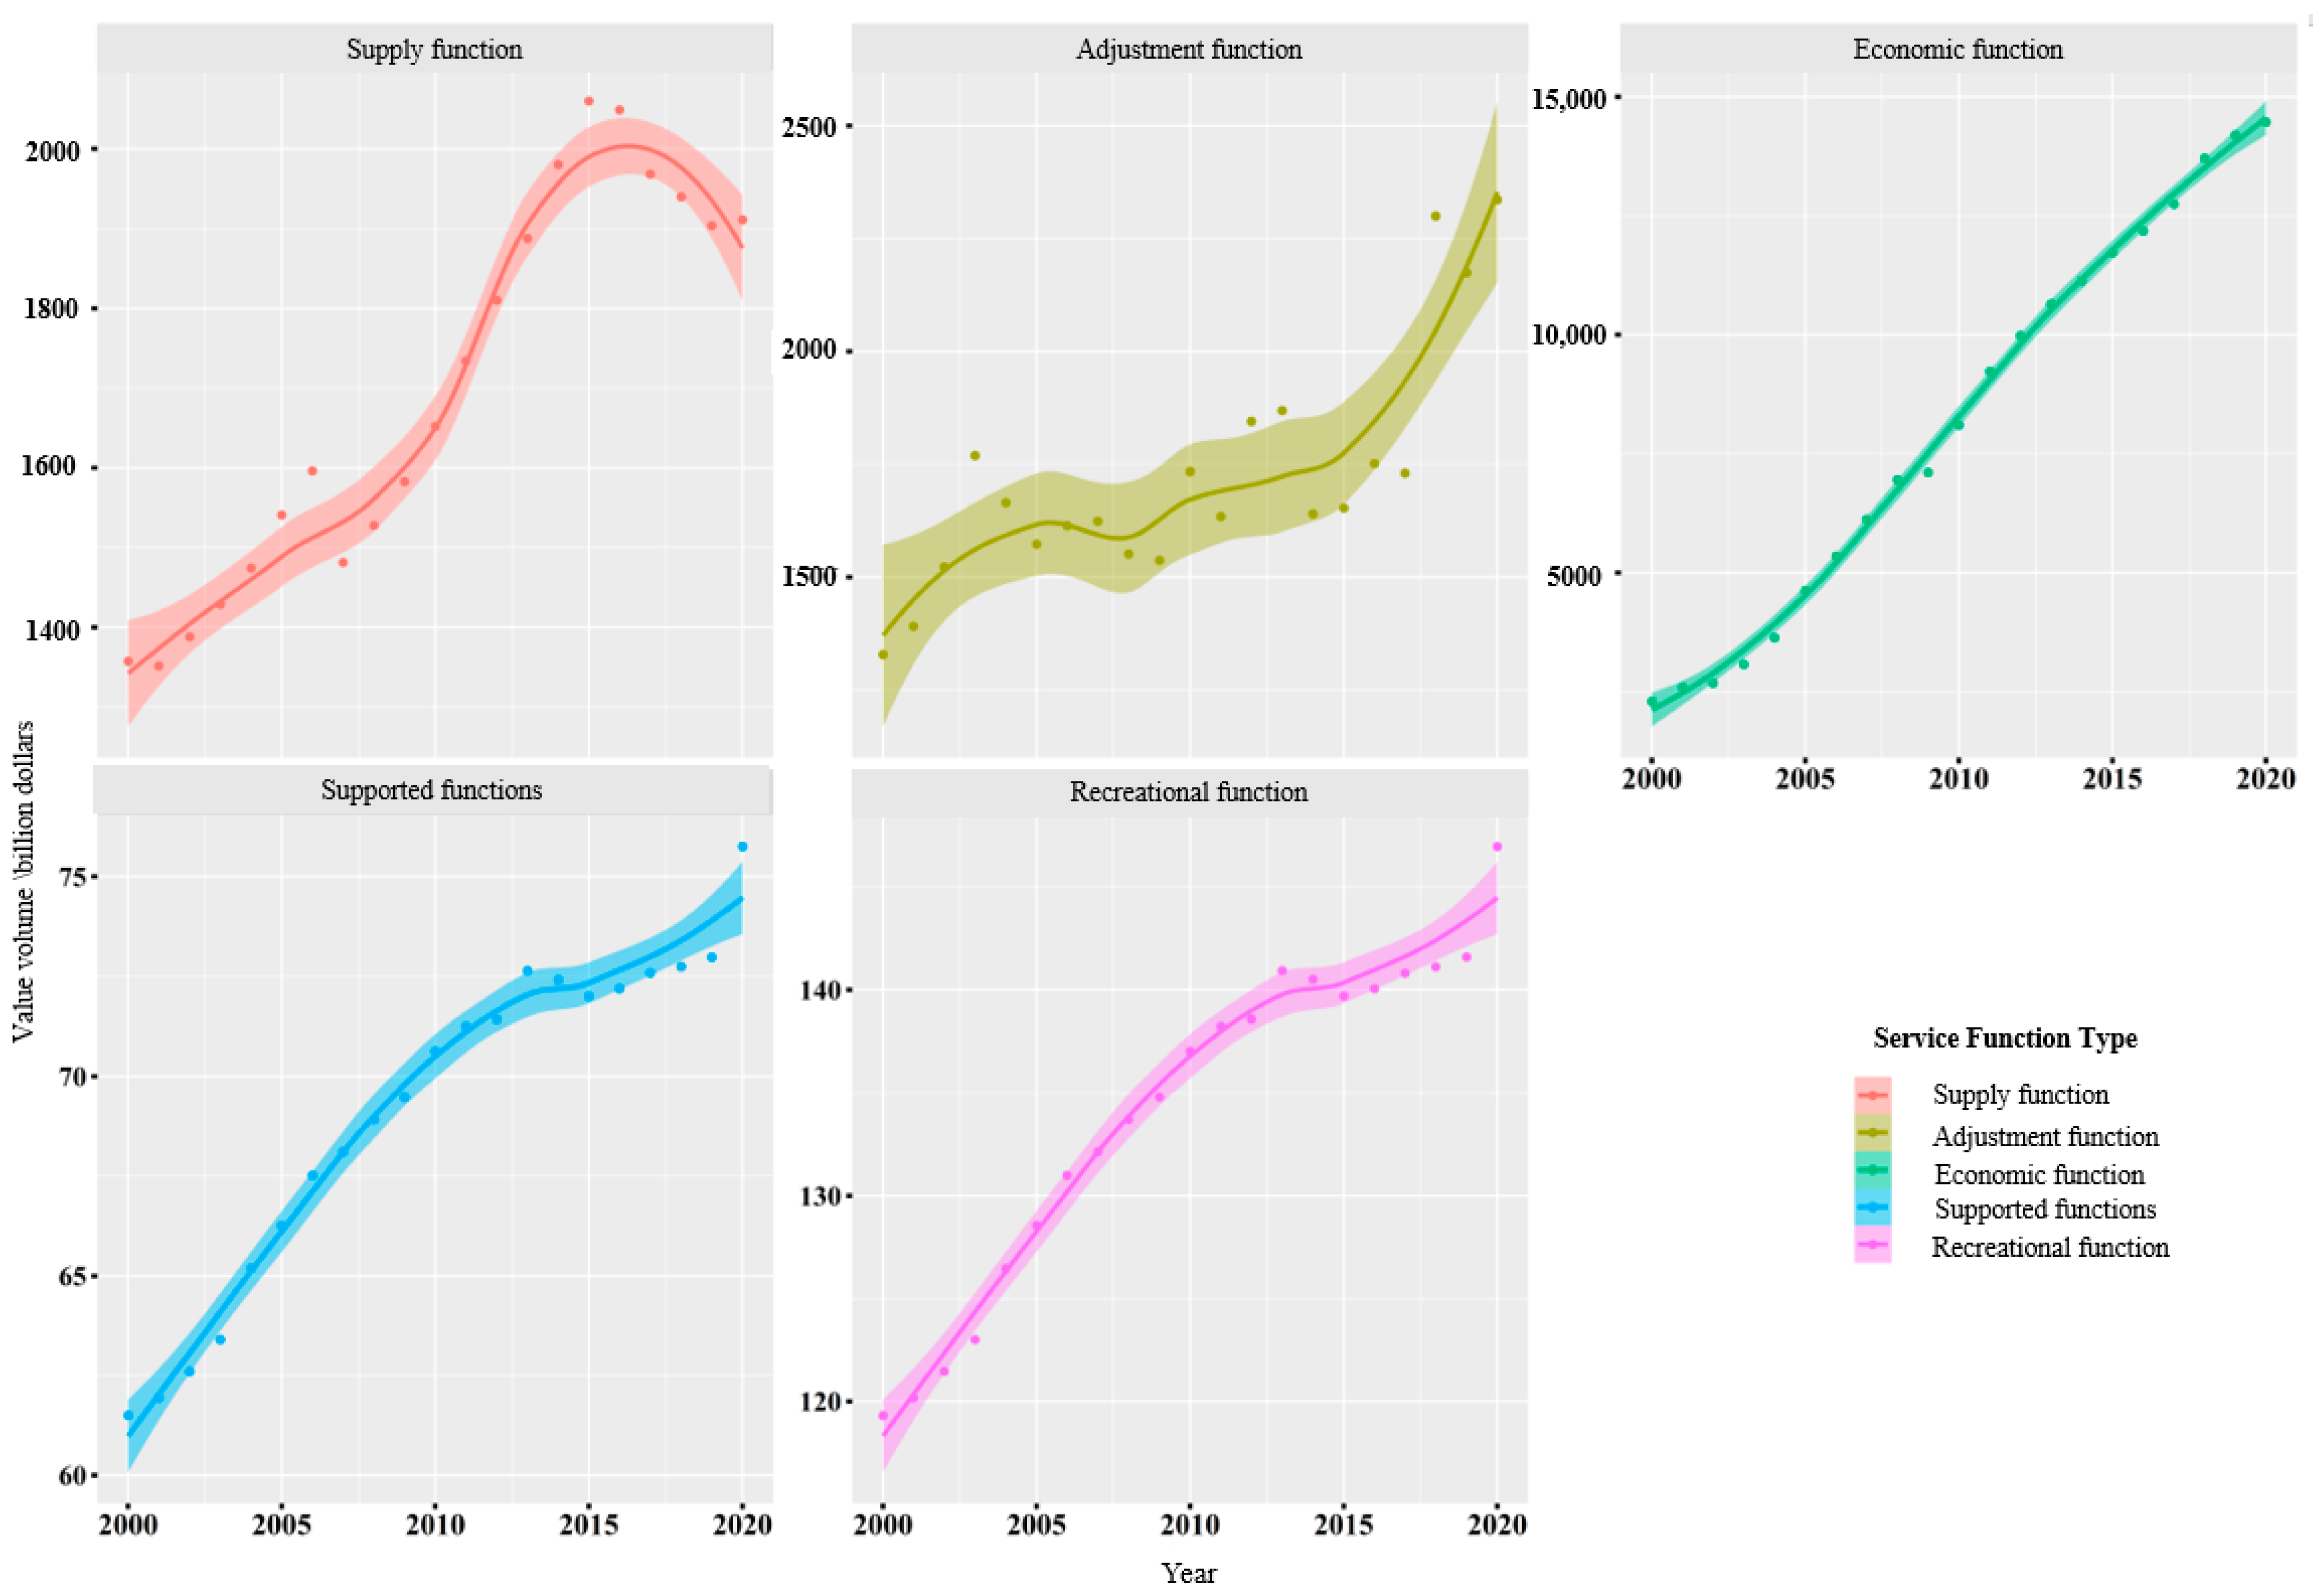
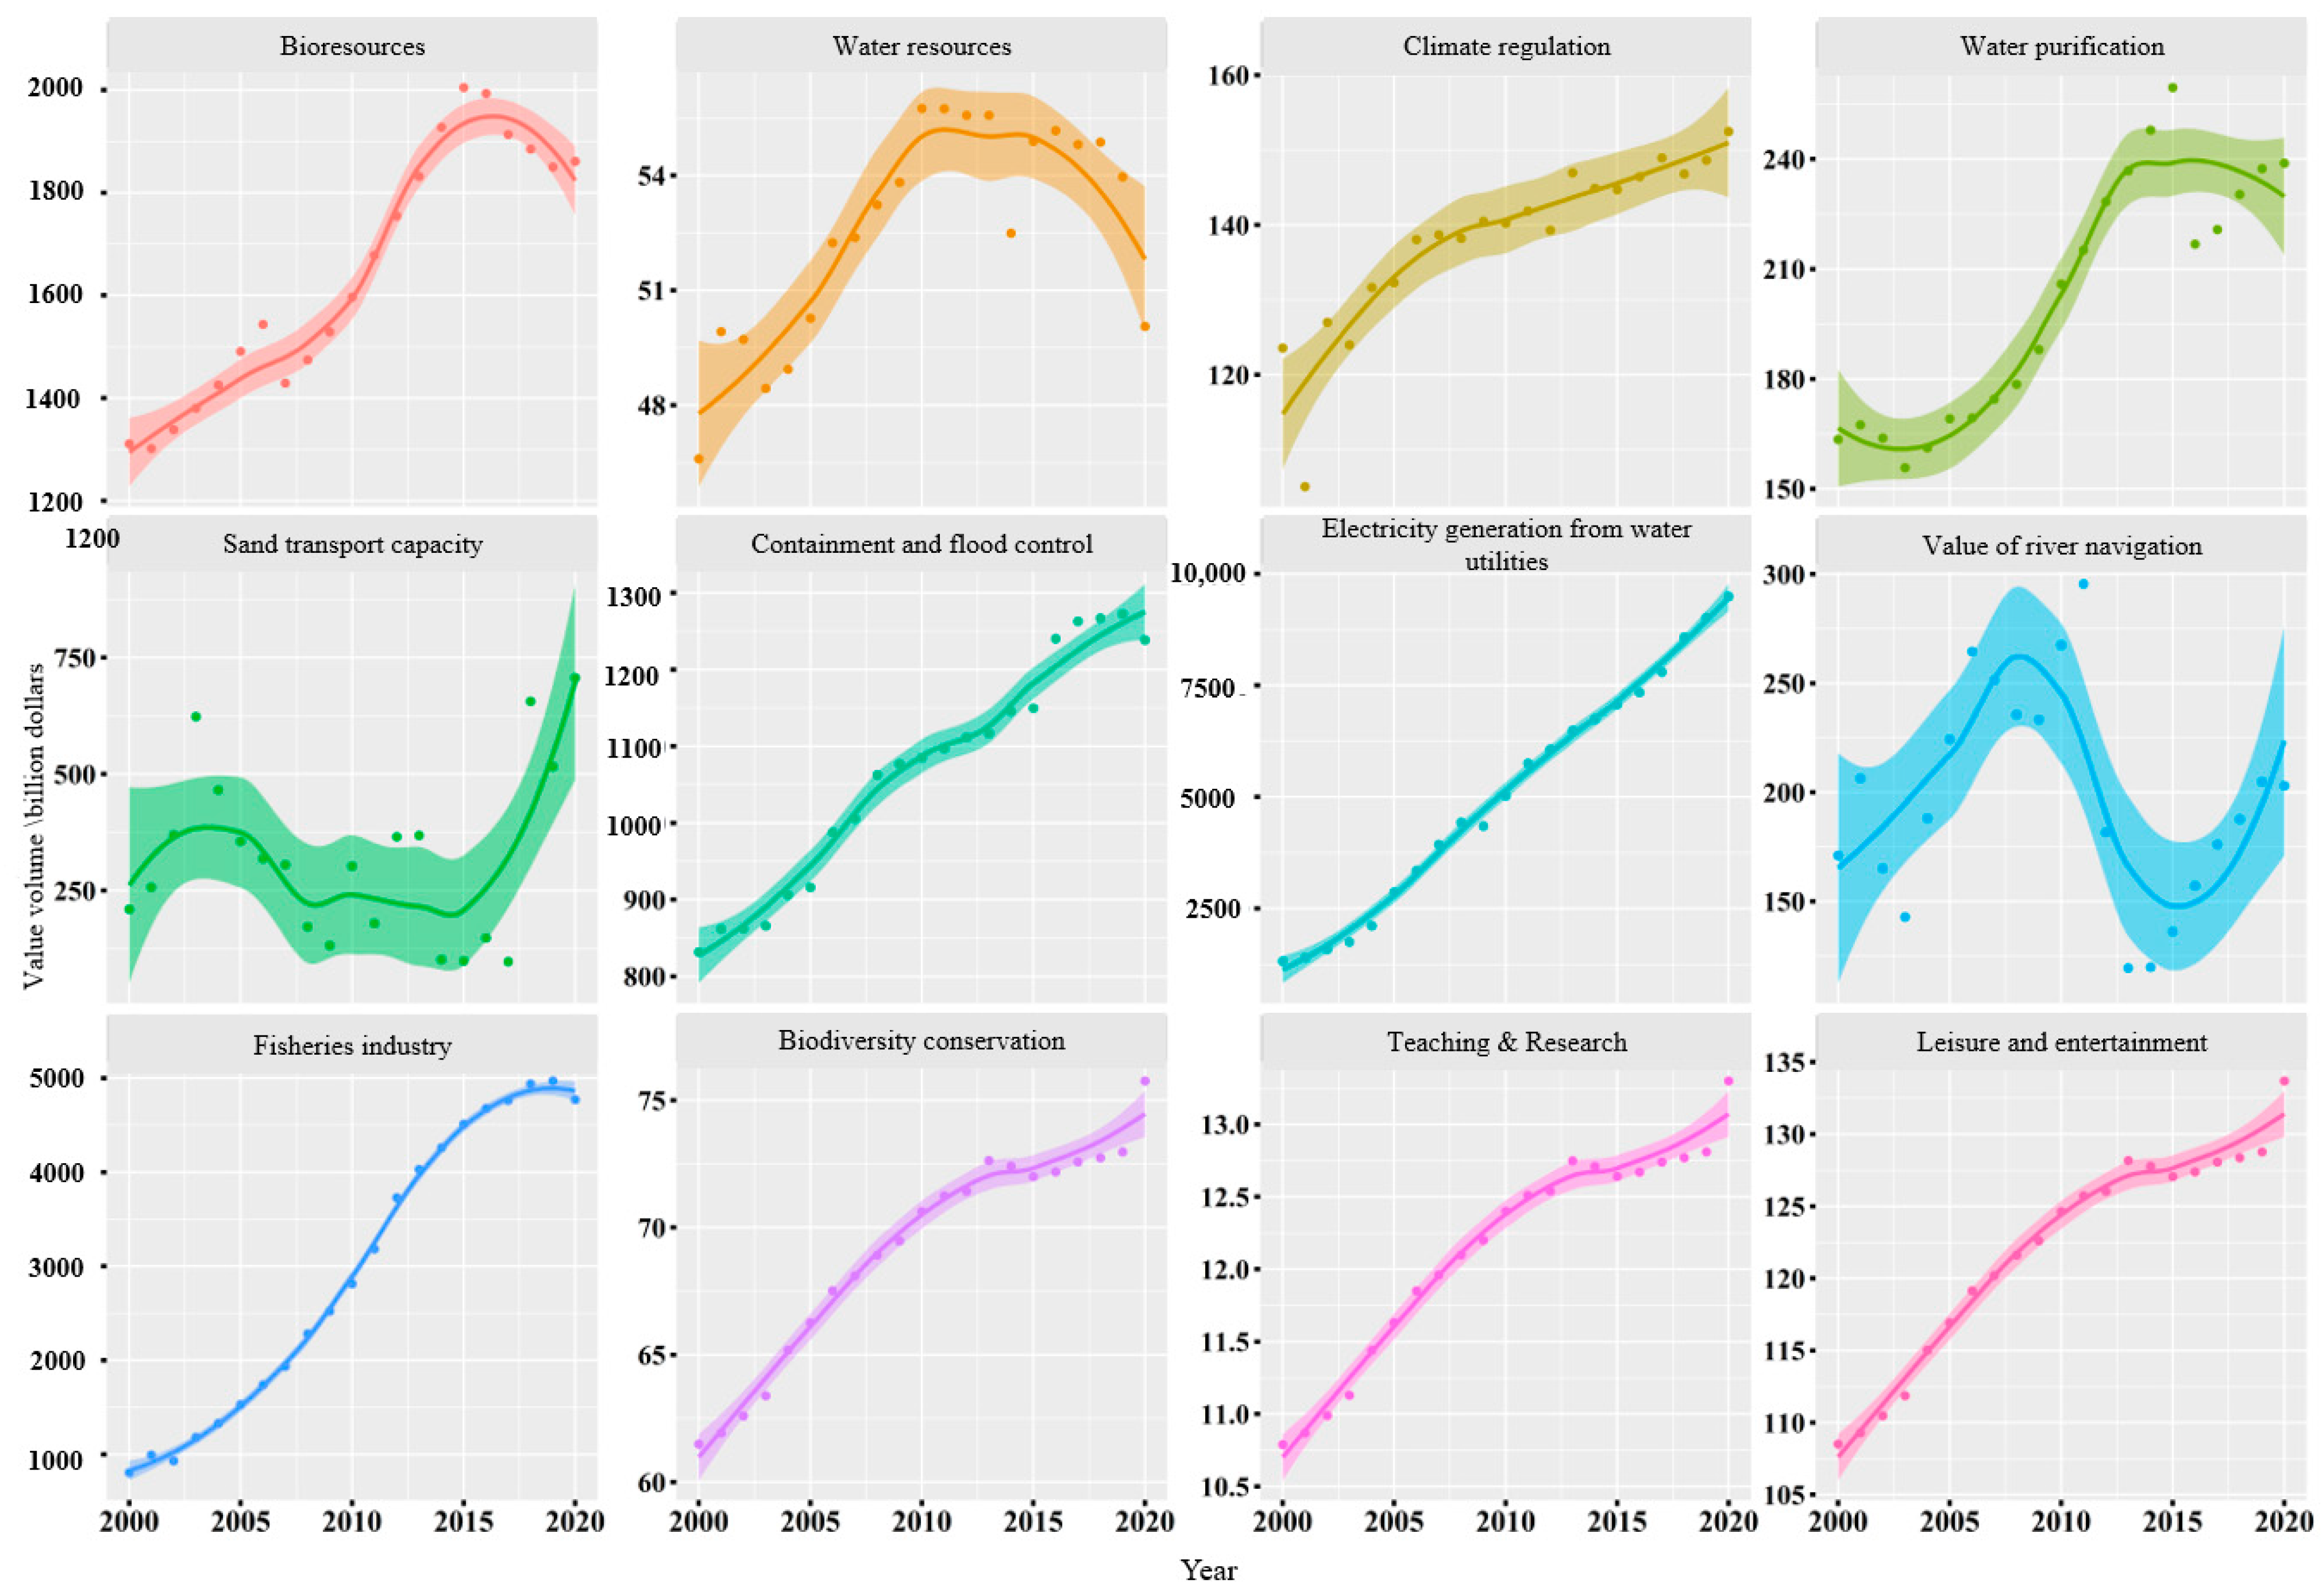
4.1. Analysis of the Results of River Health Value Assessment in the Yellow River Basin Based on the Watershed Scale
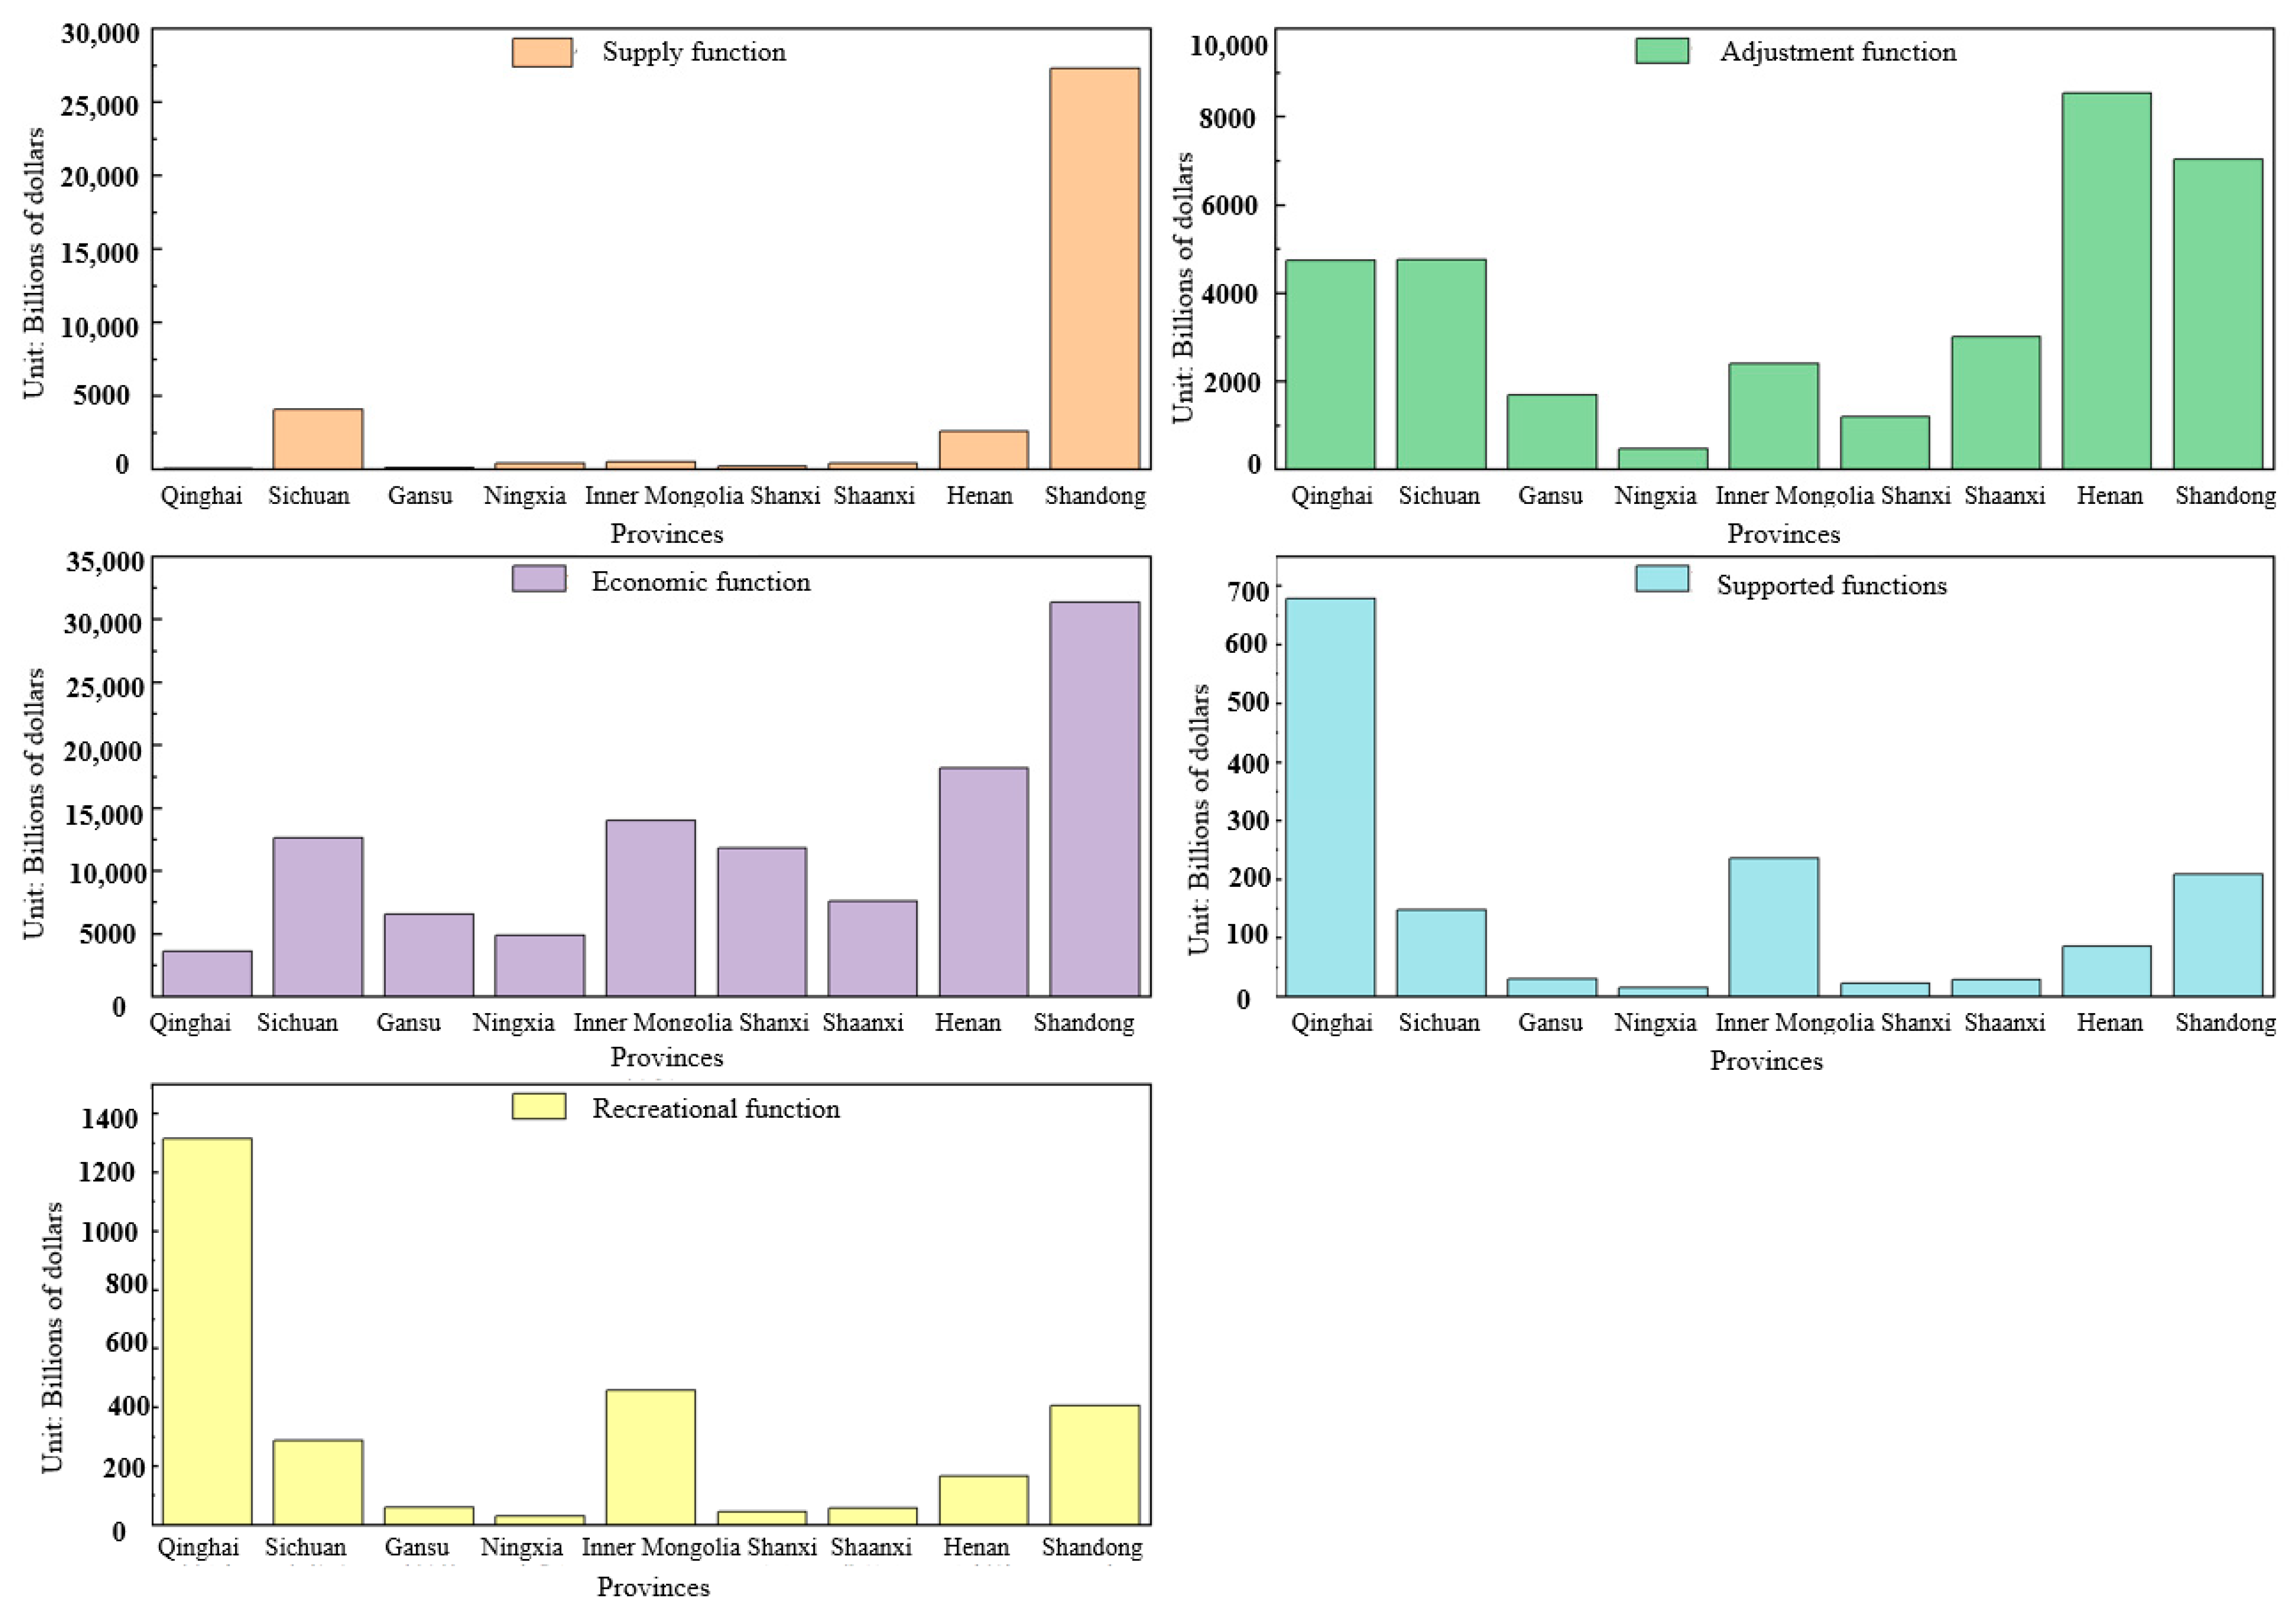
4.2. Analysis of the Results of River Health Value Assessment in the Yellow River Basin Based on the Provincial Administrative District Scale
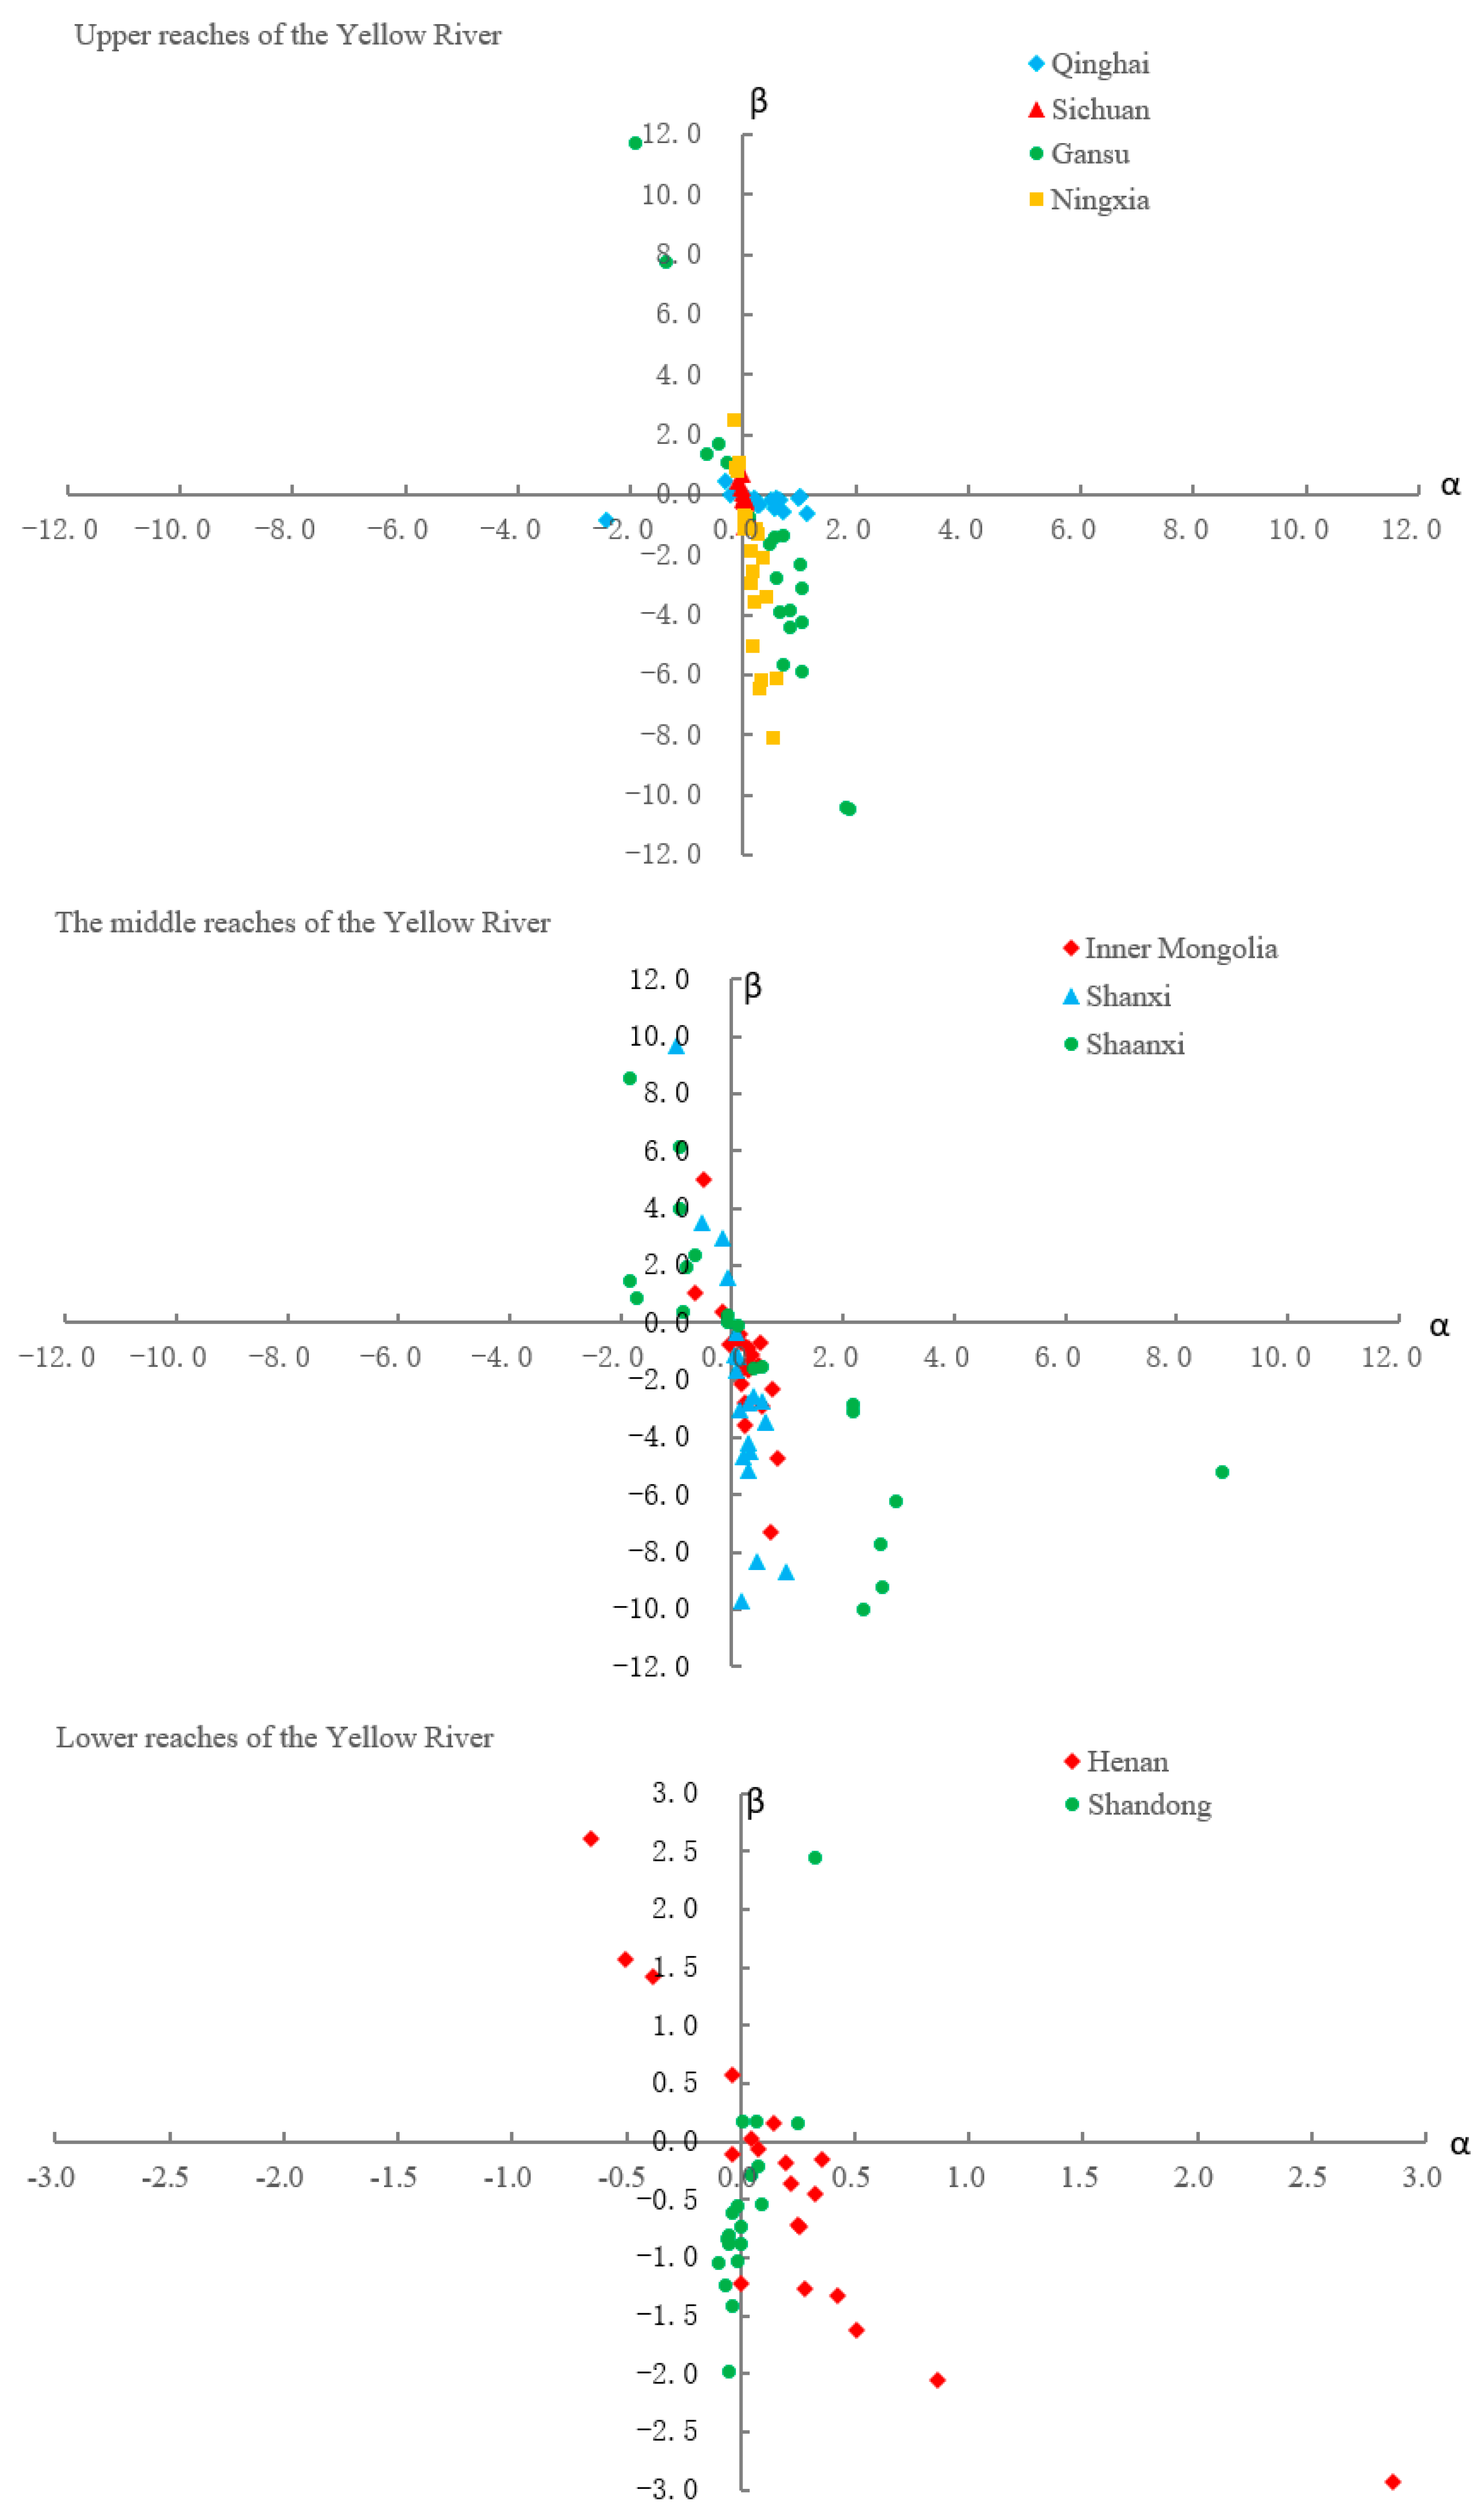
4.3. Analysis of the Results for the Coefficient of Coexistence for River Health Value Assessment in the Yellow River Basin
5. Conclusions
5.1. Research Conclusions
5.2. Recommendations
Author Contributions
Funding
Data Availability Statement
Conflicts of Interest
References
- Copeland, C. Clean Water Act: A Summary of the Law; Congressional Research Service, Library of Congress: Washington, DC, USA, 1999. [Google Scholar]
- Rapport, D.J.; Regier, H.A.; Hutchinson, T.C. Ecosystem behavior under stress. Am. Nat. 1985, 125, 617–640. [Google Scholar] [CrossRef]
- Norris, R.H.; Thoms, M.C. What is river health? Freshw. Biol. 1999, 41, 197–209. [Google Scholar] [CrossRef]
- Blue, B. What’s wrong with healthy rivers? Promise and practice in the search for a guiding ideal for freshwater management. Prog. Phys. Geogr.-Earth Environ. 2018, 42, 462–477. [Google Scholar] [CrossRef]
- James, C.R. Designing learning organizations. Organ. Dyn. 2003, 32, 46. [Google Scholar] [CrossRef]
- Li, Y.H. Research on river life realm under the concept of symbiosis. Nanjing Soc. Sci. 2013, 49–53. [Google Scholar] [CrossRef]
- Singh, P.K.; Saxena, S. Towards developing a river health index. Ecol. Indic. 2018, 85, 999–1011. [Google Scholar] [CrossRef]
- Liu, X.; Zhang, J.; Shi, W.; Wang, M.; Chen, K.; Wang, L. Priority Pollutants in Water and Sediments of a River for Control Basing on Benthic Macroinvertebrate Community Structure. Water 2019, 11, 1267. [Google Scholar] [CrossRef]
- Su, Y.; Gao, W.; Guan, D.; Zuo, T.A. Achieving Urban Water Security: A Review of Water Management Approach from Technology Perspective. Water Resour. Manag. 2020, 34, 4163–4179. [Google Scholar] [CrossRef]
- Shan, C.; Dong, Z.; Lu, D.; Xu, C.; Wang, H.; Ling, Z.; Liu, Q. Study on river health assessment based on a fuzzy matter-element extension model. Ecol. Indic. 2021, 127, 107742. [Google Scholar] [CrossRef]
- Sadat, M.A.; Guan, Y.; Zhang, D.; Shao, G.; Cheng, X.; Yang, Y. The associations between river health and water resources management lead to the assessment of river state. Ecol. Indic. 2020, 109, 105814. [Google Scholar] [CrossRef]
- Aura, C.M.; Nyamweya, C.S.; Owiti, H.; Odoli, C.; Musa, S.; Njiru, J.M.; Nyakeya, K.; Masese, F.O. Citizen science for bio-indication: Development of a community-based index of ecosystem integrity for assessing the status of afrotropical riverine ecosystems. Front. Water 2021, 2, 609215. [Google Scholar] [CrossRef]
- Kim, S.; Lee, S.-W.; Park, S.-R.; Shin, Y.; An, K. Socioeconomic Risks and Their Impacts on Ecological River Health in South Korea: An Application of the Analytic Hierarchy Process. Sustainability 2021, 13, 6287. [Google Scholar] [CrossRef]
- National Bureau of Statistics of China. China Statistical Yearbook 2000–2020. Available online: https://www.stats.gov.cn/sj/ndsj/ (accessed on 4 March 2023).
- ChinaRural Statistical Yearbook 2000–2020. Available online: https://www.stats.gov.cn/zs/tjwh/tjkw/tjzl/202302/t20230215_1907947.html (accessed on 15 March 2023).
- China Environ-Mental Statistical Yearbook 2000–2020. Available online: https://www.stats.gov.cn/zs/tjwh/tjkw/tjzl/202302/t20230215_1907855.html (accessed on 15 February 2023).
- China Electric Power Statistical Yearbook 2000–2020. Available online: https://www.stats.gov.cn/zs/tjwh/tjkw/tjzl/202302/t20230215_1907967.html (accessed on 15 February 2023).
- China River Sediment Bulletin 2000–2020. Available online: http://xxzx.mwr.gov.cn/swszyjcpj/dbsjcpj/202201/t20220112_1559381.html (accessed on 15 March 2023).
- China Fisheries Statistical Yearbook 2000–2020. Available online: http://www.moa.gov.cn/gk/zcjd/201904/t20190419_6196845.htm (accessed on 15 February 2023).
- Hou, J.; Zhang, Y. Research on the evaluation index system of ecological health of Hun River in Shenyang. Environ. Prot. Sci. 2007, 74–77+80. [Google Scholar] [CrossRef]
- Spencer, C.; Robertson, A.I.; Curtis, A. Development and testing of a rapid appraisal wetland condition index in south-eastern Australia. J. Environ. Manag. 1998, 54, 143–159. [Google Scholar] [CrossRef]
- National Development and Reform Commission on the Adjustment of Water Supply Prices for the Lower Yel-low River Diversion Canal Project and Yecheng Reservoir Water Supply Price Notice.NDRC Price [2005] No. 2005. Available online: https://www.gov.cn/zwgk/2013-04/02/content_2368290.htm (accessed on 15 February 2023).
- Development and Reform Price [2005] No. 582. Available online: https://law.esnai.com/mview/32533 (accessed on 15 February 2023).
- Ding, D.; Li, M.; Liao, B.; Dan, X. Valuation of ecosystem service functions of coastal natural wetlands in Hainan Province. J. Ecol. Environ. 2015, 24, 1472–1477. [Google Scholar] [CrossRef]
- Xue, T.; Lei, S.; Zhong, M.; Xiangqu, Z.; Genfa, L. Analysis of sewage treatment fee system based on the operating cost of sewage treatment plants-estimation based on a sample of 227 sewage treatment plants across China. China Environ. Sci. 2015, 35, 3833–3840. [Google Scholar]
- Xing, H.; Hou, X.; Xing, X.; Jianzhong, W.; Fawen, X. Introduction to the mining and effective utilization of Yellow River sediment. China Soil Water Conserv. 2015, 39–40. [Google Scholar] [CrossRef]
- Chen, D.; Zhao, Q.; Jiang, P.; Li, M. Incorporating ecosystem services to assess progress towards sustainable development goals: A case study of the Yangtze River Economic Belt, China. Sci. Total Environ. 2022, 806, 151277. [Google Scholar] [CrossRef]
- Chen, Z.; Zhang, X. The value of ecosystem benefits in China. Chin. Sci. Bull. 2000, 45, 17–22. [Google Scholar]
- Xie, G.; Zhang, C.; Zhang, L.; Chen, W.; Li, S. Improvement of ecosystem service valorization method based on unit area value equivalent factor. J. Nat. Resour. 2015, 30, 1243–1254. [Google Scholar]
- Tang, Q.; Xu, X.; He, Z. A model and empirical study of the symbiotic development between the producer-service industry and the manufacturing industry. Nankai Bus. Rev. 2009, 12, 20–26. [Google Scholar]
- Wang, S.; Sun, C.; Fan, F. Research on the ecological coordination mode of China’s coastal provinces and cities’ marine economy based on symbiosis theory. Geoscience 2018, 38, 342–350. [Google Scholar] [CrossRef]


| Service Classification | Assessment of Indicators | Description of Indicators | Assessment Methodology |
|---|---|---|---|
| Supply function | Bioresources | Mainly economic species such as aquatic products | Market value approach |
| Water resources | Water supply, including water for domestic use, industry, and agriculture | Market value approach | |
| Adjustment function | Climate regulation | Evaporation from the surface of the water, regulating the temperature | Opportunity cost approach |
| Water purification | Self-purifying capacity of rivers to clean up pollutants | Alternative cost method | |
| Sand transport capacity | Sediment transport in the study area | Market value approach | |
| Containment and flood control | Flood prevention | Shadow engineering approach | |
| Economic function | Generation of electricity from water utilities | Production of electricity resources from hydroelectric facilities | Market value approach |
| Value of river navigation | Water supply for river navigation | Market value approach | |
| Fisheries industry | Gross value of fisheries | Market value approach | |
| Supported functions | Biodiversity conservation | Types of plant and animal resources | Results-based approach |
| Recreational function | Teaching and research | Provision of scientific research materials and laboratory space for academic fields | Results-based approach |
| Leisure and entertainment | Provide places for recreation, tourism, and other activities | Results-based approach |
| Service Classification | Assessment of Indicators | Entropy Weight |
|---|---|---|
| Supply function | Bioresources | 0.07 |
| Water resources | 0.11 | |
| Adjustment function | Climate regulation | 0.12 |
| Water purification | 0.06 | |
| Sand transport capacity | 0.05 | |
| Containment and flood control | 0.08 | |
| Economic function | Generation of electricity from water utilities | 0.07 |
| Value of river navigation | 0.08 | |
| Fisheries industry | 0.07 | |
| Supported functions | Biodiversity conservation | 0.09 |
| Recreational function | Teaching and research | 0.09 |
| Leisure and entertainment | 0.09 |
| Symbiosis Value | Behavioral Model | Characteristics of Performance |
|---|---|---|
| α < 0, β < 0 | Inverse symbiosis | A certain victimization between socio-economics and natural ecology |
| α = 0, β = 0 | Parallelism | A need for mutual harmonization between socio-economic and natural ecosystems |
| α > 0, β < 0 or α < 0, β > 0 | Parasitic | The natural ecology is the beneficiary and the socio-economy is the victim |
| α > 0, β = 0 or α = 0, β > 0 | Positively biased symbiosis | A relationship between the socio-economy and the natural ecology that tends to favor the benefits of the natural ecology |
| α < 0, β = 0 or α = 0, β < 0 | Reverse bias symbiosis | A relationship between socio-economic and natural ecology that favors socio-economic benefits |
| α > 0, β > 0 | Mutually beneficial symbiosis | Relationships between socio-economic and natural ecosystems are positive, with both benefiting from cooperation |
| Provinces | Norm | 2000 | 2005 | 2010 | 2015 | 2020 | Provinces | Norm | 2000 | 2005 | 2010 | 2015 | 2020 |
|---|---|---|---|---|---|---|---|---|---|---|---|---|---|
| Qinghai | Natural ecological level | 0.71 | 0.62 | 0.52 | 0.43 | 0.41 | Shanxi | Natural ecological level | 0.18 | 0.10 | 0.08 | 0.08 | 0.06 |
| Socio-economic level | 0.11 | 0.21 | 0.35 | 0.44 | 0.46 | Socio-economic level | 0.79 | 0.87 | 0.90 | 0.90 | 0.92 | ||
| Environmental capacity | 0.18 | 0.17 | 0.13 | 0.12 | 0.12 | Environmental capacity | 0.04 | 0.03 | 0.02 | 0.02 | 0.01 | ||
| Sichuan | Natural ecological level | 0.23 | 0.17 | 0.14 | 0.17 | 0.16 | Shaanxi | Natural ecological level | 0.51 | 0.40 | 0.26 | 0.15 | 0.17 |
| Socio-economic level | 0.50 | 0.60 | 0.68 | 0.67 | 0.70 | Socio-economic level | 0.44 | 0.55 | 0.71 | 0.80 | 0.79 | ||
| Environmental capacity | 0.28 | 0.23 | 0.18 | 0.16 | 0.14 | Environmental capacity | 0.06 | 0.05 | 0.03 | 0.05 | 0.04 | ||
| Gansu | Natural ecological level | 0.34 | 0.25 | 0.18 | 0.14 | 0.12 | Henan | Natural ecological level | 0.51 | 0.34 | 0.24 | 0.19 | 0.24 |
| Socio-economic level | 0.61 | 0.71 | 0.79 | 0.84 | 0.87 | Socio-economic level | 0.40 | 0.56 | 0.69 | 0.72 | 0.68 | ||
| Environmental capacity | 0.05 | 0.04 | 0.03 | 0.02 | 0.01 | Environmental capacity | 0.09 | 0.10 | 0.07 | 0.09 | 0.08 | ||
| Ningxia | Natural ecological level | 0.25 | 0.13 | 0.10 | 0.06 | 0.06 | Shandong | Natural ecological level | 0.08 | 0.10 | 0.07 | 0.04 | 0.07 |
| Socio-economic level | 0.64 | 0.81 | 0.87 | 0.92 | 0.93 | Socio-economic level | 0.47 | 0.59 | 0.70 | 0.76 | 0.78 | ||
| Environmental capacity | 0.11 | 0.06 | 0.03 | 0.02 | 0.02 | Environmental capacity | 0.45 | 0.32 | 0.23 | 0.20 | 0.16 | ||
| Inner Mongolia | Natural ecological level | 0.41 | 0.24 | 0.20 | 0.09 | 0.09 | |||||||
| Socio-economic level | 0.40 | 0.66 | 0.75 | 0.86 | 0.89 | ||||||||
| Environmental capacity | 0.19 | 0.10 | 0.06 | 0.05 | 0.03 |
Disclaimer/Publisher’s Note: The statements, opinions and data contained in all publications are solely those of the individual author(s) and contributor(s) and not of MDPI and/or the editor(s). MDPI and/or the editor(s) disclaim responsibility for any injury to people or property resulting from any ideas, methods, instructions or products referred to in the content. |
© 2023 by the authors. Licensee MDPI, Basel, Switzerland. This article is an open access article distributed under the terms and conditions of the Creative Commons Attribution (CC BY) license (https://creativecommons.org/licenses/by/4.0/).
Share and Cite
Xiong, P.; Zhu, J.; He, R.; Li, H. Synergy Assessment of River Health Values from a Symbiotic Perspective: A Case Study of the Yellow River Basin in China. Water 2024, 16, 91. https://doi.org/10.3390/w16010091
Xiong P, Zhu J, He R, Li H. Synergy Assessment of River Health Values from a Symbiotic Perspective: A Case Study of the Yellow River Basin in China. Water. 2024; 16(1):91. https://doi.org/10.3390/w16010091
Chicago/Turabian StyleXiong, Puran, Jiwei Zhu, Ran He, and Hucheng Li. 2024. "Synergy Assessment of River Health Values from a Symbiotic Perspective: A Case Study of the Yellow River Basin in China" Water 16, no. 1: 91. https://doi.org/10.3390/w16010091
APA StyleXiong, P., Zhu, J., He, R., & Li, H. (2024). Synergy Assessment of River Health Values from a Symbiotic Perspective: A Case Study of the Yellow River Basin in China. Water, 16(1), 91. https://doi.org/10.3390/w16010091