Article

Modeling Plant Height and Biomass Production of Cluster Bean and Sesbania across Diverse Irrigation Qualities in Pakistan’s Thar Desert

1
State Key Laboratory of Desert and Oasis Ecology, Xinjiang Institute of Geography and Ecology, Chinese Academy of Sciences, Urumqi 830011, China
2
Sindh Engro Coal Mining Company, 16th Floor, The Harbour Front Building, Block 4, Clifton, Karachi 75600, Pakistan
*
Author to whom correspondence should be addressed.
Water 2024, 16(1), 9; https://doi.org/10.3390/w16010009
Submission received: 26 November 2023 / Revised: 10 December 2023 / Accepted: 14 December 2023 / Published: 19 December 2023

Abstract

:
Plant height (PH) plays a crucial role in determining per-plant growth and biomass production. Various characteristics of PH, along with the formulation of mathematical growth models, can provide a theoretical yield or biomass production based on water quality, fruit quality, and yields. The aim of this study was to investigate the relationship between PH and biomass per-plant production of two fodder crops (Cluster bean and Sesbania) under different water quality irrigation parameters in the Thar desert of Pakistan. Universal models of PH were established in which growing degree days (GDDs) and different water quality irrigation techniques have been applied as independent variables to calculate the maximum plant height of both of these crops. For this purpose, the logistic growth model, Gaussian growth model, modified Gaussian growth model, and Cubic polynomial growth model were used. Furthermore, universal biomass per plant production models have been developed for both crops, between biomass per plant, GDDs, and PH. However, among all these developed models, the modified Gaussian and Cubic polynomial growth models produced the best results. The Cubic polynomial model has meaningless parameters that make the model not very accurate, so the modified Gaussian growth model is the best among all models. Furthermore, the relationship between biomass per plant and different water qualities was established using Michaelis–Menten equations for both crops. It was observed that an increase in salt concentration within the water quality led to a decline in biomass per plant, indicating a negative linear relationship between these factors. The growth of Cluster bean and Sesbania ceased when the electrical conductivity (EC) reached or exceeded 12.34 ds/m and 11.51 ds/m, respectively. Furthermore, the results show that Cluster bean and Sesbania have the maximum plant height under brackish water irrigation when the GDD is at 1500 °C, while in freshwater irrigation, the maximum plant height of Sesbania and Cluster bean was observed when the GDD is at 1444 °C and 1600 °C. It was concluded that these developed mathematical models can provide crucial insights for enhancing production in desert conditions by improving water use efficiency across diverse irrigation water qualities.

1. Introduction

Pakistan is located in south Asia and has a total area of 796,096 km2, out of which 3% is water and 97% is land. Pakistan’s land is 3% forests and mountains and 21% desert, and only 26% is arable land [1]. Pakistan is an agricultural country, and 70% of its population runs their houses through agriculture. Agriculture production contributes 25% to the gross domestic production (GDP) of Pakistan [2]. The population of Pakistan is increasing day by day, but agricultural land and freshwater resources are going to be scarce due to the development of housing societies and industries. These changes are having a great impact on the production of the agriculture sector. Under these circumstances, it is very important to utilize soil salinization land, desert land, and brackish water resources for crop production [3], because the higher population is threatening the ability of the agriculture sector to fulfill world food demand [4]. The Thar Parker desert is located in an arid and semi-arid region in the southern part of the Sindh province of Pakistan. The Thar Parker region suffers from dry soil because of less rainfall and high temperatures, creating higher evapotranspiration rates and deep brackish groundwater resources [5,6]. Crop and vegetation growth in this region is very tough because of the harsh environment, brackish water, and poor drainage [7]. To overcome these difficulties, traditional practices such as salt-tolerant plant species along with different irrigation and planting techniques are adopted [8,9].
Sesbania (Sesbania sesban (L.) Merr.) and Cluster bean (Cyamopsis tetragonoloba L.) are rapidly growing annual shrubs in the arid and semi-arid regions of Pakistan and India [10]. Almost 80% of Cluster beans and Sesbania were grown in India and Pakistan in the rain-fed periods because of their drought, salinity, and high-temperature tolerance ability [11,12]. Cluster bean and Sesbania are both grown as green manuring crops in different parts of the world because these crops help to enhance soil fertility [13,14]. In arid and semi-arid regions, both of these crops are used as cattle feed because both of these crops contain high amounts of protein and minerals [11,15]. The growth of these crops intended for cattle feed production predominantly relies on the height of the plant and the production of biomass per individual plant [16]. Plant height has a very critical role in the development of plant growth and biomass production because it contains leaves that take part in the transpiration, evaporation, and photosynthesis processes [17]. Furthermore, plant height plays an important role in connecting with light to run the photosynthesis process [18,19]. Photosynthesis is the main process for plant growth development under every environmental condition [20]. Plant height has a direct relationship with per-plant biomass production because with an increasing plant height, the biomass per plant also increases [16,21]. Therefore, for growth prediction models, plant height and per-plant biomass are very important factors [22,23].
To date, many simulation and estimation techniques have been used to develop growth prediction models of different crops under different environmental conditions [24]. There are several growth prediction models that have been developed by using plant height to predict biomass production by using artificial neural network and multiple linear regression techniques [25,26]. A simulation growth model should be based on the biological and physiological parameters measured in real plants [27,28]. Plant species growth models and estimation techniques are the main methods to explore these problems [29,30,31,32]. Estimation techniques depend upon direct measurements or remote sensing to determine different plant growth traits [33,34,35,36]. Plant species growth models are developed based on theoretical foundations, i.e., the logistic growth model, Richards growth model, Chanter growth model, and Gompertz growth model [37]. A few parameters in these models describe some physical properties. These models explain how population size, nutrient values, water percentage, and yield change with time [21]. The logistic growth model is a very famous mathematical model for predicting plant growth with higher efficiency [21,38,39]. The main drawback of the logistic model is the ability to predict growth only under predefined conditions, as the parameter values are based on the environment. For example, temperature affects the growth curve of bacteria, but in theory, logistic models can be applied to predict any growth process. However, in this scenario, the logistic model cannot be summarized by creating a predicting model between temperature and bacterial growth rate [20,40]. Therefore, when temperature is included as a variable in the model to predict growth rate, then some restrictions are imposed by environmental factors.
The number of growing degree days (GDDs) is a very vital environmental factor affecting crop yield, plant growth indexes, leaf area, plant height, biomass per plant, and the harvest index [41]. Many researchers have used growth data on potato, maize, rice, wheat, and cotton in different regions of China to develop a mathematical growth model by using GDDs as a key input parameter [31,42,43,44]. Furthermore, a mathematical growth model of cotton crops under a drip irrigation system along with mulching was built. In this model, they discussed the relationship between total irrigation amount along with leaf area index, maximum dry matter accumulation and harvest index [21]. They found that environmental factors like the amount of irrigation and nitrogen application have a great influence on plant growth. Many researchers build mathematical growth models of many forage grasses by using biomass production, inter-cropping harvest time, and water use efficiency as a function of nutrition and water content in different years [45,46]. Many researchers developed fruit growth models to explain the relationship between the plant’s fruit growth and environmental factors such as plant densities and different seasons. Vitis Vinfera Cv, an irrigation model, was developed by considering different climate conditions, the canopy area, and the specific leaf area. The maize leaf area index (LAI) model was built based on GDDs under the application of different nutrients such as nitrogen, phosphorus and potassium [47].
The logistic growth model is very good for predicting plant growth periods but cannot predict the growth of plants in later stages and decline periods more accurately. They are a few other mathematical models, such as the Gaussian model, Cubic polynomial model, Gaussian modified model and Log-normal model, that were used to predict the growth period of plants more accurately in every stage of plant growth [25,35]. However, these mentioned models have been developed for crops such as cotton [26], wheat [45], and maize [46,48] to predict growth under different environmental conditions. Simultaneously, there is a scarcity of studies examining these models for the growth of fodder crops in desert conditions.
Therefore, this study aimed to develop a growth predictor model between plant height and per plant biomass of Sesbania and Cluster bean by using different mathematical models under different water quality irrigation. The effects of accumulative temperature and water quality on the plant height of both fodder crops have been investigated. The biomass per plant of both crops has been estimated using maximum plant height based on Michaelis–Menten kinetics equations. Finally, a mathematical model for simulating biomass per plant of both crops based on maximum plant height and GDDs was developed.

2. Materials and Methods

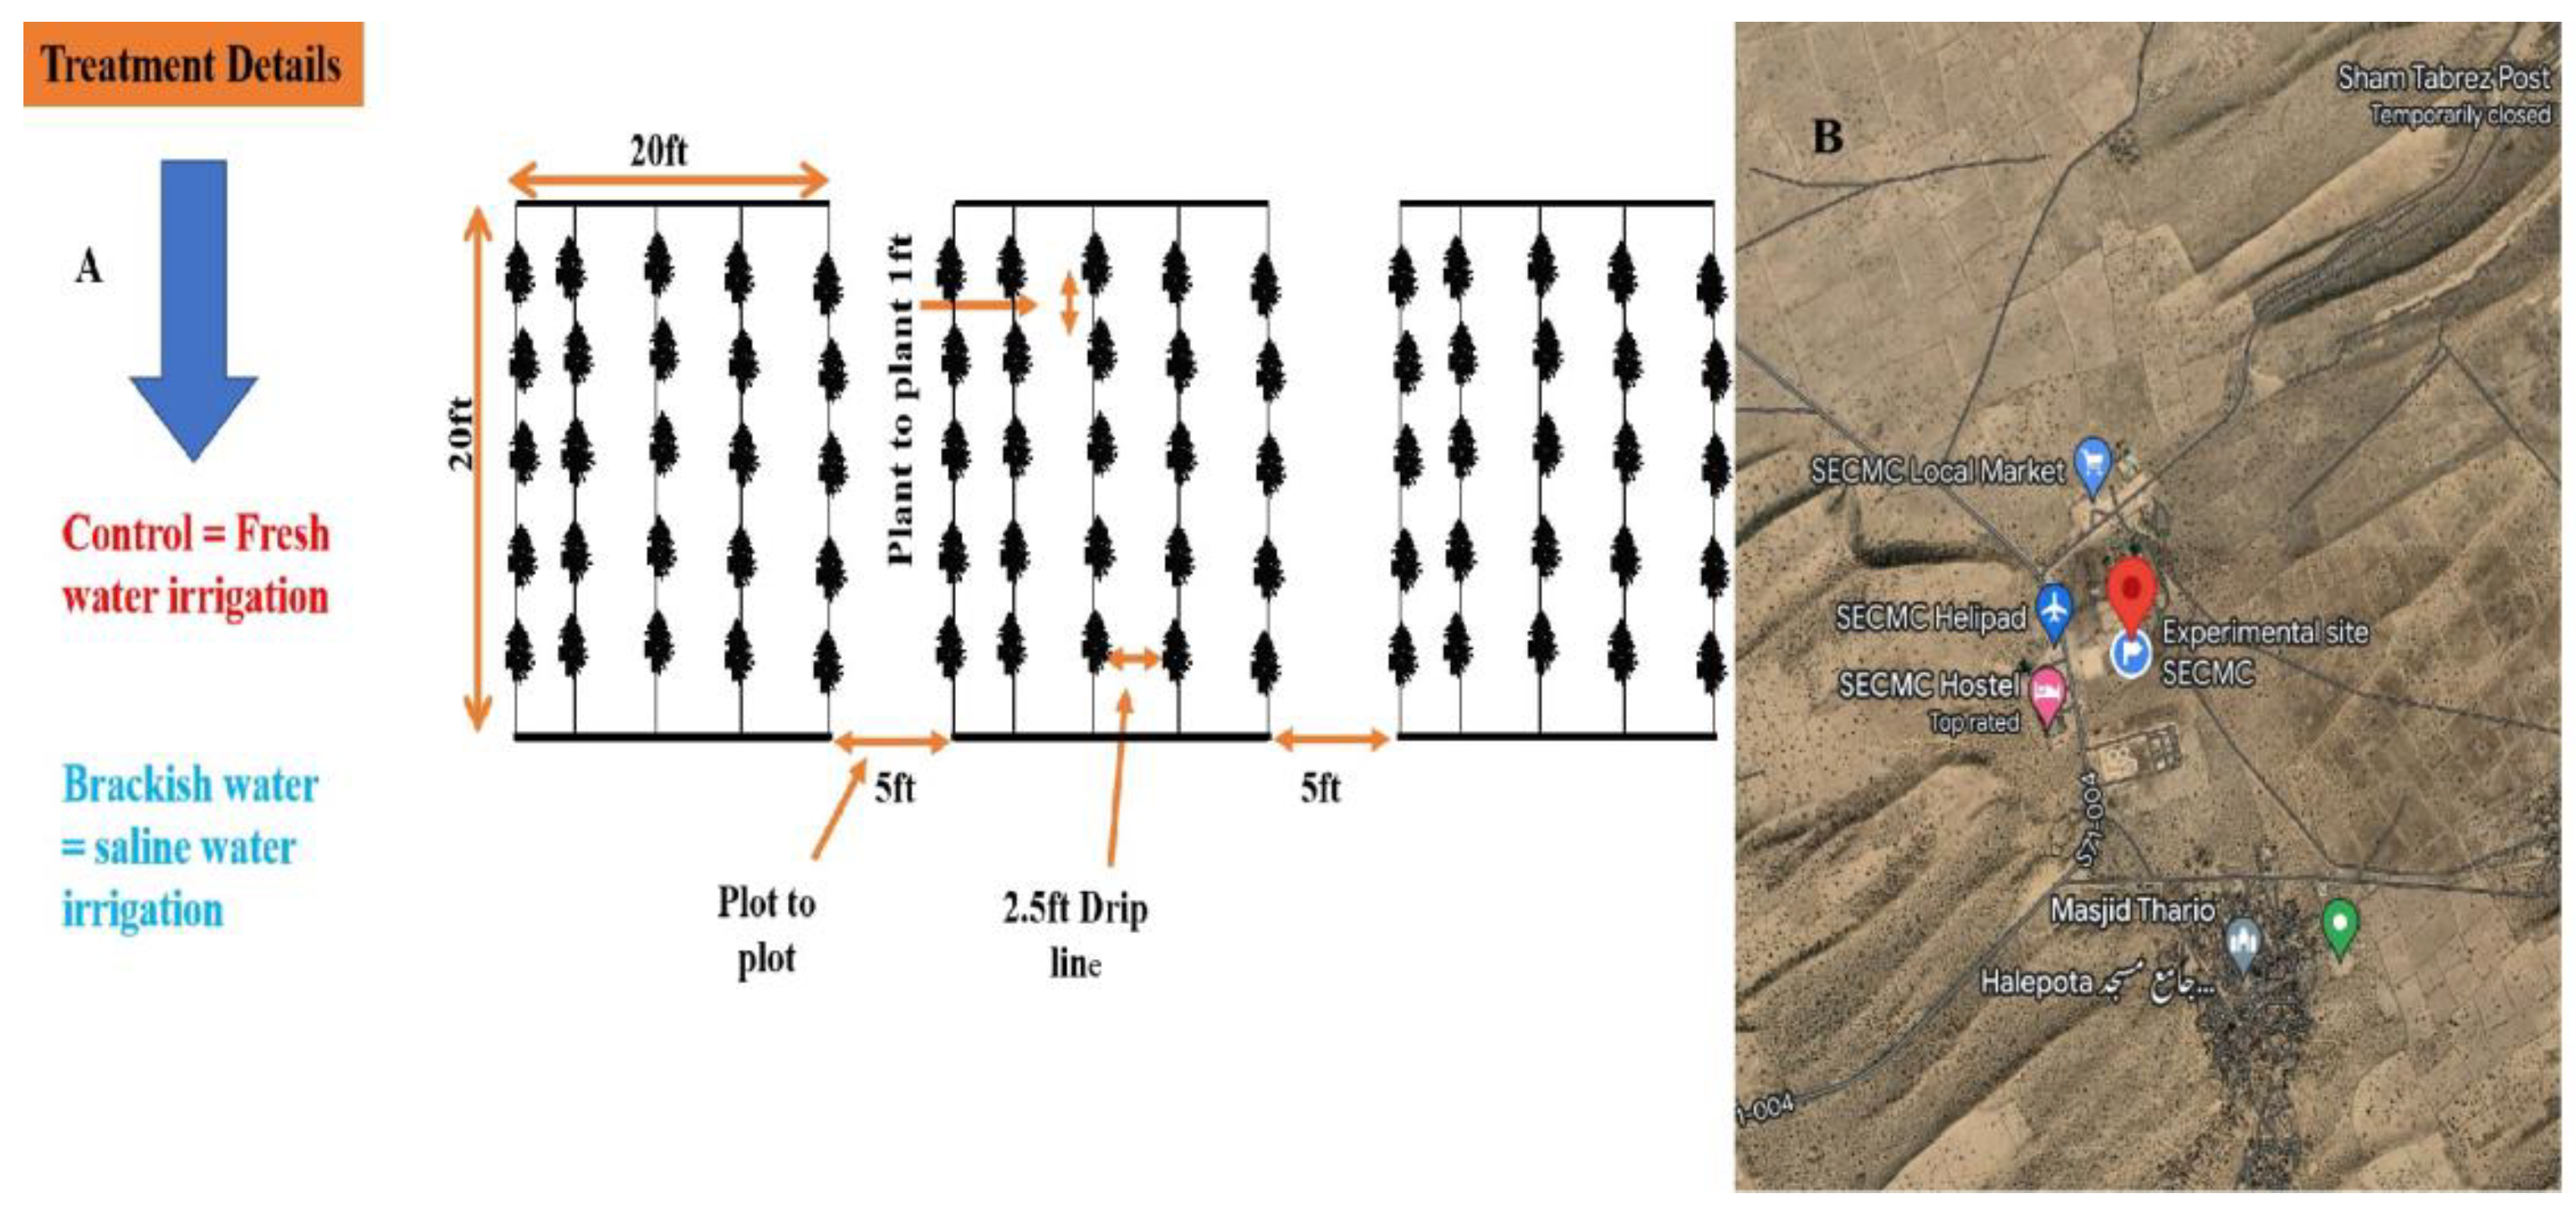
2.1. Experimental Field Conditions

Sindh Engro Coal Mining Company (SECMC) is Pakistan’s leading coal producer, operating Pakistan’s first open-pit lignite mine in Block II of the Thar Parkar desert area in the Sindh province of Pakistan. SECMC also has some experimental sites to utilize brackish water resources for agricultural purposes. A field experiment was conducted on the SECMC experimental site in the Thar desert block II, 10 km from Islamkot, Thar Parker, Sindh, Pakistan, from 20 June to 11 October 2023. The experimental site has very extreme weather conditions with a longer duration of hot summer with a maximum temperature near 48 °C and a short of winter with a minimum temperature of 1.2 °C. The annual precipitation in the experimental site is about 100 to 130 mm, and the annual evaporation is approximately 2600 mm. The soil of the experimental site is very dry loamy sandy soil with very little nutrients. The physical and chemical properties of soil are shown in Table 1.

2.2. Experimental Design

The seeds of Sesbania and Cluster beans were bought from a local market. Twenty- four hundred healthy seeds of each crop with equal size were selected for this experiment. The selected seeds of both these crops were sown in the experimental field in a complete block design with three replications of each treatment using 1 by 1 ft plant spacing in each plot of 20 × 20 ft size. There were twelve plots in total. The experimental design and field location are shown in Figure 1. Plant density is 28,800 plants/acre. The field was prepared by adding 240 kg/ha of urea fertilizer before seed sowing [49,50,51]. In the germination and seedling establishment stage, fresh water was given to each crop for about 20 days. To analyze the effect of different water quality on the growth of both these crops, three plots of each crop received brackish water irrigation, and three plots received fresh water irrigation after 20 days of sowing. The physical and chemical properties of fresh and brackish water are shown in Table 2.
The watering was completed through the drip irrigation system almost daily during the experimental period. A water meter was installed on the main irrigation pipe to control the frequency of water and fertilizer. The discharge of every emitter in the drip line was set at the rate of 3 L/h. When watering the plant in the fully brackish and freshwater irrigation, the drip irrigation system was run for half an hour to water the field at 6 mm/day. In the total experimental period, rain was in seven days, so brackish water was not given in these seven days because rainwater fulfilled the water demand on those days. The amount of water given in the experiment is given in Table 3.

2.3. Growth Trails

Sixteen plants were selected for both crops in growth trial measurements. The plant height of both these crops under brackish water irrigation and fresh water irrigation was measured at 20-day intervals in the whole experiment using measuring tape from 10 July to 10 October by selecting fifteen plants of each crop in every water treatment.
At the end of the experiment, fifteen plants of every treatment in every crop were harvested and put into the oven at 72 °C for 48 h to measure dry weight (Biomass) per plant of every crop by using weight balance [52,53,54,55,56].

Calculation of GDD

The GDD was calculated by the difference between TAverage and TBase, as shown in Equation (1) [32].
G D D = j T A v e r a g e , j T B a s e , j ,
TAverage is the daily average temperature between maximum and minimum temperature, as shown in Equation (2).
T A v e r a g e = T M a x + T M i n / 2 ,
Here, Tmax means maximum temperature, and Tmin means minimum temperature. TBase is the base or lower temperature limit that both these crops need to grow, i.e., TBase = 14 °C for Sesbania and Cluster bean in this study. Tupper is the maximum upper-temperature limit that both these crops can bear without reducing their growth; in this study, Tupper = 36 °C for both these crops. TAverage can be calculated by Equation (2). If the TAverage value is higher than the Tupper limit, then Tupper is taken as the TAverage value, and if the TAverage value is below the TBase limit, then the TBase value is taken as TAverage. The method used in this calculation was proposed by Food the and Agriculture Organization (FAO) [54].

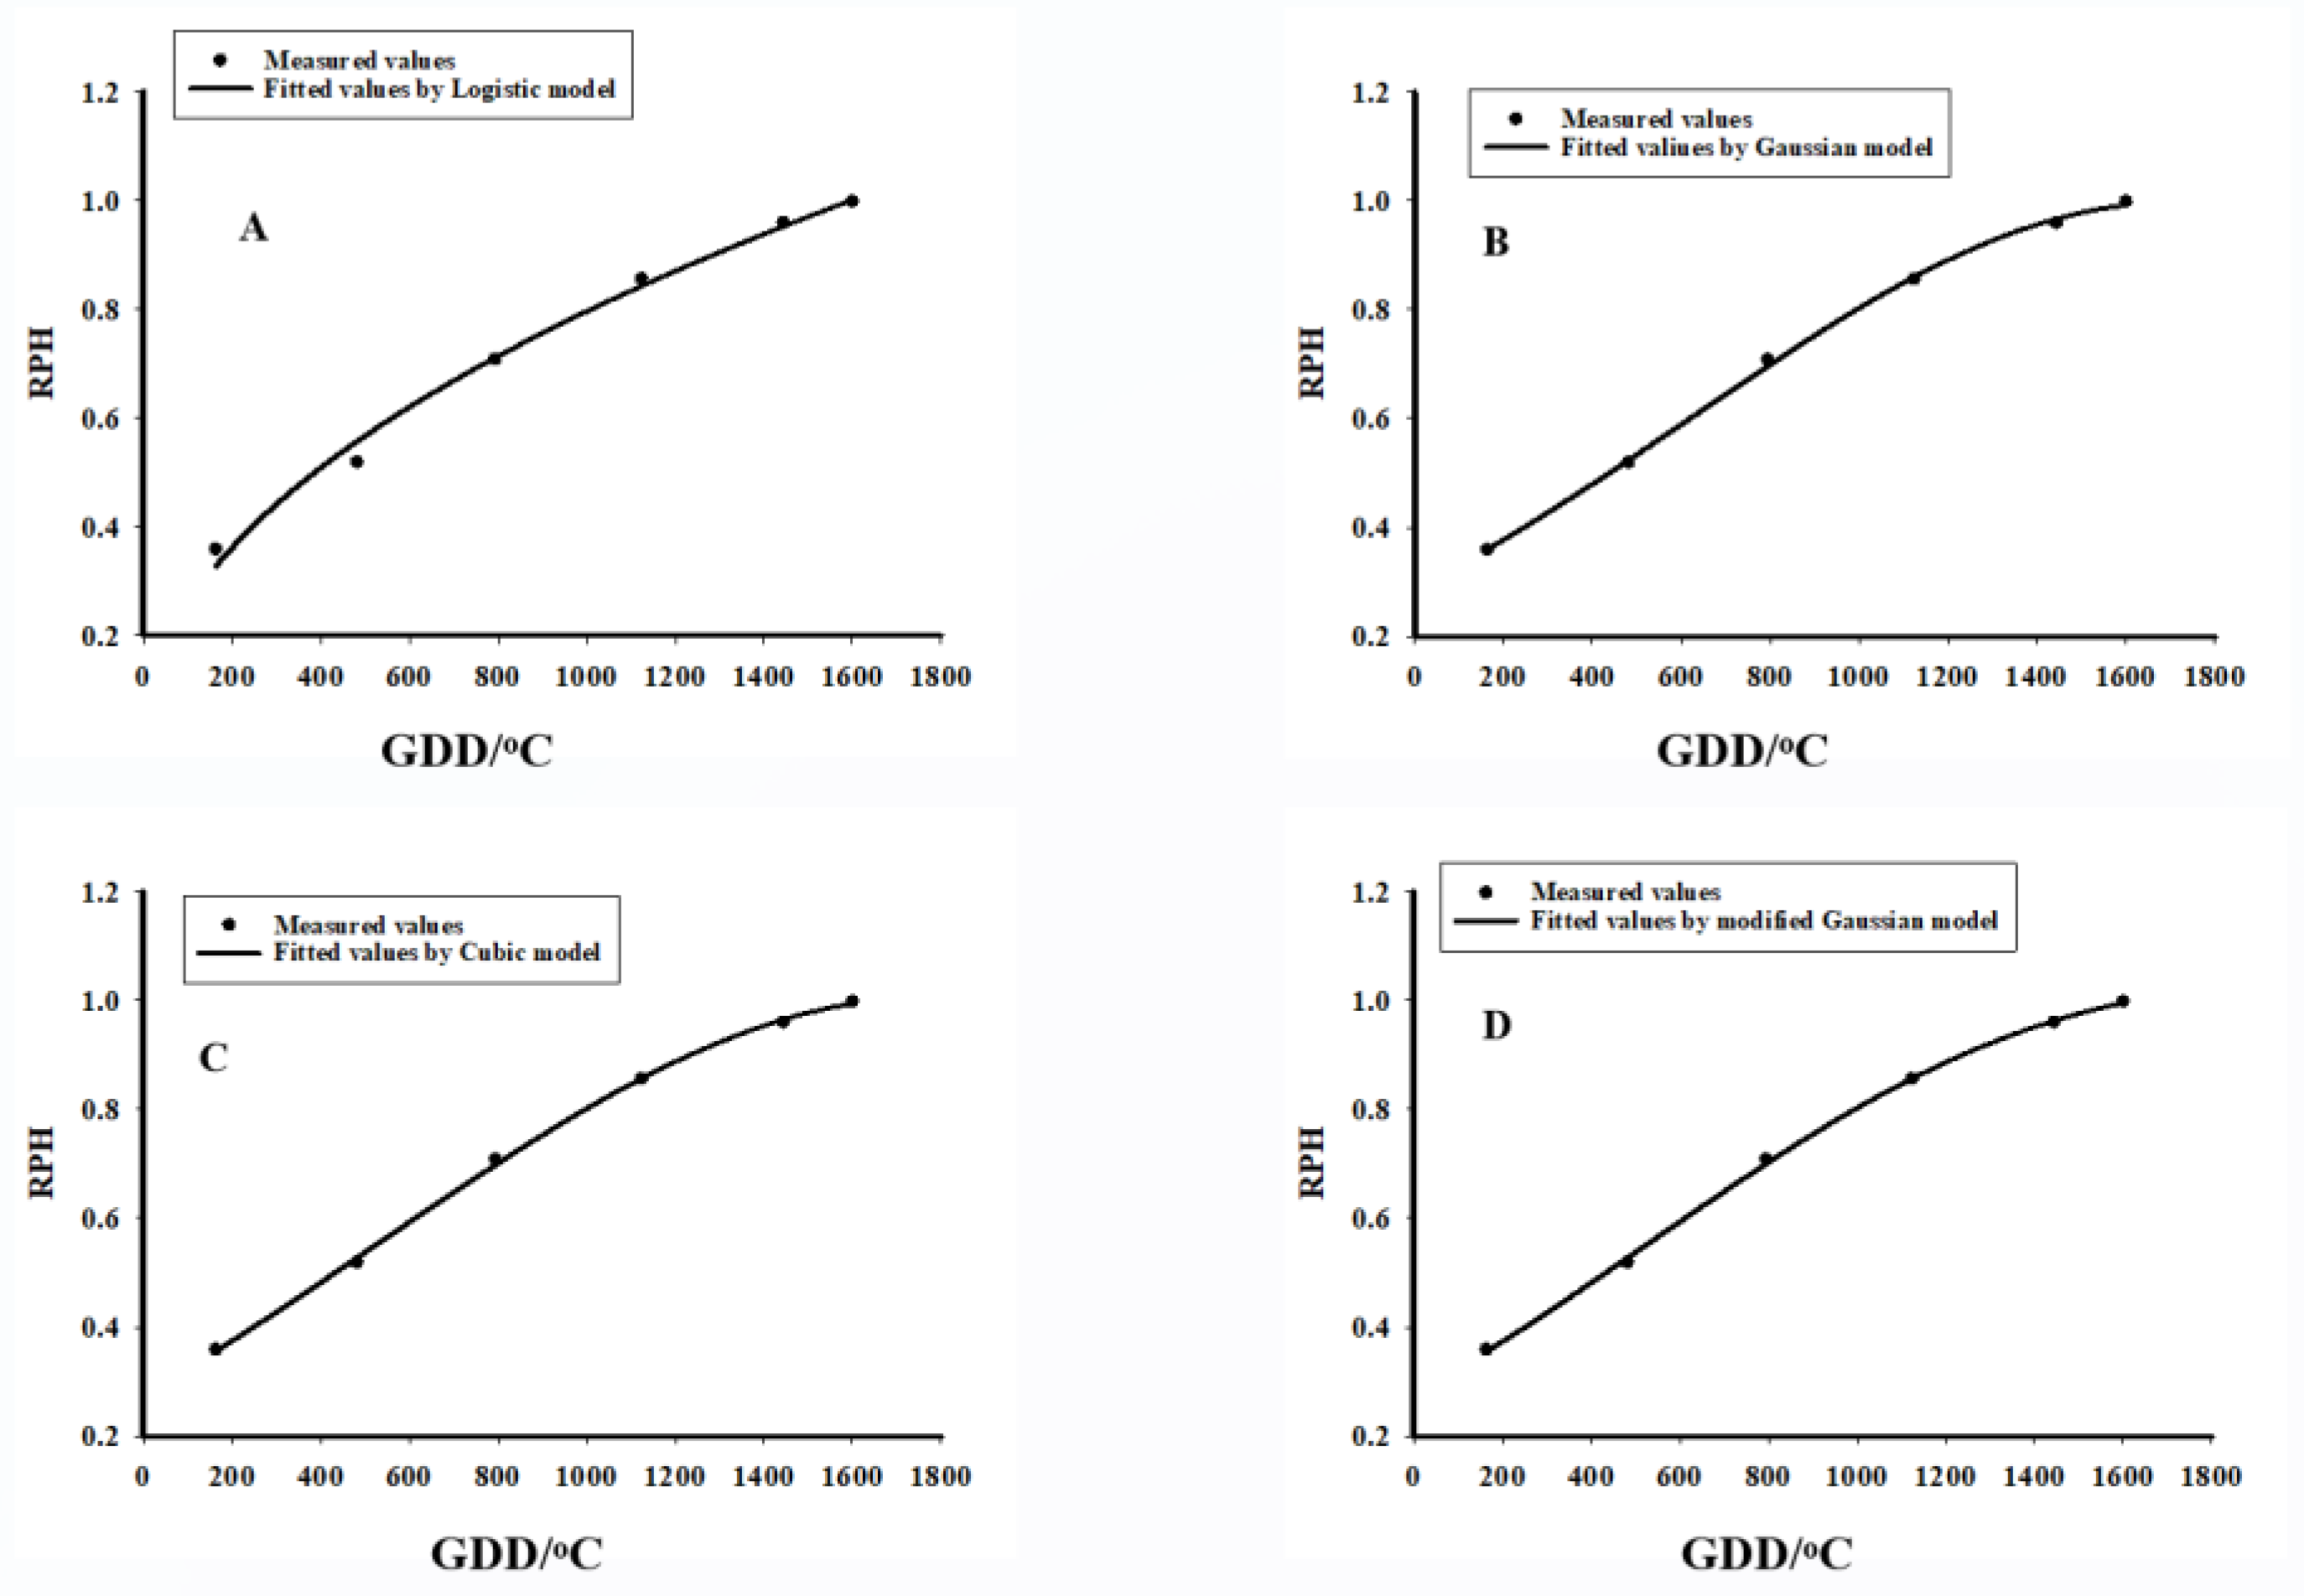
2.4. Plant Height Growth Models

In this study, four different mathematical growth models, i.e., logistic growth model, Gaussian growth model, Cubic polynomial growth model, and modified Gaussian growth model, has been used to describe the change in plant height over different period of experiment under different water quality of irrigation.
The logistic growth model is defined in Equation (3) [55,56].
P H = P H m a x 1 + e ( G D D     G D D o ) b
where PH is the plant height; PHmax is the maximum plant height, GDD is growing degree day, G D D o and b are experience coefficients.
The Cubic polynomial growth model is defined in Equation (4) [41].
P H = P H m a x + a G D D + b G D D 2 + c G D D 3
where PH is the plant height; PHmax is the maximum plant height, and GDD is growing degree day; a, b, and c are experience coefficients.
The Gaussian growth model with three parameters is defined in Equation (5), and the modified Gaussian growth model is defined in Equation (6) [41].
P H = P H m a x e [ 0.5 ( G D D     G D D o ) 2 b ]
P H = P H m a x e [ 0.5 ( G D D     G D D o ) d b ]
where PH is the plant height; PHmax is the maximum plant height, and GDD is growing degree day; G D D o b, and d are experience coefficients.

2.5. Statistical Analysis

To evaluate the performance of these mathematical models, root mean square error, the co-efficiency of determination, and the relative error were used, as shown in Equations (7)–(9).
R M S E = j = 1 ( M j P j ) 2 n
where M is the measured value, P is the predicted value, and n is the sample size.
R 2 = 1 j = 1 n ( M j P j ) 2 j = 1 n ( M j M o j ) 2
where M o j is the mean value of measured values.
R e = j = 1 n ( M j P j ) 2 j = 1 n ( M j ) 2
SigmSSigmaplot.14 was used to fit these different models using a genetic algorithm. Origin Pro 2021 was used to make graphs.

3. Results and Discussion

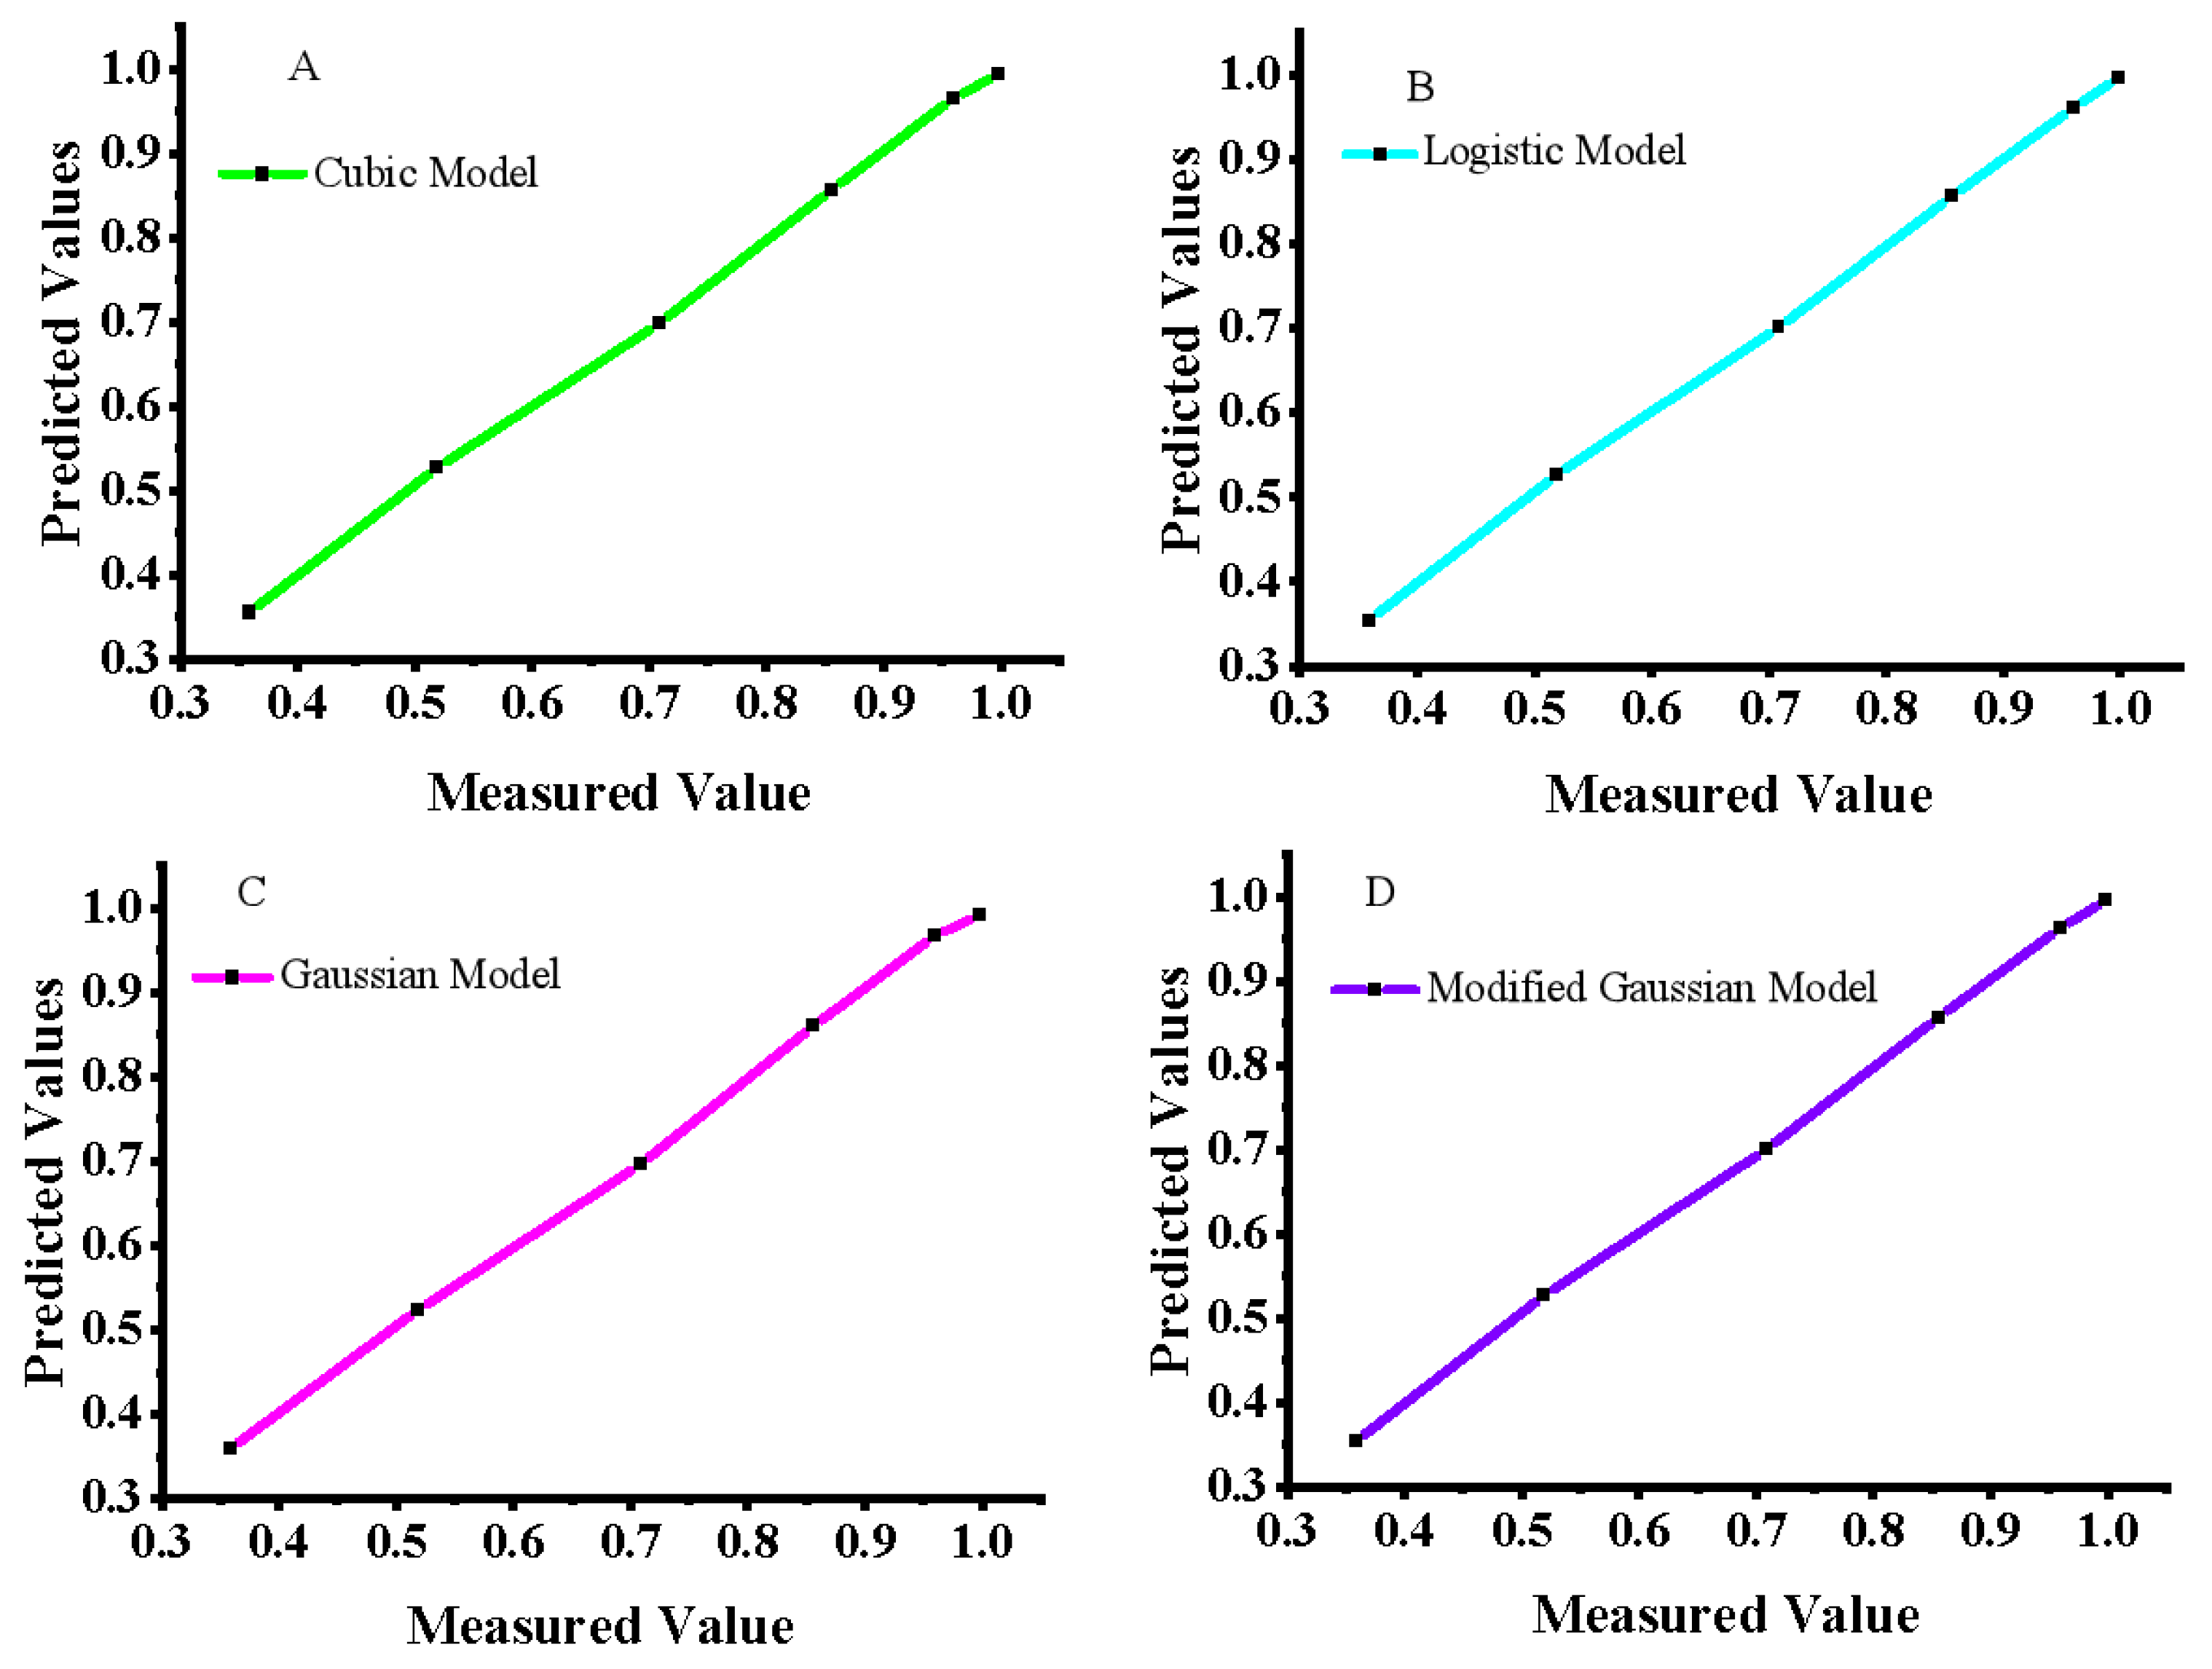
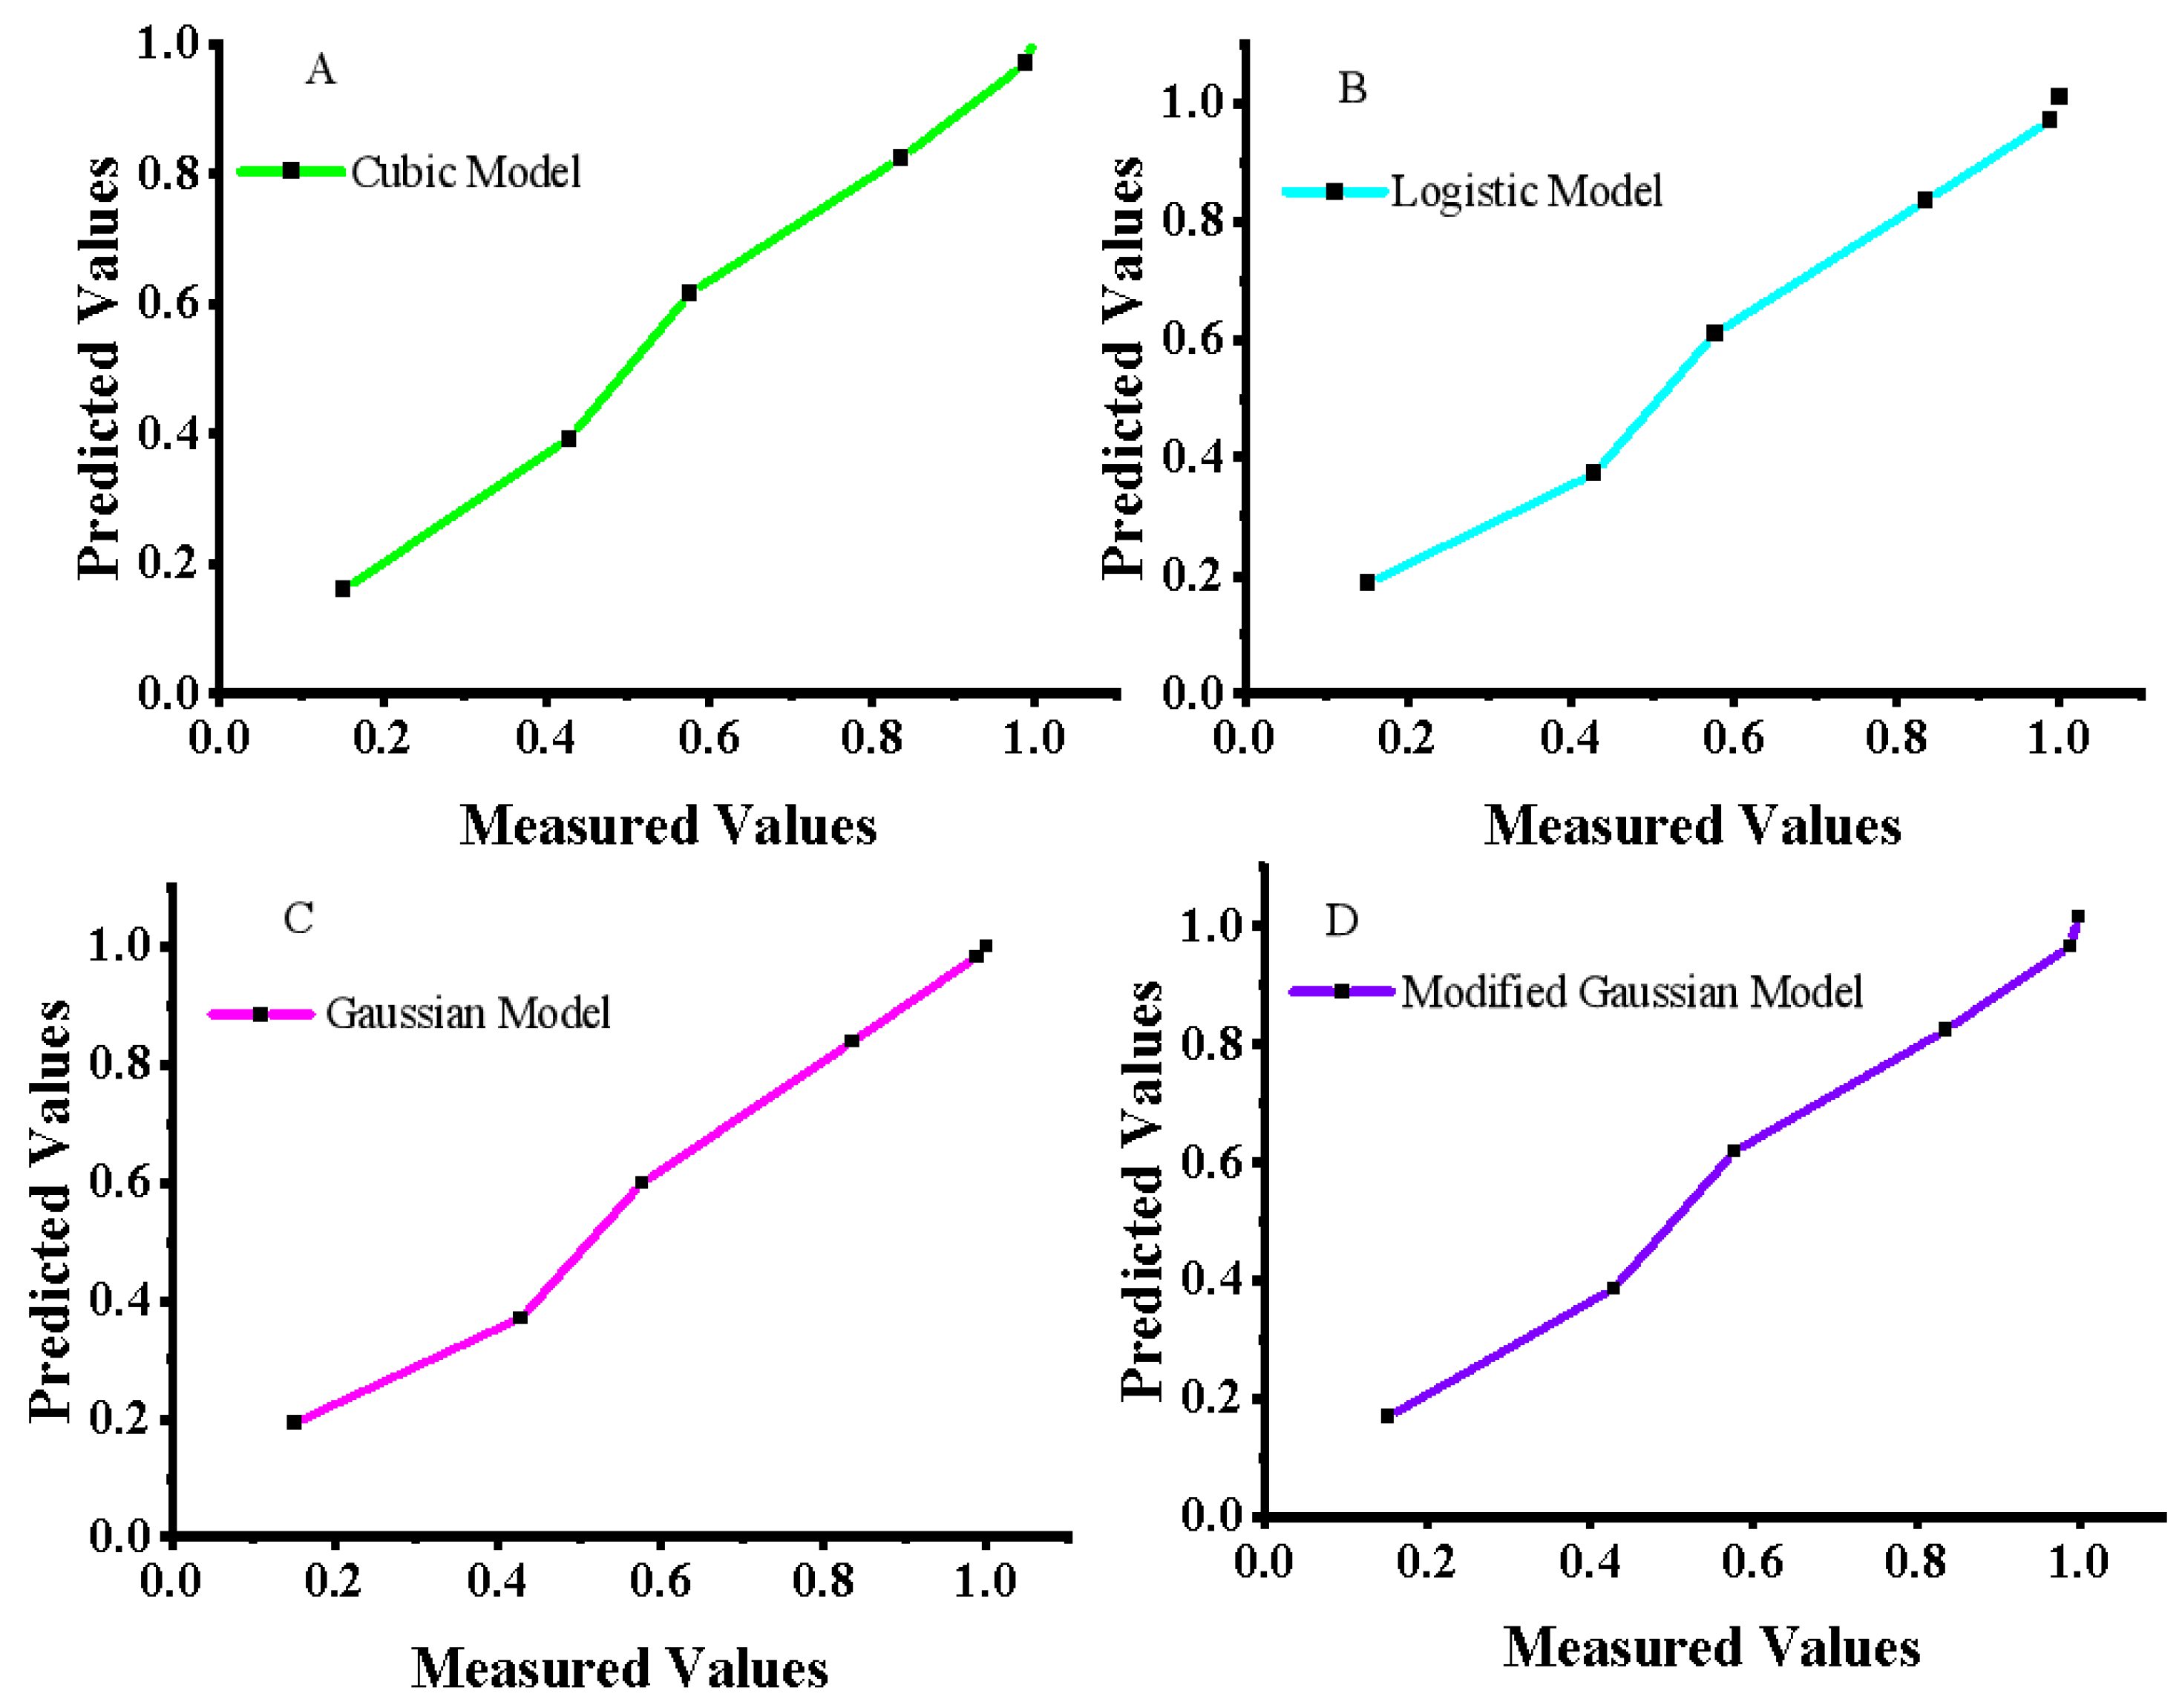
3.1. Plant Height Simulation Models

The relationship between plant height (PH) and GDDs of both these crops is shown in Figure 2. The plant height of both these crops is regularly taken at 20-day intervals. The plant height of both these crops has the same growth from 200 to 500 °C under freshwater and brackish water irrigation. The plant height of both these crops at 800 °C significantly changes between fresh and brackish water irrigation. This indicates that Sesbania and Cluster bean plants will be stressed due to brackish water irrigation [22]. Under freshwater irrigation (control treatment), the plant height of Cluster bean and Sesbania increased very fast from 200 to 1100 °C. The increase in plant height increment was slowing down; maybe plants reached their maximum height and that is why the increase in plant height was slowing down [22,23]. On the other hand, the plant height of both these crops under brackish water irrigation starting to increase very slowly after 800 °C and significantly differs from freshwater irrigation. Cluster bean plant height increment becomes constant from 800 to 1100 °C. Maybe plants are under stress due to brackish water irrigation [51] and higher temperatures [12], as shown in Figure 2A. Cluster bean has maximum plant height under fresh and brackish water irrigation when GDDs are 1600 °C and 1500 °C. Sesbania has maximum plant height under fresh and brackish water irrigation when the GDD is 1500 °C. According to the PH results, the GDD has an important practical significance on the growth of both these crops [32]. Many researchers worldwide have explored crop growth using statistical methods and crop and climate models [50]. Climate warnings enhanced the growth of many crops by changing the crop growth cycle. This indicates that climate factors like the GDD are important in crop growth development, so GDD’s role in modeling studies cannot be ignored [54].
We figured out a very simple method for normalizing the PH values to simplify the subsequent analyses. Normalizing allows us to disregard the impact of different water quality treatments on the dynamic changes in the PH of both these crops [36]. The given Equation (10) was used for this relationship.
R P H = P H P H M
where RPH indicates the relative plant height, and PHM means maximum plant height. Table 4 describes that under fresh and brackish water irrigation, both crops have different RPH values under different intervals of time. The highest standard deviation (0.137 for Cluster bean and 0.082 for Sesbania) occurred in both crops on 232 days or a GDD of 794 °C, because after this point, both crops went to brackish water stress along with higher temperature [23], and the PH growth trend changes significantly. The overall trend of RPH of both these crops has a similar trend under fresh and brackish water treatments. Consequently, a universal growth model of the RPH of both these crops was developed with the help of these RPH mean values under different irrigation treatments.
The mean RPH values of both crops were fitted using different growth models. A genetic algorithm was used to fit the model’s parameters, and these fitted models are shown in Figure 3 and Figure 4. The results of these fitted models agree well with the observed values of PH especially when plant height increments become very slow or stable. In all these fitted models, the determination of the correlation between observed and predicted values was above 0.98.
Table 5 describes the fitted results of experience parameters in the four models for both crops. The coefficient of determination in all models of both these crops is larger than 0.98, and the relative error is smaller than 1%. This indicates that the predicted results of all these models in both crops agree with the measured data in the later growth stage [32,46]. The fitted results of the present study also agreed with the findings of other crops like cotton and grapes [24,25]. Among all these established predicted growth models, the Cubic growth polynomial and modified Gaussian growth models in both crops appear to be more accurate with lesser error values, as shown in Table 5. The Cubic growth polynomial model parameters are meaningless, because they cannot explain the complex relationship between growth parameters [25], so a modified Gaussian model for both crops is the best.
Two growth models, Gaussian and modified Gaussian, are exponential functions. In these models, parameter GDD0 is the growing degree days values, where RPHM = 1. The deviation between the value of GDD0 in the Gaussian growth model for Sesbania is 0.007, and for Cluster bean, it is 0.097. Similarly, the modified Gaussian growth model for Sesbania is 0.02, and for Cluster bean, it is 0.033. The predicted RPHM value calculated by the Gaussian and modified Gaussian models is smaller than the measured value. According to the fitting results, the Cubic polynomial model and modified Gaussian models for both crops have more accuracy in predicting values with fewer errors values. Hence, both models have the best performance for both crops.
For model flexibility and applicability, the number of parameters is highly sensitive [36]. Some parameters can enhance the model’s applicability, but on the other hand, the accuracy of predicting results may be decreased [25]. As shown in Table 5, the Cubic polynomial and modified Gaussian growth model has four parameters, but the logistic and Gaussian growth model has only three parameters. Nevertheless, the higher number of parameters makes obtaining the models more complex [37]. Therefore, in any situation where higher precision is not required, it should be recommended to use Gaussian and logistic growth models to predict the PH of both crops [27].

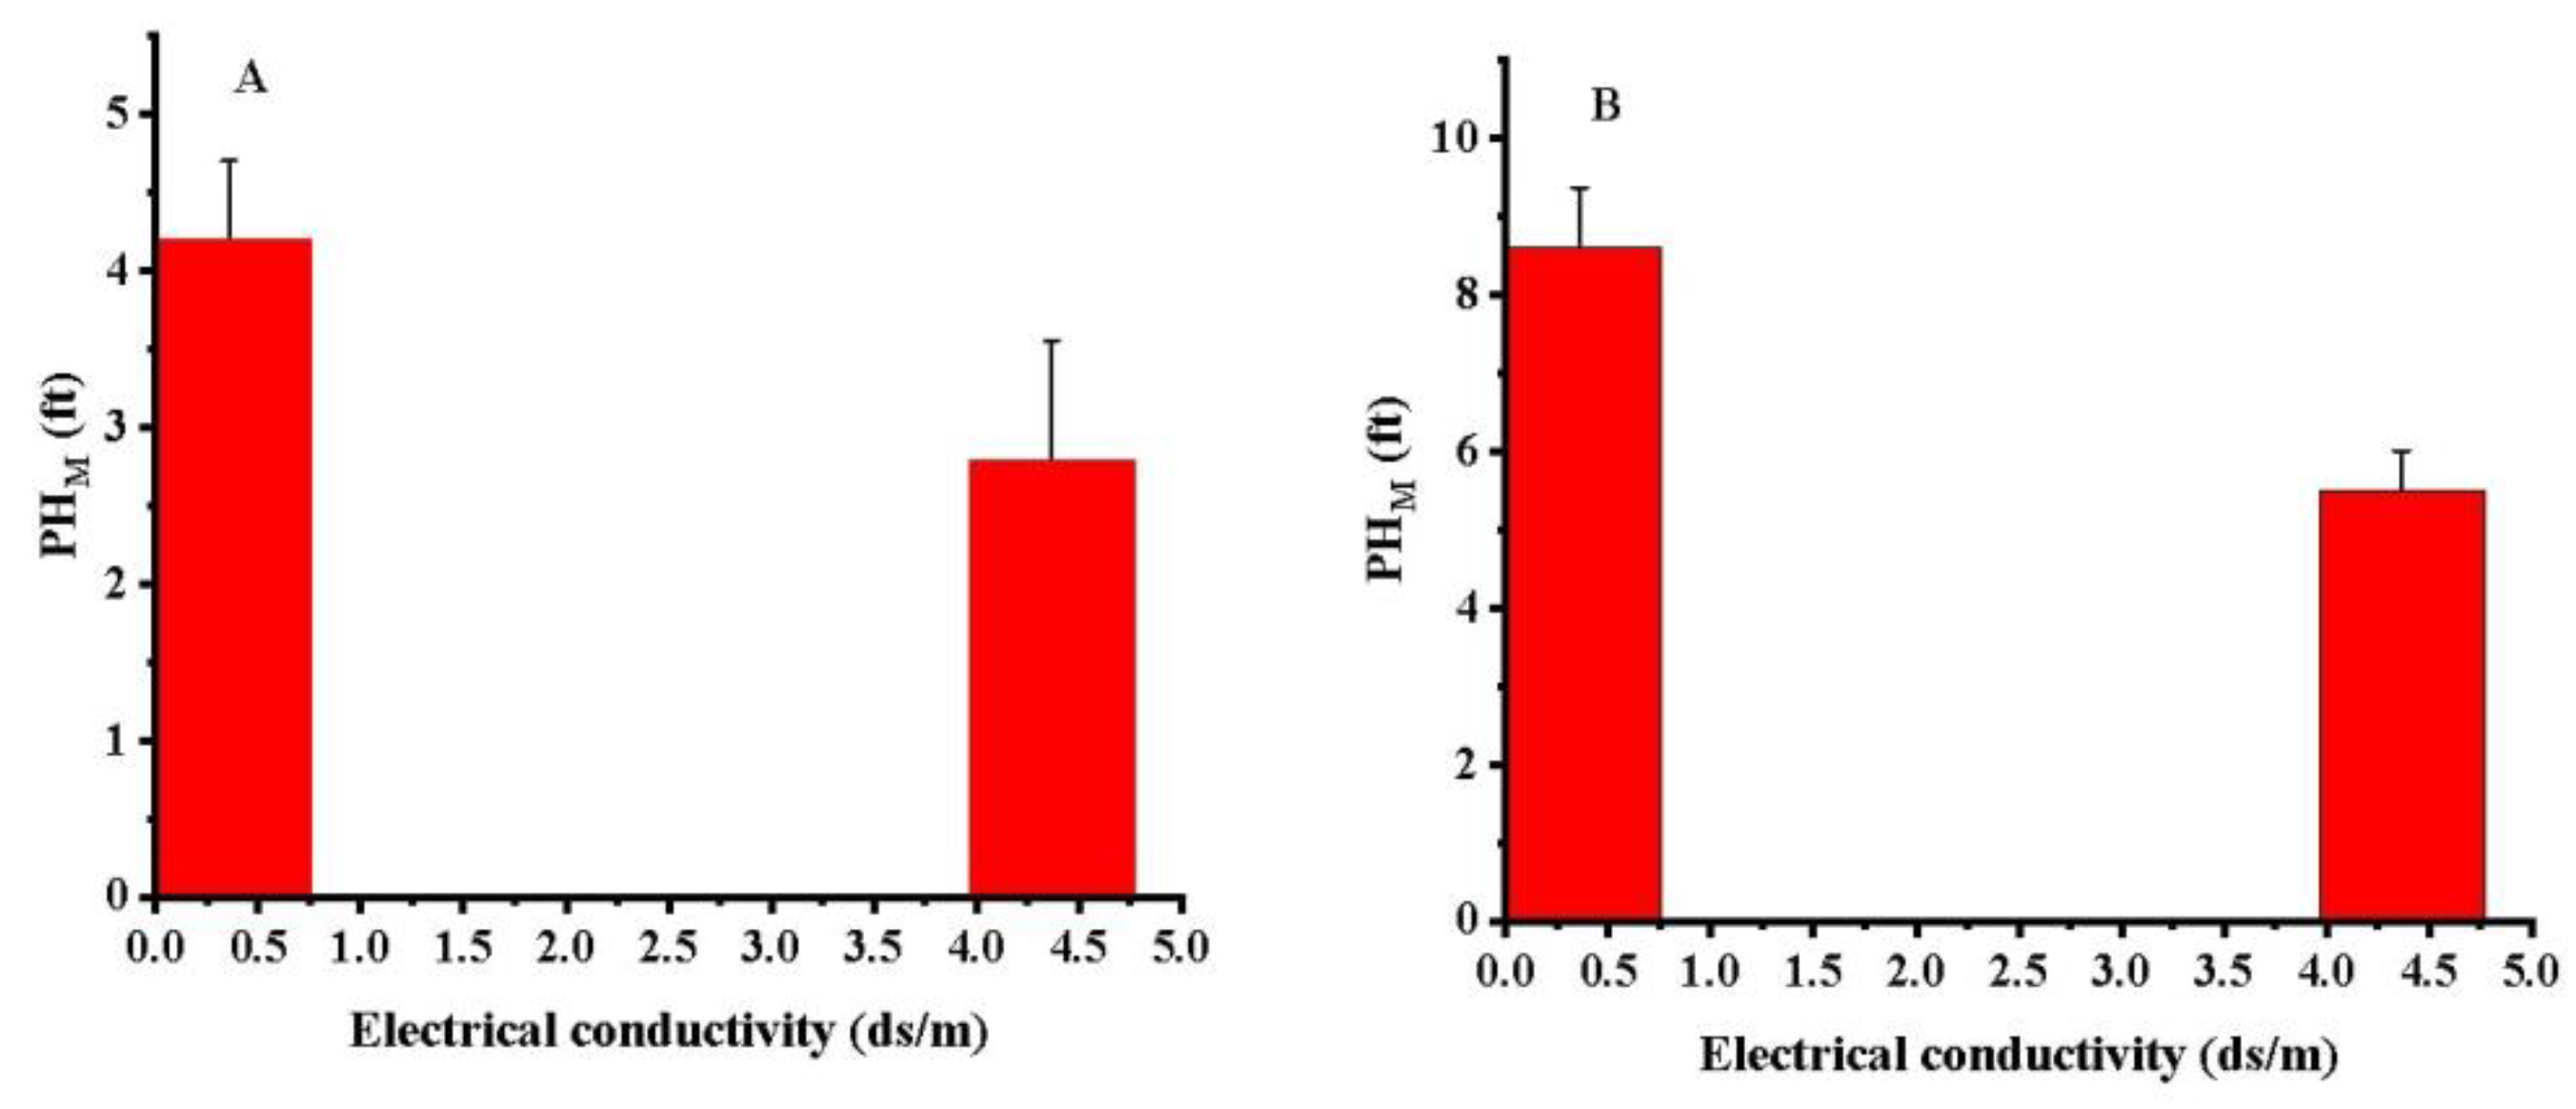
3.2. Relationship between Plant Height and Water Quality

Equations (3)–(6) describe the maximum plant height. It has an important role in the plant growth [23]. Therefore, generally, the importance of these models depends on the ability to calculate PHM quickly and easily [24]. Nevertheless, the plant height of each crop is sensitive to numerous factors, including elevated temperatures, water and soil quality, and the cumulative growing degree days [8,36,41]. Additionally, using brackish water for irrigation impacts these crops’ plant height and tolerance response [36,50]. In field experiments, some parameters are difficult to measure regularly, so the ability to measure PH by using available data plays a very important role in making a given method very useful in day to day work. In this study, PHM for Sesbania can be measured directly under fresh and brackish water irrigation when the GDD is about 1600 °C. Similarly, PHM for Cluster beans can be measured directly under fresh and brackish water irrigation when the GDD is about 1600 °C and 1444 °C, as shown in Table 4. The relationship between different water quality treatments and the PHM of both these crops is determined by investigating the results obtained in this study, as shown in Figure 5.
It is well clear by the expression that brackish water irrigation negatively affects the PHM of both crops, as shown in Figure 5A,B. Only two water treatments were used in this study, so the relationship between different water quality and PHM can be explained by a linear equation for both these crops.
P H M = 4.32 0.35 E C
P H M = 8.87 0.77 E C
Equation (11) explains the relationship between Cluster beans and Equation (12) explains the relationship for Sesbania plants, where PHM is the theoretical plant height maximum value and EC is the electrical conductivity of water. The coefficient of determination for both equations is about 0.99.
Let if
P H M = 0
Then, the EC values of Equation (11) for Cluster bean become those of Equation (13) and the EC values of Equation (12) for Sesbania become those of Equation (14).
E C = 12.34   d s / m
E C = 11.51   d s / m
This means that if EC ≥ 12.34  d s / m , PHM = 0 for Cluster bean, and if EC ≥ 11.51  d s / m then, PHM = 0 for Sesbania. It is described that both crops had zero growth rate when EC values reached these limits [55]. Equations (11) and (12) also described that with the increasing EC value in the irrigation water, the amount of plant height will be reduced by every increase EC × 0.77 for Sesbania and EC × 0.35 for Cluster bean.
The relationship between PH and water quality can be figured out by using Equations (10)–(12) for both these crops.
P H = R P H × 4.32 0.35 E C
P H = R P H × 8.87 0.77 E C
Equation (15) for Cluster bean and Equation (16) for Sesbania can be used to describe the relationship between RPH, EC and PH. These finding equations are similar to the finding equations for the leaf area index [24,25,36]. Comparing the models in Table 4 with Equations (15) and (16), the mathematical prediction models for PH can be established. Therefore, the logistic growth model equation for PH becomes as follows.
P H = 1.106 1 + e ( G D D     527.068 ) 484.52 × 4.32 0.35 E C
P H = 1.08 1 + e ( G D D     709.97 ) 349.05 × 8.87 0.77 E C
Equation (17) indicates the PH for Cluster bean, and Equation (18) represents the PH for Sesbania. Equations (17) and (18) can be described as the PH of these crops under different water quality irrigation and GDD values. Figure 6 and Figure 7 show the fitted results between predicted and measured values for these mathematical models, which have the same trend as previous findings [43,46]. The fitted results for the PH of Cluster bean and Sesbania grown in the Thar desert area under different water quality irrigation are shown in Table 5.
Figure 6 and Figure 7 show the good fitting results between predicted and measured values of PH in both these crops under the Thar desert conditions. The R2, RMSE, and relative error values for these four fitted models are given below for Cluster bean, i.e., Cubic polynomial, 0.99, 0.00032, and 0.0004; logistic model 0.98, 0.0012, and 0.0032; Gaussian model, 0.99, 0.00078, and 0.0025; and Gaussian modified model, 0.99, 0.00045, and 0.000012. Similarly, for the Sesbania, Cubic polynomial, 0.99, 0.00021, and 0.0007; logistic model 0.98, 0.0035, and 0.0057; Gaussian model, 0.99, 0.0080, and 0.0041; and Gaussian modified model, 0.99, 0.00037, and 0.00023, respectively. The Cubic polynomial and modified Gaussian model should be considered for Sesbania and Cluster beans to calculate the plant height under the Thar desert conditions. The finding of these models are also agreed with the finding of previous work [24,25].

3.3. Mathematical Models for Biomass per Plant Production

The simulations’ data on crop water productivity suggest that the per-plant biomass is influenced by the level of transpiration that takes place. Crop water productivity is measured by the per plant biomass (g or kg) produced per unit land of area (m2 or ha) per unit of water transpired (mm) [36]. The relationship between per-plant biomass production and water quality is highly linear [53,54]. Figure 8 shows the relationship between per-plant biomass and different water quality treatments for both crops.
The biomass per plant of both these crops decreased under brackish water irrigation, so the relationship between these parameters is linear, and the equations for these relationships are given below.
B = 297.58 19.73 × E C
B = 467.80 49.86 × E C
where B indicates the biomass per plant. Equation (19) represents the biomass for Cluster bean, and Equation (20) represents the biomass for Sesbania. According to the equations, the biomass of Cluster bean and that of Sesbania decreased by 19.73 × EC and 49.86 × EC with every increase in EC in the water quality, respectively.
If we interpret Equations (17)–(20), then new equations are given below:
B = 297.58 19.73 × 1 0.35 ( 1.106 1 + e ( G D D     527.068 ) 484.52 × 4.32 P H )
B = 467.80 49.86 × 1 0.77 ( 1.08 1 + e ( G D D     709.97 ) 349.05 × 8.87 P H )
Equation (21) represents the biomass per plant of Cluster beans with the help of PH and GDD in logistic growth models. Similarly, Equation (22) represents the biomass per-plant of Sesbania with the help of PH and GDD in the logistic growth model. Other model equations can be found by using similar procedures. The role of PH in plant growth development is crucial because it contains stems that connect with roots and leaves [22]. The stem is important for obtaining water and nutrients from roots and transferring them to leaves. Leaves are also responsible for evaporation, transpiration, and photosynthesis processes [23]. Furthermore, PH connects with sunlight to run the photosynthesis process [52]. The photosynthesis process is the main feature of plant growth development and biomass production, so for modeling studies, PH must be addressed. According to previous research results [24,30,36] and our finding between PH, GDDs and EC, as shown in Figure 6 and Figure 7, the modified Gaussian and Cubic polynomial models are the best for PH prediction, so we can assume that for biomass production, a similar trend will be found, because these relationships have been found by the interpretation of these equations.

4. Conclusions

This study analyzed the PH and biomass per plant for Cluster bean and Sesbania under different water quality in the Thar desert and revealed the following:
(a) Standardizing the measured PH values enables the exclusion of the influence of different water quality on the PH changes for Cluster beans and Sesbania. Simulation models were developed for both these crops with the help of the logistic growth model, Gaussian growth model, modified Gaussian growth model, and Cubic polynomial model. Among all four models, the Cubic and modified Gaussian models are the best for prediction, but cubic polynomial parameters are meaningless, so we prefer the modified Gaussian model for prediction.
(b) Simulation PH models were developed to explain the relationship between water quality and PH for these two crops.
(c) Simulation models between PH, GDDs, and biomass per plant were developed for Sesbania and Cluster bean. These models can provide important information for growth production within desert conditions by improving water use efficiency under different types of irrigation.

Author Contributions

Conceptualization, A.A.; methodology, A.A.; software, R.A.; validation, W.M.; formal analysis, A.A.; resources, W.M.; data curation, R.A.; writing—original draft preparation, A.A.; writing—review and editing, R.A.; supervision, W.M.; project administration, W.M.; funding acquisition, A.A. All authors have read and agreed to the published version of the manuscript.

Funding

This work was supported by Key projects of national key R & D plan and intergovernmental international scientific and technological innovation cooperation (2021YFE0101100).

Data Availability Statement

The data presented in this study are available on request from the corresponding author.

Acknowledgments

We acknowledged China national key R &D plan and intergovernmental international scientific and technological innovation cooperation program to support this study.

Conflicts of Interest

Author Rajib Ali was employed by the company Sindh Engro Coal Mining Company. The authors declare that this study received funding from projects of national key R & D plan and intergovernmental international scientific and technological innovation cooperation. The funder was not involved in the study design, collection, analysis, interpretation of data, the writing of this article or the decision to submit it for publication.

References

  1. Qureshi, A.S.; Perry, C. Managing water and salt for sustainable agriculture in the Indus Basin of Pakistan. Sustainability 2021, 13, 5303. [Google Scholar] [CrossRef]
  2. Chandio, A.A.; Jiang, Y.; Magsi, H. Agricultural sub-sectors performance: An analysis of sector-wise share in agriculture GDP of Pakistan. Int. J. Econ. Finance 2016, 8, 156. [Google Scholar] [CrossRef]
  3. Rahman, S.U.; Basit, A.; Ara, N.; Ullah, I.; Rehman, A.U. Morpho-physiological responses of tomato genotypes under saline conditions. Gesunde Pflanz. 2021, 73, 541–553. [Google Scholar] [CrossRef]
  4. Upreti, P.; Narayan, S.; Khan, F.; Tewari, L.M.; Shirke, P.A. Drought-induced responses on physiological performance in cluster bean [Cyamopsis tetragonoloba (L.) Taub.]. Plant Physiol. Rep. 2021, 26, 49–63. [Google Scholar] [CrossRef]
  5. Yadav, G.; Meena, M. Bioprospecting of endophytes in medicinal plants of Thar Desert: An attractive resource for biopharmaceuticals. Biotechnol. Rep. 2021, 30, e00629. [Google Scholar] [CrossRef] [PubMed]
  6. Blinkhorn, J.; Achyuthan, H.; Jaiswal, M.; Singh, A.K. The first dated evidence for Middle-Late Pleistocene fluvial activity in the central Thar Desert. Quat. Sci. Rev. 2020, 250, 106656. [Google Scholar] [CrossRef]
  7. Samtio, M.S.; Jahangir, T.M.; Mastoi, A.S.; Lanjwani, M.F.; Rajper, R.H.; Lashari, R.A.; Agheem, M.H.; Noonari, M.W. Impact of rock-water interaction on hydrogeochemical characteristics of groundwater: Using multivariate statistical, water quality index and irrigation indices of chachro sub-district, thar desert, sindh, Pakistan. Groundw. Sustain. Dev. 2023, 20, 100878. [Google Scholar] [CrossRef]
  8. Azeem, A.; Javed, Q.; Sun, J.; Ullah, I.; Kama, R.; DU, D. Adaptation of singapore daisy (wedelia trilobata) to different environmental conditions; water stress, soil type and temperature. Appl. Ecol. Environ. Res. 2020, 18, 5247–5261. [Google Scholar] [CrossRef]
  9. Javed, Q.; Wu, Y.; Xing, D.; Ullah, I.; Azeem, A.; Rasool, G. Salt-induced effects on growth and photosynthetic traits of Orychophragmus violaceus and its restoration through re-watering. Braz. J. Bot. 2018, 41, 29–41. [Google Scholar] [CrossRef]
  10. Soltani, M.D.; Meftahizadeh, H.; Barani, M.; Rahdar, A.; Hosseinikhah, S.M.; Hatami, M.; Ghorbanpour, M. Guar (Cyamopsis tetragonoloba L.) plant gum: From biological applications to advanced nanomedicine. Int. J. Biol. Macromol. 2021, 193, 1972–1985. [Google Scholar] [CrossRef]
  11. Guo, X.; Zhu, G.; Jiao, X.; Zhou, G. Effects of nitrogen application and planting density on growth and yield of Sesbania pea grown in saline soil. Curr. Sci. 2019, 116, 758–764. [Google Scholar] [CrossRef]
  12. Hussain, I.; Ali, M.; Ghoneim, A.M.; Shahzad, K.; Farooq, O.; Iqbal, S.; Nawaz, F.; Ahmad, S.; Bárek, V.; Brestic, M.; et al. Improvement in growth and yield attributes of cluster bean through optimization of sowing time and plant spacing under climate change scenario. Saudi J. Biol. Sci. 2022, 29, 781–792. [Google Scholar] [CrossRef] [PubMed]
  13. Bunma, S.; Balslev, H. A review of the economic botany of Sesbania (Leguminosae). Bot. Rev. 2019, 85, 185–251. [Google Scholar] [CrossRef]
  14. Acharya, B.R.; Sandhu, D.; Dueñas, C.; Ferreira, J.F.; Grover, K.K. Deciphering molecular mechanisms involved in salinity tolerance in guar (Cyamopsis tetragonoloba (L.) Taub.) using transcriptome analyses. Plants 2022, 11, 291. [Google Scholar] [CrossRef] [PubMed]
  15. Garcia, A.; Grover, K.; VanLeeuwen, D.; Stringam, B.; Schutte, B. Growth and Performance of Guar (Cyamopsis tetragonoloba (L.) Taub.) Genotypes under Various Irrigation Regimes with and without Biogenic Silica Amendment in Arid Southwest US. Plants 2023, 12, 2486. [Google Scholar] [CrossRef] [PubMed]
  16. Uslu, O.S.; Babur, E.; Alma, M.H.; Solaiman, Z.M. Walnut shell biochar increases seed germination and early growth of seedlings of fodder crops. Agriculture 2020, 10, 427. [Google Scholar] [CrossRef]
  17. Amanullah; Khalid, S.; Imran; Khan, H.A.; Arif, M.; Altawaha, A.R.; Adnan, M.; Fahad, S.; Shah, A.; Parmar, B. Effects of climate change on irrigation water quality. In Environment, Climate, Plant and Vegetation Growth; Springer Nature: Cham, Switzerland, 2020; pp. 123–132. [Google Scholar] [CrossRef]
  18. Zhou, B.; Liang, C.; Chen, X.; Ye, S.; Peng, Y.; Yang, L.; Duan, M.; Wang, X. Magnetically-treated brackish water affects soil water-salt distribution and the growth of cotton with film mulch drip irrigation in Xinjiang, China. Agric. Water Manag. 2022, 263, 107487. [Google Scholar] [CrossRef]
  19. Sob, M.E. Response of okra based on electrophysiological modeling under salt stress and re-watering. Growth 2017, 1, 9. [Google Scholar]
  20. Azeem, A.; Javed, Q.; Sun, J.; Nawaz, M.I.; Ullah, I.; Kama, R.; Du, D. Functional traits of okra cultivars (Chinese green and Chinese red) under salt stress. Folia Hortic. 2020, 32, 159–170. [Google Scholar] [CrossRef]
  21. Su, L.; Tao, W.; Sun, Y.; Shan, Y.; Wang, Q. Mathematical Models of Leaf Area Index and Yield for Grapevines Grown in the Turpan Area, Xinjiang, China. Agronomy 2022, 12, 988. [Google Scholar] [CrossRef]
  22. Wang, K.; Su, L.; Wang, Q. Cotton growth model under drip irrigation with film mulching: A case study of Xinjiang, China. Agron. J. 2021, 113, 2417–2436. [Google Scholar] [CrossRef]
  23. Li, L.; Chen, S.W.; Yang, C.F.; Meng, F.J.; Sigrimis, N. Prediction of plant transpiration from environmental parameters and relative leaf area index using the random forest regression algorithm. J. Clean. Prod. 2020, 261, 121136. [Google Scholar] [CrossRef]
  24. Hasegawa, K.; Matsuyama, H.; Tsuzuki, H.; Sweda, T. Improving the estimation of leaf area index by using remotely sensed NDVI with BRDF signatures. Remote Sens. Environ. 2010, 114, 514–519. [Google Scholar] [CrossRef]
  25. Wang, H.; Sánchez-Molina, J.; Li, M.; Berenguel, M.; Yang, X.; Bienvenido, J. Leaf area index estimation for a greenhouse transpiration model using external climate conditions based on genetics algorithms, back-propagation neural networks and nonlinear autoregressive exogenous models. Agric. Water Manag. 2017, 183, 107–115. [Google Scholar] [CrossRef]
  26. Ishihara, M.I.; Hiura, T. Modeling leaf area index from litter collection and tree data in a deciduous broadleaf forest. Agric. For. Meteorol. 2011, 151, 1016–1022. [Google Scholar] [CrossRef]
  27. Liu, J.-H.; Yan, Y.; Ali, A.; Yu, M.-F.; Xu, Q.-J.; Shi, P.-J.; Chen, L. Simulation of crop growth, time to maturity and yield by an improved sigmoidal model. Sci. Rep. 2018, 8, 7030. [Google Scholar] [CrossRef] [PubMed]
  28. Bouras, E.H.; Olsson, P.-O.; Thapa, S.; Díaz, J.M.; Albertsson, J.; Eklundh, L. Wheat Yield Estimation at High Spatial Resolution through the Assimilation of Sentinel-2 Data into a Crop Growth Model. Remote Sens. 2023, 15, 4425. [Google Scholar] [CrossRef]
  29. Dong, T.; Liu, J.; Shang, J.; Qian, B.; Ma, B.; Kovacs, J.M.; Walters, D.; Jiao, X.; Geng, X.; Shi, Y. Assessment of red-edge vegetation indices for crop leaf area index estimation. Remote Sens. Environ. 2019, 222, 133–143. [Google Scholar] [CrossRef]
  30. Döring, J.; Stoll, M.; Kauer, R.; Frisch, M.; Tittmann, S. Indirect estimation of leaf area index in VSP-trained grapevines using plant area index. Am. J. Enol. Vitic. 2014, 65, 153–158. [Google Scholar] [CrossRef]
  31. Su, L.; Wang, Q.; Wang, C.; Shan, Y. Simulation models of leaf area index and yield for cotton grown with different soil conditioners. PLoS ONE 2015, 10, e0141835. [Google Scholar] [CrossRef]
  32. Liu, Y.; Su, L.; Wang, Q.; Zhang, J.; Shan, Y.; Deng, M. Comprehensive and quantitative analysis of growth characteristics of winter wheat in China based on growing degree days. Adv. Agron. 2020, 159, 237–273. [Google Scholar]
  33. Xiangxiang, W.; Quanjiu, W.; Jun, F.; Lijun, S.; Xinlei, S. Logistic model analysis of winter wheat growth on China’s Loess Plateau. Can. J. Plant Sci. 2014, 94, 1471–1479. [Google Scholar] [CrossRef]
  34. Fujikawa, H.; Kai, A.; Morozumi, S. A new logistic model for Escherichia coli growth at constant and dynamic temperatures. Food Microbiol. 2004, 21, 501–509. [Google Scholar] [CrossRef]
  35. Sharma, A.; Deepa, R.; Sankar, S.; Pryor, M.; Stewart, B.; Johnson, E.; Anandhi, A. Use of growing degree indicator for developing adaptive responses: A case study of cotton in Florida. Ecol. Indic. 2021, 124, 107383. [Google Scholar] [CrossRef]
  36. Wypych, A.; Sulikowska, A.; Ustrnul, Z.; Czekierda, D. Variability of growing degree days in Poland in response to ongoing climate changes in Europe. Int. J. Biometeorol. 2017, 61, 49–59. [Google Scholar] [CrossRef] [PubMed]
  37. Boschetti, M.; Stroppiana, D.; Brivio, P.A.; Bocchi, S. Multi-year monitoring of rice crop phenology through time series analysis of MODIS images. Int. J. Remote Sens. 2009, 30, 4643–4662. [Google Scholar] [CrossRef]
  38. Liu, F.; Liu, Y.; Su, L.; Tao, W.; Wang, Q.; Deng, M. Integrated growth model of typical crops in China with regional parameters. Water 2022, 14, 1139. [Google Scholar] [CrossRef]
  39. Overman, A.R. Rational basis for the logistic model for forage grasses. J. Plant Nutr. 1995, 18, 995–1012. [Google Scholar] [CrossRef]
  40. Overman, A.R.; Wilkinson, S.R. Extended logistic model of forage grass response to applied nitrogen as affected by soil erosion. Trans. ASAE 2003, 46, 1375. [Google Scholar] [CrossRef]
  41. Chen, Y.; Wang, L.; Bai, Y.; Lu, Y.; Ni, L.; Wang, Y.; Xu, M. Quantitative relationship between effective accumulated temperature and plant height & leaf area index of summer maize under different nitrogen, phosphorus and potassium levels. Phosphorus and Potassium Levels. Sci. Agric. Sin. 2021, 54, 4761–4777. [Google Scholar]
  42. Sui, M.; Chen, K.; Shen, F. Monitoring of wheat height based on multi-GNSS reflected signals. Remote Sens. 2022, 14, 4955. [Google Scholar] [CrossRef]
  43. Azeem, A.; Sun, J.; Javed, Q.; Jabran, K.; Saifullah, M.; Huang, Y.; Du, D. Water deficiency with nitrogen enrichment makes Wedelia trilobata to become weak competitor under competition. Int. J. Environ. Sci. Technol. 2021, 19, 319–326. [Google Scholar] [CrossRef]
  44. Azeem, A.; Wu, Y.; Xing, D.; Javed, Q.; Ullah, I. Photosynthetic response of two okra cultivars under salt stress and re-watering. J. Plant Interact. 2017, 12, 67–77. [Google Scholar] [CrossRef]
  45. Zhu, G.; Xu, Y.; Xu, Z.; Ahmad, I.; Nimir, N.E.A.; Zhou, G. Improving productivity of Sesbania pea in saline soils by enhancing antioxidant capacity with optimum application of nitrogen and phosphate combination. Front. Plant Sci. 2022, 13, 1027227. [Google Scholar] [CrossRef] [PubMed]
  46. Mai, W.; Xue, X.; Azeem, A. Growth of cotton crop (Gossypium hirsutum L.) higher under drip irrigation because of better phosphorus uptake. Appl. Ecol. Environ. Res. 2022, 20, 4865–4878. [Google Scholar] [CrossRef]
  47. Azeem, A.; Mai, W.; Tian, C.; Javed, Q. Dry Weight Prediction of Wedelia trilobata and Wedelia chinensis by Using Artificial Neural Network and MultipleLinear Regression Models. Water 2023, 15, 1896. [Google Scholar] [CrossRef]
  48. Mai, W.; Xue, X.; Azeem, A. Plant Density Differentially Influences Seed Weight in Different Portions of the Raceme of Castor. Pol. J. Environ. Stud. 2023, 32, 3247–3254. [Google Scholar] [CrossRef]
  49. McMaster, G.S.; Wilhelm, W. Growing degree-days: One equation, two interpretations. Agric. For. Meteorol. 1997, 87, 291–300. [Google Scholar] [CrossRef]
  50. Yang, L.; Wang, Y.; Kang, M.; Dong, Q. Simulation of tomato fruit individual growth rule based on revised logistic model. Trans. Chin. Soc. Agric. Mach. 2008, 39, 81–84. [Google Scholar]
  51. Wang, R.; Li, S.; Wang, Q.; Zheng, J.; Fan, J.; Li, S. Evaluation of simulation models of spring-maize leaf area and biomass in semiarid agro-ecosystems. Chin. J. Eco-Agric. 2008, 16, 139–144. [Google Scholar] [CrossRef]
  52. Javed, Q.; Azeem, A.; Sun, J.; Ullah, I.; Jabran, K.; Anandkumar, A.; Prabakaran, K.; Buttar, N.; Du, D. Impacts of salt stress on the physiology of plants and opportunity to rewater the stressed plants with diluted water: A review. Appl. Ecol. Environ. Res. 2019, 17, 12583. [Google Scholar] [CrossRef]
  53. Steduto, P.; Hsiao, T.C.; Fereres, E. On the conservative behavior of biomass water productivity. Irrig. Sci. 2007, 25, 189–207. [Google Scholar] [CrossRef]
  54. Vanuytrecht, E.; Raes, D.; Steduto, P.; Hsiao, T.C.; Fereres, E.; Heng, L.K.; Vila, M.G.; Moreno, P.M. AquaCrop: FAO’s crop water productivity and yield response model. Environ. Modell. Softw. 2014, 62, 351–360. [Google Scholar] [CrossRef]
  55. Azeem, A.; Sun, J.; Javed, Q.; Jabran, K.; Du, D. The effect of submergence and eutrophication on the trait’s performance of Wedelia trilobata over its congener native Wedelia chinensis. Water 2020, 12, 934. [Google Scholar] [CrossRef]
  56. Javed, Q.; Azeem, A.; Sun, J.; Ullah, I.; Du, D.; Imran, M.A.; Nawaz, M.I.; Chattha, H.T. Growth prediction of Alternanthera philoxeroides under salt stress by application of artificial neural networking. Plant Biosyst.—Int. J. Deal. All Asp. Plant Biol. 2022, 156, 61–67. [Google Scholar] [CrossRef]
Figure 1. (A) The experimental design and water quality treatments, and (B) the field location. Note: SECMC means Sindh engro coal mining company.
Water 16 00009 g001
Figure 2. Relationship between plant height and GDDs under different irrigation treatment: (A) Cluster bean and (B) Sesbania. Note GDD = growing degree days.
Water 16 00009 g002
Figure 3. Relationship between measured and predicted values of RPH. (A) Logistic model, (B) Gaussian model, (C) Cubic polynomial model, and (D) modified Gaussian model for Sesbania. Measured values are the mean values of RPH values of different water quality treatments, and predicted values are calculated by four models and GDD. Note: GDD = growing degree day, RPH = relative plant height.
Water 16 00009 g003
Figure 4. Relationship between measured and predicted values of RPH. (A) Logistic model, (B) Gaussian model, (C) Cubic polynomial model and (D) modified Gaussian model for Cluster bean. Measured values are the mean values of RPH values of different water quality treatments and predicted values are calculated by four models and GDD. Note: GDD = growing degree day, RPH = relative plant height.
Water 16 00009 g004
Figure 5. Relationship between plant height maximum and different water quality treatment, (A) for Cluster bean and (B) for Sesbania. Note: PHM = maximum plant height.
Water 16 00009 g005
Figure 6. The graph between measured and predicted values of plant height for Cluster bean by using Equation (7) and models in Table 4. (A) Cubic model, (B) logistic model, (C) Gaussian model, and (D) modified Gaussian model.
Water 16 00009 g006
Figure 7. The graph between measured and predicted values of plant height for Sesbania by using Equation (7) and models in Table 4. (A) Cubic model, (B) logistic model, (C) Gaussian model and (D) modified Gaussian model.
Water 16 00009 g007
Figure 8. Relationship between different water quality treatments and biomass per plant. (A) for Cluster bean and (B) for Sesbania.
Water 16 00009 g008
Table 1. Soil physical and chemical properties.
EC (ds/m)TextureOrganic Carbon (%)pHPhosphorus (kg/ha)Nitrogen (kg/ha)
0.167Loamy Sandy0.306.9621.07238.22
Table 2. Water quality parameters.
Water QualityEC
(ds/m)
Total Dissolved Solid
(mg/L)
Nitrate
(mg/L)
Nitrite
(mg/L)
Chloride
(mg/L)
Fluoride
(mg/L)
Manganese
(mg/L)
Brackish water4.36862400.40.0022231.031.150.006
Fresh water0.3575100.40.015196.750.350.006
Table 3. Amount of water given in this experiment.
TreatmentAmount of Water (mm/acre)
Freshwater (control)450 mm
Brackish water414 mm
because 7 days are rain
Table 4. Relative plant height values of both crops under different treatments and different time intervals.
CropsTime/DaysGDD/°CRPHMean
RPH
Standard Deviation
FreshBrackish
Cluster bean191163.50.2800.4370.3580.111
2114820.4310.6050.5180.122
2327940.6100.8050.7080.137
2531124.50.8870.8240.8550.044
27314440.91810.9590.0577
2831600.510.990.9980.002
Sesbania191163.50.12080.1810.1510.042
2114820.3770.4790.4280.071
2327940.5180.6340.5760.082
2531124.50.8550.8140.8340.029
273144410.9760.9880.016
2831600.51110
Note: GDD = growing degree day, RPH = relative plant height.
Table 5. Simulated plant height growth models with error values and expression.
Cluster BeanExpressionRE%ParametersRMSER
Logistic model R P H = 1.106 1 + e ( G D D     527.068 ) 484.52 0.00007230.00190.9932
Gaussian model R P H = 0.097 e [ 0.5 ( G D D     1716.93 ) 2 1099.01 ] 0.0001130.00280.9945
Modified Gaussian R P H = 1.033 e [ 0.5 ( G D D     2180.469 ) 2.69 1521.3658 ] 0.00003240.00210.9932
Cubic model R P H = 0.276 + 0.0005 G D D + 1.7 × 10 7 G D D 2     1.2 × 10 10 G D D 3 0.0000001240.00160.9942
Sesbania
Logistic model R P H = 1.08 1 + e ( G D D     709.97 ) 349.05 0.001930.01250.9826
Gaussian model R P H = 1.007 e [ 0.5 ( G D D     1592.69 ) 2 788.55 ] 0.002030.01280.9902
Modified Gaussian R P H = 1.02 e [ 0.5 ( G D D     1609.4 ) 2.69 1645.54 ] 0.000740.0110.9918
Cubic model R P H = 0.0486 + 0.0007 G D D + 1.7 × 10 7 G D D 2     1.3 × 10 10 G D D 3 0.0000000009340.01000.9937
Disclaimer/Publisher’s Note: The statements, opinions and data contained in all publications are solely those of the individual author(s) and contributor(s) and not of MDPI and/or the editor(s). MDPI and/or the editor(s) disclaim responsibility for any injury to people or property resulting from any ideas, methods, instructions or products referred to in the content.

