
RETRACTED: Exploring Groundwater Quality Assessment: A Geostatistical and Integrated Water Quality Indices Perspective

 ,
,  ,
, 
 ,
,  , ,
, ,  and
and 
Abstract
:1. Introduction
2. Materials and Methods
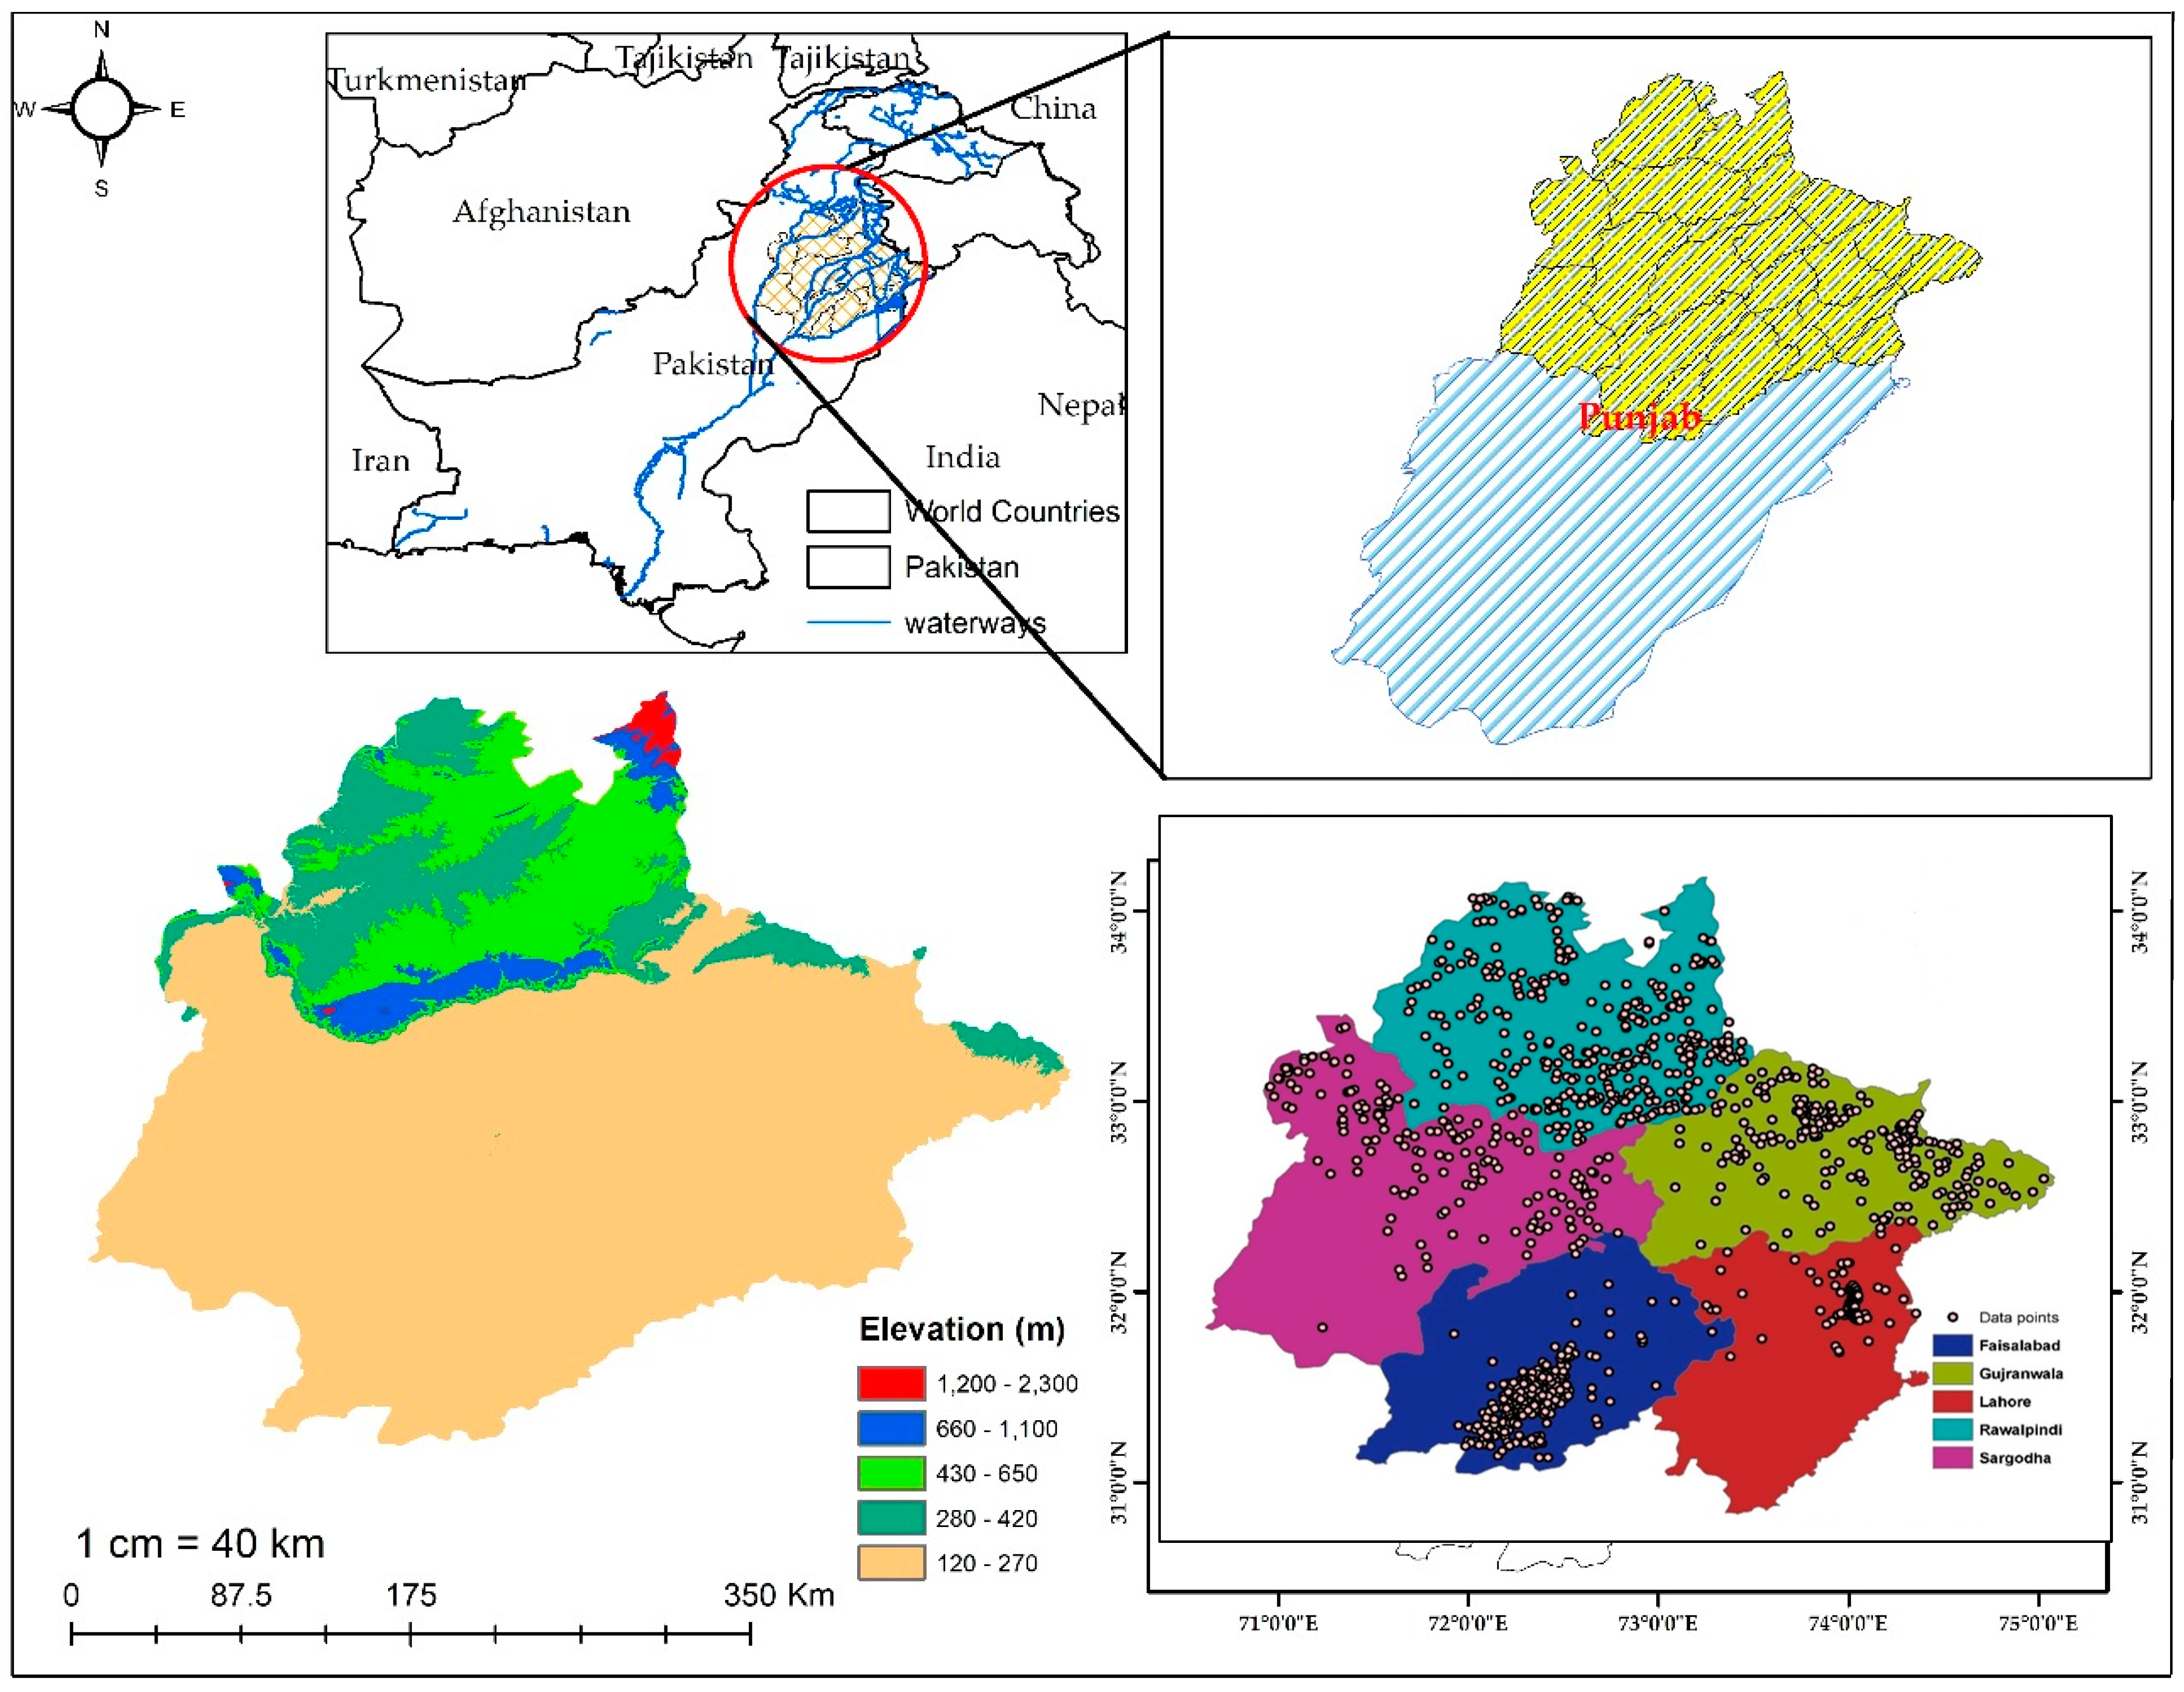
2.1. Study Area
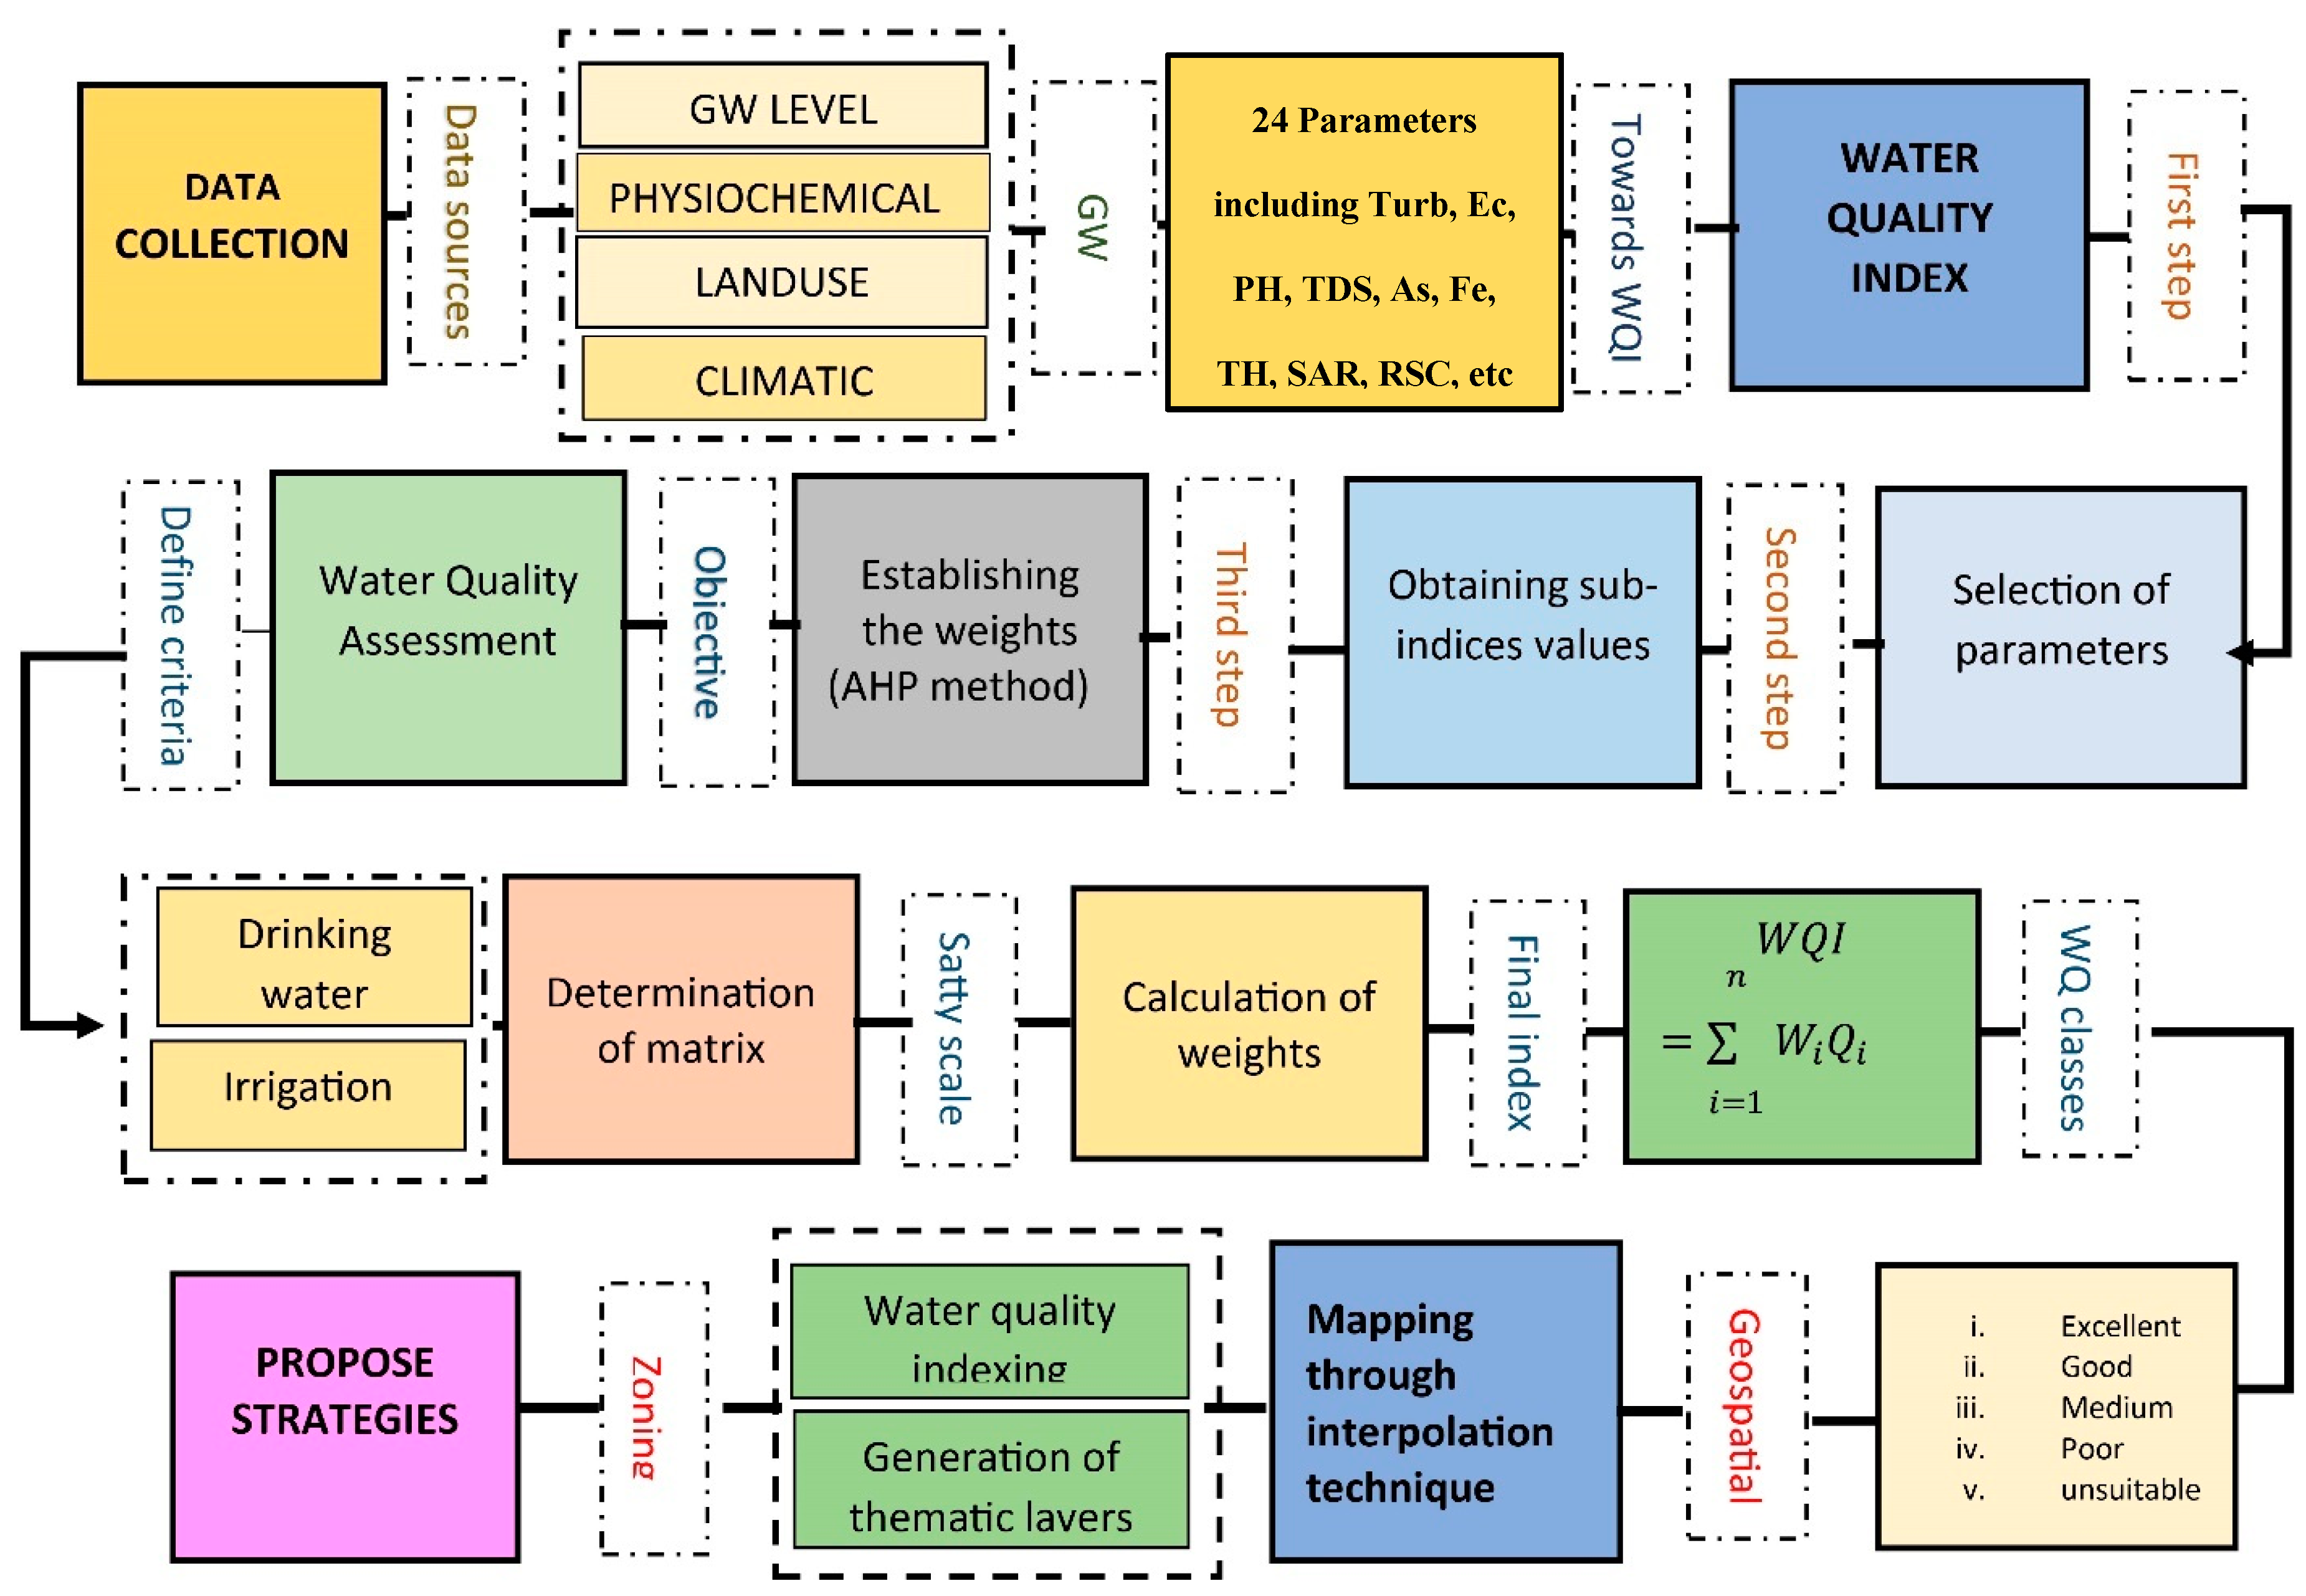
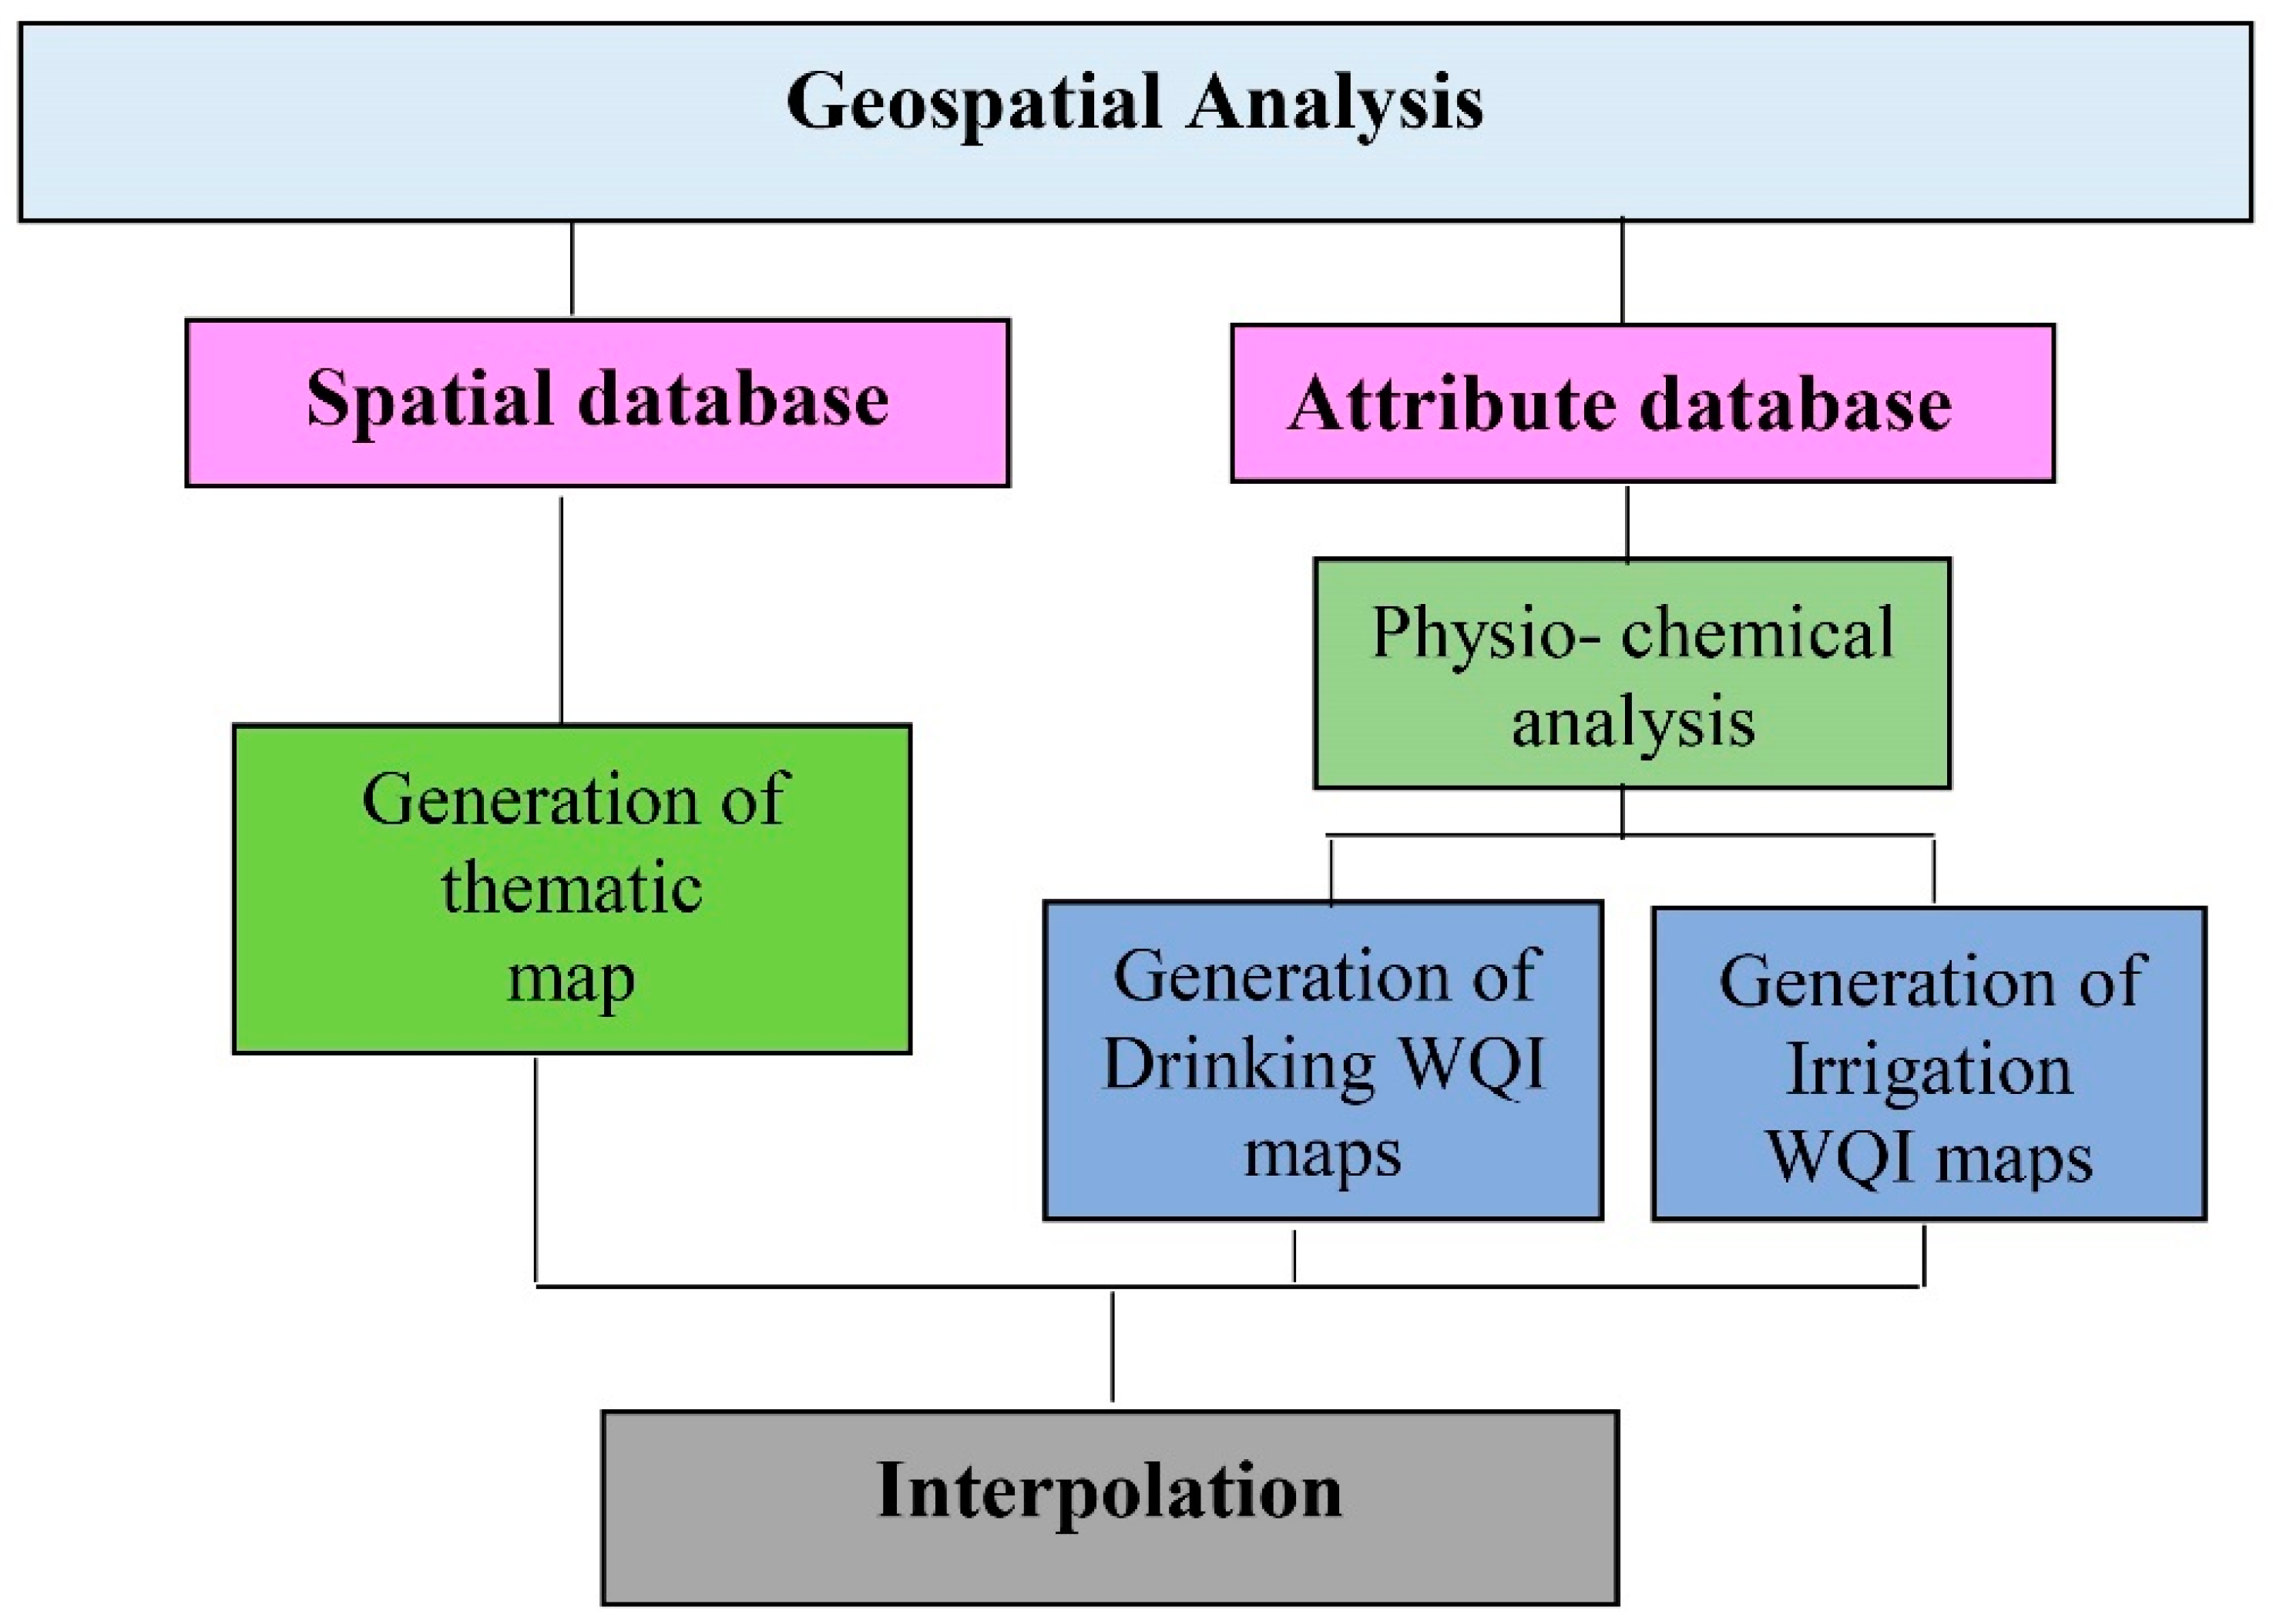
2.2. Overall Research Framework
2.3. Data Collection
Land Use
2.4. Data Analysis
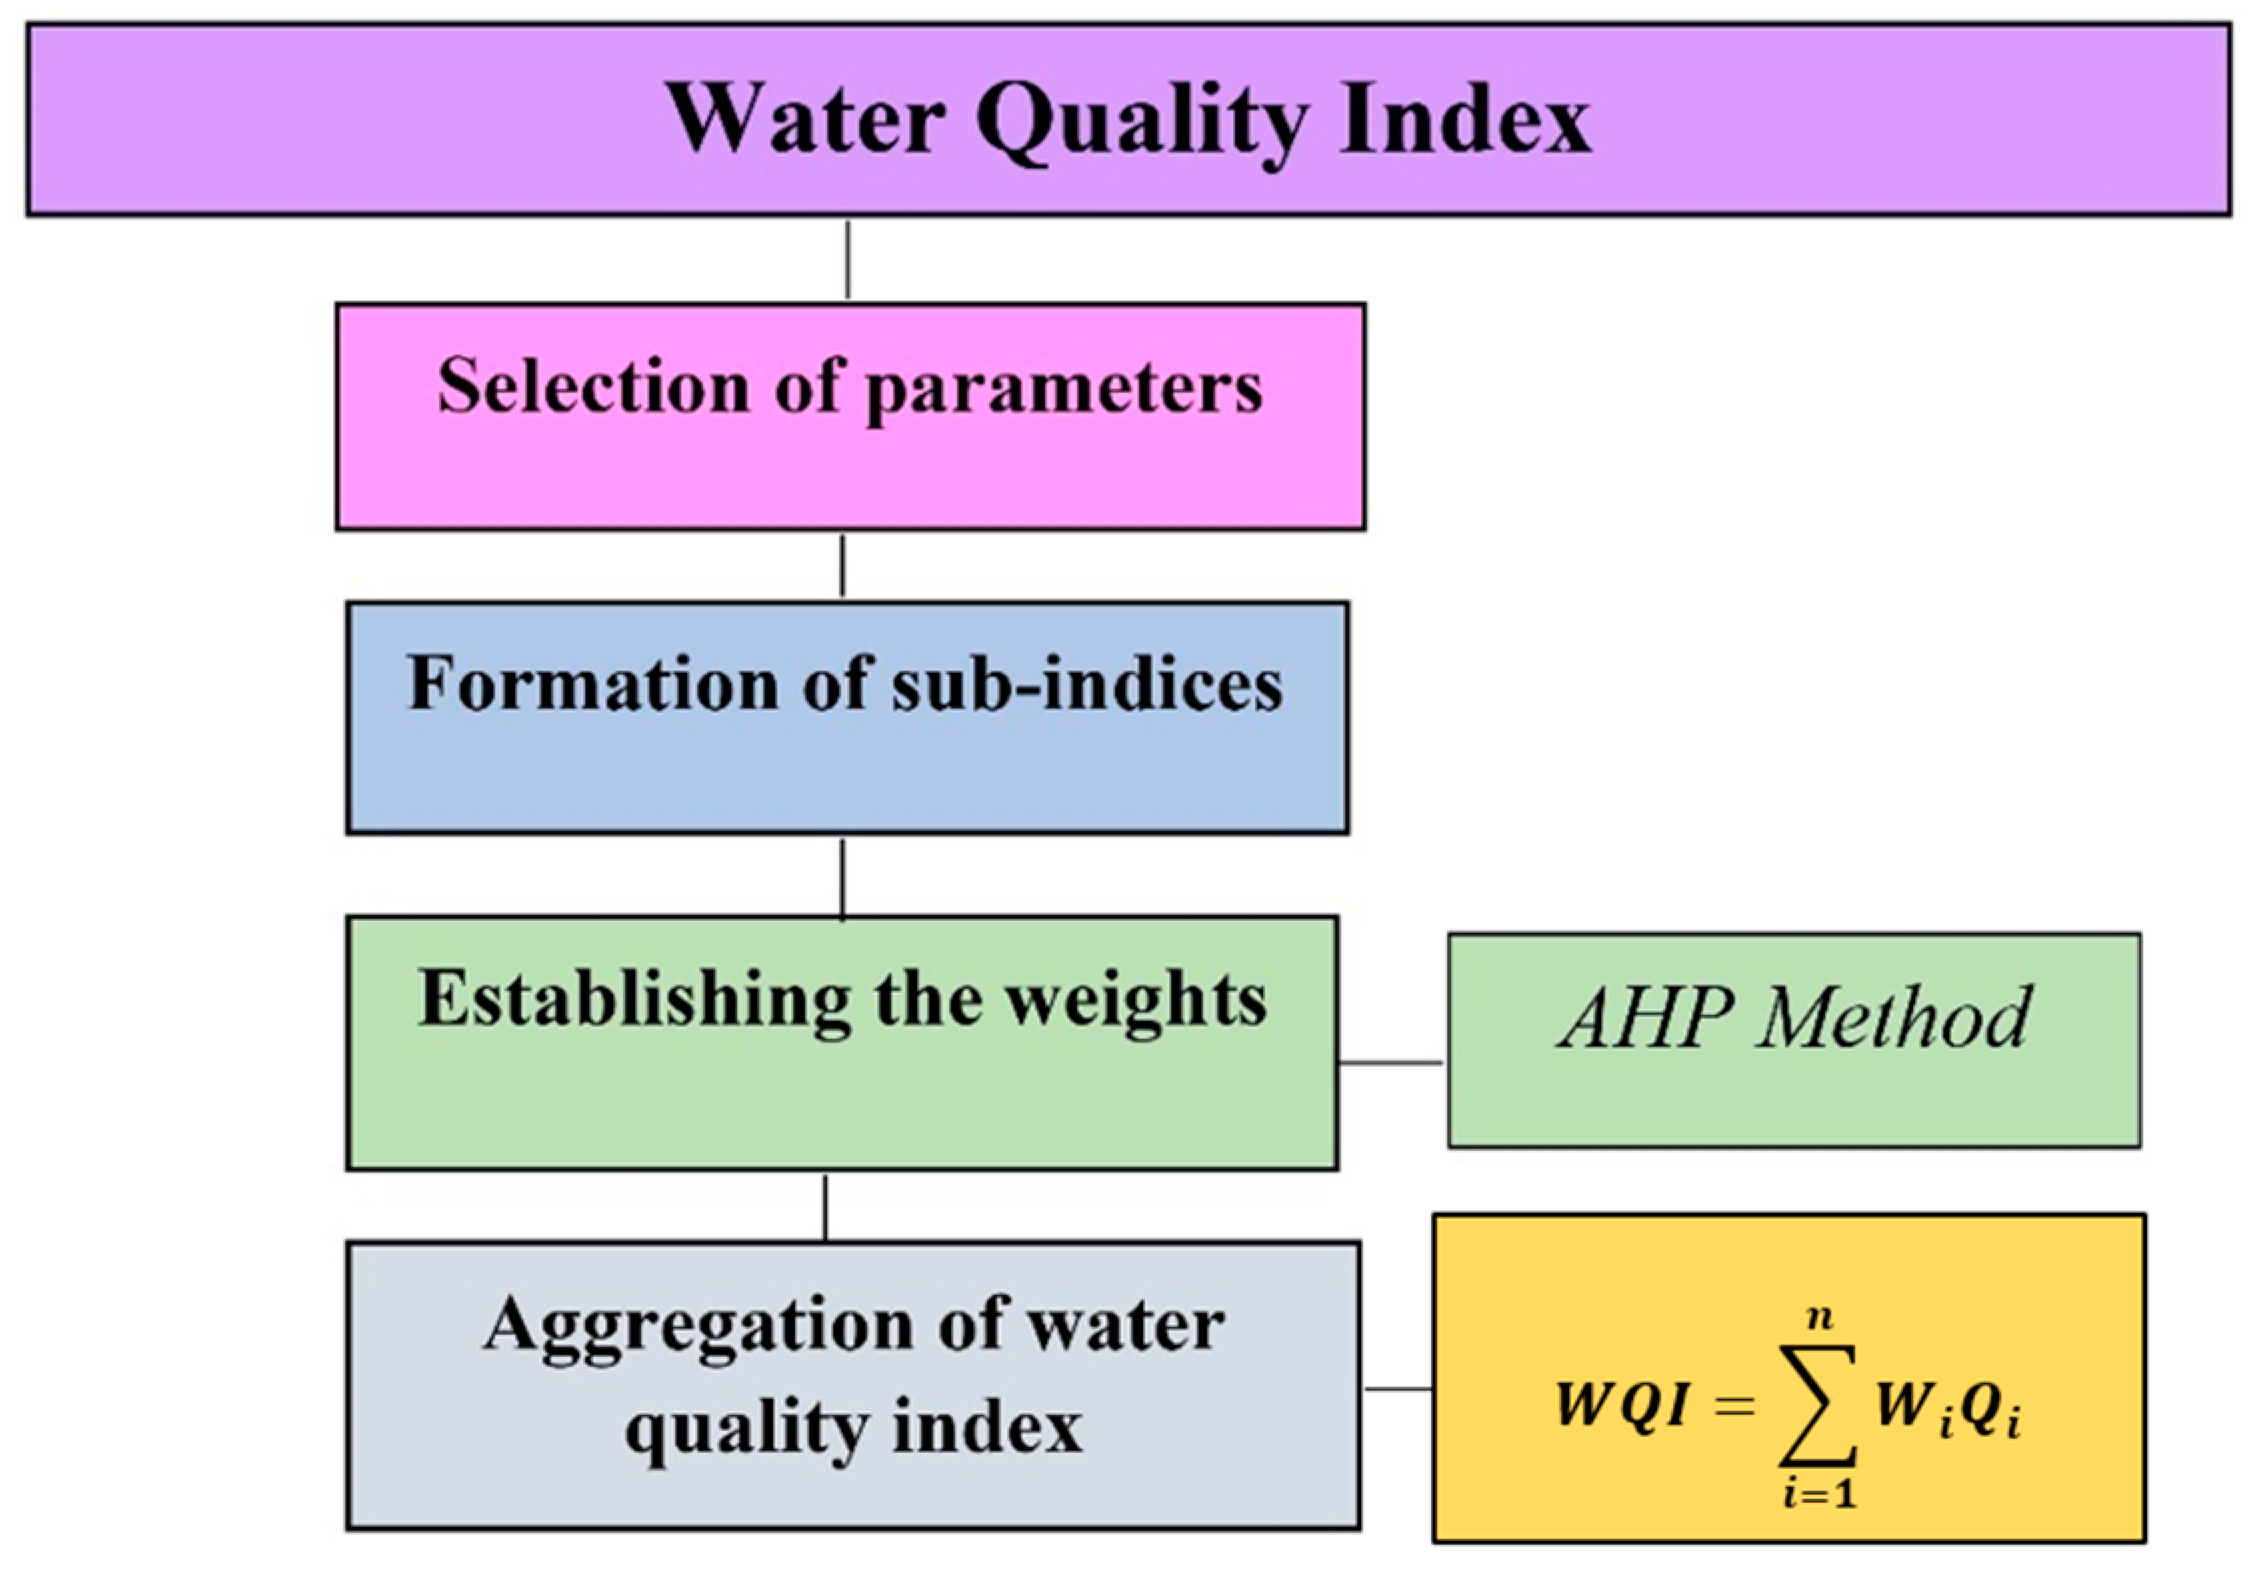
Water Quality Indices
2.5. Selection of the Parameters
2.6. Transformation to Sub-Indices
2.7. Determination of the Weights
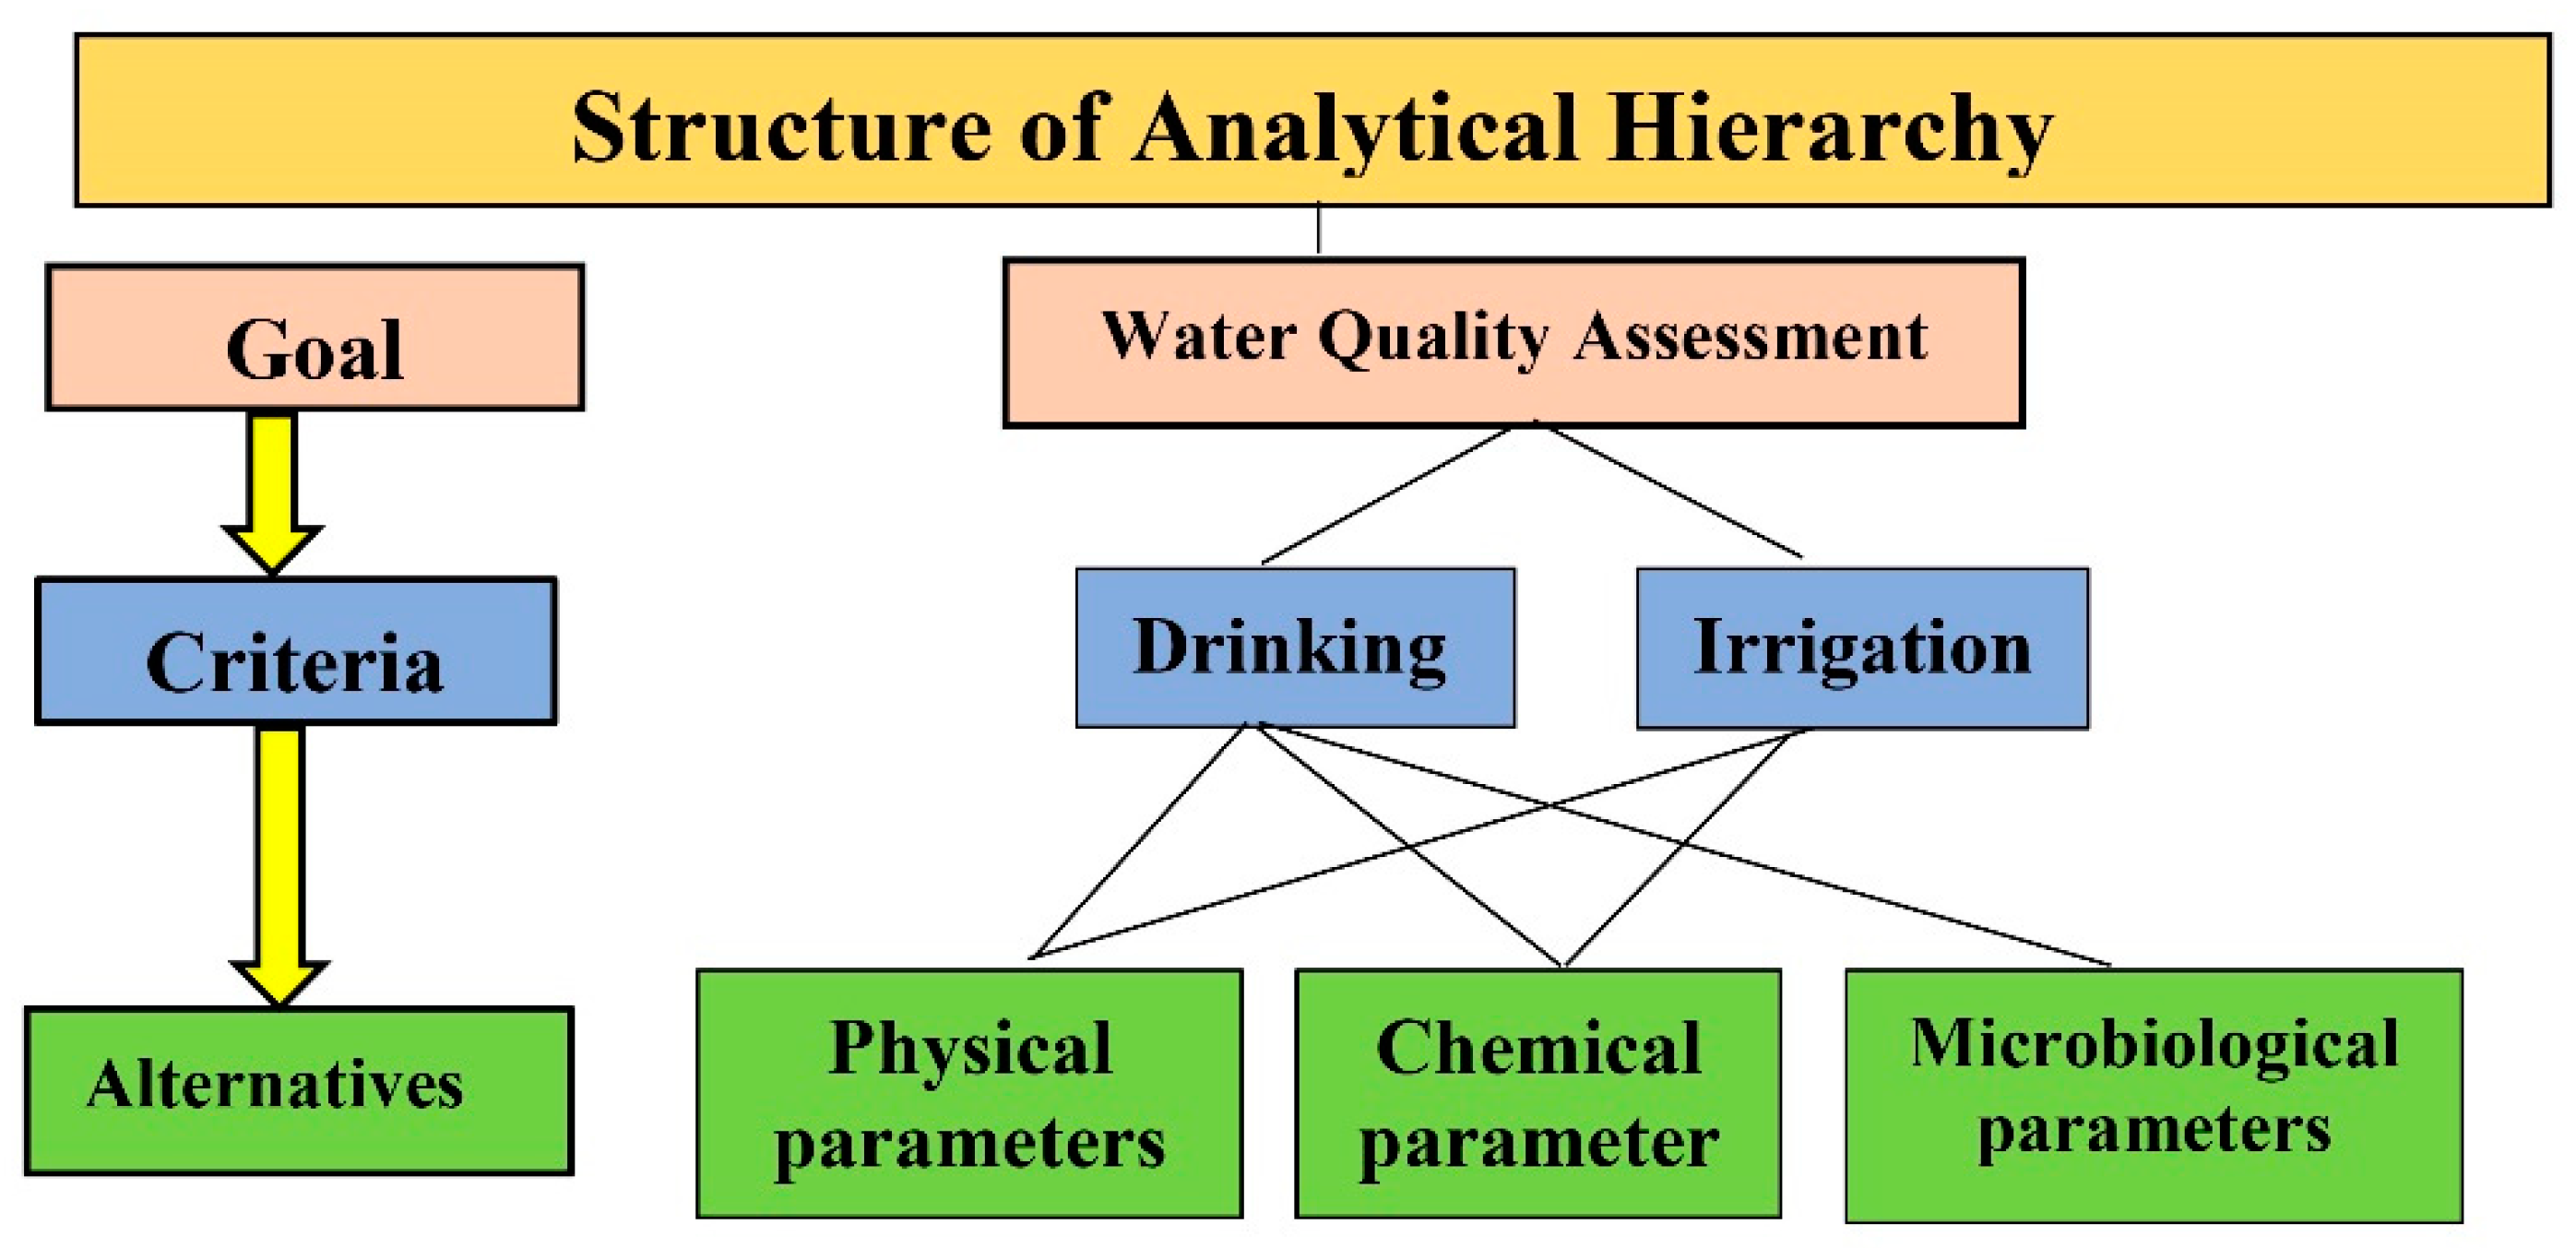
2.8. Analytical Hierarchy Process
2.9. Pairwise Comparisons of Alternatives
2.10. Preparation of the Questionnaire
2.11. Construct Pairwise Matrix
2.12. Weight Calculation (by Eigenvector)
2.13. Index Calculation
2.14. Ground Water Quality Assessment for Drinking Purpose
2.15. Strategies for the Improvement of Groundwater Quality
3. Results and Discussion
3.1. Physicochemical Parameters
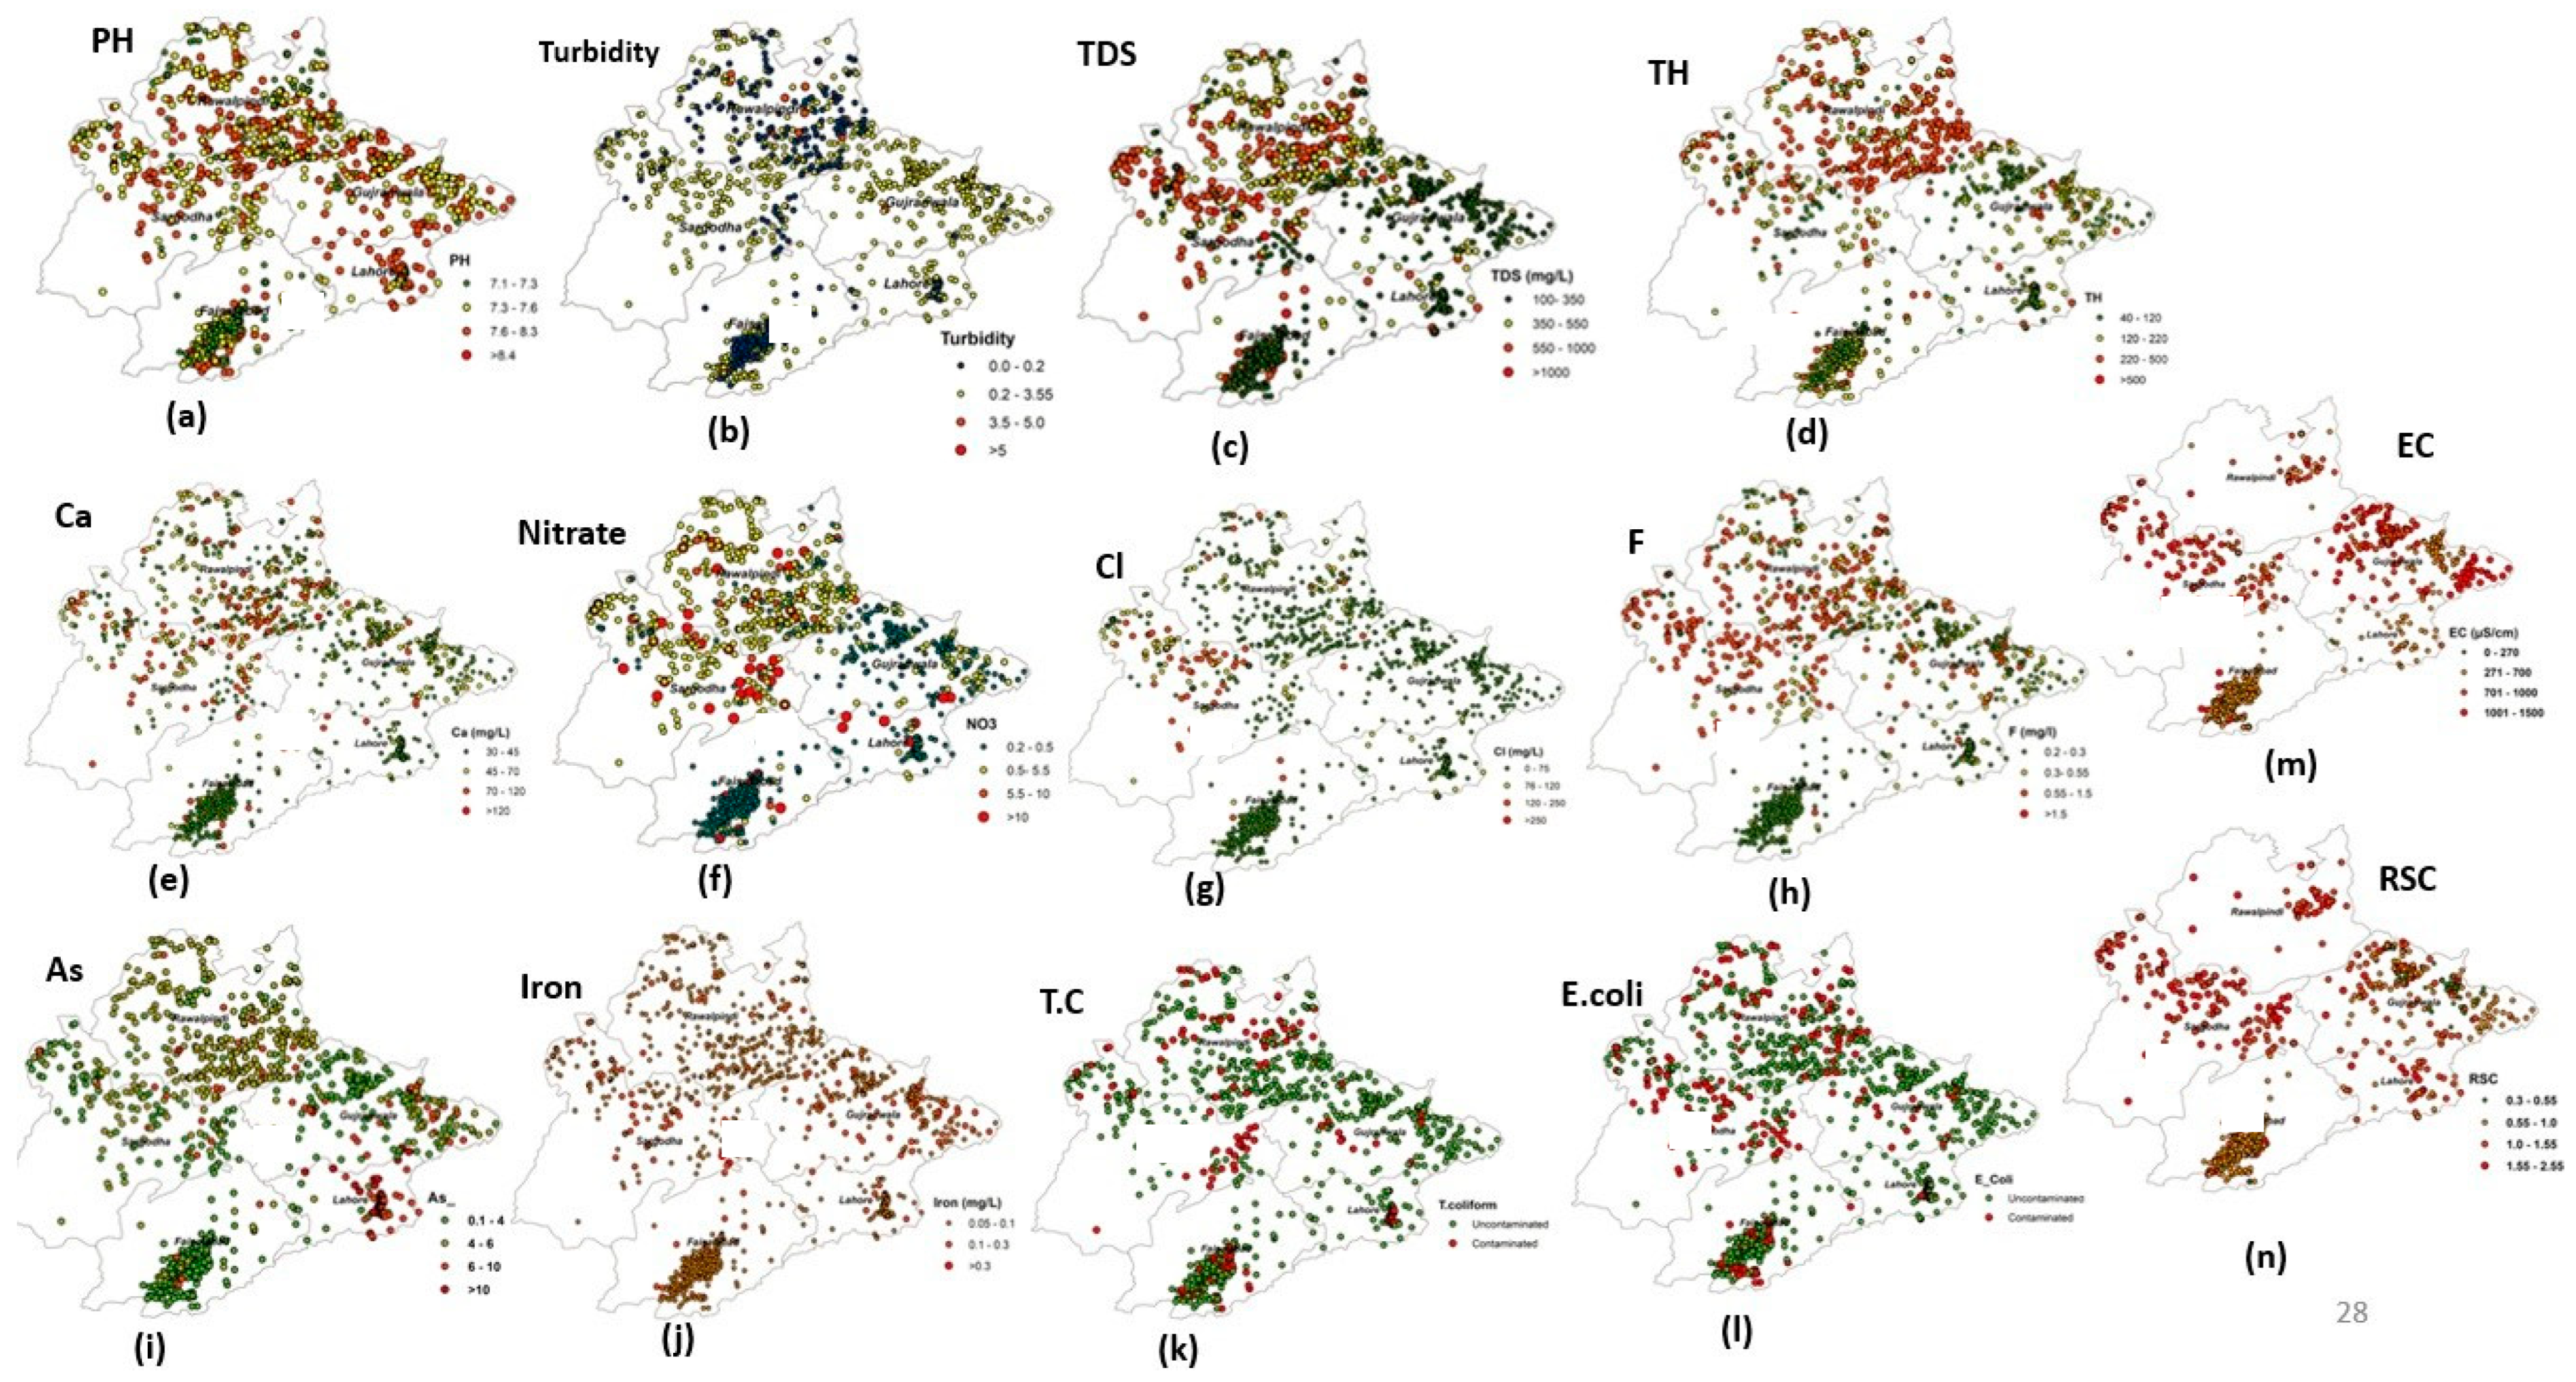
3.1.1. pH
3.1.2. Turbidity
3.1.3. Total Dissolved Solids (TDS)
3.1.4. Total Hardness
3.1.5. Calcium
3.1.6. Magnesium
3.1.7. Nitrate
3.1.8. Chloride
3.1.9. Fluoride
3.2. Heavy Metals
3.2.1. Arsenic
3.2.2. Iron
3.3. Microbiological
3.3.1. Total Coliforms
3.3.2. E. coli
3.4. Irrigation Parameters
3.4.1. Electrical Conductivity (EC)
3.4.2. Sodium Adsorption Ratio (SAR)
3.4.3. Residual Sodium Carbonate (RSC)
3.4.4. Comparison of GW Parameters with International Standards
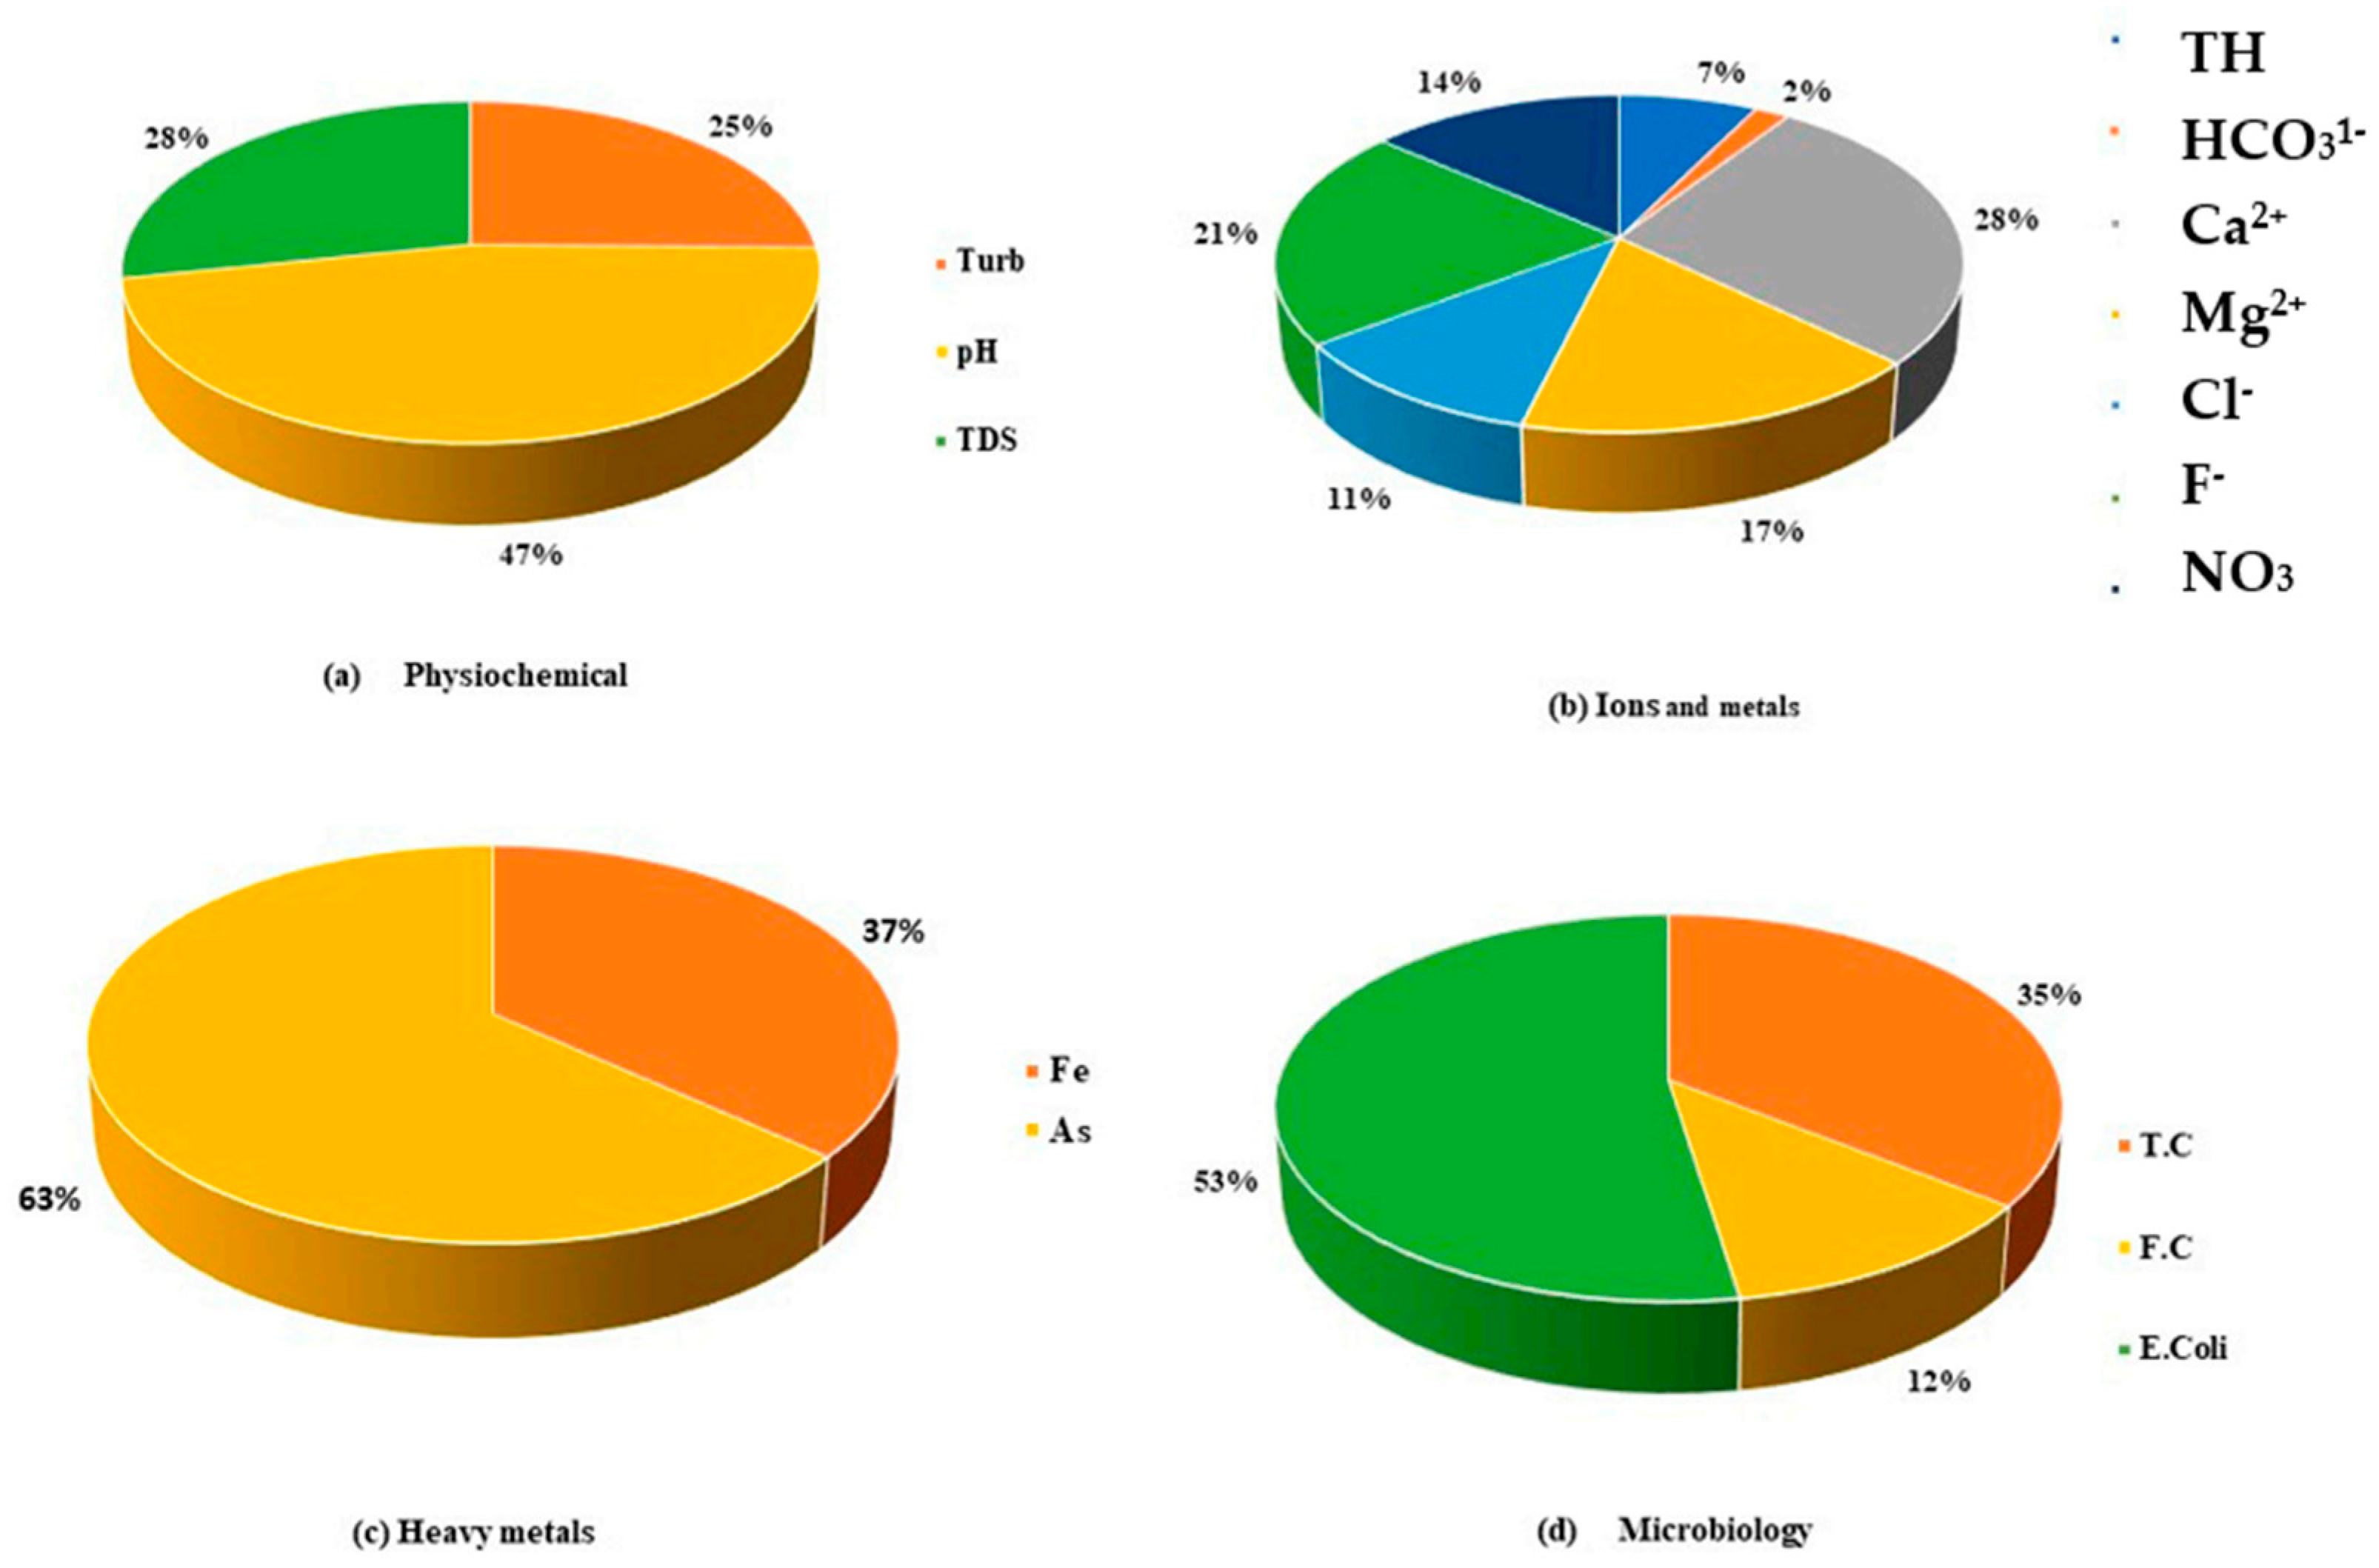
3.4.5. Relative Proportions of Parameters
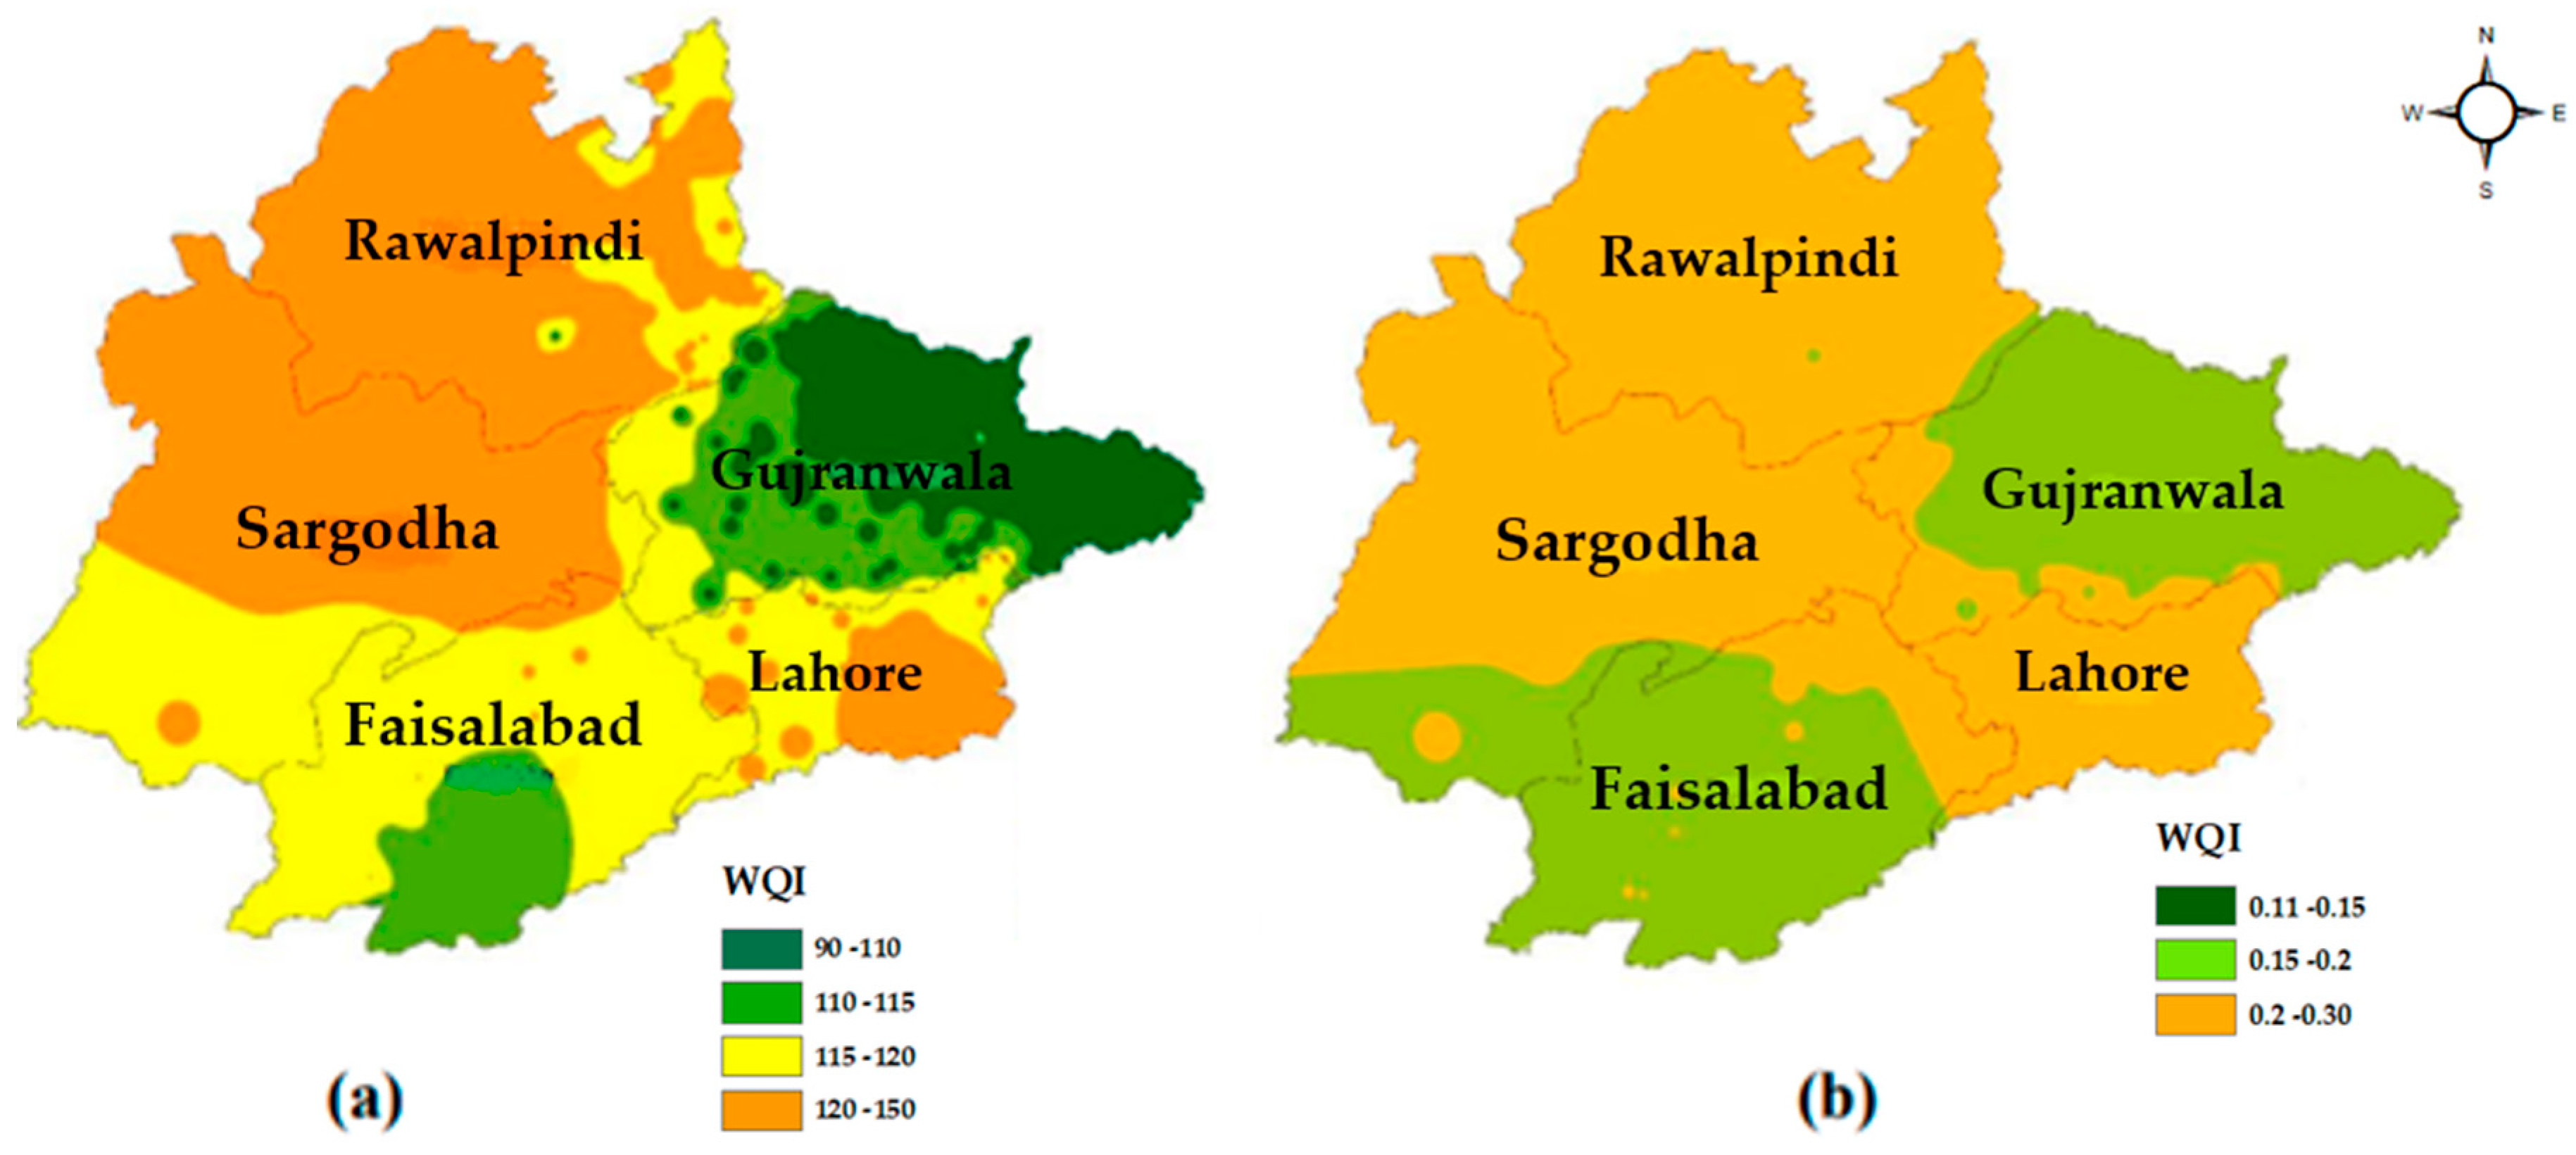
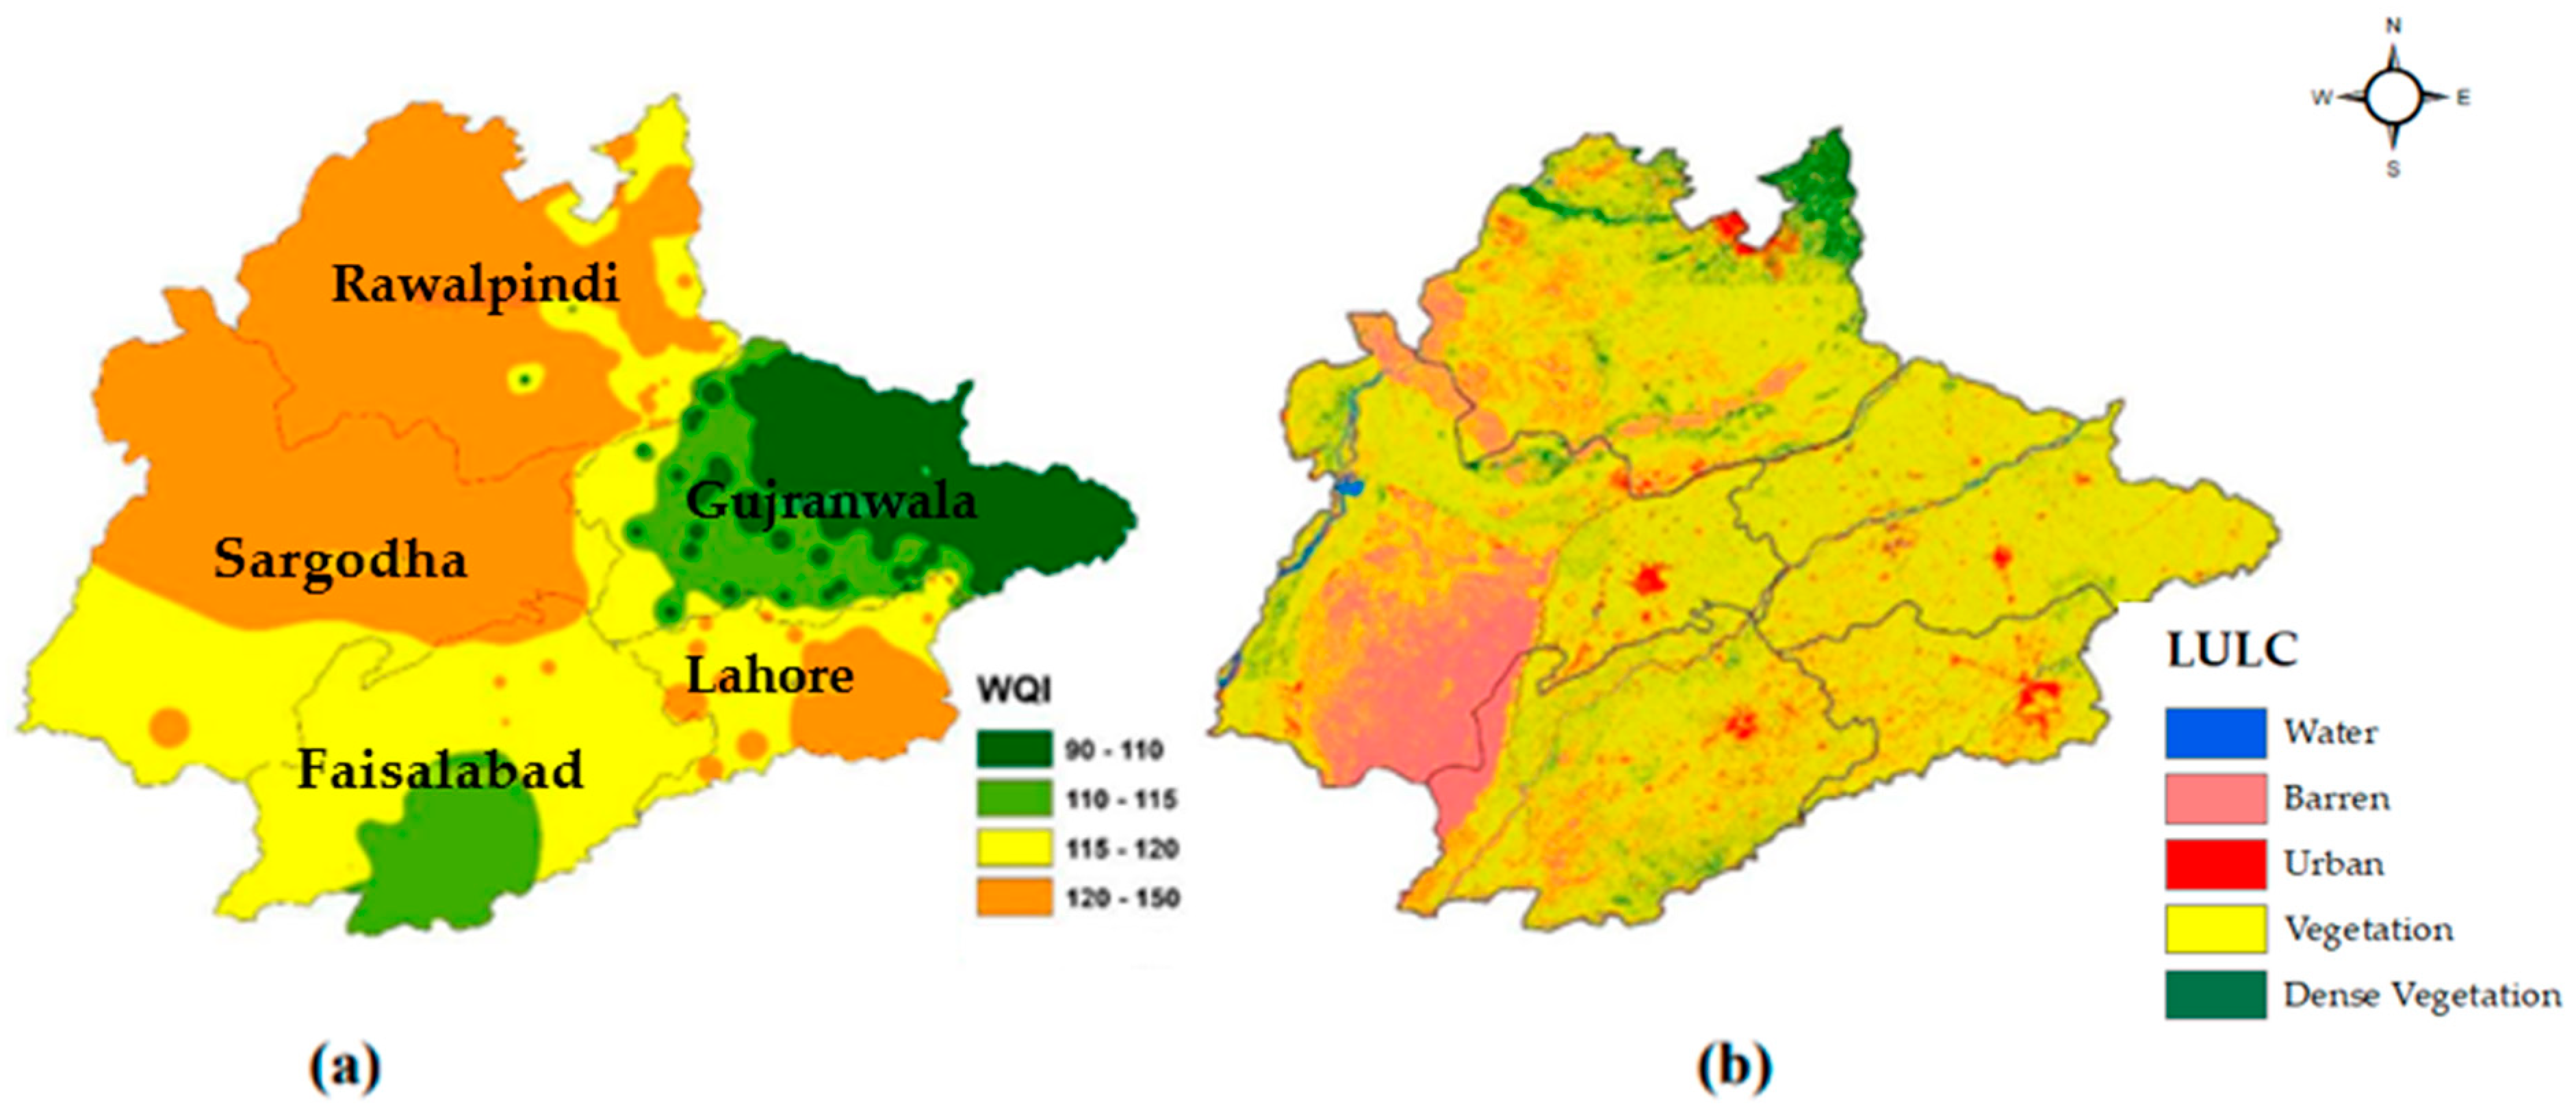
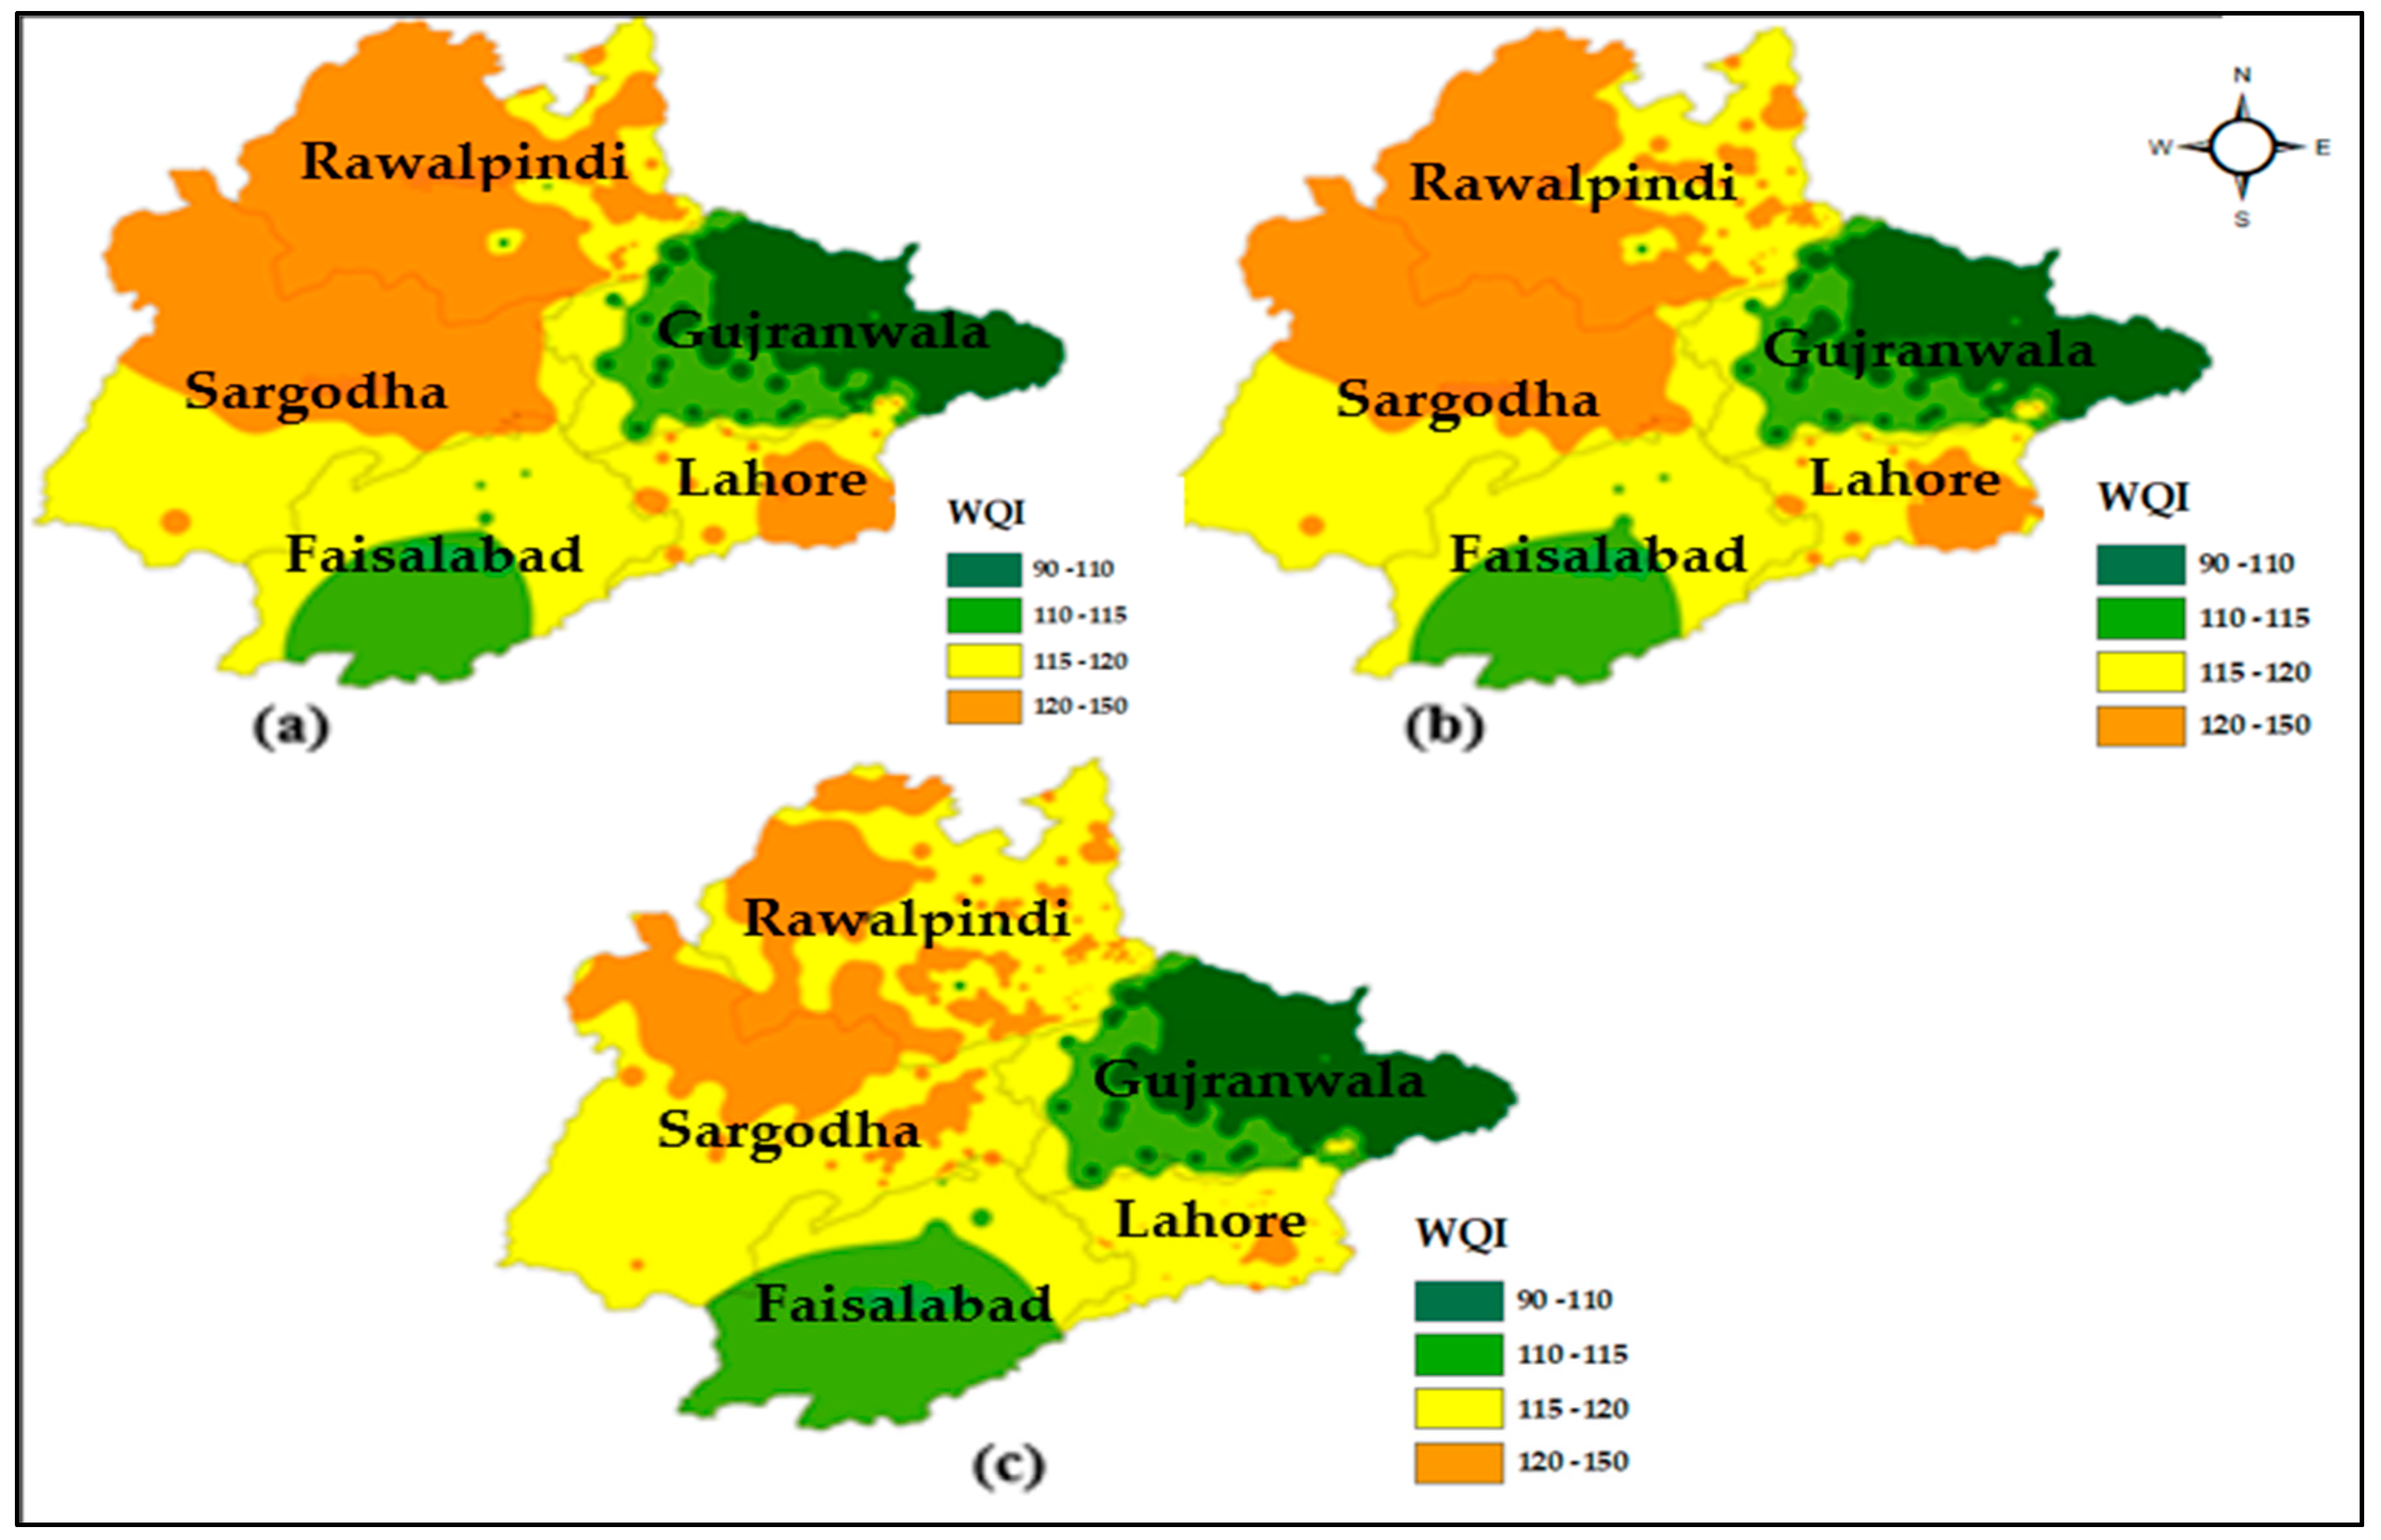
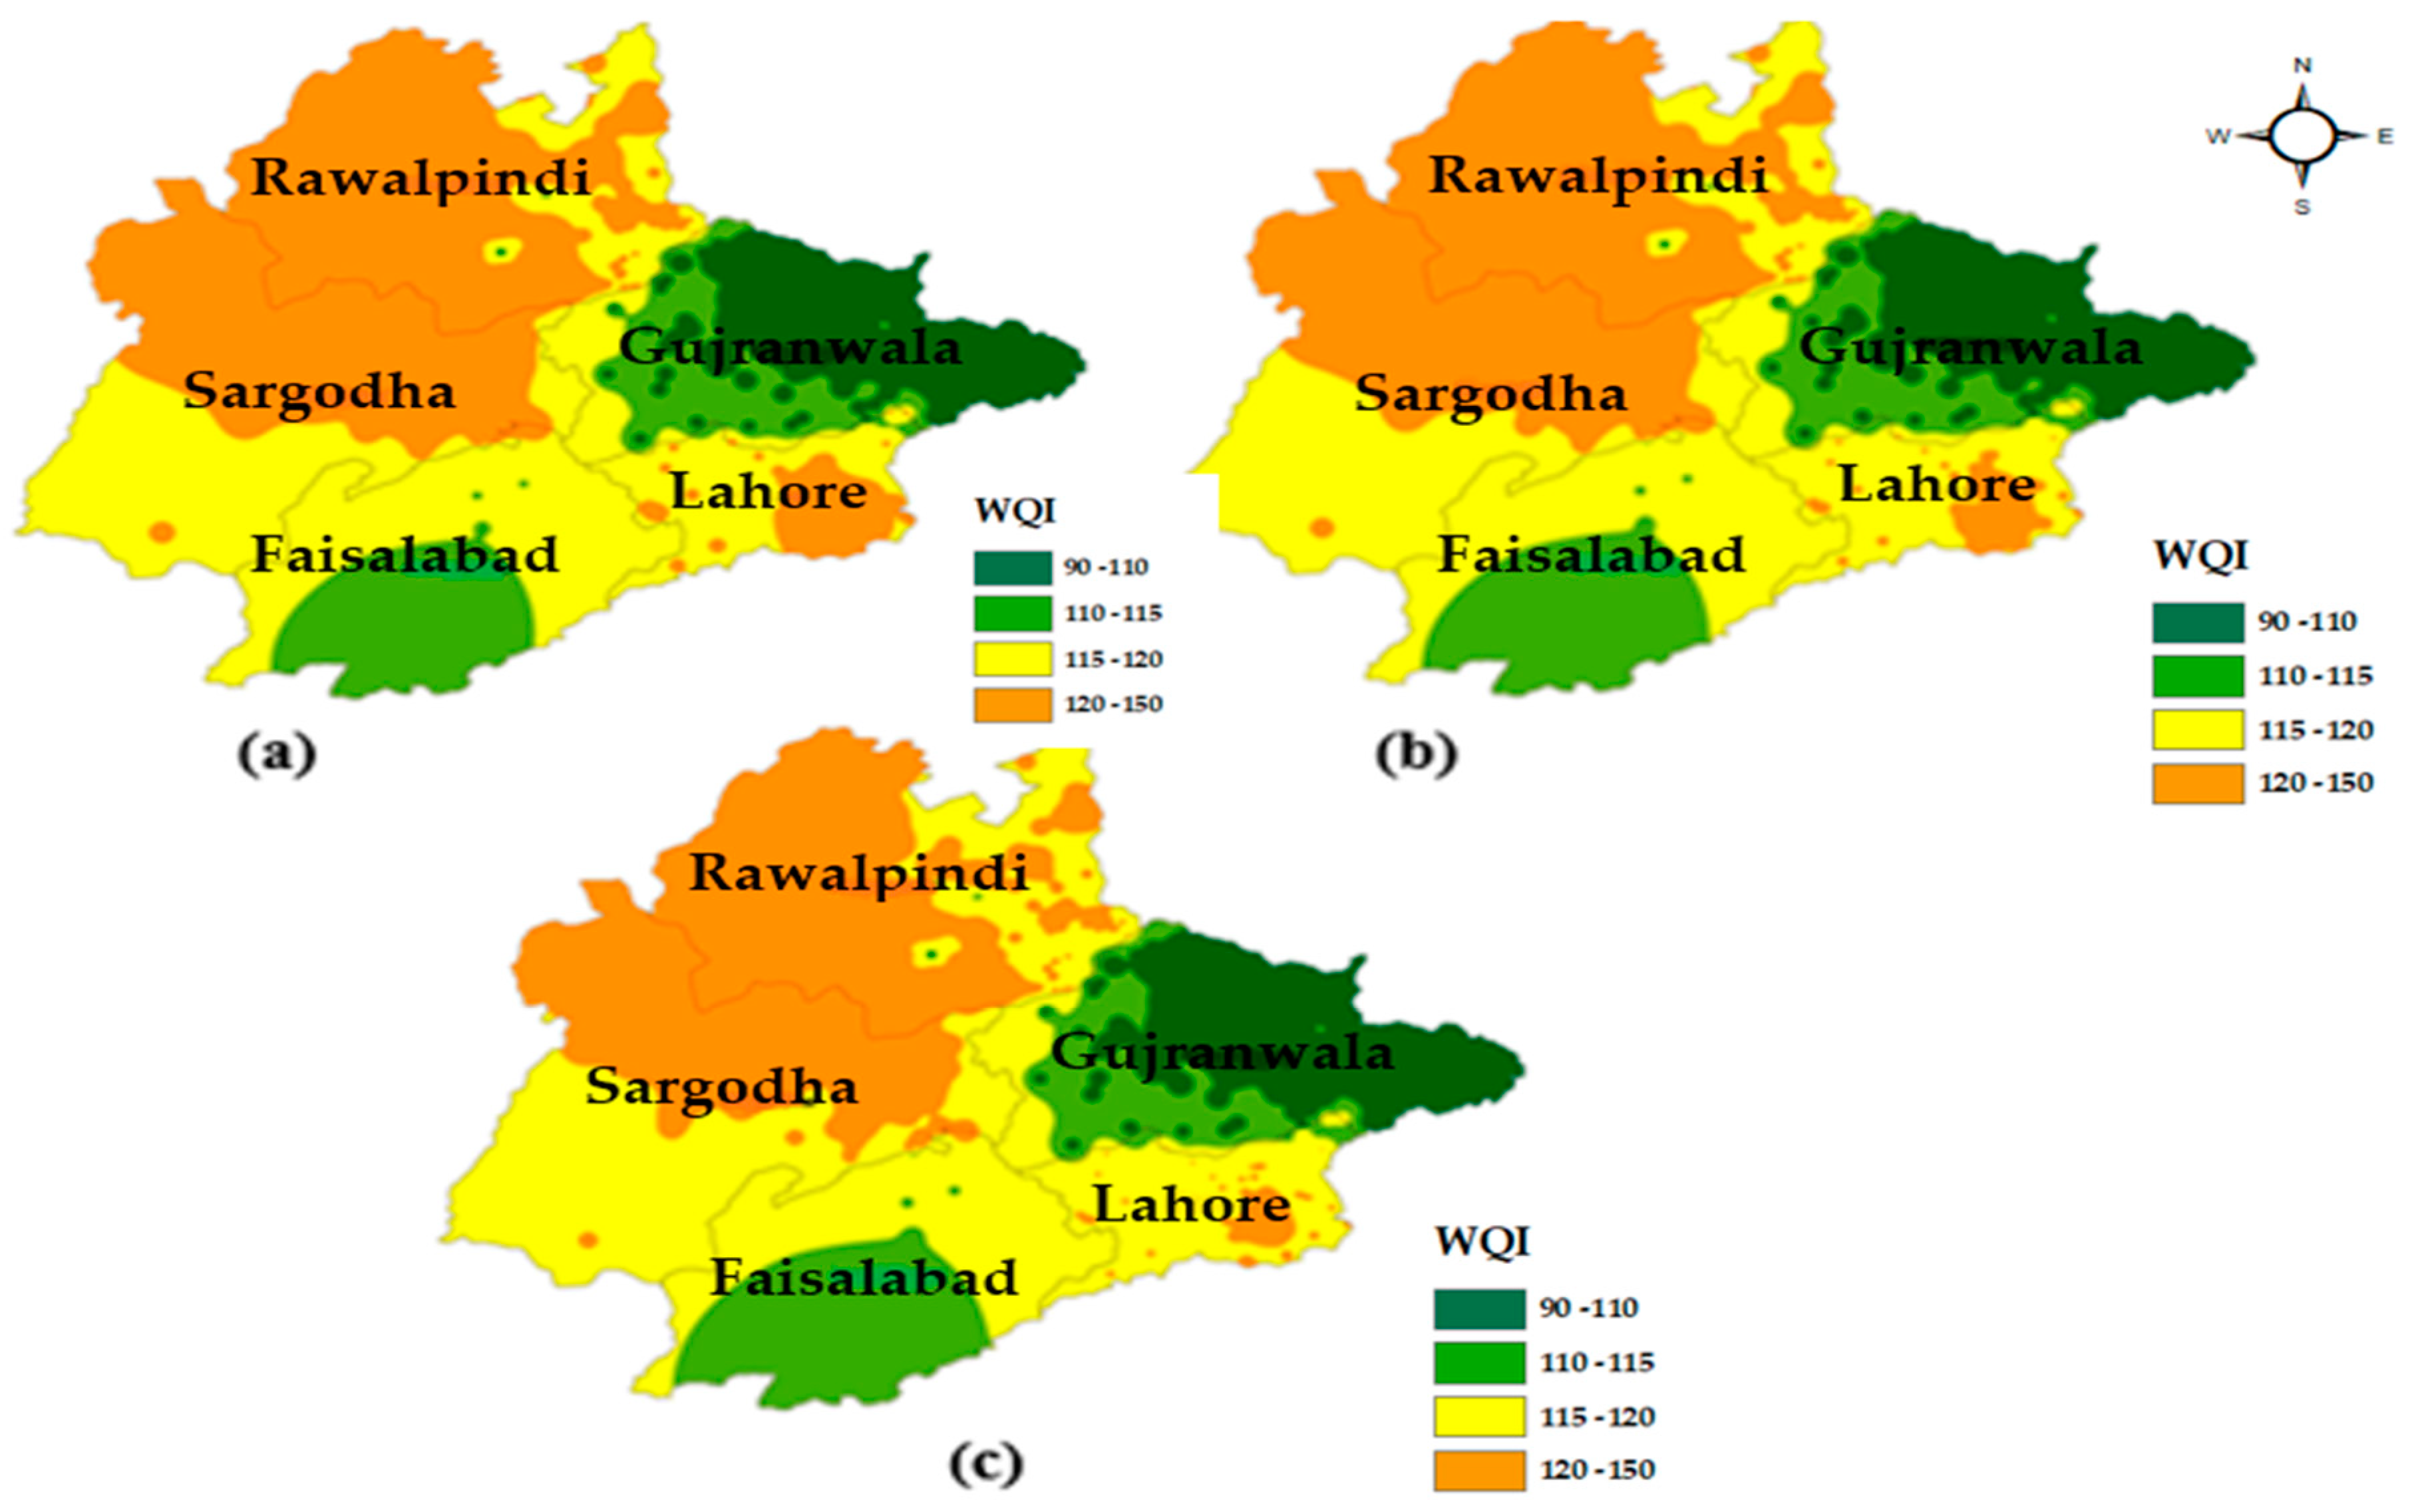
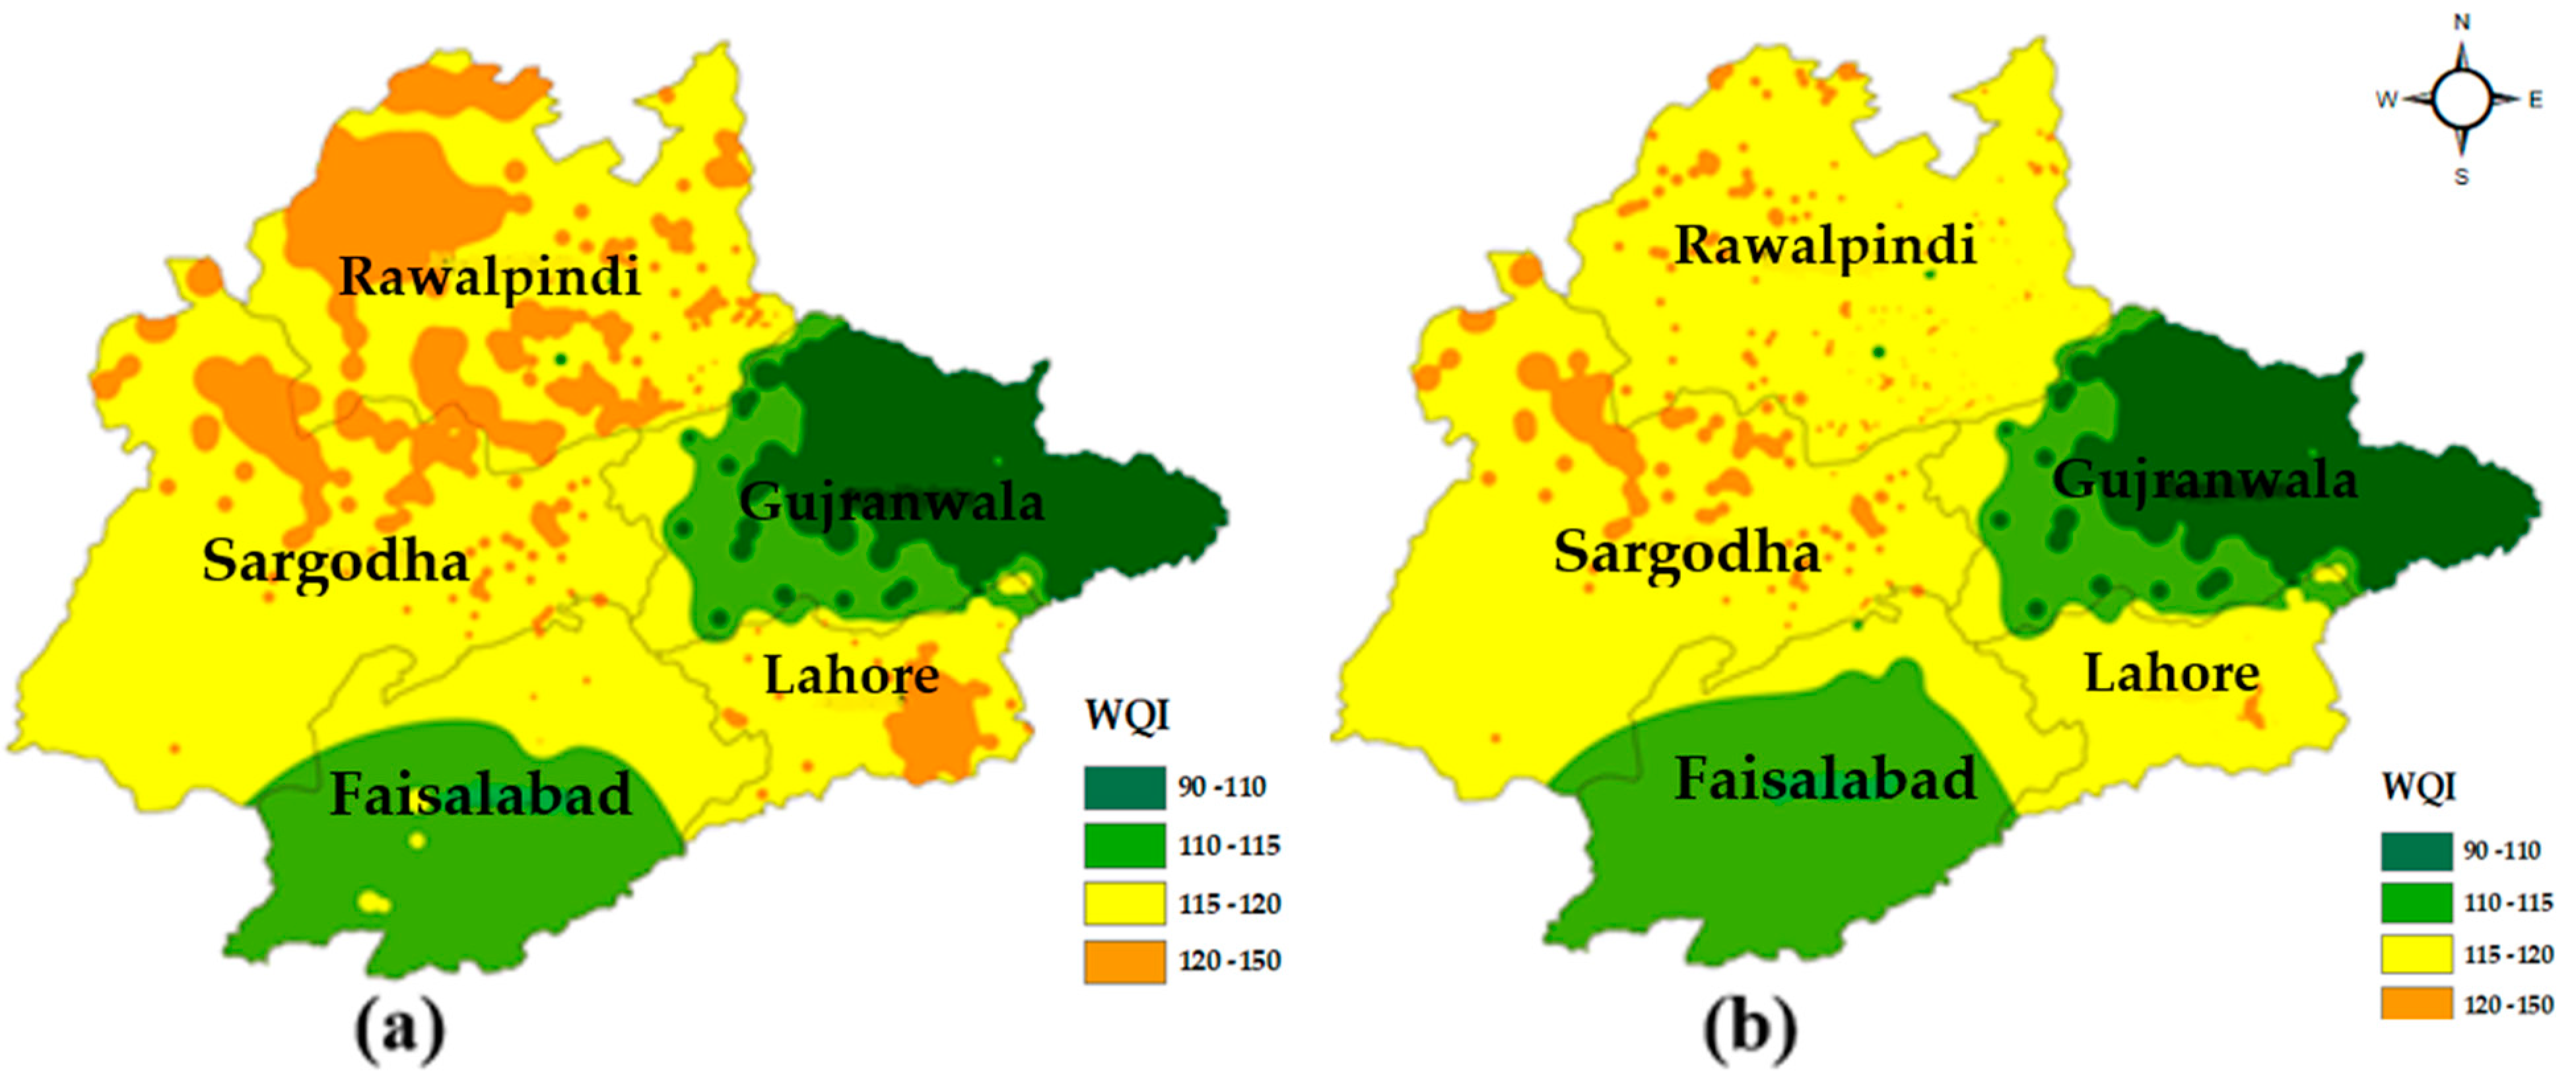
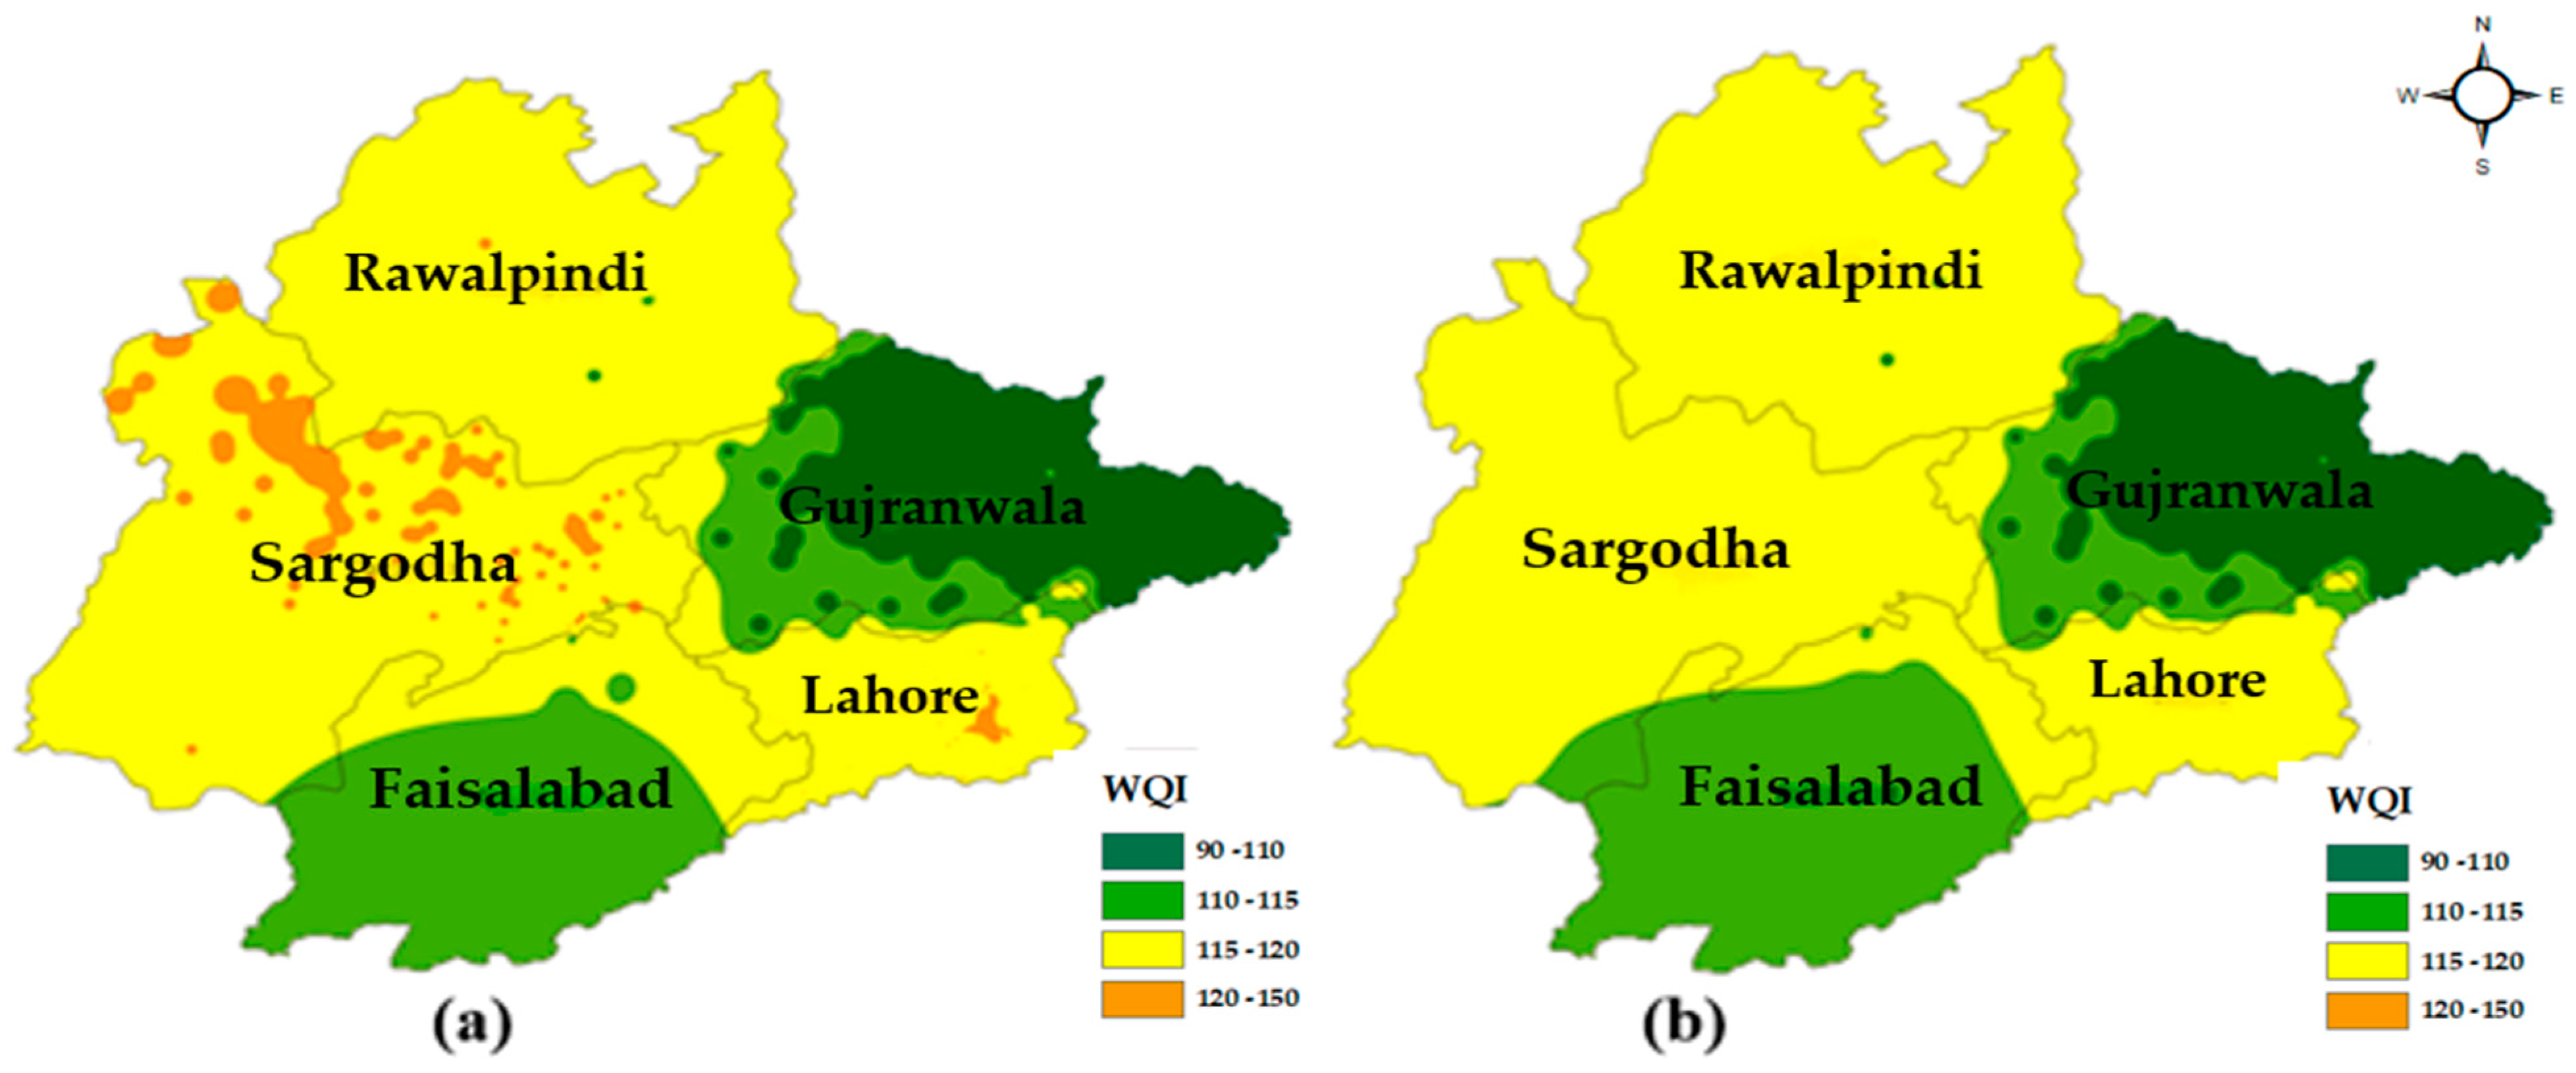
3.5. Water Quality Index
3.6. Determination of Weights
AHP Questionnaire
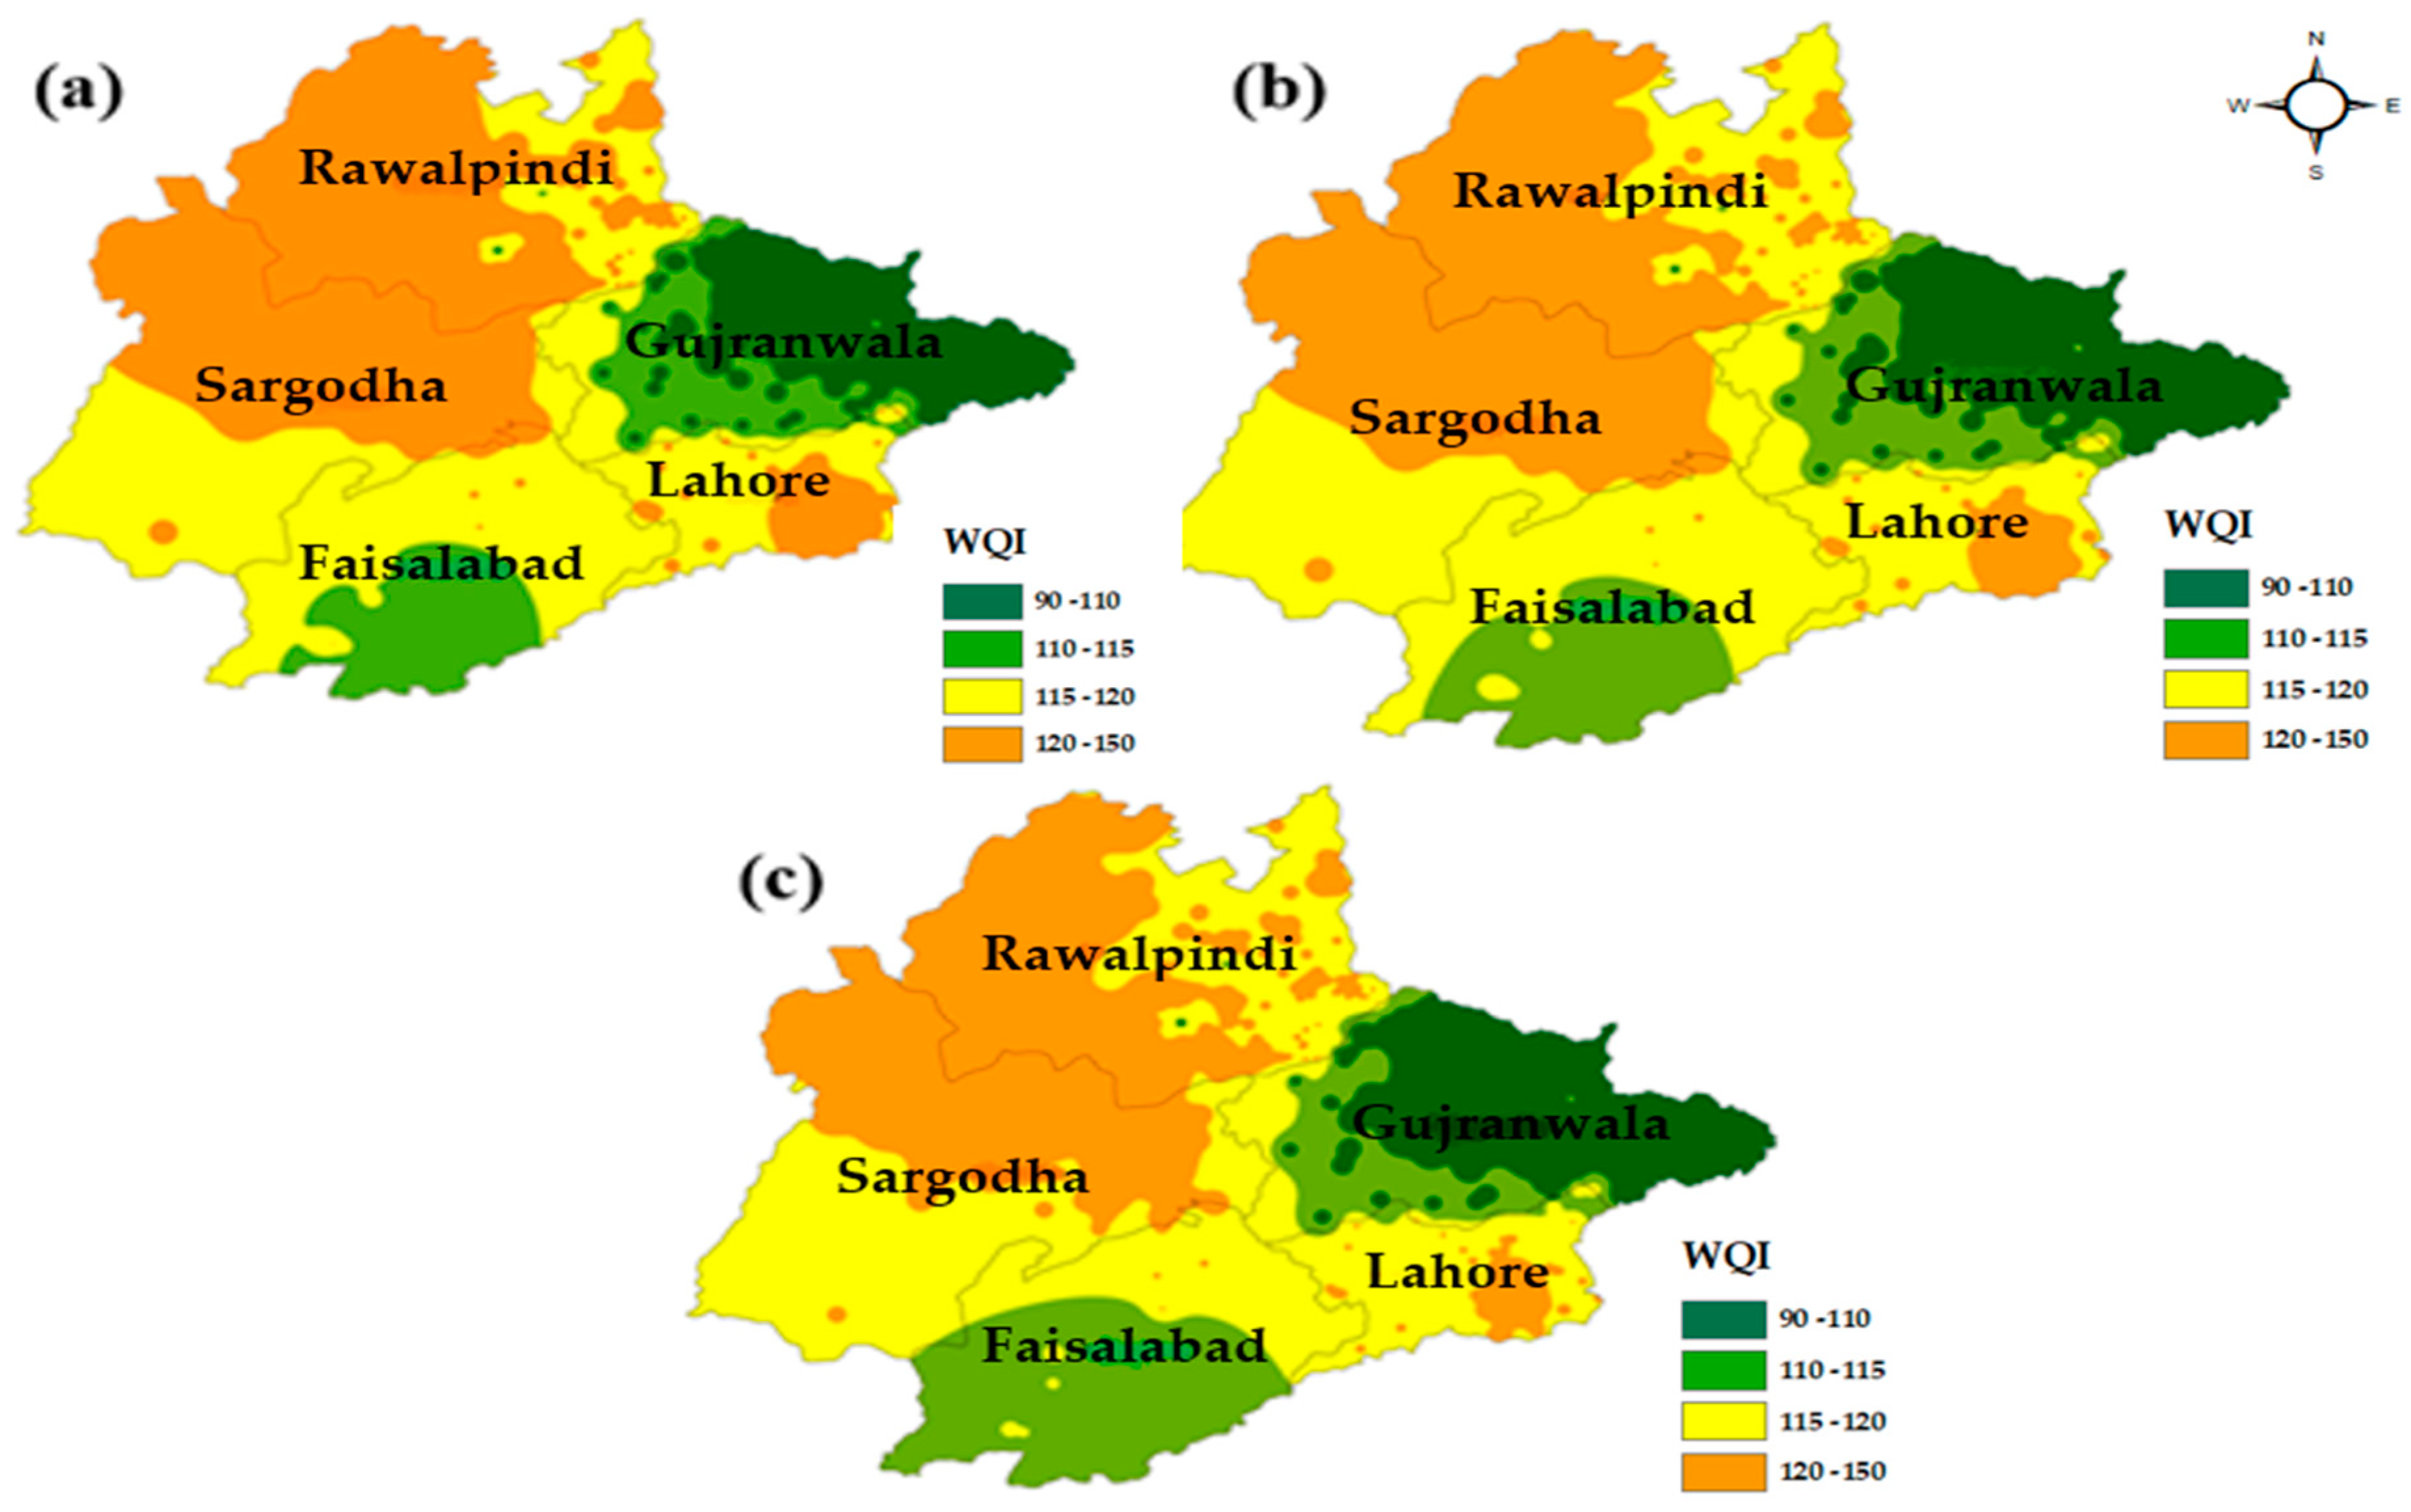
3.7. Groundwater Quality Assessment for Drinking Purpose
3.8. Ground Water Quality Assessment for Irritation Purposes
3.9. Impact of Urbanization and Industrialization on Water Quality
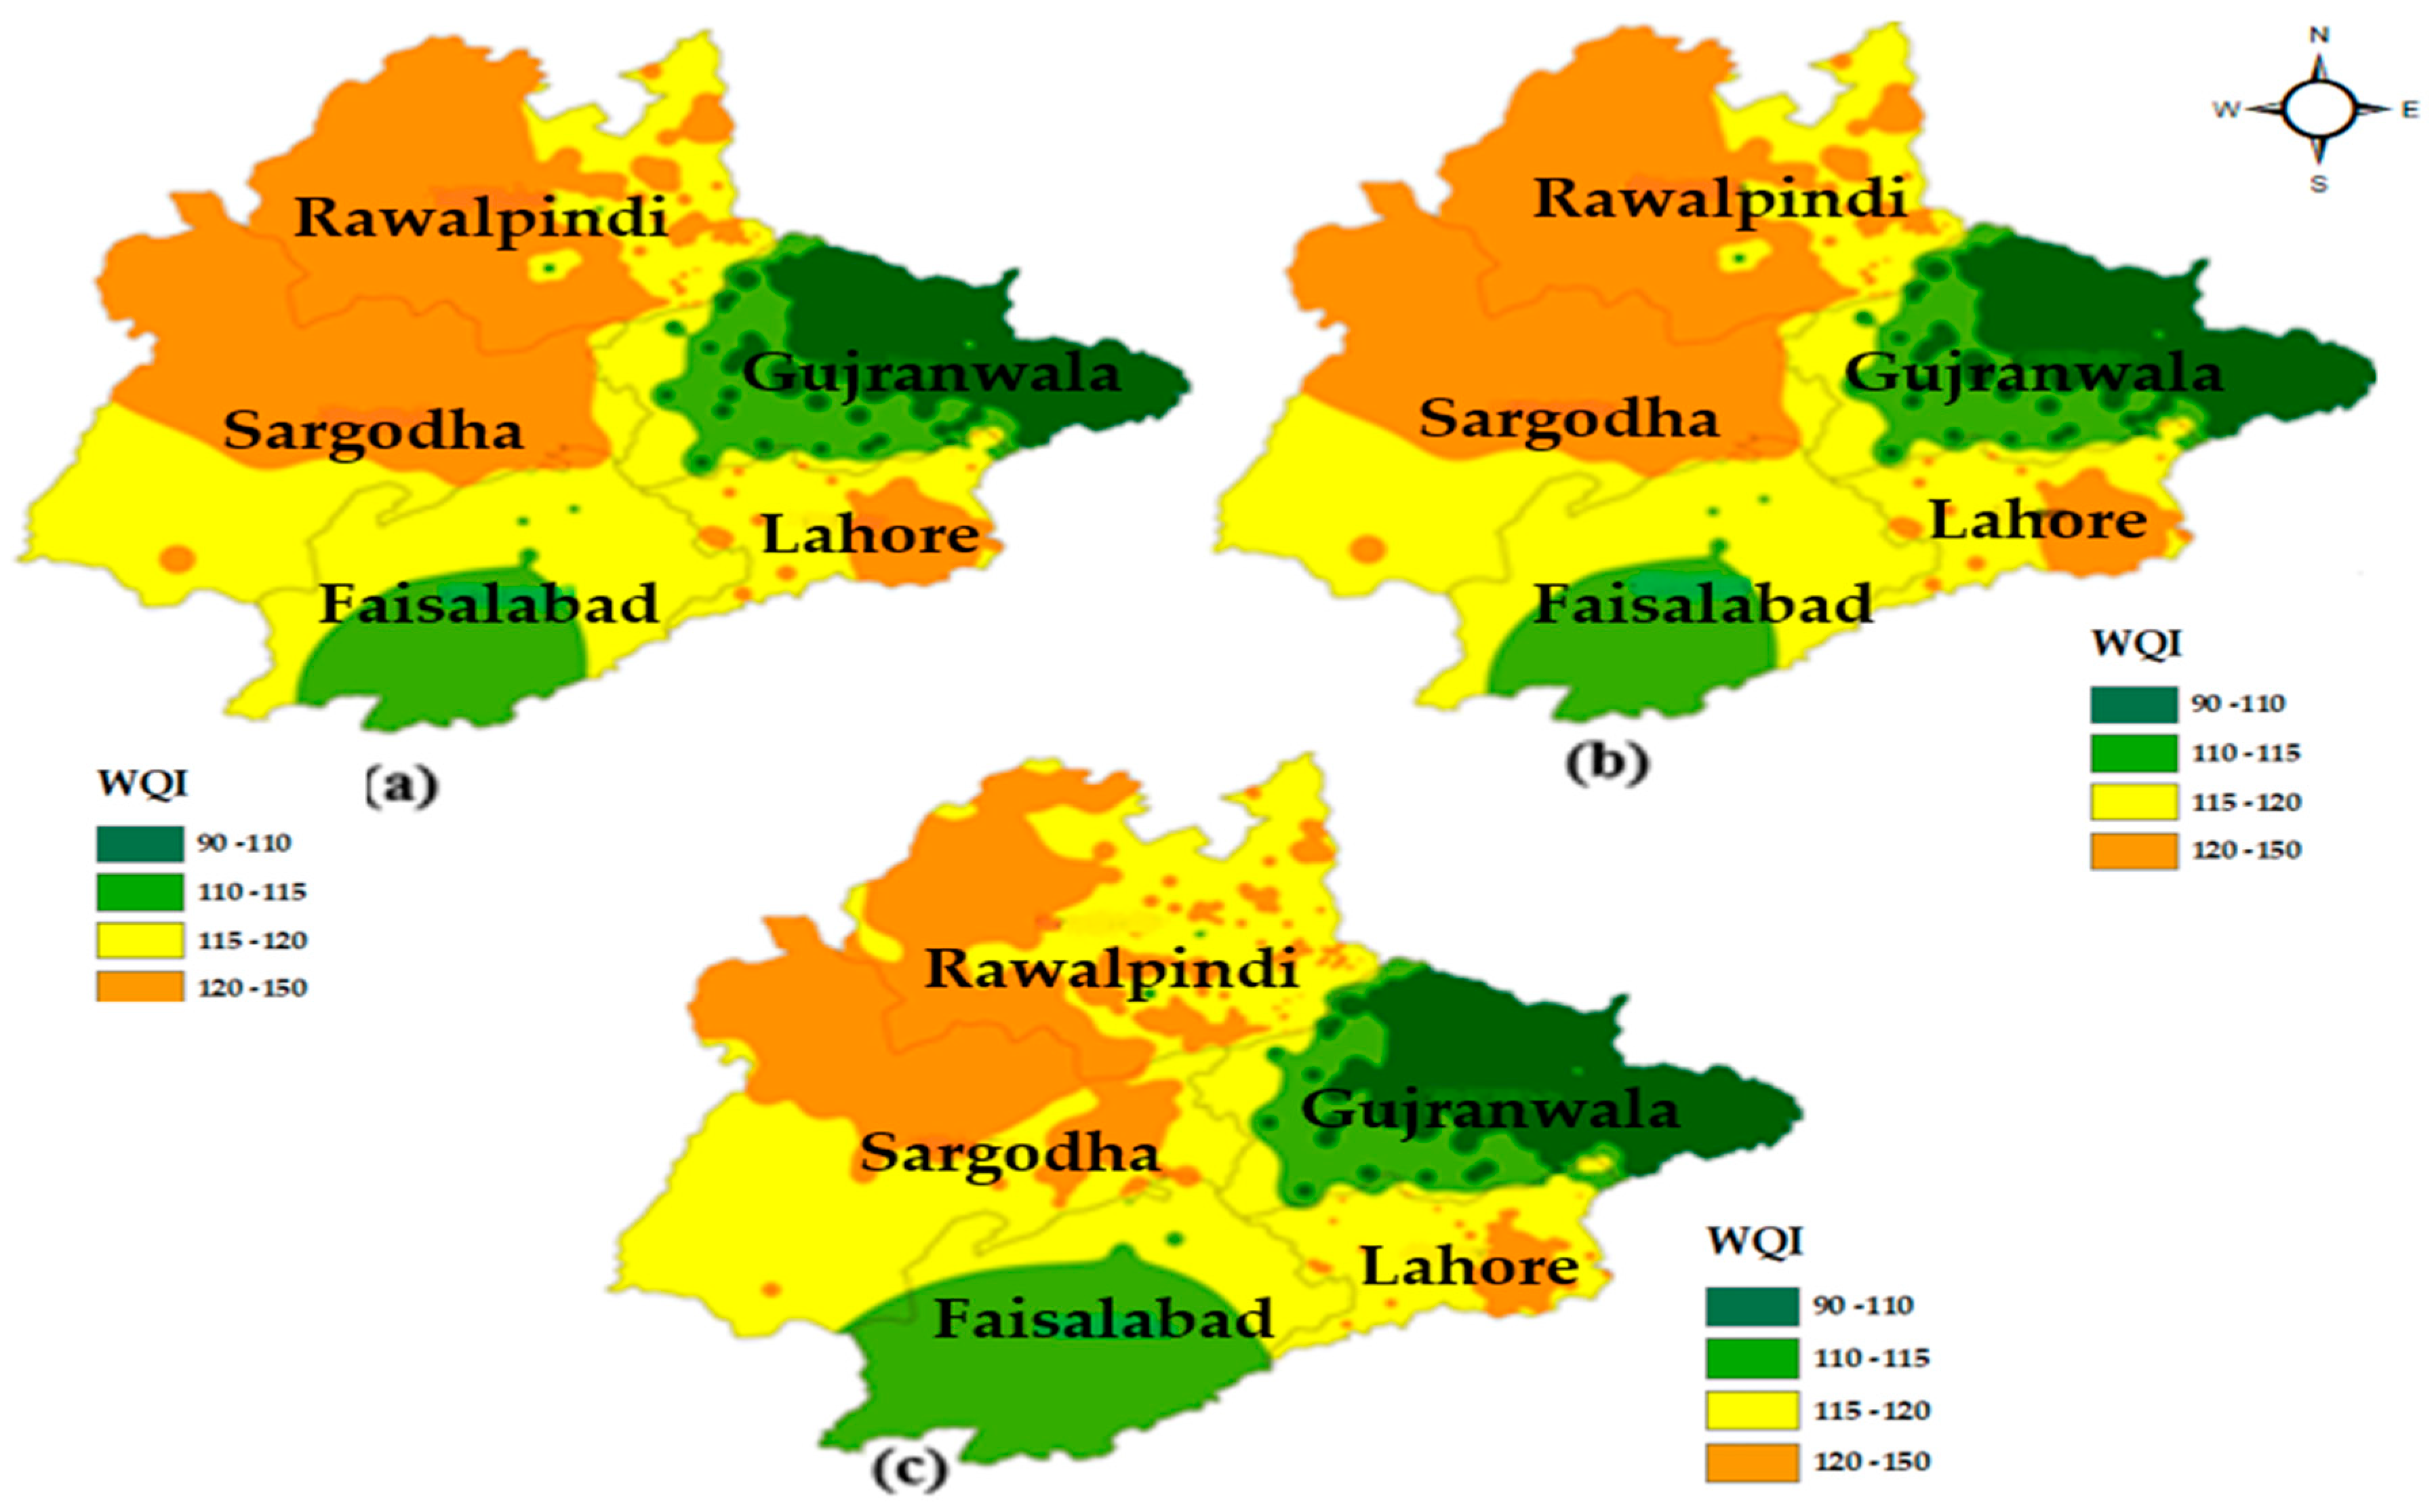
3.10. Development of the Mitigation Strategies
3.10.1. Avoid Chemical Contamination by Adopting Different Measures to Control Pollution
Scenario-I (Variations in Microbiological Parameters)
- i.
- Provide proper monitoring of the industry’s effluent discharge points;
- ii.
- Discharging wastewater only after a sequence of treatments;
- iii.
- Equipping urban areas with treatment plants;
- iv.
- Regular monitoring of the sewerage system;
- v.
- Avoiding open septic tanks and their direct disposal in the open channels;
- vi.
- Regularly monitoring the quality of pipelines;
- vii.
- Laying water supply lines away from sewerage systems;
- viii.
- Ensuring a large distance between landfills and domestic wells.
Scenario-II (Variations in Heavy Metal Parameters)
- I.
- Providing proper monitoring of the industry’s effluent discharge points;
- II.
- Restricting industry near any water supply line;
- III.
- Only discharging wastewater after a sequence of treatments;
- IV.
- Ensuring a large distance between landfills and domestic wells.
Scenario-III (Variations in Chemical Parameters)
- I.
- Decreasing the use of nitrogen-based fertilizers by 10% to 20%;
- II.
- Keeping drains isolated from the areas heavy in ions;
- III.
- Providing highly contaminated areas with wastewater collection and treatment plants;
- IV.
- Lining drainage channels to prevent seepage from drains into GW.
3.10.2. Treatment of Water to Reduce the Levels of Chemical Contamination
Scenario-I (Primary Treatment)
Scenario-II (Secondary Treatment)
Scenario-III (Tertiary Treatment)
4. Conclusions
Author Contributions
Funding
Data Availability Statement
Acknowledgments
Conflicts of Interest
References
- Foster, S.; Hirata, R.; Gomes, D.; D’Elia, M.; Paris, M. Groundwater Quality Protection: A Guide for Water Utilities, Municipal Authorities, and Environment Agencies; World Bank Publications; The World Bank Group: Washington, DC, USA, 2002. [Google Scholar]
- Nair, I.S.; Rajaveni, S.P.; Schneider, M.; Elango, L. Geochemical and Isotopic Signatures for the Identification of Seawater Intrusion in an Alluvial Aquifer. J. Earth Syst. Sci. 2015, 124, 1281–1291. [Google Scholar] [CrossRef]
- Alshehri, F.; Abdelrahman, K. Integrated Approach for the Investigation of Groundwater Quality Using Hydrochemical and Geostatistical Analyses in Wadi Fatimah, Western Saudi Arabia. Front. Earth Sci. 2023, 11, 1166153. [Google Scholar] [CrossRef]
- Bartram, J.; Ballance, R. Water Quality Monitoring: A Practical Guide to the Design and Implementation of Freshwater Quality Studies and Monitoring Programmes; CRC Press: Boca Raton, FL, USA, 1996; ISBN 0419223207. [Google Scholar]
- Haq, M.A.; Jilani, A.K.; Prabu, P. Deep Learning Based Modeling of Groundwater Storage Change. Comput. Mater. Contin. 2021, 70, 4599–4617. [Google Scholar]
- Mangan, P.; Pandi, D.; Haq, M.A.; Sinha, A.; Nagarajan, R.; Dasani, T.; Keshta, I.; Alshehri, M. Analytic Hierarchy Process Based Land Suitability for Organic Farming in the Arid Region. Sustainability 2022, 14, 4542. [Google Scholar] [CrossRef]
- Sayato, Y. WHO Guidelines for Drinking-Water Quality. Eisei Kagaku 1989, 35, 307–312. [Google Scholar] [CrossRef]
- Khan, K.; Lu, Y.; Khan, H.; Zakir, S.; Khan, S.; Khan, A.A.; Wei, L.; Wang, T. Health Risks Associated with Heavy Metals in the Drinking Water of Swat, Northern Pakistan. J. Environ. Sci. 2013, 25, 2003–2013. [Google Scholar] [CrossRef] [PubMed]
- Muhammad, S.; Shah, M.T.; Khan, S. Arsenic Health Risk Assessment in Drinking Water and Source Apportionment Using Multivariate Statistical Techniques in Kohistan Region, Northern Pakistan. Food Chem. Toxicol. 2010, 48, 2855–2864. [Google Scholar] [CrossRef]
- Bodrud-Doza, M.D.; Islam, A.R.M.T.; Ahmed, F.; Das, S.; Saha, N.; Rahman, M.S. Characterization of Groundwater Quality Using Water Evaluation Indices, Multivariate Statistics and Geostatistics in Central Bangladesh. Water Sci. 2016, 30, 19–40. [Google Scholar] [CrossRef]
- Memon, M.; Soomro, M.S.; Akhtar, M.S.; Memon, K.S. Drinking Water Quality Assessment in Southern Sindh (Pakistan). Environ. Monit. Assess. 2011, 177, 39–50. [Google Scholar] [CrossRef]
- Khan, S.; Shahnaz, M.; Jehan, N.; Rehman, S.; Shah, M.T.; Din, I. Drinking Water Quality and Human Health Risk in Charsadda District, Pakistan. J. Clean. Prod. 2013, 60, 93–101. [Google Scholar] [CrossRef]
- Azizullah, A.; Khattak, M.N.K.; Richter, P.; Häder, D.-P. Water Pollution in Pakistan and Its Impact on Public Health—A Review. Environ. Int. 2011, 37, 479–497. [Google Scholar] [CrossRef] [PubMed]
- Nabeela, F.; Azizullah, A.; Bibi, R.; Uzma, S.; Murad, W.; Shakir, S.K.; Ullah, W.; Qasim, M.; Häder, D.-P. Microbial Contamination of Drinking Water in Pakistan—A Review. Environ. Sci. Pollut. Res. 2014, 21, 13929–13942. [Google Scholar] [CrossRef] [PubMed]
- Ayaz, S.; Khan, S.; Khan, S.N.; Bibi, F.; Shamas, S.; Akhtar, M. Prevalence of Zoonotic Parasites in Drinking Water of Three Districts of Khyber Pakhtunkhwa Province, Pakistan. Pak. J. Life Soc. Sci. 2011, 9, 67–69. [Google Scholar]
- Abdel-Satar, A.M.; Ali, M.H.; Goher, M.E. Indices of Water Quality and Metal Pollution of Nile River, Egypt. Egypt. J. Aquat. Res. 2017, 43, 21–29. [Google Scholar] [CrossRef]
- Bhuiyan, M.A.H.; Rakib, M.A.; Dampare, S.B.; Ganyaglo, S.; Suzuki, S. Surface Water Quality Assessment in the Central Part of Bangladesh Using Multivariate Analysis. KSCE J. Civ. Eng. 2011, 15, 995–1003. [Google Scholar] [CrossRef]
- Chaurasia, A.K.; Pandey, H.K.; Tiwari, S.K.; Prakash, R.; Pandey, P.; Ram, A. Groundwater Quality Assessment Using Water Quality Index (WQI) in Parts of Varanasi District, Uttar Pradesh, India. J. Geol. Soc. India 2018, 92, 76–82. [Google Scholar] [CrossRef]
- Ewaid, S.H.; Abed, S.A. Water Quality Index for Al-Gharraf River, Southern Iraq. Egypt. J. Aquat. Res. 2017, 43, 117–122. [Google Scholar] [CrossRef]
- Krishna Kumar, S.; Logeshkumaran, A.; Magesh, N.S.; Godson, P.S.; Chandrasekar, N. Hydro-Geochemistry and Application of Water Quality Index (WQI) for Groundwater Quality Assessment, Anna Nagar, Part of Chennai City, Tamil Nadu, India. Appl. Water Sci. 2015, 5, 335–343. [Google Scholar] [CrossRef]
- Ponsadailakshmi, S.; Sankari, S.G.; Prasanna, S.M.; Madhurambal, G. Evaluation of Water Quality Suitability for Drinking Using Drinking Water Quality Index in Nagapattinam District, Tamil Nadu in Southern India. Groundw. Sustain. Dev. 2018, 6, 43–49. [Google Scholar] [CrossRef]
- Yousefi, M.; Saleh, H.N.; Mohammadi, A.A.; Mahvi, A.H.; Ghadrpoori, M.; Suleimani, H. Data on Water Quality Index for the Groundwater in Rural Area Neyshabur County, Razavi Province, Iran. Data Br. 2017, 15, 901–907. [Google Scholar] [CrossRef]
- De La Mora-Orozco, C.; Flores-Lopez, H.; Rubio-Arias, H.; Chavez-Duran, A.; Ochoa-Rivero, J. Developing a Water Quality Index (WQI) for an Irrigation Dam. Int. J. Environ. Res. Public Health 2017, 14, 439. [Google Scholar] [CrossRef] [PubMed]
- Misaghi, F.; Delgosha, F.; Razzaghmanesh, M.; Myers, B. Introducing a Water Quality Index for Assessing Water for Irrigation Purposes: A Case Study of the Ghezel Ozan River. Sci. Total Environ. 2017, 589, 107–116. [Google Scholar] [CrossRef] [PubMed]
- Effendi, H.; Wardiatno, Y. Water Quality Status of Ciambulawung River, Banten Province, Based on Pollution Index and NSF-WQI. Procedia Environ. Sci. 2015, 24, 228–237. [Google Scholar] [CrossRef]
- Cordoba, E.B.; Martinez, A.C.; Ferrer, E.V. Water Quality Indicators: Comparison of a Probabilistic Index and a General Quality Index. The Case of the Confederación Hidrográfica Del Júcar (Spain). Ecol. Indic. 2010, 10, 1049–1054. [Google Scholar] [CrossRef]
- Khosravi, R.; Eslami, H.; Almodaresi, S.A.; Heidari, M.; Fallahzadeh, R.A.; Taghavi, M.; Khodadadi, M.; Peirovi, R. Use of Geographic Information System and Water Quality Index to Assess Groundwater Quality for Drinking Purpose in Birjand City, Iran. Desalin Water Treat 2017, 67, 74–83. [Google Scholar] [CrossRef]
- Şener, Ş.; Şener, E.; Davraz, A. Evaluation of Water Quality Using Water Quality Index (WQI) Method and GIS in Aksu River (SW-Turkey). Sci. Total Environ. 2017, 584, 131–144. [Google Scholar] [CrossRef] [PubMed]
- Daud, M.K.; Nafees, M.; Ali, S.; Rizwan, M.; Bajwa, R.A.; Shakoor, M.B.; Arshad, M.U.; Chatha, S.A.S.; Deeba, F.; Murad, W. Drinking Water Quality Status and Contamination in Pakistan. BioMed Res. Int. 2017, 2017, 7908183. [Google Scholar] [CrossRef]
- Li, H.; Smith, C.D.; Wang, L.; Li, Z.; Xiong, C.; Zhang, R. Combining Spatial Analysis and a Drinking Water Quality Index to Evaluate Monitoring Data. Int. J. Environ. Res. Public Health 2019, 16, 357. [Google Scholar] [CrossRef]
- Dudley, R.W.; Hirsch, R.M.; Archfield, S.A.; Blum, A.G.; Renard, B. Low Streamflow Trends at Human-Impacted and Reference Basins in the United States. J. Hydrol. 2020, 580, 124254. [Google Scholar] [CrossRef]
- Webster, R.; Oliver, M.A. Geostatistics for Environmental Scientists; John Wiley & Sons: Hoboken, NJ, USA, 2007; ISBN 0470517263. [Google Scholar]
- Robinson, T.P.; Metternicht, G. Testing the Performance of Spatial Interpolation Techniques for Mapping Soil Properties. Comput. Electron. Agric. 2006, 50, 97–108. [Google Scholar] [CrossRef]
- Wu, J.; Norvell, W.A.; Welch, R.M. Kriging on Highly Skewed Data for DTPA-Extractable Soil Zn with Auxiliary Information for PH and Organic Carbon. Geoderma 2006, 134, 187–199. [Google Scholar] [CrossRef]
- Khan, A.R.; Rafique, M.; Rahman, S.U.; Basharat, M.; Shahzadi, C.; Ahmed, I. Geo-Spatial Analysis of Radon in Spring and Well Water Using Kriging Interpolation Method. Water Supply 2019, 19, 222–235. [Google Scholar] [CrossRef]
- Arslan, H. Spatial and Temporal Mapping of Groundwater Salinity Using Ordinary Kriging and Indicator Kriging: The Case of Bafra Plain, Turkey. Agric. Water Manag. 2012, 113, 57–63. [Google Scholar] [CrossRef]
- Johnson, C.D.; Nandi, A.; Joyner, T.A.; Luffman, I. Iron and Manganese in Groundwater: Using Kriging and GIS to Locate High Concentrations in Buncombe County, North Carolina. Groundwater 2018, 56, 87–95. [Google Scholar] [CrossRef] [PubMed]
- Liang, C.-P.; Chen, J.-S.; Chien, Y.-C.; Chen, C.-F. Spatial Analysis of the Risk to Human Health from Exposure to Arsenic Contaminated Groundwater: A Kriging Approach. Sci. Total Environ. 2018, 627, 1048–1057. [Google Scholar] [CrossRef] [PubMed]
- Mir, A.; Piri, J.; Kisi, O. Spatial Monitoring and Zoning Water Quality of Sistan River in the Wet and Dry Years Using GIS and Geostatistics. Comput. Electron. Agric. 2017, 135, 38–50. [Google Scholar] [CrossRef]
- Murphy, R.R.; Curriero, F.C.; Ball, W.P. Comparison of Spatial Interpolation Methods for Water Quality Evaluation in the Chesapeake Bay. J. Environ. Eng. 2010, 136, 160–171. [Google Scholar] [CrossRef]
- Sheikhy Narany, T.; Firuz Ramli, M.; Zaharin Aris, A.; Azmin Sulaiman, W.N.; Fakharian, K. Spatial Assessment of Groundwater Quality Monitoring Wells Using Indicator Kriging and Risk Mapping, Amol-Babol Plain, Iran. Water 2013, 6, 68–85. [Google Scholar] [CrossRef]
- Tiwari, K.; Goyal, R.; Sarkar, A. GIS-Based Spatial Distribution of Groundwater Quality and Regional Suitability Evaluation for Drinking Water. Environ. Process. 2017, 4, 645–662. [Google Scholar] [CrossRef]
- Horton, R.K. An Index Number System for Rating Water Quality. J. Water Pollut. Control Fed. 1965, 37, 300–305. [Google Scholar]
- Tyagi, S.; Sharma, B.; Singh, P.; Dobhal, R. Water Quality Assessment in Terms of Water Quality Index. Am. J. Water Resour. 2013, 1, 34–38. [Google Scholar] [CrossRef]
- Naz, I.; Ahmad, I.; Aslam, R.W.; Quddoos, A.; Yaseen, A. Integrated Assessment and Geostatistical Evaluation of Groundwater Quality through Water Quality Indices. Water 2024, 16, 63. [Google Scholar] [CrossRef]
- Sahu, P.; Sikdar, P.K. Hydrochemical Framework of the Aquifer in and around East Kolkata Wetlands, West Bengal, India. Environ. Geol. 2008, 55, 823–835. [Google Scholar] [CrossRef]
- Ketata, M.; Gueddari, M.; Bouhlila, R. Use of Geographical Information System and Water Quality Index to Assess Groundwater Quality in El Khairat Deep Aquifer (Enfidha, Central East Tunisia). Arab. J. Geosci. 2012, 5, 1379–1390. [Google Scholar] [CrossRef]
- Rabeiy, R.E. Assessment and Modeling of Groundwater Quality Using WQI and GIS in Upper Egypt Area. Environ. Sci. Pollut. Res. 2018, 25, 30808–30817. [Google Scholar] [CrossRef]
- Kawo, N.S.; Karuppannan, S. Groundwater Quality Assessment Using Water Quality Index and GIS Technique in Modjo River Basin, Central Ethiopia. J. Afr. Earth Sci. 2018, 147, 300–311. [Google Scholar] [CrossRef]
- Wong, Y.J.; Shimizu, Y.; He, K.; Nik Sulaiman, N.M. Comparison among Different ASEAN Water Quality Indices for the Assessment of the Spatial Variation of Surface Water Quality in the Selangor River Basin, Malaysia. Environ. Monit. Assess. 2020, 192, 644. [Google Scholar] [CrossRef] [PubMed]
- Wong, Y.J.; Shimizu, Y.; Kamiya, A.; Maneechot, L.; Bharambe, K.P.; Fong, C.S.; Nik Sulaiman, N.M. Application of Artificial Intelligence Methods for Monsoonal River Classification in Selangor River Basin, Malaysia. Environ. Monit. Assess. 2021, 193, 438. [Google Scholar] [CrossRef]
- Mahmood, K.; Rana, A.D.; Tariq, S.; Kanwal, S.; Ali, R.; Haidar, A. Groundwater Levels Susceptibility to Degradation in Lahore Metropolitan. Depression 2011, 150, 1–8. [Google Scholar]
- Vadde, K.K.; Wang, J.; Cao, L.; Yuan, T.; McCarthy, A.J.; Sekar, R. Assessment of Water Quality and Identification of Pollution Risk Locations in Tiaoxi River (Taihu Watershed), China. Water 2018, 10, 183. [Google Scholar] [CrossRef]
- El Baba, M.; Kayastha, P.; Huysmans, M.; De Smedt, F. Evaluation of the Groundwater Quality Using the Water Quality Index and Geostatistical Analysis in the Dier Al-Balah Governorate, Gaza Strip, Palestine. Water 2020, 12, 262. [Google Scholar] [CrossRef]
- Hussainzadeh, J.; Samani, S.; Mahaqi, A. Investigation of the Geochemical Evolution of Groundwater Resources in the Zanjan Plain, NW Iran. Environ. Earth Sci. 2023, 82, 123. [Google Scholar] [CrossRef]
- Palanisamy, M.; Krishnan, T.R.; Rahaman, A.S.; Jothiramalingam, K.; Thiyagarajan, I.; Kumar, S.P. Geochemical Characterisation and Geostatistical Evaluation of Groundwater Suitability: A Case Study in Perambalur District, Tamil Nadu, India. Environ. Sci. Pollut. Res. 2023, 30, 62653–62674. [Google Scholar] [CrossRef] [PubMed]
- Kiyani, V.; Esmaili, A.; Alijani, F.; Samani, S.; Vasić, L. Investigation of Drainage Structures in the Karst Aquifer System through Turbidity Anomaly, Hydrological, Geochemical and Stable Isotope Analysis (Kiyan Springs, Western Iran). Environ. Earth Sci. 2022, 81, 517. [Google Scholar] [CrossRef]
- Chen, J.; Huang, Q.; Lin, Y.; Fang, Y.; Qian, H.; Liu, R.; Ma, H. Hydrogeochemical Characteristics and Quality Assessment of Groundwater in an Irrigated Region, Northwest China. Water 2019, 11, 96. [Google Scholar] [CrossRef]
- Abbasnia, A.; Yousefi, N.; Mahvi, A.H.; Nabizadeh, R.; Radfard, M.; Yousefi, M.; Alimohammadi, M. Evaluation of Groundwater Quality Using Water Quality Index and Its Suitability for Assessing Water for Drinking and Irrigation Purposes: Case Study of Sistan and Baluchistan Province (Iran). Hum. Ecol. Risk Assess. Int. J. 2019, 25, 988–1005. [Google Scholar] [CrossRef]
- Abbasnia, A.; Radfard, M.; Mahvi, A.H.; Nabizadeh, R.; Yousefi, M.; Soleimani, H.; Alimohammadi, M. Groundwater Quality Assessment for Irrigation Purposes Based on Irrigation Water Quality Index and Its Zoning with GIS in the Villages of Chabahar, Sistan and Baluchistan, Iran. Data Br. 2018, 19, 623–631. [Google Scholar] [CrossRef]
- Ladson, A.R.; White, L.J.; Doolan, J.A.; Finlayson, B.L.; Hart, B.T.; Lake, P.S.; Tilleard, J.W. Development and Testing of an Index of Stream Condition for Waterway Management in Australia. Freshw. Biol. 1999, 41, 453–468. [Google Scholar] [CrossRef]
- Chatterjee, R.; Tarafder, G.; Paul, S. Groundwater Quality Assessment of Dhanbad District, Jharkhand, India. Bull. Eng. Geol. Environ. 2010, 69, 137–141. [Google Scholar] [CrossRef]
- Shabbir, R.; Ahmad, S.S. Use of Geographic Information System and Water Quality Index to Assess Groundwater Quality in Rawalpindi and Islamabad. Arab. J. Sci. Eng. 2015, 40, 2033–2047. [Google Scholar] [CrossRef]
- Farooqi, A.; Masuda, H.; Kusakabe, M.; Naseem, M.; Firdous, N. Distribution of Highly Arsenic and Fluoride Contaminated Groundwater from East Punjab, Pakistan, and the Controlling Role of Anthropogenic Pollutants in the Natural Hydrological Cycle. Geochem. J. 2007, 41, 213–234. [Google Scholar] [CrossRef]
- Malik, S.; Malik, S. Maternal Influence on Youth Radicalization–A Case Study of District Multan. J. Contemp. Stud. 2021, 10, 38–58. [Google Scholar]
- Zhou, G.; Li, W.; Zhou, X.; Tan, Y.; Lin, G.; Li, X.; Deng, R. An innovative echo detection system with STM32 gated and PMT adjustable gain for airborne LiDAR. Int. J. Remote Sens. 2021, 42, 9187–9211. [Google Scholar] [CrossRef]
- Water Sector Task Force. A Productive and Water-Secure Pakistan: Infrastructure, Institutions, Strategy. The Report of the Water Sector Task Force of the Friends of Democratic Pakistan; Water Sector Task Force: Islamabad, Pakistan, 2012; Available online: http://www.waterinfo.net.pk (accessed on 24 July 2023).
- Yasin, H.Q.; Breadsell, J.; Tahir, M.N. Climate-Water Governance: A Systematic Analysis of the Water Sector Resilience and Adaptation to Combat Climate Change in Pakistan. Water Policy 2021, 23, 1–35. [Google Scholar] [CrossRef]
- Adimalla, N.; Taloor, A.K. Hydrogeochemical Investigation of Groundwater Quality in the Hard Rock Terrain of South India Using Geographic Information System (GIS) and Groundwater Quality Index (GWQI) Techniques. Groundw. Sustain. Dev. 2020, 10, 100288. [Google Scholar] [CrossRef]
- Frenken, K. Irrigation in Southern and Eastern Asia in Figures: AQUASTAT Survey-2011. Water Rep. 2012, 37, 487. [Google Scholar]
- Zhou, G.; Deng, R.; Zhou, X.; Long, S.; Li, W.; Lin, G.; Li, X. Gaussian Inflection Point Selection for LiDAR Hidden Echo Signal Decomposition. IEEE Geosci. Remote Sens. Lett. 2021, 19, 6502705. [Google Scholar] [CrossRef]
- Zhou, G.; Zhang, R.; Huang, S. Generalized Buffering Algorithm. IEEE Access 2021, 9, 27140–27157. [Google Scholar] [CrossRef]
- Pesce, S.F.; Wunderlin, D.A. Use of Water Quality Indices to Verify the Impact of Córdoba City (Argentina) on Suquía River. Water Res. 2000, 34, 2915–2926. [Google Scholar] [CrossRef]
- Cude, C.G. Oregon Water Quality Index a Tool for Evaluating Water Quality Management Effectiveness. J. Am. Water Resour. Assoc. 2001, 37, 125–137. [Google Scholar] [CrossRef]
- Dunnette, D.A. A Geographically Variable Water Quality Index Used in Oregon. J. Water Pollut. Control Fed. 1979, 51, 53–61. [Google Scholar]
- Thi Minh Hanh, P.; Sthiannopkao, S.; The Ba, D.; Kim, K.-W. Development of Water Quality Indexes to Identify Pollutants in Vietnam’s Surface Water. J. Environ. Eng. 2011, 137, 273–283. [Google Scholar] [CrossRef]
- Juwana, I.; Muttil, N.; Perera, B.J.C. Indicator-Based Water Sustainability Assessment—A Review. Sci. Total Environ. 2012, 438, 357–371. [Google Scholar] [CrossRef]
- Malczewski, J. GIS-Based Land-Use Suitability Analysis: A Critical Overview. Prog. Plann. 2004, 62, 3–65. [Google Scholar] [CrossRef]
- Chow, T.E.; Sadler, R. The Consensus of Local Stakeholders and Outside Experts in Suitability Modeling for Future Camp Development. Landsc. Urban Plan. 2010, 94, 9–19. [Google Scholar] [CrossRef]
- Saaty, T.L. A Scaling Method for Priorities in Hierarchical Structures. J. Math. Psychol. 1977, 15, 234–281. [Google Scholar] [CrossRef]
- Ishizaka, A.; Labib, A. Analytic Hierarchy Process and Expert Choice: Benefits and Limitations. OR Insight 2009, 22, 201–220. [Google Scholar] [CrossRef]
- Saaty, R.W. The Analytic Hierarchy Process—What It Is and How It Is Used. Math. Model. 1987, 9, 161–176. [Google Scholar] [CrossRef]
- Pappaka, R.K.; Somagouni, S.G.; Chinthala, K.; Nakkala, A.B. Appraisal of groundwater quality for suitability of drinking and irrigation purposes of pandameru river basin, anantapur district, AP, India. Arab. J. Geosci. 2024, 17, 23. [Google Scholar] [CrossRef]
- Dong, Y.; Zhang, G.; Hong, W.-C.; Xu, Y. Consensus Models for AHP Group Decision Making under Row Geometric Mean Prioritization Method. Decis. Support Syst. 2010, 49, 281–289. [Google Scholar] [CrossRef]
- Sarkar, K.; Majumder, M. Application of AHP-Based Water Quality Index for Quality Monitoring of Peri-Urban Watershed. Environ. Dev. Sustain. 2021, 23, 1780–1798. [Google Scholar] [CrossRef]
- Karnena, M.K.; Saritha, V. Evaluation of Spatial Variability in Ground Water Quality Using Remote Sensing. Int. J. Recent Technol. Eng. 2019, 8, 4269–4278. [Google Scholar] [CrossRef]
- Haider, S.; Masood, M.U.; Rashid, M.; Alshehri, F. Simulation of the Potential Impacts of Projected Climate and Land Use Change on Runoff under CMIP6 Scenarios. Water 2023, 15, 3421. [Google Scholar] [CrossRef]
- Masood, M.U.; Haider, S.; Rashid, M.; Aldlemy, M.S.; Pande, C.B.; Đurin, B.; Homod, R.Z.; Alshehri, F.; Elkhrachy, I. Quantifying the Impacts of Climate and Land Cover Changes on the Hydrological Regime of a Complex Dam Catchment Area. Sustainability 2023, 15, 15223. [Google Scholar] [CrossRef]
- Shabahat, S.; Raza, A.; Haider, S.; Masood, M.U.; Rashid, M. Investigating the Groundwater Recharge Potential in the Upper Rechna Doab. In Proceedings of the 2nd National Conference on Sustainable Water Resources Management (SWRM-22), Lahore, Pakistan, 16 November 2022; Volume 8670. [Google Scholar]
- Hassan, S.; Masood, M.U.; Haider, S.; Anjum, M.N.; Hussain, F.; Ding, Y.; Shangguan, D.; Rashid, M.; Nadeem, M.U. Investigating the Effects of Climate and Land Use Changes on Rawal Dam Reservoir Operations and Hydrological Behavior. Water 2023, 15, 2246. [Google Scholar] [CrossRef]
- Nagra, M.; Masood, M.U.; Haider, S.; Rashid, M. Assessment of Spatiotemporal Droughts Through Machine Learning Algorithm Over Pakistan. In Proceedings of the 2nd National Conference on Sustainable Water Resources Management (SWRM-22), Lahore, Pakistan, 16 November 2022; Volume 8670. [Google Scholar]
- Masood, M.U.; Khan, N.M.; Haider, S.; Anjum, M.N.; Chen, X.; Gulakhmadov, A.; Iqbal, M.; Ali, Z.; Liu, T. Appraisal of Land Cover and Climate Change Impacts on Water Resources: A Case Study of Mohmand Dam Catchment, Pakistan. Water 2023, 15, 1313. [Google Scholar] [CrossRef]
- Haider, S.; Masood, M.U.; Rashid, M.; Ali, T.; Pande, C.B.; Alshehri, F.; Elkhrachy, I. Assessment of Rainwater Harvesting Potential for Urban Area under Climate and Land Use Changes Using Geo-Informatics Technology. Urban Clim. 2023, 52, 101721. [Google Scholar] [CrossRef]
- Cotruvo, J.A. 2017 WHO Guidelines for Drinking Water Quality: First Addendum to the Fourth Edition. J.-Am. Water Work. Assoc. 2017, 109, 44–51. [Google Scholar] [CrossRef]
- Balakrishnan, P.; Saleem, A.; Mallikarjun, N.D. Groundwater Quality Mapping Using Geographic Information System (GIS): A Case Study of Gulbarga City, Karnataka, India. Afr. J. Environ. Sci. Technol. 2011, 5, 1069–1084. [Google Scholar] [CrossRef]
- Chandel, R.K.T.S. Quality of Ground Water of Jaipur City, Rajasthan (India) and Its Suitability for Domestic and Irrigation Purpose. Appl. Ecol. Environ. Res. 2008, 6, 79–88. [Google Scholar]
- Gupta, P.; Vishwakarma, M.; Rawtani, P.M. Assessment of Water Quality Parameters of Kerwa Dam for Drinking Suitability. Int. J. Theor. Appl. Sci. 2009, 1, 53–55. [Google Scholar]
- Jameel, A.A.; Sirajudeen, J. Risk Assessment of Physico-Chemical Contaminants in Groundwater of Pettavaithalai Area, Tiruchirappalli, Tamilnadu–India. Environ. Monit. Assess. 2006, 123, 299–312. [Google Scholar] [CrossRef] [PubMed]
- Choudhary, R.; Rawtani, P.; Vishwakarma, M. Comparative Study of Drinking Water Quality Parameters of Three Manmade Reservoirs i.e. Kolar, Kaliasote and Kerwa Dam. Curr. World Environ. 2011, 6, 145–149. [Google Scholar] [CrossRef]
- Samadi-Darafshani, M.; Safavi, H.R.; Golmohammadi, M.H.; Rezaei, F. Assessment of the Management Scenarios for Groundwater Quality Remediation of a Nitrate-Contaminated Aquifer. Environ. Monit. Assess. 2021, 193, 190. [Google Scholar] [CrossRef] [PubMed]
- Hasan, M.; Shang, Y.; Akhter, G.; Jin, W. Evaluation of Groundwater Suitability for Drinking and Irrigation Purposes in Toba Tek Singh District, Pakistan. Irrig. Drain. Syst. Eng 2017, 6, 185. [Google Scholar]
- Sarda, P.; Sadgir, P. Assessment of Multi Parameters of Water Quality in Surface Water Bodies-a Review. Int. J. Res. Appl. Sci. Eng. Technol. 2015, 3, 331–336. [Google Scholar]
- National Research Council. Fluoride in Drinking Water: A Scientific Review of EPA’s Standards; The National Academies Press: Washington, DC, USA, 2006; 530p, ISBN 978-0-309-10128-8. [CrossRef]
- Karim, M.D.M. Arsenic in Groundwater and Health Problems in Bangladesh. Water Res. 2000, 34, 304–310. [Google Scholar] [CrossRef]
- Rasheed, H.; Jaleel, F.; Nisar, M.F. Analyzing the Status of Heavy Metals in Irrigation Water in Suburban Areas of Bahawalpur City, Pakistan. AEJAES 2014, 14, 732–738. [Google Scholar]
- Masood, N.; Batool, S.; Farooqi, A. Groundwater Pollution in Pakistan. In Global Groundwater; Elsevier: Amsterdam, The Netherlands, 2021; pp. 309–322. [Google Scholar]
- Soomro, Z.A.; Khokhar, D.M.I.A.; Hussain, W.; Hussain, M. Drinking Water Quality Challenges in Pakistan; Pakistan Council of Research in Water Resources: Lahore, Pakistan, 2011; pp. 17–28.
- Bibi, S.; Khan, R.L.; Nazir, R.; Khan, P.; Rehman, H.U.; Shakir, S.K.; Naz, S.; Waheed, M.A.; Jan, R. Heavy Metals Analysis in Drinking Water of Lakki Marwat District, KPK, Pakistan. World Appl. Sci. J. 2016, 34, 15–19. [Google Scholar]
- Shafeeque, M.; Sarwar, A.; Basit, A.; Mohamed, A.Z.; Rasheed, M.W.; Khan, M.U.; Buttar, N.A.; Saddique, N.; Asim, M.I.; Sabir, R.M. Quantifying the Impact of the Billion Tree Afforestation Project (BTAP) on the Water Yield and Sediment Load in the Tarbela Reservoir of Pakistan Using the SWAT Model. Land 2022, 11, 1650. [Google Scholar] [CrossRef]
- Gao, C.; Hao, M.; Chen, J.; Gu, C. Simulation and design of joint distribution of rainfall and tide level in Wuchengxiyu Region, China. Urban Clim. 2021, 40, 101005. [Google Scholar] [CrossRef]
- Xu, Z.; Li, X.; Li, J.; Xue, Y.; Jiang, S.; Liu, L.; Luo, Q.; Wu, K.; Zhang, N.; Feng, Y.; et al. Characteristics of Source Rocks and Genetic Origins of Natural Gas in Deep Formations, Gudian Depression, Songliao Basin, NE China. ACS Earth Space Chem. 2022, 6, 1750–1771. [Google Scholar] [CrossRef]
- Jat Baloch, M.Y.; Zhang, W.; Chai, J.; Li, S.; Alqurashi, M.; Rehman, G.; Tariq, A.; Talpur, S.A.; Iqbal, J.; Munir, M.; et al. Shallow Groundwater Quality Assessment and Its Suitability Analysis for Drinking and Irrigation Purposes. Water 2021, 13, 3361. [Google Scholar] [CrossRef]
- Anwar, M.S.; Chaudhry, N.A.; Tayyib, M. Qualitative Assessment of Bacteriological Quality and Chlorination Status of Drinking Water in Lahore. J. Coll. Physicians Surg. JCPSP 2004, 14, 157–160. [Google Scholar] [PubMed]
- Rasheed, H.; Altaf, F.; Anwaar, K.; Ashraf, M. Drinking Water Quality in Pakistan: Current Status and Challenges; Pakistan Council of Research in Water Resources (PCRWR): Islamabad, Pakistan, 2021; p. 141.
- Ayesha, A. Pollution of Water Bodies: Challenges and Strategies. Environ. PIAIP-NESPAK Lahore 2012, 11, 1087–1098. [Google Scholar]
- Odonkor, S.T.; Ampofo, J.K. Escherichia Coli as an Indicator of Bacteriological Quality of Water: An Overview. Microbiol. Res. 2013, 4, e2. [Google Scholar] [CrossRef]
- Ahmed, A.; Mustafa, U.; Samad, G. Economic Appraisal of Rooftop Rainwater Harvesting Technology in Bagh and Battagram Districts Pakistan; Pakistan Institute of Development Economics: Islamabad, Pakistan, 2012. [Google Scholar]
- Islam-Ul-Haq, C.W.A.; Ahmed, C.N. Multifaceted Ground Water Quality and Recharge Mechanism Issues in a Mega-City (Rawalpindi, Pakistan), and Mitigation Strategies. In Proceedings of the 6th International IAHS Ground Water Quality Conference, Fremantle, Australia, 2–7 December 2007. [Google Scholar]
- Zaman, M.; Shahid, S.A.; Heng, L.; Zaman, M.; Shahid, S.A.; Heng, L. Irrigation Water Quality. In Guideline for Salinity Assessment, Mitigation and Adaptation Using Nuclear and Related Techniques; Springer: Berlin/Heidelberg, Germany, 2018; pp. 113–131. [Google Scholar]
- Balachandar, D.; Sundararaj, P.; Murthy, R.K.; Kumaraswamy, K. An Investigation of Groundwater Quality and Its Suitability to Irrigated Agriculture in Coimbatore District, Tamil Nadu, India-A GIS Approach. Int. J. Environ. Sci. 2010, 1, 176. [Google Scholar]
- Noor, R.; Maqsood, A.; Baig, A.; Pande, C.B.; Zahra, S.M.; Saad, A.; Anwar, M.; Singh, S.K. A comprehensive review on water pollution, South Asia Region: Pakistan. Urban Clim. 2023, 48, 101413. [Google Scholar] [CrossRef]
- Khan, F.; Ali, S.; Mayer, C.; Ullah, H.; Muhammad, S. Climate Change and Spatio-Temporal Trend Analysis of Climate Extremes in the Homogeneous Climatic Zones of Pakistan during 1962–2019. PLoS ONE 2022, 17, e0271626. [Google Scholar] [CrossRef]
- Ashraf, M.; Nasir, M.; Khan, M.B.; Umar, F.; Garh, M. Characterization of Ground Water Quality for Irrigation in Tehsil and District Layyah, Punjab Pakistan. Nat. Sci. 2013, 11, 128–132. [Google Scholar]
- Sadashivaiah, C.; Ramakrishnaiah, C.R.; Ranganna, G. Hydrochemical Analysis and Evaluation of Groundwater Quality in Tumkur Taluk, Karnataka State, India. Int. J. Environ. Res. Public Health 2008, 5, 158–164. [Google Scholar] [CrossRef] [PubMed]
- Kavurmacı, M.; Karakuş, C.B. Evaluation of Irrigation Water Quality by Data Envelopment Analysis and Analytic Hierarchy Process-Based Water Quality Indices: The Case of Aksaray City, Turkey. Water Air Soil Pollut. 2020, 231, 55. [Google Scholar] [CrossRef]
- Rashid, M.; Haider, S.; Masood, M.U.; Pande, C.B.; Tolche, A.D.; Alshehri, F.; Costache, R.; Elkhrachy, I. Sustainable Water Management for Small Farmers with Center-Pivot Irrigation: A Hydraulic and Structural Design Perspective. Sustainability 2023, 15, 16390. [Google Scholar] [CrossRef]
- Mazhar, F. Population Growth & Distribution Pattern in Punjab, Pakistan (1998–2017): A Geospatial Approach. Int. J. Innov. Sci. Res. Technol. 2018, 3, 508–511. [Google Scholar]
- Khan, M. Impact of Urbanization on Water Resources of Pakistan: A Review. NUST J. Eng. Sci. 2019, 12, 1–8. [Google Scholar] [CrossRef]
- Basharat, M. Groundwater Environment in Lahore, Pakistan. In Groundwater Environment in Asian Cities; Elsevier: Amsterdam, The Netherlands, 2016; pp. 147–184. [Google Scholar]
- Varade, A.M.; Yenkie, R.O.; Shende, R.R.; Golekar, R.B.; Wagh, V.M.; Khandare, H.W. Assessment of Water Quality for the Groundwater Resources of Urbanized Part of the Nagpur District, Maharashtra (India). Am. J. Water Resour. 2018, 6, 89–111. [Google Scholar]
- Butt, I.; Iqbal, A. Solid Waste Management and Associated Environmental Issues in Lahore. Pak. Geogr. Rev. 2007, 62, 45–50. [Google Scholar]
- Akhtar, N.; Ishak, M.I.S.; Ahmad, M.I.; Umar, K.; Md Yusuff, M.S.; Anees, M.T.; Qadir, A.; Ali Almanasir, Y.K. Modification of the Water Quality Index (WQI) Process for Simple Calculation Using the Multi-Criteria Decision-Making (MCDM) Method: A Review. Water 2021, 13, 905. [Google Scholar] [CrossRef]
- Al-Rekabi, W.S.; Qiang, H.; Qiang, W.W. Improvements in Wastewater Treatment Technology. Pak. J. Nutr. 2007, 6, 104–110. [Google Scholar]
- Zhang, Z.; Han, Y.; Xiao, F.-S.; Qiu, S.; Zhu, L.; Wang, R.; Yu, Y.; Zhang, Z.; Zou, B.; Wang, Y. Mesoporous Aluminosilicates with Ordered Hexagonal Structure, Strong Acidity, and Extraordinary Hydrothermal Stability at High Temperatures. J. Am. Chem. Soc. 2001, 123, 5014–5021. [Google Scholar] [CrossRef]
- Monteiro, S.; Rente, D.; Cunha, M.V.; Marques, T.A.; Cardoso, E.; Vilaça, J.; Coelho, N.; Brôco, N.; Carvalho, M.; Santos, R. Discrimination and Surveillance of Infectious Severe Acute Respiratory Syndrome Coronavirus 2 in Wastewater Using Cell Culture and RT-QPCR. Sci. Total Environ. 2022, 815, 152914. [Google Scholar] [CrossRef] [PubMed]
- Alshehri, F.; Sultan, M.; Karki, S.; Alwagdani, E.; Alsefry, S.; Alharbi, H.; Sahour, H.; Sturchio, N. Mapping the distribution of shallow groundwater occurrences using Remote Sensing-based statistical modeling over southwest Saudi Arabia. Remote Sens. 2020, 12, 1361. [Google Scholar] [CrossRef]
- Valero, F.; Barceló, A.; Arbós, R. Electrodialysis Technology: Theory and Applications. Desalination Trends Technol. 2011, 28, 3–20. [Google Scholar]
- Seenivasagan, R.; Ayyasamy, P.M.; Kasimani, R.; Karthika, A.; Rajakumar, S.; Babalola, O.O. Nitrate Removal from Ground Water Through Lab Scale Bioreactor Using Dissimilatory Nitrate Reducer Bacillus Weihenstephanensis (DS45). In Bioremediation and Sustainable Technologies for Cleaner Environment; Springer: Berlin/Heidelberg, Germany, 2017; pp. 79–94. [Google Scholar]
- Xu, J.; Lan, W.; Ren, C.; Zhou, X.; Wang, S.; Yuan, J. Modeling of coupled transfer of water, heat and solute in saline loess considering sodium sulfate crystallization. Cold Reg. Sci. Technol. 2021, 189, 103335. [Google Scholar] [CrossRef]
- Yin, L.; Wang, L.; Ge, L.; Tian, J.; Yin, Z.; Liu, M.; Zheng, W. Study on the Thermospheric Density Distribution Pattern during Geomagnetic Activity. Appl. Sci. 2023, 13, 5564. [Google Scholar] [CrossRef]
- Zhu, X.; Xu, Z.; Liu, Z.; Liu, M.; Yin, Z.; Yin, L.; Zheng, W. Impact of dam construction on precipitation: A regional perspective. Mar. Freshw. Res. 2022, 74, 877–890. [Google Scholar] [CrossRef]
- Yin, L.; Wang, L.; Li, T.; Lu, S.; Yin, Z.; Liu, X.; Li, X.; Zheng, W. U-Net-STN: A Novel End-to-End Lake Boundary Prediction Model. Land 2023, 12, 1602. [Google Scholar] [CrossRef]
- Yin, L.; Wang, L.; Keim, B.D.; Konsoer, K.; Yin, Z.; Liu, M.; Zheng, W. Spatial and wavelet analysis of precipitation and river discharge during operation of the Three Gorges Dam, China. Ecol. Indic. 2023, 154, 110837. [Google Scholar] [CrossRef]
- Alshehri, F.; Almadani, S.; El-Sorogy, A.S.; Alwaqdani, E.; Alfaifi, H.J.; Alharbi, T. Influence of seawater intrusion and heavy metals contamination on groundwater quality, Red Sea coast, Saudi Arabia. Marine Pollut. Bull. 2021, 165, 112094. [Google Scholar] [CrossRef]
- Qiu, D.; Zhu, G.; Bhat, M.A.; Wang, L.; Liu, Y.; Sang, L.; Lin, X.; Zhang, W.; Sun, N. Water use strategy of nitraria tangutorum shrubs in ecological water delivery area of the lower inland river: Based on stable isotope data. J. Hydrol. 2023, 624, 129918. [Google Scholar] [CrossRef]
- Liu, Z.; Xu, J.; Liu, M.; Yin, Z.; Liu, X.; Yin, L.; Zheng, W. Remote sensing and geostatistics in urban water-resource monitoring: A review. Mar. Freshw. Res. 2023, 74, 747–765. [Google Scholar] [CrossRef]
- Zhang, S.; Bai, X.; Zhao, C.; Tan, Q.; Luo, G.; Wang, J.; Li, Q.; Wu, L.; Chen, F.; Li, C.; et al. Global CO2 Consumption by Silicate Rock Chemical Weathering: Its Past and Future. Earth’s Future 2021, 9, e1938E–e2020E. [Google Scholar] [CrossRef]
- Luo, J.; Niu, F.; Lin, Z.; Liu, M.; Yin, G.; Gao, Z. Abrupt increase in thermokarst lakes on the central Tibetan Plateau over the last 50 years. Catena 2022, 217, 106497. [Google Scholar] [CrossRef]
- Li, W.; Wang, C.; Liu, H.; Wang, W.; Sun, R.; Li, M.; Shi, Y.; Zhu, D.; Du, W.; Ma, L.; et al. Fine root biomass and morphology in a temperate forest are influenced more by canopy water addition than by canopy nitrogen addition. Front. Ecol. Evol. 2023, 11, 1132248. [Google Scholar] [CrossRef]
- Zhu, G.; Liu, Y.; Shi, P.; Jia, W.; Zhou, J.; Liu, Y.; Ma, X.; Pan, H.; Zhang, Y.; Zhang, Z.; et al. Stable water isotope monitoring network of different water bodies in Shiyang River basin, a typical arid river in China. Earth Syst. Sci. Data 2022, 14, 3773–3789. [Google Scholar] [CrossRef]
- Li, Q.; Lu, L.; Zhao, Q.; Hu, S. Impact of Inorganic Solutes’ Release in Groundwater during Oil Shale In Situ Exploitation. Water 2023, 15, 172. [Google Scholar] [CrossRef]
- Rui, S.; Zhou, Z.; Jostad, H.P.; Wang, L.; Guo, Z. Numerical prediction of potential 3-dimensional seabed trench profiles considering complex motions of mooring line. Appl. Ocean. Res. 2023, 139, 103704. [Google Scholar] [CrossRef]
- Sun, S.; Liu, H.; Zhang, J.; Wang, W.; Xu, P.; Zhud, X.; Wang, Y.; Wan, S. Application of a novel coagulant in reservoir water treatment in Qingdao. Desalination Water Treat. 2023, 284, 49–60. [Google Scholar] [CrossRef]


| Divisions | Districts | Latitude | Longitude |
|---|---|---|---|
| Rawalpindi | Jhelum | 32°56′25.9728″ | 73°43′39.4716″ |
| Attock | 33°46′4.9836″ | 72°21′38.5308″ | |
| Chakwal | 32°55′51.9564″ | 72°51′18.3096″ | |
| Lahore | Sheikhupura | 31°42′59.9796″ | 73°59′6.0828″ |
| Nankana Sahib | 31°26′51″ | 73°41′49.99″ | |
| Faisalabad | Chiniot | 31°43′12″ | 72°58′44″ |
| Toba Tek Singh | 30°58′23.34″ | 72°28′27.74″ | |
| Jhang | 31°16′17.54″ | 72°19′42.31″ | |
| Sargodha | Khushab | 32°17′43.93″ | 72°20′55.94″ |
| Mianwali | 32°34′26″ | 71°31′35″ | |
| Bhakkar | 31°37′30.90″ | 71°03′56.66″ | |
| Gujranwala | Gujrat | 34°17′0″ | 72°10′0″ |
| Hafizabad | 32°4′18.1092″ | 73°41′8.6280″ | |
| M.D Bahu Uddin | 32°35′0.2″ | 73°29′3.52″ | |
| Narowal | 32°12′60.00″ | 74°56′59.99″ | |
| Sialkot | 32°29′33.65″ | 74°31′52.82″ |
| Scale | Relative Importance | Scale | Relative Importance |
|---|---|---|---|
| 1 | Equally important | 1 | Equally important |
| 3 | Moderately important | 1/3 | Moderately less important |
| 5 | Strongly important | 1/5 | Weakly important |
| 7 | Very strongly important | 1/7 | Very weekly important |
| 9 | Extremely important | 1/9 | Extremely important |
| 2, 4, 6, 8 | Intermediate values | 1 | Equally important |
| P1 | P2 | PN | ||
|---|---|---|---|---|
| P1 | P1/p1 | P1/p2 | … | P1/pN |
| P2 | P2/p1 | P2/pN | … | P2/pN |
| … | … | … | … | |
| PN | PN/p1 | PN/p2 | … | PN/pN |
| Parameters | WHO | Percentage of Samples Exceeding the Limit | |||||
|---|---|---|---|---|---|---|---|
| Standards | Punjab | Lahore | Rawalpindi | Gujranwala | Sargodha | Faisalabad | |
| Turbidity | 1 NTU | 5 | 1 | 5 | 3 | 1 | 3 |
| PH | 6.5–8.5 | 9 | 5 | 7 | 9 | 2 | 8 |
| TDS | 1000 mg/L | 3 | 2 | 2 | 0 | 8 | 3 |
| T Hardness | 120–180 mg/L | 3 | 4 | 2 | 0 | 12 | 0 |
| HCO3 | 500 mg/L | 1 | 0 | 0 | 0 | 6 | 1 |
| Ca | 75 mg/L | 2 | 9 | 1 | 1 | 2 | 0 |
| Mg | 50 mg/L | 2 | 0 | 9 | 0 | 4 | 2 |
| Cl | 250 mg/L | 6 | 0 | 0 | 0 | 7 | 1 |
| F | 1.5 mg/L | 4 | 3 | 7 | 0 | 3 | 0 |
| Iron | 0.3 mg/L | 7 | 8 | 8 | 3 | 9 | 3 |
| NO3 | 50 mg/L | 6 | 3 | 6 | 0 | 10 | 5 |
| NO2 | 3 mg/L | 1 | 0 | 0 | 0 | 0 | 3 |
| As | 10 mg/L | 9 | 25 | 1 | 2 | 5 | 0 |
| T. Coliform | 0/100 mL | 27 | 31 | 27 | 14 | 24 | 19 |
| E. coli | 0/100 mL | 19 | 10 | 21 | 6 | 20 | 16 |
| F. Coliform | 0/100 mL | 18 | 20 | 17 | 9 | 7 | 9 |
| Criteria | Alternatives | Indicator | AHP Weight | |
|---|---|---|---|---|
| Positive | Negative | |||
| Drinking | Taste | 0.010 | ||
| Odor | √ | 0.010 | ||
| Color | √ | 0.010 | ||
| Turbidity | √ | 0.029 | ||
| pH | √ | 0.040 | ||
| TDS | √ | 0.057 | ||
| Total hardness | √ | 0.050 | ||
| HCO3 | √ | 0.053 | ||
| Ca | √ | 0.049 | ||
| Mg | √ | 0.046 | ||
| Cl | √ | 0.041 | ||
| F | √ | 0.045 | ||
| Iron | √ | 0.052 | ||
| NO3 | √ | 0.035 | ||
| NO2 | √ | 0.039 | ||
| As | √ | 0.147 | ||
| T. Coliform | √ | 0.073 | ||
| Fecal coliform | √ | 0.099 | ||
| E. coli | √ | 0.026 | ||
| Water levels | √ | 0.074 | ||
| Precipitation | √ | 0.015 | ||
| Irrigation | SAR | √ | 0.258 | |
| EC | √ | 0.570 | ||
| RSC | √ | 0.171 | ||
| Index | Category Rank | Interpretation |
|---|---|---|
| 0–50 | Excellent | Can be safely used. |
| 50–100 | Good | Generally safe to use |
| 100–120 | Medium | Can be used for drinking |
| 120–150 | Bad | Proper treatment is required before use |
| >150 | Very Bad | Unsuitable |
| Index Value | Category Rank | Interpretation |
|---|---|---|
| 0–0.1 | Excellent | Can be safely used |
| 0.1–0.2 | Good | Generally safe to use as irrigation water |
| 0.20–0.30 | Permissible | Suitable for irrigation of plants with salt tolerance |
| >0.3 | Unsuitable | Not suitable for use as IW |
| Process | Parameter | Percentage | Source |
|---|---|---|---|
| Primary treatment | TDS | 40–60% | Al-Rekabi et al. [133] Zhou et al. [134] |
| Bacterial loadings | 40–60% | ||
| Secondary treatment | TDS | 65–80% | Al-Rekabi et al., Zhou et al., Monteiro et al. [133,134,135] |
| Bacterial loadings | 80–90% | ||
| Hardness | 45–55% | ||
| Tertiary treatment | Arsenic | >95% | Awual et al. [136] Valero et al. [137] |
| Nitrate | 75–86% | Seenivasagan et al. [138] |
| Areas | Scenarios | ||||||
|---|---|---|---|---|---|---|---|
| Primary Treatment | Secondary Treatment | Tertiary Treatment | |||||
| S1 | S2 | S3 | S1 | S2 | S1 | S2 | |
| Lahore | 121.77 | 121.43 | 120.94 | 120.99 | 120.43 | 120.13 | 119.96 |
| Sargodha | 122.86 | 122.75 | 121.72 | 121.48 | 120.99 | 120.50 | 119.12 |
| Gujranwala | 106.23 | 106.19 | 105.14 | 106.08 | 106.04 | 105.73 | 105.30 |
| Rawalpindi | 121.05 | 120.94 | 120.80 | 120.70 | 120.70 | 119.99 | 119.92 |
| Faisalabad | 113.80 | 113.64 | 112.32 | 113.70 | 112.88 | 113.00 | 112.19 |
Disclaimer/Publisher’s Note: The statements, opinions and data contained in all publications are solely those of the individual author(s) and contributor(s) and not of MDPI and/or the editor(s). MDPI and/or the editor(s) disclaim responsibility for any injury to people or property resulting from any ideas, methods, instructions or products referred to in the content. |
© 2023 by the authors. Licensee MDPI, Basel, Switzerland. This article is an open access article distributed under the terms and conditions of the Creative Commons Attribution (CC BY) license (https://creativecommons.org/licenses/by/4.0/).
Share and Cite
Masood, M.U.; Rashid, M.; Haider, S.; Naz, I.; Pande, C.B.; Heddam, S.; Alshehri, F.; Elkhrachy, I.; Ahsan, A.; Sammen, S.S. RETRACTED: Exploring Groundwater Quality Assessment: A Geostatistical and Integrated Water Quality Indices Perspective. Water 2024, 16, 138. https://doi.org/10.3390/w16010138
Masood MU, Rashid M, Haider S, Naz I, Pande CB, Heddam S, Alshehri F, Elkhrachy I, Ahsan A, Sammen SS. RETRACTED: Exploring Groundwater Quality Assessment: A Geostatistical and Integrated Water Quality Indices Perspective. Water. 2024; 16(1):138. https://doi.org/10.3390/w16010138
Chicago/Turabian StyleMasood, Muhammad Umer, Muhammad Rashid, Saif Haider, Iram Naz, Chaitanya B. Pande, Salim Heddam, Fahad Alshehri, Ismail Elkhrachy, Amimul Ahsan, and Saad Sh. Sammen. 2024. "RETRACTED: Exploring Groundwater Quality Assessment: A Geostatistical and Integrated Water Quality Indices Perspective" Water 16, no. 1: 138. https://doi.org/10.3390/w16010138
APA StyleMasood, M. U., Rashid, M., Haider, S., Naz, I., Pande, C. B., Heddam, S., Alshehri, F., Elkhrachy, I., Ahsan, A., & Sammen, S. S. (2024). RETRACTED: Exploring Groundwater Quality Assessment: A Geostatistical and Integrated Water Quality Indices Perspective. Water, 16(1), 138. https://doi.org/10.3390/w16010138