Article

Nitrogen and Phosphorus Pollution Discharge and Water Quality Evaluation in a Small Basin of the Upper Reaches of Lijiang River

1
Guangxi Key Laboratory of Environmental Pollution Control Theory and Technology, Guilin University of Technology, Guilin 541004, China
2
Collaborative Innovation Center for Water Pollution Control and Water Security in Karst Region, Guilin University of Technology, Guilin 541004, China
3
Guilin Hydrology Center, Guilin 541004, China
*
Author to whom correspondence should be addressed.
Water 2024, 16(1), 104; https://doi.org/10.3390/w16010104
Submission received: 11 November 2023 / Revised: 21 December 2023 / Accepted: 24 December 2023 / Published: 27 December 2023

Abstract

:
The Lijiang River Basin is a humid, subtropical, karst landform in China and is listed as a World Heritage Site. However, with the rapid development of urbanization and tourism activities in recent years, it faces increasingly severe non-point source pollution. To understand the temporal and spatial variations in nitrogen and phosphorus pollution discharge and the changes in river water quality, the Jingui Small Basin, in the upper reaches of the Lijiang River, was chosen as a representative system. Changes in nitrogen and phosphorus concentrations were continuously monitored in the main river channel and the river water quality was evaluated using the comprehensive water quality identification index method. The results indicated that there were obvious seasonal changes in nitrogen and phosphorus discharge loads in the basin. Both nitrogen and phosphorus discharge loads were higher in the crop-growing season than in the non-growing season. No significant difference in nitrogen and phosphorus discharge load between different scales was found, and the scale was not the key factor affecting the nitrogen and phosphorus discharge load of Jingui River. As the river flowed from the initial water source to the outlet of the basin, water quality was characterized by the spatial pattern of the upper reaches > the middle reaches > the lower reaches. Except for the water quality at the outlet of the basin in November and December, which reached Class V, the comprehensive water quality of each sub-basin reached the target water quality of the water function zoning from May to December. The elucidation of the nitrogen and phosphorus pollution discharge patterns in the Jingui River and the changes in water quality provide a reference for the control and management of agricultural non-point source pollution in the Lijiang River Basin.

1. Introduction

Water pollution caused by non-point source pollution has become a major environmental problem with socio-economic development [1,2]. Nitrogen and phosphorus discharge are the primary non-point source pollutants of agricultural production in China [3,4,5]. Crop fields, poultry farms, and domestic sewage at urban–rural junctions contribute to nitrogen- and phosphorus-driven eutrophication in surface waters, greatly exceeding point source pollution from urban domestic sewage and industry [6,7]. Non-point source pollution is typified by a wide distribution area that is highly random and unstable, and therefore, the research and treatment of non-point source pollution are quite challenging [8,9].
The Lijiang River Basin is a typical subtropical karst landform and a World Heritage Site. Environmental changes have recently attracted much attention in the research community. With the rapid development of industry, agriculture, and tourism in recent decades, water quality in the Lijiang River has become increasingly compromised [10,11,12]. Factors such as agricultural economic development and planting structure adjustment have led to a continuous increase in the use of chemical fertilizers and pesticides. The surplus chemical fertilizers and pesticide residues have been transferred to the Lijiang River through its tributaries, resulting in the deterioration of local water quality [13]. Research has found that nitrogen and phosphorus have gradually become the main pollutants in the Lijiang River [14,15]. Therefore, it is necessary to study both the status quo and changes to rural water environmental pollution to propose comprehensive remediation measures.
Tributaries flowing through different land use types carry pollutants into the main channel of the Lijiang River and have an important negative effect on river water quality [16]. The highest concentration of pollutants was found in the middle reaches, and the overall water quality was higher in the upper reaches than in the middle and lower reaches. Some evidence showed that fertilizer runoff from cultivated land was the main pollutant source in small basins, and the magnitude of rainfall intensity and rainfall amount impacted the generated pollution load [17]. Other evidence showed that rural residential areas were the main sources of pollution in the Lijiang River, and the changes in water temperature during wet and dry seasons would likely affect the proportion of various forms of nitrogen in total inorganic nitrogen [18]. Furthermore, analysis of the dynamic changes in nitrate in the surface water body during the dry season indicated that the nitrate was from mixed sources, and included soil organic nitrogen, human and animal manure, and sewage discharge [19]. While these studies analyzed non-point source pollution, complex underlying surface conditions such as topographic features, ditches and wetlands, soil environment, and land use type complicate pollutant migration and diffusion. Therefore, a clear understanding of the temporal and spatial variation and scale characteristics of water pollution in the Lijiang River Basin remains to be uncovered.
To address this deficit, we selected a representative tributary (the Jingui River) in the Qingshitan Irrigation District (in the upper reaches of the Lijiang River) to assess the spatial and temporal variations and characteristics of pollution discharge load and concentrations. In situ, experiments were conducted to measure nitrogen and phosphorus concentrations and runoff drainage for different water channel sections in the upper, middle, and lower reaches. The changes in river water quality were analyzed to provide a scientific basis for the prevention and control of agricultural non-point source pollution in the Lijiang River Basin.

2. Materials and Methods

2.1. Overview of the Study Area

The Jingui River is located in Miaoling Township, Lingui District, Guilin City, Guangxi Zhuang Autonomous Region (110°6′–110°13′ E, 25°17′–25°22′ N). It is a secondary tributary of the Lijiang River, with a basin area of 2798 hm2, located 146–418 m above sea level (Figure 1). The Jingui River Basin enjoys a typical subtropical monsoon climate with an average annual rainfall of 1860 mm and an average annual evaporation of 1300 mm. The sunshine duration is short in winter and long in summer, and the average annual temperature is 20 °C. The Qingshitan Reservoir in the upper reaches of the Lijiang River replenishes the Jingui River through the Xigan Canal every year from April to October, at a stable replenishment rate of 0.5 m3/s. From November to March, the water flow is considerably reduced as water replenishment stops. During these months, the primary source of water to the Jingui River is rainfall runoff (Figure 2).
As a typical semi-artificial ecosystem, the Jingui River Basin is representative of many tributaries of the Lijiang River. The agroecological structure in the region is stable. Land use is mixed/agricultural, and includes cultivated land, orchard, woodland, and natural pasture. The cultivated land is dominated by rice paddy fields; mid-season rice is cultivated from May to September. Before the seedlings are planted, the farmers apply compound fertilizer or farmyard manure to the field and irrigate the water to carry it out to the paddy field. The main fertilizers used in the farmland are urea (46% nitrogen) and compound fertilizers (15% nitrogen, phosphorus, and potassium). Before planting, basal fertilizers are applied at a rate of 225–375 Kg/hm2. Afterwards, topdressing is performed 1–2 times, each time applying urea and compound fertilizer at a rate of 225–562.5 Kg/hm2. Pesticides and fertilizers applied to cultivated land, rural aquatic and poultry farming, and domestic sewage are the main sources of pollutants.

2.2. Sample Layout and Data Collection

Sub-basin division of the Jingui River Basin was carried out using the SWAT model [20,21]. The Digital Elevation Model (DEM, resolution 30 m) was derived from the ASTER-GDEM data of the Geospatial Data Cloud Platform of the Chinese Academy of Sciences Computer Network Information Center (http://www.gscloud.cn, accessed on 6 November 2023). Google Earth combined with the DEM data was used to determine the actual location of the river network.
The Jingui River Basin was divided into 11 sub-basins (Figure 1) with the SWAT model. The first sub-basin is the source sub-basin and is connected to the Qingshitan Reservoir. The outlet of the end sub-basin is connected with a primary tributary of the Lijiang River. The control area of each sub-basin and the main land use types along the river are listed in Table 1. In each sub-basin, the locations with hydraulic connections were selected as sampling sections. Nitrogen and phosphorus concentrations were monitored in these sections from May to December 2016, including the crop-growing season and non-growing season. The Tianhua section is located below the water supplement outlet from the Xigan Canal and reflects the initial water quality background of the river. The outlet section is located near the end of the river, reflecting the discharge status of the entire river basin. Water sampling was conducted across the complete crop-growing season, and samples were taken every 15–30 days.
After collection, water samples were stored in the laboratory at 4 °C, and pollutants were measured within 24 h. The total nitrogen (TN) content was determined by potassium sulfate digestion UV spectrophotometry, ammonia nitrogen (NH3-N) was determined by Nessler’s reagent spectrophotometry, and total phosphorus (TP) was determined by ammonium moly date spectrophotometry. The flow rate at the monitoring sections was measured using an LJD-10A-type portable flow meter; and then converted into flow data according to the cross-sectional area of the river. River water quality assessment was established based on the comprehensive water quality identification index method.

2.3. Calculation of Nitrogen and Phosphorus Discharge Load

The calculation of nitrogen and phosphorus monthly discharge at each monitoring point along the river was calculated as follows:
W = i = 1 n C d i × Q d i × 10 3 S
where W is the nitrogen or phosphorus discharge load in the control area of each monitoring section, kg/hm2; Cdi is the monthly average nitrogen and phosphorus concentration of the monitoring section, mg/L; Qdi is the monthly average flow of the monitoring section, m3; i and n are the serial number of the day and the number of days in the month, respectively; and S is the control area of each monitoring section, hm2.
We selected four representative sampling sections in the upper, middle, and lower reaches of the river to analyze the nitrogen and phosphorus discharge at different scales in the Jingui River Basin. The Qingmei section is located at the outlet of the source sub-basin (control area 397.4 hm2) and reflects the pollutant discharge characteristics of the first sub-basin. The Yutang section is located at the inlet of the third sub-basin (control area 745.0 hm2) and reflects the pollutant discharge characteristics of the upper reach sub-basins. The Guishan section is located at the inlet of the ninth sub-basin (control area 1252.6 hm2) and indicates the pollutant discharge characteristics of the upper and middle reaches. The water outlet of the main river channel is located at the end of the eleventh sub-basin (control area 2127.7 hm2) and reflects the pollutant discharge of the entire Jingui River Basin.

2.4. Water Quality Evaluation

Based on the Comprehensive Water Quality Identification Index of various indicators, the water quality status was evaluated, and the determination of categories (Class I: 0 ≤ X1.X2 ≤ 2.0; Class II: 2.0 < X1.X2 ≤ 3.0; Class III: 3.0 < X1.X2 ≤ 4.0; Class IV: 4.0 < X1.X2 ≤ 5.0; Class V: 5.0 < X1.X2 ≤ 6.0; Below Class V but not black odor: 6.0 < X1.X2 ≤ 7.0; Below Class V and black odor: X1.X2 > 7.0) is proposed by Xu [22]. The calculation formula of the comprehensive evaluation index (Iqw) is as follows:
Iqw = X1.X2 X3 X4
X1.X2 = 1/m∑(P1′ + P2′ + ⋯ + Pm′)
where X1 is the overall comprehensive water quality category of the river; X2 is the position of the comprehensive water quality in the change range of X1. X1.X2 is obtained from calculation; X3 and X4 are obtained from the comparison of results. X3 is the number of single indicators among the water quality indicators used to evaluate comprehensive water quality that is worse to the target of the water environment function zone. According to the pollution degree of the comprehensive water quality, X4 is the comparison result between the category of comprehensive water quality and the water function zone. m is the number of single water quality indicators used to evaluate the comprehensive water quality. P1′, P2′, and Pm′ are the univariate index of water quality of the 1st, 2nd and mth water quality factor, respectively, and represent the integer and the first figure after the decimal point of the corresponding single-factor water quality identification index. The calculation method of X1.X2, the single-factor water quality identification index, is shown in reference [23].

3. Results and Discussion

3.1. Temporal Variation in Nitrogen and Phosphorus Concentrations

Figure 3 shows the temporal variation in nitrogen and phosphorus concentrations at each monitoring section. From May to October, the overall trend of total nitrogen concentration in the Jingui River decreased, although nitrogen emissions increased during the crop-growing season. The reason is that there was a high water supply through the Xigan Canal and natural rainfall. As the river’s runoff increased, the capacity of water dilution and purification became stronger [24]. From November to December, the total nitrogen concentration increased, mainly due to the cessation of water supply from the artificial canal and a decrease in natural rainfall, resulting in a decrease in the water volume of the basin with fewer dilution pollutants easily aggregating [25]. The changes in ammonia-nitrogen concentration generally follow the same trend as total nitrogen concentration, with higher concentrations during the dry season compared to the wet season The average NH3-N concentration ranges from 0.22 to 0.26 mg/L. The total phosphorus concentration was higher in June, August, and December than in other months. The increase in total phosphorus concentration in June and August came down to topdressing at different stages during the swamp rice-growing season. A large amount of fertilization and a small amount of potassium dihydrogen phosphate are needed in the important period of rice transition from the heading stage to maturity stage [26]. The reason for the increase in total phosphorus concentration in December was the decline in water volume with poor fluidity.

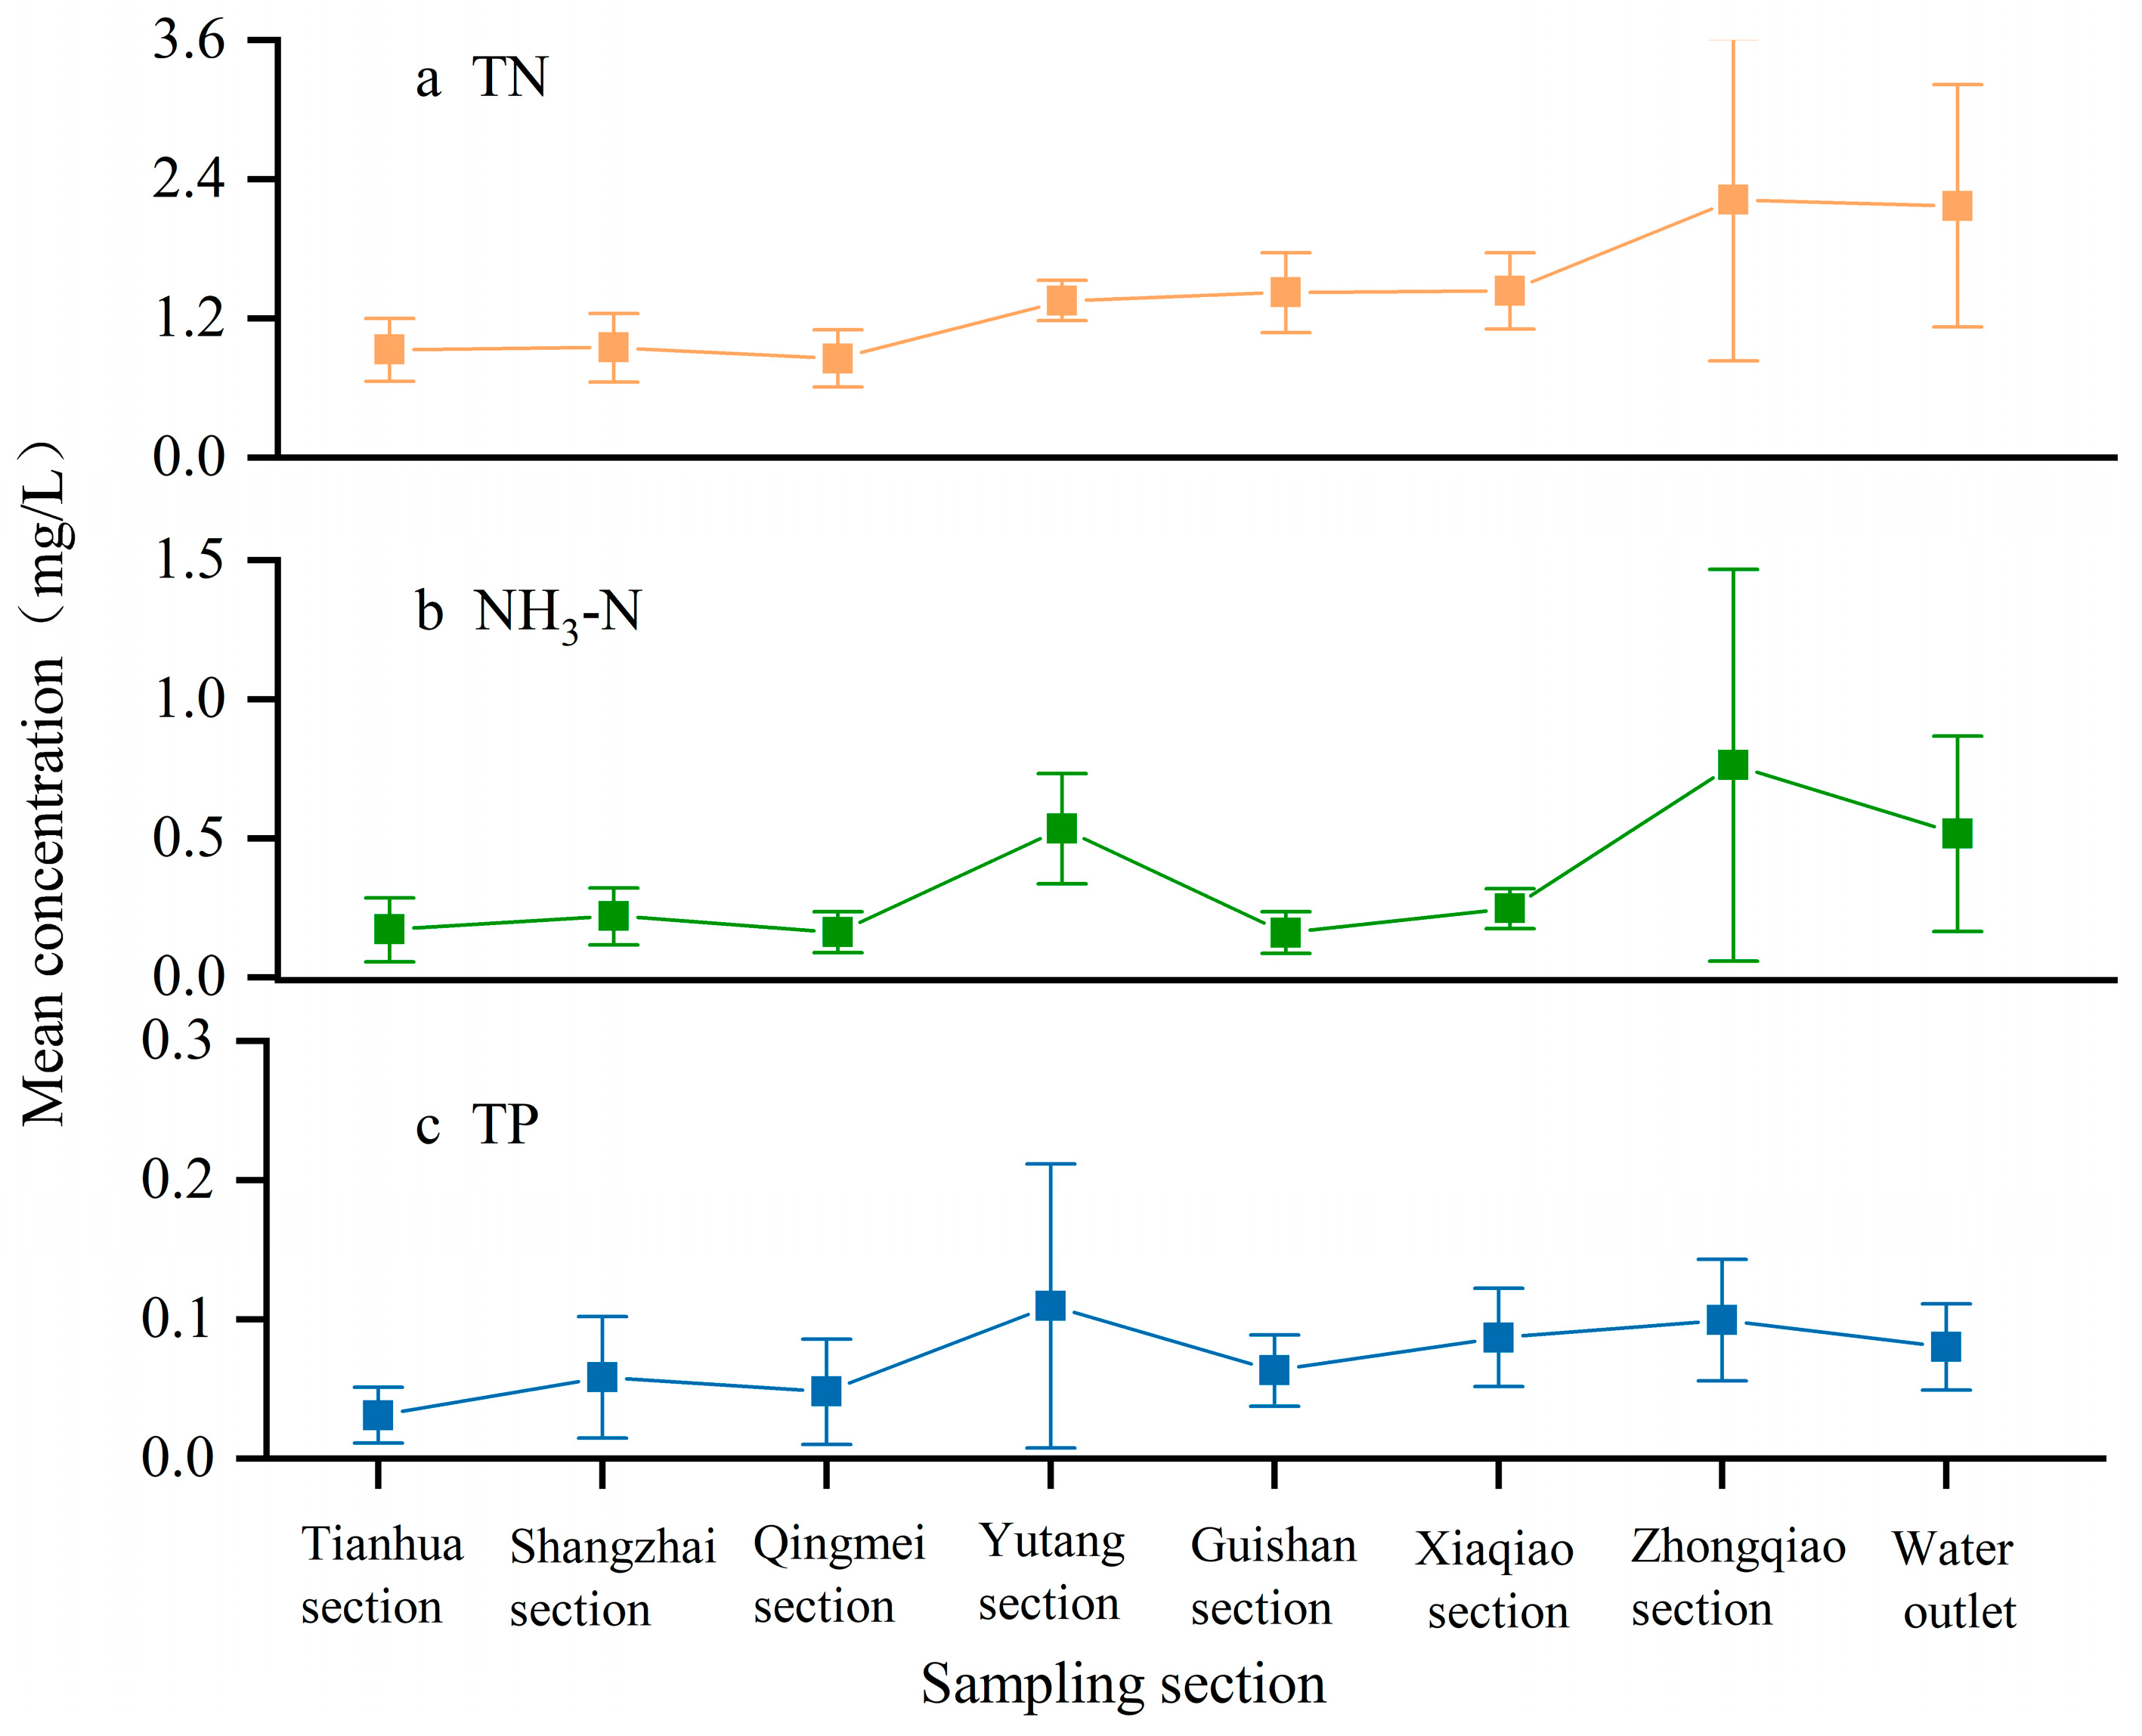
3.2. Changes in Nitrogen and Phosphorus Concentrations along the River Course

Figure 4 demonstrates the variation in nitrogen and phosphorus concentrations along the river course. From the initial water source to the end basin outlet, the concentration of pollutants increased substantially. The average concentrations of TN, NH3-N, and TP increased by 1.24 mg/L, 0.35 mg/L, and 0.05 mg/L, respectively, during the entire study period. There was a relatively small amount of nitrogen and phosphorus pollutants in the upper reaches of the Jingui River with high water quality. After large tributary junctions, the concentration of river water pollutants tended to increase rapidly, and the water quality dropped considerably. For example, in the Yutang section, after the upper reach tributary junction, the concentrations of TN, NH3-N, and TP in the mainstream channel increased by 0.50 mg/L, 0.37 mg/L, and 0.06 mg/L, respectively. Crop planting and aquaculture in the second sub-basin led to the increase in nitrogen and phosphorus concentrations. In the Zhongqiao section, when the two lower reach tributaries were joined, the concentrations of TN and NH3-N in the river water increased, increasing by 0.79 mg/L and 0.52 mg/L, respectively. However, the concentration of TP remained fairly constant, only increasing by 0.01 mg/L. On the two tributaries’ lower reaches, farmland is mainly distributed, and the loss of phosphorus in the cultivation process is much smaller than the loss of nitrogen [27]. The higher concentrations of pollutants in tributaries than in trunk streams indicates that the main sources of pollutants are excessive use of fertilizer in many small watersheds scattered across the countryside. Overall, the trend of nitrogen and phosphorus concentrations along the mainstem was generally elevated due to agricultural and animal husbandry activities from nearby villages and towns. This result is consistent with other studies [28,29]. For the sake of environmental protection, more attention should be paid to rural areas farther from the river confluence.

3.3. Temporal Variation in Nitrogen and Phosphorus Discharge Loads

Figure 5 demonstrates the temporal variation in nitrogen and phosphorus discharge load for typical monitoring sections. Large seasonal fluctuations were observed for nitrogen and phosphorus discharge loads. During the crop-growing season (May–September), the nitrogen and phosphorus discharge loads for the study area were higher than those in the non-growing season (October–December). In the area of agricultural production activities, the discharge of pollutants in rivers has obvious seasonal differences, which is consistent with the results of Steinhoff-Wrześniewska et al. [30]. At the outlet of the upper reaches (Yutang section), the monthly discharge loads of TN, NH3-N, and TP from May to September were 145.3%, 97.3%, and 193.5% higher, respectively, than those from October to December. At the outlet of the middle reaches, the monthly discharge loads of TN, NH3-N, and TP from May to September were 112.5%, 43.4%, and 180.0% higher, respectively, than those from October to December. At the outlet of the lower reaches, the monthly discharge loads of TN, NH3-N, and TP from May to September were 28.1%, 28.0%, and 14.8% higher, respectively, than those from October to December. Fertilizer and pesticide residues flowed into the Jingui River from tributaries with soil erosion and surface runoff caused by heavy rainfall during the crop-growing season [31,32]. During the non-growing season, the nitrogen and phosphorus discharge loads decreased due to the reduction in the use of fertilizers [33]. But the pollution discharge exhibited an increase in December in the Yutang section, which may be related to the wastewater operation of the aquaculture industry. The seasonal differences of the nitrogen and phosphorus discharge loads were largest in the upper reaches of the river, and smallest in the lower reaches of the river. This seasonal change was closely related to the control area of each monitoring section. The larger the control area, the lower the seasonal difference in the pollutant discharge load, consistent with the research results of Cui Yuanlai et al. [34]. During the crop-growing season, the TP discharge load at each monitoring section increased obviously in June and particularly August and was consistent with the temporal variation trend of TP concentration controlled by fertilizer topdressing stages.

3.4. Spatial Characteristics of Nitrogen and Phosphorus Discharge Loads

In order to study the scale characteristics of nitrogen and phosphorus discharge loads, we compared the monthly nitrogen and phosphorus discharge loads in different control areas (all sub-basin areas above the corresponding monitoring section). Figure 6 shows the nitrogen and phosphorus discharge loads among different scales. Compared to the upper reach outlet of the Jingui River, although the TN discharge load of the lower reach outlet decreased by 10.88%, and the TP discharge load decreased by 29.24%, there was no significant difference in TN and TP discharge loads between the four control areas. This indicates that, while the different land use patterns in the study area affect TN and TP discharge, there was essentially no difference in the total nitrogen and phosphorus discharge pressure for the river sections. The scale was not the key factor affecting the TN and TP discharge loads in the Jingui River. But some scholars found that as the spatial scale of the basin increases, the pollutant discharge load is reduced. A larger basin area compared to a smaller basin area has more foothills and plains, providing a larger sedimentation space for pollutants, reducing the erosion rate of pollutants, and thus reducing the nitrogen and phosphorus discharge load [35,36]. The reason for the differences in research results compared to others may be due to the distribution of plains in the study area, which is mostly located in farmland, cultivated land, and residential areas. Not only does it not provide sufficient settlement space for pollutants, but it will also increase pollutant discharge. This is similar to the results of Chen Manyu et al. [37], when the proportion of paddy fields, which are the main source of pollutants, increases with the increase in scale. The pollutant discharge load will not decrease with the increase in scale.
The NH3-N discharge load increased by 12.56% at the upper reach outlet versus the lower reach outlet. The NH3-N discharge load in the Yutang section was significantly higher than that at other monitoring sections, indicating that the NH3-N discharge from the second sub-basin increased. The ammonia nitrogen discharge load in the Yutang section control area is significantly different from that in the other three control areas. The reason is that there is a fish pond at the upper reach water outlet, and the fish pond sewage and sediment release a large amount of ammonia nitrogen through microbial action [38]. This change was affected by the difference in sources and composition of the pollutants in different regions.

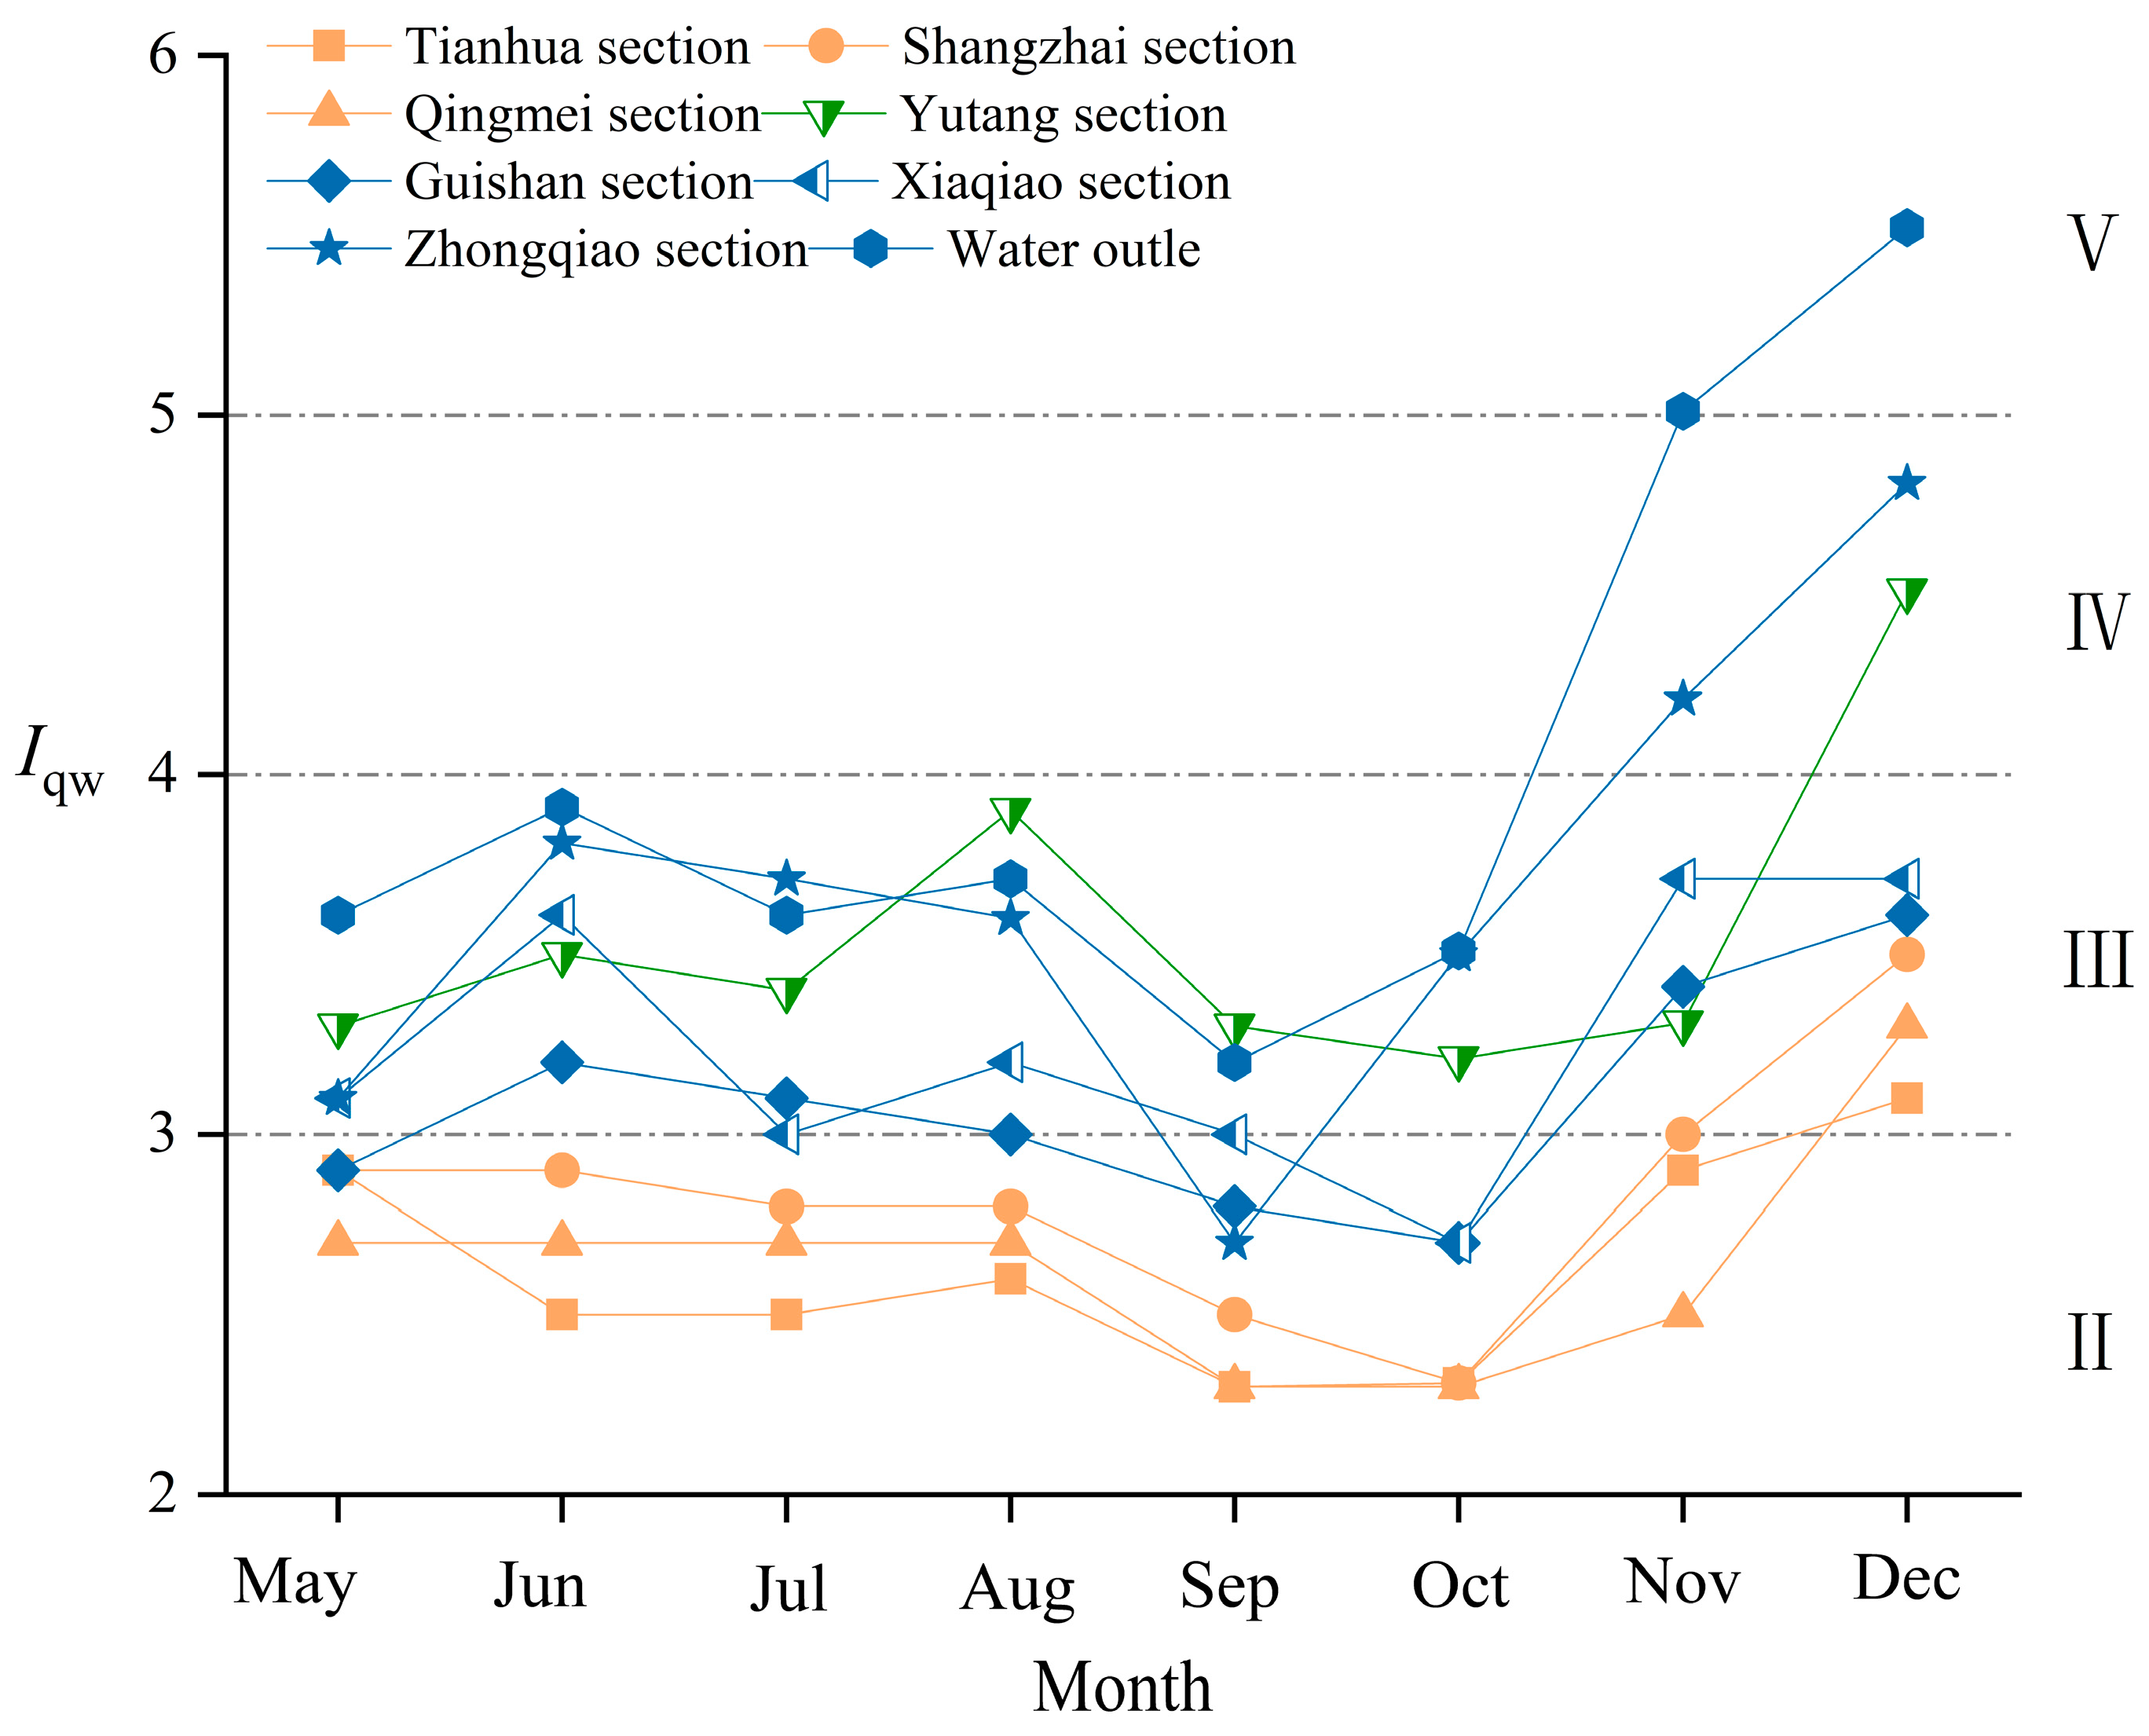
3.5. Changes in Comprehensive River Water Quality

The comprehensive water quality identification indices are shown in Figure 7. According to China’s current surface water environmental quality standards and the definition of water environmental function zoning, the water quality of Jingui River basin requires level IV. Except for November and December, when the water quality at the basin outlet reached class V, the comprehensive water quality of other monitoring sections in each period reached between class II and class IV. Except for the basin outlet, the comprehensive water quality of each sub-basin from May to December reached the target water quality of water function zoning.
The comprehensive water quality during the crop-growing season was higher than that of the non-growing season, due to more rainfall and artificial replenishment in the crop-growing season than in the non-growing season. Water quality is positively correlated with rainfall and runoff volume [39]. The Xigan canal stopped water replenishment during the non-growing season, leading to reduced water volume in the river. Although the use of chemical fertilizers had been dropping, the pollutant concentration was not improved. In space, the water quality was characterized by the upper reaches > the middle reaches > the lower reaches. The rivers in the middle and lower reaches, where farmland and residential areas are mainly located, generally exhibit such spatial distribution characteristics of water quality [40,41]. With the increase in flow distance in the downstream reaches of the river, pollutants continued to accumulate from the river bank, and the water quality of the drainage outlet of the river basin deteriorated. In particular, the middle reaches and the lower reaches flow through scattered settlements and irrigated rice paddies and orchards. which is consistent with the research results of Orzepowski et al. [42]. In mixed agricultural and residential areas, water quality is affected by both agricultural activities and unregulated sewage discharges by residents, exacerbating water pollution.

4. Conclusions

This study investigated nitrogen and phosphorus concentrations in different sections and sub-basin outlets of the Jingui River (a secondary tributary of the Lijiang River) and analyzed the characteristics of pollutant discharge and water quality. The results are summarized by the following conclusions.
There were obvious seasonal changes in nitrogen and phosphorus discharge loads in the basin. Both nitrogen and phosphorus discharge loads were higher in the crop-growing season than in the non-growing season. With the cessation of canal water replenishment and the reduction in rainfall, the water self-purification capacity weakened, the concentration of nitrogen and phosphorus in the river water increased, and the water quality decreased. There was no significant difference in nitrogen and phosphorus discharge load between different scales, indicating that scale was not a key factor influencing TN and TP discharge loads in the Jingui River. As the river flowed from the initial water source to the outlet of the basin, nitrogen and phosphorus concentrations gradually increased, and water quality was characterized by the spatial pattern of the upper reaches > the middle reaches > the lower reaches. Compared with the initial water source, the concentrations of TN, NH3-N, and TP at the outlet of the end basin increased by 1.24 mg/L, 0.35 mg/L, and 0.05 mg/L.
Except for the water quality at the outlet of the basin in November and December, which reached Class V, the comprehensive water quality of each sub-basin reached the target water quality of the water function zoning from May to December.

Author Contributions

Investigation, L.M.; methodology, L.M. and J.Y.; Provision of hydrological data information, J.M.; Data collation and analysis, J.Y.; Preparation of writing materials, J.Y.; Writing review and supervision, S.Z. and K.B.; Project management and access to funds, J.D. All authors have read and agreed to the published version of the manuscript.

Funding

This study was supported by the National Natural Science Foundation of China (Grant No. 51979046) and the Guangxi Key Research and Development Program Project (Gui Ke AB22035075).

Data Availability Statement

Data are contained within the article.

Acknowledgments

The authors wish to thank the reviewers for their constructive comments.

Conflicts of Interest

The authors declare no conflicts of interest.

References

  1. Loague, K.; Corwin, D.L.; Ellsworth, A.T.R. Feature: The challenge of predicting nonpoint source pollution. Environ. Sci. Technol. 1998, 32, 130–133. [Google Scholar] [CrossRef] [PubMed]
  2. Liu, R.M.; Xu, F.; Zhang, P.P.; Yu, W.W.; Men, C. Identifying non-point source critical source areas based on multi-factors at a basin scale with SWAT. J. Hydrol. 2016, 533, 379–388. [Google Scholar] [CrossRef]
  3. Liang, L.; Wang, J.; Yan, Y.C. Evaluating nitrogen management of farm systems in the steep-mountainous KARST region. Am.-Eurasian J. Sustain. Agric. 2008, 2, 180–186. [Google Scholar]
  4. Ongley, E.D.; Zhang, X.L.; Tao, Y. Current status of agricultural and rural non-point source Pollution assessment in China. Environ. Pollut. 2010, 158, 1159–1168. [Google Scholar] [CrossRef] [PubMed]
  5. Xu, J.; Yin, W.; Ai, L.; Xin, X.; Shi, Z. Spatiotemporal patterns of non-point source nitrogen loss in an agricultural catchment. Water Sci. Eng. 2016, 9, 125–133. [Google Scholar] [CrossRef]
  6. Wang, X.; Hao, F.H.; Cheng, H.G.; Yang, S.T.; Zhang, X.; Bu, Q.S. Estimating non-point source pollutant loads for the large-scale basin of the Yangtze River in China. Environ. Earth Sci. 2011, 63, 1079–1092. [Google Scholar] [CrossRef]
  7. Yu, F.; Shi, W.M. Non-point Source Pollution Research in China and Aboard Based on Bibliometrics. Chin. Agric. Sci. Bull. 2014, 30, 242–248. (In Chinese) [Google Scholar]
  8. Nikolaidis, N.P.; Heng, H.; Semagin, R.; Clausen, J.C. Non-linear response of a mixed land use watershed to nitrogen loading. Agric. Ecosyst. Environ. 1998, 67, 251–265. [Google Scholar] [CrossRef]
  9. Liu, R.M.; Zhang, P.P.; Wang, X.J.; Chen, Y.X.; Shen, Z.Y. Assessment of effects of best management practices on agricultural non-point source pollution in Xiangxi River watershed. Agric. Water Manag. 2013, 117, 9–18. [Google Scholar] [CrossRef]
  10. Cheng, G.W.; Wang, D.Q. The water problems and control countermeasures of Lijiang River. Carsologica Sin. 1998, 4, 351–356. (In Chinese) [Google Scholar]
  11. Ye, G.Z.; Liu, J. Water environmental capacity of Guilin section of Lijiang River. Water Resour. Prot. 2003, 9, 10–12. (In Chinese) [Google Scholar]
  12. Xu, Z.F.; Li, J.C.; Mo, D.Q.; Li, W.W.; Qiu, M.D.; Huang, L.F.; Liu, S.L.; Lu, Q.L. Study on the present state of rural water pollution in Li River Valley and comprehensive treatment. Environ. Sci. Technol. 2010, s2, 644–646. (In Chinese) [Google Scholar]
  13. Xue, B.M.; Wang, Y.H.; Zhang, D.; Zhang, J.L.; Leng, B.; Huang, W.Y.; Chen, Z.H. Concentration, distribution and sources of polycyclic aromatic hydrocarbons (PAHs) in surface sediments from Lijiang River, South China. Bull. Environ. Contam. Toxicol. 2013, 90, 446–450. [Google Scholar] [CrossRef] [PubMed]
  14. Zhang, L.H.; Dai, J.F.; Mo, L.X.; Su, Y.J.; Zeng, H.H. Effects of different underlying conditions on nitrogen and phosphorus pollution load in small watershed of Lijiang River. Water Sav. Irrig. 2018, 2, 66–70. (In Chinese) [Google Scholar]
  15. Zhang, L.H. Non-point source pollution in the small watershed of Jingui River in the upper reaches of Lijiang River. Master’s Thesis, Guilin University of Technology, Guilin, China, 2018. (In Chinese). [Google Scholar]
  16. Lin, P.; Chen, Y.D.; Xia, Y. Types and causes of water pollution under different land use types in Lijiang River Basin. J. Guilin Univ. Technol. 2016, 36, 539–544. (In Chinese) [Google Scholar]
  17. Yang, L.Y.; Xia, Y. Analysis and reduction strategies of non-point source pollution in small watershed of Lijiang tributaries. J. Guilin Univ. Technol. 2017, 37, 177–181. (In Chinese) [Google Scholar]
  18. Shen, H.Y.; Jiang, G.H.; Guo, F.; Guo, X.J. Distribution characteristics and influence factors of the ammonia, nitrite and nitrate in the Lijiang River, Guilin City. Carsologica Sin. 2015, 34, 369–374. (In Chinese) [Google Scholar]
  19. Miao, Y.; Zhang, C.; Xiao, Q.; Zhao, H.J.; Li, C.X. Dynamic variations and sources of nitrate during dry season in the Lijiang River. Environ. Sci. 2018, 39, 1589–1597. (In Chinese) [Google Scholar]
  20. Grizzetti, B.; Bouraoui, F.; Granlund, K.; Rekolainen, S.; Bidoglio, G. Modelling diffuse emission and retention of nutrients in the Vantaanjoki watershed (Finland) using the SWAT model. Ecol. Model. 2003, 169, 25–38. [Google Scholar] [CrossRef]
  21. Jayakrishnan, R.; Srinivasan, R.; Santhi, C.; Arnold, J.G. Advances in the application of the swat model for water resources management. Hydrol. Process. 2005, 19, 749–762. [Google Scholar] [CrossRef]
  22. Xu, Z.X. Comprehensive water quality identification index for environmental quality assessment of surface water. J. Tongji Univ. (Nat. Sci. Ed.) 2005, 33, 482–488. (In Chinese) [Google Scholar]
  23. Xu, Z.X. Single factor water quality identification index for environmental quality assessment of surface water. J. Tongji Univ. (Nat. Sci. Ed.) 2005, 33, 321–325. (In Chinese) [Google Scholar]
  24. Bhatt, H.A.; Karanjekar, V.R.; Altouqi, S.; Sattler, M.L.; Hossain, S.; Chen, V.P. Estimating landfill leachate BOD and COD based on rainfall, ambient temperature, and waste composition: Exploration of a MARS statistical approach. Environ. Technol. Innov. 2017, 8, 1–16. [Google Scholar] [CrossRef]
  25. Wu, W.N. Practical application analysis of high-quality and high-yield rice cultivation techniques. Agric. Technol. 2018, 38, 108–109. (In Chinese) [Google Scholar]
  26. Bora, M.; Goswami, C.D. Water quality assessment in terms of water quality index (WQI): Case study of the Kolong River, Assam, India. Appl. Water Sci. 2017, 7, 3125–3135. [Google Scholar] [CrossRef]
  27. Guo, M.; Zhang, T.; Li, J.; Li, Z.; Xu, G.; Yang, R. Reducing Nitrogen and Phosphorus Losses from Different Crop Types in the Water Source Area of the Danjiang River, China. Int. J. Environ. Res. Public Health 2019, 16, 3442. [Google Scholar] [CrossRef] [PubMed]
  28. Zhou, Z.M.; Chen, C.S.; Liu, K.H.; Li, J.; Chen, M.L.; Jiang, Y.; Yu, F.M. Phytoplankton community and water quality in Guilin City section of Lijiang River in summer, China. Ecol. Environ. Sci. 2014, 4, 649–656. (In Chinese) [Google Scholar]
  29. Yu, X.X.; Yang, G.H.; Liang, T. Effects of land use on nitrogen runoff loss process in Xitiaoxi watershed. Agric. Environ. Prot. 2002, 21, 424–427. (In Chinese) [Google Scholar]
  30. Steinhoff-Wrześniewska, A.; Strzelczyk, M.; Helis, M.; Paszkiewicz-Jasińska, A.; Gruss, Ł.; Pulikowski, K.; Skorulski, W. Identification of catchment areas with nitrogen pollution risk for lowland river water quality. Arch. Environ. Prot. 2022, 48, 53–64. [Google Scholar] [CrossRef]
  31. Ren, C.X.; Peng, D.M.; Shi, X.Y.; Yang, S.; Zhang, P.; Zhang, J.B. Seasonal Total Nitrogen and Phosphorus Variation, Speciation, and Composition in the Maowei Sea Affected by Riverine Flux Input, South China Sea. Water 2022, 14, 2584. [Google Scholar] [CrossRef]
  32. Han, X.; Pan, B.Z.; Chen, Y. Characteristics of water environment and spatial-temporal distribution of nitrogen and phosphorus loads in the Yellow River. Environ. Sci. 2021, 42, 5786–5795. (In Chinese) [Google Scholar]
  33. Liu, F.P. Analysis of the impact of paddy field water and fertilizer management on the emission of agricultural non-point source pollution at different scales. Jiangxi Agric. J. 2016, 28, 105–109. [Google Scholar] [CrossRef]
  34. Cui, Y.L. Research and Application of Comprehensive Technology of Water Saving, Yield Increasing, High Efficiency and Pollution Reduction in Rice Irrigation Area. Master’s Thesis, Wuhan University, Hubei, China, 2010. (In Chinese). [Google Scholar]
  35. Aoubid, S.H.; Opp, C. Nitrogen and Phosphorus Discharge Loads Assessment Using the SWAT Model: A Case Study of the Shatt Al-Arab River Basin. Appl. Sci. 2023, 13, 8376. [Google Scholar] [CrossRef]
  36. Mutema, M.; Chaplot, V.; Jewitt, G.; Chivenge, P.; Bloschl, G. Annual water, sediment, nutrient, and organic carbon fluxes in river basins: A global meta-analysis as a function of scale. Water Resour. Res. 2015, 51, 8949–8972. [Google Scholar] [CrossRef]
  37. Chen, M.Y.; Cui, Y.L.; Zheng, S.Z.; Yang, B.L.; Zhao, S.J. Scale effect of agricultural non-point source pollution based on SWAT model. Rural. Water Conserv. Hydropower China 2016, 187–191+196. (In Chinese) [Google Scholar]
  38. Cheng, Y.; Chen, J.J.; Xie, X.; Zhang, X.Y.; Liu, K.; Dai, J.; Zhang, C. Research progress on nitrogen and phosphorus pollution characteristics and migration and transformation of mulberry fish pond subsystem. Guangdong Agric. Sci. 2021, 48, 74–87. (In Chinese) [Google Scholar]
  39. Zhang, X.D.; Han, X.; Sun, C.S. Effects of land use on water quality at different spatial and temporal scales in Wuding River and Yanhe River Basin. Environ. Sci. 2023, 54, 29–34. [Google Scholar] [CrossRef]
  40. Tang, L.; Hu, X.H. Spatial and temporal distribution characteristics of water quality in Tanjiang River Basin and its correlation with land use. Earth Environ. 2018, 46, 364–372. (In Chinese) [Google Scholar] [CrossRef]
  41. Gossweiler, B.; Wesström, I.; Messing, I.; Romero, A.M.; Joel, A. Spatial and Temporal Variations in Water Quality and Land Use in a Semi-Arid Catchment in Bolivia. Water 2019, 11, 2227. [Google Scholar] [CrossRef]
  42. Orzepowski, W.; Paruch, A.; Pulikowski, K.; Kowalczyk, T.; Pokładek, R. Quantitative and qualitative assessment of agricultural water resources under variable climatic conditions of Silesian Lowlands (Southwest Poland). Agric. Water Manag. 2014, 138, 45–54. [Google Scholar] [CrossRef]
Figure 1. Geographic information and monitoring section in the Jingui River Basin.
Water 16 00104 g001
Figure 2. Variations in rainfall and water flux in the Jingui River Basin during the experimental period.
Water 16 00104 g002
Figure 3. Temporal variations in the concentration of nitrogen and phosphorus for each monitoring section.
Water 16 00104 g003
Figure 4. Spatial variations in the concentration of nitrogen and phosphorus along the Jingui River.
Water 16 00104 g004
Figure 5. Temporal variations in nitrogen and phosphorus discharge loads for typical monitoring section.
Water 16 00104 g005
Figure 6. Comparison of monthly nitrogen and phosphorus discharge loads among different scales. Data with the same superscripts denote no significant difference (p > 0.05), and data with different superscripts denote significant differences.
Water 16 00104 g006
Figure 7. Comprehensive Water Quality Identification Index of Jingui River.
Water 16 00104 g007
Table 1. Drainage area and land use type for each sub-basin in the Jingui River Basin.
ReachSub-BasinSampling SectionLat & LongLand Use Type
Upper reaches1stTianhua section110.185 E, 25.354 NPaddy field, orchard, woodland
Shangzhai section110.189 E, 25.354 N
Qingmei section110.191 E, 25.342 N
Middle reaches3rdYutang section110.190 E, 25.340 NPaddy field, woodland, grassland, fish pond
Lower reaches9thGuishan section110.196 E, 25.325 NPaddy field, grassland, village and town
Xiaqiao section110.195 E, 25.311 N
11thZhongqiao section110.221 E, 25.309 NGrassland, woodland, paddy field
Water outlet110.228 E, 5.306 N
Disclaimer/Publisher’s Note: The statements, opinions and data contained in all publications are solely those of the individual author(s) and contributor(s) and not of MDPI and/or the editor(s). MDPI and/or the editor(s) disclaim responsibility for any injury to people or property resulting from any ideas, methods, instructions or products referred to in the content.

