Article

The Drought of 2018–2019 in the Lusatian Neisse River Catchment in Relation to the Multiannual Conditions

Institute of Meteorology and Water Management—National Research Institute, 01-673 Warszawa, Poland
*
Author to whom correspondence should be addressed.
Water 2023, 15(9), 1647; https://doi.org/10.3390/w15091647
Submission received: 1 March 2023 / Revised: 17 April 2023 / Accepted: 19 April 2023 / Published: 23 April 2023
(This article belongs to the Special Issue Water ​Management and ​Environmental Protection)

Abstract

:
The drought event of 2018–2019 significantly affected most of Central Europe. In this study, the development and intensity of drought in the Lusatian Neisse river catchment were evaluated, based on the indices of SPI, SPEI, and low flow periods related to hydrological drought. Furthermore, multiannual variability in the drought indices, as well as the trends for air temperature and precipitation totals, were examined for 1981–2020. In the catchment, deficit of precipitation was noticed from autumn 2017 to spring 2020, additionally accompanied by a high thermal anomaly. In the summer seasons, heat waves occurred, which intensified evaporation and increased water deficit. The meteorological drought already appeared in spring 2018, developed in the following months, and became more intensive. The frequency of days with discharges >Q70% exceeded 55%. According to SPI12 and SPEI12, the episode of 2018–2019 can be assessed as the longest period of severe drought in the whole of 1981–2020. The drought caused various consequences in the region. The deterioration of water quality and selected biological indices was one of the effects. In the sector of agriculture, yield reduction in corn and wheat amounted to 33% and 18% in 2018 and 22% and 9% in 2019. In addition, decrease in hydropower generation by more than 30% was noticed.

1. Introduction

Drought is a natural phenomenon that usually develops slowly. Its development cycle consists of the following phases: meteorological drought, agricultural (soil) drought, and hydrological drought. Furthermore, considering the effects of this phenomenon, social-economic drought can be also defined [1].
The consequences of drought can be noticed for a long time due to groundwater deficit and a lower surface water level in natural and artificial reservoirs. The direct effects of drought can concern limits in water supply for communities, as well as yield reduction and a decrease in energy generation. The indirect influence may be related to the secondary effects for the natural and economic resources, which consequently can impact ecosystems, biodiversity, human health, water transport, and forestry [2,3,4].
Drought is a complex phenomenon, which involves different human and natural factors that determine the risk and vulnerability related to this phenomenon [5]. Drought risk usually depends on: (i) hazards related to the lack or shortage of rainfall, decrease in river discharges, low groundwater levels, and (ii) the consequences resulting from the hazards, characterized by a specific scale, such as yield reduction or the intensification of forest fires [6].
Drought conditions initially result from precipitation deficit. However, the propagation of meteorological drought through the water system into hydrological drought depends on both hydroclimatic conditions and the factors related to such issues as geological structure, soil, or land use in a catchment area [7]. This phenomenon is usually caused by the combination of natural factors, often accompanied by the anthropogenic influence [8]. Furthermore, the observed climate change may also contribute to the increase in the frequency of droughts [9,10,11].
The growth in air temperature and changes in precipitation totals can significantly modify thermal humidity conditions and consequently impact dry period occurrence. The analysis on climate changes show that weather conditions favoring the intensification of droughts noticeably changed, especially over the last decade. In terms of thermal conditions, the report of the World Meteorological Organization (WMO) indicates that the period of 2015–2018 was the warmest in the history of measurements [12]. In Europe, exceptionally high air temperature was noticed in 2015 and 2018 [13,14,15,16,17,18,19]. Very high values were also observed in 2019. In June 2019, the highest thermal anomaly in Europe for the last 70 years was noticed [20]. Regarding long-term changes in thermal conditions, analysis for Europe reported a significant increase in air temperature [21,22,23,24]. In Poland, the total growth since 1951 reached 2 °C [25,26]. The trends of changes are positive in all seasons, with the highest increase for spring [26]. Early occurrence of hot and usually dry weather after a mild and snowless winter considerably intensifies potential drought conditions [24].
Unlike air temperature, the trends of precipitation totals in Central Europe are usually statistically insignificant [27,28,29,30,31,32,33,34,35,36,37]. This mainly results from the fact that changes in precipitations in this region are less distinctive than in the northern or southern parts of the continent [38,39,40]. However, it should be emphasized that some analysis indicated negative tendency of precipitation totals in the summer season and the positive ones for the winter months [41,42,43,44]. Consequently, such conditions can potentially impact the intensification of droughts in the warm half-year. The studies devoted to the multiannual changes in the frequency of dry days in the warm season in Poland did not show statistically significant tendencies [30,33]. Non-homogenous trends were also reported for the annual number of dry days in the northern part of Germany and Poland [45]. On the other hand, the increase in dry periods in 1961–2019 was found for the Czech Republic [36].
Rising air temperature contributes to the changes in potential evapotranspiration, which plays an important role in the development of dry conditions. The positive trends of potential evapotranspiration were noticed for southwest and northwest Poland [46,47] and for the Czech regions as well [48]. In addition to thermal conditions, the changes in evapotranspiration mainly resulted from the increase in sunshine duration and the decline in relative humidity [46,49].
The analysis of droughts shows that the frequency of dry periods in Europe in the last decades significantly increased (including the central part of the continent), mainly due to the growth in potential evapotranspiration and mean air temperature [45,50,51,52]. This concerns especially the last decades when drought events (in 2003, 2015, and 2018 and 2019) were often accompanied by a significant positive thermal anomaly and long-lasting heat waves [15,53,54,55,56]. In Poland, mean climatic water balance during the growing season decreased in most of the regions, especially in 2011–2020 [57]. It should also be noted that meteorological droughts in Poland occur more frequently in spring and autumn than in summer [58]. Simultaneously, the analysis on drought conditions in Poland, Germany, and Czech Republic indicated that the frequency of such periods increased for the spring season, while autumn and winter were characterized by negative trends [45]. The increase was also reported for the hydrological drought risk for most of the Polish regions in 1901–2002 [59]. Furthermore, the positive trend was observed for soil drought occurrence in the summer months in the regions of Czech Republic and Slovakia [60].
Currently, many Polish regions suffer from frequent water shortage, especially in the growing season [61]. The investigation based on SPEI showed that the area of Poland extending from the southwest towards the central part of the country exhibits significant drying trends, especially in the months representing the summer season [62]. Such a situation is also observed in the Lusatian Neisse river catchment, which is located in the border area between Poland and Germany. In this case, water availability in the warm half-year was significantly reduced [63]. Consequently, this implied further research on the intensity of droughts in the catchment, which was carried out within the NEYMO-NW project. Furthermore, meetings with the stakeholders from Poland and Saxony allowed for the identification of many problems related to drought impact in the discussed region. Those included: reduction in energy generated by hydropower plants, degradation of water and water-dependent habitats, problems with surface water abstractions, agricultural losses, and soil degradation.
In 2018–2019 and in the beginning of 2020, most of Europe was affected by droughts, which seriously impacted economy, society, and natural ecosystems [56,64,65,66,67,68]. The long-lasting severe drought event was also observed in the Lusatian Neisse river catchment. Therefore, the main goal of the study is to evaluate the intensity of drought in 2018–2019 in the background of climate changes in 1981–2020. In this case, the analysis also concerned the assessment of the impact of the 2018–2019 drought on agriculture, hydropower, and water quality.

2. Study Area

The Lusatian Neisse river catchment covers the area of 4398.57 km2 and is located in the transborder area of three states: Poland (58% of the catchment area), Germany (33%), and the Czech Republic (9%). The river belongs to the Odra river basin and is 246 km long. The source section (48.39 km) is located in the Czech Republic, while the remaining part forms a border between Poland and Germany (Figure 1). Considering specific terrain relief and geological structure, the catchment can be divided into two parts: southern—mountains and their foreland (ca. 40% of the total area), and northern—lowlands (ca. 60%). In terms of land use, forests (43.5%) and agriculture lands (45%) are predominant. Some forests are included in the environment protection areas, such as Natura 2000 or nature reserves, which cover about 34% of the total catchment area. In addition to forests and agriculture lands, urban and urban–rural areas can be also distinguished in the discussed region (ca. 5%). Furthermore, because of mining activity, anthropogenically transformed terrains related to lignite open pits are also present. Due to ecological reasons, some of them were recently reclaimed.
The Lusatian Neisse river catchment is characterized by moderate climate conditions. They indicate transitional features between the maritime and continental climate. Annually, polar maritime air mass advections from the west are predominant. However, climate conditions on a local scale are modified by terrain relief and land use.

3. Data and Methods

The base for the analysis was meteorological and hydrological data containing daily records for 1981–2020, which were derived from 18 measuring sites. Those concerned seven stations from the Polish hydrological–meteorological service (IMGW-PIB), seven stations of the German weather service (DWD), and four stations belonging to the Czech weather service (ČHMÚ). In the case of hydrological records, they were obtained from four water gauges of the IMGW-PIB (Figure 1). The hydrological analysis concerned the upper and central part of the Lusatian Neisse river catchment, reaching up to the water gauge of Przewóz. The spatial range of hydrological analysis was limited by the borders of the support area of 2014–2020 INTERREG V-A Poland—Germany/Saxony Programme, which was the main source of funding for the NEYMO-NW project.
Drought conditions were evaluated using two indices: standardized precipitation index (SPI) and standardized precipitation evaporation index (SPEI). SPI is a widely used drought monitoring index, recommended by the World Meteorological Organization (WMO) [69]. The calculation of SPI is based on a multiannual series of precipitation totals, accumulated for various time intervals, for which the theoretical Gamma distribution is fitted. Subsequently, the transformation to the normal distribution is carried out. The positive SPI indicates precipitations higher than the median, while the negative SPI is related to rainfall lower than this value [70,71,72,73]. In the case of SPEI, this is defined as a standardized difference between precipitation and potential evapotranspiration. The full description and calculation details for this index were carried out by Vicente-Serrano et al. [74]. In this study, potential evapotranspiration was calculated using the Hargreaves method [75], along with its modification for the Polish conditions [76]. This method is characterized by relatively low data requirements and was calibrated to the regional Polish conditions with the reference to the Penman–Monteith FAO-56 (PMF56) method [76,77]. Moreover, based on the results obtained by Stagge et al. [78], various methods for the calculation of potential evapotranspiration can be applied using SPEI. This also includes the Hargreaves equation, which is based on air temperature data. The values of SPEI were calculated using the R package [79].
SPI takes into account precipitations only. However, in order to include the effect of air temperature on drought assessment, SPEI was applied. On the other hand, one of the advantages of both indices (SPI and SPEI) is the possibility of their calculations for different time scales. This consequently enables drought monitoring for its various types: meteorological, agricultural, and hydrological. In order to quantify droughts for the purposes of this study, the indicators were computed for both 3-month and 12-month scales. The 3-month scale (SPI3, SPEI3) enables identifying seasonal dryness, while the 12-month interval (SPI12, SPEI12,) allows for the determination of annual conditions. The impact of drought on short-term water supplies (which is important for agriculture) is reflected by the timescales referring to 3 and 6 months. Longer aggregation periods (e.g., 12 months or longer) refer to the drought impacts on river discharges, water storage in reservoirs, and groundwater level [45,73,80]. These are water resources that respond with a delay to the drought phenomenon.
Wibig [81] found that SPEI12 notably describes the occurrence of hydrological droughts in the Polish climate conditions. The negative SPI and SPEI indicate dry conditions, while the positive values are related to the wet ones. The SPI index, similarly to the SPEI, can determine drought severity (Table 1), also identifying the beginning and end of drought episodes.
Furthermore, based on the daily discharges for 1981–2020 in the Lusatian Neisse river catchment, the evaluation of low flows (as an indicator of hydrological drought) was carried out. In order to determine low flow periods, the threshold level method was applied [82,83]. In these terms, the hydrological criteria for the flow duration curve at the level of Q70% (which corresponds to the threshold value for droughts), Q90% (threshold value for severe droughts), and Q95% (threshold value for extreme droughts) were used. This method specifies low flow situations as the period with discharges below the threshold value (Q70%), lasting for at least 5 consecutive days [84]. The ends of low flows are defined when discharges are higher than the threshold value. If the time interval between the low flows do not exceed 4 days, the episode is defined as a single low flow event.
For the purposes of the analysis, water resources for a given year were calculated as the mean annual discharge (in m3/s) multiplied by its duration for this year. The deficit of discharges was defined as a difference between the actual discharge (Q) and the threshold value of Q70%.
Flow duration curves were used for the evaluation of daily discharges in 2018–2020 in relation to the multiannual period of 1981–2020. Cumulative curves concerning the frequency of discharges in 2018–2020 were carried out for each day. In this case, five classes defining dryness and wetness conditions were selected. They were assigned to the categories of the discharge exceedance probability. The class of 0–10% was related to very wet conditions, 10–25%—wet conditions, 25–75%—normal conditions, whereas the rates of 75–90% and 90–100% referred to dry and very dry conditions, respectively [85].
Energy rate generated by the hydropower plants was calculated using the following formula:
N = 9.81∙Q∙H∙η,
where
N—hydropower generation [kW];
Q—turbine’s gullet [m3/s];
H—difference in water levels [m];
η—efficiency coefficient;
9.81—standard gravity [m/s2].

4. Results

4.1. Changes in Air Temperature and Precipitation Totals in 1981–2020

Based on the climatological normal period 1981–2010, the area-averaged value of the annual air temperature in the Lusatian Neisse catchment is equal to 8.8 °C. Annually, July is the warmest month, with mean air temperature reaching 18.2 °C, while January is the coldest (−0.6 °C). In the 1981–2020 period, 2018 and 2019 were the warmest years, characterized by the mean annual value reaching 10.4 °C. On the other hand, the coldest conditions were observed in 1996, when mean air temperature amounted to 6.5 °C (Figure 2a). In terms of the multiannual changes in mean air temperature in 1981–2020, the trend was positive (0.046 °C/year) and statistically significant at the level of 0.05 (Figure 2a).
The area-averaged annual precipitation totals for the entire Lusatian Neisse river catchment amount to 687 mm (1981–2010). The totals for the warm half-year (May–October) account for 56% of the total annual value. The highest precipitations are usually observed in July (87 mm), while February is the driest month (41 mm).
Annual precipitation totals were characterized by a high variability in the discussed period. In 1982, 2003, and 2018 the driest conditions occurred, characterized by precipitation totals below 500 mm. In this case, they accounted for 62–66% of the normal value (1981–2010). On the other hand, 2010 was regarded as the wettest year. Mean totals for the entire area reached 969 mm and exceeded the normal rate by 41%.
Such a significant variability of precipitation totals in the multiannual period resulted in wet and dry periods occurring. In the wet periods, precipitation totals significantly exceeding the normal value were observed during the consecutive years (1986–1988, 1993–1995, and 2007–2013). Analogically, dry periods were related to the totals below the normal rate and also noticed in the successive years (1982–1985, 1989–1992, and 2018–2020). In the case of the changes in annual precipitation totals, the analysis did not detect any statistically significant trends (Figure 2b).

4.2. Meteorological Droughts in 1981–2020

In 1981–2020, the values of SPI12 for the January–December period identified drought (SPI ≤ −0.5) for twelve years. The year 1982 was considered as extremely dry (SPI ≤ −2.0), while severe drought occurred in 2003 and 2018 (Figure 3a). According to SPEI12, 2018 was the driest year. Furthermore, severe drought also occurred in 1982 and 2003 (Figure 3b).
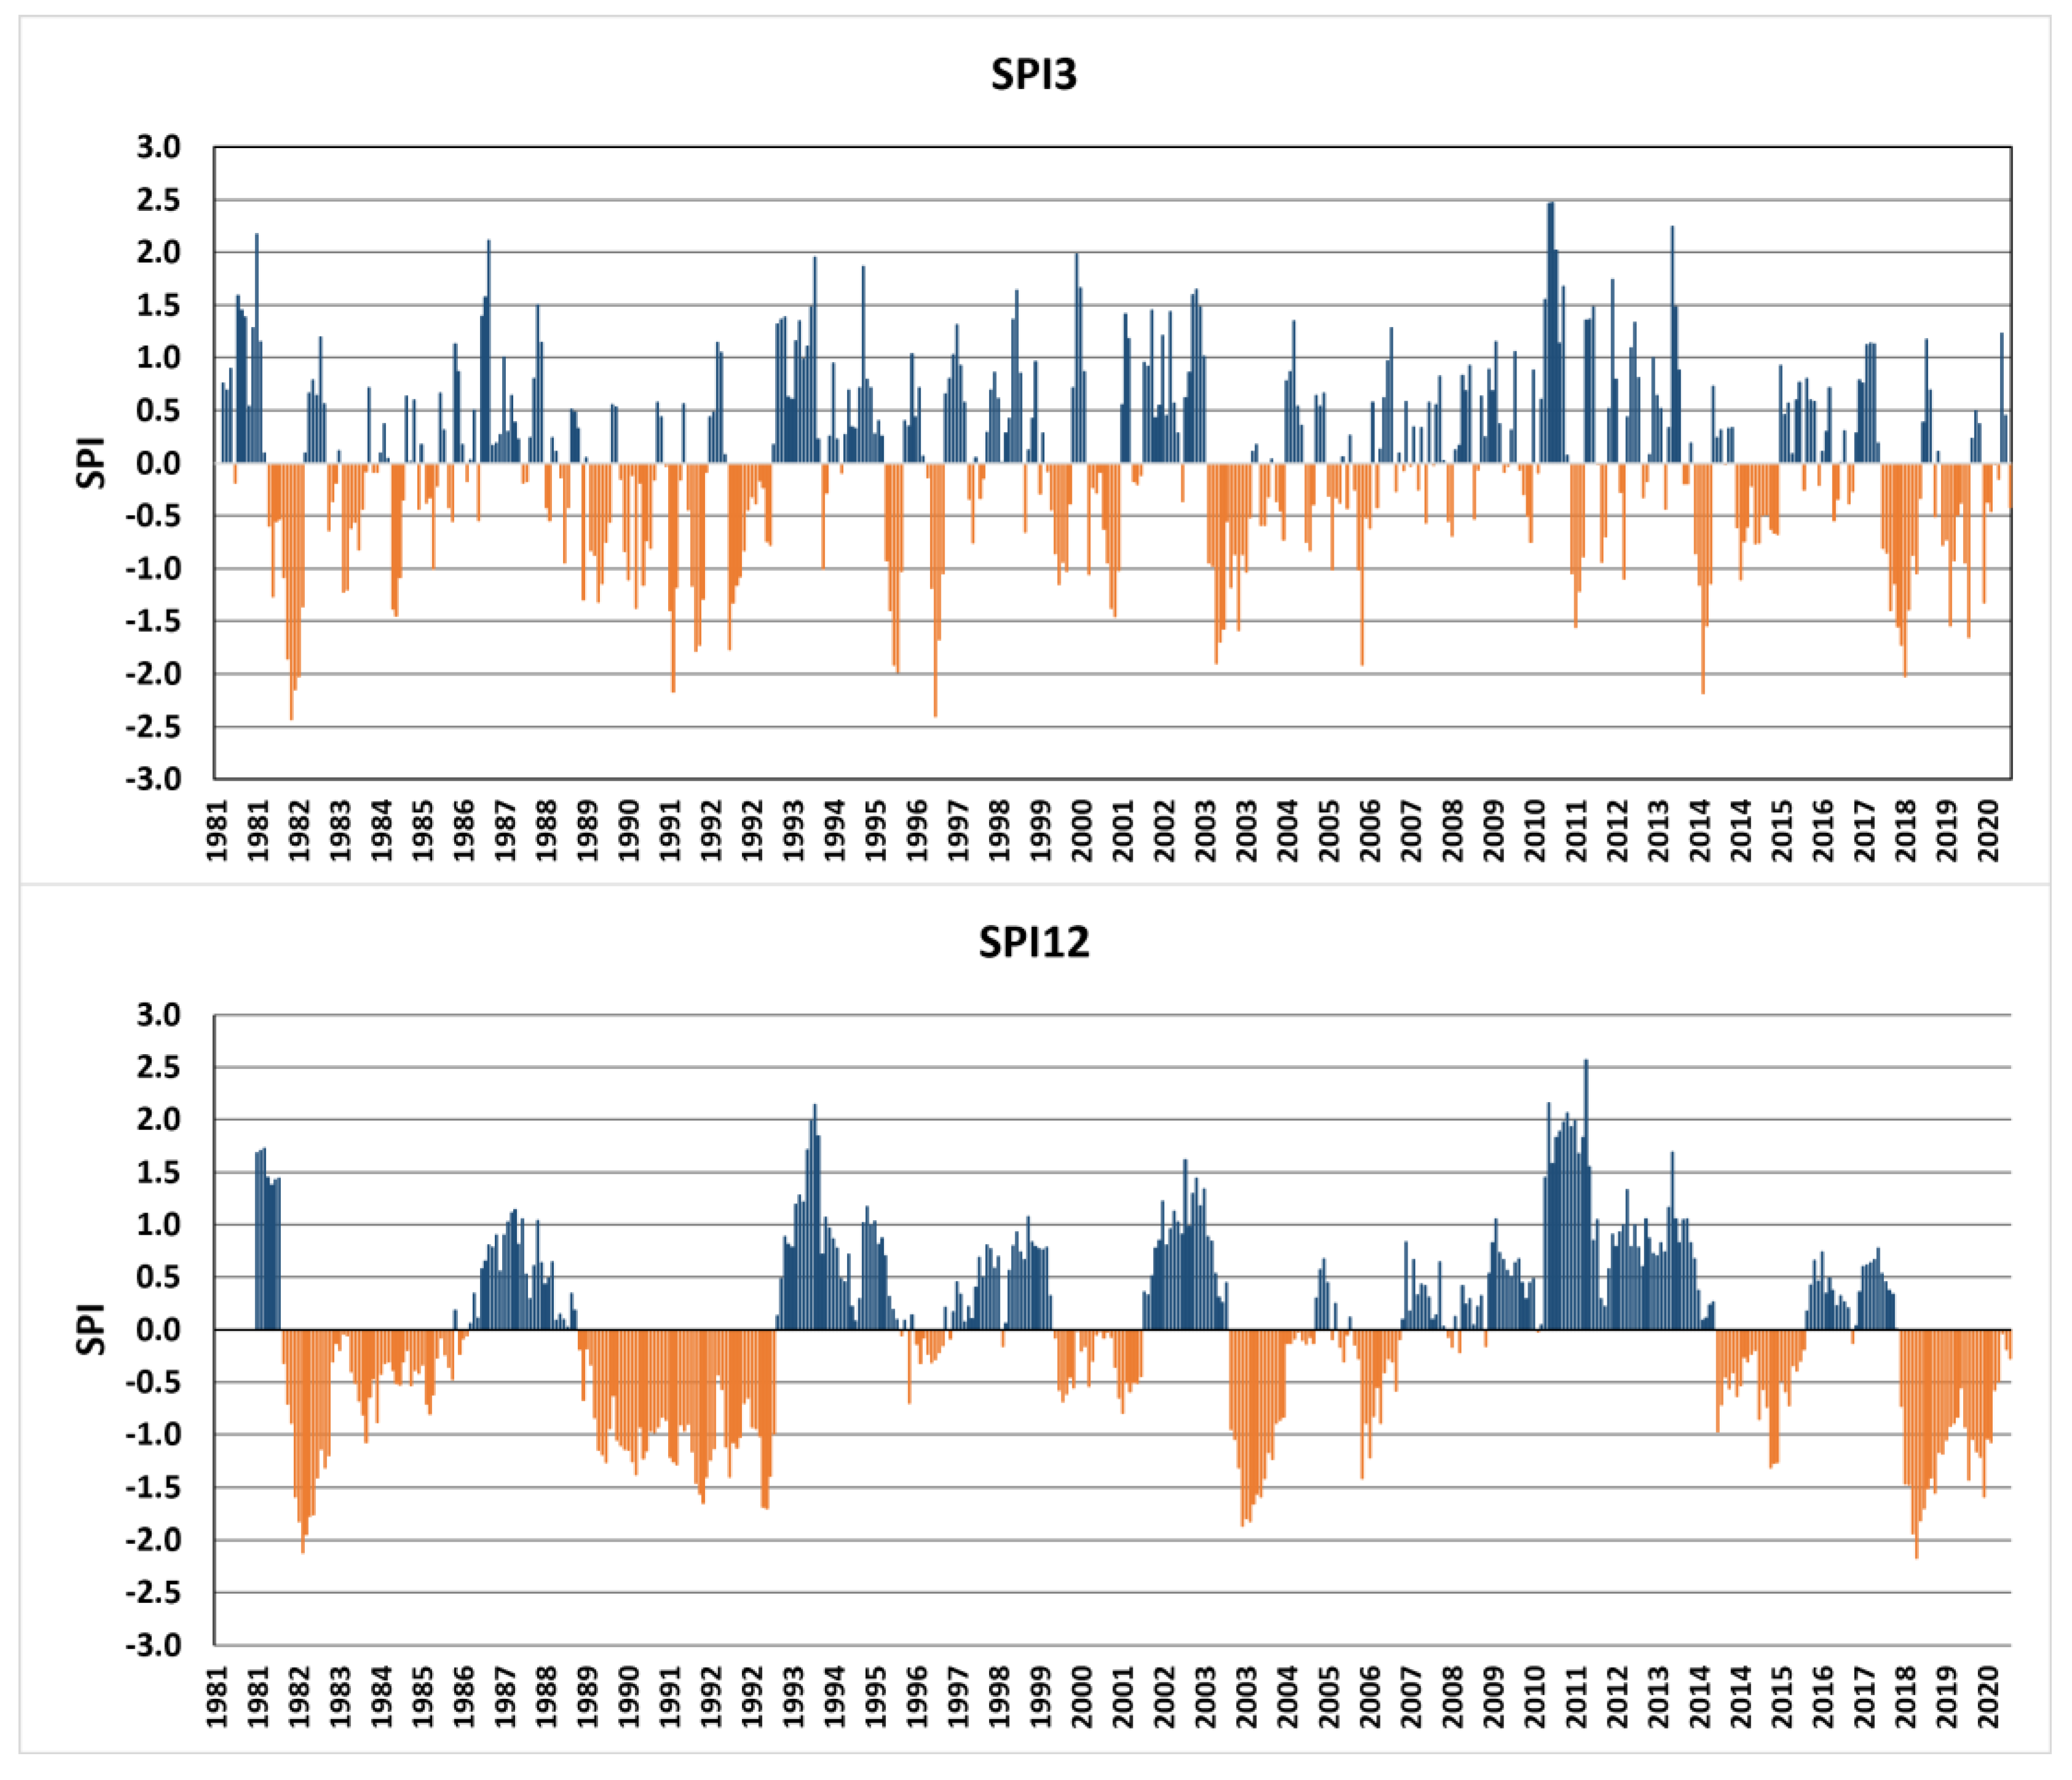
Figure 4 shows the course of SPI on the 3 and 12 months scales. In the case of the 3-month scale, dry (SPI ≤ −0.5) and moist (SPI > 0.5) periods indicate a high temporal frequency. In terms of the longer time interval (12 months), the changes progress slower. The periods with the negative SPI12 values occur more rarely than in the case of SPI3, while their duration is longer. The average duration of dry periods (SPI ≤ −0.5) for the 3-month scale reaches 3 months, while the duration of 8 months is observed for the scale of 12 months.
SPI3 indicated extreme drought in 1982 (three consecutive months), 1991, 1997, 2014, and 2018. In the case of SPI12, the longest drought with different intensity conditions persisted from June 1989 to June 1993. However, the longest period of severe drought was noticed from August 2018 to April 2019.
In the case of SPI3, periods associated with severe drought were mainly observed in summer and continued till the end of autumn (November). In terms of SPI12, such droughts usually started in the autumn months and ended in spring.
The frequency of droughts in each of the intensity classes was assessed for particular decades of 1981–2020. The intensity was defined in terms of the categories of moderate, severe, and extreme droughts. They were specified based on the number of months when SPI3 and SPI12 were below the threshold values for a given class. The highest frequency of moderate droughts (38 months) for SPI3 was noticed in 1981–1990. In terms of severe drought, the longest duration (8 months) was observed for SPI12 for the entire 2011–2020 period. On the other hand, the frequency of extreme droughts was balanced for particular time scales and decades, amounting to 1–3 cases.
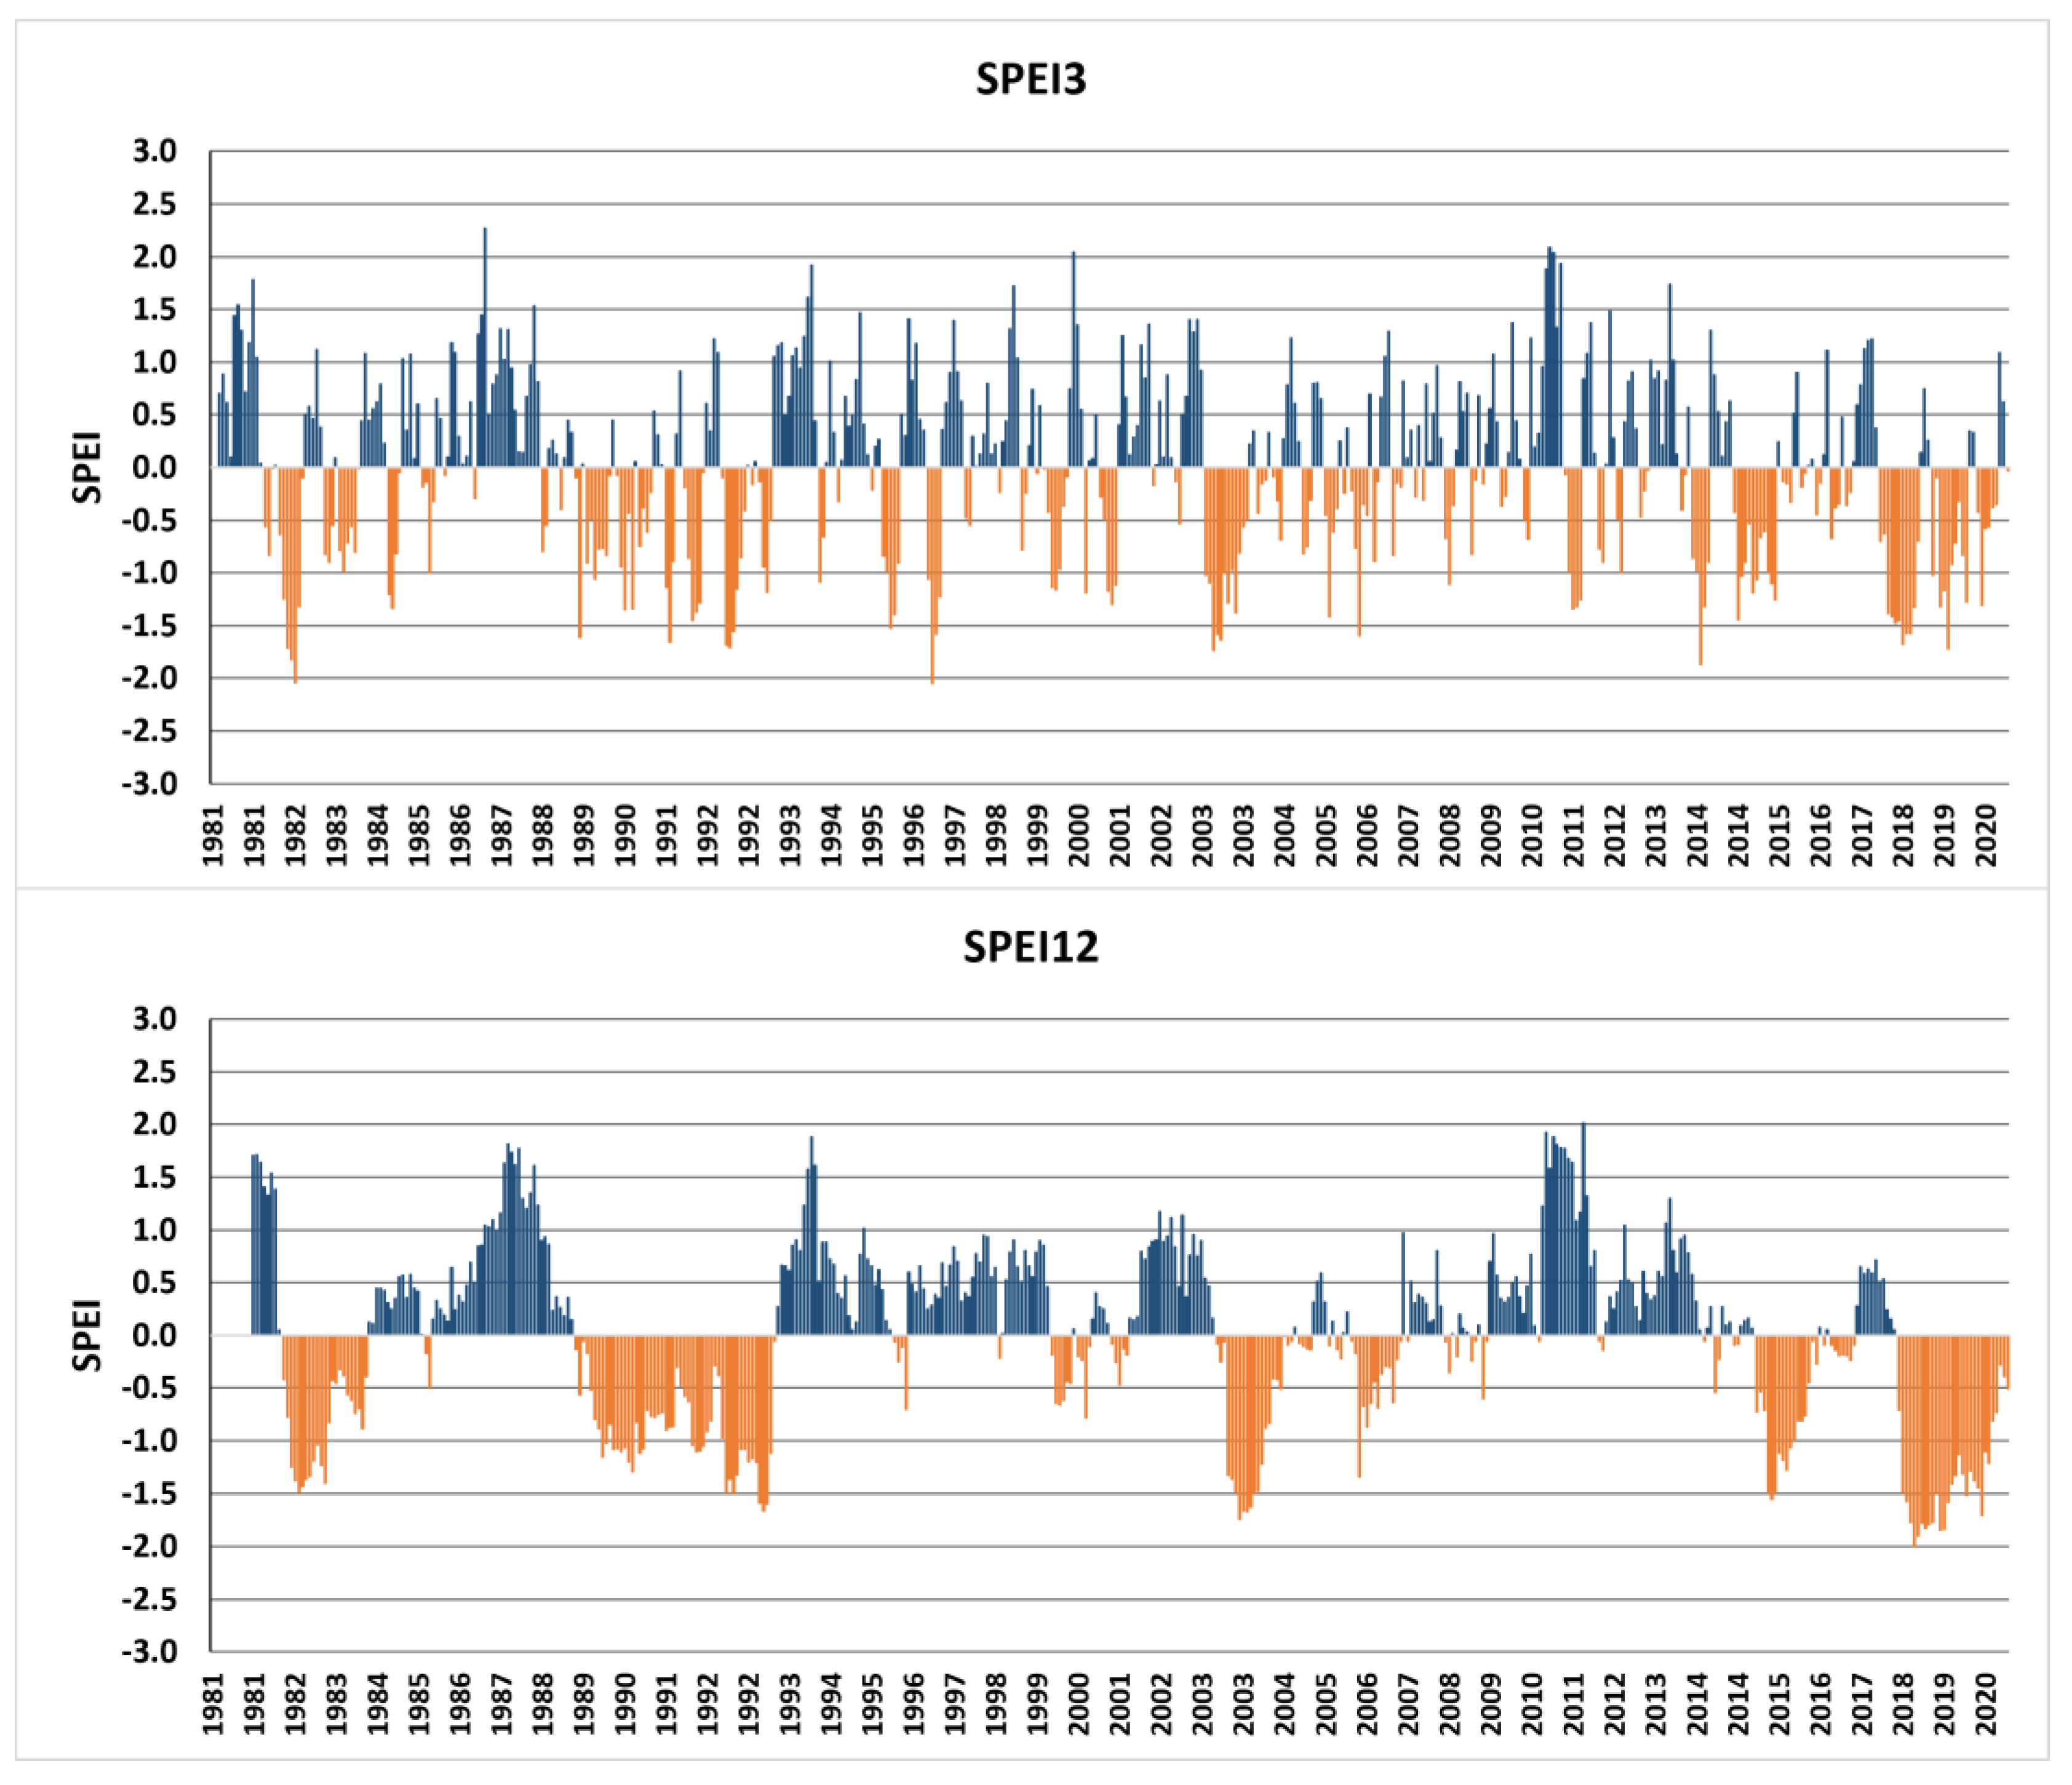
In 1981–2020, the course of SPEI for the selected time scales (3, 12 months) mainly reflected the features of SPI. Minor differences were observed for the intensity of dry and wet periods (Figure 5). According to SPEI, drought occurrence for the 12-month scale was characterized by a lower regularity than for the 3-month period, which was similar to the SPI analysis. Exceptionally low SPEI occurred in the periods when low precipitation totals were accompanied by a significant positive thermal anomaly (i.e., 1992, 2006, 2015, 2018, and 2019). According to SPEI12, severe drought in the entire analyzed multiannual period was characterized by the longest duration from August 2018 to June 2019. In terms of SPI12, this drought period was shorter and lasted till April 2019.
In the 1981–2020 period, the lowest SPI12 and SPEI12 were noticed in November 2018 (−2.2), which classified these conditions as extreme drought (≤−2.0). Regarding SPI3, the lowest rates were observed in September 1982 (SPI3 equal to −2.4), while the minimum for SPEI3 was noted in November 1982 (−2.0).

4.3. Hydrological Droughts in 1981–2020

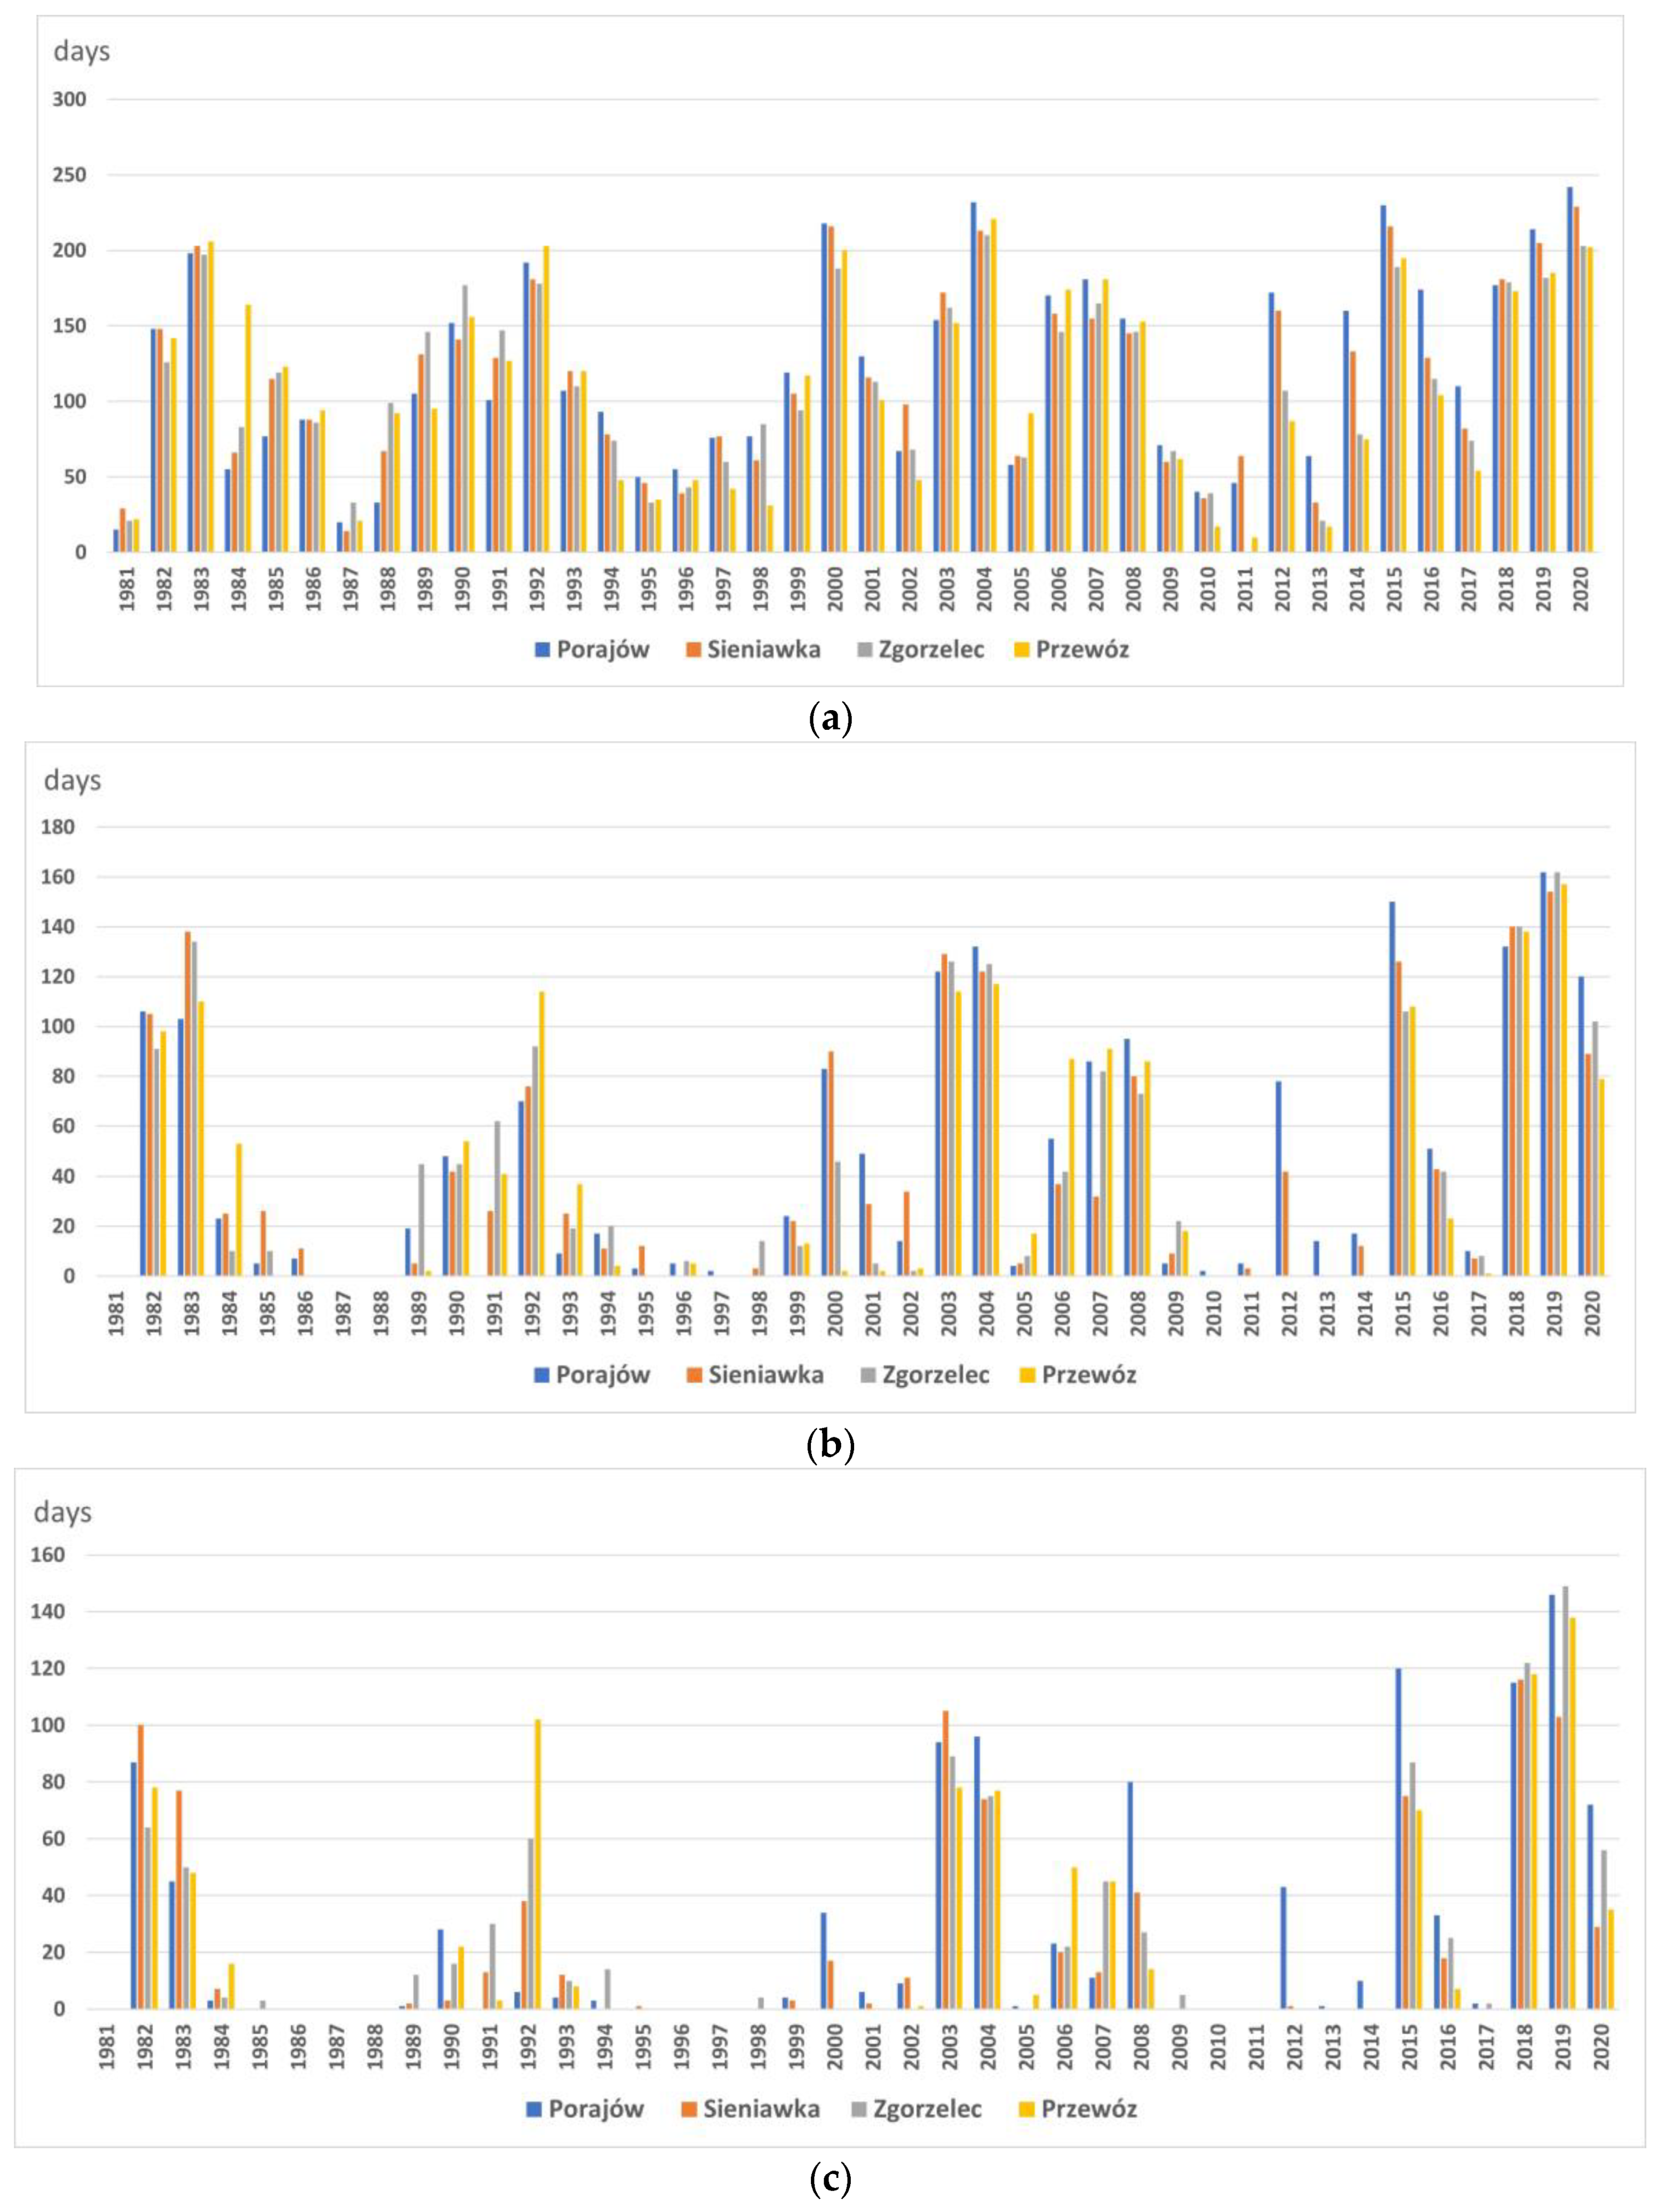
The course of low flow periods (mainly in the summertime) usually depends on the deficit of precipitations and water loss in the process of evaporation. In 1981–2020, 1–8 cases of low flow periods were annually noticed in the Lusatian Neisse river catchment at the considered water gauges. The only exception was 2011, when such periods did not occur at the gauges of Zgorzelec and Przewóz. The duration of low flows usually varied from several to more than 10 days. The longest periods were noticed in 1982, 2003, 2018, and 2019. Their duration exceeded 200 days and they concerned all the analyzed water gauges profiles. The longest low flow period (more than 250 days) was noticed at the gauges of Sieniawka (2000, 2003, and 2018) and Porajów (2000).
In the discussed catchment, low flows were the most frequent in the warm half-year, from July to October. In the timespan between June and November, their mean frequency amounted to 12 days a month. The highest number of days with low flows was noticed in the August–October period and varied at 16–18 days a month.
In 1981–2020, both very long low flows and extreme droughts (discharges below Q95%) were observed. Such conditions were found especially for the warm half-year. Furthermore, it should be emphasized that low flows often appeared in the consecutive years. Dry 2-year periods were noticed in: 1999–2000, 2003–2004, and 2007–2008, while the 3-year episodes occurred in 1990–1992 and 2018–2020.
Analyzing the number of days with the discharge lower than Q90% and Q95% (indicating severe and extreme drought in the catchment), the highest frequency of such situations was noticed in 1982, 1983, 1992, 2003, 2004, 2015, and in the last three years of the considered period (2018–2020). In the first three decades of 1981–2020, conditions characterized by more than 100 days with discharges below Q95% were noticed sporadically, just at the water gauges of Przewóz (1992) and Sieniawka (2003). In the last decade, such a situation was observed in 2015 in Porajów and at all the gauges in 2018 and 2019. It should be noted that these conditions concerned two consecutive years (Figure 6).
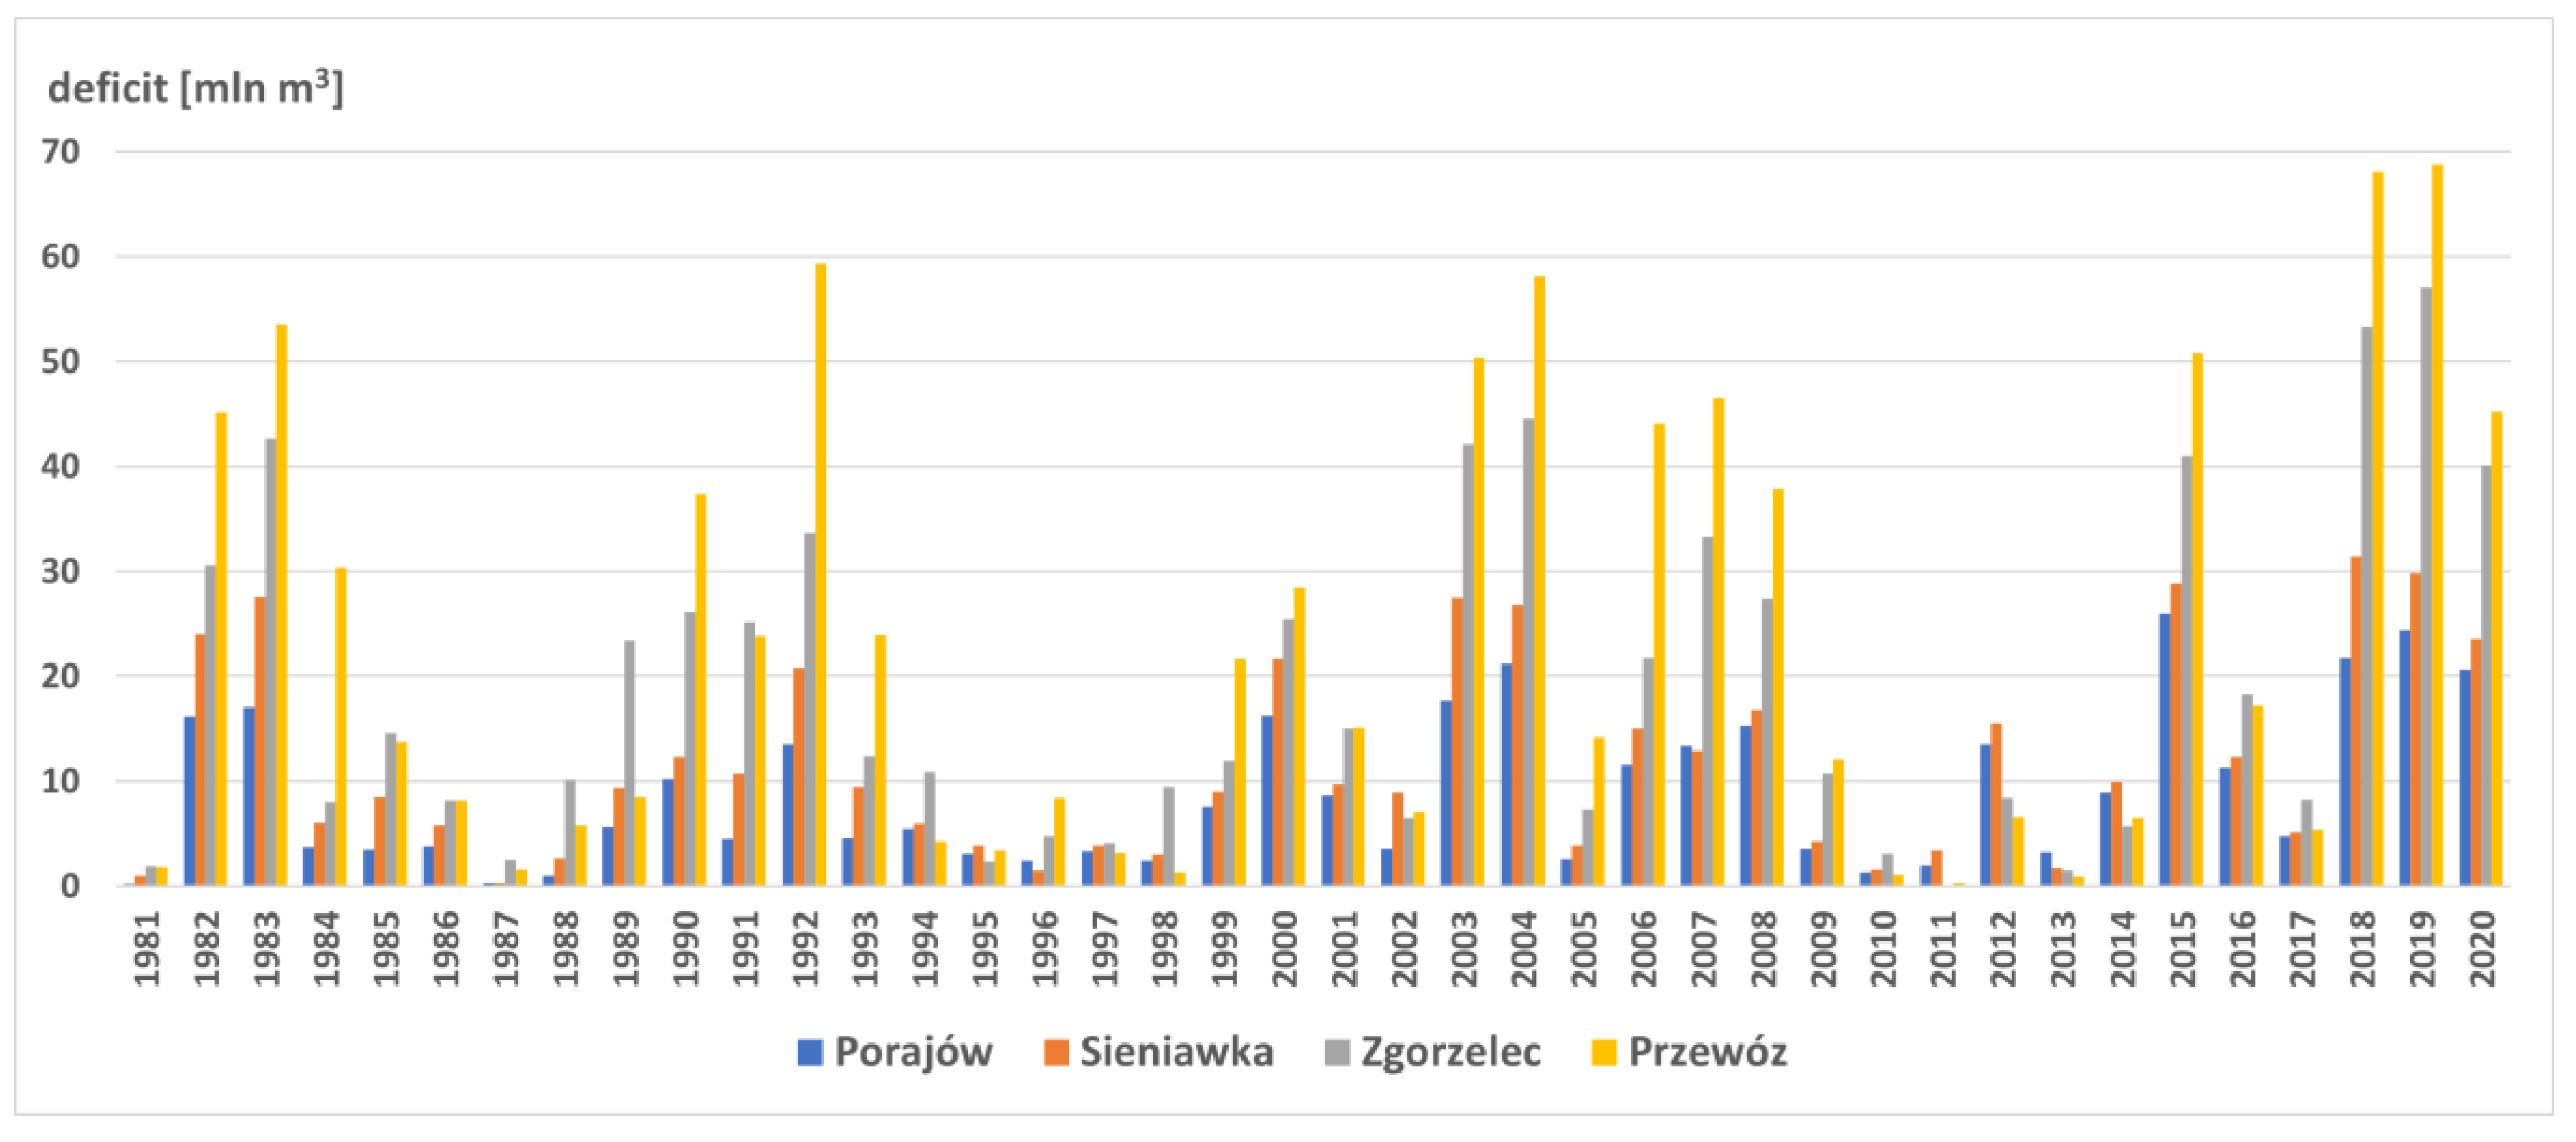
In the multiannual period of 1981–2020, the most significant discharges deficit in the catchment occurred in 2015–2020. In the case of the Porajów water gauge (the upper part of the catchment), the highest shortage was observed in 2015 and amounted to 26.014 million m3. In 2018, its value in Sieniawka reached 31.393 million m3, while Zgorzelec and Przewóz (the last gauge, located in the middle part of the catchment) were characterized by the deficit of 57.116 million m3 and 68.788 million m3, respectively (Figure 7). On the other hand, neither of the discharges in 2011 in Zgorzelec were lower than Q70%. In 2011, the minimum deficit (0.365 million m3) was also noticed in Przewóz, which is located at the lowest altitude. In the upper part of the catchment (Porajów and Sieniawka), the minimum deficit occurred in the 1980s and reached 0.235 million m3 in Porajów (1981) and 0.318 million m3 in Sieniawka (1987).

4.4. Drought of 2018–2019

4.4.1. Meteorological Drought

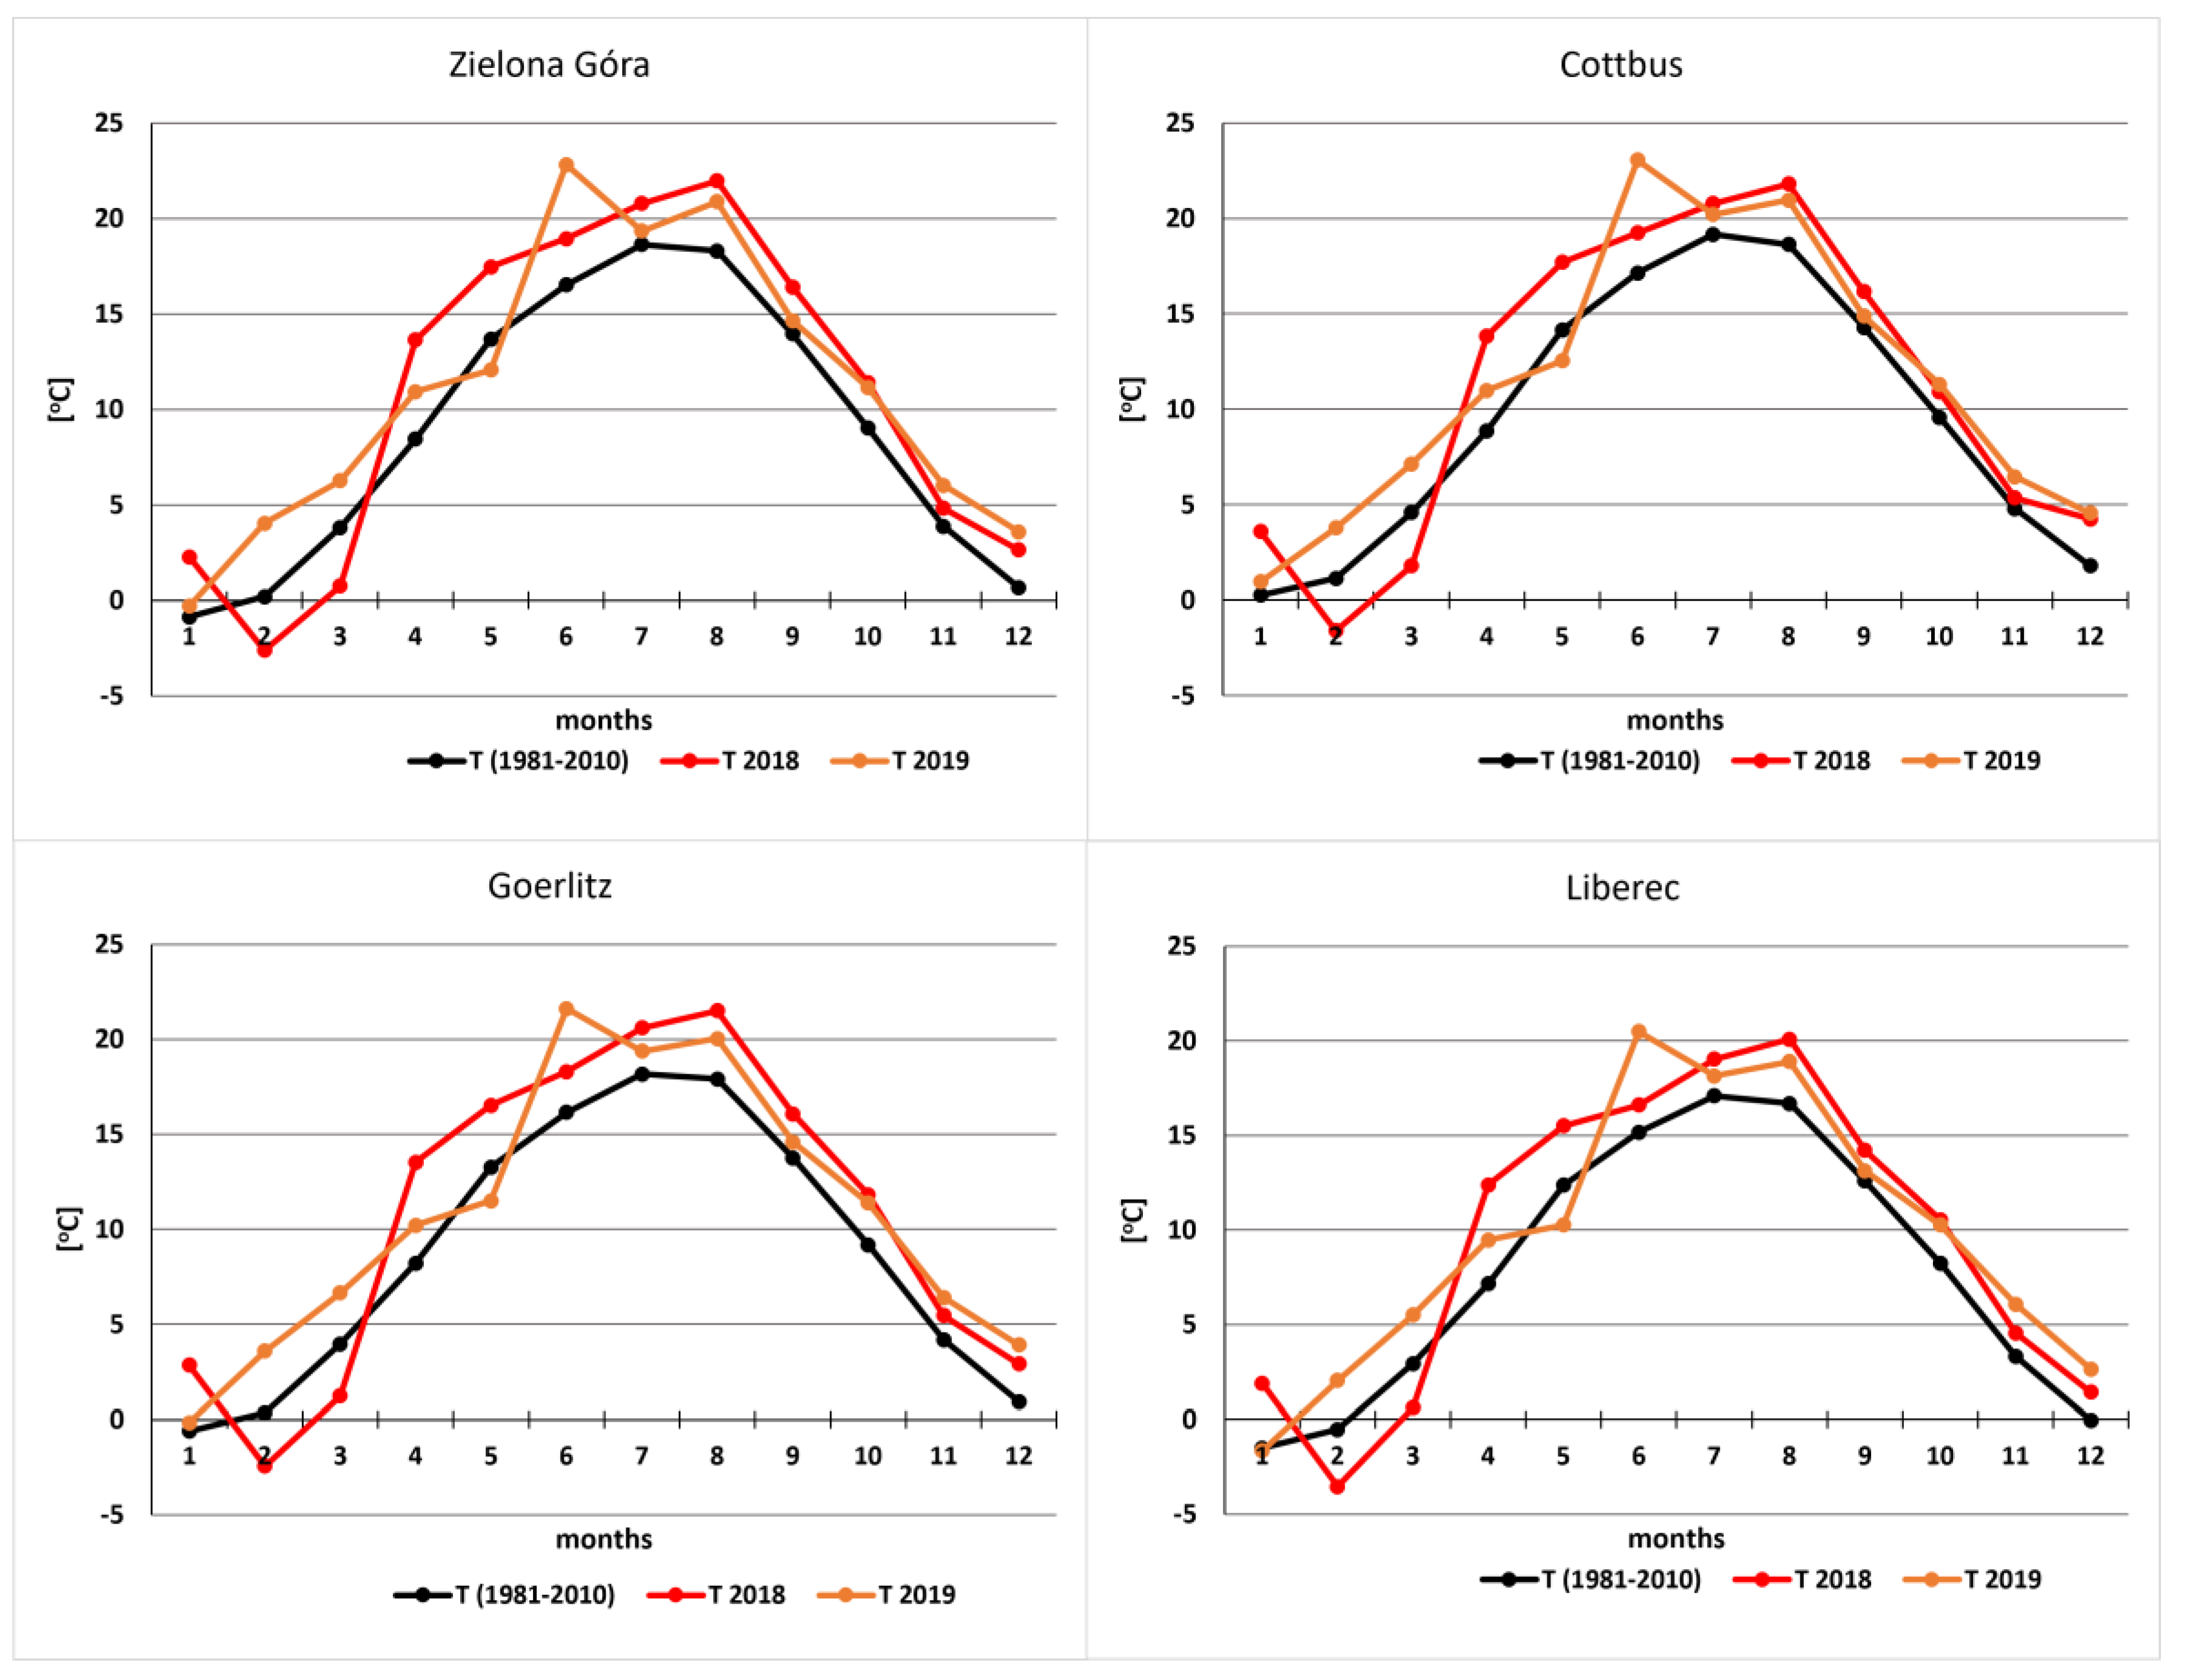
Thermal conditions in Poland in 2018 and 2019 were significantly different from the normal state and classified these years as extremely warm [86,87]. In the Lusatian Neisse river catchment, mean air temperature in 2018 and 2019, assessed for the entire region, reached 10.4 °C and exceeded the multiannual value (1981–2010) by 1.6 °C. In 2018, air temperature exceeding the normal rate was observed for most of the months with the highest anomaly noticed in January, May, and August (Figure 8). In January and April, the anomaly exceeded 3 °C and 5 °C, respectively. Such significant values were also observed in May. However, the entire spring season (March–May) was characterized by a high thermal variability, because of a very cold March (3 °C below the norm). In the summer season, August was the warmest month, with mean air temperature exceeding the normal rate by more than 3 °C. The positive anomaly was also noticed in autumn (September–November). A similar situation took place in 2019, when air temperature was higher than the normal value for most of the year (except May). As a result, all the seasons of 2019 were characterized by a positive thermal anomaly, reaching its maximum in summer. This was mainly contributed to by extremely hot conditions in June, when mean air temperature exceeded the normal rate by 6 °C (Zielona Góra, Cottbus). In Zielona Góra, the mean value in this month was the highest in the history of records for this station. It should also be emphasized that warm conditions were also observed in the wintertime of 2019/2020.
In 2018, the annual number of warm days (Tmax > 25 °C) in the discussed region varied from approximately 70 days (Liberec) to more than 95 days (Cottbus), which exceeded the normal frequency twice. In July and August 2018, warm days accounted for about 70% (locally almost 80%) of all the days in these months. The first cases of warm days in the northwestern part of the region (Cottbus) already occurred at the turn of the first and second decade of April. In the other area of the catchment, they were noticed in the second and third decade of this month. The last warm days were observed in the third decade of September or even in the second decade of October (in the central and northeastern part). In the case of heat days (Tmax > 30 °C), their number in 2018 differed form 15 (Liberec) to 30 days (Cottbus), while the mean multiannual frequency in Liberec and Cottbus was equal to 4 days and 11 days, respectively. The highest number of such days was noticed in August (10–12 days). Most of the catchment area was characterized by two heat waves, defined as at least three consecutive days with maximum air temperature > 30 °C. In the northwest, five heat waves were even observed. The longest one persisted from 24 July to 4 August (Görlitz) and was characterized by extremely high air temperature, reaching as much as 35 °C, locally exceeding 36 °C (Cottbus).
Similarly to 2018, warm days in 2019 occurred more frequently than usual. Their annual number varied from approximately 52 days (Liberec) to more than 76 days (Cottbus), which exceeded the normal rate by 50–80%. In June 2019, 80% of days (locally even more) were classified as warm. The first warm days occurred at the end of April, while the last cases were noted in the beginning of September. However, in the northwest, such conditions were still observed in the second decade of October. In terms of heat days, their number differed from 10 (Liberec) to 32 days (Cottbus). The highest frequency was noticed in June, when air temperature above 30 °C was observed during 5 days in the southern part of the region (mountains and mountain foreland) and on 7–15 days in the remaining area. In 2019, two–three heat waves were observed. The longest episode lasted from 25 August to 1 September (Cottbus).
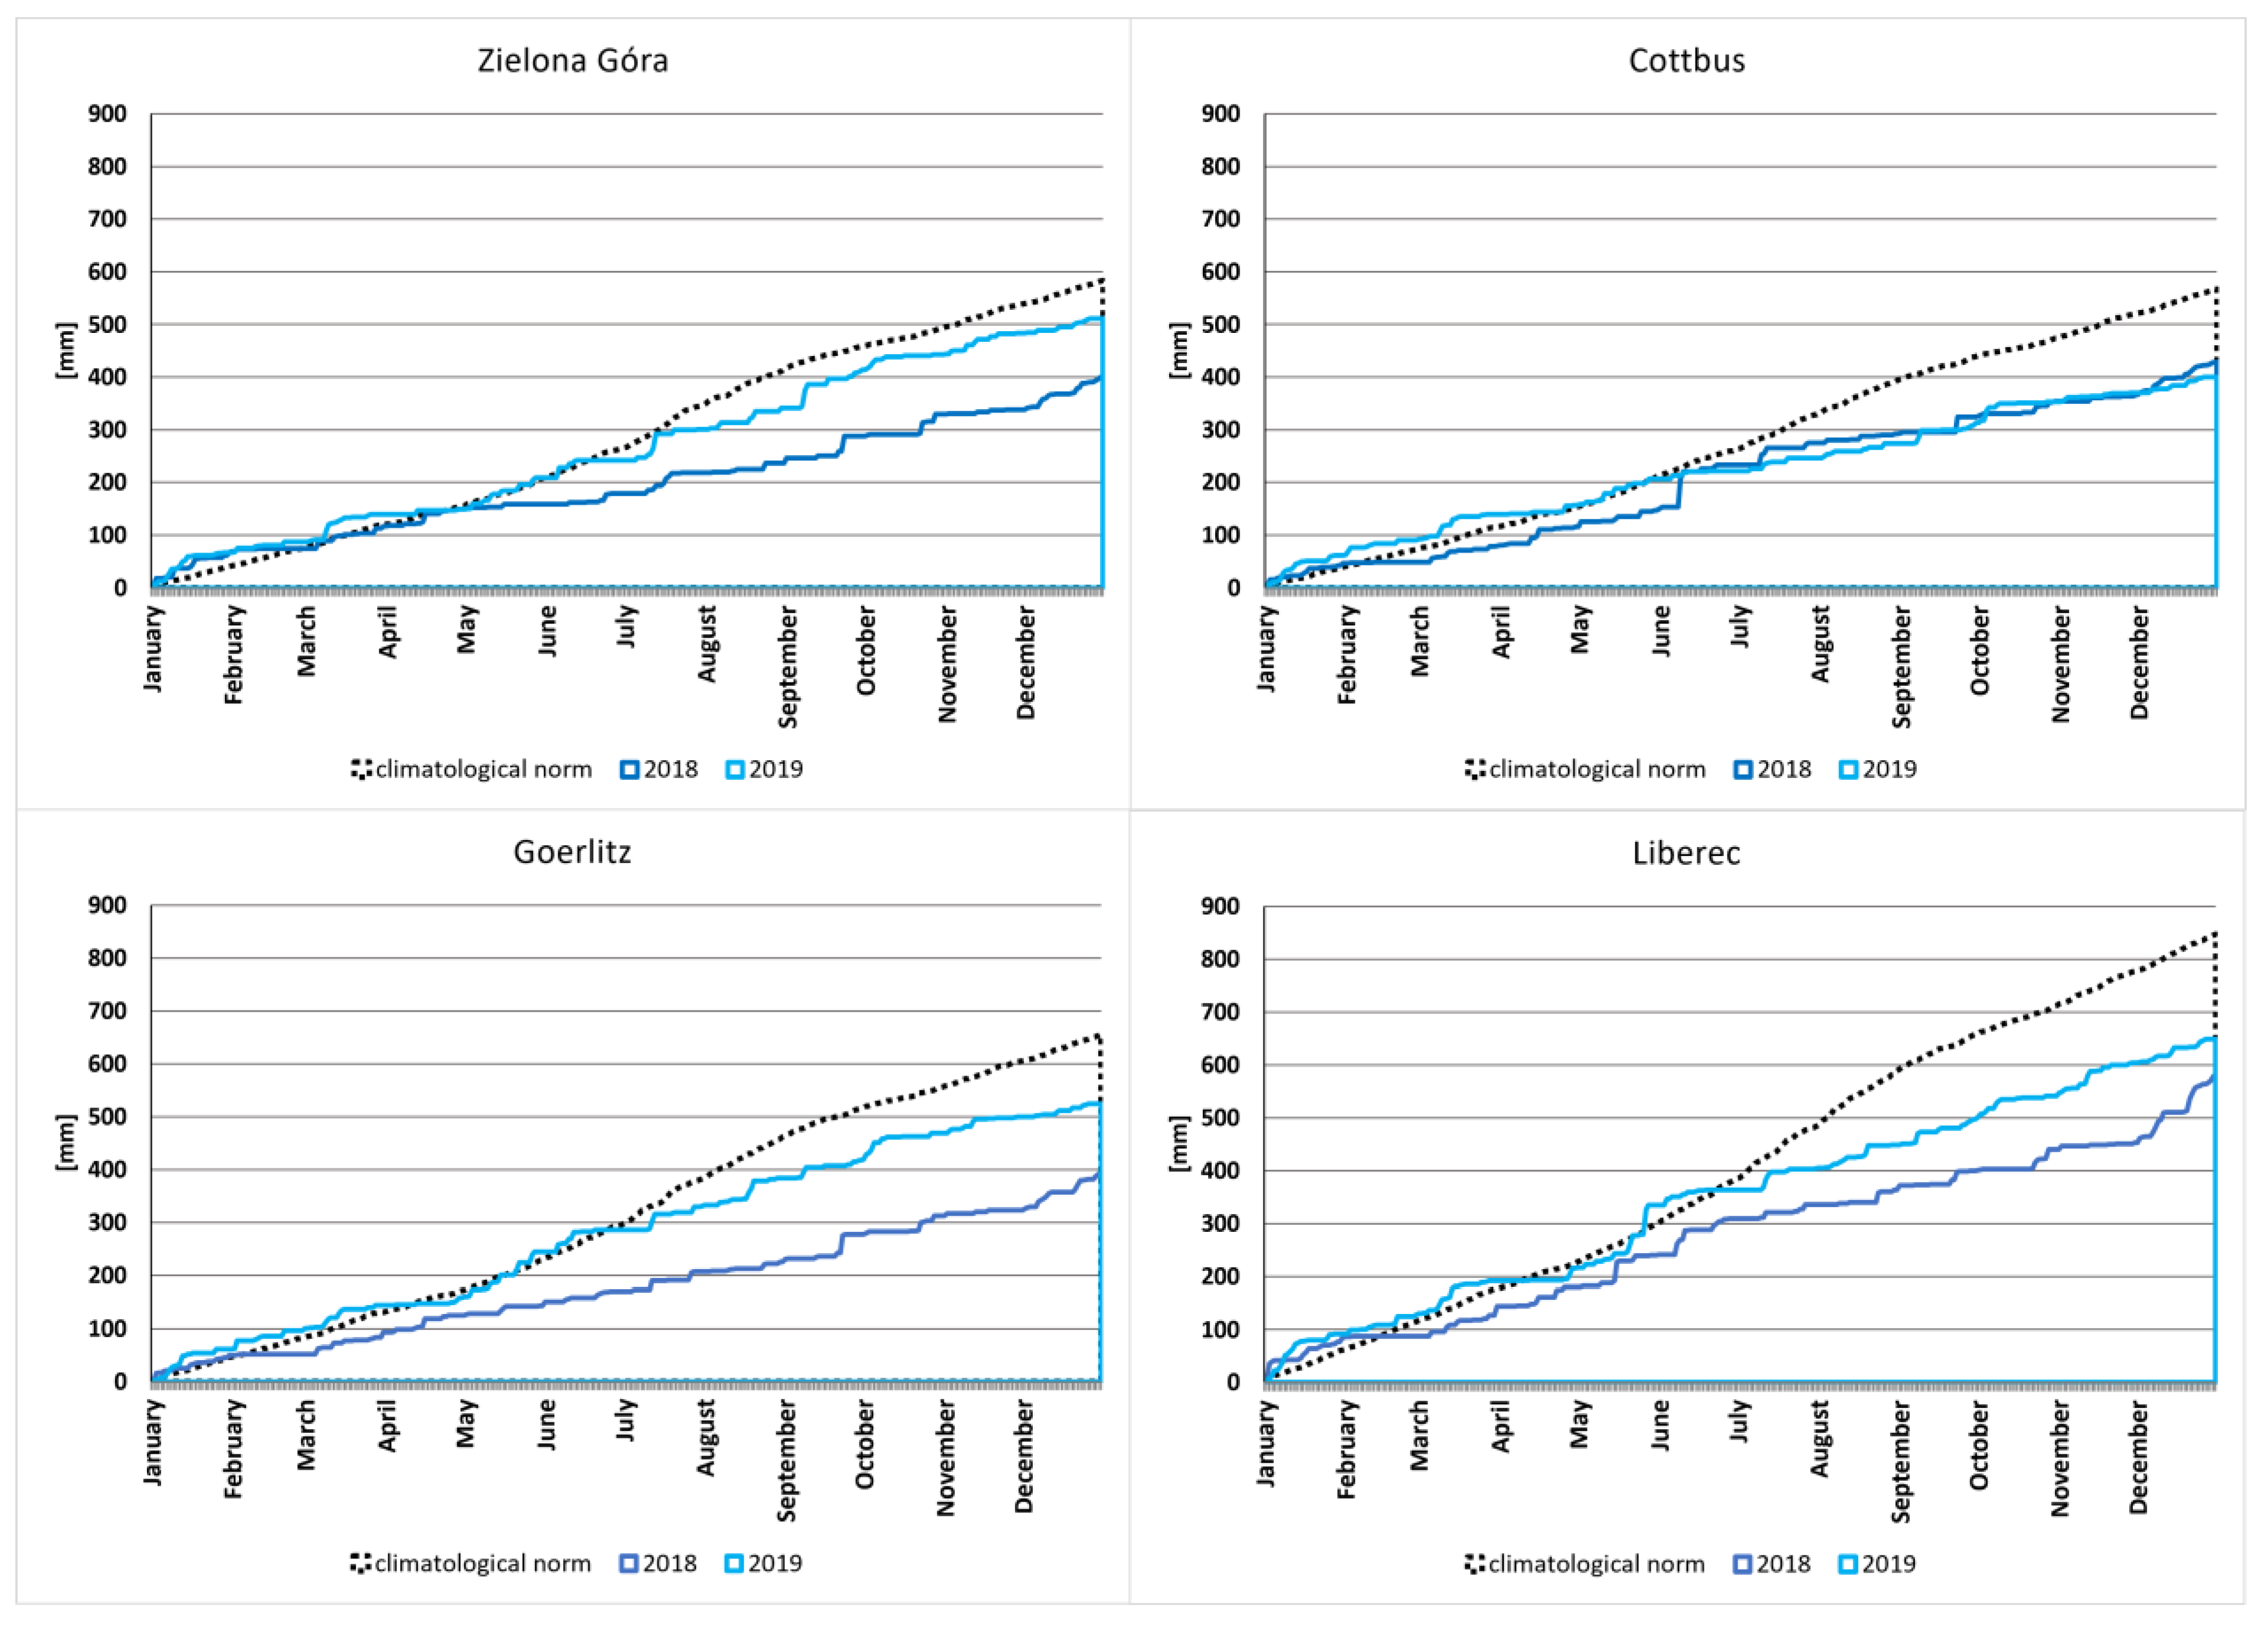
In terms of precipitations, mean annual totals for the entire area amounted to 451 mm in 2018 and 560 mm in 2019, which accounted for 66% and 81% of the normal values. The first weeks of 2018 were initially wet. The monthly totals in January significantly exceeded the mean value. However, February was the beginning of the period with the deficit of precipitations. Most of the catchment area was characterized by very low totals, which accounted for less than 10% of the normal rate. From the beginning of February to the first decade of March, the longest dry period was observed. This amounted to more than 30 days without precipitations or with daily totals below 1 mm. Dry conditions were also noticed in spring, especially in April and May. In these months, precipitation totals usually varied at 20–35 mm (April) and 10–30 mm (May), locally reaching up to 60 mm. In this season, the duration of dry periods exceeded 10 days. The deficit was also crucial in summer and autumn. In August, the totals of about 20–30 mm were measured for most of the area, whereas November was the month with precipitations reaching below 20% of the normal value. In December, precipitation totals were already above the norm. The entirety of 2018 was characterized by significant water deficit. The cumulative precipitation totals indicate that the shortage was already increasing from mid-February (Figure 9).
In 2019, January was wet with the totals reaching beyond the normal rate. The deficit appeared in April, when very low precipitation totals were noticed in most of the catchment area and accounted for about 20% of the mean multiannual rate. The longest dry period persisted from the end of March to the third decade of April. On the other hand, the wettest conditions were observed in May, when monthly totals were equal to 50–60 mm in the north, almost 90 mm in the central part of the region, and approximately 120 mm in the southern area. In June, dry conditions with monthly precipitation totals of 30–40 mm were observed (Figure 9). Furthermore, a period with more than 10 consecutive dry days was noticed this month. The deficit of precipitation started to appear in June, when the cumulative precipitation totals were lower than usual (Figure 9). It should also be noted that 2019 was the second consecutive year with the deficit.
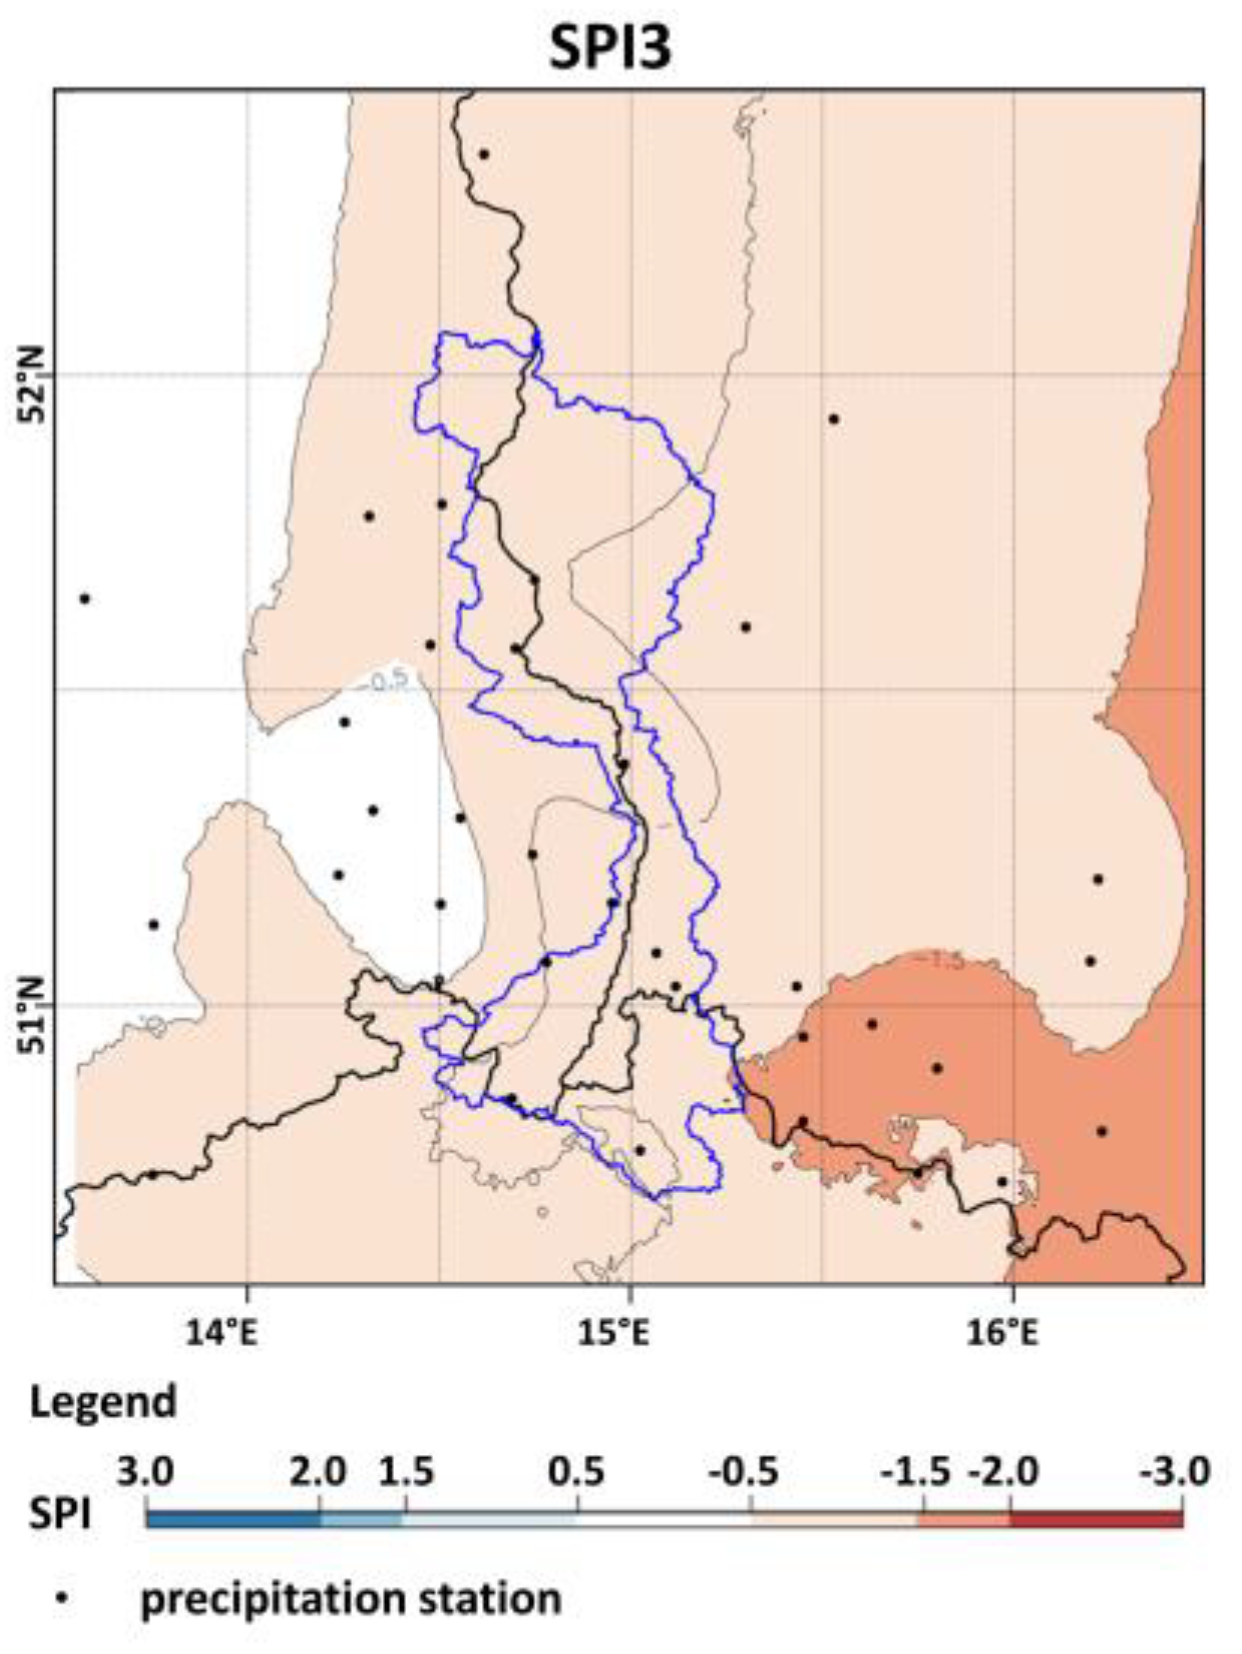
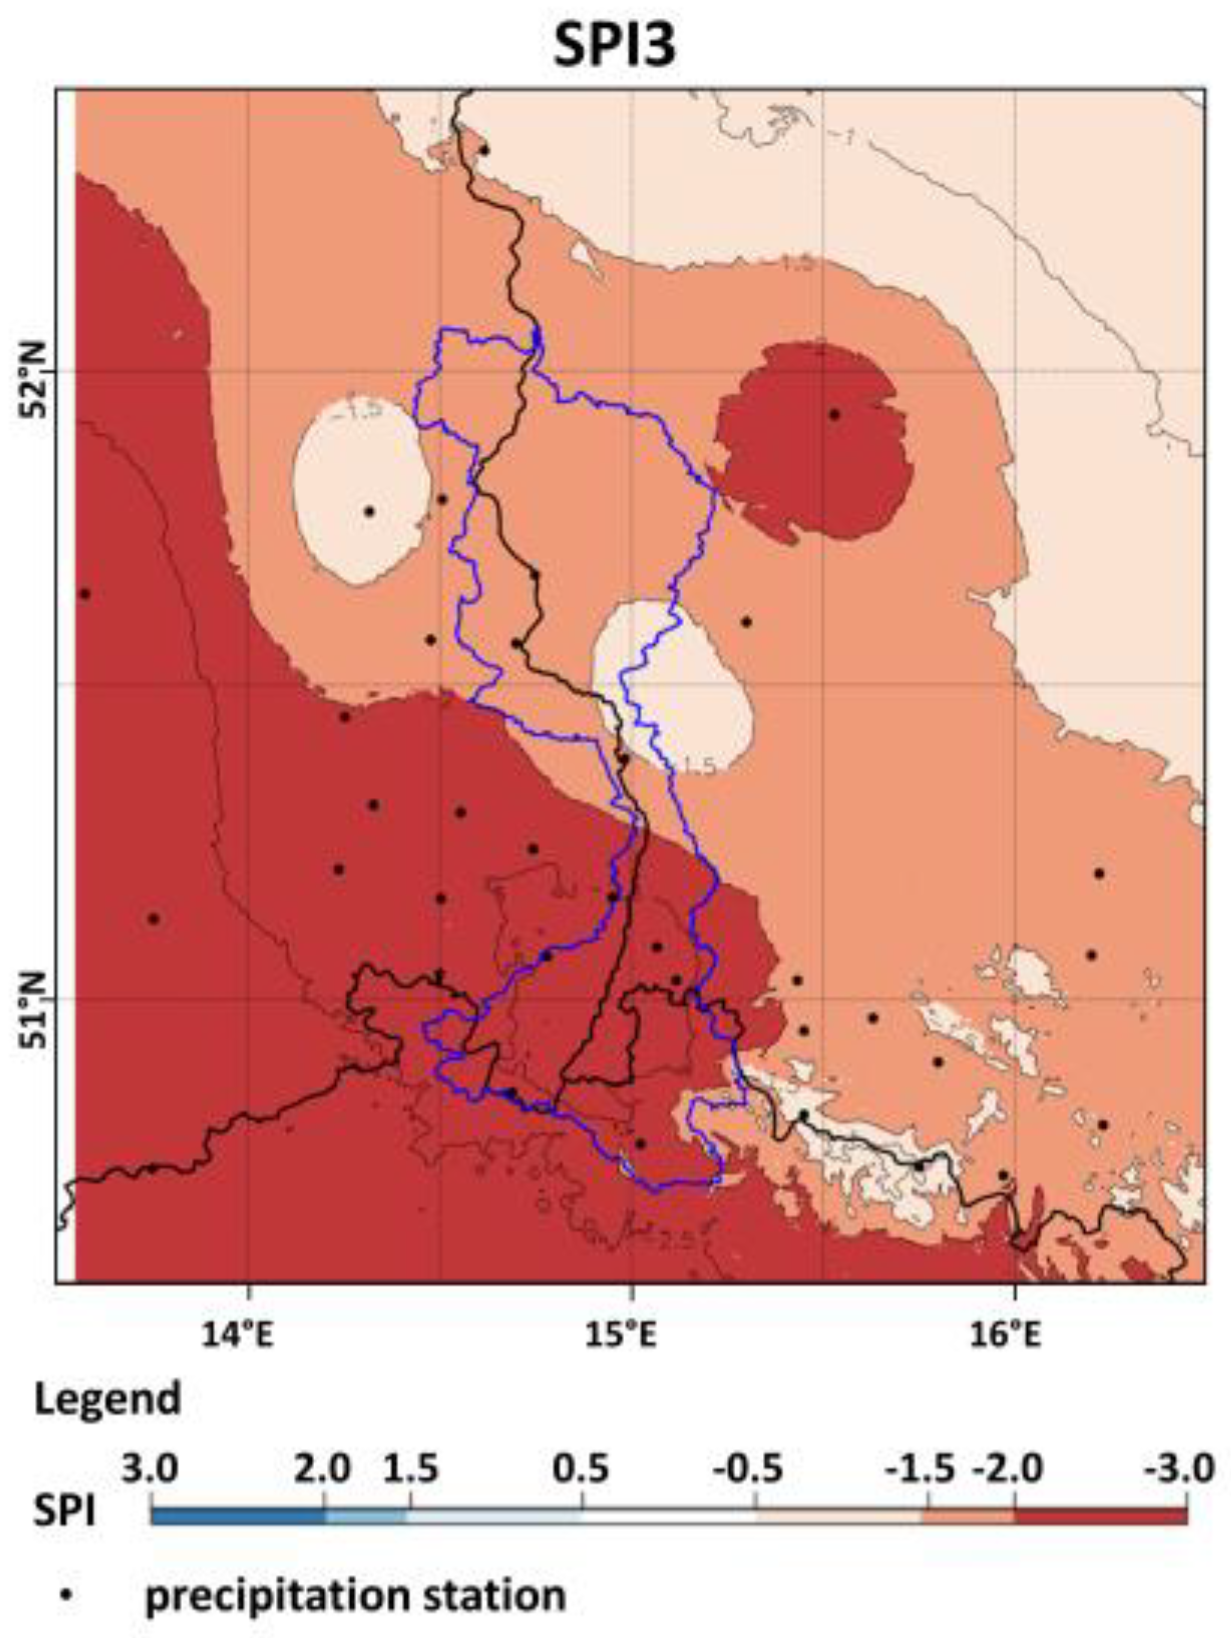
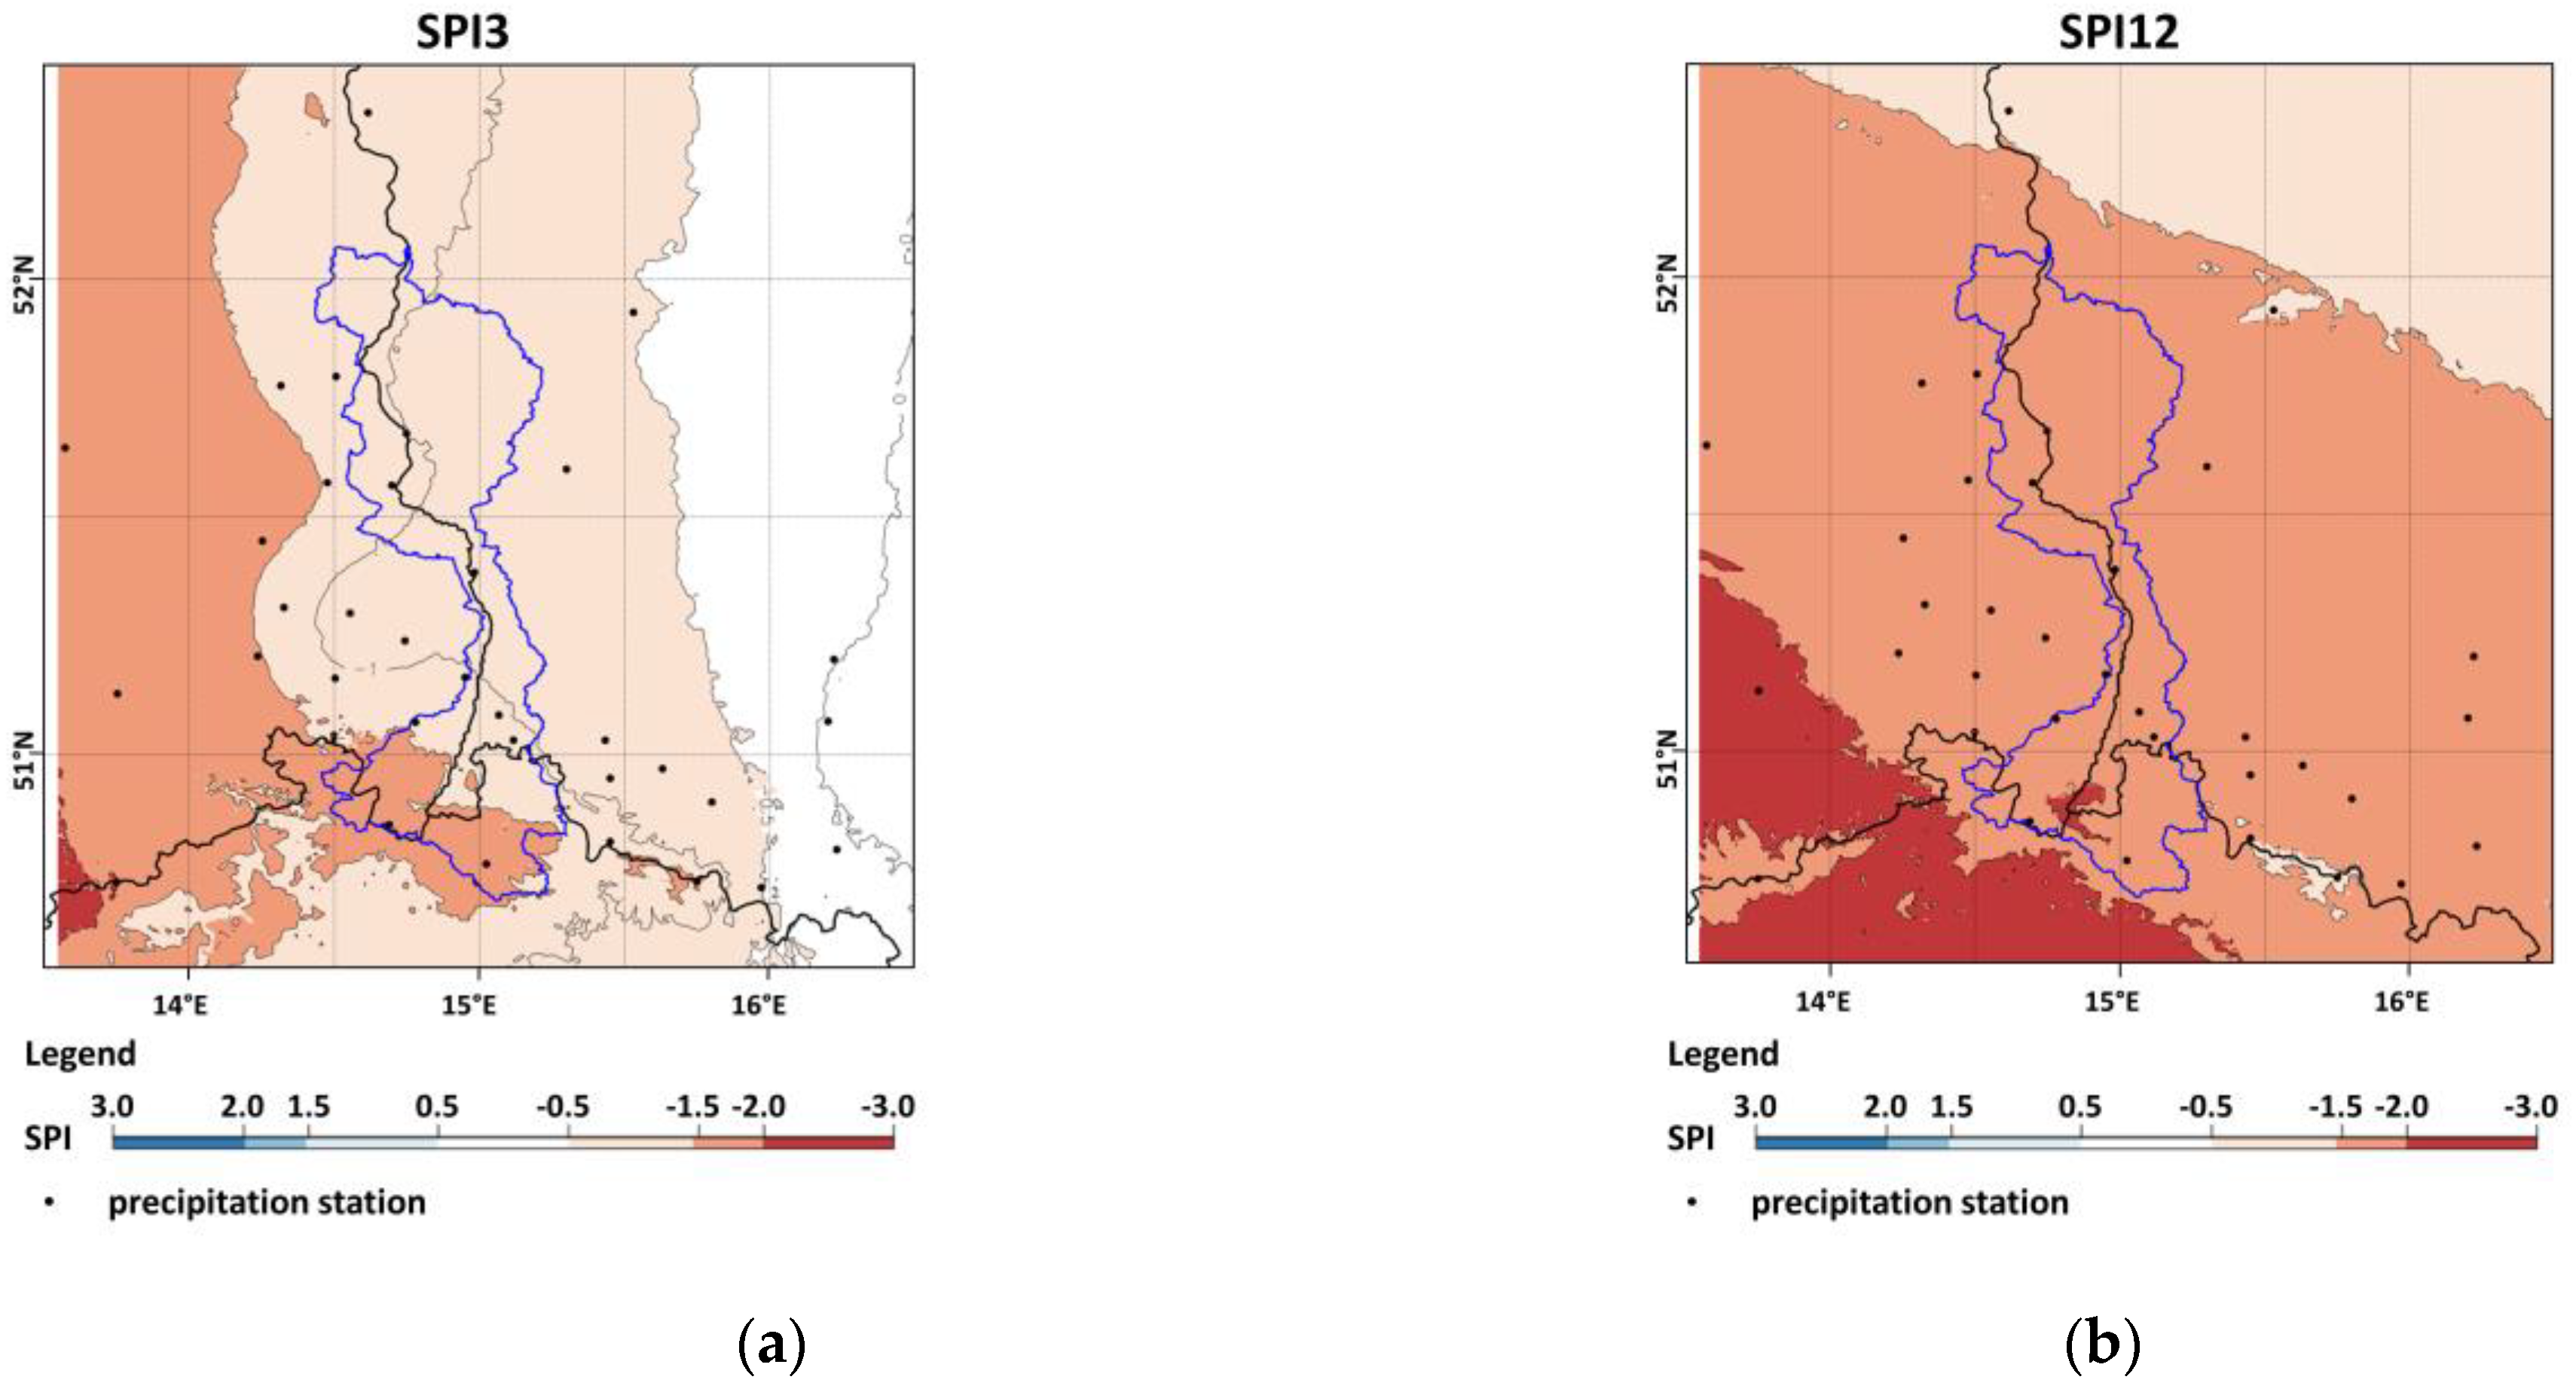
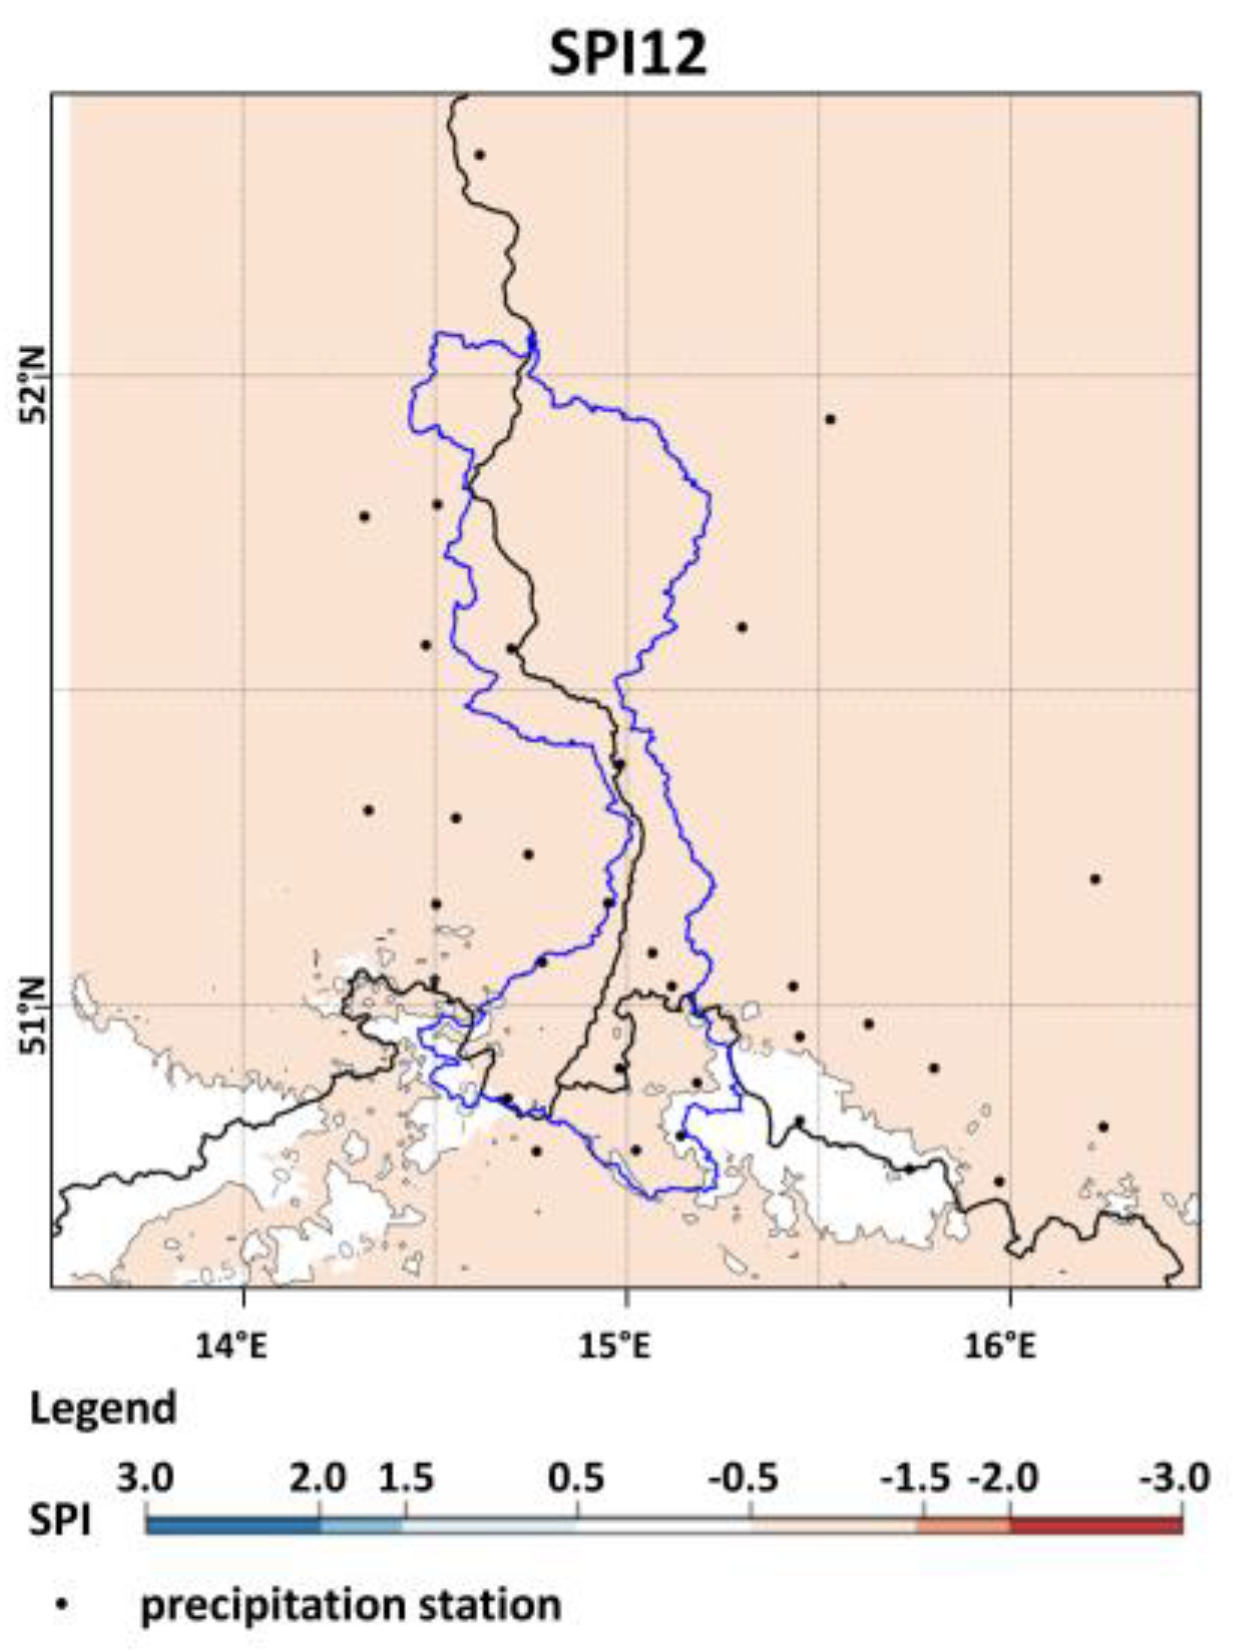
Meteorological conditions presented above contributed to the drought development in the Lusatian Neisse river catchment, which already started in spring 2018. The values of SPI3 at the end of May 2018 identified moderate drought for most of the region (Figure 10). In the following months, the meteorological drought became more intensive. The values of SPI3 for the end of August 2018 indicated extreme drought in the south/southwestern part of the region and severe drought in the remaining area (Figure 11). In autumn, the drought became less intensive. SPI3 for the end of November was adequate to moderate drought for most of the region, while the southern part was characterized by severe conditions. SPI12 for the end of December indicated conditions related to severe drought (Figure 12).
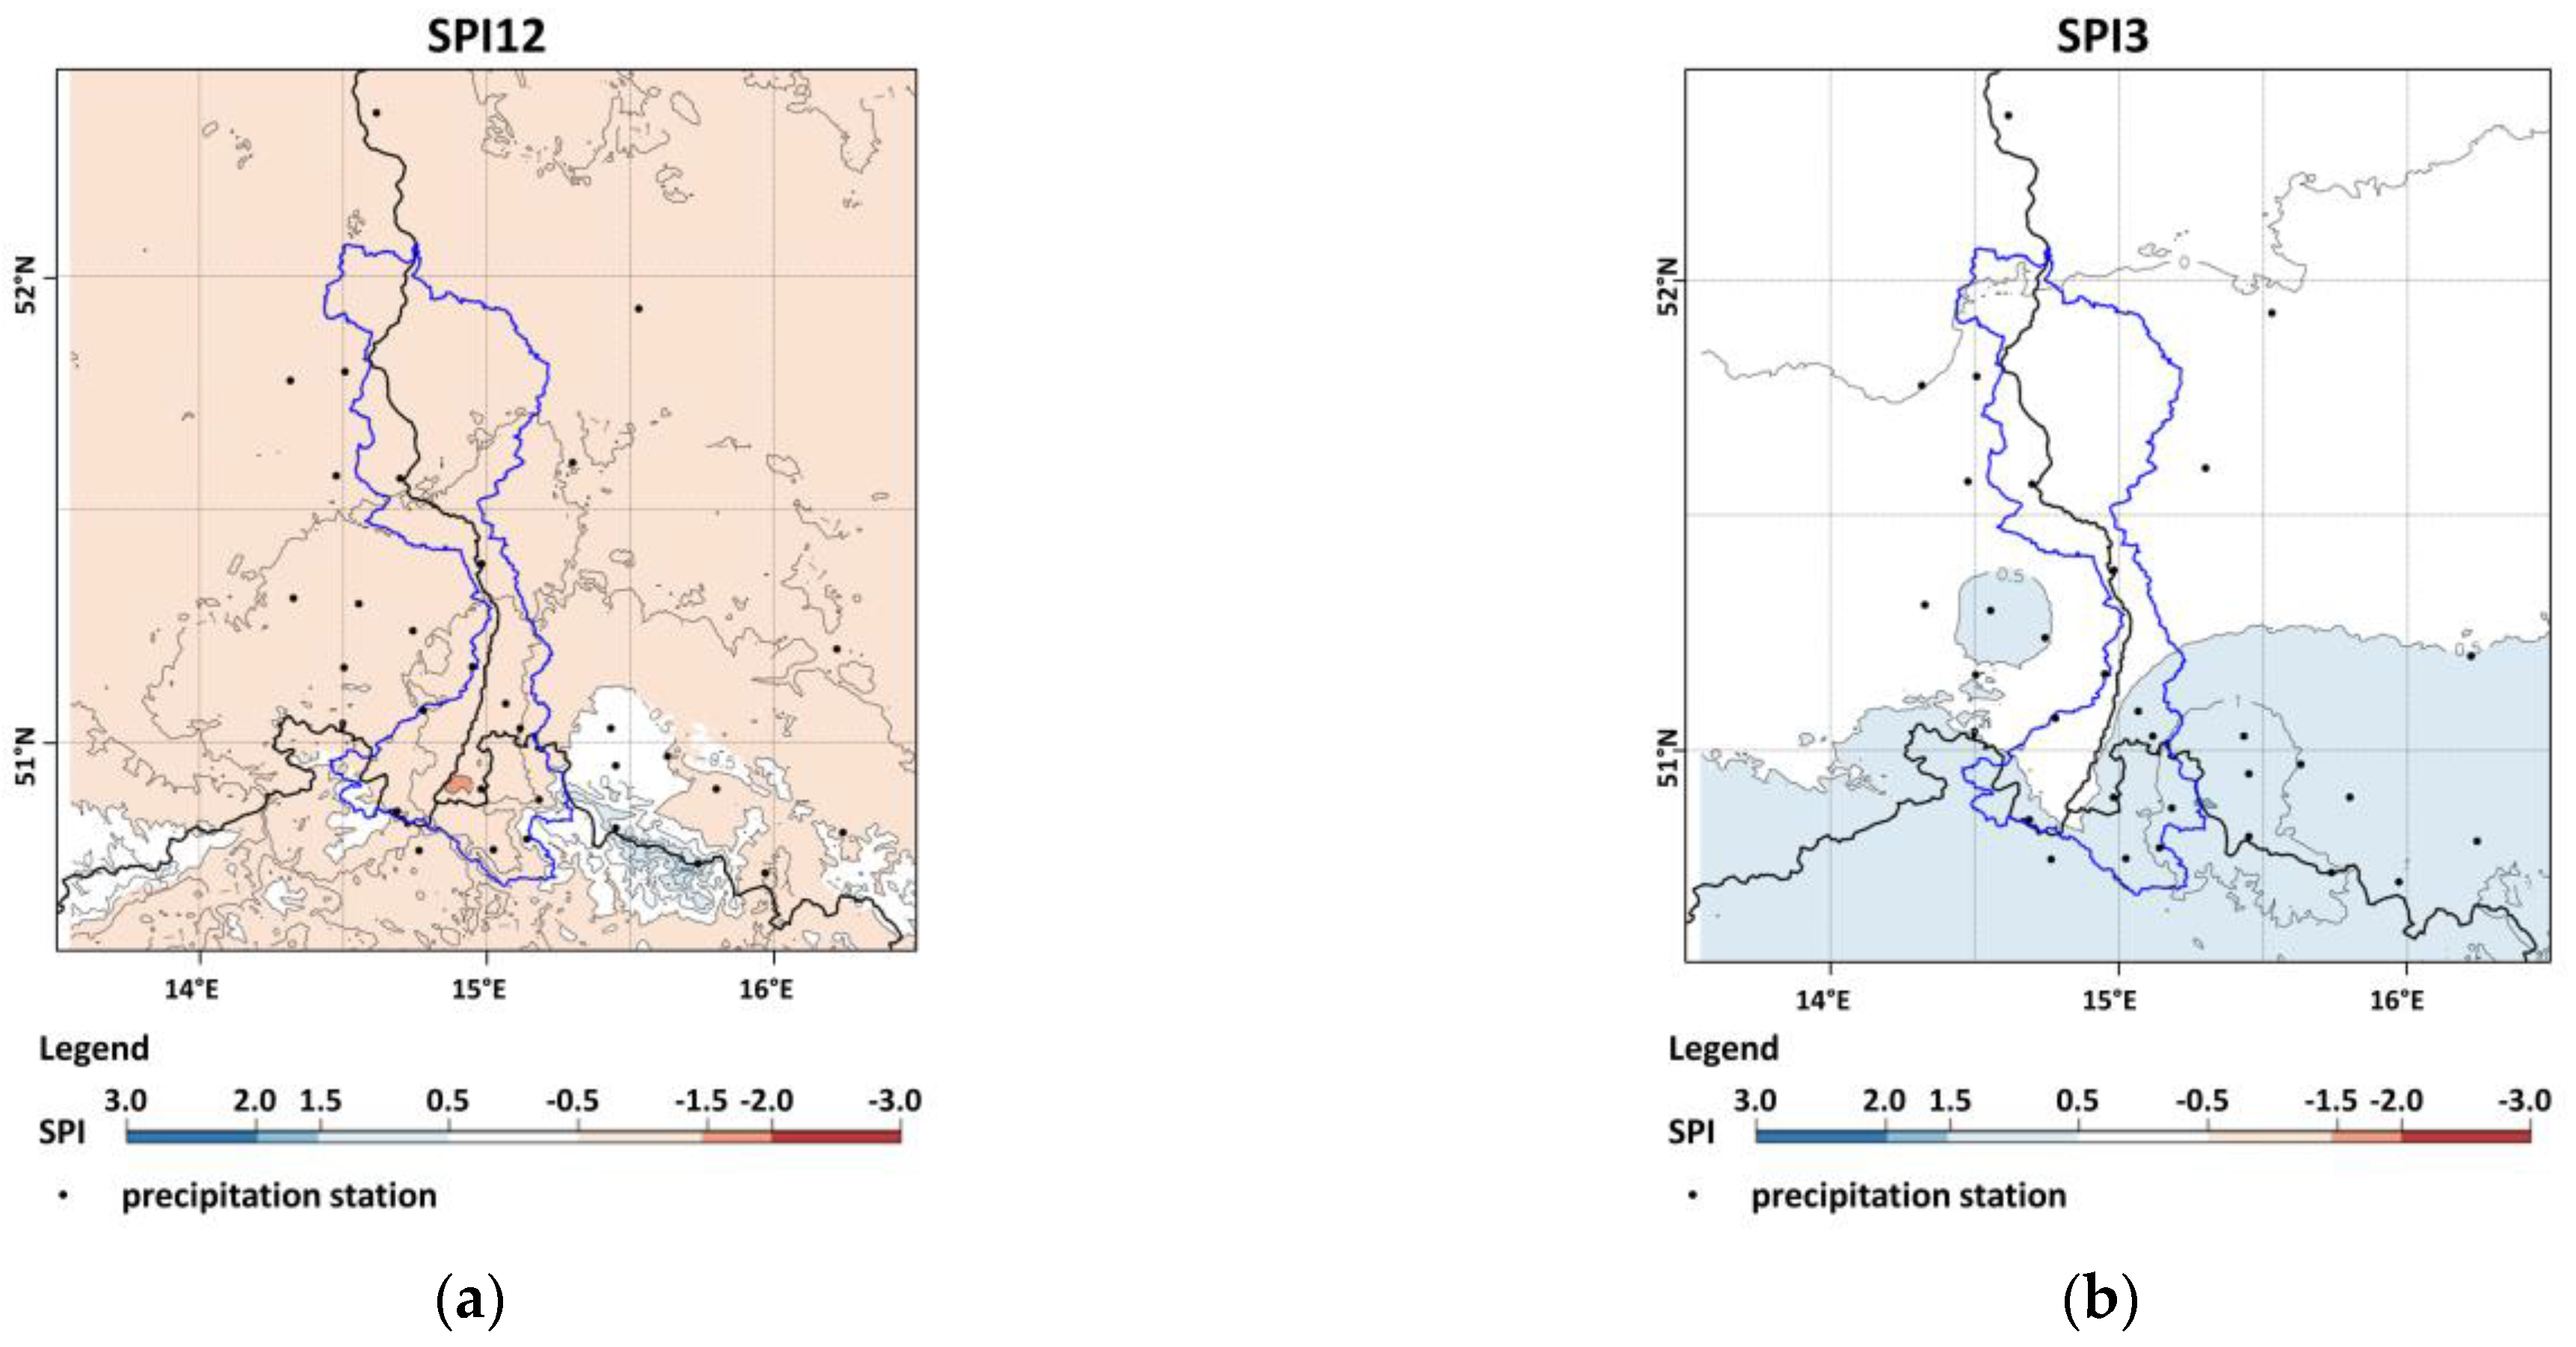
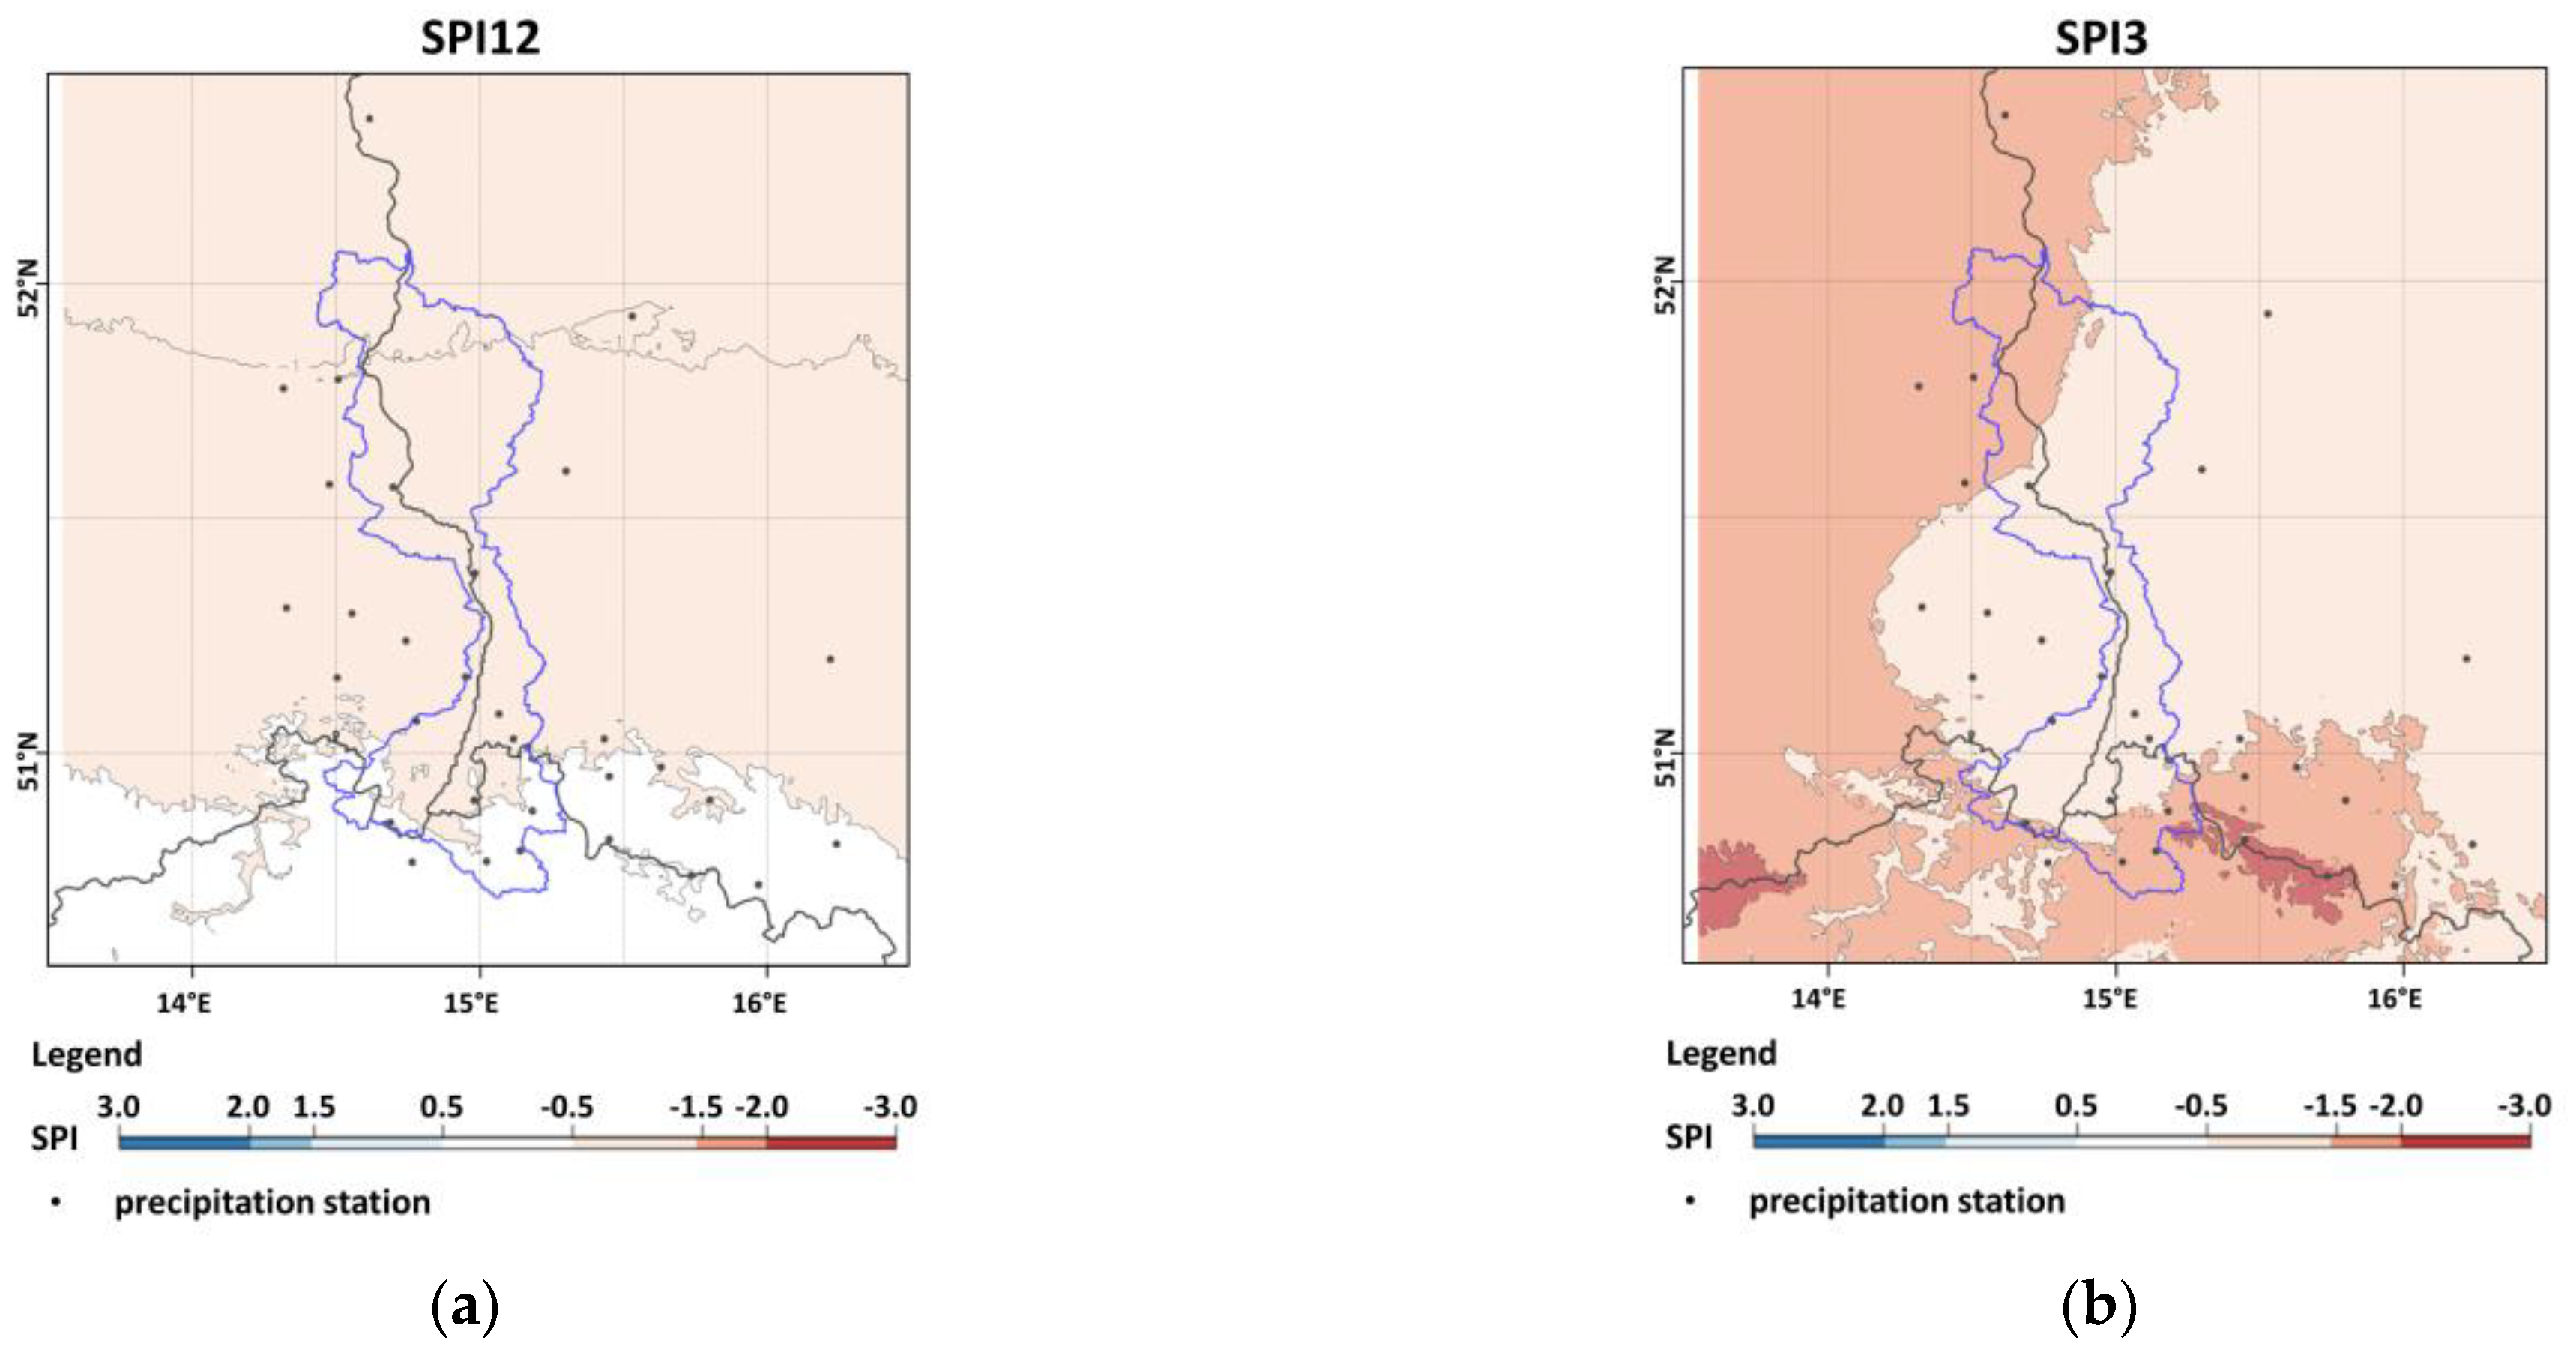
The winter season of 2018/2019 was wet and the index of SPI3 for its months (December–February) did not detect any drought conditions. However, the values of SPI for longer periods (SPI12) at the end of winter still indicated severe drought, especially in the southern part of the region (Figure 13). A similar situation took place several months later. No drought conditions were noticed in terms of SPI3 at the end of May, while SPI12 identified moderate drought (Figure 14). In the case of SPI3, severe drought was specified for the end of summer (August) (Figure 15). Furthermore, the values of SPI12 at the end of December 2019 identified moderate drought (Figure 16). It should also be noted that 2019 was the second consecutive year characterized by meteorological drought in the Lusatian Neisse river basin and its surrounding area.
In the case of SPEI, moderate drought, related to the 3-month scale, persisted from February to May 2018. In the following months, meteorological drought became more intensive. The values of SPEI3 in June and July indicated severe conditions, while extreme drought was noticed in August. In autumn, the drought became less intensive. In 2019, SPEI3 indicated dry conditions from June to the end of the year and even in January 2020. In the case of SPEI12, its values from July 2018 to December 2020 were negative. Severe drought was observed from August 2018 to August 2019 and in January 2020, while extreme drought occurred in November 2018 and from February to April 2019 (Figure 17).

4.4.2. Hydrological Drought

In 2018, the lowest discharges reached the following values: NQ = 0.93 m3/s in Porajów, NQ = 1.47 m3/s in Sieniawka (the lowest discharge in the entire 1981–2020 for this gauge), NQ = 2.31 m3/s in Zgorzelec (the lowest discharge in the multiannual period), and NQ = 3.22 m3/s in Przewóz. In 2019, the lowest discharges amounted to: NQ = 1.19 m3/s in Porajów, NQ = 1.83 m3/s in Sieniawka, NQ = 2.68 m3/s in Zgorzelec, and NQ = 4.06 m3/s in Przewóz.
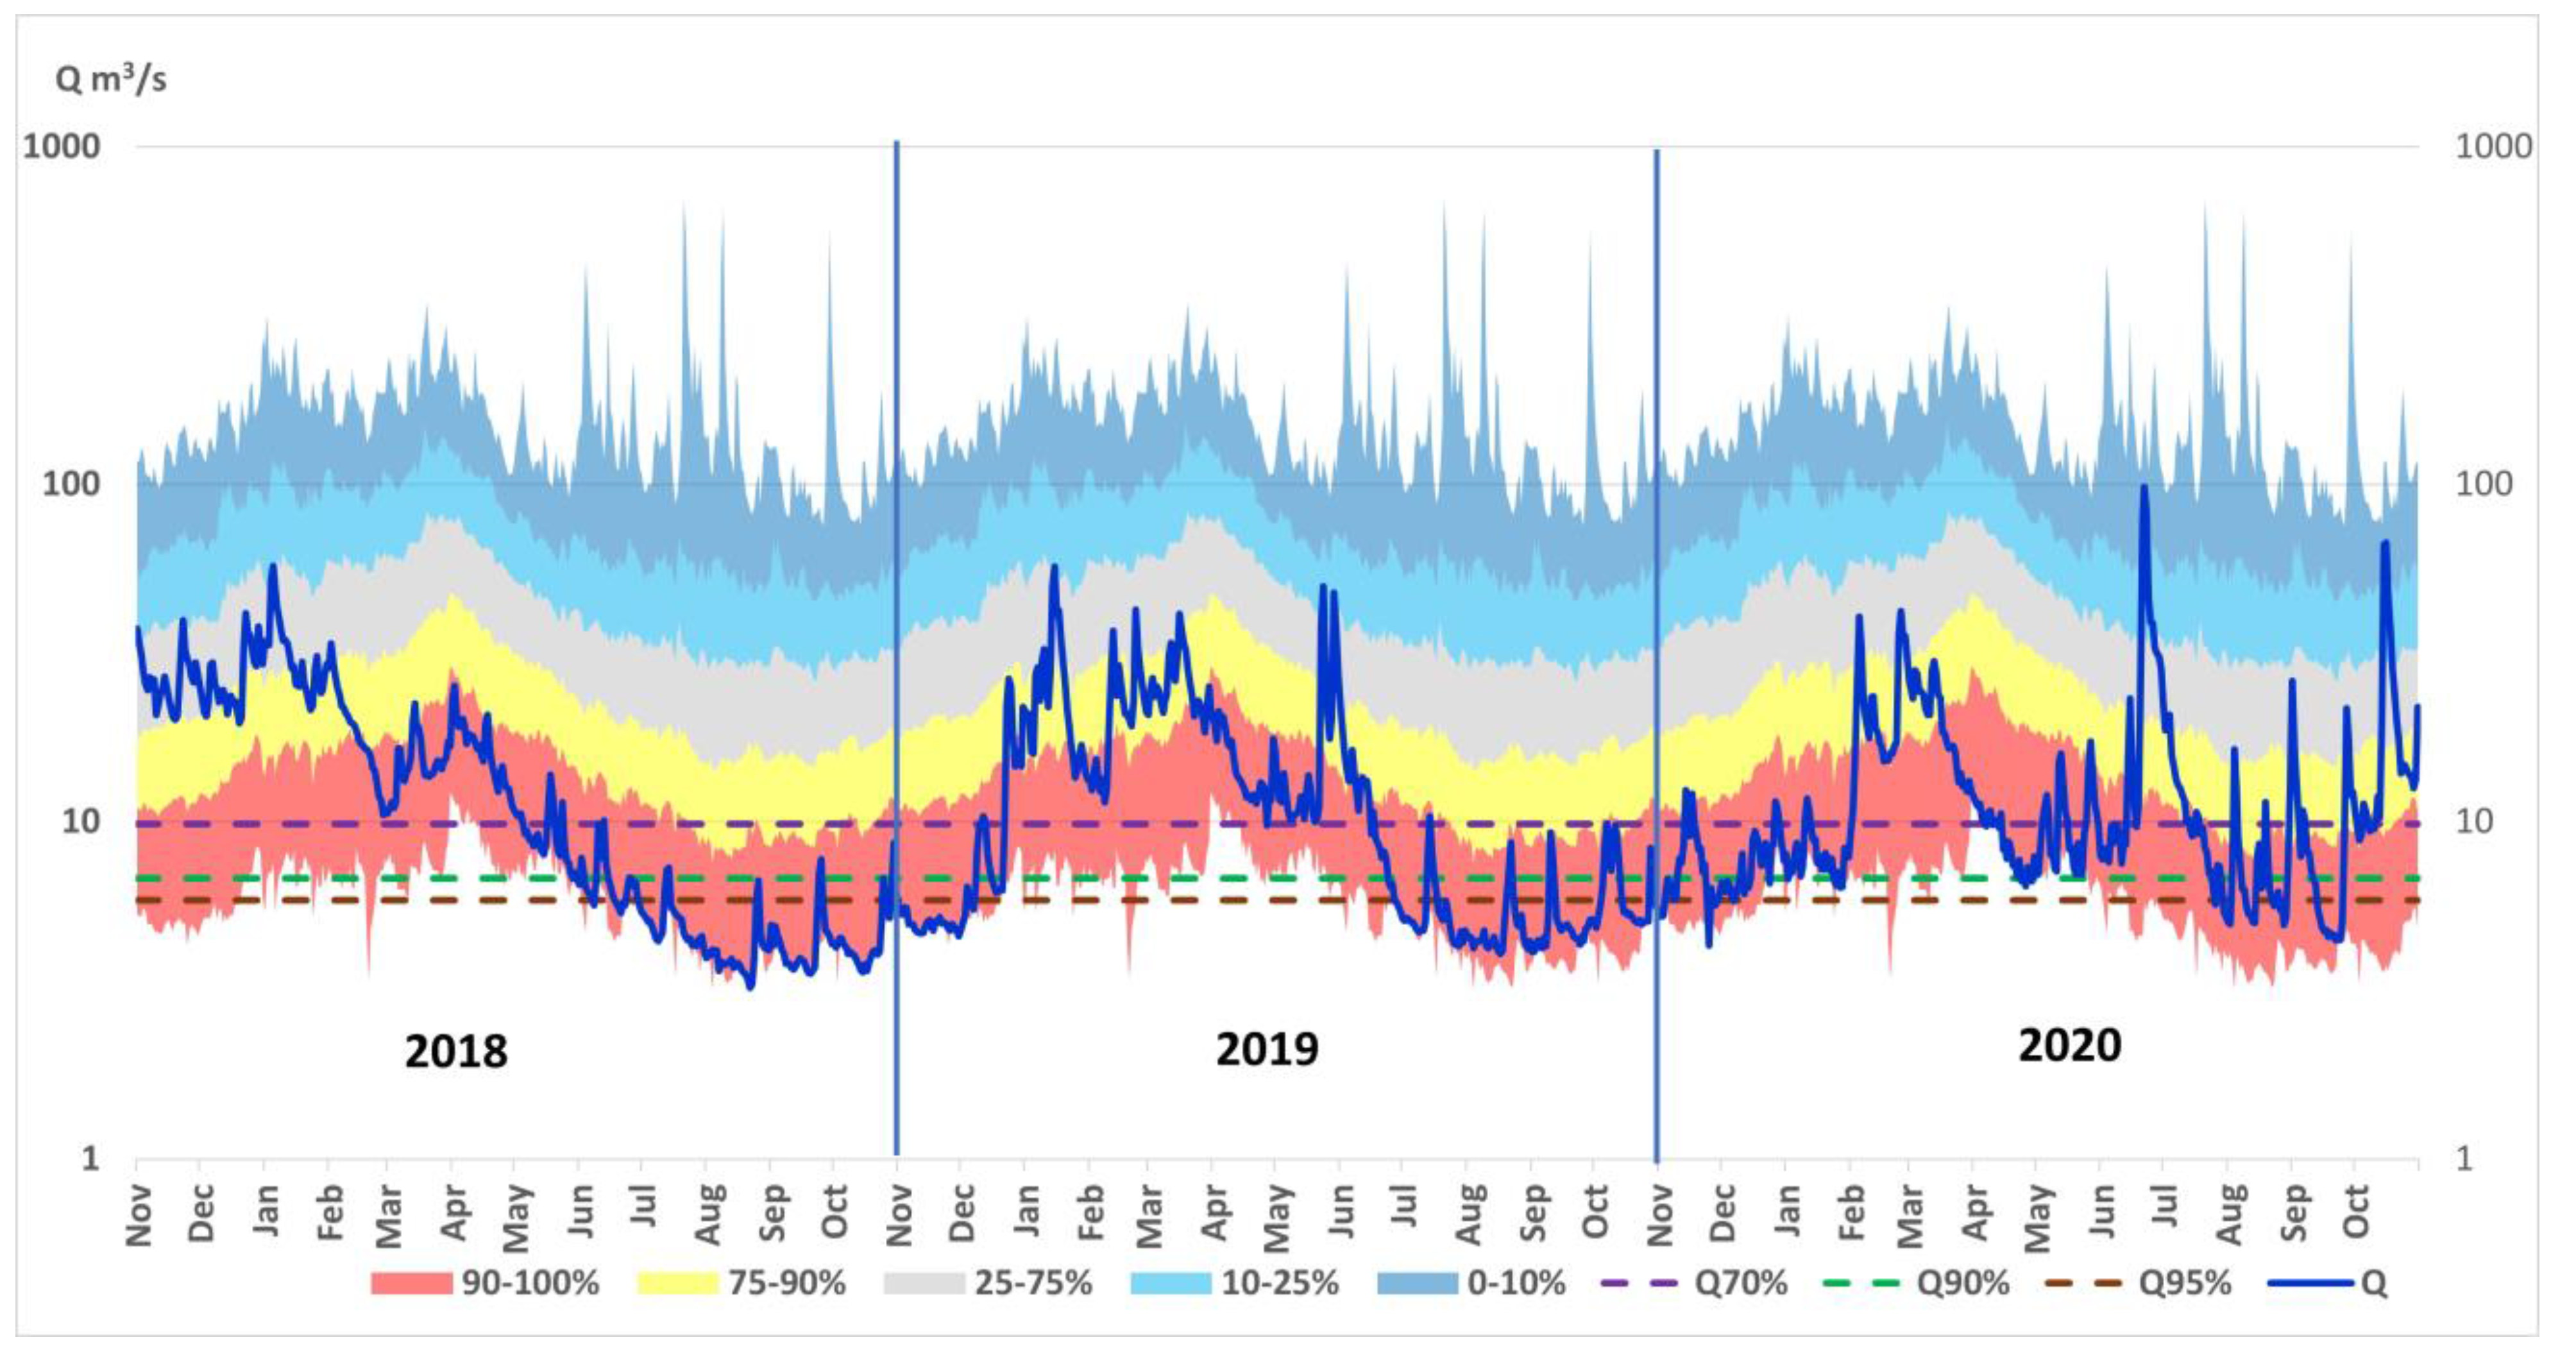
In the case of Przewóz (the last gauge in the analyzed catchment), discharge magnitude in 2018 and 2019 was mainly related to dry or very dry conditions (Figure 18). This resulted from specific thermal and precipitation conditions in these periods. In the beginning of hydrological year 2018, wet and very wet conditions were predominant. The situation changed in February, when less than 10% of the normal precipitation totals were observed. In this period, dry conditions prevailed, followed by a very dry phase from the end of April to the end of the hydrological year. In December 2018 and January 2019, precipitation totals exceeded the normal rate, which contributed to the increase in discharges. In the annual course, a very long dry period from the end of March to the second decade of April was also observed. The long-lasting deficit of precipitations started in June and contributed to dry and very dry conditions occurring in the catchment. Drought in the discussed region was still observed in the beginning of 2020 and ended in the first decade of February 2020 (Figure 18).
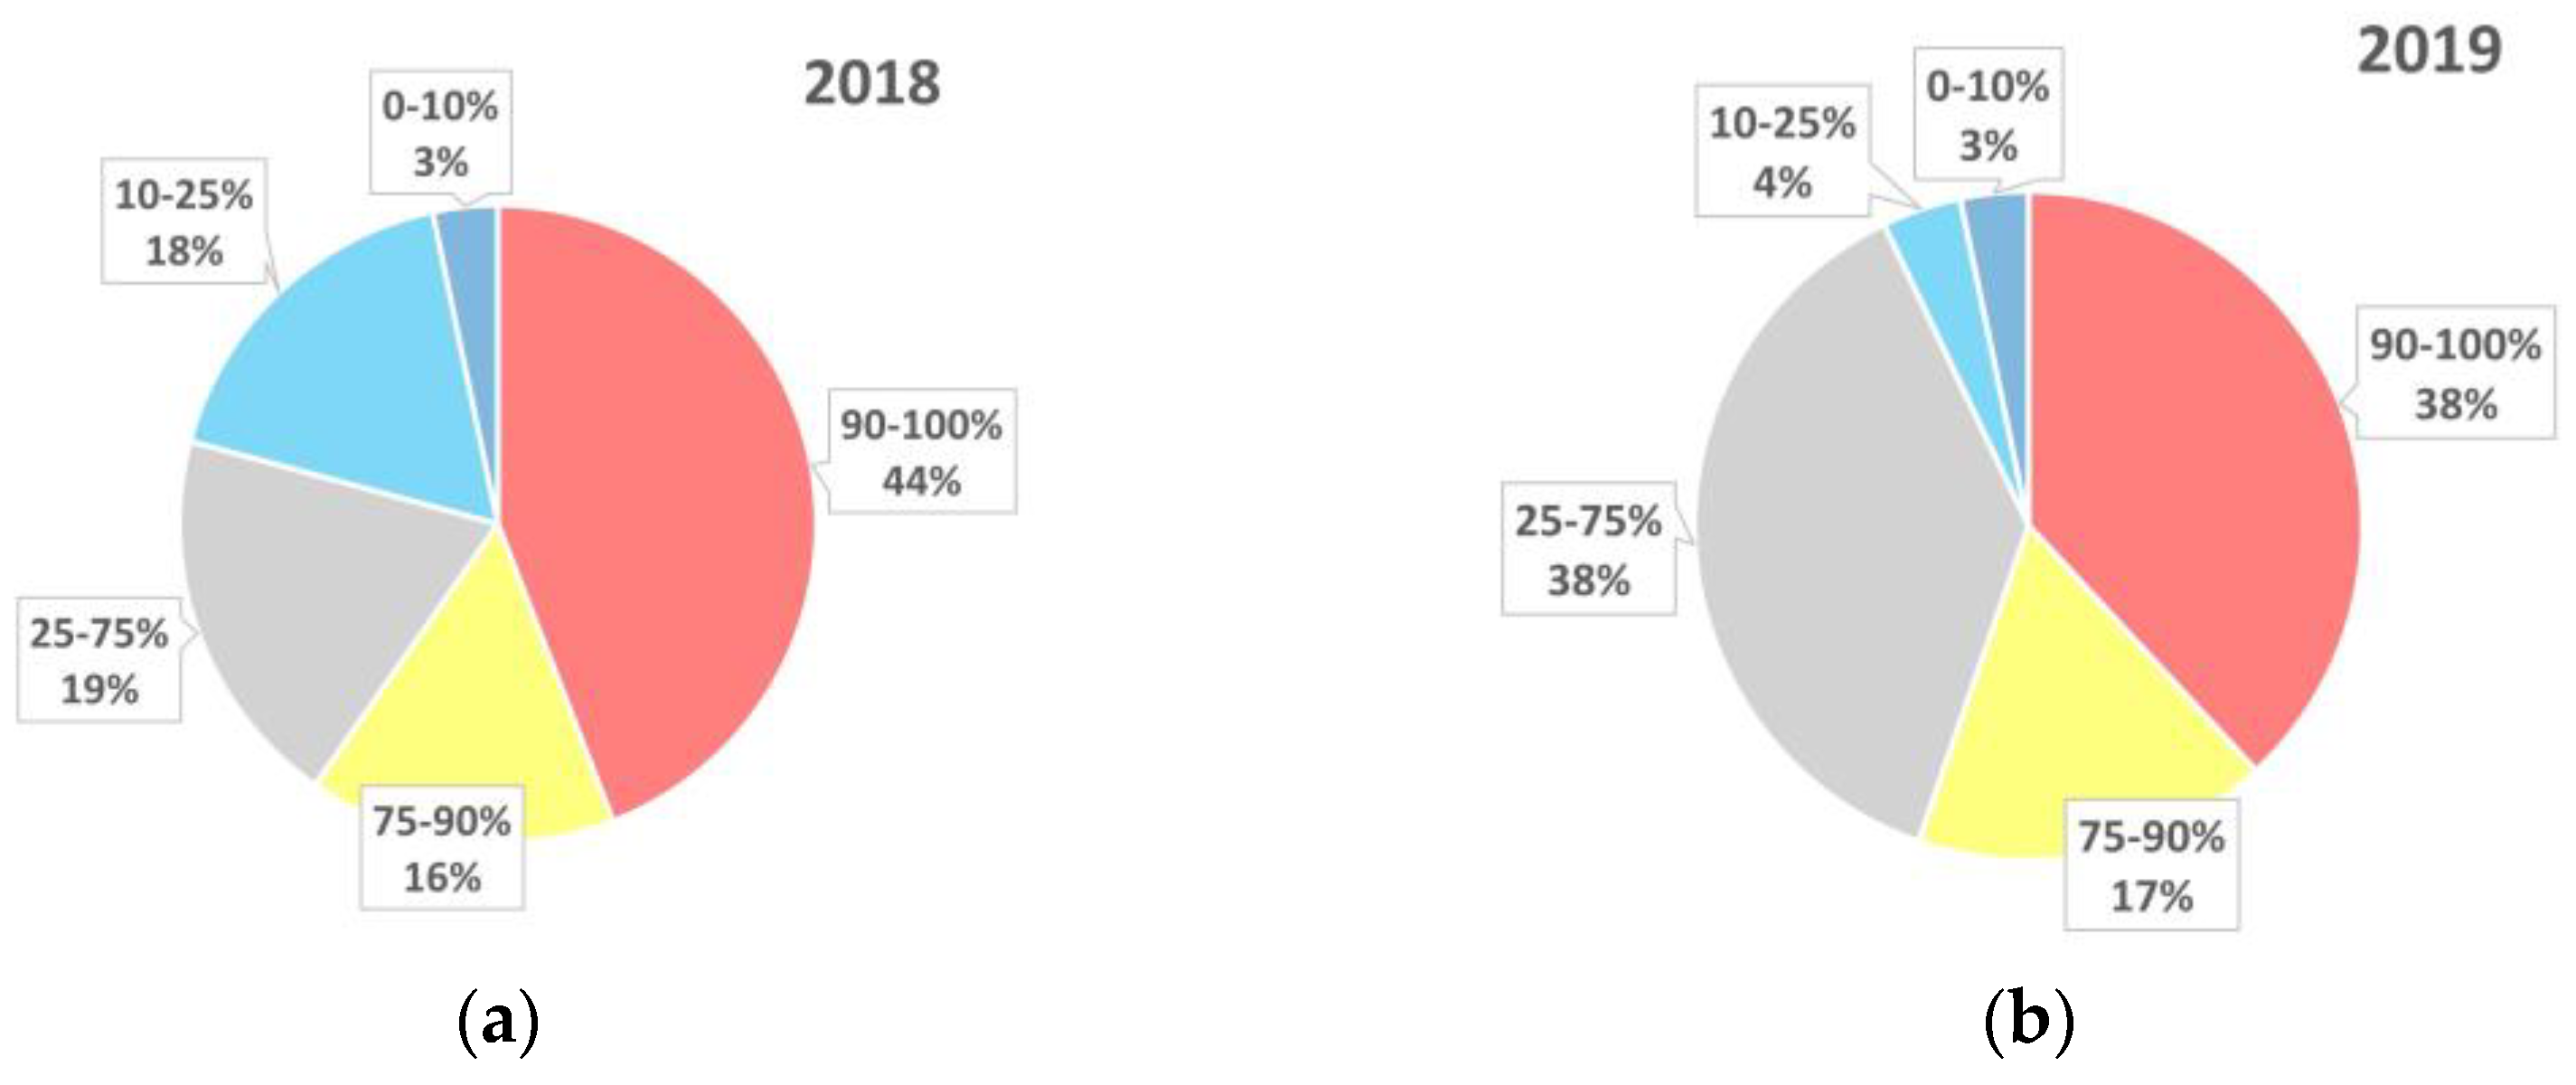
Considering the fraction of the dryness and wetness classes in the hydrological year 2018, very dry conditions were predominant. They were found for 44% of the discussed year, while the percentage of normal, wet, and dry conditions was similar—19%, 18%, and 16%, respectively. On the other hand, the frequency of very wet days reached just 3%, whereas the combined number of days with dry and very dry conditions amounted to 60%. In the hydrological year 2019, the highest frequency was observed for both very dry and normal conditions (38% each). Dry conditions occurred on 17% of days, while the percentage of wet and very wet days reached 4% and 3%, respectively. As a result, only 7% of days were characterized by discharges higher than the normal rate (Figure 19).
Based on the principles defining low flows, the longest low flow period (244 days) was noticed in 2018 in Sieniawka. The most significant deficit, reaching 86 million m3, was calculated for the gauge of Przewóz and occurred during the low flow episode in 6 May 2018–22 December 2019. In the case of the other water gauges, the low flow periods were slightly shorter and their duration exceeded 200 days in both 2018 and 2019. All the gauges were also characterized by very long periods of severe (148–205 days) and extreme hydrological drought (71–183 days) as shown in (Table 2).
The changes in hydrological conditions also contributed to the modification of water quality in the river. Such a situation could be observed in Żarki Wielkie (the station belongs to the State Environmental Monitoring), which is located below the water gauge of Przewóz. The most significant changes were noticed in 2019 and concerned the concentration of nitrate nitrogen, nitrite nitrogen, total nitrogen, total solid, sulphate, and chlorides. These changes followed the hydrological droughts of 2018 and 2019. A similar process also took place after the drought of 2015. However, because of a higher range of the 2018 drought, more significant changes in the selected indices of water quality could be observed in this case. In 2020, water quality was already characterized by good or very good conditions (Table 3).
The reaction of the river ecosystem to weather conditions can be also assessed based on the diatoms phytobenthos. In these terms, the diatom index is recommended for the evaluation of ecological state of waters in Poland. There are located numerous measuring sites in the discussed area (Bielawa, Sanice, Potok, Siedlec, and Olszyna), where this index can be assessed. In 2018, the diatom index at two sites classified water quality in the second class (Bielawa, Sanice), while in 2019, the index indicated the additional deterioration in Sanice (from the second to the third class) and Olszyna (from the first to the second class). In 2020, the first class of water quality was already observed at all the considered sites (Table 4).

4.5. The Influence of Drought on the Selected Economic Sectors

In 2018–2019, more than 50% of Central Europe was affected by drought, which had a serious consequence for numerous sectors related to economy, society, and biodiversity [56,64,65,66,67,68].
Regarding drought influence, agriculture is the most vulnerable sector [89,90,91,92,93,94,95]. The statistics show that mean yield reduction caused by droughts can reach as much as 50% [96]. Such losses were noticed in the extremely dry years (i.e., 1992, 2000), when meteorological drought affected most of Central Europe [97].
According to the statistics of Poland [96], a reduction in yield rate was noticed in both 2018 and 2019. The most significant decrease was observed in 2018 in the Lubuskie voivodeship, located in west Poland. In this case, yield reduction reached about 33% for corn (grain) and 27% for oats, if compared to the mean yield in 1999–2020. A slightly lower decrease was found for wheat (approximately 20%), colza (18%), and for cereals in general (approximately 17%). Yield rates concerning potatoes, permanent meadows, and grassland were comparable to the mean multiannual values. In the Lower Silesia (Dolnośląskie voivodeship, southwest Poland), yield reduction was less distinctive and amounted to 15% for meadows. The remaining crops in this voivodeship were characterized by rates similar to the mean values for 1999–2020. In 2019, the reduction was lower than for 2018. The decrease in corn grain, oats, potatoes, and wheat in the Lubuskie voivodeship reached 22%, 14%, 13%, and 9%, respectively. In the southern part, the most significant reduction was noticed for permanent grassland, meadows, and potatoes (17%, 12%, and 10%, respectively). Corn grain yields decreased by about 5%, while the other crops reached the values typical for the entire 1999–2020 period (Figure 20).
Energy generated by hydropower plants is considered as one of the most important sectors in Europe affected by droughts [98]. The problem of the influence of drought on water energy generation was considered in numerous studies [99,100,101]. In total, there are nine hydropower plants operating in the upper and middle sections of the Lusatian Neisse river.
Based on the data related to discharges rates, mean annual potential energy generation was calculated for eleven hydropower plants (three Polish and eight German facilities) located on the Lusatian Neisse river. The calculation concerned the reference period (1981–2010) and 2018–2019. The energy generated by hydropower plants depends on the difference in water levels before and behind the turbines, the turbine’s gullet, and the efficiency of the turbines, transmission, and generator. In this analysis, technical exploitation data for power plants were considered. This was presented in the study devoted to the water–economy balance of the Lusatian Neisse river [102].
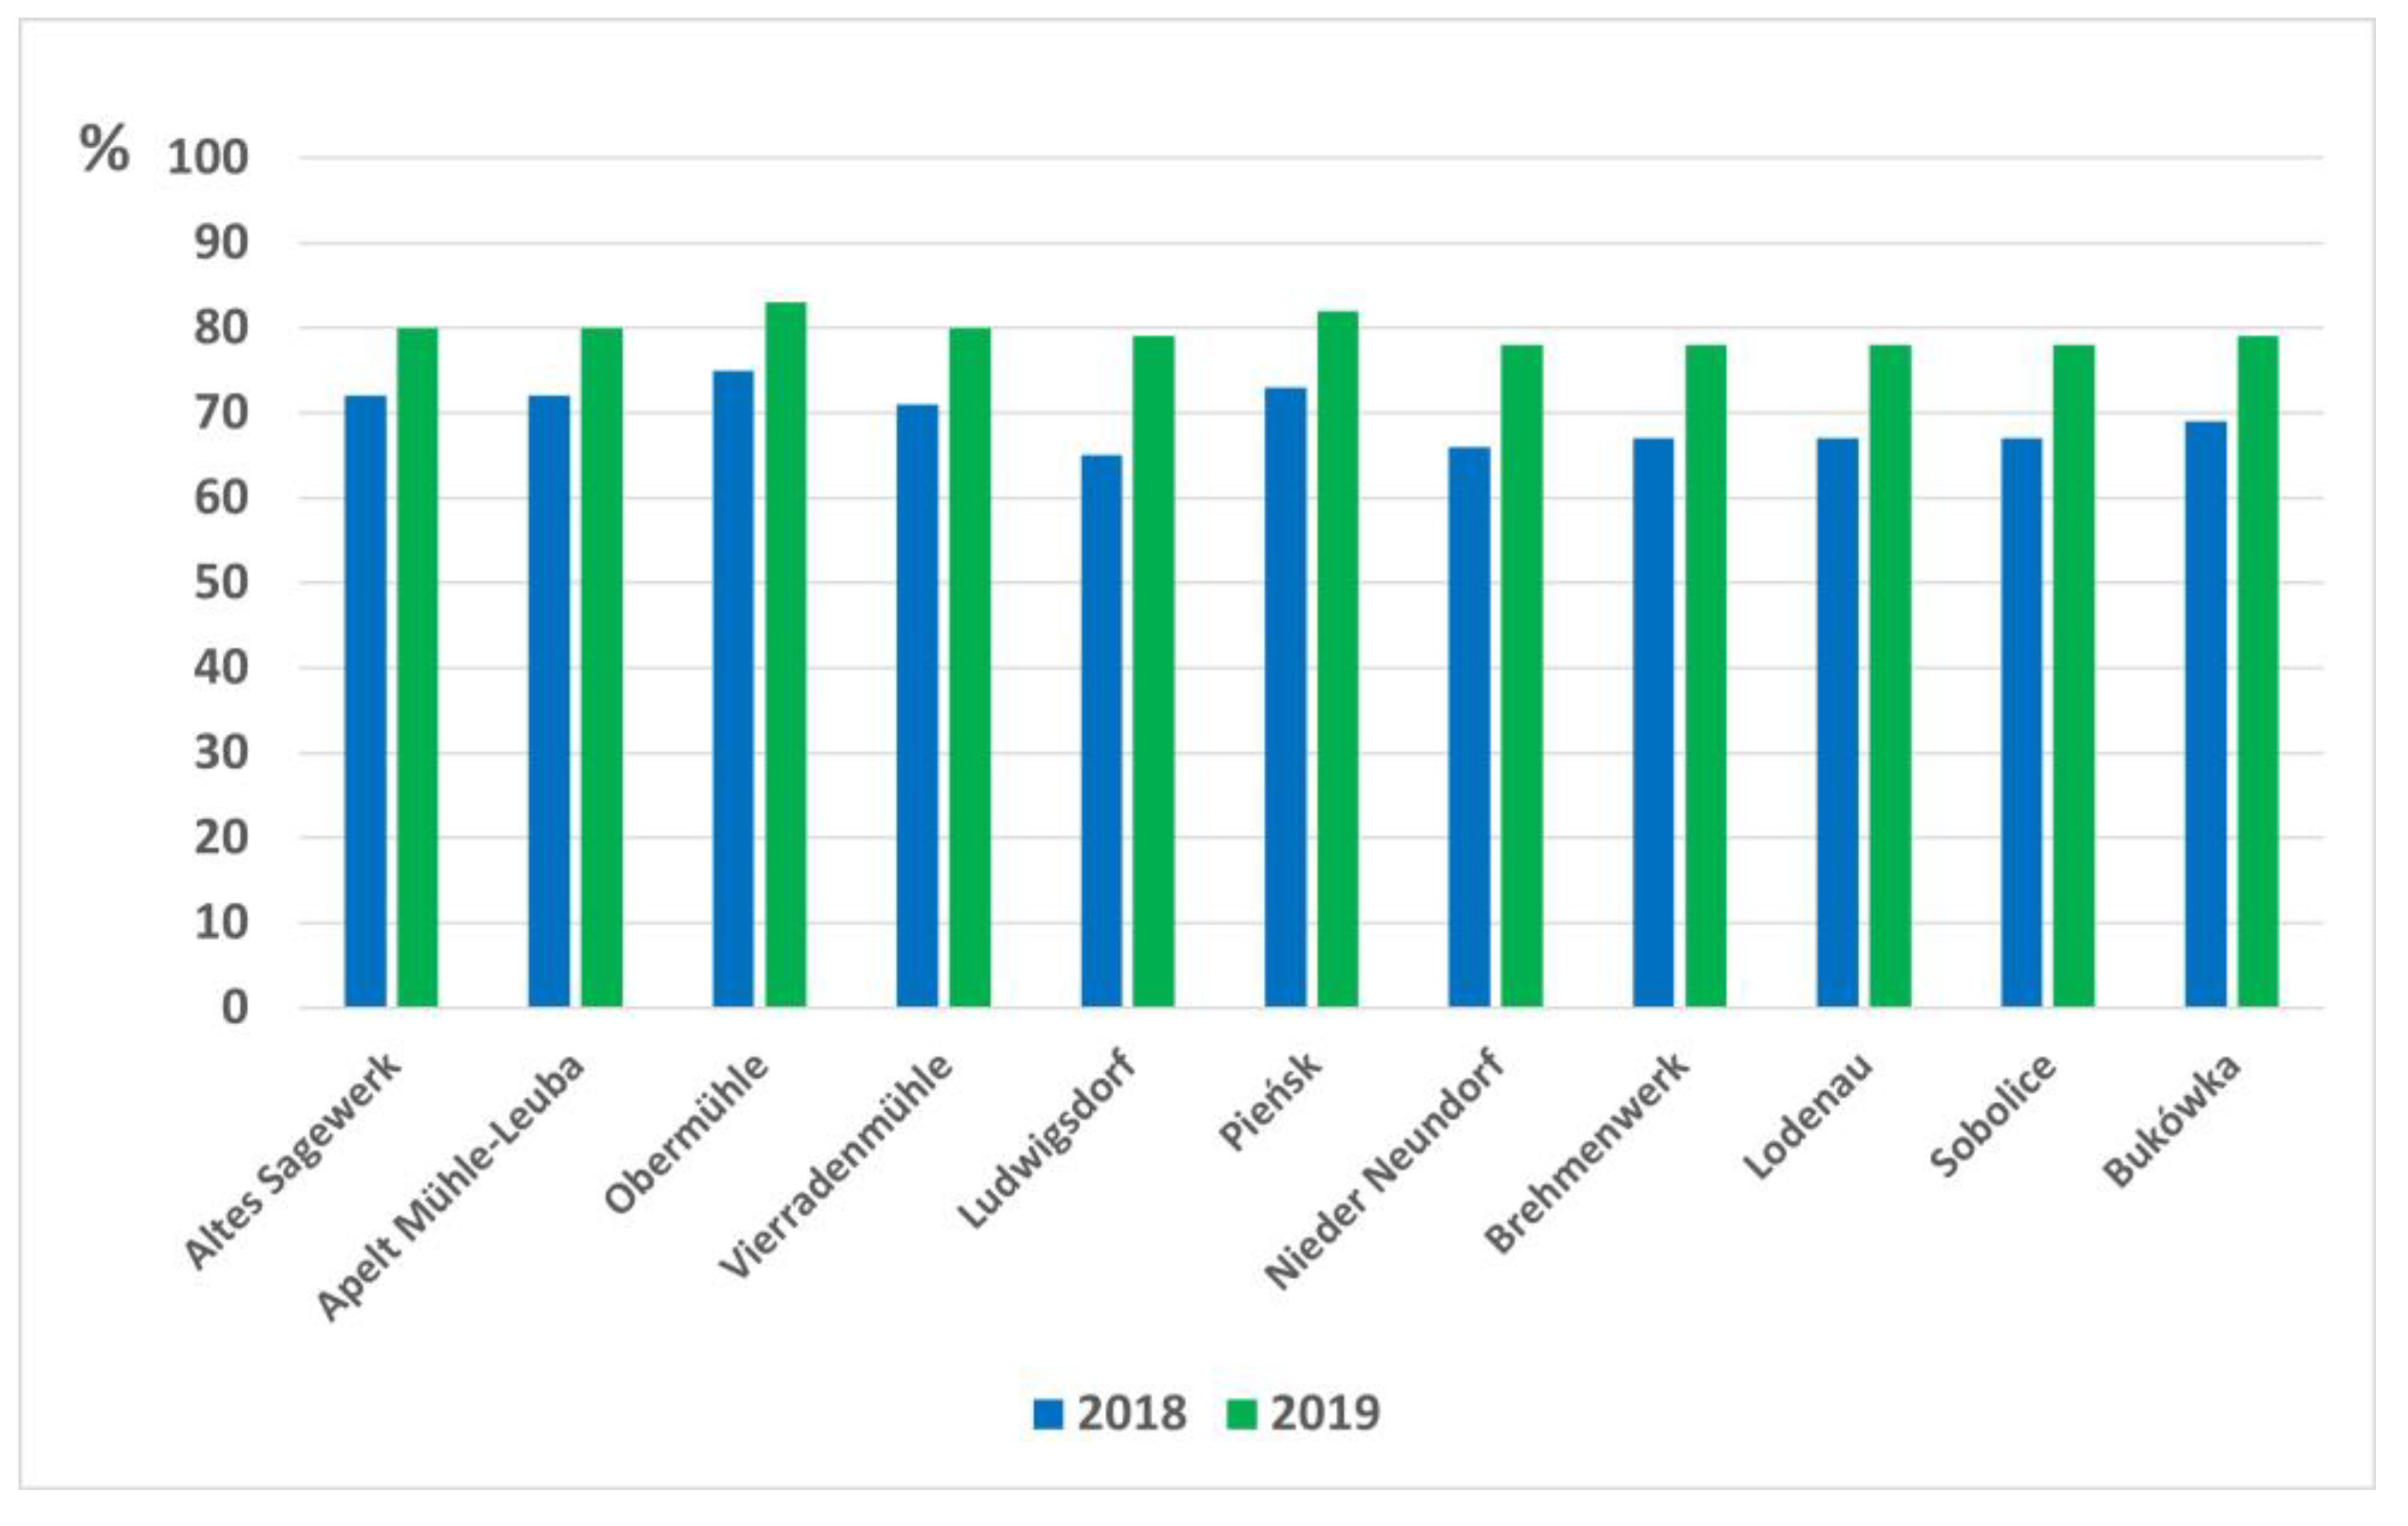
The results of the calculations indicate the reduction in energy generated by hydropower plants in 2018 and 2019 if compared to the mean rates for the reference period. Figure 21 shows that the energy production in these years was significantly lower than for 1981–2010. In 2018, only 65–75% of the total potential energy could be generated by the plants. The lowest rates were noticed for the hydropower plants in Ludwigsdorf (65%) and Nieder-Neundorf (66%). In 2019, hydrological conditions allowed for higher production, reaching 78–83% of the mean value for the reference period. The lowest generation rate (78%) was observed for the plants of Nieder-Neundorf, Brehmenwerk, Lodenau, and Sobolice.
Considering all the hydropower plants, the total loss in energy generation in 2018 and 2019 (if compared to the reference period) reached 9314 MWh and 6162 MWh, respectively.
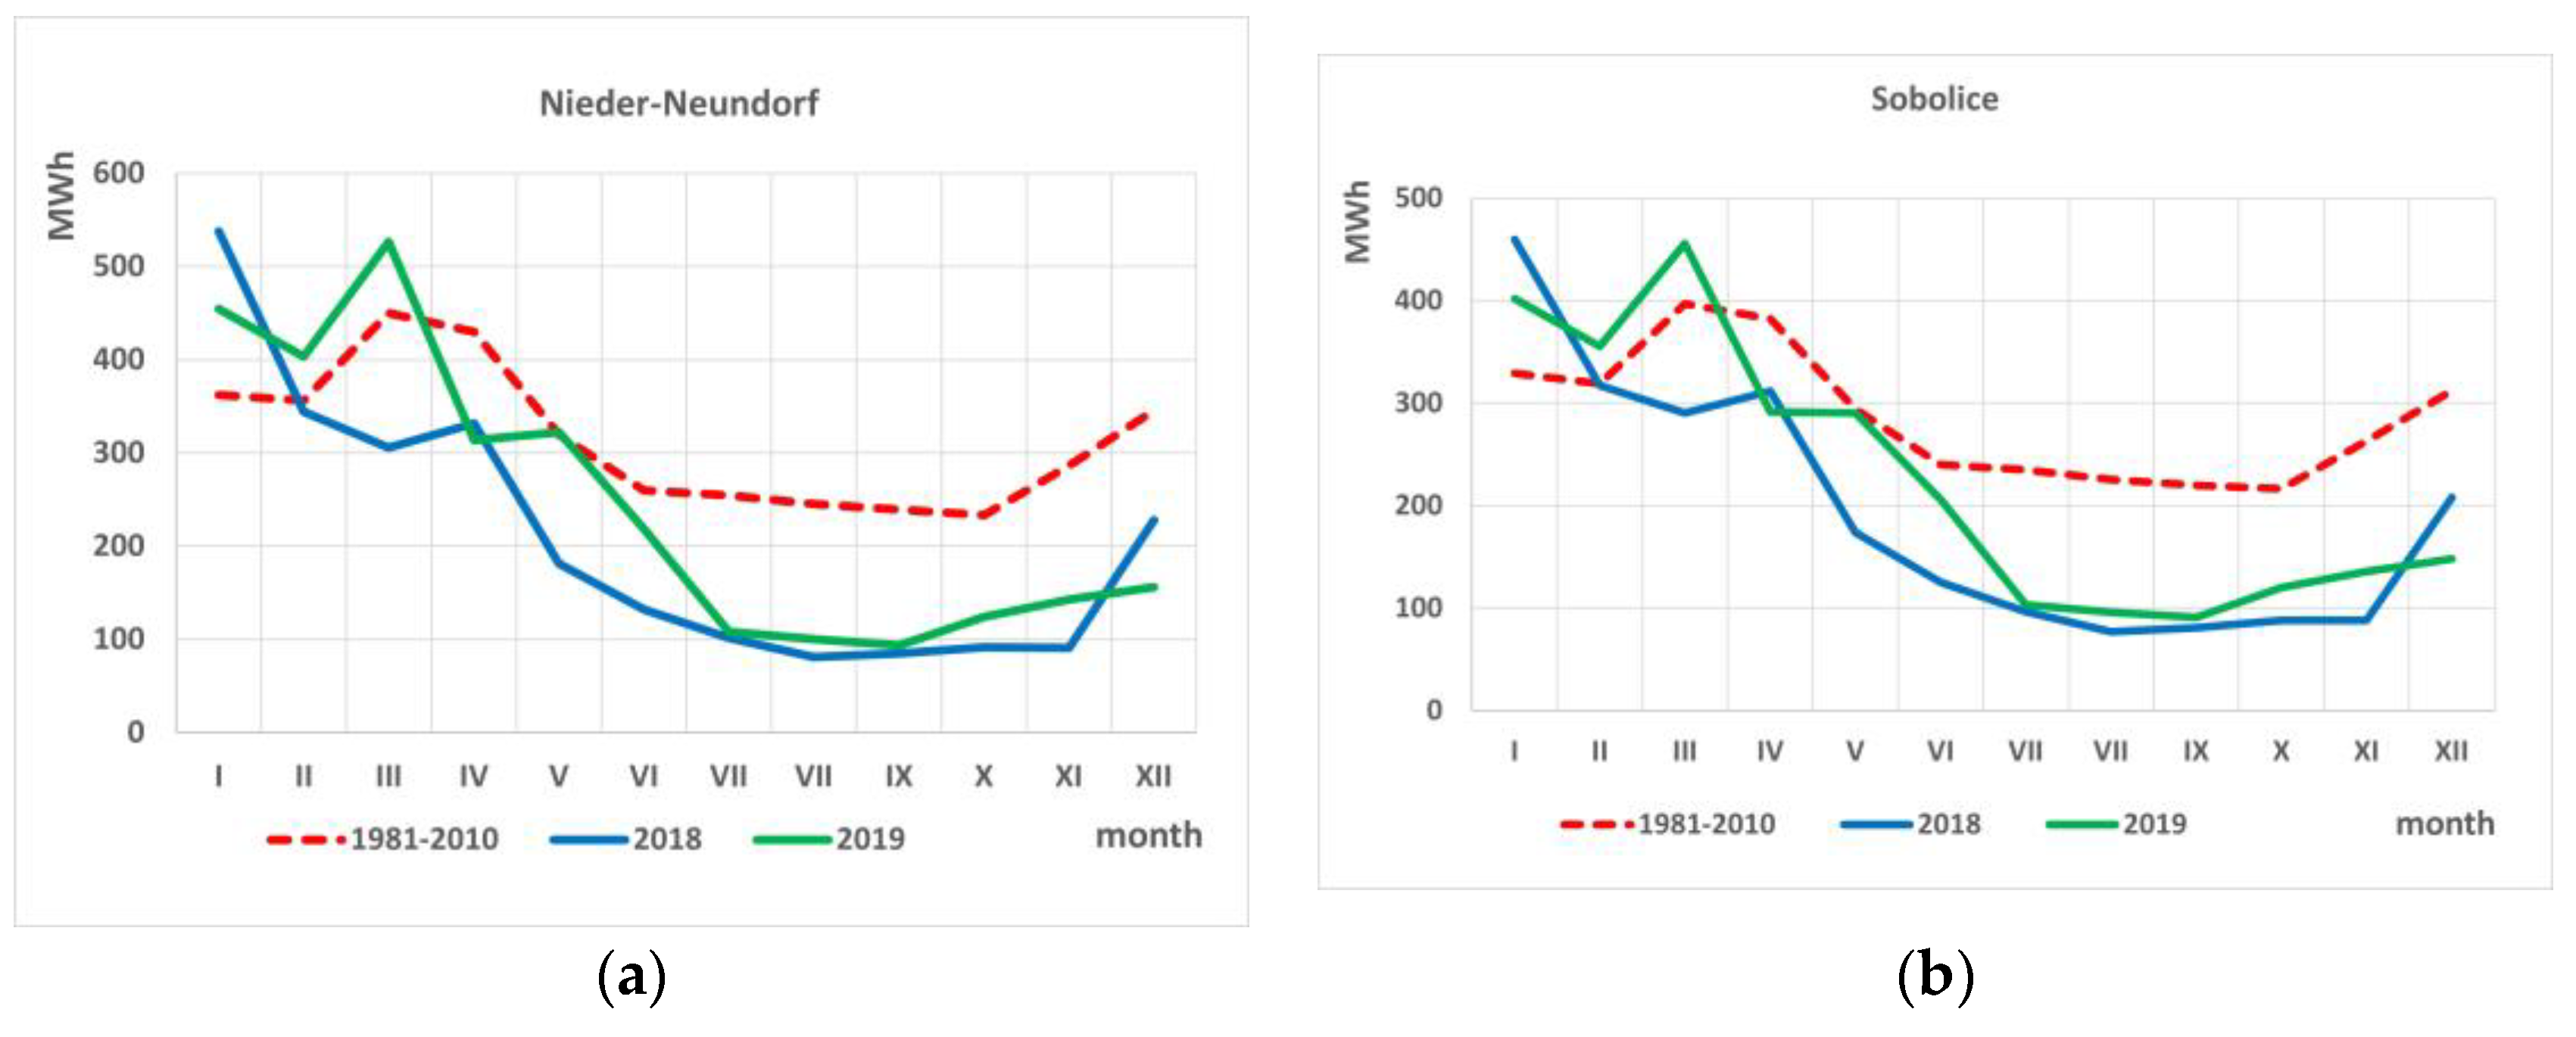
Energy production in the particular months of 2018 and 2019, along with the mean multiannual values for 1981–2010 for the hydropower plants of Nieder-Neundorf and Sobolice, are presented in Figure 22. The most significant losses were observed in July–November 2018. Both plants were characterized by the highest decrease in November 2018, when the rate of potential energy generation reached only 31.7% in Nieder-Neundorf and 33.6% in Sobolice. A similar annual course was noticed in 2019. In July–September, the level of potential generation was comparable to 2018. September was the month with the lowest rate, reaching 38.3% (Nieder-Neundorf) and 41.5% (Sobolice) of the mean value.

5. Discussion and Conclusions

The drought event of 2018–2019 significantly affected most of Central Europe. In this study, the development and intensity of drought in the Lusatian Neisse river catchment was evaluated based on the indices of SPI and SPEI, as well as low flows related to hydrological drought. Furthermore, multiannual variability in the drought indices and trends for air temperature and precipitation totals were examined for 1981–2020.

5.1. Weather Conditions in 2018 and 2019

The drought of 2018–2019 was accompanied by a high positive thermal anomaly. Mean air temperature in some months significantly exceeded the climatological norm. Thermal anomaly in April 2018 and June 2019 reached 5 °C and 6 °C, respectively. Considering the entirety of Europe, exceptionally high air temperature was observed in the summer season of 2018, which exceeded the mean value by 1.3 °C [103]. A similar deviation was reported for the entire area of Germany [104]. In Central Europe, the thermal deviation for spring and summer 2018 reached as much as 2.5 °C [103]. In this part of the continent, June 2019 was also exceptional in terms of thermal conditions, if compared to the mean mutliannual values [20]. In Austria and the Netherlands, this month was the warmest in the history of measurements, while the summits of the Alps were characterized by the highest maximum air temperature ever [105]. In Poland, the summer season of 2019 was significantly warmer if compared to the multiannual period [106], also including the southwestern regions [107].
Precipitation totals in the Lusatian Neisse river basin in 2018 and 2019 were characterized by a noticeable deficit. In 2018, the annual rates accounted just for 66% of the normal value. This shortage was also noticed in the remaining Polish regions [108]. In the summer months of 2019, mean precipitation totals in Poland accounted for 66% of the normal value, reaching as low as 30% in the Central Polish Lowlands [109]. The analysis carried out for Central Europe indicated the summer seasons of 2018 and 2019 as some of the driest in the history [110]. This concerned especially southeast Germany and southwest Poland, which were some of the driest European regions in 2018 [103]. In the entire area of Germany, mean deficit of precipitation in the summer of 2018 exceeded 100 mm [104]. In terms of precipitation totals and climate water balance, the Lusatian Neisse river basin in the growing seasons of 2018 and 2019 was one of the driest Polish regions [111].

5.2. Multiannual Climate Changes

The most characteristic feature of the observed climate changes in Europe is an increase in air temperature. The recent research indicates that this growth significantly intensified since 1985. The changes were characterized by a high level of statistical significance and reached the rate of 0.051 °C/year [24]. Such a strong positive tendency of thermal changes in Poland was also found by Ustrnul et al. [26] for 1951–2018. This resulted from the noticeably higher values of air temperature noticed for the last 20–25 years, especially for 2014–2018. The trend was statistically significant and observed throughout the state. In the middle-west region, its intensity exceeded 0.3 °C/10 years [26]. Similar conditions were also found for the Lusatian Neisse river catchment, where changes in mean annual air temperature in 1981–2020 were characterized by a positive, statistically significant trend with the intensity of 0.046 °C/year. Furthermore, projections of thermal conditions for the following decades show that the increase in air temperature in this region at the end of the century can reach as much as 3 °C [112]. Considering this process, projected increase in potential evapotranspiration can contribute to the intensification of drought occurring in Central Europe [50], including the Lusatian Neisse river catchment. The simulations of climate water balance indicate that the values of this index in 2100 in the German–Polish border area can decrease by about 5–15% if compared to the current conditions [113]. Simultaneously, the increase in drought risk can be expected, including the areas located at higher elevations [114].
On the other hand, the results concerning trends of annual precipitation totals in the discussed region do not indicate significant changes for the last 40 years (1981–2020). This is coherent with the research carried out for the entire area of Poland, which did not show any statistically significant tendency for both annual and seasonal totals [30]. Insignificant trends for precipitation totals were also noticed in previous research [115,116].

5.3. Meteorological Drought

In the Lusatian Neisse river catchment, the precipitation deficit observed from autumn 2017 to spring 2020, high positive thermal anomaly, and a short duration of snow cover in winter 2017/2018 contributed to the increase in evaporation and consequently caused meteorological drought. As a result, SPI3 already indicated drought at the end of March 2018, while in June, severe drought was observed in the south of the catchment. Warm and dry conditions persisted till the end of the year, which was also confirmed in the other European regions [103], especially in north-central and northeastern Europe [117]. In the discussed region, water shortage at the end of 2018 amounted to 30%, while the winter of 2018/2019 did not compensate such a significant deficit. In 2019, dry conditions were still observed, with SPI3 indicating severe or extreme drought at the end of August. Thus, the drought was even more intensive than during the episode of 2015, when moderate drought conditions were reported [58]. In whole Poland, SPI3 specified moderate drought conditions for autumn 2018 and extreme drought for spring 2018 and summer 2019 [58]. It is assumed that almost 60% of the Polish regions in the summer of 2019 were affected by moderate, severe, or extreme drought [58]. It should be emphasized that based on SPI12 and SPEI12, the drought of 2018–2019 can be evaluated as the longest period of a severe drought episode in the region in the entire 1981–2020 period. In some regions of Central Poland, the drought intensity was less distinctive. In the Kujawy region, the annual values of SPI for 2018 indicated moderate drought or normal conditions [118]. The cases of extreme meteorological drought, defined by SPI and SPEI, were noticed in east Germany [119]. It should also be noted, that the meteorological drought of 2018 and 2019, along with the episode of 2015, contributed to the significant increase in the frequency of SPEI categories related to water deficit in 2011–2020 in comparison to the previous decades [57]. The analysis of SPEI conducted for a larger scale shows that Central Europe became more vulnerable to droughts because of the increase in both potential evapotranspiration and mean air temperature [50].

5.4. Hydrological Drought

As SPEI12 notably defines risk related to hydrological drought in Poland [81], its negative values from July 2018 to October 2020 indicated conditions favoring the development of this phenomenon. The hydrological drought of 2018 mostly affected the Benelux region, Germany, the Czech Republic, and Scandinavia. In Central Europe, the maximum range of this phenomenon was noticed in October and November 2018 [117]. In 2018, the lowest discharges for all of the 1981–2020 period were observed at some of the water gauges in the Lusatian Neisse river basin. The number of days with discharges below Q70% was observed for more than 55% of all days in both 2018 and 2019. These low flow periods persisted from May to December 2018 and from June 2019 to February 2020. In the discussed region, the episodes of severe (148–205 days) and extreme (71–183 days) hydrological drought were observed. In the Białowieża region (east Poland), the duration of severe drought in 2018 and 2019 amounted to 150–160 days [120]. On the national scale, mean discharges in 2019 were more than 30% lower if compared to the multiannual values. In some months, the lowest rates were 2–3 times lower than the minimum discharges for 1951–2018 [109]. In some cases, more than 90% of the Polish regions in 2019 were affected by drought [109]. Similar rates were also reported for Germany, especially in the northern and eastern part [121]. As a result, Poland and Germany were some of the most affected countries, if considering the multi-year drought 2018–2019 [117]. In the Białowieża Primeval Forest, the absolute minimum discharges were observed in 2019–2020 [120].

5.5. The Impact of Drought on Economy and Natural Environment

The long-lasting drought of 2018–2020 resulted in numerous effects in Central Europe, comparable to those observed in 2003 and 2015. The drought noticeably affected social-economic and environmental sectors, including agriculture, hydropower generation, forestry, and natural ecosystems [56,64,65,66,68,122,123]. This concerned especially the growing season, when higher rates of evapotranspiration were observed. Such conditions consequently contributed to the intensification of droughts originally caused by rainwater deficit [45,81]. Such an intensification during the growing season was also indicated in the study carried out by Wibig [81]. In the Polish part of the Lusatian Neisse river basin and its surroundings, losses in agriculture in 2018 and 2019 for corn (grain) and wheat amounted to 22–33% and 9–18%, respectively. These rates were significant, considering the fact that southwest Poland is one of the most important regions in terms of wheat production [124]. In some western Polish regions, more than 90% of the cultivation area (spring cereals, fruit bushes, maize, leguminous plants, winter cereals, and tobacco) was at risk of drought during the most critical periods [109]. The negative effects for agriculture and livestock farming were also noticed in other European regions [117]. In Germany, agriculture was severely affected in 2018, while the drought of 2019 had a main impact on forestry [121]. Some crop yields (maize, potatoes, and summer burley) in the German part of the Lusatian Neisse river catchment were reduced by about 30–50%, while the losses in wheat production amounted to approximately 15–30% [119]. Furthermore, large areas of spruce forests in Saxony were destroyed, mainly because of water stress and pests [125]. Economic losses were also observed in the case of hydropower production. In the discussed period, energy generated by the hydropower plants located on the Lusatian Neisse river decreased by more than 30%. This corresponds to the projected losses for the final decades of the century [126] and is twice as high if compared to the simulated decrease for the Elbe river catchment in 2050 [127]. The effects of the discussed drought were also connected with physicochemical and biological conditions of the rivers. The analysis indicated the increase in nutrients, sulphate, chlorides, and total solid in the examined section of the Lusatian Neisse river basin. Similar results were achieved for the Carpathians [128]. In this region, the increase in such parameters as electrolytic conductivity and the concentration of sulphate, nitrates, and nitrites were observed in dry years. Such changes were also noticed in other regions of the world [129,130,131,132]. Furthermore, unfavorable changes in the diatom index were observed in the considered catchment. The same situation took place in the Carpathians, where the value of the diatom index under drought conditions was significantly lower than for drought-free periods [128]. Analysis carried out for other regions also indicated the progressing changes in the number of water-related organisms during droughts [132,133,134,135]. After the drought, the diatom index in 2020 was already characterized by good or very good conditions. Nevertheless, this research requires further examination because of possible anthropogenic influence.

5.6. Summary

It should be emphasized that drought is a natural phenomenon characterized by irregular occurrence. Therefore, the evaluation of its intensity, duration, and the spatial range of its episodes is crucial for all the measures focused on the mitigation of its effects [8]. This results from the fact that the influence of drought in a longer time period depends on the sort of adaptation measures available in the region. The activities aimed at decreasing social and economic vulnerability to droughts concern the development of monitoring and early warning systems, as well as the creation of drought-related plans, which should increase the preparedness for droughts [6,136,137]. Thus, the appropriate recognition of drought phenomenon on different spatial scales is crucial for both forecasts related to droughts and the development of reliable adaption strategies [50]. It should also be remembered that water resources in the discussed area can be affected by mining activity. However, the analysis carried out for the region of the Turów mine showed that river discharges did not indicate any periodic anomalies and their course was characterized by stable conditions [138]. Thus, it can be assumed that the rates of discharges, and consequently, drought conditions in the considered catchment, mainly depend on the meteorological factors, while the impact of mining activity seems to be insignificant [138].

5.7. Conclusions

Based on the results presented above, the following conclusions can be issued:
  • The episode of the 2018–2019 drought confirms the previous results that the last years were extraordinary from the climatological perspective. If such conditions continue, dry periods can occur more often in the future. Thermal precipitation conditions in 2018–2019 were significantly different from the mean multiannual values. Mean air temperature was the highest in the entire 1981–2020, while June 2019 was characterized by the highest values for the last 70 years;
  • Both SPI12 and SPEI12 identified the drought of 2018–2019 as the most intensive episode in 1981–2020;
  • The changes in thermal conditions indicate positive trends for air temperature. Further growth in this variable can additionally impact drought intensity and consequently contribute to the increase in the social-economic and environmental losses related to this phenomenon;
  • The discussed drought episode showed that the effects of long-lasting dry periods can significantly affect multiple sectors. This influence is noticed especially in such sensitive regions as the Lusatian Neisse river basin, where agriculture, forestry, hydropower generation, and environment protection play an important role;
  • The results of this study can be a source of information for local or regional planning processes, focused on the activities related to the meteorological and hydrological hazards.

Author Contributions

Conceptualization, I.O. and I.Z.; investigation, I.O., M.A.-P., I.Z., I.L. and B.M.; writing—original draft preparation, I.O., I.Z. and M.A.-P.; writing—review and editing, B.M., I.O., I.Z., I.L. and M.A.-P. All authors have read and agreed to the published version of the manuscript.

Funding

This research was partly funded by 2014—2020 INTERREG V-A Poland—Germany/Saxony Programme, Project no. PLSN.04.01.00-02-0069/17.

Data Availability Statement

The data presented in this study are available on request from the corresponding author. The data are not publicly available due to internal company regulations.

Conflicts of Interest

The authors declare no conflict of interest.

References

  1. Wilhite, D.A.; Glatz, M.H. Understanding the drought phenomenon: The role of definitions. Water Int. 1985, 10, 111–120. [Google Scholar] [CrossRef]
  2. Wilhite, D.A.; Svoboda, M.D.; Hayes, M.J. Understanding the complex impacts of drought: A key to enhancing drought mitigation and preparedness. Water Resour. Manag. 2007, 21, 763–774. [Google Scholar] [CrossRef]
  3. Tallaksen, L.M.; van Lannen, H.A.J. (Eds.) Hydrological Drought—Processes and Estimation Methods for Streamflow and Groundwater. In Development in Water Science, 48; Elsevier Science B.V.: Amsterdam, The Netherlands, 2004. [Google Scholar]
  4. Spinoni, J.; Naumann, G.; Vogt, J.; Barbosa, P. Meteorological Droughts in Europe: Events and Impacts—Past. Trends and Future Projections; Publications Office of the European Union: Luxembourg, 2016; p. 130. [Google Scholar]
  5. Vicente-Serrano, S.M.; Lopez-Moreno, J.I. Hydrological response to different time scales of climatological drought: An evaluation of the Standardized Precipitation Index in a mountainous Mediterranean basin. Hydrol. Earth Syst. Sci. 2005, 9, 523–533. [Google Scholar] [CrossRef]
  6. Tokarczyk, T.; Szalińska, W.; Otop, I.; Bedryj, M. Zarządzanie Ryzykiem Suszy (Drought Risk Management); Monografie Komitetu Gospodarki Wodnej Polskiej Akademii Nauk: Warszawa, Poland, 2017; Volume 40. [Google Scholar]
  7. van Loon, A.F. Hydrological drought explained. WIREs Water 2015, 2, 359–392. [Google Scholar] [CrossRef]
  8. Oikonomou, P.D.; Karavitis, C.A.; Kolokytha, E. Multi-Index Drought Assessment in Europe. Proceedings 2019, 7, 20. [Google Scholar] [CrossRef]
  9. Gutry-Korycka, M.; Sadurski, A.; Kundzewicz, Z.; Pociask-Karteczka, J.; Skrzypczyk, L. Zasoby wodne a ich wykorzystanie. Nauka 2014, 1, 77–98. [Google Scholar]
  10. Mukherjee, S.; Mishra, A.; Trenberth, K.E. Climate change and drought: A perspective on drought indices. Curr. Clim. Chang. Rep. 2018, 4, 145–163. [Google Scholar] [CrossRef]
  11. Marvel, K.; Cook, B.I.; Bonfils, C.J.W.; Durack, P.J.; Smerdon, J.E.; Williams, A.P. Twentieth-century hydroclimate changes consistent with human influence. Nature 2019, 569, 59–65. [Google Scholar] [CrossRef]
  12. WMO. The Global Climate 2015–2019; World Meteorological Organization: Geneva, Switzerland, 2019; Available online: https://library.wmo.int/ (accessed on 27 December 2022).
  13. Krzyżewska, A.; Wereski, S.; Demczuk, P. Biometeorological conditions during an extreme heatwave event in Poland in August 2015. Weather 2019, 75, 183–189. [Google Scholar] [CrossRef]
  14. Sulikowska, A.; Wypych, A.; Woszczek, I. Fale upałów latem 2015 roku i ich uwarunkowania cyrkulacyjne (Heat waves in the sumer of 2015 and their circulation conditions). Bad. Fizjogr. VII Ser. A. Geogr. Fiz. 2016, A67, 205–223. [Google Scholar] [CrossRef]
  15. Hoy, A.; Hänsel, S.; Skalak, P.; Ustrnul, Z.; Bochnicek, O. The extreme European summer of 2015 in a long-term perspective. Int. J. Climatol. 2017, 37, 943–962. [Google Scholar] [CrossRef]
  16. Urban, A.; Hanzlikova, H.; Kysely, J.; Plavcova, E. Impacts of the 2015 heat waves on mortality in the Czech Republic—A comparison with previous heat waves. Int. J. Environ. Res. Public Health 2017, 14, 1562. [Google Scholar] [CrossRef]
  17. Wibig, J. Heat waves in Poland in the period 1951-2015: Trends, patterns and driving factors. Meteorol. Hydrol. Water Manag. 2018, 6, 37–45. [Google Scholar] [CrossRef]
  18. Kornhuber, K.; Ospray, S.; Coumou, D.; Petri, S.; Petoukhov, V.; Rahmstorf, S.; Gray, L. Extreme weather events in early summer 2018 connected by a recurrent hemispheric wave-7 pattern. Environ. Res. Lett. 2019, 14, 054002. [Google Scholar] [CrossRef]
  19. Tomczyk, A.M.; Bednorz, E. The extreme year—Analysis of thermal conditions in Poland in 2018. Theor. Appl. Climatol. 2020, 139, 251–260. [Google Scholar] [CrossRef]
  20. Sulikowska, A.; Wypych, A. How unusual were June 2019 temperatures in the context of European climatology? Atmosphere 2020, 11, 697. [Google Scholar] [CrossRef]
  21. Scherrer, S.C.; Appenzeller, C.; Liniger, M.A. Temperature trends in Switzerland and Europe: Implications for climate normal. Inter. J. Climatol. 2006, 25, 565–580. [Google Scholar] [CrossRef]
  22. Krauskopf, T.; Huth, R. Temperature trends in Europe: Comparison of different data sources. Theor. Appl. Climatol. 2020, 139, 1305–1316. [Google Scholar] [CrossRef]
  23. Krauskopf, T.; Huth, R. Trends in intraseasonal temperature variability in Europe, 1961–2018. Int. J. Climatol. 2022, 42, 7298–7320. [Google Scholar] [CrossRef]
  24. Twardosz, R.; Walanus, A.; Guzik, I. Warming in Europe: Recent Trends in Annual and Seasonal temperatures. Pure Appl. Geophys. 2021, 178, 4021–4032. [Google Scholar] [CrossRef]
  25. IMGW-PIB. Klimat Polski 2020 (Climate of Poland 2020); IMGW-PIB: Warsaw, Poland, 2021; p. 45. [Google Scholar]
  26. Ustrnul, Z.; Wypych, A.; Czekierda, D. Air Temperature Change. In Climate Change in Poland; Falarz, M., Ed.; Springer Climate: Cham, Switzerland, 2021; pp. 275–330. [Google Scholar]
  27. Zebisch, M.; Grothmann, T.; Schröter, D.; Hasse, C.; Fritsch, U.; Cramer, W. Climate Change in Germany. In Vulnerability and Adaptation of Climate Sensitive Sectors; Umweltbundesamt: Dessau, Germany, 2005; p. 205. [Google Scholar]
  28. Marosz, M.; Wójcik, R.; Biernacik, D.; Jakusik, E.; Pilarski, M.; Owczarek, M.; Miętus, M. Zmienność klimatu Polski od połowy XX wieku. Rezultaty projektu Klimat (Poland’s climate variability 1951–2008. KLIMAT project’s results). Pr. I Stud. Geogr. 2011, 47, 51–66. [Google Scholar]
  29. Ziernicka-Wojtaszek, A.; Kopcińska, J. Variation in Atmospheric Precipitation in Poland in the Years 2001–2018. Atmosphere 2020, 11, 794. [Google Scholar] [CrossRef]
  30. Łupikasza, E.; Małarzewski, Ł. Precipitation Change. In Climate Change in Poland; Falarz, M., Ed.; Springer: Cham, Switzerland, 2021; pp. 349–373. [Google Scholar] [CrossRef]
  31. Brázdil, R.; Zahradníček, P.; Pišoft, P.; Štěpánek, P.; Bělínová, M.; Dobrovolný, P. Temperature and precipitation fluctuations in the Czech Republic during the period of instrumental measurements. Theor. Appl. Climatol. 2012, 110, 17–34. [Google Scholar] [CrossRef]
  32. Łupikasza, E.; Niedźwiedź, T.; Pinskwar, I.; Ruiz-Villanueva, V.; Kundzewicz, Z.W. Observed Changes in Air Temperature and Precipitation and Relationship between them, in the Upper Vistula Basin; Springer International Publishing: Berlin, Germany, 2016. [Google Scholar] [CrossRef]
  33. Pinskwar, I.; Choryński, A.; Graczyk, D.; Kundzewicz, Z.W. Observed changes in precipitation totals in Poland. Geografie 2019, 124, 237–264. [Google Scholar] [CrossRef]
  34. Tomczyk, A.M.; Szyga-Pluta, K. Variability of thermal and precipitation conditions in the growing season in Poland in the years 1966–2015. Theor. Appl. Climatol. 2018, 135, 1517–1530. [Google Scholar] [CrossRef]
  35. Brázdil, R.; Zahradníček, P.; Dobrovolný, P.; Štěpánek, P.; Trnka, M. Observed changes in precipitation during recent warming: The Czech Republic, 1961–2019. Int. J. Climatol. 2021, 41, 3881–3902. [Google Scholar] [CrossRef]
  36. Brázdil, R.; Zahradnícek, P.; Dobrovolný, P.; Rehor, J.; Trnka, M.; Lhotka, O.; Štepánek, P. Circulation and Climate Variability in the Czech Republic between 1961 and 2020: A Comparison of Changes for Two “Normal” Periods. Atmosphere 2022, 13, 137. [Google Scholar] [CrossRef]
  37. Miszuk, B. Changes in Precipitation Conditions in the Warm Half-Year in the Polish–Saxon Border Region in Relation to the Atmospheric Circulation. Atmosphere 2022, 13, 720. [Google Scholar] [CrossRef]
  38. IPCC. AR5 Synthesis Report: Climate Change 2014. Contribution of Working Groups I, II and III to the Fifth Assessment Report of the Intergovernmental Panel on Climate Change; IPCC: Geneva, Switzerland, 2014; p. 151. Available online: https://archive.ipcc.ch/report/ar5/syr/ (accessed on 4 January 2023).
  39. Kundzewicz, Z.W.; Jania, J.A. Extreme Hydro-meteorological Events and their Impacts. From the Global down to the Regional Scale. Geogr. Pol. 2007, 75, 9–24. [Google Scholar]
  40. European Commission. Regions 2020: The Climate Change Challenge for European Regions. European Commission, Directorate-General Regional Policy; Policy Development, Conception, forward Studies, Impact Assessment: Brussels, Belgium, 2009; Available online: https://climate-adapt.eea.europa.eu/metadata/publications/regions-2020-the-climate-challenge-for-europeanregions (accessed on 4 January 2023).
  41. Franke, J.; Goldberg, V.; Freydank, E.; Eichelmann, U. Statistical analysis of regional climate trends in Saxony, Germany. Clim. Res. 2004, 27, 145–150. [Google Scholar] [CrossRef]
  42. Anders, I.; Stagl, J.; Auer, I.; Pavlik, D. Climate Change in Central and Eastern Europe. In Managing Protected Areas in Central and Eastern Europe Under Climate Change; Advances in Global Change Research; Rannov, S., Neubert, M., Eds.; Springer: Dordrecht, The Netherlands, 2014; Volume 58, pp. 17–30. [Google Scholar]
  43. Nilsen, I.B.; Fleig, A.K.; Tallaksen, M.; Hisdal, H. Recent trends in monthly temperature and precipitation patterns in Europe. In Hydrology in a Changing World: Environmental and Human Dimensions, Proceedings of FRIEND-Water, Montpellier, France, 7–10 October 2014; Ben Ammar, S., Taupin, J.D., Zouari, K., Eds.; IAHS Publication: Wallingford, UK, 2014; pp. 132–137. [Google Scholar]
  44. Jaagus, J.; Aasa, A.; Aniskevich, S.; Boincean, B.; Bojariu, R.; Briede, A.; Danilovich, I.; Castro, F.D.; Dumitrescu, A.; Labuda, M. Long-term changes in drought indices in eastern and central Europe. Int. J. Climatol. 2022, 42, 225–249. [Google Scholar] [CrossRef]
  45. Hänsel, S.; Ustrnul, Z.; Łupikasza, E.; Skalak, P. Assessing seasonal drought variations and trends over Central Europe. Adv. Water Resour. 2019, 127, 53–75. [Google Scholar] [CrossRef]
  46. Kożuchowski, K.; Degirmendžić, J. Contemporary changes of climate in Poland: Trends and variation in thermal and solar conditions related to plant vegetation. Pol. J. Ecol. 2005, 53, 283–297. [Google Scholar]
  47. Okoniewska, M.; Szumińska, D. Changes in Potential Evaporation in the Years 1952–2018 in North-Western Poland in Terms of the Impact of Climatic Changes on Hydrological and Hydrochemical Conditions. Water 2020, 12, 877. [Google Scholar] [CrossRef]
  48. Poznikova, G. The Drought Indication Based on the Ratio between Potential Evapotranspiration and Precipitation at Different Sites in the Czech Republic over the Last 50 Years. In Environmental Changes and Adaptation Strategies; Šiška, B., Ed.; Slovenská Bioklimatologická Spoločnosť, Česká Bioklima-Tologická Společnost: Slovakia, Skalica, 2013. [Google Scholar]
  49. Brázdil, R.; Chromá, K.; Dobrovolný, P.; Tolasz, R. Climate fluctuations in the Czech Republic during the period 1961–2005. Int. J. Climatol. 2008, 29, 223–242. [Google Scholar] [CrossRef]
  50. Ionita, M.; Nagavciuc, V. Changes in drought features at the European level over the last 120 years. Nat. Hazards Earth Syst. Sci. 2021, 21, 1685–1701. [Google Scholar] [CrossRef]
  51. Spinoni, J.; Vogt, J.V.; Naumann, G.; Barbosa, P.; Dosio, A. Will drought events become more frequent and severe in Europe? Int. J. Climatol. 2018, 38, 1718–1736. [Google Scholar] [CrossRef]
  52. EEA. Meteorological and Hydrological Droughts in Europe. 2021. Available online: https://www.eea.europa.eu/data-and-maps/indicators/river-flow-drought-3/assessment (accessed on 5 January 2022).
  53. Graczyk, D.; Kundzewicz, Z. Changes in thermal extremes in Poland. Acta Geophys. 2014, 62, 1435–1445. [Google Scholar] [CrossRef]
  54. Rebetez, M.; Mayer, H.; Dupont, O.; Schindler, D.; Gartner, K.; Kropp, J.P.; Menzel, A. Heat and drought 2003 in Europe: A climate synthesis. Ann. For. Sci. 2006, 63, 569–577. [Google Scholar] [CrossRef]
  55. Sedlmeier, K.; Feldmann, H.; Schädler, G. Compound summer temperature and precipitation extremes over central Europe. Theor. Appl. Climatol. 2018, 131, 1493–1501. [Google Scholar] [CrossRef]
  56. Ionita, M.; Nagavciuc, V. Forecasting low flow conditions months in advance through teleconnection patterns, with a special focus on summer 2018. Sci. Rep. 2020, 10, 13258. [Google Scholar] [CrossRef]
  57. Urban, G.; Kuchar, L.; Kępińska-Kasprzak, M.; Łaszyca, E. A Climatic water balance variability during the growing season in Poland in the context of modern climate change. Meteorol. Z. 2022, 31, 349–365. [Google Scholar] [CrossRef]
  58. Kalbarczyk, R.; Kalbarczyk, E. Research into Meteorological Drought in Poland during the Growing Season from 1951 to 2020 Using the Standardized Precipitation Index. Agronomy 2022, 12, 2035. [Google Scholar] [CrossRef]
  59. Somorowska, U. Wzrost zagrożenia suszą hydrologiczną w różnych regionach geograficznych Polski w XX wieku (Increase in the hydrological drought risk in different geographical regions of Poland in the 20th century). Geogr. Works Stud. 2009, 43, 97–114. Available online: https://wgsr.uw.edu.pl/wgsr/wp-content/uploads/2018/11/Somorowska.pdf (accessed on 5 January 2023).
  60. Řehoř, J.; Brázdil, R.; Trnka, M.; Lhotka, O.; Balek, J.; Možný, M.; Štěpánek, P.; Zahradníček, P.; Mikulová, K.; Turna, M. Soil drought and circulation types in a longitudinal transect over central Europe. Int. J. Climatol. 2021, 41, E2834–E2850. [Google Scholar] [CrossRef]
  61. Szwed, M. The elements of water balance in the changing climate in Poland. Adv. Meteorol. 2015, 5, 149674. [Google Scholar] [CrossRef]
  62. Somorowska, U. Changes in drought conditions in Poland over the past 60 years evaluated by the Standardized Precipitation-Evapotranspiration Index. Acta Geophys. 2016, 64, 2530–2549. [Google Scholar] [CrossRef]
  63. Pluntke, T.; Schwarzak, S.; Kuhn, K.; Lunich, K.; Adynkiewicz-Piragas, M.; Otop, I.; Miszuk, B. Climate analysis as a basis for a sustainable water management at the Lusatian Neisse. Meteorol. Hydrol. Water Manag. 2016, 4, 3–11. [Google Scholar] [CrossRef]
  64. Bakke, S.J.; Ionita, M.; Tallaksen, L.M. The 2018 northern European hydrological drought and its drivers in a historical perspective. Hydrol. Earth Syst. Sci. 2020, 24, 5621–5653. [Google Scholar] [CrossRef]
  65. Hari, V.; Rakovec, O.; Markonis, Y.; Hanel, M.; Kumar, R. Increased future occurrences of the exceptional 2018–2019 Central European drought under global warming. Sci. Rep. 2020, 10, 12207. [Google Scholar] [CrossRef] [PubMed]
  66. Ionita, M.; Nagavciuc, V.; Kumar, R.; Rakovec, O. On the curious case of the recent decade, mid-spring precipitation deficit in central Europe. NPJ Clim. Atmos. Sci. 2020, 3, 49. [Google Scholar] [CrossRef]
  67. Ionita, M.; Dima, M.; Nagavciuc, V.; Scholz, P.; Lohmann, G. Past megadroughts in central Europe were longer, more severe and less warm than modern droughts. Commun. Earth Environ. 2021, 2, 61. [Google Scholar] [CrossRef]
  68. Schuldt, B.; Buras, A.; Arend, M.; Vitasse, Y.; Beierkuhnlein, C.; Damm, A.; Gharun, M.; Grams, T.E.E.; Hauck, M.; Hajek, P.; et al. A first assessment of the impact of the extreme 2018 summer drought on Central European forests. Basic Appl. Ecol. 2020, 45, 86–103. [Google Scholar] [CrossRef]
  69. WMO-No. 1090; Standardized Precipitation Index. User Guide. WMO: Geneva, Switzerland, 2012.
  70. McKee, T.B.; Doesken, N.J.; Kleist, J. The relationship of drought frequency and duration to time scales. In Proceedings of the Eighth Conference on Applied Climatology, Anaheim, CA, USA, 17–22 January 1993; American Meteorological Society: Boston, MA, USA, 1993; pp. 179–184. [Google Scholar]
  71. Guttman, N.B. Accepting the Standardized Precipitation Index: A calculation algorithm. J. Am. Water Resour. Assoc. 1999, 35, 311–322. [Google Scholar] [CrossRef]
  72. Hayes, M.; Svoboda, M.; Wall, N.; Widhalm, M. The Lincoln declaration on drought indices: Universal meteorological drought index recommended. Bull. Am. Meteorol. Soc. 2011, 92, 485–488. [Google Scholar] [CrossRef]
  73. No.1090; Standardized Precipitation Index User Guide. World Meteorological Organization: Geneva, Switzerland, 2012; p. 24.
  74. Vicente-Serrano, S.M.; Beguería, S.; López-Moreno, J.I. A multiscalar drought index sensitive to global warming: The standardized precipitation evapotranspiration index. J. Clim. 2010, 23, 1696–1718. [Google Scholar] [CrossRef]
  75. Hargreaves, G.H. Defining and Using Reference Evapotranspiration. J. Irrig. Drain. Eng. 1994, 120, 1132–1139. [Google Scholar] [CrossRef]
  76. Bogawski, P.; Bednorz, E. Comparison and validation of selected evapotranspiration models for conditions in Poland (Central Europe). Water Resour. Manag. 2014, 28, 5021–5038. [Google Scholar] [CrossRef]
  77. Allen, R.G.; Pereira, L.S.; Raes, D.; Smith, M. Crop evapotranspiration—Guidelines for computing crop water requirements. In FAO Irrigation and Drainage Paper, No. 56; FAO: Rome, Italy, 1998; p. 290. ISBN 92-5-104219-5. [Google Scholar]
  78. Stagge, J.H.; Tallaksen, L.M.; Xu, C.-Y.; Van Lanen, H.A.J. Standardized Precipitation-Evapotranspiration Index (SPEI): Sensitivity to potential evapotranspiration model and parameters. Hydrology in a Changing World: Environmnetal and Human Dimensions. In Proceedings of FRIEND-Water 2014, Montpellier, France, 7–10 October 2014; Daniell, T.M., Ed.; IAHS Publ. No. 363; IAHS Press, Centre for Ecology and Hydrology: Wallingford, UK, 2014; pp. 367–373. [Google Scholar]
  79. Available online: https://cran.r-project.org/web/packages/SPEI/index.html (accessed on 20 April 2023).
  80. Vicente-Serrano, S.M.; Domínguez-Castro, F.; Murphy, C.; Hannaford, J.; Reig, F.; Peña-Angulo, D.; Tramblay, Y.; Trigo, R.M.; Mac Donald, N.; Luna, M.Y.; et al. Long-term variability and trends in meteorological droughts in Western Europe (1851–2018). Int. J. Climatol. 2021, 41, E690–E717. [Google Scholar] [CrossRef]
  81. Wibig, J. Warunki wilgotnościowe w Polsce w świetle wskaźnika standaryzowanego klimatycznego bilansu wodnego (Moisture conditions in Poland in view of the SPEI index). Woda Środ. Obsz. Wiej. 2012, 12, 329–340. [Google Scholar]
  82. Zielińska, M. Statystyczne metody opracowania niżówek (Statistical methods for low-flows evaluation). Prz. Geofiz. 1964, 2, 109–120. [Google Scholar]
  83. Tokarczyk, T. Niżówka Jako Wskaźnik Suszy Hydrologicznej (Low-Flows as an Index of Hydrological Drought); Instytut Meteorologii i Gospodarki Wodnej—Państwowy Instytut Badawczy: Warszawa, Poland, 2010; p. 164. [Google Scholar]
  84. Raczyński, K. Metody separacji niżówek na zdarzenia niezależne na przykładzie rzek Polski Wschodniej (Methods of separating low flows into independent episodes applied to rivers of Eastern Poland). Woda Środ. Obsz. Wiej. 2015, 15, 39–56. [Google Scholar]
  85. Tokarczyk, T. Wskaźniki oceny suszu stosowane w Polsce i na świecie (Widely applied indices for drought assessment and Polish application). Infrastrukt. I Ekol. Teren. Wiej. 2008, 8, 167–182. [Google Scholar]
  86. Biuletyn Monitoringu Klimatu Polski (Bulletin of Monitoring of Climate Conditions in Poland). 2018. Available online: http://klimat.pogodynka.pl/pl/biuletyn-monitoring/#2018/rok (accessed on 25 October 2022).
  87. Biuletyn Monitoringu Klimatu Polski (Bulletin of Monitoring of Climate Conditions in Poland). 2019. Available online: http://klimat.pogodynka.pl/pl/biuletyn-monitoring/#2019/rok (accessed on 25 October 2022).
  88. Dz.U. z 2021 r. poz. 1475, ROZPORZĄDZENIE MINISTRA INFRASTRUKTURY1) z dnia 25 Czerwca 2021 r. w Sprawie Klasyfikacji Stanu Ekologicznego, Potencjału ekologicznego i Stanu Chemicznego oraz Sposobu Klasyfikacji Stanu Jednolitych Części Wód Powierzchniowych, a Także Środowiskowych Norm Jakości dla Substancji Priorytetowych (Journal of Laws of 2021, Item 1475, REGULATION OF THE MINISTER OF INFRASTRUCTURE1) of 25 June 2021 on the Classification of Ecological Status, Ecological Potential, Chemical Status and the Method of Classification of the State of Surface Water Bodies, as Well as Environmental Quality Standards for Priority Substances). Available online: https://isap.sejm.gov.pl/isap.nsf/download.xsp/WDU20210001475/O/D20211475.pdf (accessed on 25 October 2022).
  89. Kundzewicz, Z.W.; Matczak, P. Climate change regional review: Poland. Wiley Interdiscip. Rev. Clim. Chang. 2012, 3, 297–311. [Google Scholar] [CrossRef]
  90. Kundzewicz, Z.W.; Hov, O.; Okruszko, T. Zmiany klimatu i ich Wpływ na Wybrane Sektory w Polsce (Climate Changes and Their Impact on Selected Sectors in Poland); ISRL PAN: Poznań, Poland, 2017; p. 273. [Google Scholar]
  91. Karczun, Z.M.; Kozyra, J. Wpływ Zmiany Klimatu w Zmiany Klimatu na Bezpieczeństwo Żywnościowe Polski (The Influence of Climate on Food Security in Poland); Szkoła Główna Gospodarstwa Wiejskiego: Warszawa, Poland, 2020; p. 119. [Google Scholar]
  92. Moździoch, M.; Ploch, A. Zmiany klimatyczne a ubezpieczenia upraw rolnych (Climatic changes and crop insurance). Wiadomości Ubezpieczeniowe 2010, 3, 133–150. [Google Scholar]
  93. Łabędzki, L.; Bąk, B. Impact of meteorological drought on crop water deficit and crop yield reduction in Polish agriculture. J. Water Land Dev. 2017, 34, 181–190. [Google Scholar] [CrossRef]
  94. Brás, T.A.; Seixas, J.; Carvalhais, N.; Jagermeyr, J. Severity of drought and heatwave crop losses tripled over the last five decades in Europe. Environ. Res. Lett. 2021, 16, 065012. [Google Scholar] [CrossRef]
  95. Kundzewicz, Z.W.; Zaleski, J.; Nachlik, E.; Januchta-Szostak, A. Gospodarowanie wodą—Wyzwania dla Polski (Managing water—Challenges for Poland). Nauka 2021, 1, 79–102. [Google Scholar] [CrossRef]
  96. Statistics Poland. Local Data Bank. Available online: https://bdl.stat.gov.pl/bdl/start (accessed on 20 April 2023).
  97. Peters, W.; Bastos, A.; Ciasis, P.; Vermeulens, A. A historical, geographical and ecological perspective on the 2018 European summer drought. Phil. Trans. R. Soc. 2020, 375, 20190505. [Google Scholar] [CrossRef] [PubMed]
  98. Cammalleri, C.; Naumann, G.; Mentaschi, L.; Formetta, G.; Forzieri, G.; Gosling, S.; Bisselink, B.; De Roo, A.; Feyen, L. Global Warming and Drought Impacts in the EU.; Publications Office of the European Union: Luxembourg, 2020; p. JRC118585. [Google Scholar] [CrossRef]
  99. Paltan, H.A.; Pant, R.; Braeckman, J.P.; Dadson, S. Increased water risks to global hydropower in 1.5 °C and 2.0 °C Warmer Worlds. J. Hydrol. 2021, 599, 126503. [Google Scholar] [CrossRef]
  100. Naumann, G.; Spinoni, J.; Vogt, J.; Barbosa, P. Assessment of drought damages and their uncertainties in Europe. Environ. Res. Lett. 2015, 10, 124013. [Google Scholar] [CrossRef]
  101. Wan, W.; Zhao, J.; Popat, E.; Herbert, C.; Döll, P. Analyzing the impact of streamflow drought on hydroelectricity production: A global scale study. Water Resour. Res. 2021, 57, e2020WR028087. [Google Scholar] [CrossRef]
  102. Dubicki, A. Ilościowy i Jakościowy Bilans Wodnogospodarczy Nysy Łużyckiej (Quantitative and Qualitative Water and Economic Balance of the Lusatian Neisse River); Instytut Meteorologii i Gospodarki Wodnej: Wrocław, Poland, 2001; Unpublished work. [Google Scholar]
  103. Copernicus. European State of the Climate 2018. ECMWF. 2019. Available online: https://climate.copernicus.eu/sites/default/files/2019-04/Brochure_Final_Interactive.pdf (accessed on 23 February 2023).
  104. Zscheischler, J.; Fischer, E.M. The record-breaking compound hot and dry 2018 growing season in Germany. Weather. Clim. Extremes 2020, 29, 100270. [Google Scholar] [CrossRef]
  105. van Oldenborgh, G.; Sjoukje, P.; Sarah, K.; Vautard, R.; Boucher, O.; Otto, F.; Haustein, K.; Soubeyroux, J.-M.; Ribes, A.; Robin, Y.; et al. Human contribution to the record-breaking June 2019 heat wave in France. Environ. Sci. 2019, 15, 100270. Available online: https://www.worldweatherattribution.org/wp-content/uploads/WWA-Science_France_heat_June_2019.pdf (accessed on 27 February 2023).
  106. Tomczyk, A.M. Bioclimatic Conditions of June 2019 in Poland on a Multi-Year Background (1966–2019). Atmosphere 2021, 12, 1117. [Google Scholar] [CrossRef]
  107. Miszuk, B. Warunki termiczne i biotermiczne na Dolnym Śląsku w 2019 roku (Thermal and bio-thermal conditions in Lower Silesia in 2019). Przegl. Geofiz. 2021, LXVI, 1–2, 43–64. [Google Scholar] [CrossRef]
  108. Kępińska-Kasprzak, M.; Struzik, P. Monitoring of Plant Cultivation Conditions Using Ground Measurements and Satellite Products. Water 2023, 15, 449. [Google Scholar] [CrossRef]
  109. Ziernicka-Wojtaszek, A. Summer Drought in 2019 on Polish Territory—A Case Study. Atmosphere 2021, 12, 1475. [Google Scholar] [CrossRef]
  110. Boergens, E.; Güntner, A.; Dobslaw, H.; Dahle, C. Quantifying the Central European Droughts in 2018 and2019 With GRACE Follow-On. Geophys. Res. Lett. 2020, 47, e2020GL087285. [Google Scholar] [CrossRef]
  111. Samorowska, U. Amplified signals of soil moisture and evaporative stresses across Poland in the twenty-first century. Sci. Total Environ. 2022, 812, 151465. [Google Scholar] [CrossRef]
  112. Mehler, S.; Völlings, A.; Flügel, I.; Szymanowski, M.; Błaś, M.; Sobik, M.; Migała, K.; Werner, M.; Kryza, M.; Miszuk, B.; et al. Zmiany Klimatu w Regionie Granicznym Polski i Saksonii (Climate Changes in the Polish-Saxon Border Region); Sächsisches Landesamtfür Umwelt, Landwirtschaft und Geologie: Dresden, Germany, 2014; p. 80. [Google Scholar]
  113. Stagl, J.; Mayr, E.; Koch, H.; Hattermann, F.F.; Huang, S. Effects of Climate Change on the Hydrological Cycle in Central and Eastern Europe. In Managing Protected Areas in Central and Eastern Europe Under Climate Change, Rannov, S., Neubert, M. Eds. Adv. Glob. Chang. Res. 2014, 58, 31–43. [Google Scholar] [CrossRef]
  114. Bokwa, A.; Klimek, M.; Krzaklewski, P.; Kukułka, W. Drought Trends in the Polish Carpathian Mts. in the Years 1991–2020. Atmosphere 2021, 12, 1259. [Google Scholar] [CrossRef]
  115. Kożuchowski, K.; Żmudźka, E. 100-year series of areally averaged temperatures and precipitation totals in Poland. Acta Univ. Wratisl. 2003, 2542, 116–122. [Google Scholar]
  116. Czarnecka, M.; Nidzgorska-Lencewicz, J. Wieloletnia zmienność sezonowych opadów w Polsce (Multiannual variability of seasonal precipitation in Poland). Woda Środ. Obsz. Wiej. 2012, 12, 45–60. [Google Scholar]
  117. Blauhut, V.; Stoelzle, M.; Ahopelto, L.; Brunner, M.I. Lessons from the 2018–2019 European droughts: A collective need for unifying drought risk management. NHESS 2021, 22, 2201–2217. [Google Scholar] [CrossRef]
  118. Araźny, A.; Bartczak, A.; Maszewski, R.; Krzemiński, M. The influence of atmospheric circulation on the occurrence of dry and wet periods in Central Poland in 1954–2018. Theor. Appl. Climatol. 2021, 146, 1079–1095. [Google Scholar] [CrossRef]
  119. Conradt, T.; Engelhardt, H.; Menz, C.; Vicente-Serrano, S.M.; Farizo, B.A.; Peña-Angulo, D.; Domínguez-Castro, F.; Eklundh, L.; Jin, H.; Boincean, B.; et al. Cross-sectoral impacts of the 2018–2019 Central European drought and climate resilience in the German part of the Elbe River basin. Reg. Environ. Chang. 2023, 23, 32. [Google Scholar] [CrossRef]
  120. Hejduk, L.; Kaznowska, E.; Wasilewicz, M.; Hejduk, A. Hydrological Droughts in the Białowieża Primeval Forest, Poland, in the Years 1951–2020. Forests 2021, 12, 1744. [Google Scholar] [CrossRef]
  121. De Brito, M.M.; Kuhlicke, C. Cascading Effects of the 2018–2019 German Drought: Empirical Evidence from Media Reports. EGU General Assembly 2020, Online, 4–8 May 2020, EGU2020-9499. Available online: https://www.researchgate.net/publication/341234233_Cascading_effects_of_the_2018-2019_German_drought_empirical_evidence_from_media_reports (accessed on 24 February 2023). [CrossRef]
  122. Klages, S.; Heidecke, C.; Osterburg, B. The Impact of Agricultural Production and Policy on Water Quality during the Dry Year 2018, a Case Study from Germany. Water J. 2020, 12, 1519. [Google Scholar] [CrossRef]
  123. Moravec, V.; Markonis, Y.; Rakovec, O.; Svoboda, M.; Trnka, M.; Kumar, R.; Hanel, M. Europe under multi-year droughts: How severe was the 2014–2018 drought period? Environ. Res. Lett. 2021, 16, 034062. [Google Scholar] [CrossRef]
  124. Oleksiak, T.; Spyroglou, I.; Pacoń, D.; Matysik, P.; Pernisová, M.; Rybka, K. Effect of drought on wheat production in Poland between 1961 and 2019. Crop. Sci. 2022, 62, 728–734. [Google Scholar] [CrossRef]
  125. Ocena Susz Oraz Ich Konsekwencji w Zlewni Nysy Łużyckiej i Jej Otoczeniu (Powiat Zgorzelecki, Żarski Oraz Powiat GÖRLITZ) Assessment of Droughts and Their Consequences in the Catchment of the Lusatian Neisse and Its Surroundings (Zgorzelec District, Żary District and Görlitz District). 2020. Available online: http://neymo.imgw.pl/pub/NEYMO-NW_Zadanie_1.2_raport_PL.pdf (accessed on 25 October 2022).
  126. Adynkiewicz-Piragas, M.; Miszuk, B. Risk Analysis Related to Impact of Climate Change on Water Resources and Hydropower Production in the Lusatian Neisse River Basin. Sustainability 2020, 12, 5060. [Google Scholar] [CrossRef]
  127. Koch, H.; Vögele, S.; Kaltofen, M.; Grossmann, M.; Grünewald, U. Security of Water Supply and Electricity Production: Aspects of Integrated Management. Water Resour. Manag. 2014, 28, 1767–1780. [Google Scholar] [CrossRef]
  128. Peszek, Ł.; Zgrundo, A.; Noga, T.; Kochman-Kędziora, N.; Poradowska, A.; Rybak, M.; Puchalski, C.; Lee, J. The influence of drought on diatom assemblages in a temperate climate zone: A case study from the Carpathian Mountains, Poland. Ecol. Indic. 2021, 21, 107579. [Google Scholar] [CrossRef]
  129. Peña-Guerrero, M.D.; Nauditt, A.; Muñoz-Robles, C.; Ribbe, L.; Meza, F. Drought impacts on water quality and potential implications for agricultural production in the Maipo River Basin, Central Chile. Hydrol. Sci. J. 2020, 65, 1005–1021. [Google Scholar] [CrossRef]
  130. Mosley, L.M. Drought impacts on the water quality of freshwater systems; review and integration. Earth-Sci. Rev. 2015, 140, 203–214. [Google Scholar] [CrossRef]
  131. Van Vilet, M.T.H.; Zwolsman, J.J.G. Impact of summer droughts on the water quality of the Meuse river. J. Hydrol. 2008, 353, 1–17. [Google Scholar] [CrossRef]
  132. Sabater, S.; Barcelo, D. Water scarcity in the Mediterranean: Perspectives under global change. In The Handbook of Environmental Chemistry; Springer: Berlin/Heidelberg, Germany, 2010; p. 311. [Google Scholar]
  133. Barthes, A.; Leflaive, J.; Coulon, S.; Peres, F.; Rols, J.L.; Ten-Hage, L. Impact of drought on diatom communities and the consequences for the use of diatom index values in the River Maureillas (Pyrenees-Orientales, France). River Res. Appl. 2015, 31, 993–1002. [Google Scholar] [CrossRef]
  134. Boix, D.; Garcia-Berthou, E.; Gascon, S.; Benejam, L.; Tornes, E.; Sala, J.; Benito, J.; Munne, A.; Sola, C.; Sabater, S. Response of community structure to sustained drought in Mediterranean rivers. J. Hydrol. 2010, 383, 135–146. [Google Scholar] [CrossRef]
  135. Calapez, A.R.; Elias, C.L.; Almeida, S.F.P.; Feio, M.J. Extreme drought effects and recovery patterns in the benthic communities of temperate streams. Limnetica 2014, 33, 281–296. [Google Scholar] [CrossRef]
  136. Wilhite, D.A. Drought as a natural hazard: Concepts and definitions. In Drought: A Global Assessment; Wilhite, D.A., Ed.; Routledge Publishers: Londyn, UK, 2000; pp. 3–18. [Google Scholar]
  137. Wilhite, D.A.; Svoboda, M.D. Drought early warning systems in the context of drought preparedness and mitigation. In Early Warning Systems for Drought Preparedness and Drought Management; Wilhite, D.A., Sivakumar, M.V.K., Wood, D.A., Eds.; World Meteorological Organization: Geneva, Switzerland, 2000; pp. 1–21. [Google Scholar]
  138. Tokarczyk, T.; Szalińska, W.; Adynkiewicz-Piragas, M.; Ciupak, M.; Miszuk, B.; Malicka, J.; Djaków, P. Uwarunkowania Klimatyczne i Hydrologiczne Planowanego Przedsięwzięcia Kontynuacji Eksploatacji Złoża Węgla Brunatnego, Turów” (Climatic and Hydrological Conditions of the Planned Continued Exploitation of the Lignite in the Turów Mine); IMGW-PIB: Wrocław, Poland, 2020; p. 50. Available online: https://kwbturow.pgegiek.pl/Ochrona-srodowiska/uwarunkowania-klimatyczne-i-hydrologiczne (accessed on 12 April 2023).
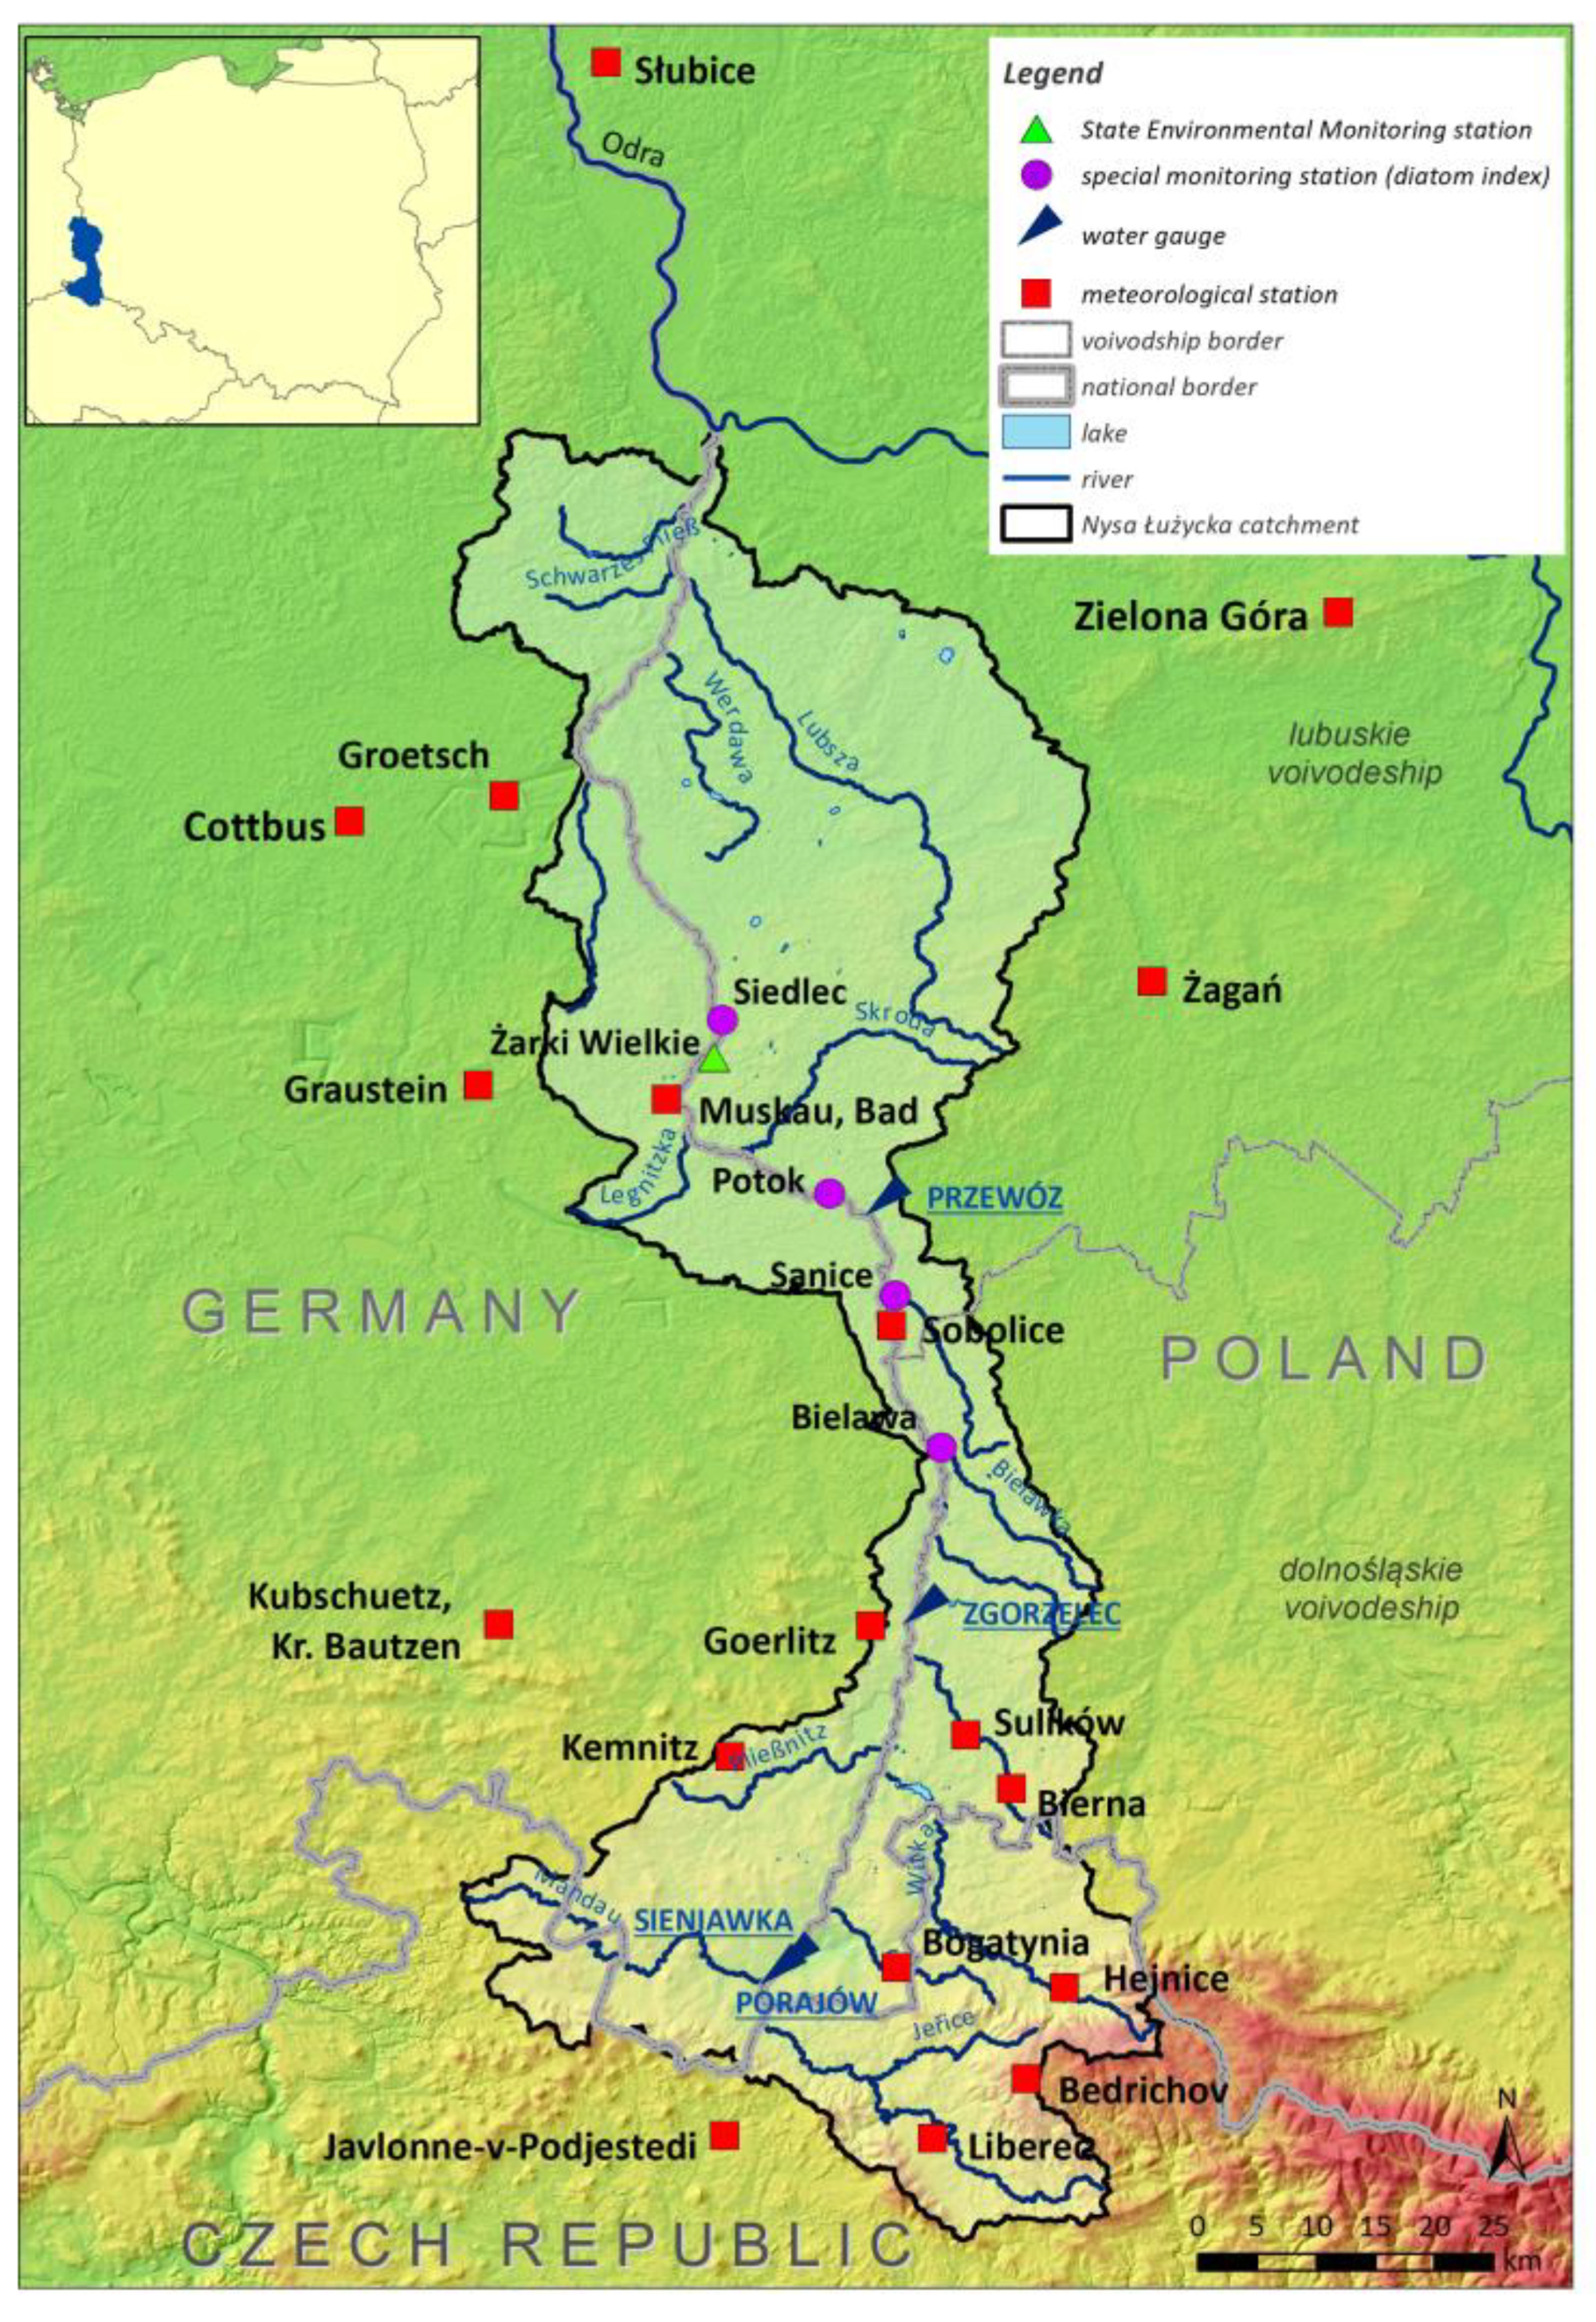
Figure 1. Location of meteorological stations, water gauges, and other monitoring sites in the Lusatian Neisse river catchment.
Water 15 01647 g001
Figure 2. The area-averaged mean annual air temperature, its trend (a) and annual precipitation total, and its trend (b) in the Lusatian Neisse river catchment in 1981–2020.
Water 15 01647 g002
Figure 3. 12-month values of SPI (a) and SPEI (b) for the end of December in 1981–2020 in the Lusatian Neisse river catchment (mean values for the entire area).
Water 15 01647 g003
Figure 4. Multiannual courses of SPI for different time scales: 3 and 12 months (SPI3, SPI12, respectively) in the Lusatian Neisse river catchment in 1981–2020.
Water 15 01647 g004
Figure 5. Multiannual courses of SPEI for different time scales: 3 and 12 months (SPEI3, SPEI12, respectively) in the Lusatian Neisse river catchment in 1981–2020.
Water 15 01647 g005
Figure 6. Annual number of days with discharges below the threshold values of Q70% (a), Q90% (b), and Q95% (c) in the Lusatian Neisse catchment in 1981–2020.
Water 15 01647 g006
Figure 7. Multiannual course of the discharges deficit on the Lusatian Neisse river in 1981–2020.
Water 15 01647 g007
Figure 8. Mean monthly air temperature in 2018 and 2019 against the normal value (for 1981–2010) at the selected stations in the Lusatian Neisse river catchment and its surrounding.
Water 15 01647 g008
Figure 9. Cumulative precipitation totals in 2018 and 2019 (1 January–31 December) against the normal value at the selected stations in the Lusatian Neisse river basin and its surroundings.
Water 15 01647 g009
Figure 10. Distribution of SPI for the 3-month period (SPI3) for the end of May 2018.
Water 15 01647 g010
Figure 11. Distribution of SPI for the 3-month period (SPI3) for the end of August 2018.
Water 15 01647 g011
Figure 12. Distribution of SPI for the 3-month period (SPI3) for the end of November 2018 (a) and the 12-month period (SPI12) for the end of December 2018 (b).
Water 15 01647 g012
Figure 13. Distribution of SPI for the 12-month period (SPI12) for the end of February 2019.
Water 15 01647 g013
Figure 14. Distribution of SPI for the 12-month period (SPI12) at the end of May 2019 (a) and the 3-month period (SPI3) at the end of May 2019 (b).
Water 15 01647 g014
Figure 15. Distribution of SPI for the 12-month period (SPI12) at the end of August 2019 (a) and the 3-month period (SPI3) at the end of August 2019 (b).
Water 15 01647 g015
Figure 16. Distribution of SPI for the 12-month period (SPI12) at the end of December 2019.
Water 15 01647 g016
Figure 17. Monthly evolution of the SPEI (averaged over the study area) from November 2017 to December 2020 (x-axis) and for the time scales ranging from 3 months (bottom) to 12 months (top).
Water 15 01647 g017
Figure 18. Flow duration curves, the values of Q70% Q90% and Q95% for 1981–2020, and daily discharges (Q) for the hydrological years 2018–2020 at the water gauge of Przewóz on the Lusatian Neisse river.
Water 15 01647 g018
Figure 19. The frequency of daily discharges for particular classes of probability exceedance in 2018 (a) and 2019 (b).
Water 15 01647 g019
Figure 20. Yield rates (in %) for the selected crops in 2018 and 2019 against the mean multiannual value [96].
Water 15 01647 g020
Figure 21. Changes in the potential hydropower generation (%) in 2018 and 2019 against the mean energy generation in the reference period (1981–2010).
Water 15 01647 g021
Figure 22. The annual course of potential hydropower generation [MWh/year] in Nieder-Neundorf (a) and Sobolice (b) hydropower plants in 2018 and 2019 and for the reference period (1981–2010).
Water 15 01647 g022
Table 1. Classes of dryness and wetness conditions according to the values of SPI and SPEI.
Dryness and Wetness ConditionsSPI and SPEI
Extreme drought≤−2.0
Severe drought−2.0 < SPI ≤ −1.5
Moderate drought−1.5 < SPI ≤ −0.5
Normal (normal conditions, no drought)−0.5 < SPI ≤ 0.5
Moderately wet0.5 < SPI ≤ 1.5
Very wet1.5 < SPI ≤ 2.0
Extremely wet>2.0
Table 2. Characteristics of the periods related to the hydrological drought in 2018 and 2019/2020 at the water gauges on the Lusatian Neisse river.
Water GaugeYearStart–End DateNumber of Days with Discharge BelowResource
Million m3
Deficit
Million m3
Number of DaysQ70%Q90%Q95%
Porajów201830 May–21 December222175156144.428.2
236
2019–202014 June 2019–1 February 2020225165129136.924.9
235
Sieniawka201810 April–20 December244205183213.249.5
255
2019–20208 June 2019–27 January 202021713371213.228.2
234
Zgorzelec20181 May–21 December226184161365.868.6
235
2019–202015 June 2019–31 January 2020212155124356.456.8
231
Przewóz20186 May–22 December222182153444.786.0
231
2019–202016 June 2019–1 February 2020219148110400.569.6
231
Table 3. Mean annual values of the selected indices, based on the data of the State Environmental Monitoring Lusatian Neisse river, Żarki Wielkie, and water quality classes according to Polish law [88] (water quality below II class marked in bold).
Water Quality IndicatorUnitValue (Water Quality Class)/Year
201520162017201820192020
pH-7.542 (I)7.633 (II)7.675 (I)7.750 (I)7.664 (I)7.550 (I)
BOD5mg/L O22.825 (II)3.675 (II)2.850 (II)2.475 (I)3.227 (II)3.417 (II)
Phosphatesmg/L PO43−0.101 (I)0.146 (below II)0.061 (I)0.027 (I)0.037 (I)0.047 (I)
Nitrate nitrogenmg/L N-NO32.003 (II)2.303 (II)2.365 (II)1.9962.661 (below II)2.087 (II)
Nitrite nitrogenmg/L N-NO20.018 (II)0.020 (II)0.013 (II)0.0210.032 (below II)0.021 (II)
Kjeldahl nitrogenmg/L N1.302 (II)1.877 (below II)0.729 (I)0.8881.230 (II)0.505 (I)
Total nitrogenmg/L N3.317 (II)3.973 (below II)3.107 (II)2.830 3.912 (below II)2.921 (II)
Total solidmg/L 15.342 (II)13.075 (II)14.333 (II)7.267 (I)25.255 (below II)11.442 (II)
Sulphatemg/L SO42−87.692 (below II)74.058 (II)68.417 (II)78.600 (below II)85.836 (below II)74.509 (II)
Chloridemg/L Cl33.950 (II)25.150 (II)26.333 (II)32.50036.800 (below II)29.060 (II)
Table 4. Diatom index (IO) and the classification of water quality at the selected measuring sites (sample points) in the Lusatian Neisse river basin in 2018–2020; classes according to Polish law [88].
Sample PointDiatom Index Value (Water Quality Class)/Year
201820192020
Bielawa0.42 (II)0.48 (II)0.57 (I)
Sanice0.5 (II)0.38 (III)0.58 (I)
Potok0.6 (I)0.65 (I)0.56 (I)
Siedlec0.58 (I)0.58 (I)0.55 (I)
Olszyna0.6 (I)0.53 (II)0.63 (I)
Disclaimer/Publisher’s Note: The statements, opinions and data contained in all publications are solely those of the individual author(s) and contributor(s) and not of MDPI and/or the editor(s). MDPI and/or the editor(s) disclaim responsibility for any injury to people or property resulting from any ideas, methods, instructions or products referred to in the content.