Abstract
An assessment of potential groundwater areas in the Ifni basin, located in the western Anti-Atlas range of Morocco, was conducted based on a multicriteria analytical approach that integrated a set of geomorphological and hydroclimatic factors influencing the availability of this resource. This approach involved the use of geographic information systems (GIS) and hierarchical analytical process (AHP) models. Different factors were classified and weighted according to their contribution to and impact on groundwater reserves. Their normalized weights were evaluated using a pairwise comparison matrix. Four classes of potentiality emerged: very high, high, moderate, and low, occupying 15.22%, 20.17%, 30.96%, and 33.65%, respectively, of the basin’s area. A groundwater potential map (GWPA) was validated by comparison with data from 134 existing water points using a receiver operating characteristic (ROC) curve. The AUC was calculated at 80%, indicating the good predictive accuracy of the AHP method. These results will enable water operators to select favorable sites with a high groundwater potential.
1. Introduction
Providing populations with safe drinking water has emerged as a significant challenge for developing countries [1,2], particularly in light of the current climate change. Water resources in these regions are characterized by scarcity and irregularity, both spatially and temporally [3]. The growing demands for freshwater in these densely populated areas necessitates exploring alternative sources of renewable groundwater resources [1,4,5]. The Ifni basin in Morocco serves as a prime example of the challenges faced by regions dealing with increasing demand for water to satisfy the growing needs of agriculture and population. This basin lies in the fractured and crystalline formations of the Ifni buttonhole, which is part of the western Anti-Atlas range [6,7]. In hydrological terms, it experiences heavy floods that bring significant volumes of surface water, which could be mobilized [8,9]. However, due to the low permeability of the geological formations, the water is not utilized and is instead lost in the Atlantic Ocean. The aquifers in the basin mainly comprise basement aquifers with relatively low permeability. Since the early 1990s, the flow rates of wells have been declining due to reduced precipitation, with a sharp and long-lasting impact since 2000 [8]. Meeting the increasingly urgent demand for water by local populations requires a thorough understanding of the factors influencing water availability in these particular geomorphological conditions. Mastery of the assessment of the weight of each factor in the AHP model, chosen for the mapping of the groundwater potential areas (GWPA), will make it possible to obtain a map that is closer to reality, optimizing the choice of future boreholes to be drilled. Several models exist for mapping the GWPA:
- (1)
- One approach to mapping potential groundwater areas is data-driven and involves the use of probabilistic statistical techniques. The accuracy of the resulting forecast is influenced by both the quality and quantity of the data used [10]. Several model types have been employed in compiling these maps, including the Dempster–Shafer theory [11,12,13], frequency ratio [14,15,16], logistic regression [17,18], statistical index [12], certainty factor [19], and entropy index [20].
- (2)
- The analytic hierarchy process (AHP) is a decision-making technique that incorporates subjective opinions and evaluates multiple factors to complement decision-making. To delineate GWPA using this model, four key steps are taken: standardization of prospecting factors, generation of a pairwise comparison matrix, checking the consistency of the matrix, and weighting the evaluation factors in a GIS environment [4,10,21,22].
- (3)
- Machine learning techniques (MLT) have shown improved accuracy in many situations due to their ability to process non-linear data with varying scales and from different sources [23,24,25,26]. MLT techniques include several models, such as the aquifer sustainability factor [27], classification and regression tree [28], random forest [28,29], boosted regression tree [30], maximum entropy [31], artificial neural network model [32], and generalized additive model [33].
In this study, we use the AHP model with 14 factors to map the potential groundwater areas (GWPA) in the Ifni basin. This approach has yielded satisfactory results in similar basins [4,5,9,11,19,22]. Our analysis of the factors, such as those used in previous studies [4,5,10,22], revealed that certain relevant factors, such as land use, the intersection between geological lineaments and the hydrographic network, the density of the nodes, and TPI, were not considered in the model. In discontinuous environments, aquifer recharge primarily occurs through faults and lineaments that intersect with the hydrographic network [34]. The infiltration of water is also influenced by land use, with wooded areas promoting infiltration and urban areas resulting in low infiltration rates [13]. Therefore, in our study, we took these factors into account to create a more refined GWPA map. The fourteen factors used in our study were categorized into three groups: geology, hydrology, and topography. By creating a GWPA map, we aimed to provide valuable information to policymakers and hydrogeological researchers that will promote the sustainable development and management of groundwater resources within this basin.
2. Material and Methods
2.1. Study Area
The Ifni basin is situated in the western Anti-Atlas region of southwestern Morocco, covering an area of 717 km2 between longitudes 9°50′ W and 10°10′ NW and latitudes 29°10′ N and 29°28′ N (Figure 1). The area’s altitude ranges from 8 to 1209 m, generally decreasing from east to west. The slopes are steep, ranging from 0° on the terraces of wadi beds to 61° on the slopes upstream of the basin. The watershed basin’s topography is mountainous, and the region experiences a semi-arid climate with an average annual rainfall of 133 mm. The temperatures can rise to 42 °C, especially during the summer months. The hydrographic network is dense and well-branched, bringing average annual flows to approximately 1.5 m3/s. In 2014/2015, the maximum instantaneous flow recorded was 891 m3/s [8].
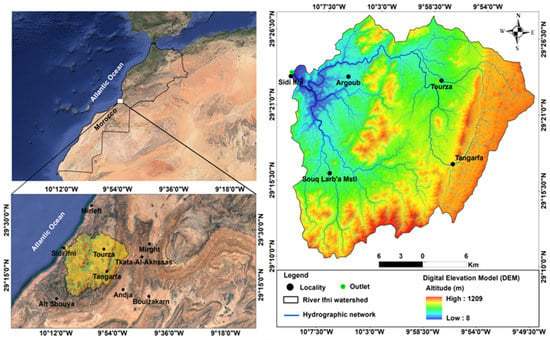
Figure 1.
Geographical location of the Ifni basin.
The geological formations in the basin consist primarily of a Paleoproterozoic basement, represented by Alouzad granite, and a Neoproterozoic cover, represented by the quartzose sandstone series of the Lkest group, as well as volcano-sedimentary formations (Figure 2) [6,35,36,37]. The Neoproterozoic formations include Sahel massif granodiorites to the north of the basin, the granodioritic and monzogranitic massif of Mesti to the south, the granodioritic massif of Ifni forming an elongated massif east of the city of Ifni, Tourza granodiorite in the southeast of the basin, Taoulecht and Tourza granites in elongated NNE–SSW bands in the center of the basin, and the pink granite of Mirleft to the northwest of the basin [6,36,37,38]. This Proterozoic complex is overlaid by basic conglomerates of terminal Proterozoic and lower Cambrian carbonate formations [38,39,40,41,42]. Quaternary outcrops, usually found in wadi, are present in the form of alluvial terraces or veneer on old rocks in the form of a weathered mantle [36,37].
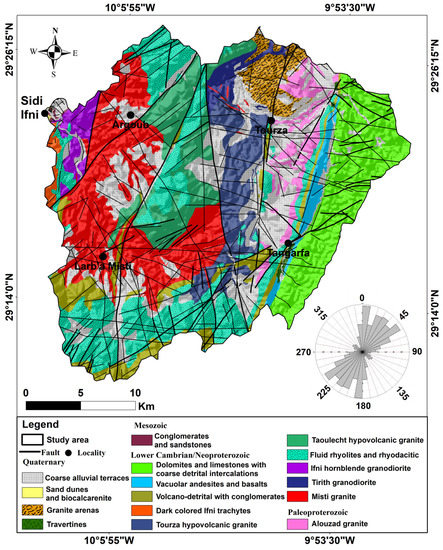
Figure 2.
Geological map of the Ifni basin (delimited according to the geological map of Sidi Ifni at 1/100,000).
From a structural standpoint, the Ifni buttonhole has undergone multiple tectonic events that have impacted the Anti-Atlas chain, including fractures, faults, and schistosity. Brittle tectonics are typically dominant, with fold tectonics and associated foliation being less developed [36,42,43]. The primary directions of N–S and NNE–SSW to ENE–WSE faults are visible and are related to Eburnian and Panafricain deformation. These fractures are intersected by NW–SE structures that can be traced for several kilometers (Figure 2).
Based on geological, hydrological, and topographical data, as well as drilling data obtained from the Drâa-Oued Noun Hydraulic Basin Agency, it can be inferred that the aquifers in this region are of the fractured type [44]. This inference is based on the observation that most water inflows in the drillings coincide with faults or fractures [45,46,47]. In the region, 70% of the boreholes exhibit low flow or are dry. Aude [44] noted a strong correlation between the water occurrence altitudes and fractured levels recorded in 15 boreholes carried out as part of his research on groundwater accumulation in the granitic massif of the Ifni basin. The measured flow rates are highly variable and can reach significant values (3 L/s). This variability in borehole flow rates may be attributed to several factors, including lithological variation in the formations, permeability, compaction, and fracture filling [35,36,37,45,46].
2.2. Methodology
The mapping of groundwater potential areas typically involve a three-step process. In this study, the first step involved identifying decision factors using various types of data such as Ifni geological and topographical maps at a scale of 1:100,000, Landsat-8 Oli satellite images from 29 August 2020, and a digital terrain model (DEM). The thematic layers for the different factors were spatialized, generated, and developed using the ArcGIS 10.4 software in a geographic information system (GIS) environment. The thematic maps were edited based on the conic conformal coordinate system of Morocco and the WGS84 spatial reference (WGS84-CC-Zone 2). The second step was to calculate the weights of these factors using a pairwise comparison matrix and combined by multiplying each factor by its respective weight [10,11,19,48,49]. The third step involved validating the GWPA map using the receiver operating characteristics (ROC) [10,11,19,22,33,47,48]. A flowchart summarizing the methodology used in this study is presented in Figure 3.
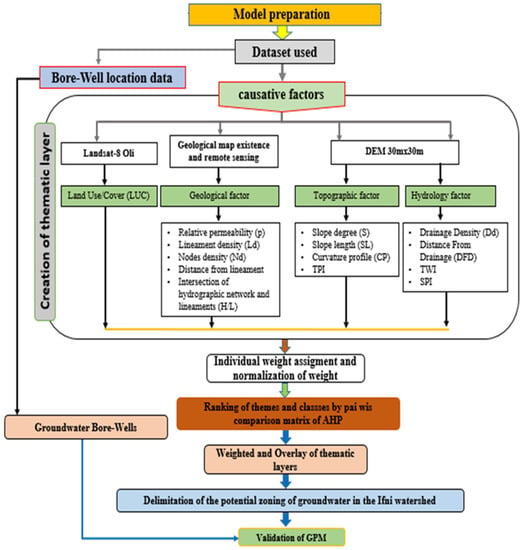
Figure 3.
Processes used to create the groundwater potential map in the Ifni basin.
2.2.1. Development of Decision Factor Maps
To improve the accuracy of our model results, 14 factors, including geological, topographical, and hydrological factors, were used [4,5,10,19,21,50,51].
Geology Factors and Land Use
Geological factors play a crucial role in determining the GWPA in crystalline basement terrains [21,22,48,49,52]. A relative permeability map (Figure 4a) was generated from a geological map of Ifni at a scale of 1:100,000. Lineaments and faults with high permeability facilitate water infiltration, increase permeability and secondary porosity, and enhance the vertical flow of water that replenishes the aquifer [19,52,53]. To create a fracture density map (Figure 4b), we digitized faults from the geological map and extracted lineaments from Landsat 8 Oli satellite imagery. We used the lineament density tool in the ArcGIS 10.4.1 software to process the data, and the resulting node density map (Figure 4d) shows the number of lineament intersections and faults per surface mesh. The maps (Figure 4b–d) indicated that the southern and central eastern parts of the basin had higher concentrations of lineaments and faults (Figure 4c). The availability of groundwater is also influenced by the distance to the fracture network. Areas within 200 m of the fracture network are more sensitive to significant penetration, while the effect of this parameter decreases if the distance is greater than 200 m (Figure 4c). The contact between lineaments, fractures, and the hydrographic network may also affect the drainage and recharge of the aquifer [34,53,54,55,56] (Figure 5a). In addition, land use was considered (Figure 5b) since it impacts the aquifer’s water recharge [48,54]. The map was edited based on sentinel image processing and completed using a Google Earth image. It shows five different classes, including dense vegetation, less-dense vegetation, riverbeds, bare soil, and residential buildings [48,49,55,57].
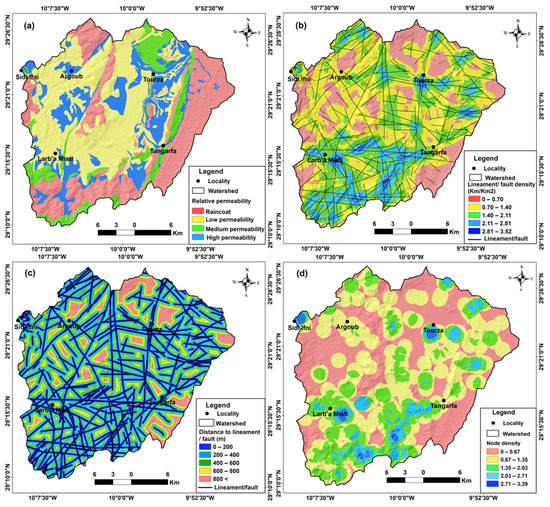
Figure 4.
Groundwater conditioning factors in the Ifni basin: (a) permeability; (b) lineament/fault density; (c) distance to lineament; and (d) node density.
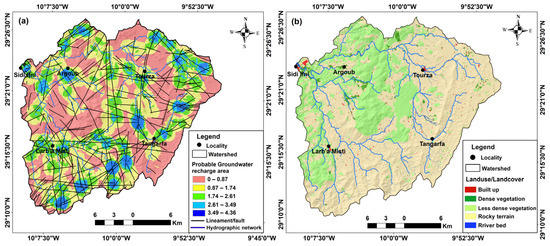
Figure 5.
Groundwater conditioning factors in the Ifni basin: (a) probable groundwater recharge area and (b) landuse/land cover.
Topographic Factors
Surface water flow and groundwater storage patterns are significantly influenced by topographic factors, such as slope, slope length, curvature profile, and topographic position index (TPI) [4,5,54]. These factors were derived from a digital elevation model (DEM) with a spatial resolution of 30 m. Low-slope regions exhibit high percolation rates and low surface water runoff, while high-slope regions favor surface runoff [5,10,19]. The slope map (Figure 6a) revealed that low-slope areas were situated downstream in the central part and around the primary wadi, while higher-slope areas were found upstream, east, south, and north of the basin. Additionally, as slope length increased, the velocity of the water flow decreased, promoting increased infiltration rates [58]. The slope length (Figure 6b) calculation was computed using Equation (1) [59].
where Bs is the flux accumulation and α is the gradient of the slope in degrees.
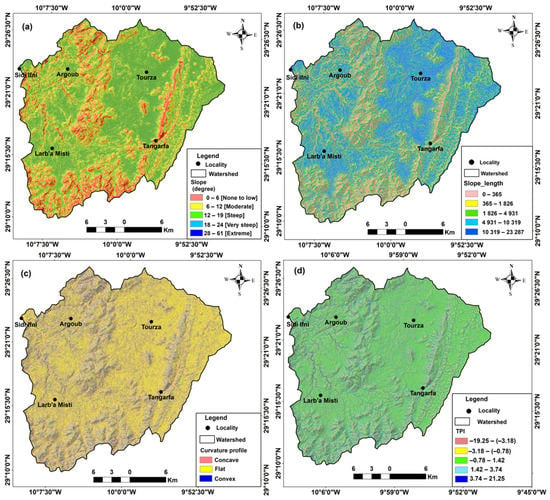
Figure 6.
Topographic factors influencing groundwater in the Ifni basin: (a) slope degree; (b) slope length; (c) curvature profile; and (d) topographic position index.
A digital terrain model was used with the ArcGIS 10.4.1 software’s spatial analysis tool to derive the curvature that represented the topography’s morphology. It was necessary to analyze the physical characteristics of the drainage system and to examine the study area’s convex and concave features. The curvature profile (Figure 6c) played a significant role in determining the direction of water flow, as well as the speed of water flow on the ground surface.
The topographic position index (TPI) is another important factor that determines the relative height and position of a given cell compared to its neighboring cells. By using Equation (2) and the ArcGIS 10.4.1 software, the TPI values for the study area were computed. These values were utilized for automating the geomorphological classification of the landscape and differentiating the various types of landforms in the study area, such as ridges, valley bottoms, and plains (Figure 6d). Cells with negative TPI values are located below their neighbors, while those with positive TPI values are higher than their neighbors [60].
where M0 is the elevation of the model point being evaluated, Mn is the grid elevation, and n is the total number of surrounding points used in the evaluation.
Hydrological Factors
The hydrological factors that have the greatest impact on water availability in a given area are drainage density (DD), distance to stream (DS), topographic wetness index (TWI), and stream power index (SPI), as stated in various sources [4,5,19,59,61]. To calculate the drainage density and distance to stream, the linear density and Euclidean distance tools were employed using the ArcGIS 10.4.1 software.
The DD map (Figure 7a) revealed elevated values primarily in the Ounder and Krayma rivers, which can be explained by the abundant runoff and water retention in those areas. Figure 7b, which represents the DS map, demonstrates that areas within a distance of 200 m from the network exhibited the potential for efficient infiltration, while distances greater than 200 m posed difficulties for water penetration [61]. The commonly used topographic index, TWI, was calculated utilizing Equation (3) [62] (Figure 7c). This index measures an area’s propensity to supply water to a particular point along a hillslope, with higher values indicating a greater potential for water supply. The TWI map displayed the highest values in the central section of the study area, attributable to the flat topography and high capacity for infiltration in this region.
where As is the upslope area (flow accumulation) and β is the topographic gradient of slope (degrees).
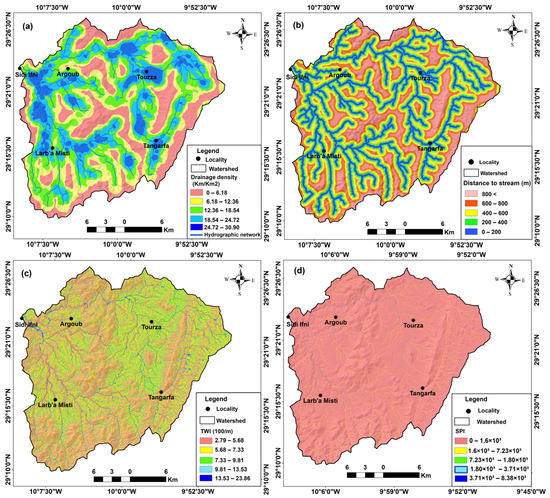
Figure 7.
Hydrological factors influencing groundwater in the Ifni basin: (a) drainage density; (b) distance to stream; (c) topographic wetness index; and (d) stream power index.
The stream power index (SPI) is a crucial factor in assessing the degree of slope erosion caused by water flow [10]. The hydraulic gradient of a slope is directly proportional to the amount of water contributed by upstream regions and the velocity of the water flow, thereby elevating the power index and the probability of erosion. Equation (4) was used to compute the SPI [61].
2.2.2. Analytic Hierarchy Process Model
The analytic hierarchy process (AHP) is a popular technique used for multi-criteria decision-making to identify GWPA that has been used in various studies [49,51,56,61,62]. This technique allows for subjective opinions to be incorporated and is useful for evaluating multiple factors in groundwater research [63,64,65]. To determine the GWPA in the Ifni basin, we employed the AHP method to assess selected factors as thematic layers. The steps taken in this study were critical to ensuring the precision and dependability of the GWPA identified, which are essential for effective groundwater management and planning.
Standardization of Thematic Layers
Factor classification is an equally delicate phase and must be carefully carried out. The selected factors were classified into five classes. A standard range, from 2 to 10, was adopted for this purpose [4,5,21,49,66]. A score of 10 was assigned to the “very low” or “very high” classes depending on whether they contributed to the excellent performance of the considered indicator. Contrarily, an opposite score was given to the other extreme classes (Table 1).

Table 1.
Ranking of factors influencing GWPA.
Weighting of Deciding Factors
The determination of the weights of various factors that affect groundwater storage was achieved through the utilization of a pairwise comparison matrix [63,65,67]. This matrix took into account the relative importance of each factor. The assessment of the relative significance of these factors was conducted using a six-level numerical scale, as shown in Table 2.

Table 2.
Pairwise comparison matrix of different factors influencing groundwater potential areas in the Ifni basin.
To guarantee precise outcomes, the summation of every column within the comparison matrix was computed, followed by dividing each element in the matrix by the total of its respective column. Subsequently, the weights of each factor were determined by dividing the aggregate mass by the overall number of factors [68]. The weights thus derived for all the evaluation factors are tabulated in Table 3.

Table 3.
Determination of standardized weights for each factor influencing groundwater potential areas in the Ifni basin.
To assess the coherence of the matrix utilized in the GWPA, the consistency ratio (CR) was employed (Equation (5)) [69,70], which is calculated as the ratio between the consistency index (CI) and the random index (RI) [69]. A CR value of less than or equal to 0.1 is expected. If the CR exceeds 0.1, the matrix judgments should be reviewed and recalculated until the underlying cause of the inconsistency is identified and corrected to attain a CR value of less than 0.1 [63,64,65,69]. Such an analysis is crucial in guaranteeing the validity and dependability of the results since any inconsistency could have a substantial bearing on the precision of the outcomes [68,69,70].
where CR is the consistency ratio, CI is the consistency index derived from Equation (6), and RI is a random index calculated from the average consistency index of randomly generated samples of 500 randomly generated pairwise comparison matrices depending on the number of factors used (Table 4) [64,69,70,71,72].
CR = (CI)/RI
CI = (λmax − n)/(n − 1)

Table 4.
Random index function of the number of elements compared.
From the above, λmax represents the maximum significant absolute eigenvalue of the comparison matrix pairing calculated from Equation (7) [71,72].
where W is the corresponding eigenvector of λmax and AWi (i = 1, 2,…… n) is the weight value for each factor that is easily determined from the motioned matrix in Equation (8) [69,72,73], and (n) is the number of groundwater conditioning factors [4,9,10,24].
In the present study, the consistency ratio (CR) was 0.082, with CI computed for: λmax = 15.64, n = 14, and RI = 1.52. This finding confirmed the consistency of the matrix and supported the notion that the AHP method produced valid and reliable results.
Delineation of Groundwater Potential Areas (GWPA)
The proposed methodology utilized a linear, pixel-by-pixel approach that incorporated normalized relative weights to combine the different factors. This involved overlaying the thematic layers of the various evaluation factors using Equation (9) to generate the GWPA.
where GWPA denotes the groundwater potential, wi is the weight of each corresponding factor, and Xi is the rank of the subclasses in each theme.
GWPA = (lineament density × 0.157) + (nodes density × 0.145) + (distance to lineament/fault × 0.146) + (probable groundwater recharge area × 0.092) + (drainage density × 0.086) + (relative permeability × 0.069) + (distance to stream × 0.074) + (slope × 0.046) + (curvature profile × 0.0452) + (landuse/landcover × 0.0504) + (stream power index × 0.031) + (TPI × 0.0221) + (TWI × 0.018) + (slope length × 0.015).
2.2.3. Validation of the GWPA
To verify the reliability of the GWPA map, the flow rates of one hundred and thirty-four wells were classified into four categories and then overlaid onto the map. The same points were used to establish the receiver operating characteristic (ROC). The area under the ROC curve (AUC) can be used to assess the predictive performance of models, and a larger AUC indicates a better model [10,11,13,19,22,50,51].
3. Results
The analysis of the GWPA map revealed four water potentiality domains: very high, high, moderate, and low, covering 15.22%, 20.17%, 30.96%, and 33.65%, respectively, of the total basin area (Figure 8).
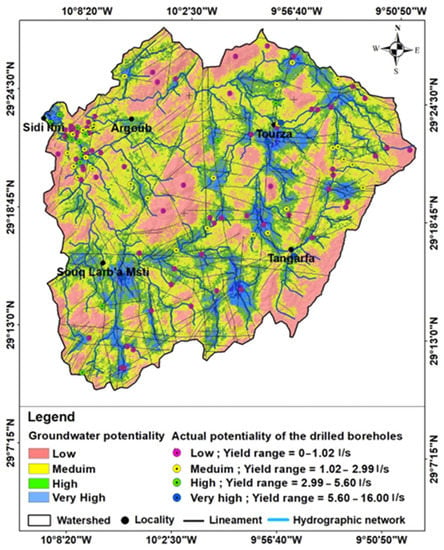
Figure 8.
Groundwater potential areas in Ifni basin.
The very-high-potential areas were mostly found in the southern, eastern, and northeastern plains of the basin, particularly at the intersection of the hydrographic network with hydrogeological lineaments. These areas generally extend over granite formations, volcanic sedimentary formations, and alluvial plains, exhibiting high porosity and permeability in low-lying topographic zones. The Tangarfa source, with a flow rate of 16 L/s, is a good example as it emerges in the contact zone between volcanic and carbonates rocks, facilitated by a network of NE–SE- and NW-SE-oriented faults.
The high-potential areas mainly encircled the tributaries of the main river as well as the faults. The Larba-Msti well and the Mesti Spring with high discharge rates of 8.33 L/s and 5.66 L/s, respectively, exemplify the synergistic effects of multiple favorable factors for groundwater infiltration. Their occurrence in highly permeable alluvial deposits, situated above a well-developed hydrographic network that interconnects with fault systems, highlights the complex interplay of lithological, hydrological, and structural controls on groundwater flow dynamics. In the vicinity of Sidi Ifni city, granitic and granodioritic formations were investigated through 15 boreholes (Figure 9), revealing a positive correlation between the occurrence of water and the recorded fractured levels at varying altitudes [44]. The measured flows showed a wide range of variability and, in some cases, reached significant levels (up to 3 L/s) (Table 5). Similar findings were reported in several similar study areas [36,37,46,47].
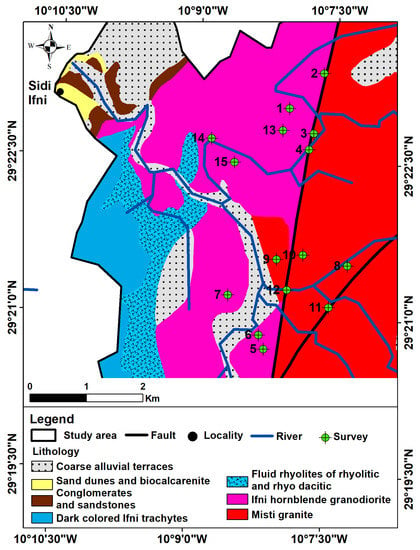
Figure 9.
Location of reconnaissance survey [44].

Table 5.
Hydro-structural characteristics of the 15 boreholes drilled in the granitic basement of Ifni [44].
The validation of areas with very high and high groundwater potential was carried out through a comparison of data from 134 wells executed in the basin. Among these points, 35 were located in areas with very high potential, while 45 were located in areas with high groundwater potential. In contrast, low-potential areas were found on the slopes of denuded mountains, ridges, and hills with steep slopes and high runoff. These areas were characterized by rhyolitic rock, igneous formations with low permeability, and low drainage and lineament density.
Geological and hydrological factors, particularly the density of the hydrological network, the distance to stream, slope, and land use, were found to have the greatest influence on the delimitation of groundwater potential areas. However, topographic factors such as TWI, curvature profile, SPI, TPI, and slope length were found to have a lesser influence.
To assess the capacity of the analytic hierarchy process (AHP) model in detecting potential groundwater areas and validate its sensitivity, a receiver operating characteristic (ROC) approach was used (Figure 10). The results indicated that the AHP model had a high predictability in delineating the GWPA, with an 80% probability of correctly identifying a high-ranking value at random.
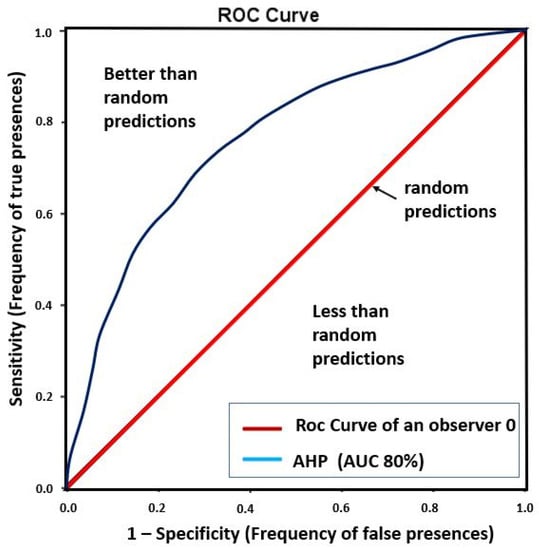
Figure 10.
ROC curve of the GWPA map in Ifni basin.
4. Discussion
The application of mathematical models based on geospatial data is becoming increasingly popular for mapping areas with high groundwater potentiality. Such approaches are particularly promising for large regions that lack sufficient geological and hydrogeological data to develop physical and/or numerical models [74,75,76,77,78].
The AHP model was employed in this study to develop a GWPA map, which serves as a basis for identifying areas with a high potential for water resources. The results indicated that this model provided an 80% chance of accurately identifying a high-ranked value at random. This confirmed the high predictability of the AHP method in defining areas with a high groundwater potential [10,22,50]. This result was consistent with those of Benjmel et al. [4] and Echogdali et al. [10], who worked in the same geological and hydro-climatological contexts.
However, the potential groundwater map had several limitations, primarily due to the challenges involved in obtaining detailed geospatial data for the study area. The accuracy of the data may have been affected by errors in the classification of maps and images, which could have arisen due to their low resolution [4,5]. Utilizing high-resolution satellite imagery can improve data extraction efficiency and the resulting factor maps [10]. The absence of climatological stations in the basin, which can provide spatial variation in precipitation, limited the integration of this factor into the model, highlighting the need to establish a network of regularly distributed stations in the basin. However, some studies were able to generate a GWPA map without incorporating this factor [22,49,50]. Additionally, expert opinions on factor weightings should be carefully considered, as subjective judgments can affect their assignment. Finally, validating the potentiality map solely based on the distribution of water points in a basin may not be sufficient. In our case, the absence of wells in some areas limited the ability to fully validate the potential map, although the ROC curve showed an 80% satisfaction level.
Identifying areas with high-potential groundwater resources can promote investment in tourism and industry in the region by exploiting new water resources. Currently, the scarcity of water resources constrains the development of these economic sectors in the area. It is advisable to avoid drilling in areas with poor and very poor GWPA to minimize investment costs. The approach and findings of this study can be applied to other regions with similar climatological conditions, geomorphological conditions, and water scarcity levels [12,13,14,28,33].
5. Conclusions
In conclusion, the mapping of high-groundwater-potential areas in the Ifni basin was carried out by applying the analytic hierarchy process (AHP) model, remote sensing techniques, and geographic information system (GIS) techniques. Various geological, hydrological, and topographical factors were combined to generate different thematic maps, which were weighted and overlaid in a GIS environment. Appropriate weights were assigned based on the impact of the factors on water availability. The groundwater potentiality (GWPA) map was generated based on the combination of different factors. It was classified into four zones with very high, high, moderate, and low potential. The validation of the results was performed by comparing the GWPA map with 134 existing wells, and the AUC was calculated to be 80%, indicating the good predictive accuracy of the AHP method. The reliability of the results obtained shows that this map can be used as a tool for water resource management by operators in this field. To improve the accuracy of the AHP method, high-resolution geospatial data are necessary. This method can be extrapolated to similar mountainous areas.
Author Contributions
Conceptualization, M.I. and S.B.; methodology, M.I.; software, M.I.; validation, S.B., I.M.I., M.A., K.A. and T.A.-A.; formal analysis, M.I.; investigation, M.I.; resources, M.I.; data curation, M.I.; writing—original draft preparation, M.I., S.B., F.Z.E., M.I.-B., H.E.A., S.E. and F.F.; writing—review and editing, I.M.I., M.A., K.A. and T.A.-A.; visualization, M.I.; supervision, S.B. and F.F.; project administration, M.A.; funding acquisition, K.A. All authors have read and agreed to the published version of the manuscript.
Funding
This research was funded by Researchers Supporting Project number (RSP2023R351), King Saud University, Riyadh, Saudi Arabia.
Data Availability Statement
The data presented in this study are available upon request from the corresponding author.
Conflicts of Interest
The authors declare no conflict of interest.
References
- Kostyuchenko, Y.; Artemenko, I.; Abioui, M.; Benssaou, M. Global and regional climatic modeling. In Encyclopedia of Mathematical Geosciences; Daya Sagar, B., Cheng, Q., McKinley, J., Agterberg, F., Eds.; Springer: Cham, Switzerland, 2022; pp. 1–5. [Google Scholar] [CrossRef]
- Taweesin, K.; Seeboonruang, U.; Saraphirom, P. The influence of climate variability effects on groundwater time series in the lower central plains of Thailand. Water 2018, 10, 290. [Google Scholar] [CrossRef]
- Bahir, M.; Ouhamdouch, S.; Carreira, P.M. La ressource en eau au Maroc face aux changements climatiques; cas de la nappe Plio-Quaternaire du bassin synclinal d’Essaouira. Comun. Geol. 2016, 103, 35–44. [Google Scholar]
- Echogdali, F.Z.; Boutaleb, S.; Abioui, M.; Aadraoui, M.; Bendarma, A.; Kpan, R.B.; Ikirri, M.; El Mekkaoui, M.; Essoussi, S.; El Ayady, H.; et al. Spatial Mapping of Groundwater Potentiality Applying Geometric Average and Fractal Models: A Sustainable Approach. Water 2023, 15, 336. [Google Scholar] [CrossRef]
- Benjmel, K.; Amraoui, F.; Aydda, A.; Tahiri, A.; Yousif, M.; Pradhan, B.; Abdelrahman, K.; Fnais, M.S.; Abioui, M. A Multidisciplinary approach for groundwater potential mapping in a fractured semi-arid terrain (Kerdous Inlier, Western Anti-Atlas, Morocco). Water 2022, 14, 1553. [Google Scholar] [CrossRef]
- Mortaji, A.; Gasquet, D.; Ikenne, M.; Beraaouz, E.H.; Barbey, P.; Lahmam, M.; El Aouli, E.H. Les granitoïdes tardi-panafricains de l’Anti-Atlas sud-occidental (Maroc): Evolution d’un type magnésien à un type ferrifère. Exemple de la boutonnière d’Ifni. Estud. Geol. 2007, 63, 7–25. [Google Scholar] [CrossRef]
- Charton, R.; Bertotti, G.; Arantegui, A.; Bulot, L. The Sidi Ifni transect across the rifted margin of Morocco (Central Atlantic): Vertical movements constrained by low-temperature thermochronology. J. Afr. Earth Sci. 2018, 141, 22–32. [Google Scholar] [CrossRef]
- Ikirri, M.; Faik, F.; Boutaleb, S.; Echogdali, F.Z.; Abioui, M.; Al–Ansari, N. Application of HEC–RAS/WMS and FHI models for the extreme hydrological events under climate change in the Ifni River arid watershed from Morocco. In Climate and Land Use Impacts on Natural and Artificial Systems: Mitigation and Adaptation; Nistor, M.M., Ed.; Elsevier: Amsterdam, The Netherlands, 2021; pp. 251–270. [Google Scholar] [CrossRef]
- Echogdali, F.Z.; Kpan, R.B.; Ouchchen, M.; Id-Belqas, M.; Dadi, B.; Ikirri, M.; Abioui, M.; Boutaleb, S. Spatial prediction of flood frequency analysis in a semi-arid zone: A case study from the Seyad Basin (Guelmim Region, Morocco). In Geospatial Technology for Landscape and Environmental Management: Sustainable Assessment and Planning; Rai, P.K., Mishra, V.N., Singh, P., Praveen, K.R., Eds.; Springer: Singapore, 2022; pp. 49–71. [Google Scholar] [CrossRef]
- Echogdali, F.Z.; Boutaleb, S.; Bendarma, A.; Saidi, M.E.; Aadraoui, M.; Abioui, M.; Ouchchen, M.; Abdelrahman, K.; Fnais, M.S.; Sajinkumar, K.S. Application of analytical hierarchy process and geophysical method for groundwater potential mapping in the Tata basin, Morocco. Water 2022, 14, 2393. [Google Scholar] [CrossRef]
- Rahmati, O.; Melesse, A.M. Application of Dempster-Shafer theory, spatial analysis and remote sensing for groundwater potentiality and nitrate pollution analysis in the semi-arid region of Khuzestan, Iran. Sci. Total Environ. 2016, 568, 1110–1123. [Google Scholar] [CrossRef]
- Haghizadeh, A.; Moghaddam, D.D.; Pourghasemi, H.R. GIS-based bivariate statistical techniques for groundwater potential analysis (an example of Iran). J. Earth Syst. 2017, 126, 109. [Google Scholar] [CrossRef]
- Ghorbani Nejad, S.; Falah, F.; Daneshfar, M.; Haghizadeh, A.; Rahmati, O. Delineation of groundwater potential zones using remote sensing and GIS-based data-driven models. Geocarto Int. 2017, 32, 167–187. [Google Scholar] [CrossRef]
- Regmi, A.D.; Devkota, K.C.; Yoshida, K.; Pradhan, B.; Pourghasemi, H.R.; Kumamoto, T.; Akgun, A. Application of frequency ratio, statistical index, and weights-of-evidence models and their comparison in landslide susceptibility mapping in Central Nepal Himalaya. Arab. J. Geosci. 2014, 7, 725–742. [Google Scholar] [CrossRef]
- Oh, H.J.; Kim, Y.S.; Choi, J.K.; Park, E.; Lee, S. GIS mapping of regional probabilistic groundwater potential in the area of Pohang City, Korea. J. Hydrol. 2011, 399, 158–172. [Google Scholar] [CrossRef]
- Moghaddam, D.D.; Rezaei, M.; Pourghasemi, H.R.; Pourtaghie, Z.S.; Pradhan, B. Groundwater spring potential mapping using bivariate statistical model and GIS in the Taleghan watershed, Iran. Arab. J. Geosci. 2015, 8, 913–929. [Google Scholar] [CrossRef]
- Ozdemir, A. GIS-based groundwater spring potential mapping in the Sultan Mountains (Konya, Turkey) using frequency ratio, weights of evidence and logistic regression methods and their comparison. J. Hydrol. 2011, 411, 290–308. [Google Scholar] [CrossRef]
- Chen, W.; Peng, J.; Hong, H.; Shahabi, H.; Pradhan, B.; Liu, J.; Zhu, A.X.; Pei, X.; Duan, Z. Landslide susceptibility modelling using GIS-based machine learning techniques for Chongren County, Jiangxi Province, China. Sci. Total Environ. 2018, 626, 1121–1135. [Google Scholar] [CrossRef]
- Razandi, Y.; Pourghasemi, H.R.; Neisani, N.S.; Rahmati, O. Application of analytical hierarchy process, frequency ratio, and certainty factor models for groundwater potential mapping using GIS. Earth Sci. Inform. 2015, 8, 867–883. [Google Scholar] [CrossRef]
- Al-Abadi, A.M.; Shahid, S. A comparison between index of entropy and catastrophe theory methods for mapping groundwater potential in an arid region. Environ. Monit. Assess. 2015, 187, 576. [Google Scholar] [CrossRef]
- Das, S. Comparison among influencing factor, frequency ratio, and analytical hierarchy process techniques for groundwater potential zonation in Vaitarna basin, Maharashtra, India. Groundw. Sustain. Dev. 2019, 8, 617–629. [Google Scholar] [CrossRef]
- Mukherjee, I.; Singh, U.K. Delineation of groundwater potential zones in a drought-prone semi-arid region of east India using GIS and analytical hierarchical process techniques. CATENA 2020, 194, 104681. [Google Scholar] [CrossRef]
- Al-Fugara, A.K.; Pourghasemi, H.R.; Al-Shabeeb, A.R.; Habib, M.; Al-Adamat, R.; Al-Amoush, H.; Collins, A.L. A comparison of machine learning models for the mapping of groundwater spring potential. Environ. Earth Sci. 2020, 79, 206. [Google Scholar] [CrossRef]
- Zhang, J.; Liu, K.; Wang, M. Downscaling groundwater storage data in China to a 1-km resolution using machine learning methods. Remote Sens. 2021, 13, 523. [Google Scholar] [CrossRef]
- Jaafarzadeh, M.S.; Tahmasebipour, N.; Haghizadeh, A.; Pourghasemi, H.R.; Rouhani, H. Groundwater recharge potential zonation using an ensemble of machine learning and bivariate statistical models. Sci. Rep. 2021, 11, 5587. [Google Scholar] [CrossRef]
- Springer, A.; Lopez, T.; Owor, M.; Frappart, F.; Stieglitz, T. The role of space-based observations for groundwater resource monitoring over Africa. Surv. Geophys. 2023, 44, 123–172. [Google Scholar] [CrossRef]
- Smith, L.B.; Slone, L.K. A developmental approach to machine learning? Front. Psychol. 2017, 8, 2124. [Google Scholar] [CrossRef] [PubMed]
- Naghibi, S.A.; Pourghasemi, H.R.; Dixon, B. GIS-based groundwater potential mapping using boosted regression tree, classification and regression tree, and random forest machine learning models in Iran. Environ. Monit. Assess. 2016, 188, 44. [Google Scholar] [CrossRef] [PubMed]
- Garosi, Y.; Sheklabadi, M.; Conoscenti, C.; Pourghasemi, H.R.; Van Oost, K. Assessing the performance of GIS-based machine learning models with different accuracy measures for determining susceptibility to gully erosion. Sci. Total Environ. 2019, 664, 1117–1132. [Google Scholar] [CrossRef]
- Zabihi, M.; Pourghasemi, H.R.; Motevalli, A.; Zakeri, M.A. Gully erosion modeling using GIS-based data mining techniques in Northern Iran: A comparison between boosted regression tree and multivariate adaptive regression spline. In Natural Hazards GIS-Based Spatial Modeling Using Data Mining Techniques; Pourghasemi, H., Rossi, M., Eds.; Springer: Cham, Switzerland, 2019; pp. 1–26. [Google Scholar] [CrossRef]
- Rahmati, O.; Pourghasemi, H.R.; Melesse, A.M. Application of GIS-based data driven random forest and maximum entropy models for groundwater potential mapping: A case study at Mehran Region, Iran. CATENA 2016, 137, 360–372. [Google Scholar] [CrossRef]
- Pal, J.; Chakrabarty, D. Assessment of artificial neural network models based on the simulation of groundwater contaminant transport. Hydrogeol. J. 2020, 28, 2039–2055. [Google Scholar] [CrossRef]
- Naghibi, S.A.; Ahmadi, K.; Daneshi, A. Application of support vector machine, random forest, and genetic algorithm optimized random forest models in groundwater potential mapping. Water Resour. Manag. 2017, 31, 2761–2775. [Google Scholar] [CrossRef]
- Boutaleb, S.; Boualoul, M.; Bouchaou, L.; Oudra, M. Application of remote-sensing and surface geophysics for groundwater prospecting in a hard rock terrain, Morocco. In Applied Groundwater Studies in Africa, IAH Book Series; Adelana, S.M.A., MacDonald, A.M., Eds.; CRC Press: Boca Raton, FL, USA; Balkema: Leiden, The Netherlands, 2008; pp. 215–227. [Google Scholar] [CrossRef]
- Jeannette, D.; Benziane, F.; Yazidi, A. Lithostratigraphie et datation du Protérozoïque de la boutonnière d’Ifni (Anti-Atlas, Maroc). Precambrian Res. 1981, 14, 363–378. [Google Scholar] [CrossRef]
- Benziane, F.; Yazidi, A. Géologie de la boutonnière d’Ifni (Anti-Atlas occidental, Maroc). Notes Mém. Serv. Géol. Maroc. 1982, 312, 1–114. [Google Scholar]
- Yazidi, A. Les Formations Sédimentaires et Volcaniques de la Boutonnière d’Ifni, Maroc. Ph.D. Thesis, Université Scientifique et Médicale de Grenoble, Grenoble, France, 1976. [Google Scholar]
- Thomas, R.J.; Fekkak, A.; Ennih, N.; Errami, E.; Loughlin, S.C.; Gresse, P.G.; Chevallier, L.P.; Liégeois, J.P. A new lithostratigraphic framework for the Anti-Atlas Orogen, Morocco. J. Afr. Earth Sci. 2004, 39, 217–226. [Google Scholar] [CrossRef]
- Álvaro, J.J.; Benziane, F.; Thomas, R.; Walsh, G.J.; Yazidi, A. Neoproterozoic-Cambrian stratigraphic framework of the Anti-Atlas and Ouzellagh promontory (High Atlas), Morocco. J. Afr. Earth Sci. 2014, 98, 19–33. [Google Scholar] [CrossRef]
- Benssaou, M.; M’Barki, L.; Ezaidi, A.; Abioui, M. Geodynamic significance of studying Lower Cambrian Sequence units in the western Anti-Atlas. Int. J. Mater. Sci. Appl. 2017, 6, 142–147. [Google Scholar] [CrossRef]
- Benssaou, M.; Hamoumi, N. Le graben de l’Anti-Atlas occidental (Maroc): Contrôle tectonique de la paléogéographie et des séquences au Cambrien inférieur. C. R. Geosci. 2003, 335, 297–305. [Google Scholar] [CrossRef]
- Soulaimani, A.; Bouabdelli, M.; Piqué, A. L’extension continentale au Néo-Protérozoïque supérieur-Cambrien inférieur dans l’Anti-Atlas (Maroc). Bull. Soc. Géol. Fr. 2003, 174, 83–92. [Google Scholar] [CrossRef]
- Soulaimani, A.; Michard, A.; Ouanaimi, H.; Baidder, L.; Raddi, Y.; Saddiqi, O.; Rjimati, E.C. Late Ediacaran-Cambrian structures and their reactivation during the Variscan and Alpine cycles in the Anti-Atlas (Morocco). J. Afr. Earth Sci. 2014, 98, 94–112. [Google Scholar] [CrossRef]
- Aude, J.L. Projet d’Accumulation Souterraine d’eau en Massif Granitique (Oued Ifni-Maroc): Application de l’Analyse Structurale. Ph.D. Thesis, Université Scientifique et Médicale de Grenoble, Grenoble, France, 1983. [Google Scholar]
- Benziane, F.; Yazidi, A.; Schulte, B.; Boger, S.; Stockhammer, S.; Lehmann, A.; Saadane, A.; Yazid, M. Notice explicative de la carte géologique du Maroc au 1/50000, Feuille Sidi Ifni. Notes Mém. Serv. Géol. Maroc 2016, 542. [Google Scholar]
- Schulte, B.; Benziane, F.; Yazidi, A.; Boger, S.; Stockhammer, S.; Lehmann, A.; Saadane, A.; Yazidi, M. Notes explicative de la carte géologique du Maroc au 1/50000, Feuille Arbaa Sahel. Notes Mém. Serv. Géol. Maroc 2016, 541. [Google Scholar]
- Yazidi, A.; Benziane, F.; Schulte, B.; Boger, S.; Stockhammer, S.; Lehmann, A.; Saadane, A.; Yazid, M. Notes explicative de la carte géologique du Maroc au 1/50000, Feuille Assaka. Notes Mém. Serv. Géol. Maroc 2016, 544. [Google Scholar]
- Andualem, T.G.; Demeke, G.G. Groundwater potential assessment using GIS and remote sensing: A case study of Guna tana landscape, upper Blue Nile Basin, Ethiopia. J. Hydrol. Reg. Stud. 2019, 24, 100610. [Google Scholar] [CrossRef]
- Dar, T.; Rai, N.; Bhat, A. Delineation of potential groundwater recharge zones using analytical hierarchy process (AHP). Geol. Ecol. Landsc. 2021, 5, 292–307. [Google Scholar] [CrossRef]
- Al–Djazouli, M.O.; Elmorabiti, K.; Rahimi, A.; Amellah, O.; Fadil, O.A.M. Delineating of groundwater potential zones based on remote sensing, GIS and analytical hierarchical process: A case of Waddai, eastern Chad. GeoJ. 2021, 86, 1881–1894. [Google Scholar] [CrossRef]
- Makonyo, M.; Msabi, M.M. Identification of groundwater potential recharge zones using GIS-based multi-criteria decision analysis: A case study of semi-arid midlands Manyara fractured aquifer, North–Eastern Tanzania. Remote Sens. Appl. Soc. Environ. 2021, 23, 100544. [Google Scholar] [CrossRef]
- Echogdali, F.Z.; Boutaleb, S.; Kpan, R.B.; Ouchchen, M.; Bendarma, A.; El Ayady, H.; Abdelrahman, K.; Fnais, M.S.; Sajinkumar, K.S.; Abioui, M. Application of fuzzy logic and fractal modeling approach for groundwater potential mapping in semi-arid Akka basin, Southeast Morocco. Sustainability 2022, 14, 10205. [Google Scholar] [CrossRef]
- Abijith, D.; Saravanan, S.; Singh, L.; Jennifer, J.J.; Saranya, T.; Parthasarathy, K.S.S. GIS-based multi-criteria analysis for identification of potential groundwater recharge zones–A case study from Ponnaniyaru watershed, Tamil Nadu, India. HydroResearch 2020, 3, 1–14. [Google Scholar] [CrossRef]
- Çelik, R. Evaluation of groundwater potential by GIS-based multicriteria decision making as a spatial prediction tool: Case study in the Tigris River Batman-Hasankeyf Sub-Basin, Turkey. Water 2019, 11, 2630. [Google Scholar] [CrossRef]
- Lentswe, G.B.; Molwalefhe, L. Delineation of potential groundwater recharge zones using analytic hierarchy process-guided GIS in the semi-arid Motloutse watershed, eastern Botswana. J. Hydrol. Reg. Stud. 2020, 28, 100674. [Google Scholar] [CrossRef]
- AL-Shammari, M.M.A.; AL-Shamma’a, A.M.; Al Maliki, A.; Hussain, H.M.; Mundher, Y.Z.; Armanuos, A.M. Integrated water harvesting and aquifer recharge evaluation methodology based on remote sensing and geographical information system: Case study in Iraq. Nat. Resour. Res. 2021, 30, 2119–2143. [Google Scholar] [CrossRef]
- Chowdhury, A.; Jha, M.K.; Chowdary, V.M. Delineation of groundwater recharge zones and identification of artificial recharge sites in West Medinipur district, West Bengal, using RS, GIS and MCDM techniques. Environ. Earth Sci. 2010, 59, 1209–1222. [Google Scholar] [CrossRef]
- Al–Abadi, A.M.; Al–Temmeme, A.A.; Al–Ghanimy, M.A. A GIS-based combining of frequency ratio and index of entropy approaches for mapping groundwater availability zones at Badra-Al Al-Gharbi-Teeb areas, Iraq. Sustain. Water Resour. Manag. 2016, 2, 265–283. [Google Scholar] [CrossRef]
- Moore, I.D.; Burch, G.J. Sediment transport capacity of sheet and rill flow: Application of unit stream power theory. Water Resour. Res. 1986, 22, 1350–1360. [Google Scholar] [CrossRef]
- Qadir, J.; Bhat, M.S.; Alam, A.; Rashid, I. Mapping groundwater potential zones using remote sensing and GIS approach in Jammu Himalaya, Jammu and Kashmir. GeoJournal 2019, 85, 487–504. [Google Scholar] [CrossRef]
- Abrams, W.; Ghoneim, E.; Shew, R.; LaMaskin, T.; Al-Bloushi, K.; Hussein, S.; AbuBakr, M.; Al-Mulla, E.; Al-Awar, M.; El-Baz, F. Delineation of groundwater potential (GWP) in the northern United Arab Emirates and Oman using geospatial technologies in conjunction with Simple Additive Weight (SAW), Analytical Hierarchy Process (AHP), and Probabilistic Frequency Ratio (PFR) techniques. J. Arid Environ. 2018, 157, 77–96. [Google Scholar] [CrossRef]
- Rajasekhar, M.; Raju, G.S.; Sreenivasulu, Y.; Raju, R.S. Delineation of groundwater potential zones in semi-arid region of Jilledubanderu river basin, Anantapur District, Andhra Pradesh, India using fuzzy logic, AHP and integrated fuzzy-AHP approaches. HydroResearch 2019, 2, 97–108. [Google Scholar] [CrossRef]
- Saaty, T.L. The Analytic Hierarchy Process: Planning, Priority Setting, Resource Allocation, 12th ed.; McGraw-Hill International Book Co.: New York, NY, USA, 1980. [Google Scholar]
- Saaty, T.L. Making and validating complex decisions with the AHP/ANP. J. Syst. Sci. Syst. Eng. 2005, 14, 1–36. [Google Scholar] [CrossRef]
- Saaty, T.L. Decision making with the analytic hierarchy process. Int. J. Serv. Sci. 2008, 1, 83–98. [Google Scholar] [CrossRef]
- Mu, E.; Pereyra-Rojas, M. Understanding the analytic hierarchy process. In Practical Decision Making; Springer: Cham, Switzerland, 2017; pp. 7–22. [Google Scholar] [CrossRef]
- Lee, S.; Kim, Y.S.; Oh, H.J. Application of a weights-of-evidence method and GIS to regional groundwater productivity potential mapping. J. Environ. Manage. 2012, 96, 91–105. [Google Scholar] [CrossRef]
- Kaliraj, S.; Chandrasekar, N.; Magesh, N.S. Identification of potential groundwater recharge zones in Vaigai upper basin, Tamil Nadu, using GIS-based analytical hierarchical process (AHP) technique. Arab. J. Geosci. 2013, 7, 1385–1401. [Google Scholar] [CrossRef]
- Saaty, T.L. Decision Making for Leaders: The Analytic Hierarchy Process for Decisions in a Complex World; RWS Publications: Pittsburgh, PA, USA, 1990. [Google Scholar]
- Sinha, A.; Nikhil, S.; Ajin, R.S.; Danumah, J.H.; Saha, S.; Costache, R.; Rajaneesh, A.; Sajinkumar, K.S.; Amrutha, K.; Johny, A.; et al. Wildfire Risk Zone Mapping in Contrasting Climatic Conditions: An Approach Employing AHP and F-AHP Models. Fire 2023, 6, 44. [Google Scholar] [CrossRef]
- Abioui, M.; Ikirri, M.; Boutaleb, S.; Faik, F.; Wanaim, A.; Id-Belqas, M.; Echogdali, F.Z. GIS for Watershed Characterization and Modeling: Example of the Taguenit River (Lakhssas, Morocco). In Water, Land, and Forest Susceptibility and Sustainability: Geospatial Approaches and Modeling; Chatterjee, U., Pradhan, B., Kumar, S., Saha, S., Zakwan, M., Eds.; Elsevier: Amsterdam, The Netherlands, 2023; pp. 61–85. [Google Scholar] [CrossRef]
- Khan, M.R.; Alam, M.J.; Tabassum, N.; Khan, N.A. A Systematic review of the Delphi–AHP method in analyzing challenges to public-sector project procurement and the supply chain: A developing country’s perspective. Sustainability 2022, 14, 14215. [Google Scholar] [CrossRef]
- Mandal, P.; Saha, J.; Bhattacharya, S.; Paul, S. Delineation of groundwater potential zones using the integration of geospatial and MIF techniques: A case study on Rarh region of West Bengal, India. Environ. Chall. 2021, 5, 100396. [Google Scholar] [CrossRef]
- Maliva, R.; Missimer, T. Aridity and drought. In Arid Lands Water Evaluation and Management; Springer: Berlin/Heidelberg, Germany, 2012; Volume 1, pp. 21–39. [Google Scholar] [CrossRef]
- Nampak, H.; Pradhan, B.; Abd Manap, M. Application of GIS based data driven evidential belief function model to predict groundwater potential zonation. J. Hydrol. 2014, 513, 283–300. [Google Scholar] [CrossRef]
- Al-Abadi, A.M. Modeling of groundwater productivity in northeastern Wasit Governorate, Iraq using frequency ratio and Shannon’s entropy models. Appl. Water Sci. 2015, 7, 699–716. [Google Scholar] [CrossRef]
- Akula, A.; Singh, A.; Ghosh, R.; Kumar, S.; Sardana, H.K. Target recognition in infrared imagery using convolutional neural network. In Proceedings of the International Conference on Computer Vision and Image Processing, Roorkee, India, 9–12 September 2017; pp. 25–34. [Google Scholar] [CrossRef]
- Mohammadzadeh, A.; Zoej, M.J.V.; Tavakoli, A. Automatic main road extraction from high resolution satellite imageries by means of particle swarm optimization applied to a fuzzy-based mean calculation approach. J. Indian Soc. Remote Sens. 2009, 37, 173–184. [Google Scholar] [CrossRef]
Disclaimer/Publisher’s Note: The statements, opinions and data contained in all publications are solely those of the individual author(s) and contributor(s) and not of MDPI and/or the editor(s). MDPI and/or the editor(s) disclaim responsibility for any injury to people or property resulting from any ideas, methods, instructions or products referred to in the content. |
© 2023 by the authors. Licensee MDPI, Basel, Switzerland. This article is an open access article distributed under the terms and conditions of the Creative Commons Attribution (CC BY) license (https://creativecommons.org/licenses/by/4.0/).