Article

Diet and Trophic Structure of the Fish Community in a Small Sub-Tropical Lake in Central Mexico

by
Arely Ramírez-García
1,*,
Erik Jeppesen
2,3,4,5,6,
Rodrigo Moncayo-Estrada
7,
Norman Mercado-Silva
8 and
Omar Domínguez-Domínguez
9
1
Programa Institucional de Doctorado en Ciencias Biológicas, Universidad Michoacana de San Nicolás de Hidalgo, Morelia 58000, Michoacan, Mexico
2
Department of Ecoscience, Aarhus University, 8000 Aarhus, Denmark
3
Sino-Danish Centre for Education and Research, Beijing 100049, China
4
Limnology Laboratory, Department of Biological Sciences, Centre for Ecosystem Research and Implementation, Middle East Technical University, Ankara 06800, Turkey
5
Institute of Marine Sciences, Middle East Technical University, Mersin 33010, Turkey
6
Institute for Ecological Research and Pollution Control of Plateau Lakes, School of Ecology and Environmental Science, Yunnan University, Kunming 650000, China
7
Instituto Politécnico Nacional, CICIMAR, La Paz 23096, Baja California Sur, Mexico
8
Centro de Investigación en Biodiversidad y Conservación, Universidad Autónoma del Estado de Morelos, Cuernavaca 62209, Morelos, Mexico
9
Laboratorio de Biología Acuática, Universidad Michoacana de San Nicolás de Hidalgo, Morelia 58000, Michoacan, Mexico
*
Author to whom correspondence should be addressed.
Water 2023, 15(7), 1301; https://doi.org/10.3390/w15071301
Submission received: 1 March 2023 / Revised: 19 March 2023 / Accepted: 23 March 2023 / Published: 25 March 2023

Abstract

:
Analyses of trophic structure and feeding habits of the fish community can provide information on the complex biotic and abiotic interactions in lake ecosystems. Based on stomach content and δ13C and δ15N stable isotope analyses, we conducted a comprehensive study of the diet of the fish community and its trophic structure in subtropical Lake Zacapu in central Mexico. Overall, there was good agreement between the results based on the diet and the isotope analysis. Fish diets consisted mainly of aquatic macroinvertebrates, which were abundant in the lake. Most species were secondary consumers and trophic generalists across the four sites and two seasons. The food web structure did not differ significantly between the sites or seasons. Our results suggest a low trophic position of native species having a wide spatial trophic niche and niche width. Trophic diet overlap was greater between native species (especially between species from the same family) than between non-native species. Our study provides new information on the trophic interactions in a subtropical lake, rich in endemic species and an important resource for human communities.

1. Introduction

Small lakes are diverse and often productive [1], and they provide water sources for human use, as well as a natural habitat for aquatic organisms, including endemic species [2]. They are often influenced by human activities that can affect the structure and function of their food webs [3]. Understanding complex interactions between lake communities and their effects on energy flow and community structure is essential for the effective management of lake systems [4].
Fish are important drivers of food webs in lakes; they occupy a great variety of trophic niches and circulate matter and energy from basal resources to the highest levels of the web [5]. Fish and ecosystem trophic structure studies are essential for defining conservation strategies for aquatic ecosystems and for integrated assessment of their resources [6]. Evaluation of the feeding habits of fishes in different parts of their life cycle is useful to determine the status of the species within the food web and, thus, contributes to the understanding of the community structure [7].
Analyzing the diets of different fishes in a community can provide information about inter- or intraspecific interactions and the mechanisms that determine the distribution of resources [8]. For example, competition occurs when species share the same prey [9] and the resources available are limited [10]. Competitive interactions are usually much stronger within than between species of a community [11]. When competition is for the same resource, it can affect habitat selection patterns and niche overlap [12]. It has been reported that competition is stronger between native species than between non-native species [13,14]. Coexistence is the degree to which phylogenetic relatedness between species reflects their ecological similarity, and it can, thus, be used to understand community assembly [15], and when the relationship is closer, for example, the same family or genus, the niche overlap increases [16].
Elucidating the trophic position of different fish species in a community may help to understand the complexity and functioning of a food web [17]. Changes in the trophic position of species are often associated with abiotic and biotic factors, such as hydrological stability, ecosystem area, diet composition, the availability of prey, and the body size of organisms [18,19]. Identifying the trophic position also helps to reveal the functional role of a species within the trophic web and its specific contribution to energy flow pathways [17].
Stomach content analysis constitutes a classical method to elucidate the diet of aquatic organisms [20]. However, data obtained by this method only provides a snapshot of the diet of the consumer at the time of sampling [21]. Stable isotope analysis techniques have been used to integrate energetic information over longer periods [22]. In stable isotope studies, carbon signatures identify energy sources, while nitrogen signatures are related to the trophic position of a consumer within the food web [23,24]. The joint use of stomach and stable isotope analyses allows a more comprehensive examination of the food web relationships and modeling of the trophic structure in an ecosystem [25] and further improves the understanding of the trophic position of species in the web and of how species (for example native versus non-native species) interact [26]. The combination of the two methods has been successfully used for elucidating food webs in freshwater and marine systems [27,28,29,30]. However, there are few such studies from lakes [31,32].
Lake Zacapu is shallow (average~2.7 m) and is maintained by the contribution of numerous tributaries and springs [33]. The hydraulic renewal is fast (approx. five days) due to the continuous flow of water from springs, leading to good water quality and a high buffering capacity for pollutants. The lake has little human disturbance [33,34] and has many native and endemic fish species [35,36].
Here, we describe the diet of fishes in Lake Zacapu temporally (two seasons) and spatially (4 sampling sites) and document their trophic position in the food web. Our hypotheses were that (1) the trophic position of fishes evaluated from stable isotope data will mimic the diet data, (2) homogeneous environmental characteristics, different substrates, and the hydrodynamics of the lake result in high availability and diversity of food resources within the lake for fish and low contribution from external sources, and (3) trophic diet overlap will be greater for native species than for non-native species.

2. Materials and Methods
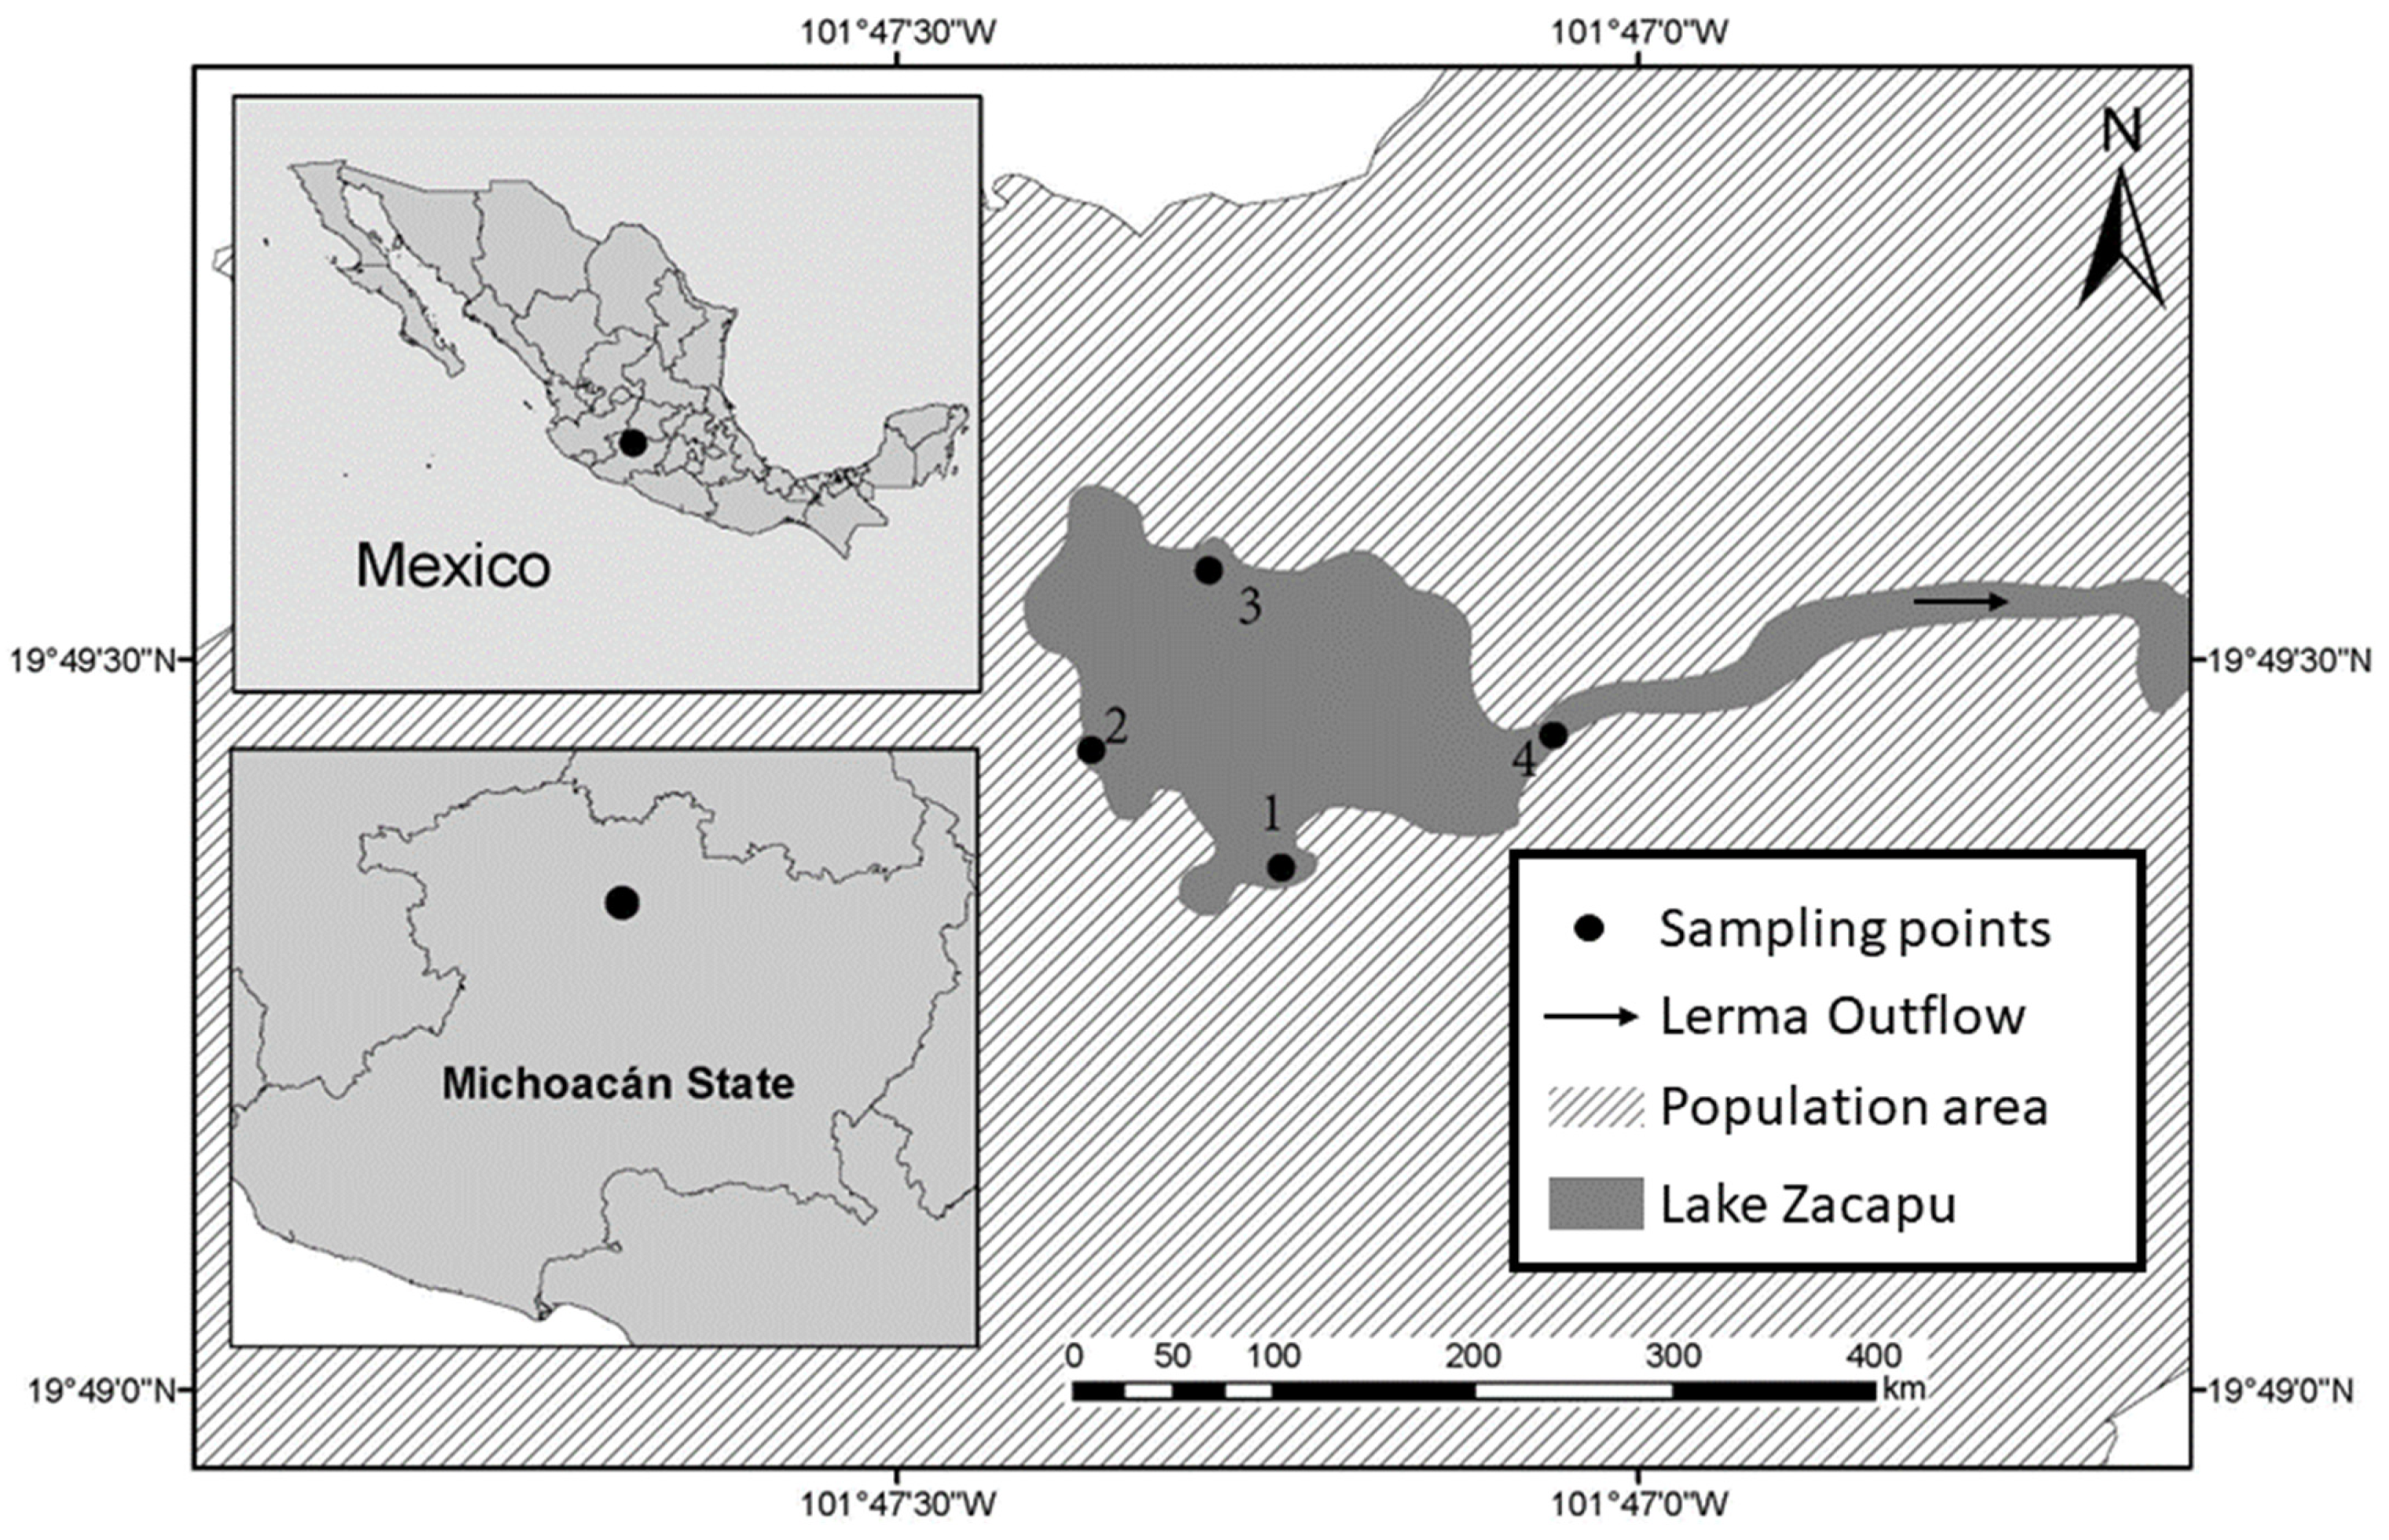
2.1. Study Area

Lake Zacapu is a small sub-tropical lake (ca. 20 ha) located in central-western Mexico at 1980 m.a.s.l. and is part of the Lerma-Chapala River basin (Figure 1).
The air temperature varies from 14 to 18 °C during the season, and the total annual precipitation is 800–1200 mm [37]. In 2003, the lake was declared a Natural Protected Area; its management plan was published in 2005 [38]. Lake Zacapu is a monomictic subtropical ecosystem with low turbidity [30,31,32]. This shallow lake (average depth~2.7 m) is fed by 12 springs, and it has a high hydraulic renewal rate (approx. 5 days) and a high buffering capacity [33,34]. The lake is also considered homogeneous, with good water quality because of little human disturbance and the short renewal time, and spatial variations in physical and chemical variables are low [35,36,39,40,41]. Four sampling sites were chosen to represent the different shorelines (Figure 1), including two major spring-influenced areas (sites 1 and 3; [35,36]).

2.2. Environmental Variables

Environmental variables were measured at each site during the samplings. We used a multiparameter probe (YSI EXO2; YSI Inc., Yellow Springs, OH, USA) and measured conductivity (µS/cm), temperature (°C), dissolved oxygen (O2 mg/L), reduction-oxidation potential (mv), total dissolved solids (TDS mg/L−1), ammonia (NH3, mg/L), nitrate (NO3, mL/L), ammonium (NH4, mg/L), and pH. We compared two seasons (wet and dry). Other studies from the lake have reported that there are no significant differences between the environmental variables between different points of the lake or between different months of the year [35,36,41], and most environmental variables have remained in the same range for decades (1995 to 2019) [36]. Whether the feeding strategy of the fish species change between the two seasons of the year is, however, not known.

2.3. Fish Collection

We conducted fish sampling over an annual cycle from May 2019 to May 2020 for diet analysis every three months and for stable isotopes in two seasons (dry and wet). Multiple fishing methods were used to sample the fish. We used a seine net (25 m length, 1.8 m height, and 5 mm mesh size) to sample fish in areas with a maximum depth of 1.5 m. We also used minnow traps (stainless steel, square mesh 0.5 m, cylindrical, 42 cm long and 19 cm in diameter, with two 2.5 cm holes with inverted cone inlets) set for one hour per site. Shallow (<1 m) areas near shores within site were sampled with electrofishing for half an hour (DC-backpack electrofisher model ABP-3, ETS electrofishing systems, LLC, average power~200 W, peak voltage~250 V, peak current~10 A). In addition, specimens were also obtained from local fishermen. We identified fish species using published keys [42]. The fish were euthanized with an overdose of benzocaine. Fishes for stable isotope analysis were preserved in ice water, and fish for stomach content analysis were preserved in 4% formaldehyde and transported to the Aquatic Biology Laboratory from the Universidad Michoacana de San Nicolás de Hidalgo. All field sampling techniques and fish handling protocols were reviewed and approved by the Mexican Ministry of Environmental and Natural Resources (SEMARNAT-SGPA/DGVS/00012/19), Ministry of the Environment, Climate Change and Natural Resources (SEMACCDET-OS. 0084/2019), and the Secretariat of Agriculture and Rural Development (SAGARPA: PPF/DGOPA-014/20).

2.4. Invertebrate Collection

In addition to fish, we gathered samples of other food web components. Thus, we sampled benthic aquatic macroinvertebrates using a 500 µm D-shape net. The collected specimens were separated in situ from the abiotic material and subsequently transported to the laboratory. Macroinvertebrates were processed per individual when the size of the organism was sufficient to obtain at least 2 mg (dry weight); if individuals were not large enough (i.e., Hyalella), we pooled all available individuals from each site per season. Plankton was collected by filtering 300 L of water covering the entire water column using two nets of different mesh sizes (64 μm and 200 μm). These bulk samples contained a mix of phytoplankton (larger sizes) and zooplankton. All the samples were frozen at −20 °C until laboratory processing.

2.5. Laboratory Analysis

Standard length and weight were measured for each individual fish. Each fish’s stomach was dissected, and the stomach was preserved in 5% formaldehyde. Later the content was analyzed manually using a dissecting microscope at 10x magnification; prey items were identified to the lowest possible taxonomic level using invertebrate keys (for insects: [43] and non-insects: [44]). For the species Cyprinus carpio and Algansea tincella, we could not evaluate the stomach content due to the low capture of organisms, and they were, therefore, only considered in the stable isotopic analysis.
From the fish used for stomach analysis, muscle tissue samples (2 cm3) from the lateral back region of three specimens of all fish species were taken, labeled, transferred to plastic bags, frozen at −20 °C, and stored until processing.
Fish muscle tissue, plankton samples, and macroinvertebrate individuals were dried and pulverized, and~1 mg was weighed into tin capsules and analyzed for δ15N and δ15 C stable isotopes. Stable isotope analysis was performed at the University of New Mexico Department of Earth and Planetary Sciences. Two percent of all samples were processed in duplicate (mean standard error 0.5‰ for C and 1.5‰ for N). The stable isotope analyses were conducted based on 112 fish, 4 phytoplankton samples, 4 zooplankton samples, and 29 invertebrate samples from the wet season and 118 fish, 4 phytoplankton samples, 4 zooplankton samples, and 26 invertebrate samples from the dry season.

2.6. Data Analysis

2.6.1. Environmental Variables

We tested for differences in environmental variables among seasons (dry and wet) and sites (four sites) using Kruskal Wallis non-parametric analyses of variance (Dunn test, as a posteriori). The analysis was performed only for the samples obtained to describe isotopes because the abiotic characteristics related to the diet analysis have already been described and analyzed elsewhere [36].

2.6.2. Diet Analysis

To determine whether the number of analyzed stomachs accurately described the diet of the species, a prey accumulation curve followed the criteria of [45]. We calculated the percent of a prey-specific index of relative importance (%PSIRI) to reveal the dominance of prey using the following equation [46]:
% P S I R I = % F O i × ( % P N i + % P W i ) / 2
%PSIRI includes the percent frequency of occurrence (%FOi = a number of stomachs with prey i divided by the total number of stomachs). Additionally, it includes the prey-specific abundance ( % P N i ,   % P W i ) : % P A i = j = 1 n % A i j / n i ,   the average percent abundance (%Ni, %Wi): % A i = j = 1 n % A i j / n , where %Aij is the abundance (counts or weights) of prey i in stomach sample j, ni is the number of stomachs containing prey i, and n is the total number of stomachs. The trophic level of each taxon allowed us to gain information on the position that organisms occupied in the food web and was estimated using the TrophLab software [47]. The results were expressed as a trophic level between 1 and 5, where 0–1 corresponds to decomposers, 1–2 to primary producers, 2–3 to primary consumers, 3–4 to secondary consumers, and >4 to tertiary consumers. The omnivory level was estimated by the omnivory index (OI) proposed by [48]. The index is dimensionless and describes the distribution of interactions at each trophic level, and the values are in the range between 0 and 1. When OI is close to 0, the consumer is considered a specialist. If the value of OI is close to 1, the consumer feeds on several trophic levels. Diet overlaps between different fish taxa were assessed via Horn’s index [49] using the following equation:
Ro = ∑(Pij + Pik) log (Pij + Pik) − ∑pij log Pij − ∑pik log Pik/2log 2
where Ro = is Horn´s niche overlap index between the species; Pij is the proportion of resource i that is used by species j; Pik is the proportion of the resource i that is used by the species k; and N is the total number of resources. The values in this index vary from 0 to 1. Values between 0 and 0.29 indicate low superposition, values between 0.30 and 0.65 indicate medium superposition and values > 0.66 indicate high overlap [49]. Fish species diets according to the PSIRI index were compared using cluster analysis following the Bray–Curtis ordination method and Euclidian distance as an index of dissimilitude. To complement the cluster analysis and to visualize the main prey and fish species, we used a principal component analysis (PCA). To test for significant differences in the diet composition between the groups that emerged from the cluster analysis, a non-parametric Permutational Multivariate Analysis of Variance (PERMANOVA; Bray Curtis index) was performed.

2.6.3. Stable Isotopes

Differences in carbon and nitrogen isotopic signatures between species from different sites were analyzed with ANOVA with a posthoc Tukey test to identify significant differences; for differences between seasons, a student´s test was applied. A bivariate plot of the mean (±1 SE) isotopic values (δ15N on the y-axis; δ13C on the x-axis) was made for all fishes (per species), including grouped benthic invertebrates, zooplankton, and phytoplankton.
The niche breadth and isotopic overlap degree of the species were estimated by computerizing the standard Bayesian ellipses area in R (SIBER) in the bidimensional isotopic space of δ15N and δ13C values [50]. These metrics reflect assemblage trophic niche space as the area occupied within a δ13C–δ15N biplot as a range in δ13C (CR), range in δ15N (NNR), mean distance to the centroid (CD), and total area (TA). CR is a measure of basal δ13C variation, NNR provides information on the food chain length, CD indexes trophic diversity within the assemblage, and TA represents the total trophic niche space occupied by the assemblage. The extent of trophic redundancy within the assemblage was measured by two additional metrics: mean nearest neighbor distance (MNND) and standard deviation of the nearest neighbor distance (SDNND). Theoretically, smaller MNND and SDNND indicate greater trophic redundancy (groups with similar trophic niches; [51,52]). Corrected Bayesian standard ellipse area (SEAc) was used to quantify the trophic niche space of the fish community, and the overlap niche was obtained between seasons and sites [48]. To determine the trophic position of the fish species, we used a Bayesian model using the package tRophicPosition in R for the calculation of consumer trophic position using C and N stable isotopes [53].

3. Results

3.1. Environmental Variables
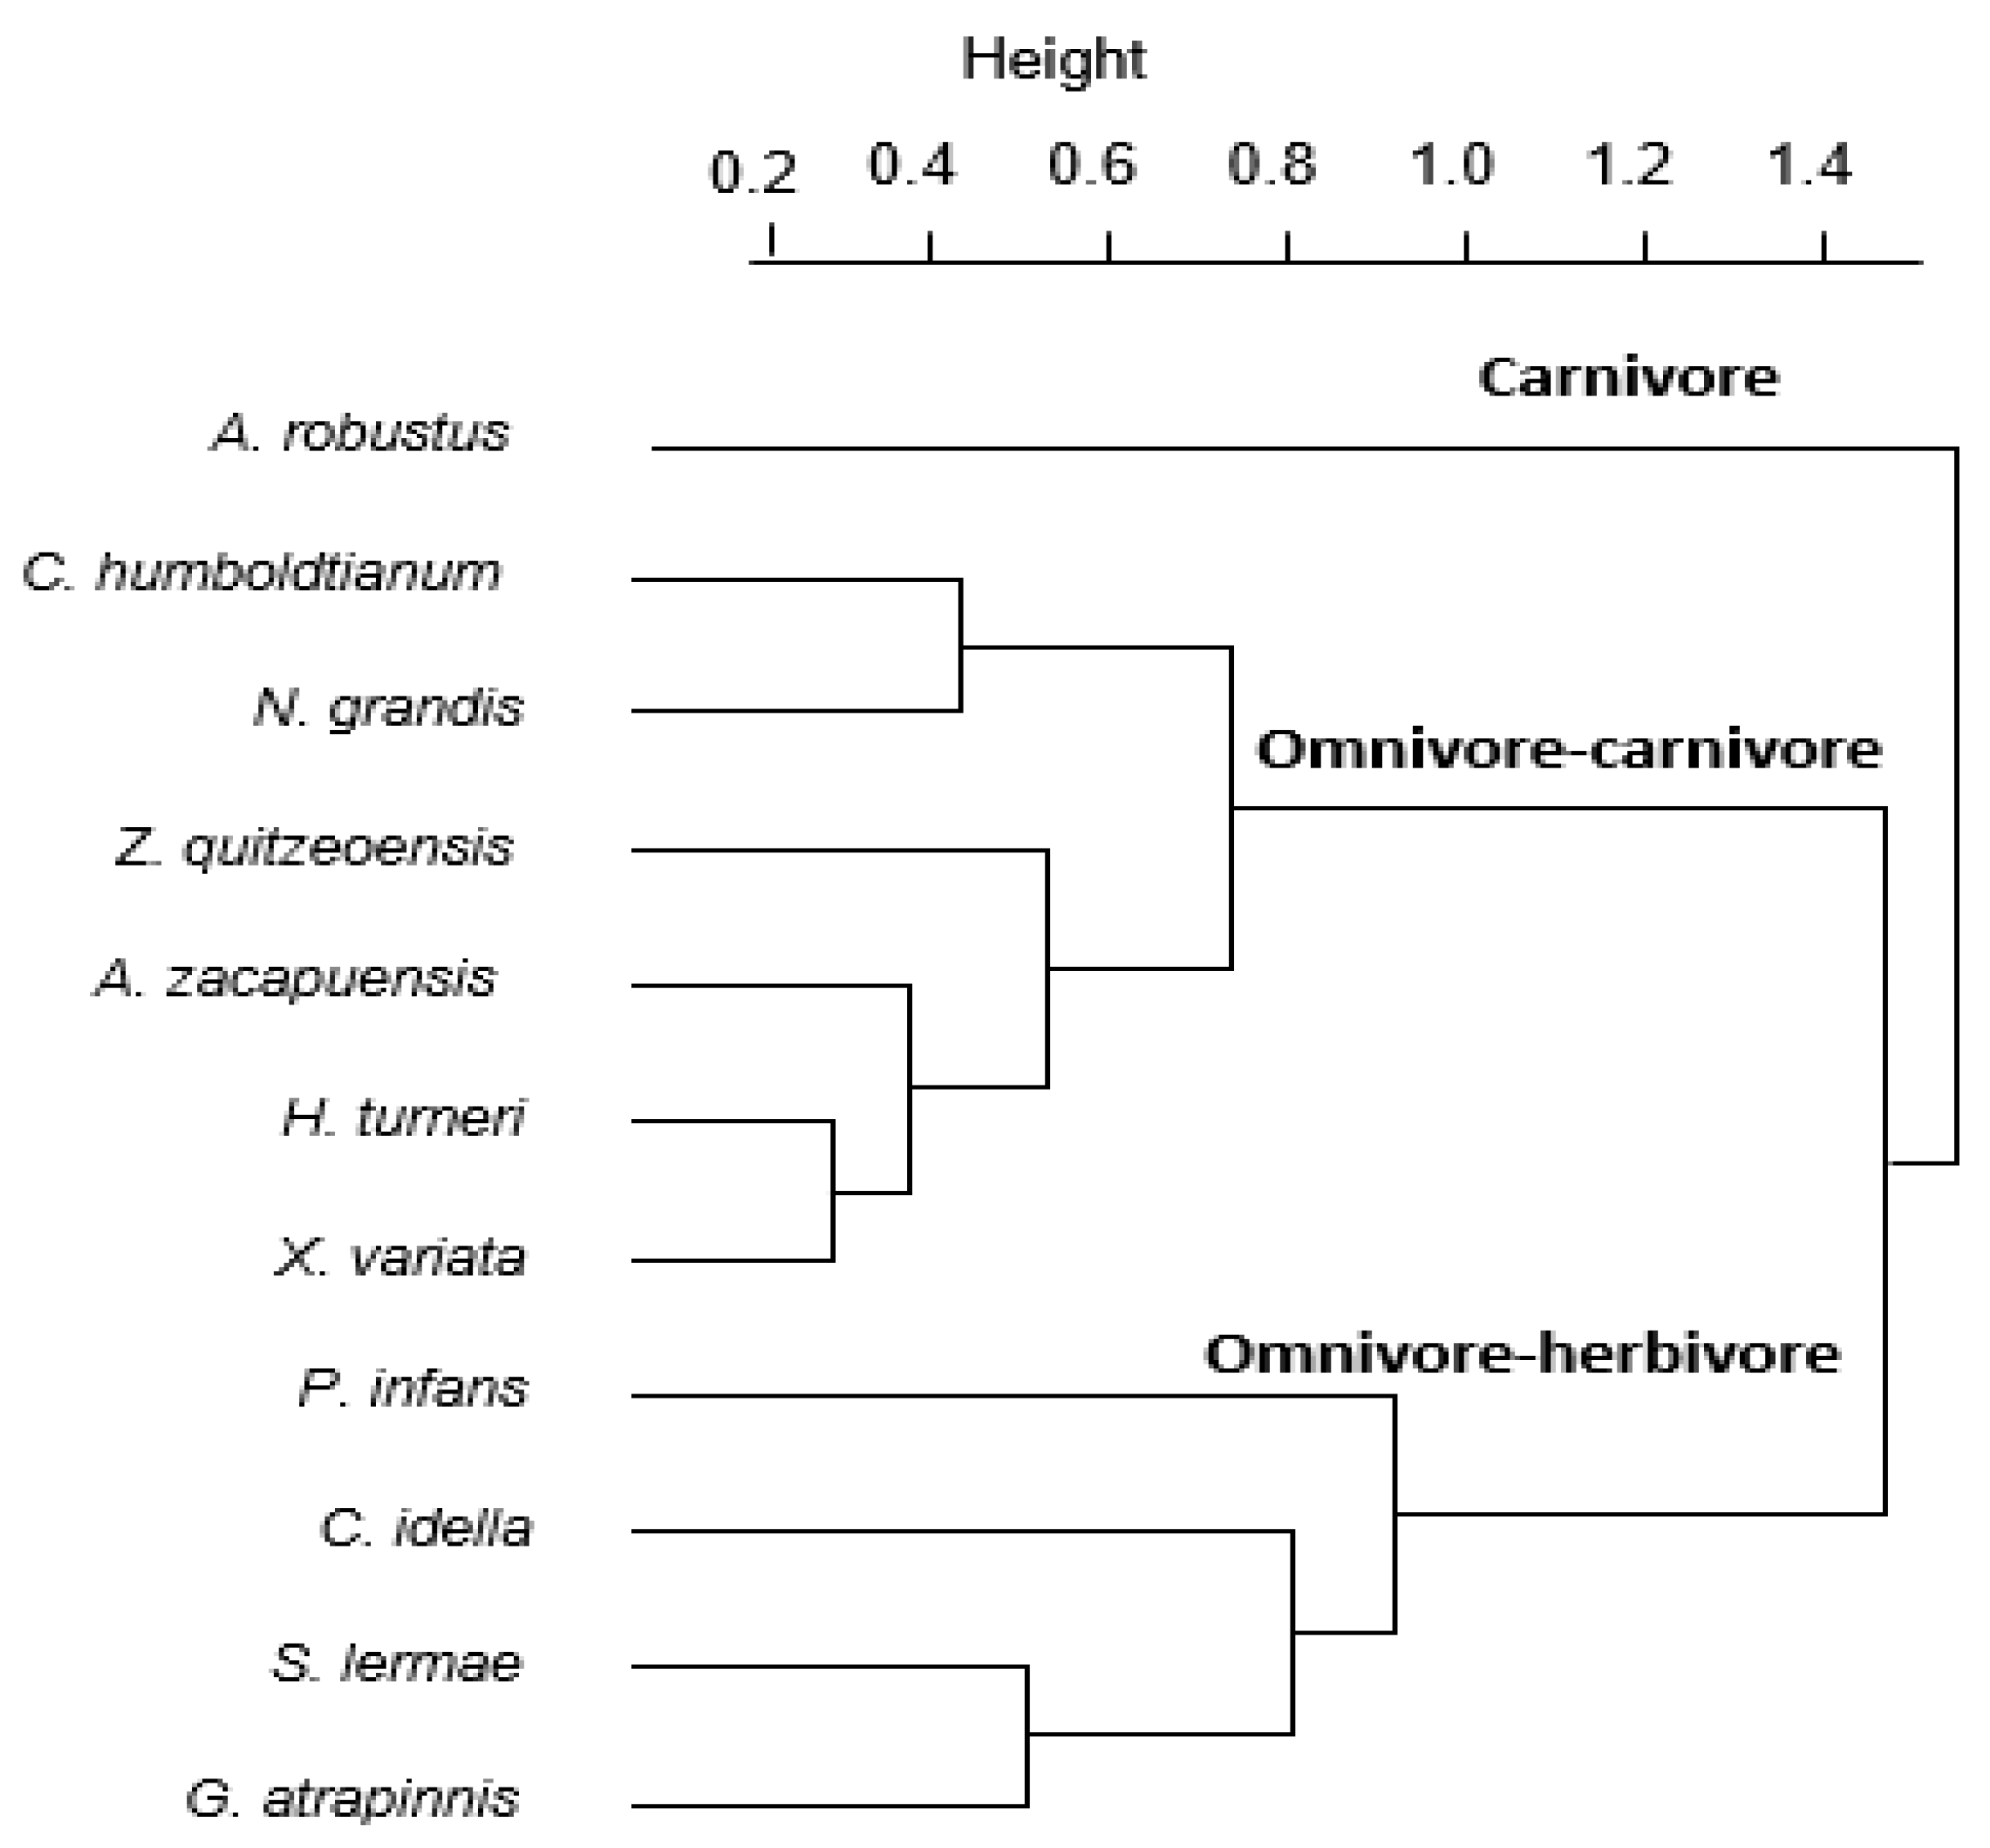
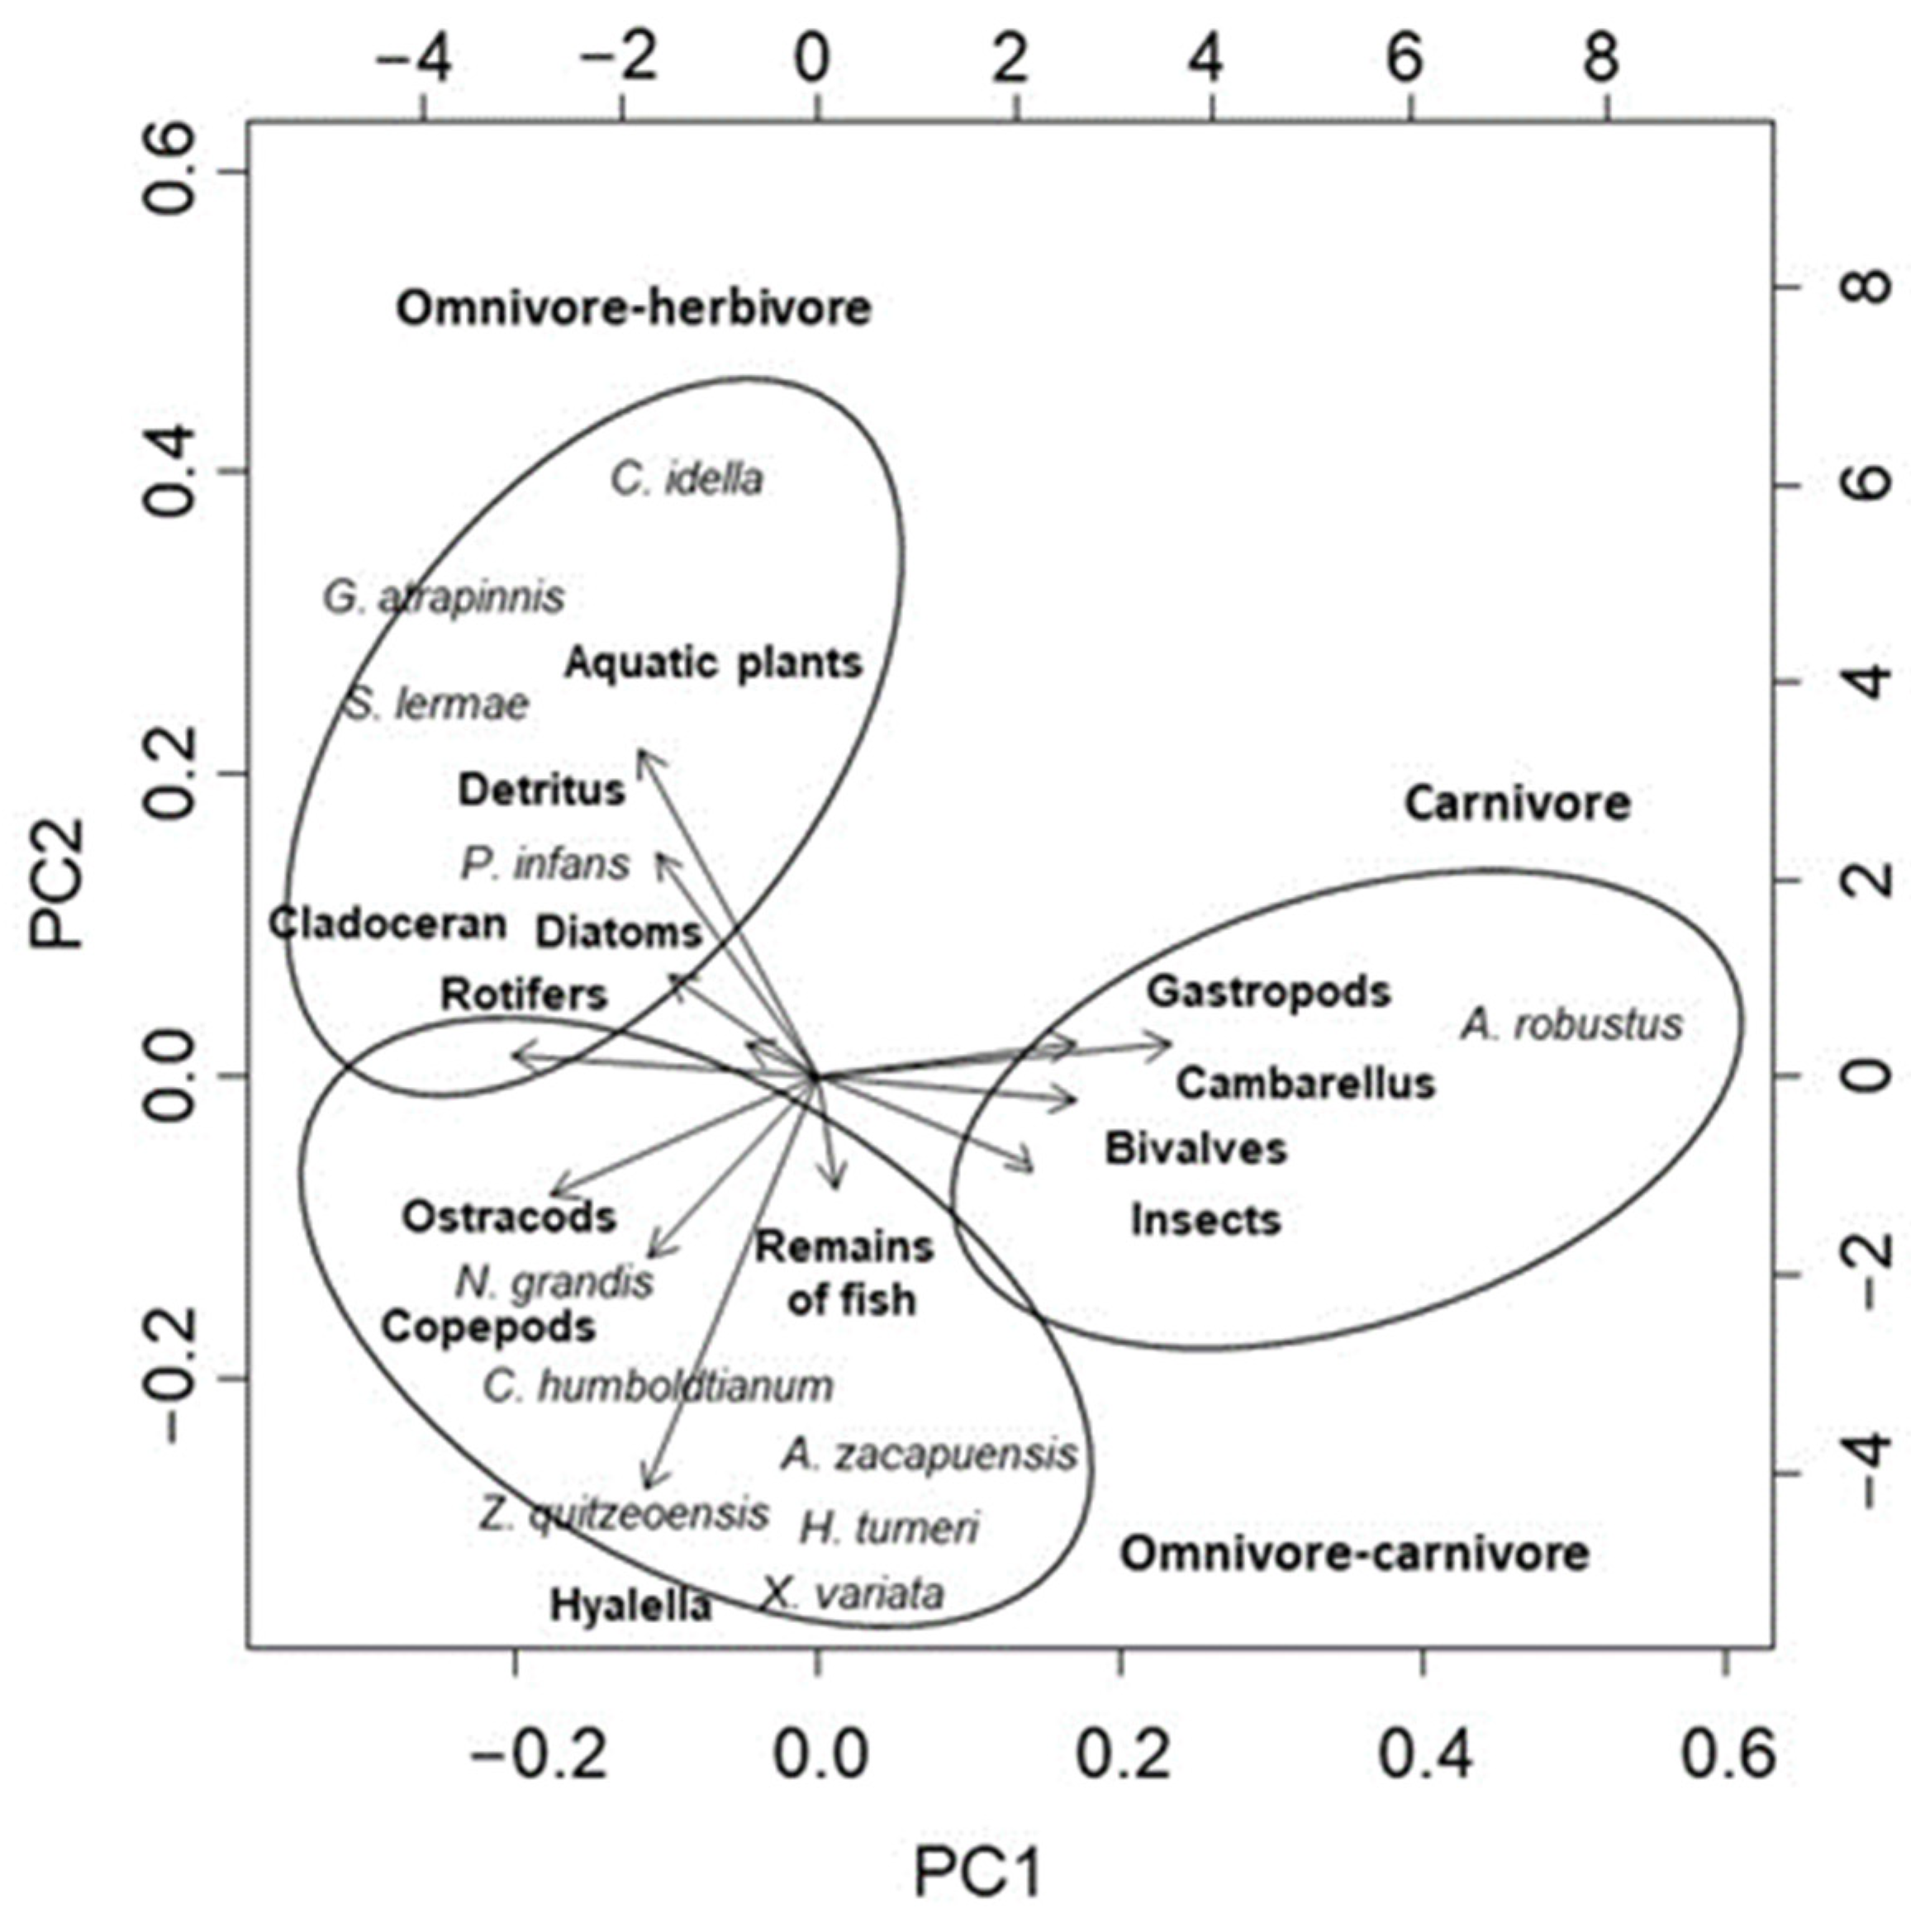
Kruskal-Wallis test showed no significant differences between the dry and wet seasons for temperature (x2 = 3.6, p = 0.056), dissolved oxygen (x2 = 0.2, p = 0.599), TDS (x2 = 0.8, p = 0.369), conductivity (x2 = 1.8, p = 0.170), NO3 (x2 = 2.6, p = 0.102), and NH4 (x2 = 2.2, p = 0.134) (Table 1).
Significant differences were, however, found for pH (x2 = 6.4, p = 0.0113) and NH3 (x2 = 6.1, p = 0.012). Dunn test shows that pH in the dry season was higher than in the wet season (alpha = 0.05, p < 0.01), and vice versa for NH3. (alpha = 0.05, p < 0.01). We did not find significant differences among the sites for any of the other variables (Table 1).

3.2. Diet Analysis

Eleven species were recorded in the lake, and these belonged to four families, Goodeidae being the most common (68% of all the species) (Table 2).
Apart from two (C. idella and C. carpio), all fish species present in the lake are native to Mexico. From a total of 3403 stomachs, 3229 (94%) were analyzed and used for establishing feeding groups. The remaining stomachs were empty or had indeterminate dietary content.
The food items recorded were classified as follows: Chordata (including whole fish, scales, fins, and fish remains); Arthropoda (including insect remains and the family Chironomidae); Crustacea (including Malacostraca [genera Hyalella and Cambarellus], Ostracoda, Branchiopoda [genus Bosmina], and Maxillopoda [copepods]); Mollusca (including Gastropoda and Bivalvia); Rotifera (comprising Monogononta, genus Keratella); Diatomista (including Diatomea [genus Fragilaria, Synedra, Cymbela]; Magnoliophyta (including vegetal remains and Liliopsida within the genus Potamogeton), and Bryozoa (genus Plumatella) (Table 2).
The PSIRI index revealed that A. robustus mainly fed on Cambarellus (13.0), followed by fish remains (7.1). Hyalella was the item occurring in the highest proportion for many species, Z. quitzeoensis (13.7), N. grandis (20.3), A. zacapuensis (22.9), H. turner (31.2), X. variata (27.4), and C. humboldtianum (27.1). The species C. idella was the only one consuming Potamogeton (21.3). Goodea atripinnis mainly fed on detritus (9.7), S. lermae mainly on aquatic insect remains (4.6; 28.6, respectively), and P. infans on Bosmina (24.6) (Table 2).
C. idella had the most specialized niche breath, and G. atripinnis was the most generalist species (Table 3).
All species occupied two positions in the trophic web: primary and secondary consumers (Table 3). The omnivory index indicated that most species were generalists (Table 3). G. atripinnis, S. lermae, and A. robustus had high omnivory index values, indicating that these species fed on more trophic levels than the other species. Horn’s niche overlap index suggests high food overlap between the species A. zacapuensis vs. H. turneri, X. variata, Z. quitzeoensis; S. lermae vs C. idella, G. atripinnis; X. variata vs Z. quitzeoensis, C. humboldtianum, N. grandis; C. humboldtinum vs. N. grandis; and G. atripinnis vs. S. lermae (Table 4).
The combination of the PSIRI values for each dietary item (Table 2) used in a cluster analysis revealed a classification into three trophic groups: Carnivore (one species, mostly feeding on insects and mollusks), omnivore-carnivore (six species feeding mostly on copepods, ostracods, Hyalella, and fish remains), and omnivore-herbivore (four omnivorous species feeding mostly on rotifers, cladocerans, aquatic plants, diatoms, and detritus) (Figure 2 and Figure 3).
The principal component analysis (PCA) separated out the same three trophic groups (Figure 3), with the first two axes explaining 66% of the variation (PC1 = 47% and PC2 = 19%). The PERMANOVA test gave strong statistical support to this classification, with significant differences in PSIRI index values for the dietary items between the groups (F = 6.35, p < 0.001).

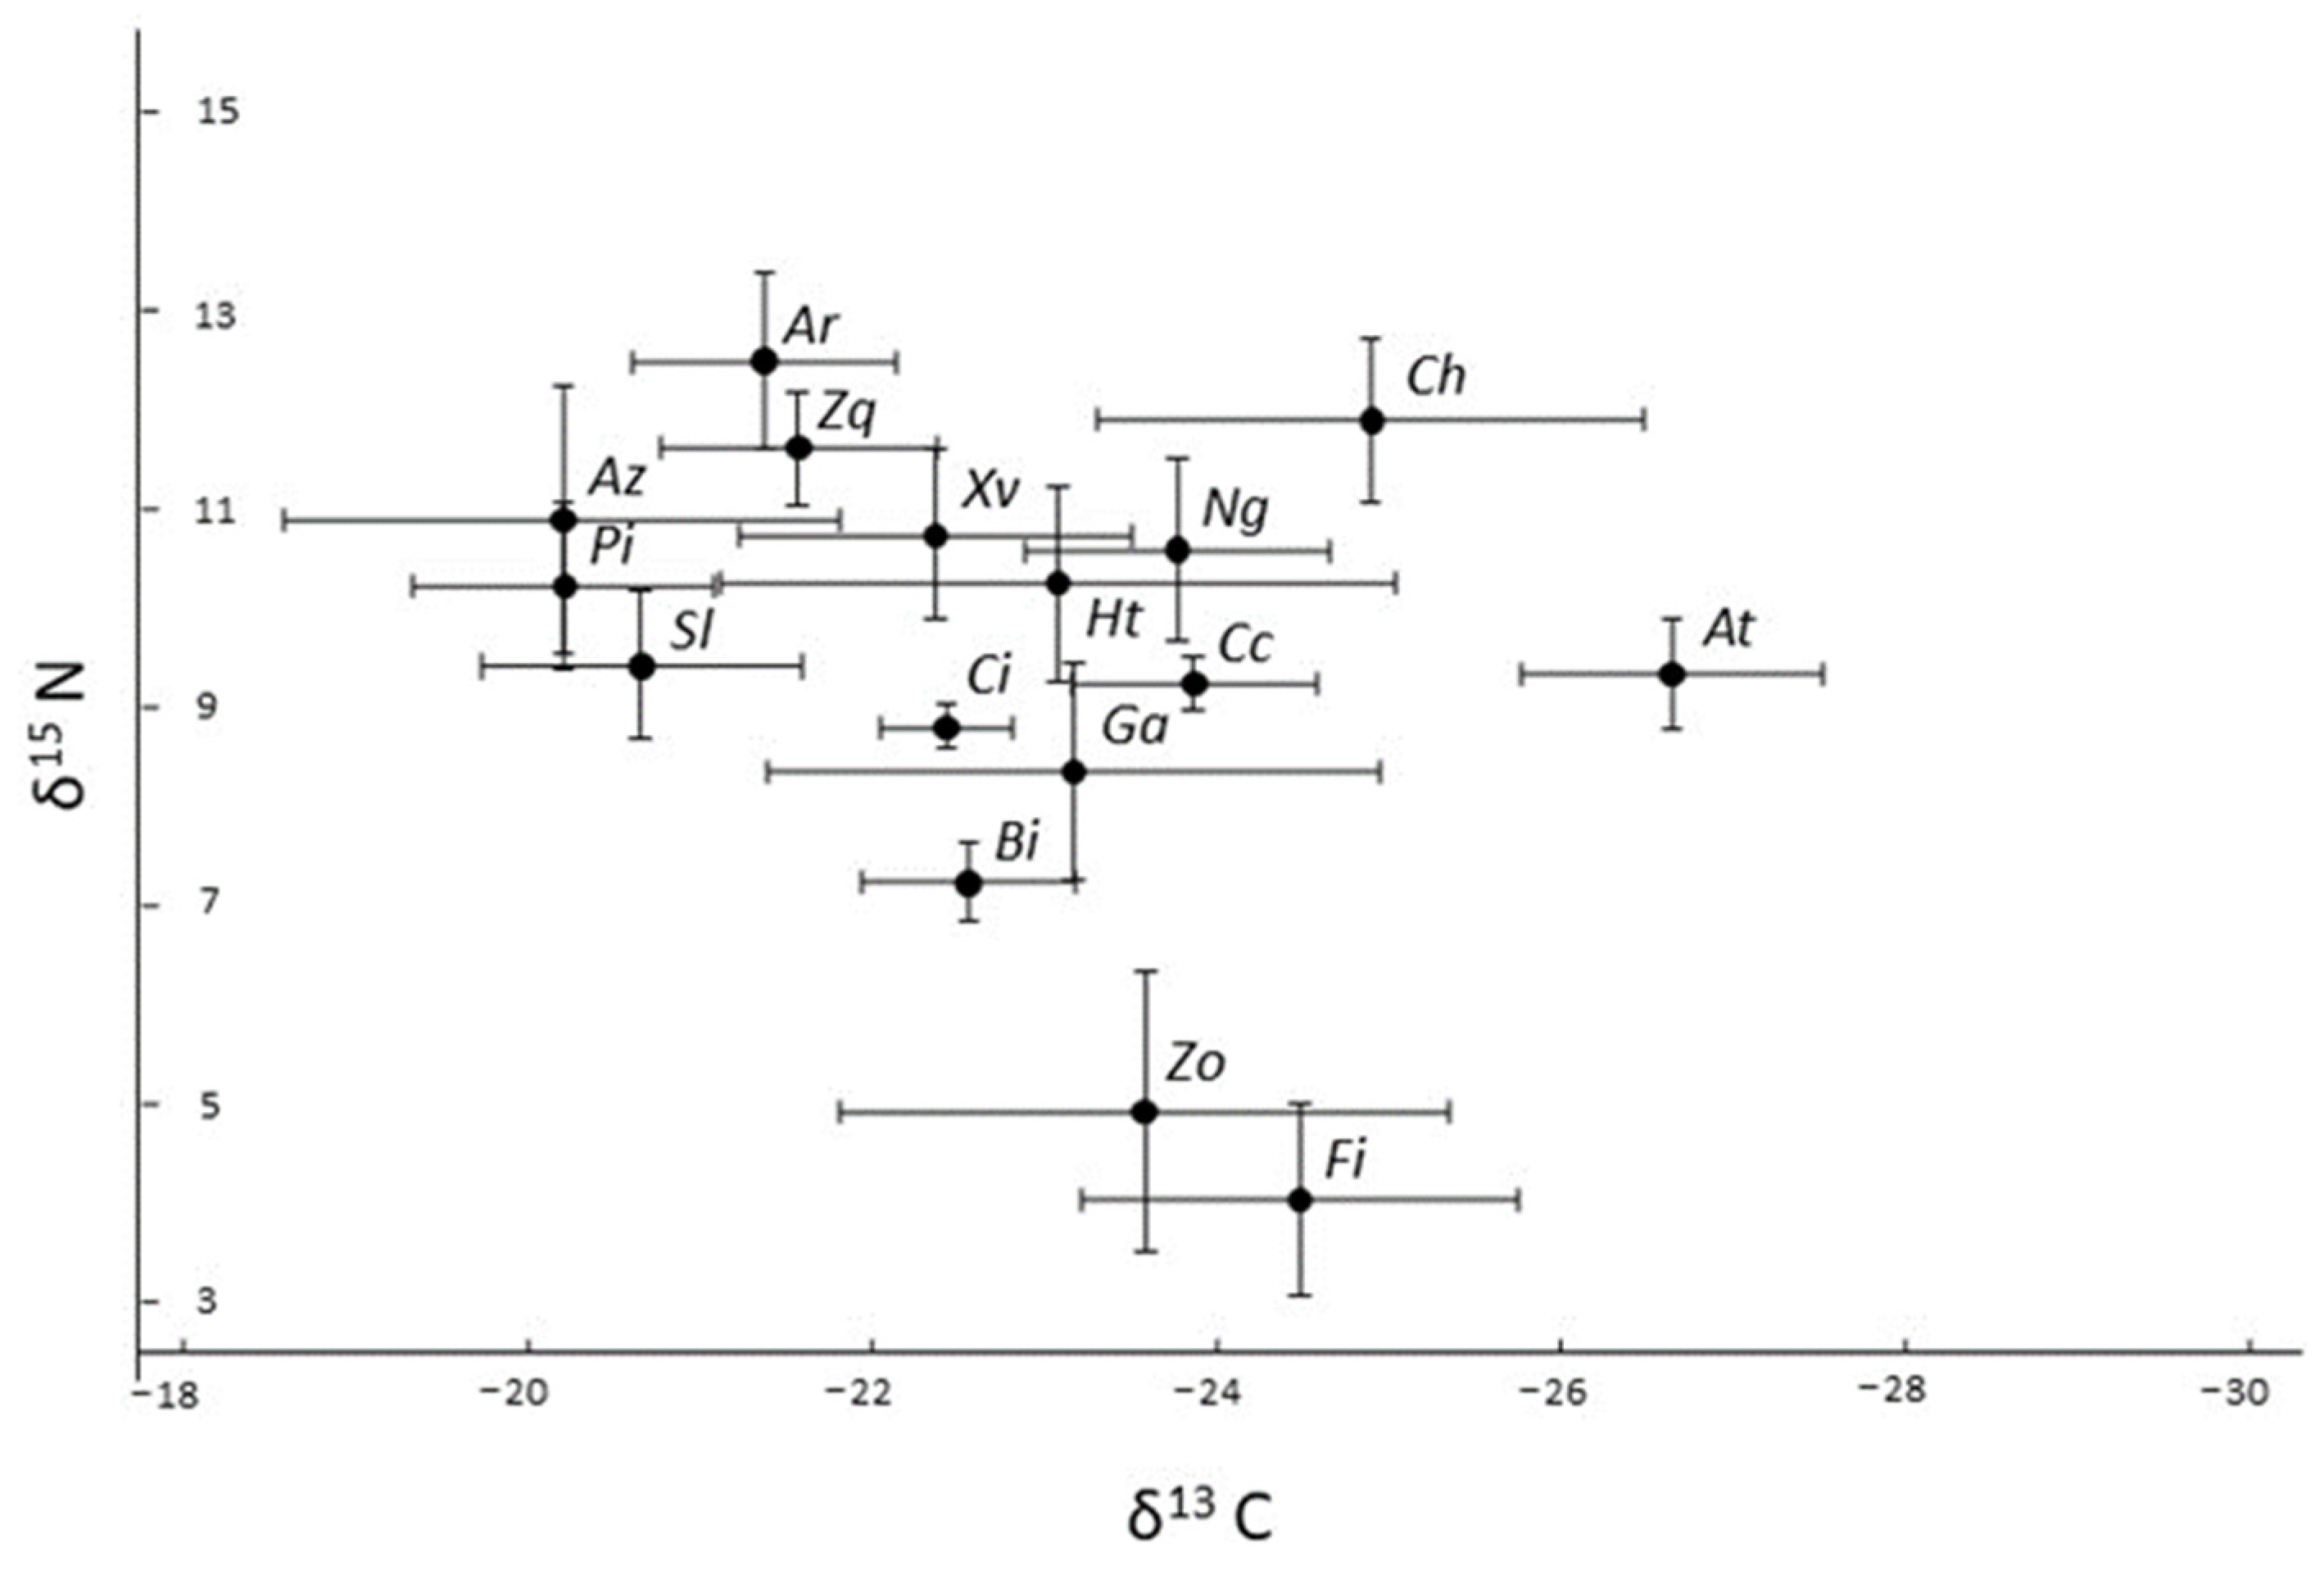
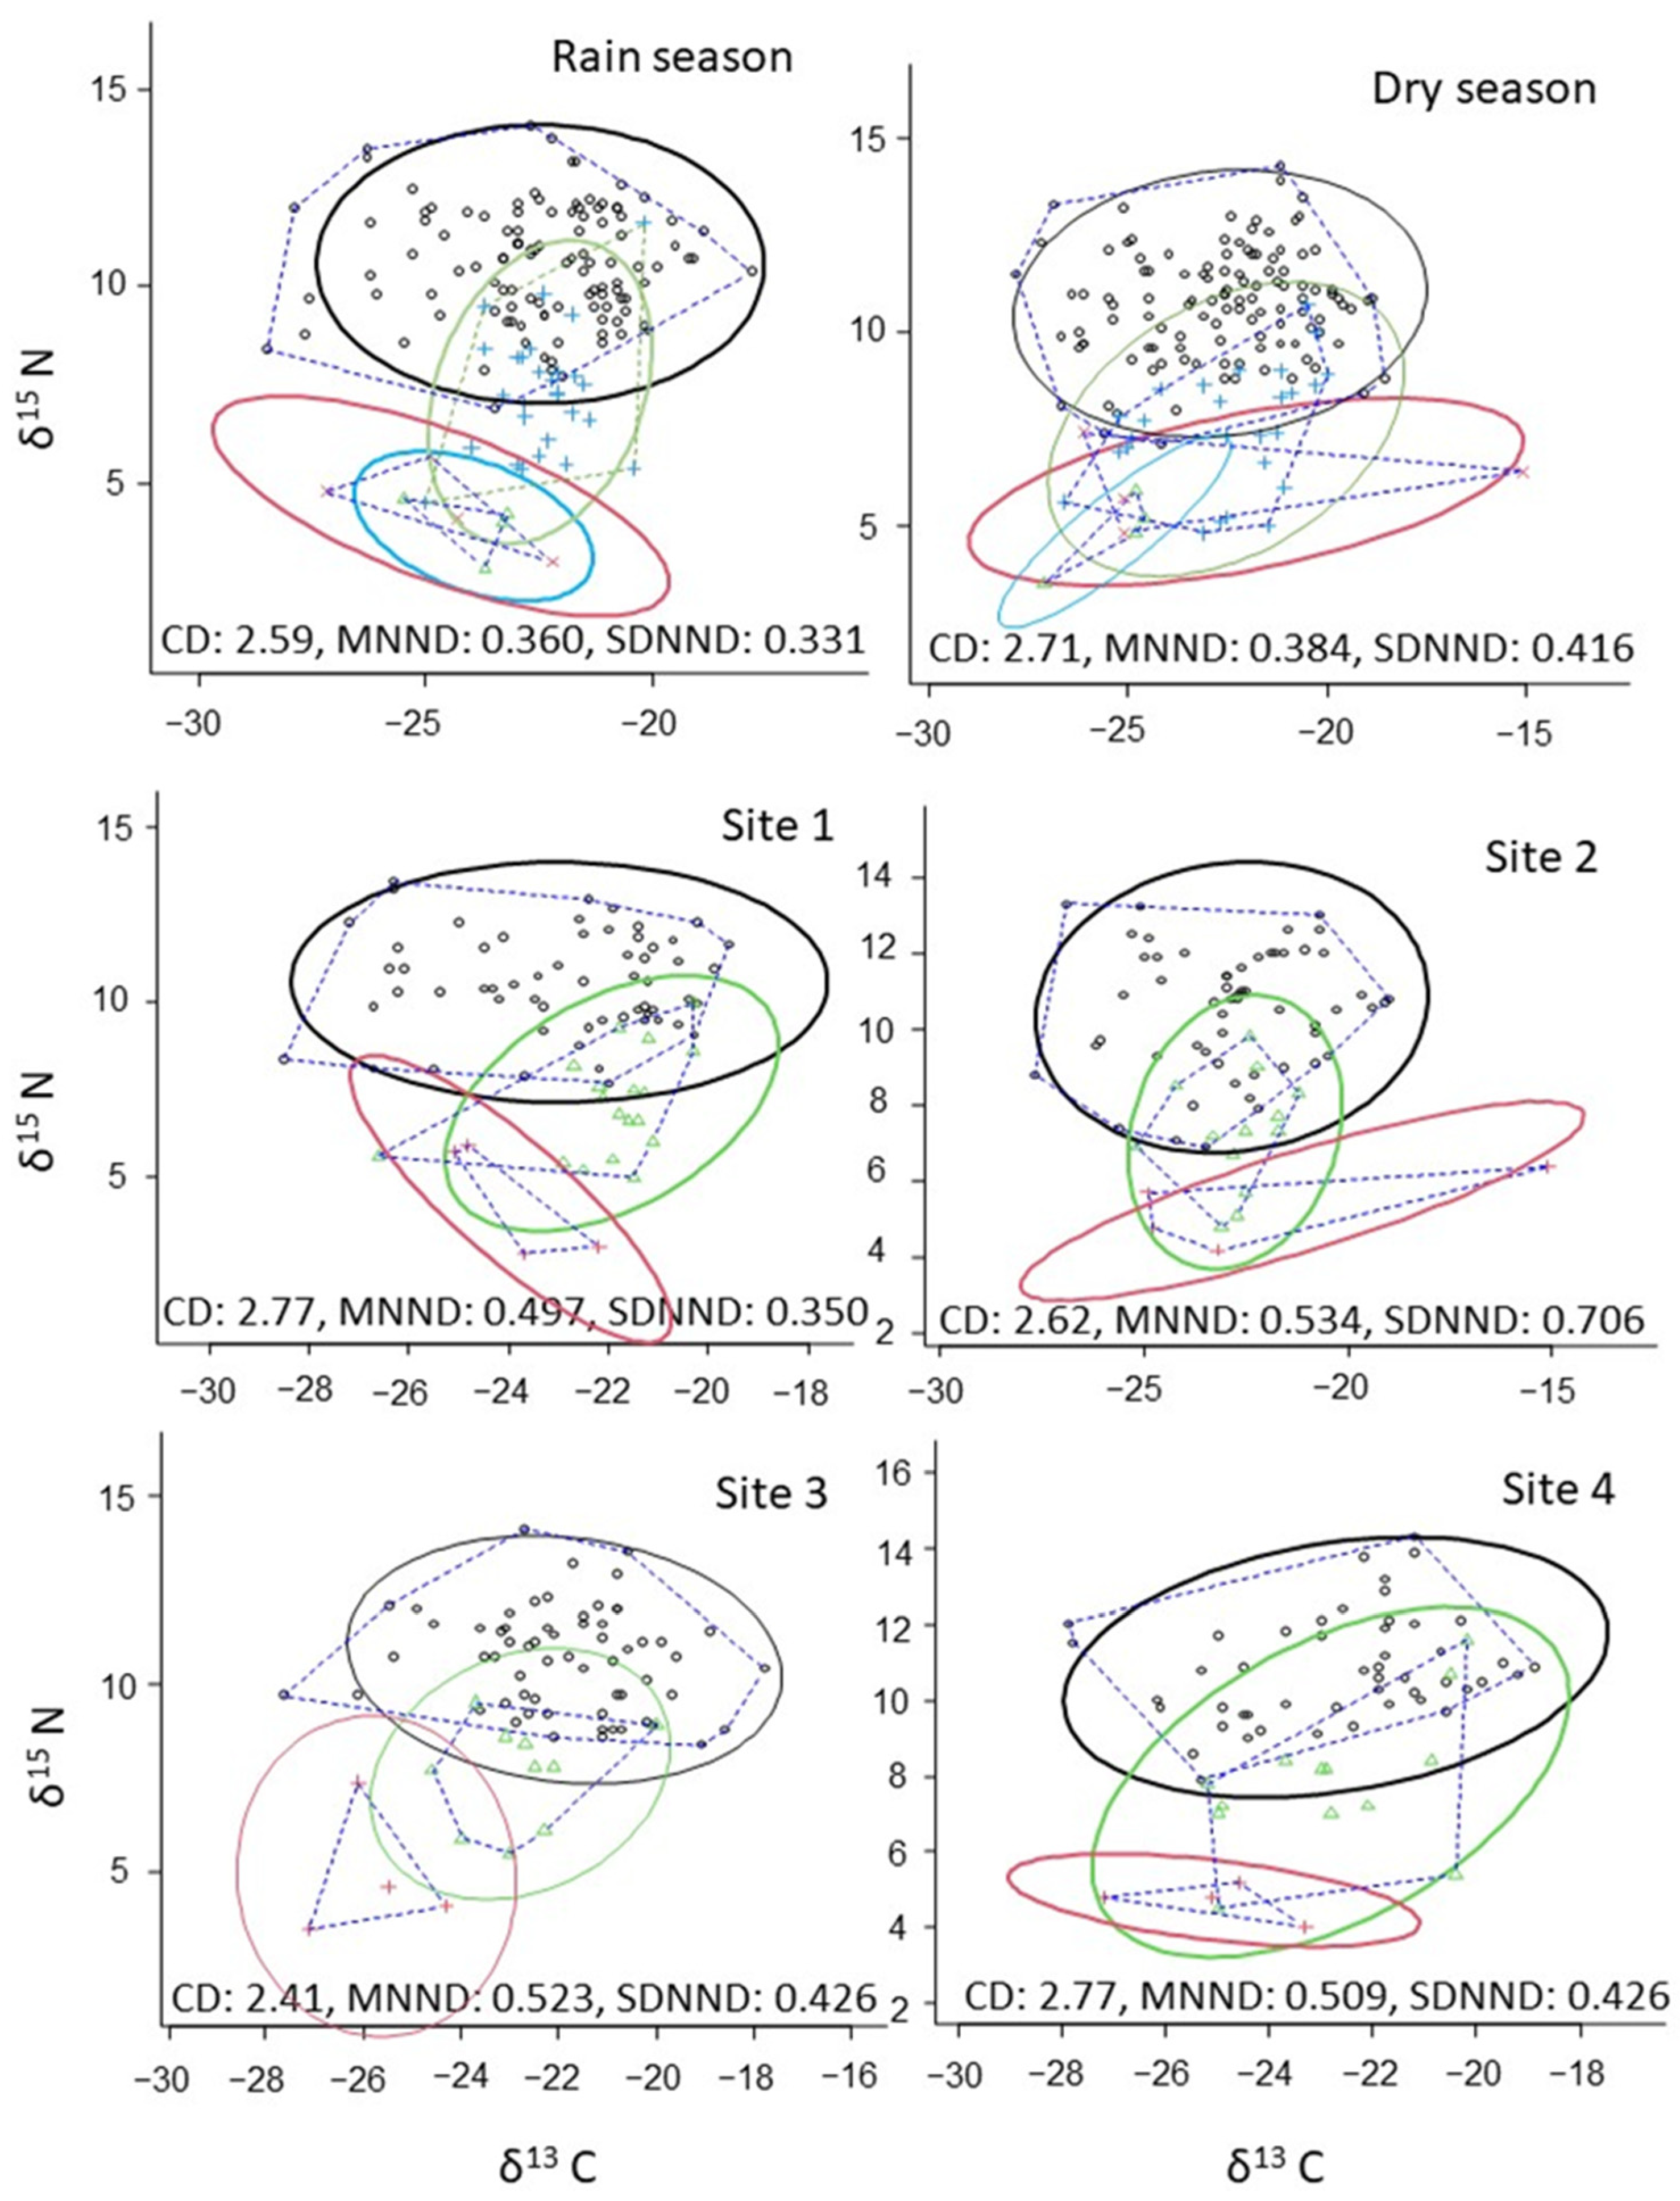
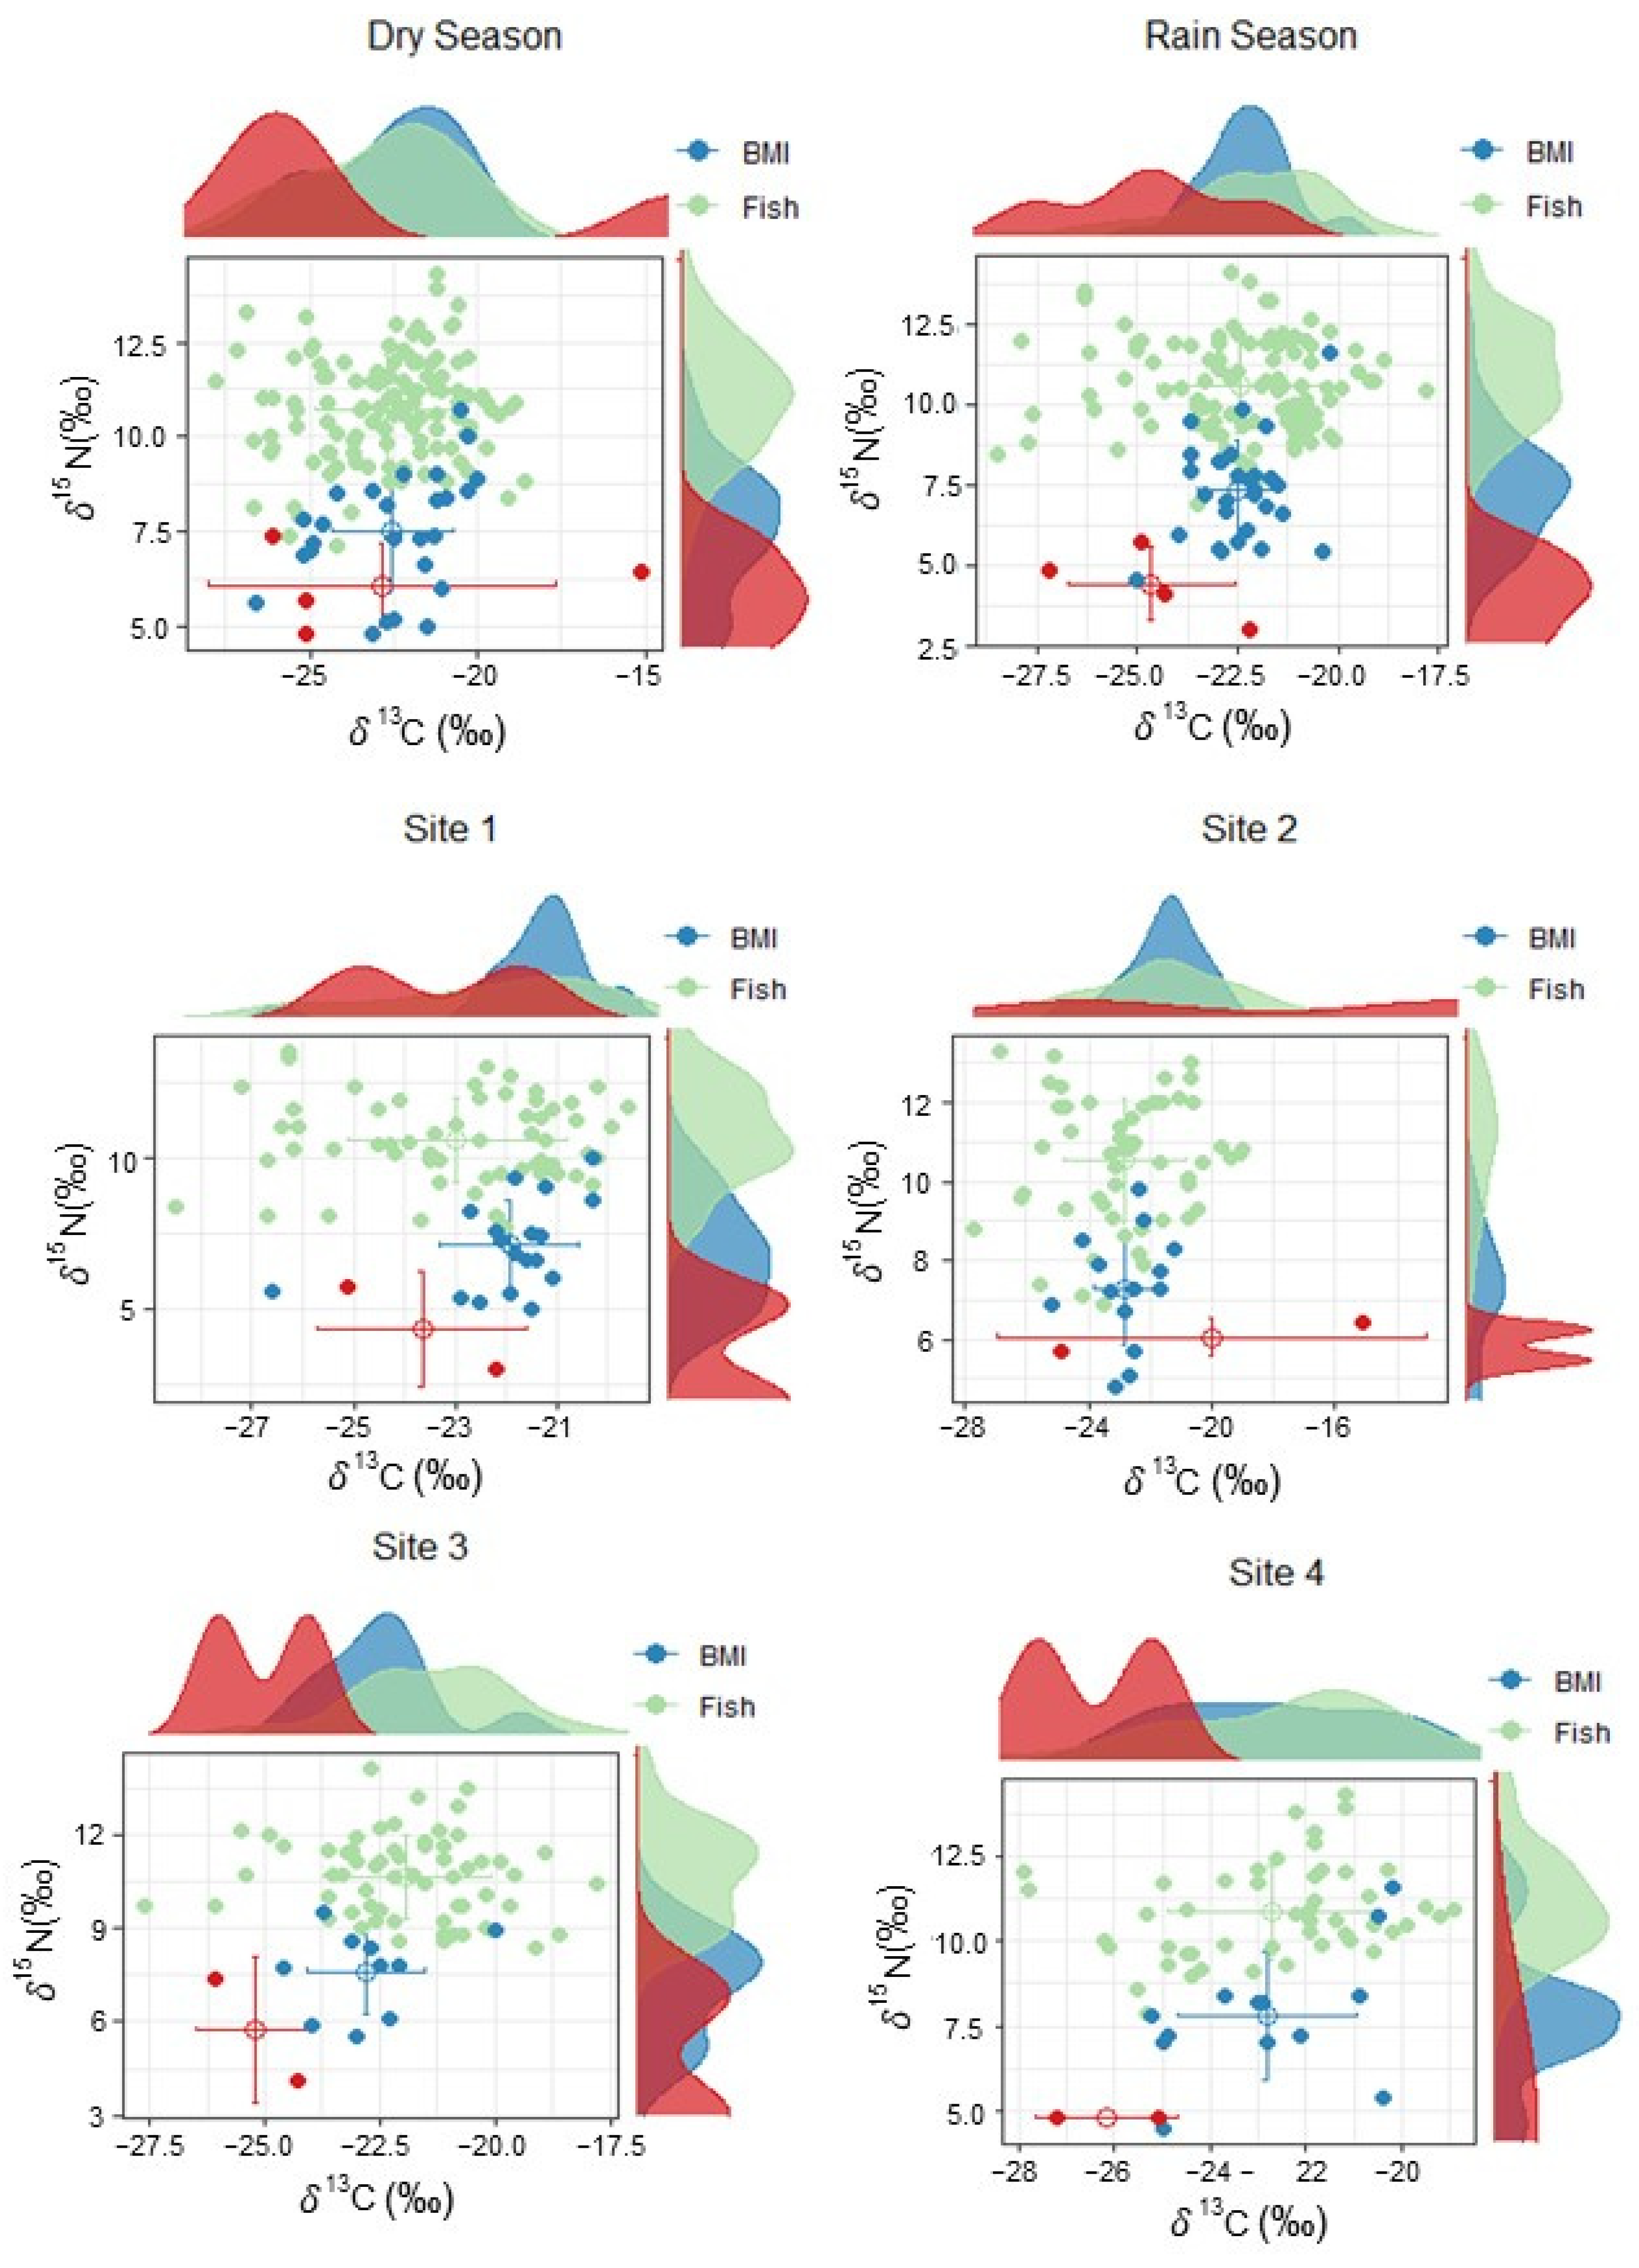
3.3. Stable Isotopes

We found significant differences between seasons in δ13C for A. tincella (t = 0.506, p = 0.016) and C. carpio (t = 0.947, p = 0.002); the post hoc test showed the most enriched values in the wet season. Significant differences between seasons in δ15N were found for H. turneri (t = 0.320, p = 0.021) and P. infans (t = 0.238, p = 0.005), and the post hoc test showed the most enriched in the dry season. Significant differences among sites in δ13C (F = 8.047, p = 0.001) and δ15N (F = 4.149, p = 0.021) were only found for G. atripinnis; the Tukey test showed that site 3 had the highest values of δ13C and the lowest values of δ15N (p < 0.05). P. infans showed significant differences among sites in δ15N (F = 3.4811, p = 0.033), and Z. quitzeoensis exhibited differences in δ13C (F = 3.436, p = 0.037); the Tukey test showed that site 1 had the lowest values for both species. A. robustus occupied the highest fish trophic position in the food web, based on relative δ15 N values and food components (Figure 4), while G. atripinnis and C. idella had the lowest position. A. tincella had the most enriched δ13 C values of all the food web components. Except for C. humboldtianum and A. tincella, the fish species had average δ13 C values, ranging between −28 and −18‰.
No clear seasonal pattern was found in the community-wide trophic structure (Figure 5, Table 5). However, the degree of trophic diversity, measured as CD, was greatest in the dry season. Site 3 had the lowest CD value, while sites 1 and 4 had the same or a higher value (2.77) (Table 5).
The metric MNND, which declines in webs with overlap, indicated a divergent trophic niche or low overlap in both seasons and at all sites. The metric SDNND, which measures the evenness of species isotopic distributions, was highest in the dry season and at site 2 (Figure 5, Table 5).
The δ13C isotope mean values of the baseline (macroinvertebrates) were −21.9 ± 1.4 for site 1, −22.8 ±1.1 for site 2, −22.8 ±1.3 site 3, and −22.8 ± 1.9 for site 4; for δ15 N, the mean values were 7.1 ± 1.5 for site 1; 7.3 ± 1.4 for site 2; 7.6 ± 1.4 for site 3, and 7.8 ±1.9 for site 4 (Figure 6). The δ13C values for the consumers (fish) were 23.0 ± 2.2 for site 1, −22.8 ± 2.0 for site 2, −21.9 ± 1.8 for site 3, and −22.7 ± 2.1 for site 4, while the δ15N values were 10.6 ± 1.4 for site 1, 10.5 ±1.6 for site 2, 10.6 ±1.3 for site 3, and 10.8 ± 1.4 for site 4 (Figure 6).
There were no significant differences between sites for either δ13C (F = 1.6057, p = 0.188) or δ15N (F = 0.6551, p = 0.580). In the wet season, the values of the consumers were 10.6 ± 1.4 for δ15N and −22.5 ± 2.0 for δ13C. For the dry season, the δ13C value was −22.7 ± 2.1 and the δ15N value 10.7 ±1.4; the baseline (macroinvertebrates) in the dry season was −22.5 ±1.8 for δ13C and for 7.5 ±1.6 δ15N; in the wet season δ13C was 0∓22.5 ±1.0 and δ15 N 7.3 ±1.6. The baseline of Zoo in the wet season was −24.6 ± 2.1 for δ13C and 4.4 ±1.1 for δ15N, and in the dry season it was −22.9 ±5.2 for δ13C and 6.1 ±1.1 for δ15N (Figure 6). There were no significant differences between the dry and wet seasons for either δ13 C (F = 0.5600, p = 0.455) or δ15N (F = 1.4406, p = 0.231).

4. Discussion

This study focused on elucidating the diet and trophic structure of the fish species present in Lake Zacapu. We demonstrated that (1) analysis of stomach content and analysis of δ13C and δ15N complement each other, (2) there was a great availability and diversity of food resources for the fish species in the lake, (3) the native species had a low trophic position, as well as a wide spatial trophic niche and niche width at all sites and both seasons studied, indicating that they were mainly generalists, (4) the trophic structure of a group of related species (the family Goodeidae) revealed similar feeding habits, (5) Trophic diet overlap was greater between native species than between non-native species.
The stomach content data and isotopic signatures provided overall similar results for the trophic positions for the different species (Figure 4), confirming our first hypothesis. However, it is well documented that the stomach content does not fully capture the trophic position. Diet data typically only provide a snapshot of the consumption (hours to days), while the stable isotopes integrate over a longer time (weeks to months) [20]. Moreover, some fish specimens had empty stomachs. In our study, C. carpio and A. tincella could not be considered for the stomach content analyses, for example, as only a few fish were captured and most had empty stomachs, in part because some were captured by the fishermen who use gill nets set over-night, leading to defecation. Else the stomach content provides valuable information on the taxonomic composition of the diets (Table 2), which could not be obtained by the stable isotope analysis. Combining both techniques (stomach content and stable isotopes), therefore, improves our interpretation of the diet of the species and the food web structure in the lake.
As in other studies of Lake Zacapu [35,36,41], we found homogeneous environmental conditions, both spatially and temporally, reflecting continuous circulation with little zonation due to the shallowness of the system, high capacity for hydraulic renewal and small spatial dimensions [33]. Only ammonia and pH differed slightly between the two seasons (Table 1).
In accordance with our second hypothesis, the fish relied mainly on internal food sources, while terrestrial organisms were of minor importance. The aquatic macroinvertebrate data revealed 79 genera, and the analysis of the macroinvertebrate samples showed no differences among sites in community structure and organization [54]. The most abundant macroinvertebrate genera in the diet were Hyalella (40%), Cambarellus (4.5%), Belostoma (3.2%), and gastropods (Physella: 12.5%, Pomatiopsis: 6.3%, and Valvata: 8.0%), indicating ample food resources for the fish in the lake, reducing the competition between the species.
Macroinvertebrates played an important role as a food resource for most species (Table 2). For example, the endemic N. grandis is an omnivorous species with a tendency to carnivory (Figure 2), which fed mainly on Hyalella (Table 2), as also demonstrated in an earlier study of other species of the genus [55]. The relict species H. turneri also fed mainly on Hyalella and microcrustaceans (copepods and cladocerans), as also reported in other studies [39,56], and the micro-endemic species A. zacapuensis mainly ingested Hyalella and aquatic insects (Table 2). Three species are restricted to this small lake: N. grandis [57], H. turneri [58], and A. zacapuensis [59]. They had similar feeding habits (ingesting Hyalella and aquatic insects) but only occurred in low abundance in specific areas of the lake [36]. The three species occur in different habitats; N. grandis lives in the littoral zone of the lake [36], A. zacapuensis restring to one of the springs (Site 3) [35] with dense vegetation [41], and H. turneri lives in the littoral areas with abundant aquatic vegetation [58].
Regarding our third hypothesis, we found higher trophic diet overlap between native species than for non-native. Species from the same family, such as Z. quitzeoensis, A. zacapuensis, H. turneri, and X. variata, were grouped into the same guild due to the similarity of the resources that they consumed (Figure 2 and Figure 3), likely reflecting the taxonomic proximity between the species [60], all of them native to this lake. In principle, closer species should be strongly competitive due to high diet overlap [61], as we found for species of the Goodeid family (Table 4). However, high overlap does not necessarily mean that the species are competing if resources are abundant enough [62], as was the case for macroinvertebrates in Lake Zacapu [54].
Three trophic guilds were identified in the lake: carnivore, omnivore-carnivore, and omnivore-herbivore, as also reported 27 years ago for this lake [39]. The fish species ranged from primary to secondary consumers, with A. robustus (Table 3) having the highest δ15N value (Figure 4). This species is also considered a secondary consumer in other Mexican aquatic systems [63] and feeds principally on insects, and is considered being the most highly developed carnivore in the Goodeidae family [42].
In the non-native versus native species, we only found diet overlap between C. idella and S. lermae (Table 4); however, the native species S. lermae consumed various items, including Bosmina, aquatic insects, copepods, and detritus as their main food items, while C. idella only consumed Potamogeton, Plumatelidae and detritus (Table 1). This indicates that the overlap mainly concerns detritus, as also seen in the PSIRI index values. The other non-native species, C. carpio, occupied a lower position, as revealed by the δ15N analysis (Figure 3), classifying it as omnivorous, which corresponds with the reports for other aquatic systems in which these carps are non-native species, for example, Lake Pátzcuaro [63] and Lake Xochimilco [64], and elsewhere [65]. The abundance of C. carpio was relatively low in the lake, and their population was controlled by the fishermen [36]. The results of the isotope signatures of C. carpio (Figure 4) and the diet overlap of the C. idella (Table 4) indicated that trophic diet overlap was greater between native species (especially between species from the same family) than for non-native species, as also seen in another study [16].
Another species with a relatively low abundances in the lake is the native A. tincella [36]. This species showed the most enriched values of carbon and low values of δ15N, classifying it as an omnivore. The genus Algansea is considered omnivorous, feeding mainly on filamentous algae, phytoplankton, benthic invertebrates, and zooplankton [42,66], which concurs with the observed niche overlap with A. tincella in our isotopic results (Figure 4).
Lake size has been shown to be an important determinant of the trophic composition of shallow subtropical lakes [67,68]. In the present study, both the stable isotopes and stomach contents indicated that the mean trophic level (Table 3) and the trophic position (Figure 4) of the fish species were overall similar to those reported for other small shallow lakes [68], while the higher trophic position has been found in Mexican lakes with larger surface areas, such as Lake Chapala [69] and Lake Pátzcuaro [70], though may vary with fish community composition [71]. In Lake Zacapu, the dominant species were carnivorous, omnivorous-carnivorous and omnivorous-herbivorous, and the preferred food item of most species were macroinvertebrates (Table 1), emphasizing the phylogenetic relatedness of the species in the Goodeidae family.
Low δ15N values correlated with great δ13C variation [72], thus, a wider trophic niche area. The fish isotopic signatures from this lake differ from previous records of feeding habitats of the species in other, more eutrophic, aquatic Mexican systems [66,69,73]. We found the δ15N values to be lower and the trophic niche areas wider, suggesting that the species are opportunistic and are able to switch food sources depending on their abundance [13]. The omnivory index (Table 3) provides similar evidence, indicating that these species fed on more than one trophic level.
The SIBER analysis revealed similar values in the isotopic niche space (SEAc) and a similar trophic diversity based on the NNR, CR, and CD values in the dry and wet seasons (Table 5, Figure 5), which is also supported by the similar values of MNND and SDNND (trophic redundancy) in the two seasons. This suggests that the fish in this lake exploited similar resources in the dry and wet seasons studied. We, however, found a tendency to lower CD and SEAc values at site 3 and lower MNND and SDNND values at site 1 (Table 5; Figure 5), indicating lower trophic diversity. These sites were spring fed and located where most of the water entered the lake, and here the fish had aquatic macroinvertebrates as their main source of energy. The stable isotope data, however, suggests that they also consumed food with enriched δ13C values, such as zooplankton (Figure 6). We found little variation in isotope values and diet between seasons, likely reflecting the low variation in environmental variables, including temperature, as compared to the temperate regions [74].

5. Conclusions

Lake Zacapu is characterized by environmental conditions that favor trophic generalist fish. Our findings reveal that the local food web structure did not differ significantly between the four sampling sites (Figure 6), which we attribute to aquatic macroinvertebrates [54] and environmental homogeneity (Table 1). Our results suggest a low trophic position of native species having a wide spatial trophic niche and niche width, indicating that they fed on more than one trophic level. We also found overall good agreement in the trophic position determined by gut content and isotope analysis. Trophic diet overlap was greater between native species (especially between species from the same family) than between non-native species. Our study provides new information on the trophic interactions in a subtropical Mexican lake, rich in endemic species and an important resource for the local human communities.

Author Contributions

Conceptualization, A.R.-G., E.J., R.M.-E., N.M.-S. and O.D.-D.; data curation, A.R.-G.; formal analysis, A.R.-G., E.J., R.M.-E., N.M.-S. and O.D.-D.; investigation, A.R.-G., E.J., R.M.-E., N.M.-S. and O.D.-D.; methodology, A.R.-G., E.J., R.M.-E. and N.M.-S.; resources, A.R.-G. and O.D.-D.; supervision, A.R.-G. and E.J.; visualization, A.R.-G., E.J., R.M.-E., N.M.-S. and O.D.-D. All authors have read and agreed to the published version of the manuscript.

Funding

This research was funded by Chester Zoo (project FP1.12), The Rufford Foundation Small Grants (project 38237-2), the Goodeid Working Group, the American Livebearer Association and CIC-UMSNH. Arely Ramírez-García received a CONACYT (number 598599) fellowship grant for Ph.D. studies. Rodrigo Moncayo-Estrada is a fellow of the COFAA and EDI programs of Instituto Politécnico Nacional. Erik Jeppesen was supported by the TÜBITAK program BIDEB2232 (project 118C250).

Data Availability Statement

Databases are available from the corresponding author A.R.-G.

Acknowledgments

We thank the Unión de Pescadores of Lake Zacapu, the government of Zacapu, and Centro Regional de Investigación Pesquera (CRIAP) Pátzcuaro for facilities, support and sampling assistance. We thank R. Pérez-Munguia for their help in the identification of macroinvertebrates.

Conflicts of Interest

The authors declare no conflict of interest.

References

  1. Biggs, J.; von Fumetti, S.; Kelly-Quinn, M. The importance of small waterbodies for biodiversity and ecosystem services: Implications for policy makers. Hydrobiologia 2017, 793, 3–39. [Google Scholar] [CrossRef]
  2. Hoverman, J.T.; Johnson, P.T.J. Ponds and Lakes: A Journey Through the Life Aquatic. Nat. Sci. Educ. 2012, 3, 17. [Google Scholar]
  3. Strong, D.R.; Frank, K.T. Human Involvement in Food Webs. Annu. Rev. Environ. Resour. 2010, 35, 1–23. [Google Scholar] [CrossRef] [Green Version]
  4. Crowder, L.B.; Ray, R.; Drenner, W.; Chair, W.; Kerfoot, C.; McQueen, D.J.; Mills, E.; Sommer, U.; Spencer, C.N.; Vanni, M.J. Food web interactions in lakes. In Interactions in Lake Communities; Carpenter, S.R., Ed.; Springer: New York, NY, USA, 1988. [Google Scholar] [CrossRef]
  5. Delong, M.; Thorp, J.M.; Thons, M.S.; Mcintosh, L. Trophic niche dimensions of fish communities as a function of historical hydrological conditions in a Plains River. River Syst. 2011, 19, 177–187. [Google Scholar] [CrossRef]
  6. Fauvelle, C.; Diepstraten, R.; Jessen, T. A meta-analysis of home range studies in the context of trophic levels: Implications for policy-based conservation. PLoS ONE 2017, 12, e0173361. [Google Scholar] [CrossRef] [PubMed] [Green Version]
  7. Garrison, L.P.; Link, J.S. Fishing effects on spatial distribution and trophic guild structure of the fish community in the Georges Bank region. J. Mar. Sci. 2000, 57, 723–730. [Google Scholar] [CrossRef] [Green Version]
  8. Dantas, D.V.; Barletta, M.; Ramos, J.d.A.A.; Lima, A.R.A.; Costa, M.F. Seasonal diet shifts and overlap between two sympatric catfishes in an estuarine nursery. Estuar. Coast. 2013, 36, 237–256. [Google Scholar] [CrossRef]
  9. Pianka, E.R. Competition and niche theory. In Theoretical Ecology: Principles and Applications; May, R.M., Ed.; Blackwell Scientific Publication: Oxford, UK, 1981; pp. 167–196. [Google Scholar]
  10. Sánchez-Hernández, J.; Vieira-Lanero, R.; Servia, M.J.; Cobo, F. Feeding habits of four sympatric fish species in the Iberian Peninsula: Keys to understanding coexistence using prey traits. Hydrobiologia 2011, 667, 119–132. [Google Scholar] [CrossRef]
  11. Carrara, F.; Giometto, A.; Seymour, M.; Rinado, A.; Altermatt, F. Inferring species interactions in ecological communities: A comparison of methods at different levels of complexity. Methods Ecol. Evol. 2015, 6, 895–906. [Google Scholar] [CrossRef]
  12. Post, D.M.; Layman, C.A.; Arrington, D.A.; Takimoto, G.; Quattrochi, J.; Montaña, C.G. Getting to the fat of the matter: Models, methods and assumptions for dealing with lipids in stable isotope analyses. Oecologia 2007, 152, 179–189. [Google Scholar] [CrossRef]
  13. Córdova-Tapia, F.; Contreras, M.; Zambrano, L. Trophic niche overlap between native and non-native fishes. Hydrobiologia 2015, 746, 291–301. [Google Scholar] [CrossRef]
  14. Cicala, D.; Polgar, G.; Mor, J.R.; Piscia, R.; Brignone, S.; Zaupa, S.; Volta, P. Trophic Niches, Trophic Positions, and Niche Overlaps between Non-Native and Native Fish Species in a Subalpine Lake. Water 2020, 12, 3476. [Google Scholar] [CrossRef]
  15. Webb, C.O.; Ackerly, D.D.; McPeek, M.A.; Donoghue, M.J. Phylogenies and community ecology. Annu. Rev. Ecol. Syst. 2002, 33, 475–505. [Google Scholar] [CrossRef] [Green Version]
  16. Burns, J.H.; Strauss, S. More Closely related species are more ecologically similar in an experimental test. Proc. Natl. Acad. Sci. USA 2011, 108, 5302–5307. [Google Scholar] [CrossRef] [Green Version]
  17. Hussey, N.E.; MacNeil, M.A.; McMeans, B.C.; Olin, J.A.; Dudley, S.F.; Cliff, G.; Wintner, S.P.; Fennessy, S.T.; Fisk, A.T. Rescaling the trophic structure of marine food webs. Ecol. Lett. 2014, 17, 239–250. [Google Scholar] [CrossRef]
  18. Romanuk, T.N.; Hayward, A.; Hutchings, J.A. Trophic level scales positively with body size in fishes. Glob. Ecol. Biogeogr. 2011, 20, 231–240. [Google Scholar] [CrossRef]
  19. Eloranta, A.T.; Nieminen, P.; Kimmo, K.; Kahilainen, K. Trophic interactions between introduced lake trout (Salvelinus namaycush) and native Arctic charr (S. alpinus) in a large Fennoscandian subarctic lake. Ecol. Freshw. Fish 2015, 24, 181–192. [Google Scholar] [CrossRef] [Green Version]
  20. Davis, A.M.; Blanchette, M.L.; Pusey, B.J.; Jardine, T.D.; Pearson, R.G. Gut content and stable isotope analyses provide com- plementary understanding of ontogenetic dietary shifts and trophic relationships among fishes in a tropical river. Freshw. Biol. 2012, 57, 2156–2172. [Google Scholar] [CrossRef]
  21. Svanbäck, R.; Quevedo, M.; Olsson, J.; Eklöv, P. Individuals in food webs: The relationships between trophic position, omnivory and among-individual diet variation. Oecologia 2015, 178, 103–104. [Google Scholar] [CrossRef] [Green Version]
  22. Vander Zanden, M.J.; Rasmussen, J.B. Primary Consumer S13C and S15N and the trophic position of aquatic consumers. Ecology 1999, 80, 1395–1404. [Google Scholar] [CrossRef]
  23. Fry, B. Stable Isotope Ecology; Springer: New York, NY, USA, 2006; Volume 521. [Google Scholar] [CrossRef]
  24. Layman, C.A.; Araujo, M.S.; Boucek, R.; Hammerschlag-Peyer, C.M.; Harrison, E.; Jud, Z.R.; Yeager, L.A. Applying stable isotopes to examine food- web structure: An overview of analytical tools. Biol. Rev. 2012, 87, 545–562. [Google Scholar] [CrossRef]
  25. Hill, M.J.; Mathers, K.L.; Wood, P.J. The aquatic macroinvertebrate biodiversity of urban ponds in a medium-sized European town (Loughborough, UK). Hydrobiologia 2015, 760, 225–238. [Google Scholar] [CrossRef] [Green Version]
  26. Pilger, T.J.; Gido, K.B.; Propst, D.L. Diet and trophic niche overlap of native and nonnative fishes in the Gila River, USA: Implications for native fish conservation. Ecol. Freshw. Fish 2010, 19, 300–321. [Google Scholar] [CrossRef]
  27. Thomas, S.; Kijunen, M.; Malinen, T.; Eloranta, A.; Amundsen, P.; Lodenius, M.; Kahilainen, K. Food-web structure and mercury dynamics in a large subarctic lake following multiple species introductions. Freshw. Biol. 2016, 61, 500–517. [Google Scholar] [CrossRef]
  28. Sánchez-Hernández, J.; Eloranta, A.; Finstad, A.; Amundsen, P. Community structure affects trophic ontogeny in a predatory fish. Ecol. Evol. 2017, 7, 358–367. [Google Scholar] [CrossRef] [PubMed]
  29. Laske, S.; Rosenberger, A.; Wipfi, M.; Zimmeman, C. Generalist feeding strategies in Arctic freshwater fish: A mechanism for dealing with extreme environments. Ecol. Freshw. Fish 2018, 27, 767–784. [Google Scholar] [CrossRef]
  30. Mwijage, A.P.; Shila, D.A.; Machiwa, J.F. Differences in trophic resources and niches of two juvenile predatory species in three Pangani estuarine zones, Tanzania: Stomach contents and stable isotope approaches. J. Biol. Res. 2018, 25, 13. [Google Scholar] [CrossRef] [Green Version]
  31. Jones, J.I.; Waldron, S. Combined stable isotope and gut contents analysis of food webs in plant-dominated, shallow lakes. Freshw. Biol. 2003, 48, 1396–1407. [Google Scholar] [CrossRef] [Green Version]
  32. Franssen, N.R.; Gido, K.B. Use of stable isotopes to test literature-based trophic classifications of small-bodied stream fishes. Am. Midl. Nat. 2006, 156, 1–10. [Google Scholar] [CrossRef]
  33. Ayala-Ramírez, G.L.; Ruiz-Sevilla, G.; Chacon-Torres, A. La Laguna de Zacapu, Michoacán. In Las Aguas Interiores de México: Conceptos y Casos; De la Lanza, G., Ed.; AGT EDITOR, S.A.: Mexico City, Mexico, 2007; pp. 268–284. [Google Scholar]
  34. Domínguez-Domínguez, O.; Zambrano, L.; Escalera-Vázquez, L.H.; Pérez-Rodríguez, R.; Pérez-Ponce de León, G. Changes in the distribution of goodeids (Osteichthyes: Cyprinodontiformes: Goodeidae) in river basin of Central Mexico. Rev. Mex. Biodivers. 2008, 79, 501–512. [Google Scholar] [CrossRef]
  35. Ramírez-García, A.; Moncayo-Estrada, R.; González-Cárdenas, J.J.; Domínguez-Domínguez, O. Reproductive cycle of native viviparous fish species (Actinopterygii: Cyprinodontiformes: Goodeidae) in a subtropical Mexican lake. Neotrop. Ichthyol. 2021, 19, e210105. [Google Scholar] [CrossRef]
  36. Ramírez-García, A.; Domínguez-Domínguez, O.; De La Cruz-Agüero, J.; López-López, E.; Moncayo-Estrada, R. Temporary changes in the structure of the fish community separated by decades in a small subtropical lake. Ecol. Freshw. Fish 2022, 32, 53–63. [Google Scholar] [CrossRef]
  37. Comisión Nacional para el Conocimiento y Uso de la Biodiversidad (CONABIO). La biodiversidad en Michoacán. In Estudio de Estado 2; CONABIO: Mexico City, Mexico, 2019. [Google Scholar]
  38. Zubieta-Rojas, T.; Alvarado-Villanueva, R.; Ortega-Murillo, M.R.; Medina-Nava, M.; Sánchez-Heredia, J.D. Plan de Manejo del área Natural Protegida “Laguna de Zacapu y su Ribera”; Comisión Nacional de Áreas Naturales Protegidas (CONANP): Mexico City, Mexico, 2005. [Google Scholar]
  39. Moncayo-Estrada, R. Estructura y Función de la Comunidad de Peces de la Laguna de Zacapu, Michoacán, México. Master’s Thesis, Instituto Politécnico Nacional, Mexico City, Mexico, 1996. Available online: https://www.repositoriodigital.ipn.mx/handle/123456789/15234 (accessed on 13 April 2021).
  40. Ramírez-Herrejón, J.P. Análisis Temporal de la Calidad Ambiental de Los Ecosistemas Acuáticos en la Sub-Cuenca del río Angulo, Cuenca Lerma-Chapala. Master’s Thesis, Universidad Michoacana de San Nicolás de Hidalgo, Mexico City, Mexico, 2008. [Google Scholar]
  41. Valencia-Vargas, R.; Escalera-Vázquez, L.H. Abundancia de la salamandra Ambystoma andersoni con relación a la dinámica estacional y heterogeneidad espacial en el lago de Zacapu, Michoacán, México. Rev. Mex. Biodivers. 2021, 92, e923283. [Google Scholar] [CrossRef]
  42. Miller, R.R.; Minckley, W.L.; Norris, S.M. Peces dulceacuícolas de México; CONABIO: Comisión Nacional para el Conocimiento y Uso de la Biodiversidad: Mexico City, Mexico, 2009. [Google Scholar]
  43. Merritt, R.; Cummins, K.; Berg, M.B. An Introduction to the Aquatic Insects of North America, 5th ed.; Kendall Hunt Publishing Company: Dubuque, IA, USA, 2019; p. 1498. [Google Scholar]
  44. Thorp, J.H.; Covich, A.P. Ecology and Classification of North American Freshwater Invertebrates; Academic Press: London, UK, 2010. [Google Scholar]
  45. Ferry, L.A.; Cailliet, G. Sample size and data analysis are we characterizing and comparing diet properly. In Feeding Ecology and Nutrition in Fish Symposium Proceedings, International Congress on the Biology of Fishes; San Francisco State University: San Francisco, CA, USA, 1996; pp. 14–18. [Google Scholar]
  46. Brown, S.C.; Bizzarro, J.J.; Cailliet, G.M.; Ebert, D.A. Breaking with tradition: Redefining measures for diet description with a case study of the Aleutian skate Bathyraja aleutica (Gilbert 1896). Environ. Biol. Fishes 2012, 95, 3–20. [Google Scholar] [CrossRef]
  47. Pauly, D.; Froese, R.; Sala, P.; Palomares, M.L.; Christensen, V.; Rius, J. Trophlab Manual; ICLARM: Manila, Philippines, 2000. [Google Scholar]
  48. Christensen, V.; Pauly, D. ECOPATH II-a software for balancing steady-state ecosystem models and calculating network characteristics. Ecol. Model 1992, 61, 169–185. [Google Scholar] [CrossRef]
  49. Krebs, C.J. Ecological Methodology; Harper and Row: New York, NY, USA, 1989. [Google Scholar]
  50. Jackson, A.; Parnell, A. Package SIBER: Stable Isotope Bayesian Ellipses in R. Cran-R-Project. 2021. Available online: https://cran.r-project.org/web/packages/SIBER/SIBER.pdf (accessed on 15 June 2021).
  51. Abrantes, K.; Johnston, R.; Connolly, R.; Sheaves, M. Importance of Mangrove Carbon for Aquatic Food Webs in Wet–Dry Tropical Estuaries. Estuaries Coasts 2014, 39, 383–399. [Google Scholar] [CrossRef] [Green Version]
  52. Jackson, A.L.; Inger, R.; Parnell, A.C.; Bearhop, S. Comparing isotopic niche widths among and within communities: SIBER-Stable Isotope Bayesian Ellipses in R. J. Anim. Ecol. 2011, 80, 595–602. [Google Scholar] [CrossRef]
  53. Quezada-Romegialli, C.; Jackson, A.L.; Hayden, B.; Kahilainen, K.K.; Lopes, C.; Harrod, C. tRophicPosition, an R package for the Bayesian estimation of trophic position from consumer stable isotope ratios. Methods Ecol. Evol. 2018, 9, 1592–1599. [Google Scholar] [CrossRef] [Green Version]
  54. Ramírez-García, A.; Pérez-Munguía, R.M.; Domínguez-Domínguez, O. Spatial and temporal variation patterns of aquatic macroinvertebrates in a subtropical lake in the central Mexico. Rev. Biol. Trop. 2023, in press. [Google Scholar]
  55. Bean, P.T.; Williams, C.S.; Diaz, P.H.; Bonner, T.H. Habitat associations, life history, and diet of the blackspot shiner, Notropis atrocaudalis. Southeast. Nat. 2010, 9, 673–686. [Google Scholar] [CrossRef]
  56. Moncayo-Estrada, R. Análisis histórico de la biología de la Cherehuita (Hubbsina turneri) (Pisces: Goodeidae), especie endémica y en peligro de extinción de México. Rev. Chapingo Ser. Cienc. For. Ambiente 2012, 18, 101–110. [Google Scholar] [CrossRef] [Green Version]
  57. Domínguez-Domínguez, O.; Pérez-Rodríguez, R.; Escalera-Vázquez, L.H.; Doadrio, I. Two new species of the genus Notropis Rafinesque, 1817 (Actinopterygii, Cyprinidae) from the Lerma River Basin in Central Mexico. Hidrobiológica 2009, 19, 159–172. [Google Scholar]
  58. Moncayo-Estrada, R.; De La Cruz-Agüero, J.; López-López, E.; Del Monte-Luna, P.; Díaz-Argüero, M.M.; Chacón-Torres, A.; Ramírez-García, A.; Domínguez-Domínguez, O.; Ramírez-Herrejón, J.P. Historical analysis of an imperiled fish species: Environmental variables modeling, biotic interactions, extirpation, and current restricted-range. Front. Biosci. 2022, 27, 165. [Google Scholar] [CrossRef] [PubMed]
  59. Meyer, M.K.; Radda, A.C.; Domínguez-Domínguez, O. Notes on the genera Neoophorus HUBBS & TURNER, 1937 and Allotoca HUBBS & TURNER, 1937, with a description of a new species of Allotoca from Laguna de Zacapu, Michoacán, Mexico (Teleostei, Cyprinodontiformes: Goodeidae). Ann. Nat. Hist. Mus. Wien. 2001, 103B, 453–460. [Google Scholar]
  60. German, D.P.; Horn, M.H. Gut length and mass in herbivorous and carnivorous prickleback fishes (Teleostei: Stichaeidae): Ontogenetic, dietary, and phylogenetic effects. Mar. Biol. 2006, 148, 1123–1134. [Google Scholar] [CrossRef]
  61. Cavender-Bares, J.; Kozak, K.H.; Fine, P.V.A.; Kembel, S.W. The merging of community ecology and phylogenetic biology. Ecol. Lett. 2009, 12, 692–715. [Google Scholar] [CrossRef]
  62. Mérona, B.D.; Rankin-de-Mérona, J. Food resource partitioning in a fish community of the central Amazon floodplain Bernard. Neotrop. Ichthyol. 2004, 2, 75–84. [Google Scholar] [CrossRef] [Green Version]
  63. Ramírez-Herrejón, J.P.; Zambrano, L.; Mercado-Silva, N.; Torres-Téllez, A.; Pineda-García, F.; Caraveo-Patiño, J.; Balart, E.F. Long term changes in the fish fauna of Lago de Pátzcuaro in Central México. Lat. Am. J. Aquat. Res. 2014, 42, 137–149. [Google Scholar] [CrossRef]
  64. Zambrano, L.; Valiente, E.; Vander Zanden, M.J. Food web overlap among native axolotl (Ambystoma mexicanum) and two non-native fishes: Carp (Cyprinus carpio) and tilapia (Oreochromis niloticus) in Xochimilco, Mexico City. Biol. Invasions 2010, 12, 3061–3069. [Google Scholar] [CrossRef]
  65. Gallardo, B.; Clavero, M.; Sánchez, M.I.; Vilá, M. Global ecological impacts of invasive species in aquatic ecosystems. Glob. Chang. Biol. 2016, 22, 151–163. [Google Scholar] [CrossRef]
  66. Orbe-Mendoza, A.A.; Acevedo-García, J.; Lyons, J. Lake Patzcuaro fishery management plan. Rev. Fish Biol. Fish. 2002, 12, 207–217. [Google Scholar] [CrossRef]
  67. Post, P.M.; Pace, M.L.; Hairston, N.G. Ecosystem size determines food-chains in lakes. Nature 2000, 405, 1047–1049. [Google Scholar] [CrossRef]
  68. Jia, Y.; Jiang, Y.; Liu, Y.; Sui, X.; Feng, X.; Zhu, R.; Chen, Y. Understanding trophic structure variation in fish assemblages of subtropical shallow lakes: Combined effects of ecosystem size, productivity, and disturbance. Ecol. Indic. 2021, 129. [Google Scholar] [CrossRef]
  69. Mercado-Silva, N.; Lyons, J.; Moncayo-Estrada, R.; Gesundheit, P.; Krabbenhoft, T.J.; Powell, D.L.; Piller, K.R. Stable isotope evidence for trophic overlap of sympatric Mexican Lake Chapala silversides (Teleostei: Atherinopsidae: Chirostoma spp.). Neotrop. Ichthyol. 2015, 13, 389–400. [Google Scholar] [CrossRef] [Green Version]
  70. Ramírez-Herrejón, J.P.; Moncayo-Estrada, R.; Balart, E.F.; García-Camacho, L.A.; Vital-Rodríguez, B.; Alvarado-Villanueva, R.; Ortega-Murillo, R.; Caraveo-Patiño, J. Trophic interrelations between introduced common carp, Cyprinus carpio (Actinopterygii: Cypriniformes: Cyprinidae), and fish community in a eutrophic shallow lake. Acta Ichthyol. Piscat. 2014, 44, 45–58. [Google Scholar] [CrossRef] [Green Version]
  71. Sánchez-Hernández, J.; Amundsen, P. Ecosystem type shapes trophic position and omnivory in fishes. Fish Fish. 2018, 19, 1003–1015. [Google Scholar] [CrossRef] [Green Version]
  72. Gu, B.H.; Schelske, C.L.; Hoyer, M.V. Intrapopulation feeding diversity in blue tilapia: Evidence from stable-isotope analyses. Ecology 1997, 78, 2263–2266. [Google Scholar]
  73. Kondoh, M. Foraging adaptation and the relationship between food-web complexity and stability. Science 2003, 299, 1388–1391. [Google Scholar] [CrossRef]
  74. Kao, Y.C.; Rogers, M.W.; Bunnell, D.B.; Cowx, I.G.; Qian, S.S.; Anneville, O.; Beard, T.D., Jr.; Brinker, A.; Britton, J.R.; Chura-Cruz, R.; et al. Effects of climate and land-use changes on fish catches across lakes at a global scale. Nat. Commun. 2020, 11, 2526. [Google Scholar] [CrossRef]
Figure 1. The geographical location of the study area and sampling sites (S1–S4) are located in Lake Zacapu, Michoacán, México.
Water 15 01301 g001
Figure 2. Cluster analysis of the trophic classification of fish species from Lake Zacapu.
Water 15 01301 g002
Figure 3. Principal component analysis showing the position of the trophic groups of fish species in Lake Zacapu.
Water 15 01301 g003
Figure 4. Lake Zacapu food web plot based on analysis of δ13 C and δ15 N stable isotope values, mean δ13 C and δ15 N (±1SE). Acronyms: Ar = Alloophorus robustus, Az = Allotoca zacapuensis, Ht = Hubbsina turneri, Sl = Skiffia lermae, Xv = Xenotoca variata, Zq = Zoogoneticus quitzeoensis, Ch = Chirostoma humboldtianum, Pi = Poeciliopsis infans, Ci = Ctenopharingodon idella, Cc = Cyprinus carpio, Ng = Notropis grandis, At = Algansea tincella, Ga = Goodea atripinnis, Bi= benthic invertebrates, Zo = zooplankton, Fi =phytoplankton.
Water 15 01301 g004
Figure 5. Stable isotope ellipses encircling one standard deviation of the bivariate data for fish species (black line), macroinvertebrates (green line), phytoplankton (blue line), and zooplankton (red line) collected in Lake Zacapu. Layman metrics for each season and site are shown in the plots; phytoplankton and zooplankton communities per site are shown together (red line). CD mean distance to centroid; MNND mean nearest neighbor distance; SDNND standard deviation of nearest neighbor distance.
Water 15 01301 g005
Figure 6. Bayesian model for the calculation of consumer (fish species: green color) trophic position using stable isotopes of C and N with BMI (macroinvertebrates: blue color) and Zooplankton (red color) as baseline for the different sites and seasons in Lake Zacapu.
Water 15 01301 g006
Table 1. Physical and chemical water characteristics of Lake Zacapu, Michoacán, Mexico. Temp = water temperature (°C), DO = dissolved oxygen (O2 mg/L), pH = potential for hydrogen, TDS = total dissolved solids (mg/L), Cond = conductivity (µS/cm), NH3 = ammonia (mg/L), NO3 = nitrate (mg/L), NH4 = ammonium (mg/L). Average and standard deviation (X̄ ± SD). Kruskal Wallis differences among seasons and sites. * Significant differences.
ParameterDry SeasonWet Season
Temp18.5 ± 1.519.9±0.7
Seasonx2 = 3.6486, p = 0.056
Sitesx2 = 1.723, p = 0.631
DO13.7±2.714.3±0.2
Seasonx2 = 0.2757, p = 0.599
Sitesx2 = 9.3971, p = 0.064
pH7.7±0.47.3±0.2
Seasonx2 = 6.419, p = 0.011 *
Sitesx2 = 0.74108, p = 0.86
TDS107.9±2.1109.2±2.4
Seasonx2 = 0.80397, p = 0.37
Sitesx2 = 1.0738, p = 0.78
Cond136.7±2.6138.8±1.8
Seasonx2 = 1.875, p = 0.17
Sitesx2 = 1.0429, p = 0.79
NH30.07±0.020.11±0.03
Seasonx2 = 6.1799, p = 0.012 *
Sitesx2 = 0.18107, p = 0.98
NO37.4±1.06.7±0.6
Seasonx2 = 2.6694, p = 0.10
Sitesx2 = 0.13889, p = 0.98
NH40.06±0.020.09±0.05
Seasonx2 = 2.2443, p = 0.13
Sitesx2 = 0.0171, p = 0.99
Table 2. Diet and trophic classification of fish species sampled in Lake Zacapu. The values for each item type and fish species represent the Variation in the Prey-Specific Index of Relative Importance (PSIRI). Abbreviations of minor taxa identified: Fish/R = fish and fish remains; AcIn/R = Aquatic insect remains; Chi= Chironomidae; Hya = Hyalella; Cam = Cambarellus; Ost = Ostracods; Bos = Bosmina, Cop = copepods; Gas = gastropods, Biv = Bivalvia, Ker = Keratella, Frag = Fragilaria; Dia = diatoms; Veg/R = vegetal remains; Pot = Potamogeton; Plu = Plumatelidae. Origin of the species: * = native, ** = endemic, + = nonnative.
Fish SpeciesFish/RAcIn/RChiHyaCamOstBosCopDetritus
Goodeidae
* Alloophorus robustus7.11.2 1.913.0 0.30
** Allotoca zacapuensis 13.84.822.9 0.6 0.80
* Goodea atripinnis4.5 1.5 6.97.52.59.7
* Hubbsina turneri 3.92.731.2 2.34.53.90
* Skiffia lermae0.74.6 0.9 0.46.01.65.1
* Xenotoca variata8.1 8.227.4 9.3 4.90.3
* Zoogoneticus quitzeoensis7.62.23.913.7 0.410.93.6
Atherinopsidae
* Chirostoma humboldtianum1.50.50.527.10.42.231.05.20
Poeciliidae
* Poeciliopsis infans3.10.20.20.6 0.924.6 6.1
Cyprinidae
+ Ctenopharyngodon idella 21.3
** Notropis grandis 20.3 13.39.61.90
Fish SpeciesGastBivKerFragDiaVe/RPotPlu
Goodeidae
* Alloophorus robustus5.71.2
** Allotoca zacapuensis 0.4
* Goodea atripinnis1.00.43.04.413.9
* Hubbsina turneri 3.6 0.3 0.9
* Skiffia lermae 0.214.81.10.6
* Xenotoca variata 0.60.10.10.10.1 0.2
* Zoogoneticus quitzeoensis 0.4
Atherinopsidae
* Chirostoma humboldtianum0.90.92.6 0.2
Poeciliidae
* Poeciliopsis infans 1.8
Cyprinidae
+ Ctenopharyngodon idella 48.213.2
** Notropis grandis6.8 0.60.1
Table 3. Trophic level (average ± SD) and omnivory index for the fish species caught in Lake Zacapu.
Fish SpeciesTrophic LevelOmnivory Index
A. robustus3.5 ± 0.520.20
A. zacapuensis3.3 ± 0.450.10
G. atripinnis2.8 ± 0.370.29
H. turneri3.1 ± 0.400.12
S. lermae2.8 ± 0.350.22
X. variata2.8 ± 0.370.10
Z. quitzeoensis3.0 ± 0.390.12
C. humboldtianum3.3 ± 0.440.25
P. infans3.1 ± 0.460.05
C. idella2.6 ± 0.140.01
N. grandis2.9 ± 0.380.15
Table 4. Values of Horn’s niche overlap index for fish species in Lake Zacapu. Ar = Alloophorus robustus, Az = Allotoca zacapuensis, Ht = Hubbsina turneri, Sl = Skiffia lermae, Xv = Xenotoca variata, Zq = Zoogoneticus quitzeoensis, Ch = Chirostoma humboldtianum, Pi = Poeciliopsis infans, Ci = Ctenopharingodon idella, Ng = Notropis grandis, Ga = Goodea atripinnis. White = low superposition, light gray = medium superposition, black color = high overlap between the species.
ArAzHtSlXvZqChPiCiNgGa
Ar10.330.350.160.400.380.300.190.000.290.15
Az 10.870.370.830.720.540.130.000.520.20
Ht 10.470.880.790.790.330.000.720.38
Sl 10.450.520.490.510.660.500.76
Xv 10.930.670.240.030.720.36
Zq 10.630.330.070.660.45
Ch 10.680.010.800.50
Pi 10.100.450.57
Ci 10.040.38
Ng 10.52
Ga 1
Table 5. Metrics of the niche breadth and isotopic overlap between the species per site and season. Abbreviations: CR = range in δ13C, NNR = range in δ15N, TA = total area, SEA = Bayesian standard ellipse area, SEAc = Bayesian standard ellipse area corrected.
NNRCRTASEASEAc
Wet Season11.310.782.4
Fish 49.59.19.2
Phyto 1.72.33.5
BMI 21.54.84.9
Zoo 4.35.37.9
Dry Season10.812.788.3
Fish 49.59.19.2
Phyto 1.72.33.5
BMI 21.54.84.9
Zoo 4.35.37.9
Site 110.78.964.0
Fish 38.29.79.8
BMI 15.15.76.1
Phyto-Zoo 3.03.65.4
Site 29.112.674.8
Fish 39.29.69.7
BMI 10.74.85.2
Phyto-Zoo 8.610.515.7
Site 310.69.863.6
Fish 34.27.57.5
BMI 10.65.25.8
Phyto-Zoo 5.16.39.5
Site 410.3968.19
Fish 32.79.09.2
BMI 22.89.610.5
Phyto-Zoo 1.82.23.3
Disclaimer/Publisher’s Note: The statements, opinions and data contained in all publications are solely those of the individual author(s) and contributor(s) and not of MDPI and/or the editor(s). MDPI and/or the editor(s) disclaim responsibility for any injury to people or property resulting from any ideas, methods, instructions or products referred to in the content.

