Article

Effect of Temperature on Microorganisms and Nitrogen Removal in a Multi-Stage Surface Flow Constructed Wetland

1
School of Water Conservancy and Hydroelectric Power, Hebei University of Engineering, Handan 056038, China
2
Hebei Key Laboratory of Intelligent Water Conservancy, Hebei University of Engineering, Handan 056038, China
3
Department of Earth Sciences, University of the Western Cape, Cape Town 7535, South Africa
4
Hebei Collaborative Innovation Center for the Regulation and Comprehensive Management of Water Resources and Water Environment, Hebei University of Engineering, Handan 056038, China
5
Innovation Center for Water Pollution Control and Water Ecological Remediation, Hebei University of Engineering, Handan 056038, China
*
Authors to whom correspondence should be addressed.
Water 2023, 15(7), 1256; https://doi.org/10.3390/w15071256
Submission received: 3 March 2023 / Revised: 21 March 2023 / Accepted: 21 March 2023 / Published: 23 March 2023
(This article belongs to the Special Issue Constructed Wetlands and Nutrient Removal)

Abstract

:
The effect of low temperature on microbial nitrogen metabolism in constructed wetlands has yet to be extensively investigated. In this study, we analyzed the effects of temperature changes on nitrogen-associated microorganisms and nitrogen metabolism functional genes in a multi-stage surface flow constructed wetland (MSSFCW) using metagenomic sequencing. The treatment of polluted river water in the MSSFCW, which had a mean water temperature (MWT) of ≤17 °C, resulted in a low removal efficiency (RE) for total nitrogen (TN; average RE: 23.05% at 1–17 °C) and nitrate nitrogen (NO3-N; average RE: −2.41% at 1–17 °C). Furthermore, at a MWT of ≤11 °C, the REs were low for ammonium nitrogen (NH4+-N; average RE: 67.92% at 1–11 °C) and for chemical oxygen demand (COD; average RE: 27.45% at 1–11 °C). At 0.24 m3 m−2 d−1 influent load, the highest REs for TN (66.84%), NO3-N (74.90%), NH4+-N (83.93%), and COD (52.97%) occurred in July and August, when water temperatures were between 26 and 28 °C. The lowest rates (TN: 11.90%, NO3-N: −21.98%, NH4+-N: 65.47%, COD: 24.14%) occurred in the January–February period, when the water temperature was lowest (1–5 °C). A total of 25 significantly different species were detected in surface sediment, none of which were dominant species. The dominant phyla and genera at low (January) and high (July) temperatures were similar; however, microorganisms were more abundant in the low-temperature months. Our analysis indicated that the same nitrogen metabolism pathways occurred in January and July. Denitrification-associated functional genes were the most abundant; nitrification-related functional genes were the least abundant. Only nirBD displayed significantly different abundances between January and July. This paper can hopefully help researchers and managers further understand how temperature affects nitrogen removal performance in constructed wetlands.

1. Introduction

Treated and untreated effluents, as well as agricultural runoff, flow directly into rivers, causing higher nutrient contents, including nitrogen, which leads to eutrophication of the lakes and reservoirs replenished by rivers [1,2,3]. Data from recent decades show that nitrogen concentrations in rivers around the world are increasing annually; thus, nitrogen pollution is a matter of international concern [4,5].
Constructed wetlands simulate natural wetlands in structure and function to provide treatment of wastewater. Engineered wetland systems that have been artificially designed and constructed have strong wastewater treatment capabilities and low construction, operation, and management costs [6,7]. Further, these wetlands, which are similar in structure to natural wetlands, can regulate and store floodwater, increase biodiversity, and be used for human recreation [2,8]. Moreover, constructed wetlands are an effective tool for the removal of nitrogen from polluted river water [1,3,9].
In constructed wetlands, microbial degradation plays a vital role in pollutant removal, especially the nitrogen removal process [10,11,12], and it is influenced by various environmental factors. Temperature not only affects microbial activity but can also change the structure of microbial communities, which is a key factor in nutrient removal in wetlands [1,13,14]. Multiple studies have assessed the influence of temperature on microbial degradation, but uncertainty remains regarding how temperature affects microorganisms and pollutant removal. For example, some studies agree that low temperatures severely inhibit microbial processes, including organic matter decomposition, nitrification, and denitrification [15,16,17]. Akratos and Tsihrintzis [18] demonstrated that, at temperatures below 15 °C, denitrifying bacteria do not function properly. However, a study by Van de Moortel et al. [19] found that total nitrogen (TN) and ammonium–nitrogen (NH4+-N) removal rates were highest between 5 °C and 15 °C. Furthermore, Chen et al. [14] concluded that low temperatures (5–10 °C) boosted the nitrification activity of microorganisms. In view of these seemingly contrasting findings, further research is required, especially on the geographical environment of constructed wetlands, to fully ascertain the influence of temperature in improving their purification capacity.
The Yongnian depression is the third largest depression in north China and the only lake wetland in southern Hebei province. It is, therefore, valuable in terms of ecosystem services. The Fuyang River is the main source of replenishment for the Yongnian depression. Agricultural runoff and tailwater from sewage treatment plants in the city of Handan and the surrounding counties flow into the river, resulting in large amounts of nitrogen entering the lake, thus producing a mesotrophic environment. To reduce nitrogen input load in the depression, a multi-stage surface flow constructed wetland (MSSFCW) was created using existing aquatic plant ponds around the depression’s water replenishment channel to purify water from the Fuyang River.
In this study, we compared the nitrogen removal performance of the field-scale MSSFCW across different months and analyzed the composition and metabolic pathways of nitrogen-associated microbial communities. The effects of temperature changes on the removal of nitrogen and on microbes and nitrogen metabolism in the constructed wetland were all evaluated. Specifically, we explored the relationship between nitrogen metabolism pathways and functional genes and pollutant removal in high- and low-temperature months.

2. Materials and Methods

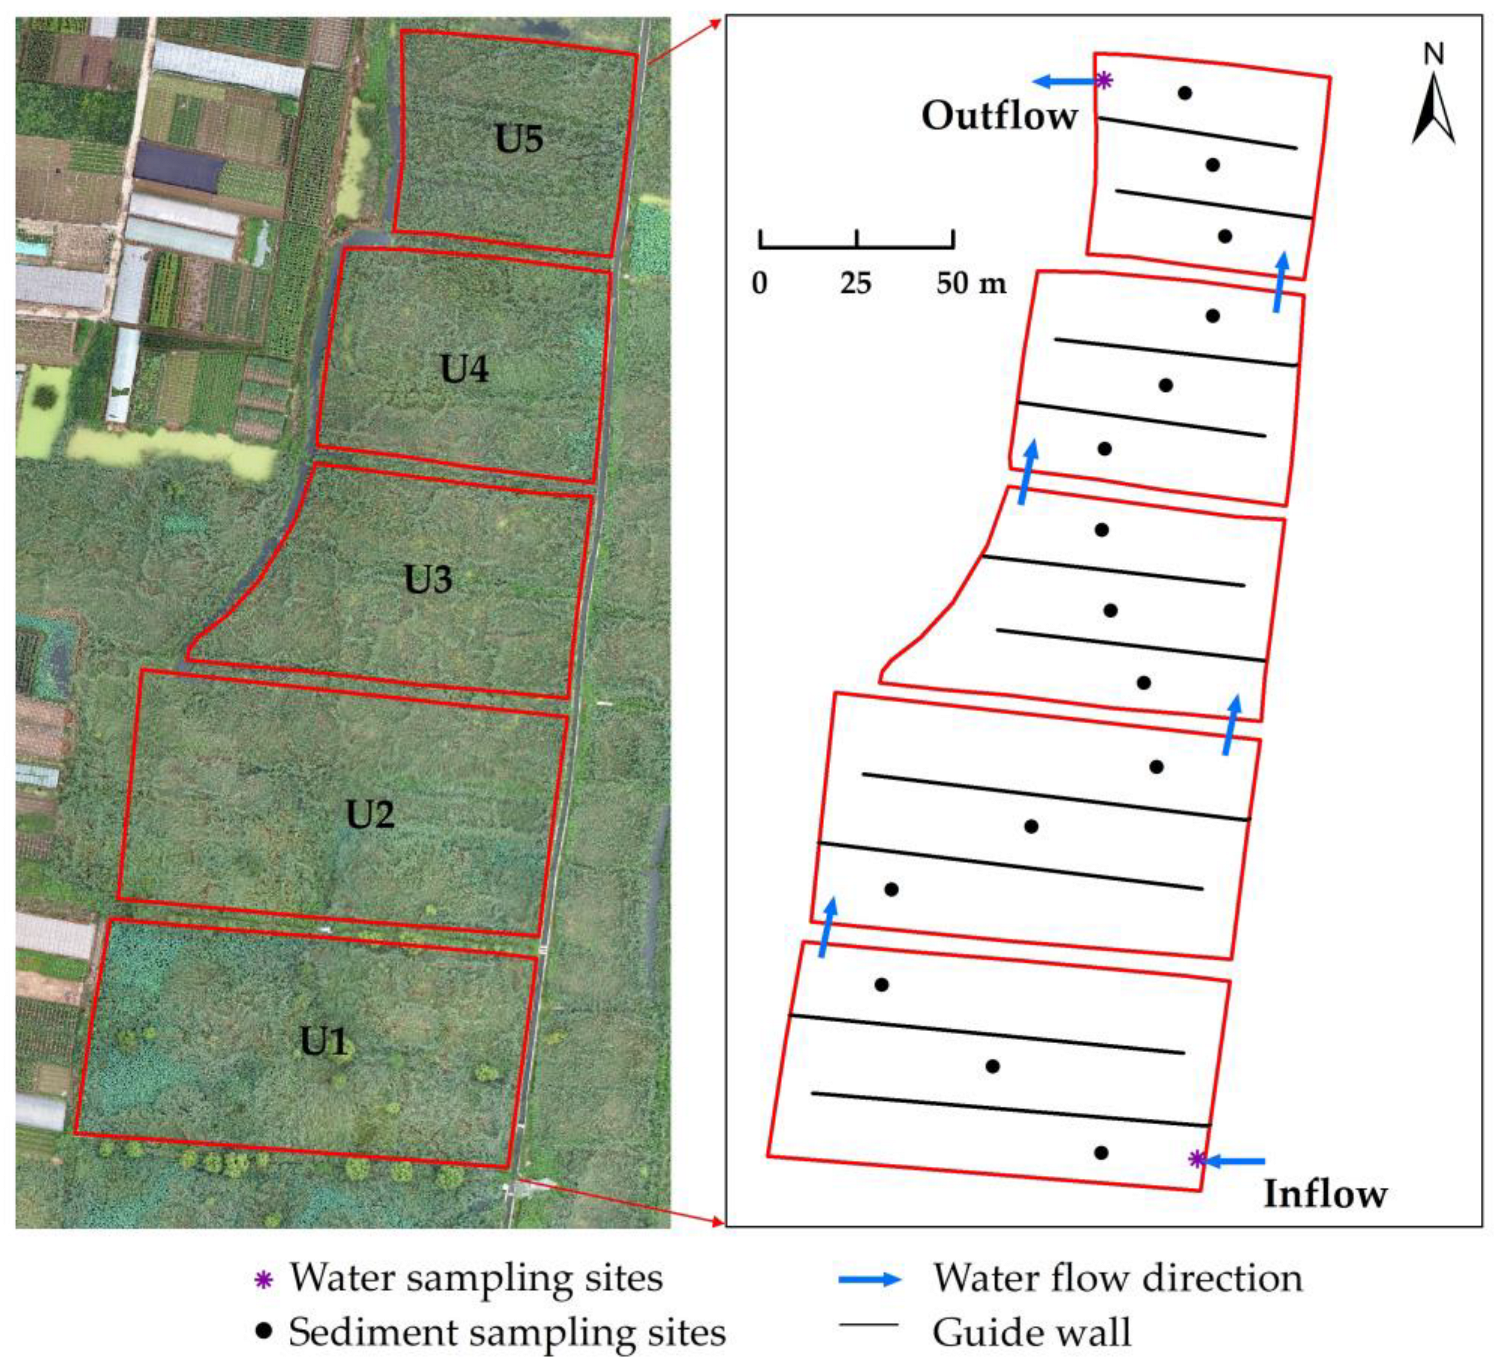
2.1. Site Description

The MSSFCW (36°40′50″ N, 114°44′3″ E) is located southeast of Yongnian district, Handan city, China, and west of the FengDi drainage, which is the diversion channel from the Fuyang River to the Yongnian depression. It was completed in 2017 and has a net area of approximately 24,100 m2. The MSSFCW system is composed of five contiguous units referred to as U1–U5 (Figure 1). The wetland units have varying areas as they were constructed based on local geographical conditions, and the terrain is higher in the south and lower in the north. The water flows through each wetland unit from south to north under the action of gravity.
The area where the constructed wetland is located has a temperate monsoon continental climate, with marked temperature changes throughout the year (Figure 2a). The temperature is higher from May to September (average: 23–30 °C), with the highest annual temperature in July (average: 30 °C). April and October have similar midrange temperatures (average: 16 °C). January to March and November and December are the colder months (average: 0–11 °C), January being the coldest of the year (average: 0 °C). The average annual temperature is 16 °C. Changes in the wetland water temperature are similar to the atmospheric temperature (Figure 2a). The temperature is higher from May to September (average: 23–28 °C) and highest in July (average: 28 °C). The average water temperature is 15 °C in April and 17 °C in October. January to March and November and December have colder water temperatures (average: 1–11 °C), and January has the coldest water temperature (average: 1 °C).
The dominant wetland plants are reeds (Phragmites communis (L.) Trin.), with some lotuses (Nelumbo nucifera). The former accounts for approximately 95% of the wetland plant area, and vegetation coverage in summer is nearly 100%. To improve and avoid short-circuiting the hydraulic conditions in the wetland, the units contain guide walls. During the study period, to reduce the impact of changes in the hydraulic loading rate (HLR) and guarantee downstream water replenishment, the wetland HLR was maintained at approximately 0.24 m3 m−2 d−1 using an electromagnetic flowmeter (Shanghai Longruisi Electron Technology Co., Ltd., Shanghai, China). The water depth of each wetland unit was 25–30 cm, with a mean water depth of 28 cm, and the total hydraulic retention time was approximately 28 h.

2.2. Sample Collection and Analysis

2.2.1. Water Sample Collection and Physicochemical Index Analysis

Between March 2019 and February 2020, water samples were collected three times per month (not during precipitation) at the entrance and exit of the wetland (see Figure 1 for sampling details). Water samples were kept in glass bottles, stored at 0–4 °C, and quickly transported to the laboratory for analysis and determination. Water temperature was measured on-site using a HQ40d water quality detector (Hach, Loveland, CO, USA). NH4+-N and nitrate nitrogen (NO3-N) were measured using an Auto-Analyzer3 continuous flow analyzer (SEAL Analytical, Norderstedt, Germany). TN was measured using alkaline potassium persulfate digestion ultraviolet spectrophotometry (HJ 636-2012) [20], and COD was measured using the potassium dichromate method (HJ 828-2017) [21]. Additionally, atmospheric temperature data were obtained from the Yongnian Meteorological Observatory, close to where the constructed wetland is located.

2.2.2. Microorganism Sample Collection

In July 2019 and January 2020, 0–5 cm microbial samples of surface sediment were collected from the five wetland units. To obtain representative samples from each unit, three samples of surface sediment of the same volume were collected from each unit (see Figure 1 for the sample locations) in the direction of water flow, with plant residues and gravel removed. They were then mixed evenly and packed into sealed polyethylene bags. The samples were stored on dry ice, quickly transported back to the laboratory, and stored in a −80 °C freezer for DNA extraction and molecular biology assays.

2.2.3. DNA Extraction, Library Construction, and Metagenomic Sequencing

Microbial DNA was extracted from sediment samples using the E.Z.N.A.® Soil DNA Kit (Omega Bio-tek, Norcross, GA, USA) following the manufacturer’s instructions. Subsequently, the quantitative and qualitative identification of DNA samples was achieved using a NanoDrop ND-1000 spectrophotometer (Thermo Fisher Scientific, Waltham, MA, USA) and agarose gel electrophoresis, respectively. A metagenomic shotgun sequencing library with a mode length of approximately 400 bp was constructed using the TruSeq Nano DNA LT Library Preparation kit (Illumina, San Diego, CA, USA). The sample library was sequenced by Personal Biotechnology Co., Ltd. (Shanghai, China) on a HiSeq X-ten (Illumina).
We applied quality control and preprocessing to the raw sequencing data using the Cutadapt (v1.2.1) [22] and Fastp (v0.20.0) [23] software programs, obtaining a clean dataset with an average value of 11.78 Gb/sample for subsequent analysis. Further, we used Kaiju [24] to identify species based on the clean reads from metagenomic sequencing and analyze the statistical species information and sequences to obtain species composition and abundance information at the taxonomic level for each sample. Furthermore, for gene prediction and annotation, we used MEGAHIT [25] to splice and assemble the clean reads in each sample, employing the meta-large pre-set parameters and keeping the contig length at ≥300 bp. Additionally, we used the “easy-linclust” mode in MMseqs2 software (v7e2840992948ee89dcc336522dc98a74fe0adf00) [26] to cluster contigs showing 95% identity, with alignment coverage of 90% (proportion of short sequences), to obtain the non-redundant contig set. Genes in contigs were predicted using MetaGeneMark (Georgia Institute of Technology, Atlanta, GA, USA) [27]. The coding sequences for the samples were clustered using the “easy-cluster” mode in MMseqs2, setting the protein sequence identity threshold to 0.90 and covering residues of the shorter contigs up to 90%, thereby constructing non-redundant protein sequence sets. Functional gene annotation was completed by comparing non-redundant protein sequence sets with the KEGG Orthology-Based Annotation System database [28]. Moreover, Salmon [29] was used to assess the abundances of annotated genes, and MinPath [30] was used to infer metabolic pathways.

2.3. Statistical Analysis

SPSS (version 26) was employed to conduct Kruskal–Wallis tests, with which we determined significant differences in the water purification efficiency of the MSSFCW system at different temperatures. Linear discriminant analysis effect size (LEfSe) was used to identify taxa that contributed to the effect size in the microbial community and to analyze differences between microbial communities. Statistical analysis was conducted using LEfSe software (v1.0) (http://huttenhower.sph.harvard.edu/galaxy/ (accessed on 8 September 2022)). The microbial composition histogram, chord diagram, and significant difference test boxplot and histogram were all developed using genescloud tools (https://www.genescloud.cn (accessed on 20 October 2022)).

3. Results

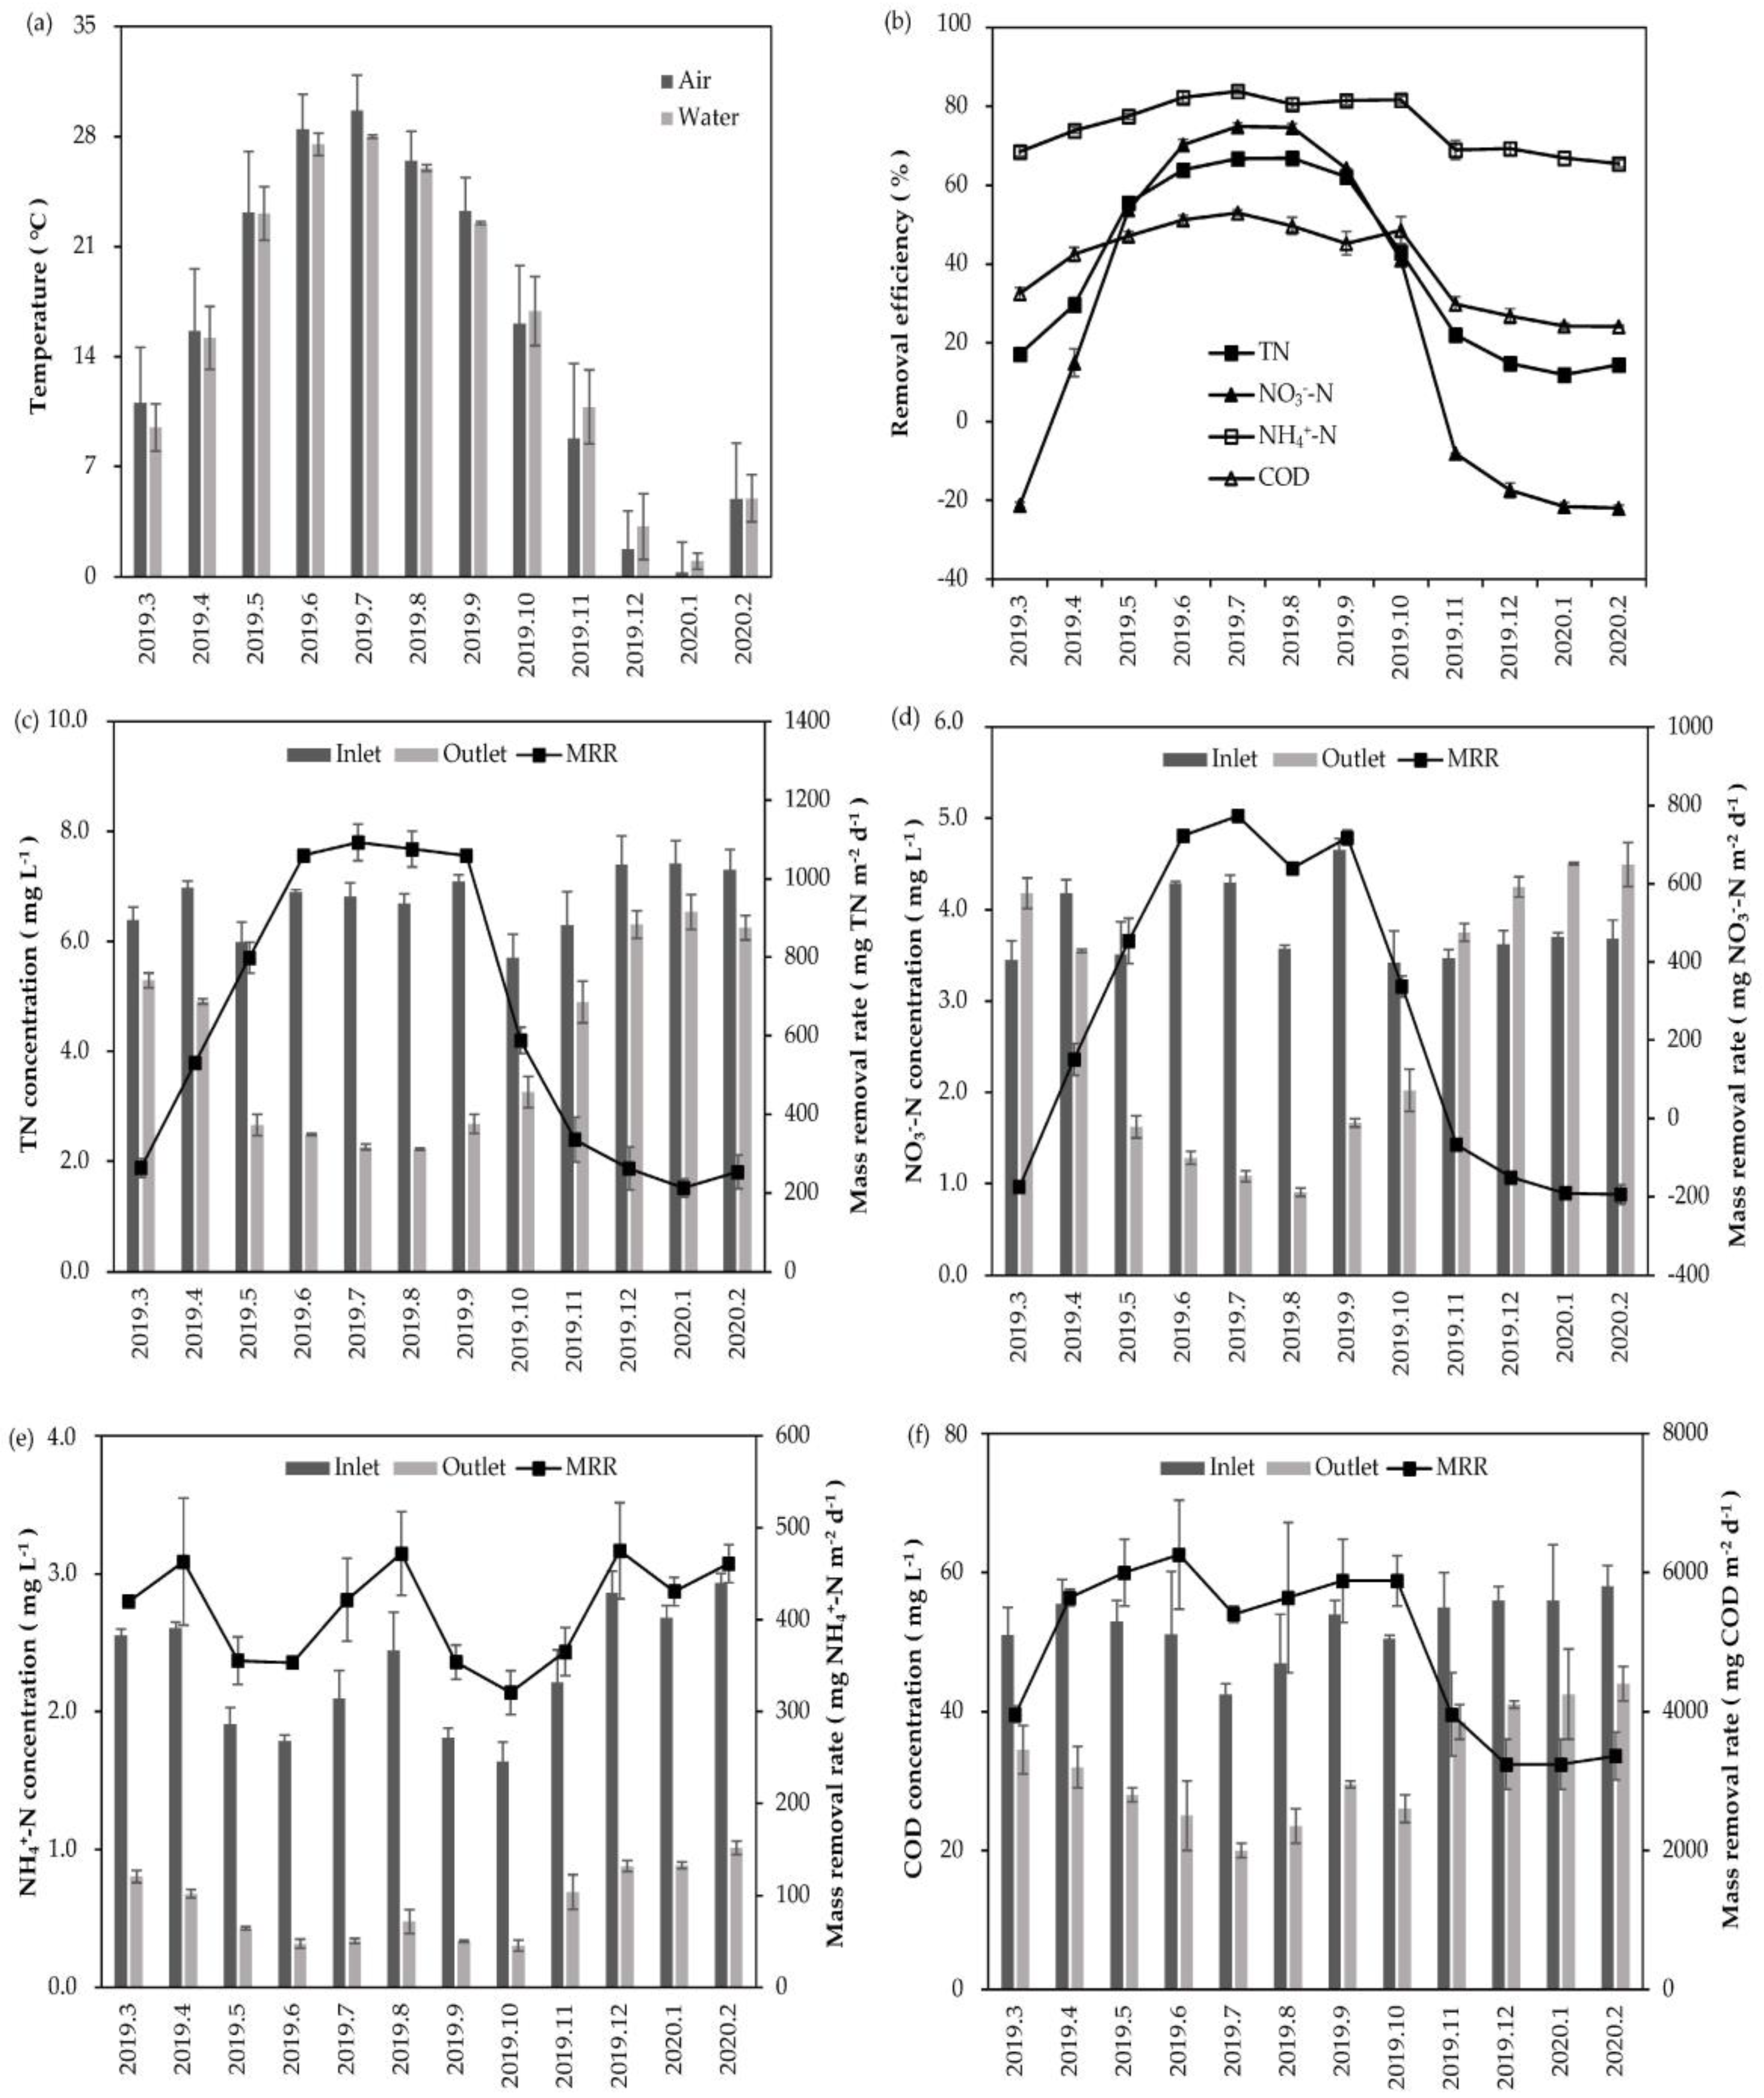
3.1. Water Purification Performance

The water purification efficiency of the MSSFCW system was analyzed statistically under different temperature conditions (high, ~23–28 °C; medium, ~15–17 °C; and low, ~1–11 °C). The results obtained are shown in Table 1. From this table, it can be seen that the removal efficiencies (REs) of the system for TN, NO3-N, NH4+-N, and COD, as well as the mass removal rates (MRRs) with respect to TN, NO3-N, and COD, were significantly affected by temperature (p < 0.001), decreasing significantly with decreasing water temperature. However, the MRR for NH4+-N did not show any significant changes (p > 0.05) with increasing temperature but was slightly higher at lower temperatures.
Detailed information on the water purification in this constructed wetland is shown in Figure 2b–f). During the study period, the TN influent concentration in the wetland was 6.70 ± 0.60 mg L−1, the effluent concentration was 3.95 ± 1.59 mg L−1, the overall average RE was 41.23%, and the overall average MRR was 658.08 mg TN m−2 d−1. The TN purification capacity in the wetland increased as atmospheric temperature increased from March, stabilizing and reaching a peak in July to August. Further, RE was highest in August (66.84%), and MRR was highest in July (1092.13 mg TN m−2 d−1). Subsequently, as the temperature dropped, purification weakened. The lowest values occurred in January, when the RE and MRR were just 11.90% and 212.55 mg TN m−2 d−1, respectively.
The NO3-N influent concentration in the wetland was 3.84 ± 0.45 mg L−1, the effluent concentration was 2.63 ± 1.37 mg L−1, the overall average RE was 29.38%, and the overall average MRR was 289.66 mg NO3-N m−2 d−1. Further, the changes in NO3-N purification were similar to those for TN. The removal effect was best in July, with an RE and MRR of 74.90% and 772.80 mg NO3-N m−2 d−1, respectively. From January to March and in November and December, the NO3-N removal efficiency was negative (average: −17.63%), and it reached its lowest level in February, when the RE was −21.98% and the MRR was −194.40 mg NO3-N m−2 d−1.
The NH4+-N influent concentration in the wetland was 2.24 ± 0.43 mg L−1, the effluent concentration was 0.56 ± 0.24 mg L−1, and the overall average RE was 75.76%. The removal efficiency was higher and basically stable from June to October (average: 82.06%), and it was highest in July (83.93%). Additionally, the average RE in April and May was 75.69%, while it was lower in January to March and November and December (average: 67.92%), with the lowest value in February (65.47%). The NH4+-N influent concentration was higher in March to April 2019, December 2019, and January to February 2020 (Figure 2e) than within other periods. This resulted in a slight increase in the MRR at lower temperatures. These results notwithstanding, the overall differences in MRRs were small (overall average: 402.43 mg NH4+-N m−2 d−1).
The wetland’s COD purification also increased as temperature increased. RE was higher in June to August (average: 51.30%) and highest in July (52.97%). From November, the removal efficiency decreased sharply before stabilizing, and it was lowest in February (24.14%). The MRR was highest in June (6259 mg COD m−2 d−1) and lowest in January (3240 mg COD m−2 d−1). The overall average COD RE was 40.07%, and overall average MRR was 4937.32 mg COD m−2 d−1 (influent concentration of 52 ± 4 mg L−1).

3.2. Microbial Community Structure

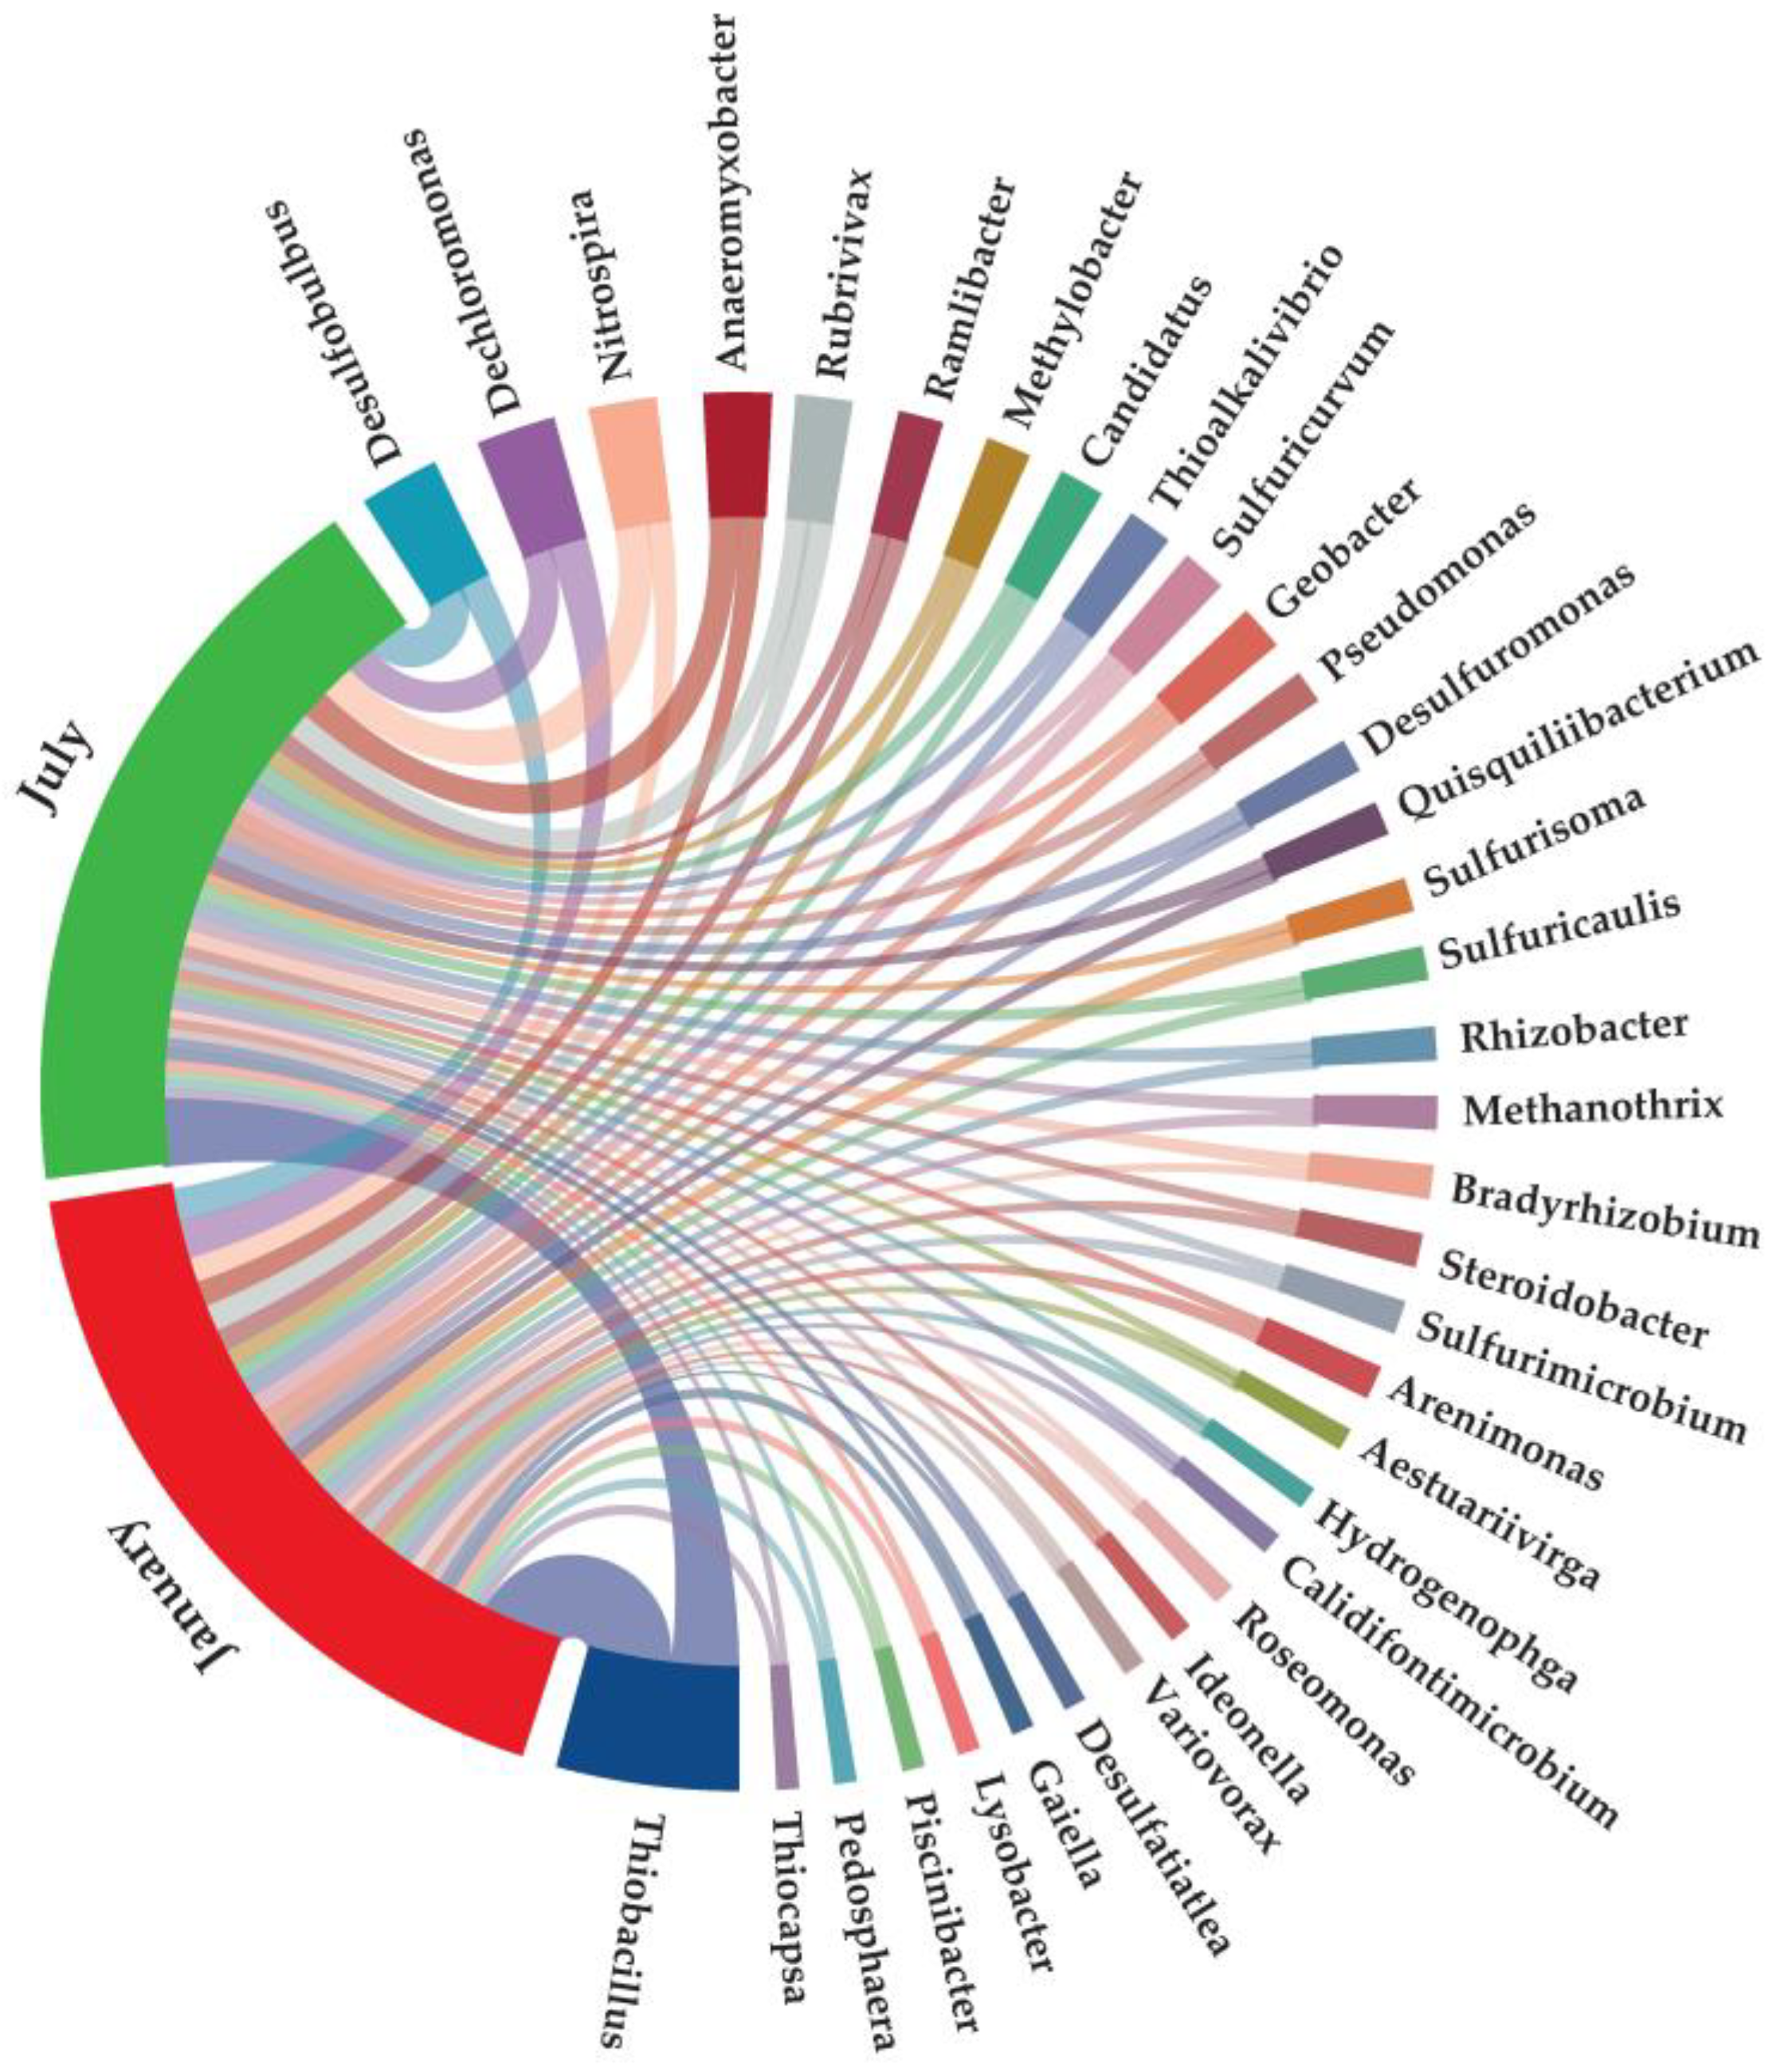
3.2.1. Dominant Microorganisms Associated with Nitrogen

Based on the metagenomic sequencing results, a total of 37 microbial phyla associated with nitrogen were detected in the MSSFCW, including 33 phyla of bacteria (relative abundance: 91.42–94.76%) and four phyla of archaea (relative abundance: 0.54–3.31%), with 4.38–5.82% of microorganisms being unclassified. Species with a relative abundance of less than 1% in each unit were classified as “Others”, and the dominant phyla were analyzed. The dominant phyla among the wetland microorganisms were basically the same in January and July (Figure 3). Proteobacteria (53.97–67.70%), Chloroflexi (4.36–10.11%), and Acidobacteria (4.48–9.23%) had relatively high proportions and were the dominant bacterial phyla. This was consistent with the results published by Zhang et al. [2]. Proteobacteria, the most abundant phylum, play an important role in organic matter degradation and nitrogen transfer [31,32]. Chloroflexi survive well in a range of environmental conditions (aerobic and anaerobic) and are involved in various metabolic processes; its members can be nitrite oxidants and participate in nitrogen cycle metabolism [12,33]. The phylum Acidobacteria was only discovered recently, and its specific ecology is not well-understood [34]. However, existing studies have shown that Acidobacteria are mostly heterotrophic, have good carbohydrate utilization capacities, and can use nitrite as a nitrogen source [35].
Figure 4 shows genus-level microorganisms with an average relative abundance of >0.2%. The dominant genera among the wetland microorganisms were basically the same in January and July. The relative abundances of those involved in denitrification, including Thiobacillus (1.54–1.88%), Desulfobulbus (0.69–0.87%), Dechloromonas (0.67–0.84%), Anaeromyxobacter (0.57–0.65%), and Rubrivivax (0.56–0.62%), as well as Nitrospira (0.57–0.80%), which is involved in nitrification, were relatively high. They were the major dominant genera of bacteria in the wetland. Of the six most dominant genera, denitrifying bacteria were more numerous.

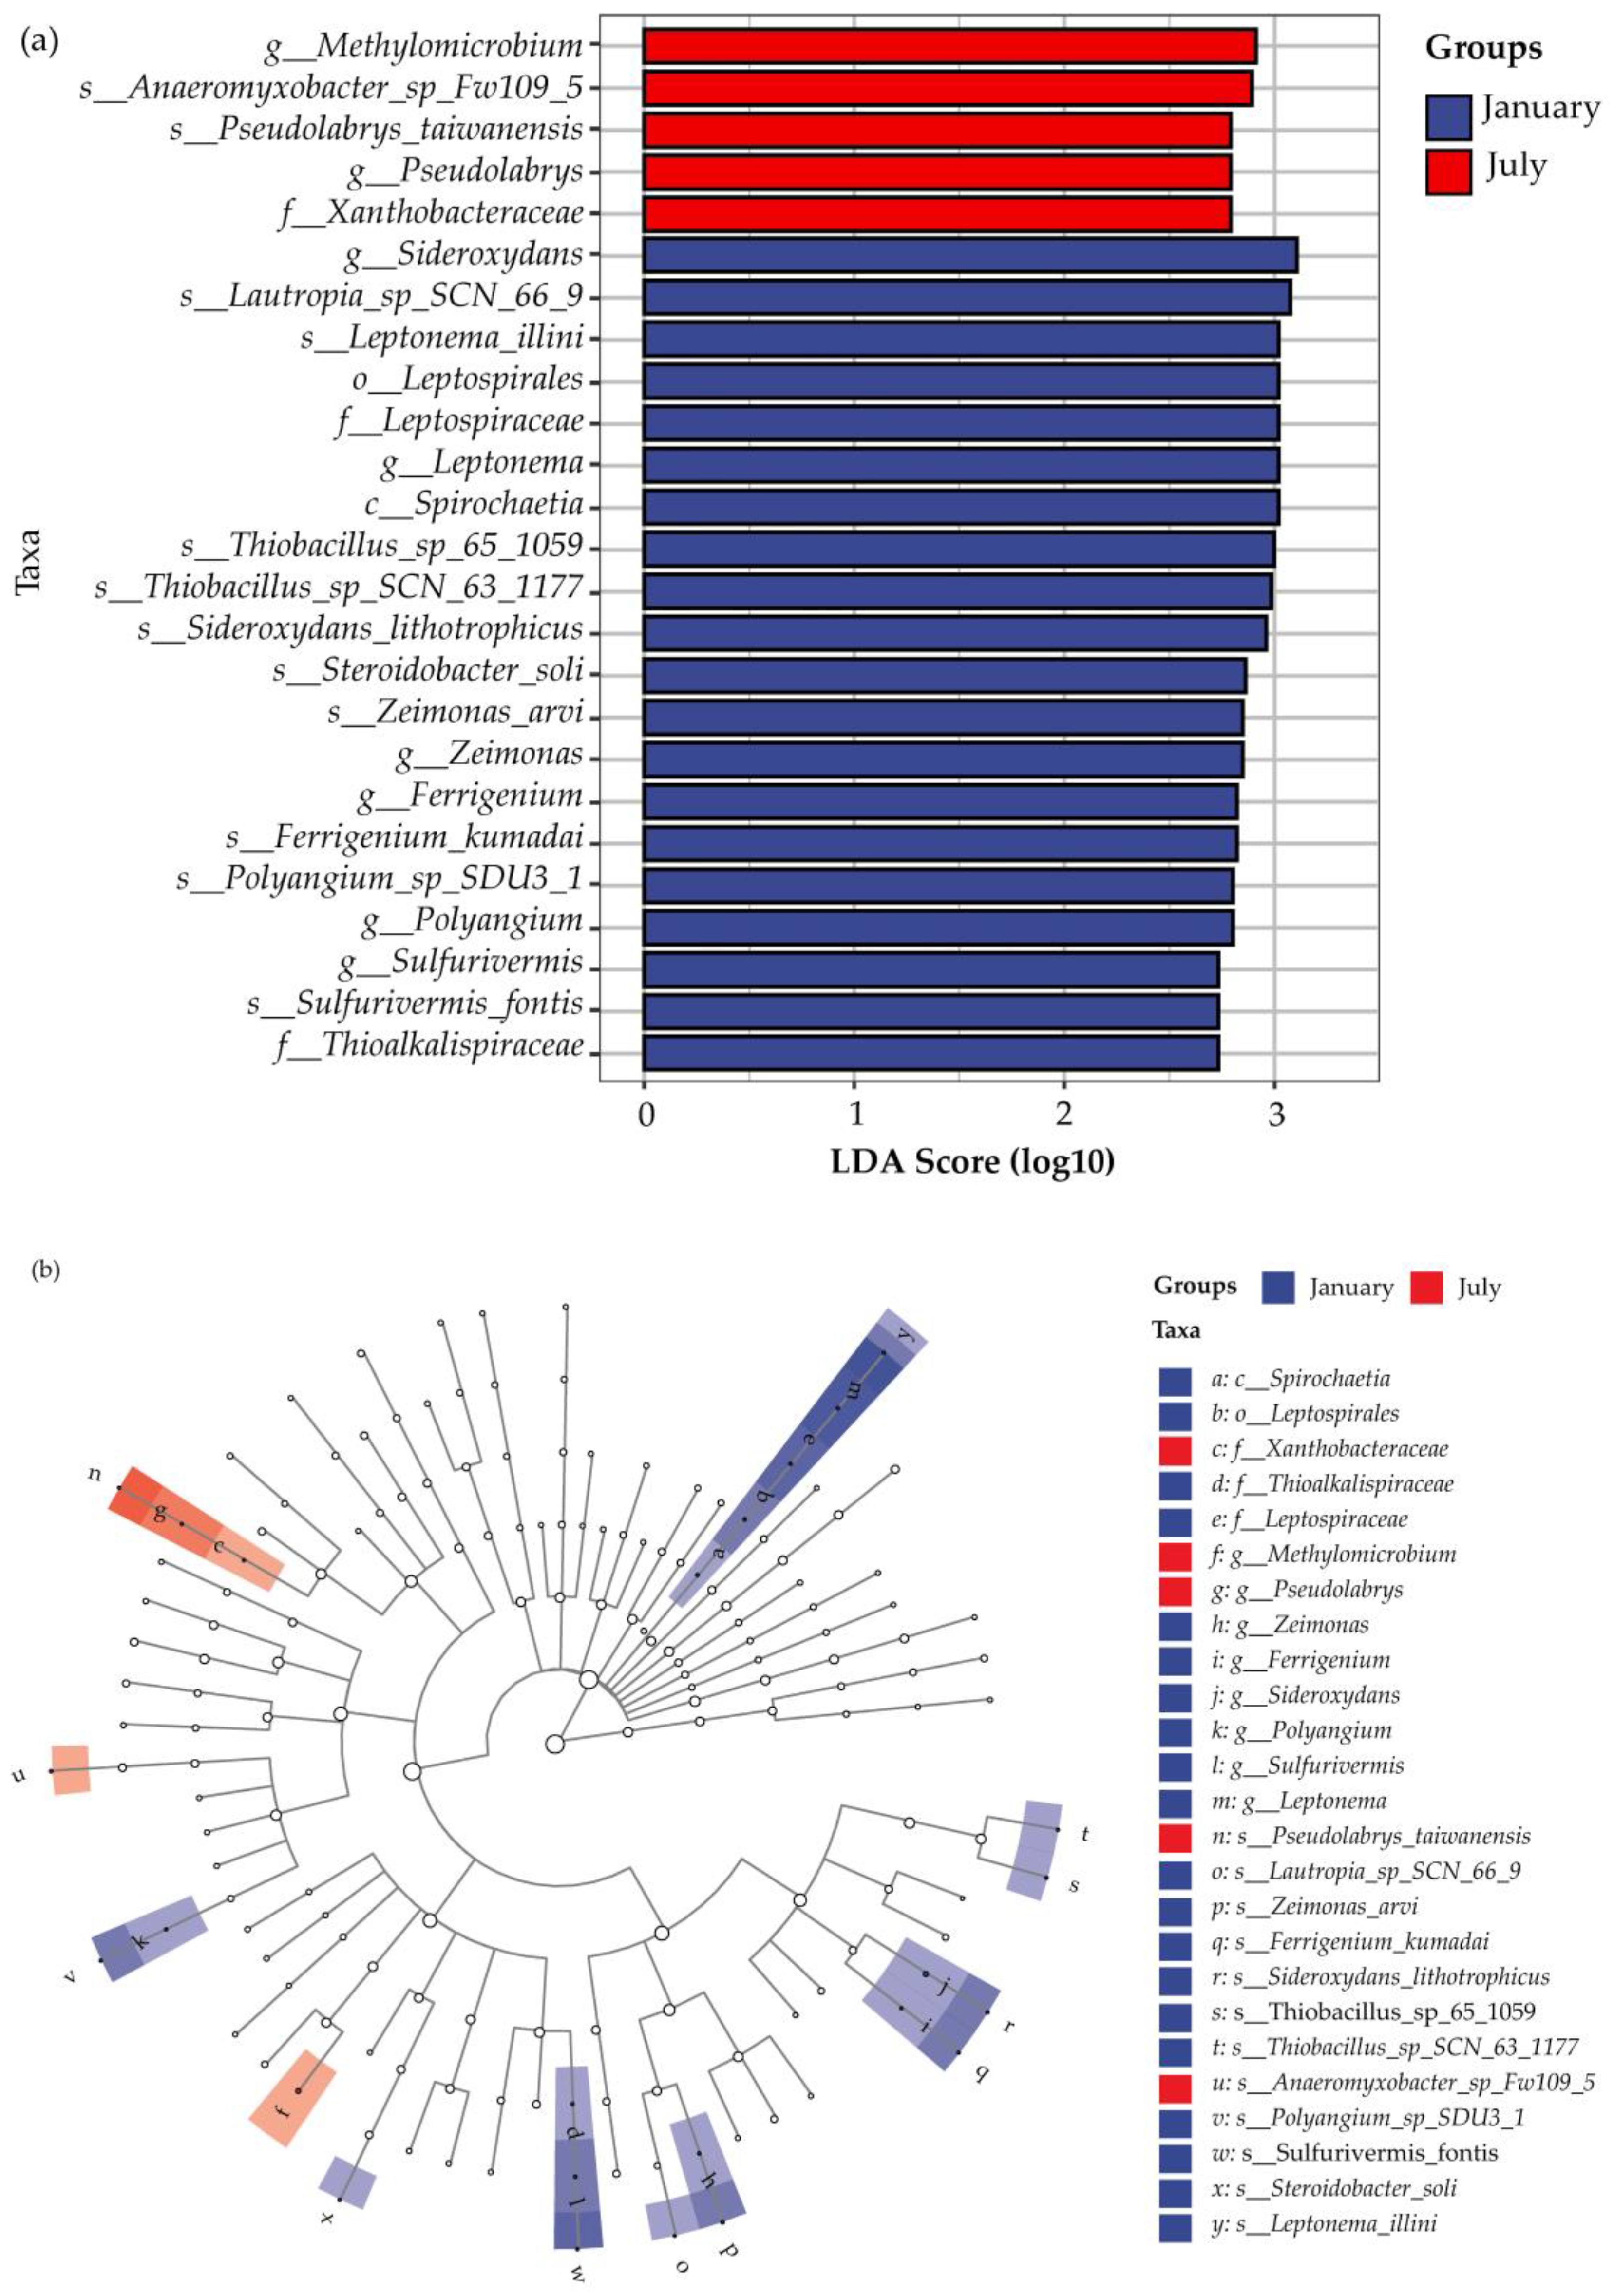
3.2.2. Microbial Community Diversity and Variation Analysis

The alpha-diversity index was used to characterize the effect of temperature change on the abundance and diversity of microbial communities associated with nitrogen (Figure 5). The Chao1 and ACE indexes represent the abundance of a microbial community, and the Shannon and Simpson indexes represent its diversity. In the MSSFCW, the Chao1, ACE, Shannon, and Simpson values were 1963.6 ± 91.24, 1315.38 ± 47.51, 8.99 ± 0.11, and 0.99 ± 0.001, respectively. All indexes were higher in January than July. The difference between Chao1 and ACE was significant (p < 0.05). Wetland microorganisms were more abundant in the colder months.
We used LEfSe (LDA > 2, p < 0.05) to compare groups at different temperatures and analyze differences in microbial community composition. Figure 6a shows the LDA values for groups with significant differences from phyla to species, and Figure 6b shows the evolutionary branches of species with significant differences. Our analysis indicated that there were 25 significantly different species in the wetland, including 20 in January and 5 in July, suggesting that species concentration increases during low-temperature months compared to high-temperature months, which was consistent with the results for the alpha-diversity index. The relative abundances of species with significant differences were lower.
Significantly enriched microbes in January included one class (Spirochaetia), one order (Leptospirales, a member of Spirochaetia), two families (Leptospiraceae (a member of Leptospirales) and Thioalkalispiraceae), six genera (Sideroxydans, Leptonema (a member of Leptospiraceae), Zeimonas, Ferrigenium, Polyangium, and Sulfurivermis (a member of Thioalkalispiraceae)), and ten species. Except for Lautropia sp. SCN 66-9, Thiobacillus sp. 65-1059, Thiobacillus sp. SCN 63-1177, and Steroidobacter soli, the other six species belonged to the six significantly different genera.
Significantly different microbes in July included one family (Xanthobacteraceae), two genera (Pseudolabrys (a member of Xanthobacteraceae) and Methylomicrobium), and two species (Pseudolabrys taiwanensis (a member of Pseudolabrys) and Anaeromyxobacter sp. Fw109-5). The five different species were all associated with denitrification [36,37].

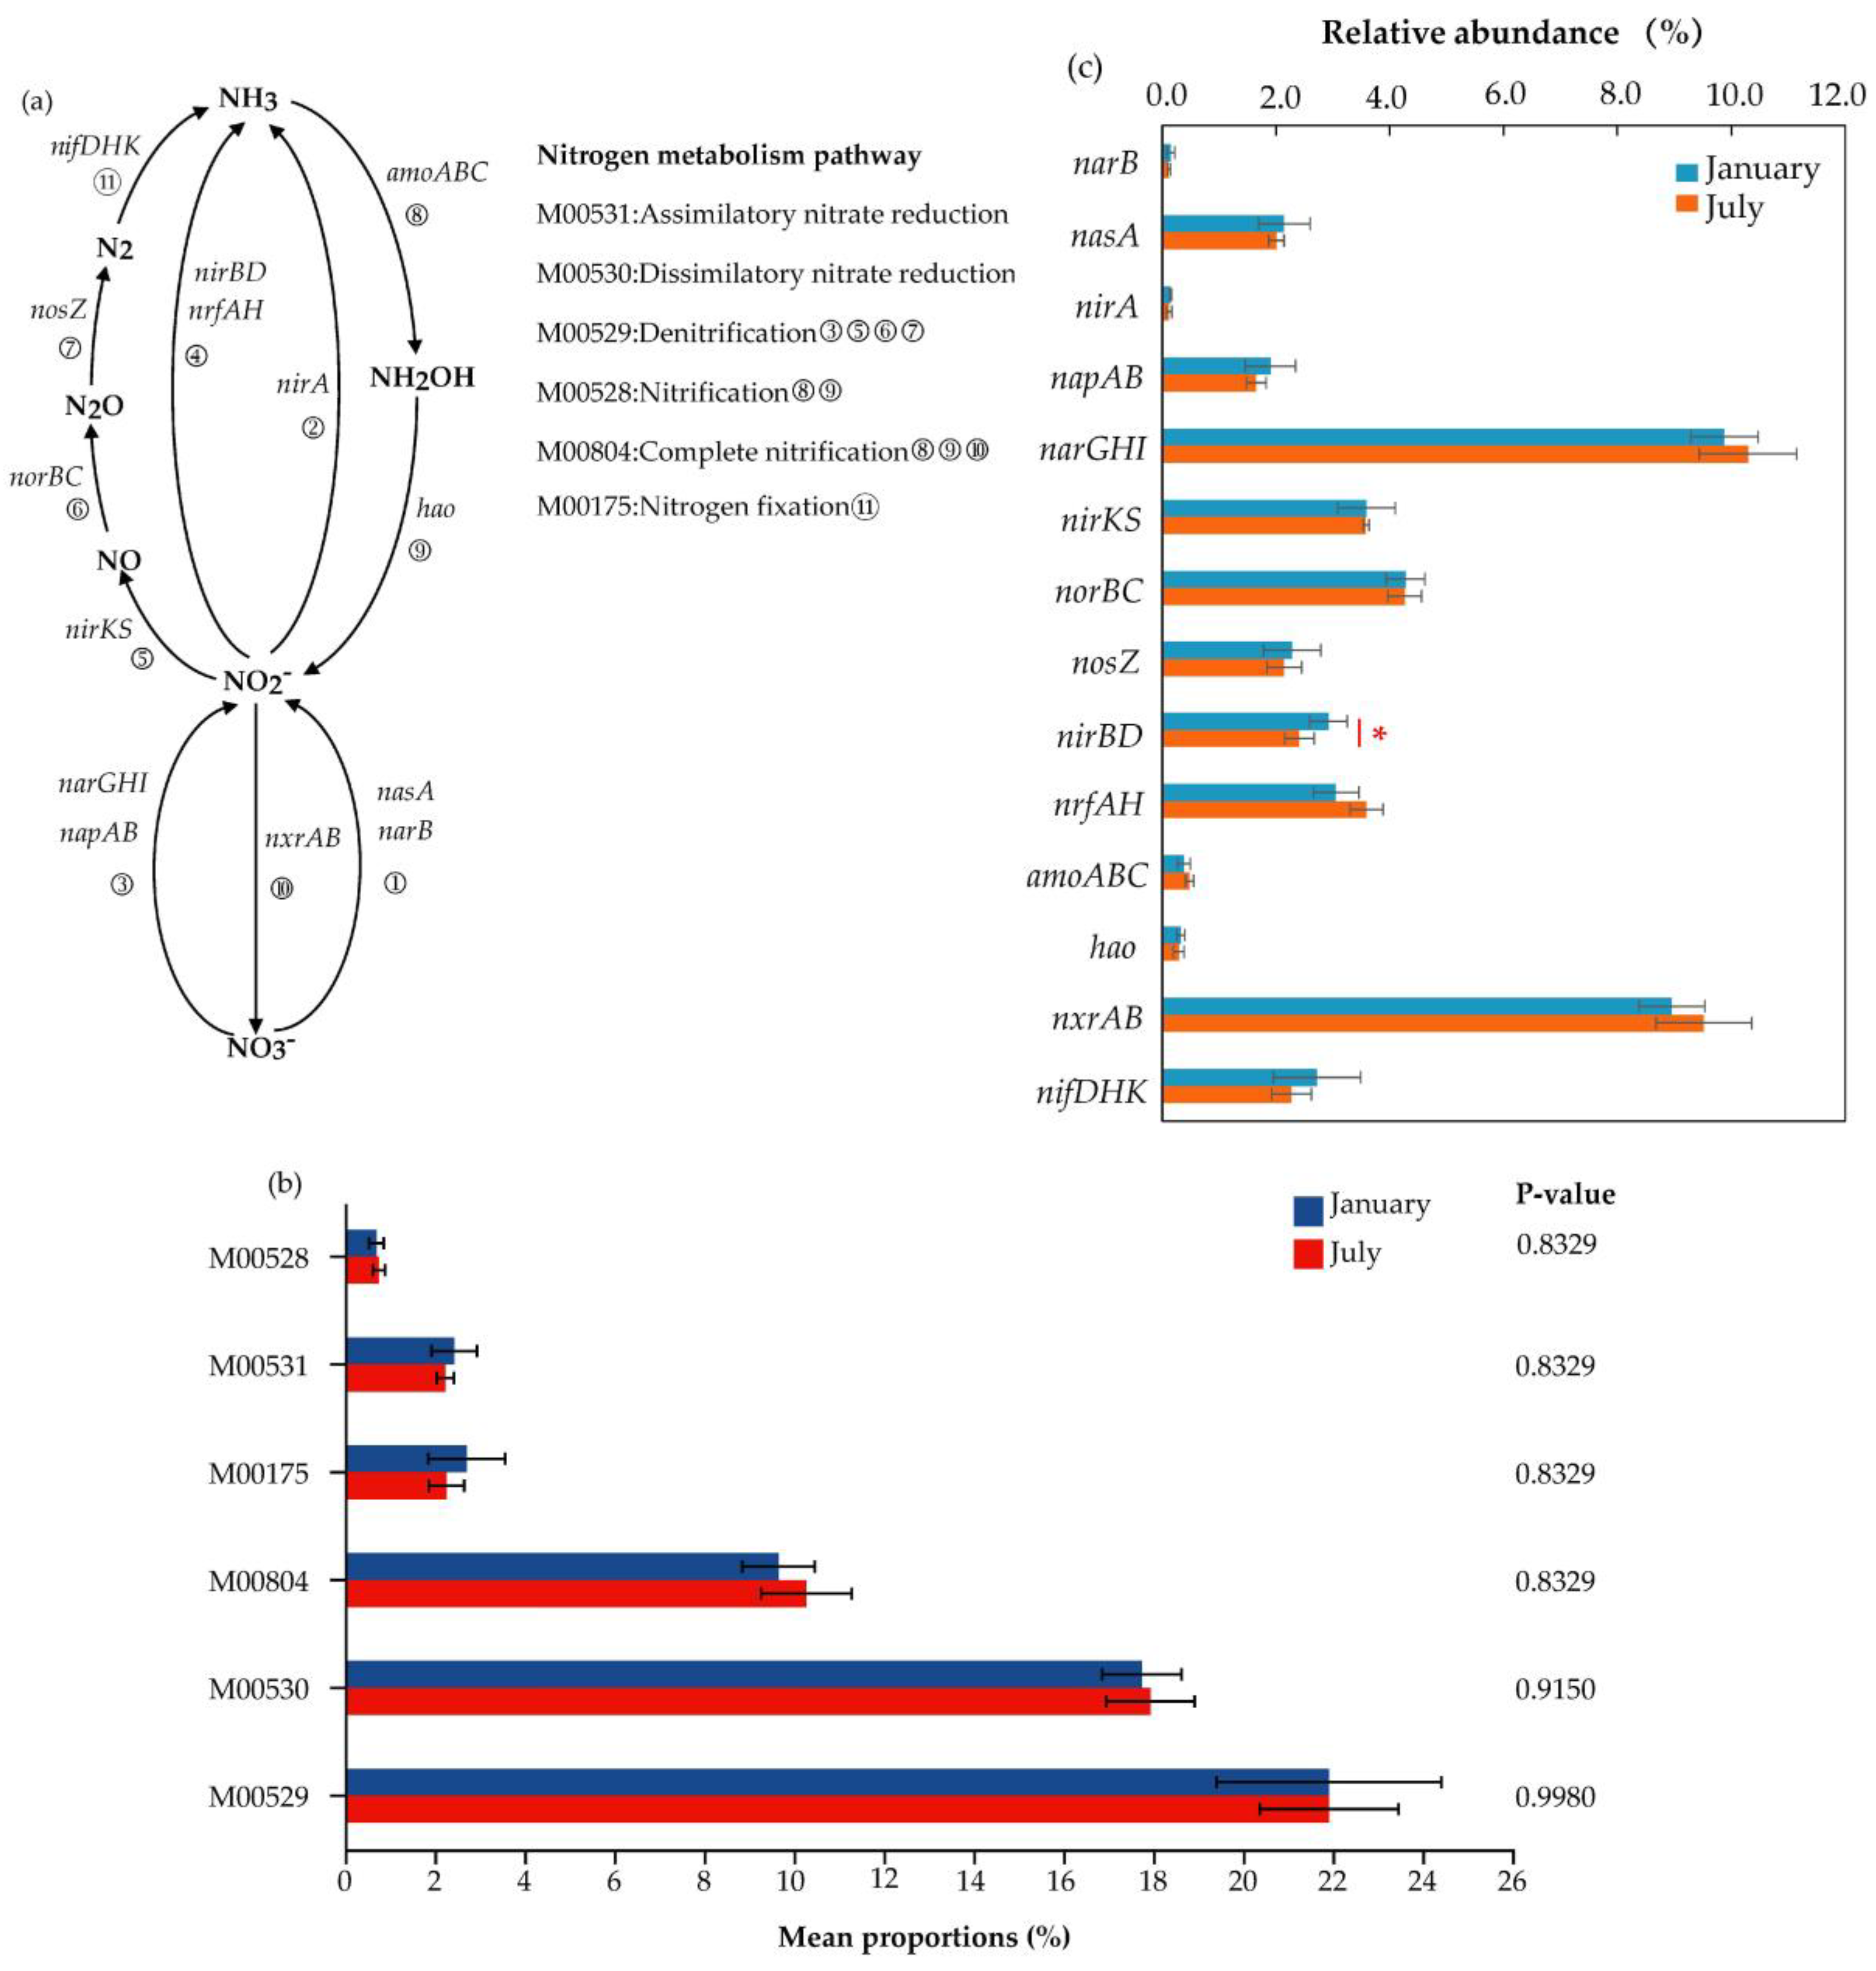
3.3. Nitrogen Metabolism Pathway and Functional Genes

We used the KEGG database to classify functional genes related to nitrogen metabolism annotated in the macrogene data in order to further explore the impact of temperature change on the microbial nitrogen removal pathway. A total of six nitrogen metabolism pathways were involved in the MSSFCW (Figure 7a): assimilatory nitrate reduction (M00531), dissimilatory nitrate reduction (M00530), denitrification (M00529), nitrification (M00528), complete nitrification (M00804), and nitrogen fixation (M00175). Differences in metabolic pathways between January and July were minor (p > 0.05) (Figure 7b). M00529 had the highest relative abundance (21.92 ± 1.86%), and M00528 had the lowest relative abundance (0.73 ± 0.14%). The functional genes mediating nitrogen metabolism were the same in January and July. Only the relative abundance of nirBD was significantly different (p < 0.05) (Figure 7c).
Importantly, the oxidation of ammonium salt to nitrite in M00804 is generally considered to be the initial step in nitrification, as well as the rate-limiting step [38,39]. The mean relative abundance sums for the corresponding functional genes amoABC and hao were 0.70% in January and 0.76% in July.
The reduction of nitrate to nitrite in M00529 is the first step in both denitrification and in the reduction of nitrate to ammonium salt [40]. The reduction of nitrate to nitrite in a wetland is completed via the two processes of dissimilation and assimilation, and the abundance of functional genes that mediate dissimilation (narGHI and napAB, the mean relative abundance sums of which were 11.78% in January and 11.94% in July) was much greater than the abundance of functional genes that mediate assimilation (narB and nasA, the mean relative abundance sums of which were 2.29% in January and 2.12% in July). Therefore, the reduction of nitrate to nitrite in the wetland was mainly completed during the dissimilation process.
In wetlands, nitrite reduction includes denitrification, dissimilatory reduction, and assimilatory reduction. Denitrification can gradually reduce nitrite to N2 under certain conditions. The mean relative abundance sums for the relevant functional genes (nirKS, norBC, and nosZ) were 10.14% in January and 9.98% in July. Dissimilation and assimilation can reduce nitrite to ammonium. The mean relative abundance sums for the functional genes encoding dissimilatory nitrite reductase (nirBD and nrfAH) were 5.97% in January and 6.00% in July, while those of functional genes encoding assimilatory nitrite reductase (nirA) were 0.15% in January and 0.12% in July. To summarize, this indicates that denitrification is the main pathway for reducing nitrite, while dissimilation is the main pathway for reducing nitrite to ammonium.
Furthermore, wetlands are capable of nitrogen fixation, and the mean relative abundances of the functional gene nifDHK involved in nitrogen fixation were 2.72% in January and 2.27% in July. These values were higher than the abundances of functional genes associated with nitrification (amoABC and hao), which consume ammonium.

4. Discussion

Using metagenomic sequencing, we examined the impact of temperature changes on nitrogen-associated microorganisms and nitrogen metabolism functional genes in an MSSFCW. Our analyses revealed that the removal efficiency for nitrogen in the wetlands was significantly influenced by changes in temperature. The TN removal efficiency was highest in July and August, when the water temperature was 26–28 °C. However, in October, when the water temperature dropped to 17 °C, the TN removal efficiency immediately decreased by 23.88%. This was higher than the influencing temperature of below 15 °C obtained by Akratos and Tsihrintzis [18]. When the water temperature dropped below 11 °C (January–March and November–December), the average TN removal efficiency was below 20%.
The removal of TN depends primarily on the ability of the wetland to remove NO3-N and NH4+-N as they are the main components in TN. The NO3-N removal efficiency was highest in July and August when the water temperature was 26–28 °C, and the removal efficiency decreased significantly when the water temperature fell to ≤17 °C. Once the water temperature dropped below 11 °C, the removal efficiency turned negative. Thus, NO3-N was particularly sensitive to temperature changes. This finding is largely consistent with the study by Chen et al. [14], who reported that nitrate accumulates at temperatures below 10 °C.
The influence of temperature on NH4+-N removal efficiency was also extremely significant. Compared with the June to October period (water temperature: 17–28 °C), NH4+-N removal efficiency decreased by approximately 14% in the low-temperature months of January to March, November, and December (water temperature: ≤ 11 °C). While this observation was in agreement with previous studies showing that low temperature suppresses NH4+-N removal, we found that the suppression was not as great as previously reported (a reduction by 40%) [9].
The ability of the wetland to remove COD was also affected by low temperature, and significantly lower removal efficiency was recorded when the water temperature was ≤ 11 °C. Compared with June to August (water temperature: 26–28 °C), removal efficiency decreased by approximately 27% in January and February when the water temperature dropped below 5 °C.
Microbial nitrogen metabolism is the primary method of removing nitrogen in wetlands. In the MSSFCW, we detected a total of 37 microbial phyla that were associated with nitrogen, along with a high alpha-diversity index and an abundant and diverse microbial community. Temperature change did not have a strong effect on microbial species as fewer species displayed significant variation—only a small proportion of the abundance of the microbial community—and there were no significant differences in the dominant microorganisms. This observation indicates that the change in wetland purification was not caused by a change in the composition of the microbial community. This finding differs from the results obtained by Mu et al. [41], who found that low temperature changes the dominant microbial phyla, leading to a fall in nutrient removal.
In the MSSFCW, NO3-N was mainly consumed in the M00529 and M00530 pathways. Compared with the production of NO3-N by the M00804 pathway, the abundance of functional genes that mediate the removal of NO3-N was much higher than the abundance of genes that mediate its input, indicating that the wetlands possessed substantial NO3-N removal potential. Furthermore, in the M00530 pathway, the proportion of the abundance of nirBD, which mediates nitrite nitrogen (NO2-N) reduction, was significantly higher in January (2.94%) than that in July (2.14%) (p < 0.05), slightly accelerating the conversion of NO3-N. Nevertheless, as the temperature fell, the NO3-N removal efficiency decreased significantly, causing it to accumulate. It has been previously reported that a suitable temperature range contributes to the metabolic activity of denitrification enzymes and dissimilatory nitrate reductase, while low temperatures inhibit their activity, reducing the metabolic rate and limiting water purification [14,42,43]. In the MSSFCW, the reduction in NO3-N removal was likely due to low temperatures inhibiting the activity of related enzymes, resulting in a decrease in the metabolic rate.
Nitrification is a process whereby microbial metabolism removes NH4+-N. Due to the low abundance of functional genes mediating NH4+-N oxidation (amoABC and hao), nitrification conversion of NH4+-N was limited, likely accounting for its low removal efficiency in the wetlands. Considering that low temperatures inhibit nitrification [44,45], NH4+-N removal efficiency further decreases with drops in temperature.
In the nitrogen metabolism in the wetlands, the M00531, M00530, and M00175 pathways produced ammonium. The corresponding functional genes were more abundant than M00528, which consumes NH4+-N; however, NH4+-N concentration in the effluent did not increase. This observation indicates that, in the wetland environment, ammonium assimilation by microbes and plants maintained a balance for NH4+-N.

5. Conclusions

Water purification in the MSSFCW was significantly affected by temperature change, with notably higher removal efficiencies for TN, NO3-N, NH4+-N, and COD in high-temperature months than in low-temperature ones. Temperature changes had little effect on the composition of microbial communities associated with nitrogen metabolism in the wetlands, with similar dominant phyla and genera for low temperatures in January as for high temperatures in July. Proteobacteria was the dominant phylum, and Thiobacillus was the dominant genus. Nitrogen metabolism in the wetland comprised six pathways: assimilatory nitrate reduction, dissimilatory nitrate reduction, denitrification, nitrification, complete nitrification, and nitrogen fixation. Functional genes that mediate denitrification were the most abundant and functional genes that mediate nitrification were the least abundant. There were no statistically significant differences in any of the nitrogen metabolism pathways between January and July.

Author Contributions

Conceptualization, H.W. and Y.X.; methodology, H.W. and Y.X.; formal analysis, H.W.; investigation, H.W. and Y.X.; data curation, H.W.; writing—original draft preparation, H.W.; writing—review and editing, B.C.; visualization, H.W.; supervision, Y.X. and B.C.; project administration, Y.X. and B.C.; funding acquisition, B.C. All authors have read and agreed to the published version of the manuscript.

Funding

This research was funded by the National Natural Science Foundation of China (nos 72091511 and 52070065), the Science Fund for Distinguished Young Scholars of Hebei Province (no. E2022402064), and the Natural Science Foundation of Hebei Province (no. E2020402074).

Data Availability Statement

The data are not publicly available due to the first author still undertaking Ph.D. research.

Conflicts of Interest

The authors declare no conflict of interest.

References

  1. Li, B.; Chen, J.; Wu, Z.; Wu, S.; Xie, S.; Liu, Y. Seasonal and spatial dynamics of denitrification rate and denitrifier community in constructed wetland treating polluted river water. Int. Biodeterior. Biodegrad. 2018, 126, 143–151. [Google Scholar] [CrossRef]
  2. Zhang, Y.; Ji, Z.; Pei, Y. Nutrient removal and microbial community structure in an artificial-natural coupled wetland system. Process Saf. Environ. Protect. 2021, 147, 1160–1170. [Google Scholar] [CrossRef]
  3. Huang, L.; Bao, J.; Zhao, F.; Liang, Y.; Chen, Y. New insight for purifying polluted river water using the combination of large-scale rotating biological contactors and integrated constructed wetlands in the cold season. J. Environ. Manag. 2022, 324, 116433. [Google Scholar] [CrossRef]
  4. Domangue, R.J.; Mortazavi, B. Nitrate reduction pathways in the presence of excess nitrogen in a shallow eutrophic estuary. Environ. Pollut. 2018, 238, 599–606. [Google Scholar] [CrossRef] [PubMed]
  5. Wang, T.; Xiao, L.; Lu, H.; Lu, S.; Li, J.; Guo, X.; Zhao, X. Nitrogen removal from summer to winter in a field pilot-scale multistage constructed wetland-pond system. J. Environ. Sci. 2022, 111, 249–262. [Google Scholar] [CrossRef] [PubMed]
  6. Kivaisi, A.K. The potential for constructed wetlands for wastewater treatment and reuse in developing countries: A review. Ecol. Eng. 2001, 16, 545–560. [Google Scholar] [CrossRef]
  7. Kennedy, G.; Mayer, T. Natural and constructed wetlands in canada; An overview. Water Qual. Res. J. 2002, 37, 295–325. [Google Scholar] [CrossRef]
  8. Thorslund, J.; Jarsjo, J.; Jaramillo, F.; Jawitz, J.W.; Manzoni, S.; Basu, N.B.; Chalov, S.R.; Cohen, M.J.; Creed, I.F.; Goldenberg, R.; et al. Wetlands as large-scale nature-based solutions: Status and challenges for research, engineering and management. Ecol. Eng. 2017, 108, 489–497. [Google Scholar] [CrossRef]
  9. Wang, W.; Gao, J.; Guo, X.; Li, W.; Tian, X.; Zhang, R. Long-term effects and performance of two-stage baffled surface flow constructed wetland treating polluted river. Ecol. Eng. 2012, 49, 93–103. [Google Scholar] [CrossRef]
  10. Sanchez, O. Constructed wetlands revisited: Microbial diversity in the -omics era. Microb. Ecol. 2017, 73, 722–733. [Google Scholar] [CrossRef]
  11. Yang, A.; Zhang, G.; Meng, F.; Zhi, R.; Zhang, P.; Zhu, Y. Nitrogen metabolism in photosynthetic bacteria wastewater treatment: A novel nitrogen transformation pathway. Bioresour. Technol. 2019, 294, 122162. [Google Scholar] [CrossRef] [PubMed]
  12. Li, X.; Li, Y.; Lv, D.; Li, Y.; Wu, J. Nitrogen and phosphorus removal performance and bacterial communities in a multi-stage surface flow constructed wetland treating rural domestic sewage. Sci. Total Environ. 2020, 709, 136235. [Google Scholar] [CrossRef]
  13. Liu, Y.; Gong, L.; Mu, X.; Zhang, Z.; Zhou, T.; Zhang, S. Characterization and co-occurrence of microbial community in epiphytic biofilms and surface sediments of wetlands with submersed macrophytes. Sci. Total Environ. 2020, 715, 136950. [Google Scholar] [CrossRef] [PubMed]
  14. Chen, X.; Luo, P.; Liu, F.; Zhang, S.; Li, H.; Xiao, R.; Wu, J. Cold temperature increases nitrate accumulation in pilot-scale surface flow constructed wetlands with high rates of nitrogen removal. Agric. Ecosyst. Environ. 2021, 308, 107250. [Google Scholar] [CrossRef]
  15. Truu, M.; Juhanson, J.; Truu, J. Microbial biomass, activity and community composition in constructed wetlands. Sci. Total Environ. 2009, 407, 3958–3971. [Google Scholar] [CrossRef] [PubMed]
  16. Wang, M.; Zhang, D.Q.; Dong, J.W.; Tan, S.K. Constructed wetlands for wastewater treatment in cold climate—A review. J. Environ. Sci. 2017, 57, 293–311. [Google Scholar] [CrossRef]
  17. Liu, W.; Chu, Y.; Tan, Q.; Chen, J.; Yang, L.; Ma, L.; Zhang, Y.; Wu, Z.; He, F. Cold temperature mediated nitrate removal pathways in electrolysis-assisted constructed wetland systems under different influent c/n ratios and anode materials. Chemosphere 2022, 295, 133867. [Google Scholar] [CrossRef]
  18. Akratos, C.S.; Tsihrintzis, V.A. Effect of temperature, hrt, vegetation and porous media on removal efficiency of pilot-scale horizontal subsurface flow constructed wetlands. Ecol. Eng. 2007, 29, 173–191. [Google Scholar] [CrossRef]
  19. Van de Moortel, A.M.K.; Meers, E.; De Pauw, N.; Tack, F.M.G. Effects of vegetation, season and temperature on the removal of pollutants in experimental floating treatment wetlands. Water Air Soil Pollut. 2010, 212, 281–297. [Google Scholar] [CrossRef] [Green Version]
  20. Ministry Of Environmental Protection of China. National Environmental Protection Standards of the People’s Republic of China (hj 636-2012): Water Quality -Determination of Alkaline Potassium Persulfate Digestion uv Spectrophotometric Method; China Environmental Science Press: Beijing, China, 2012. [Google Scholar]
  21. Ministry Of Environmental Protection of China. National Environmental Protection Standards of the People’s Republic of China (hj 828-2017): Water Quality -Determination of the Chemical Oxygen Demand-Dichromate Method; China Environmental Science Press: Beijing, China, 2017. [Google Scholar]
  22. Martin, M. Cutadapt removes adapter sequences from high-throughput sequencing reads. EMBnet J. 2011, 17, 10–12. [Google Scholar] [CrossRef]
  23. Chen, S.; Zhou, Y.; Chen, Y.; Gu, J. Fastp: An ultra-fast all-in-one fastq preprocessor. Bioinformatics 2018, 34, i884–i890. [Google Scholar] [CrossRef] [PubMed]
  24. Menzel, P.; Ng, K.L.; Krogh, A. Fast and sensitive taxonomic classification for metagenomics with kaiju. Nat. Commun. 2016, 7, 11257. [Google Scholar] [CrossRef] [PubMed] [Green Version]
  25. Li, D.; Liu, C.M.; Luo, R.; Sadakane, K.; Lam, T.W. Megahit: An ultra-fast single-node solution for large and complex metagenomics assembly via succinct de bruijn graph. Bioinformatics 2015, 31, 1674–1676. [Google Scholar] [CrossRef] [Green Version]
  26. Steinegger, M.; Söding, J. Mmseqs2 enables sensitive protein sequence searching for the analysis of massive data sets. Nat. Biotechnol. 2017, 35, 1026–1028. [Google Scholar] [CrossRef] [Green Version]
  27. Zhu, W.; Lomsadze, A.; Borodovsky, M. Ab initio gene identification in metagenomic sequences. Nucleic Acids Res. 2010, 38, e132. [Google Scholar] [CrossRef] [PubMed] [Green Version]
  28. Bu, D.; Luo, H.; Huo, P.; Wang, Z.; Zhang, S.; He, Z.; Wu, Y.; Zhao, L.; Liu, J.; Guo, J.; et al. Kobas-i: Intelligent prioritization and exploratory visualization of biological functions for gene enrichment analysis. Nucleic Acids Res. 2021, 49, W317–W325. [Google Scholar] [CrossRef] [PubMed]
  29. Patro, R.; Duggal, G.; Love, M.I.; Irizarry, R.A.; Kingsford, C. Salmon provides fast and bias-aware quantification of transcript expression. Nat. Methods 2017, 14, 417–419. [Google Scholar] [CrossRef] [PubMed] [Green Version]
  30. Ye, Y.; Doak, T.G. A parsimony approach to biological pathway reconstruction/inference for genomes and metagenomes. PLoS Comput. Biol. 2009, 5, e1000465. [Google Scholar] [CrossRef] [Green Version]
  31. Ansola, G.; Arroyo, P.; Sáenz De Miera, L.E. Characterisation of the soil bacterial community structure and composition of natural and constructed wetlands. Sci. Total Environ. 2014, 473–474, 63–71. [Google Scholar] [CrossRef]
  32. Zhang, Q.; Huang, J.; Dzakpasu, M.; Gao, Z.; Zhou, W.; Zhu, R.; Xiong, J. Assessment of plants radial oxygen loss for nutrients and organic matter removal in full-scale constructed wetlands treating municipal effluents. Bioresour. Technol. 2022, 360, 127545. [Google Scholar] [CrossRef]
  33. Santos, A.; Rachid, C.; Pacheco, A.B.; Magalhães, V. Biotic and abiotic factors affect microcystin-lr concentrations in water/sediment interface. Microbiol. Res. 2020, 236, 126452. [Google Scholar] [CrossRef] [PubMed]
  34. Vipindas, P.V.; Mujeeb, R.K.M.; Jabir, T.; Thasneem, T.R.; Mohamed Hatha, A.A. Diversity of sediment bacterial communities in the south eastern arabian sea. Reg. Stud. Mar. Sci. 2020, 35, 101153. [Google Scholar] [CrossRef]
  35. Kielak, A.M.; Barreto, C.C.; Kowalchuk, G.A.; van Veen, J.A.; Kuramae, E.E. The ecology of acidobacteria: Moving beyond genes and genomes. Front. Microbiol. 2016, 7, 744. [Google Scholar] [CrossRef] [Green Version]
  36. Fan, X.; Li, J.; He, L.; Wang, Y.; Zhou, J.; Zhou, J.; Liu, C. Co-occurrence of autotrophic and heterotrophic denitrification in electrolysis assisted constructed wetland packing with coconut fiber as solid carbon source. Chemosphere 2022, 301, 134762. [Google Scholar] [CrossRef] [PubMed]
  37. Huang, X.; Duan, C.; Yu, J.; Dong, W. Transforming heterotrophic to autotrophic denitrification process: Insights into microbial community, interspecific interaction and nitrogen metabolism. Bioresour. Technol. 2022, 345, 126471. [Google Scholar] [CrossRef] [PubMed]
  38. Guan, Y.; Hou, T.; Li, X.; Feng, L.; Wang, Z. Metagenomic insights into comparative study of nitrogen metabolic potential and microbial community between primitive and urban river sediments. Environ. Res. 2022, 212, 113592. [Google Scholar] [CrossRef] [PubMed]
  39. Wang, H.; Yang, C.; Wang, B.; He, Z.; Fu, T. Nitrogen removal performance and microbiological characteristics for the landfill leachate treatment in a three-stage vertical flow constructed wetlands system. Environ. Technol. Innov. 2022, 28, 102728. [Google Scholar] [CrossRef]
  40. Kuypers, M.M.M.; Marchant, H.K.; Kartal, B. The microbial nitrogen-cycling network. Nat. Rev. Microbiol. 2018, 16, 263–276. [Google Scholar] [CrossRef]
  41. Mu, X.; Zhang, S.; Lv, X.; Ma, Y.; Zhang, Z.; Han, B. Water flow and temperature drove epiphytic microbial community shift: Insight into nutrient removal in constructed wetlands from microbial assemblage and co-occurrence patterns. Bioresour. Technol. 2021, 332, 125134. [Google Scholar] [CrossRef]
  42. Smith, C.J.; Dong, L.F.; Wilson, J.; Stott, A.; Osborn, A.M.; Nedwell, D.B. Seasonal variation in denitrification and dissimilatory nitrate reduction to ammonia process rates and corresponding key functional genes along an estuarine nitrate gradient. Front. Microbiol. 2015, 6, 542. [Google Scholar] [CrossRef]
  43. Ji, M.; Hu, Z.; Hou, C.; Liu, H.; Ngo, H.H.; Guo, W.; Lu, S.; Zhang, J. New insights for enhancing the performance of constructed wetlands at low temperatures. Bioresour. Technol. 2020, 301, 122722. [Google Scholar] [CrossRef] [PubMed]
  44. Wang, F.; Liu, Y.; Ma, Y.; Wu, X.; Yang, H. Characterization of nitrification and microbial community in a shallow moss constructed wetland at cold temperatures. Ecol. Eng. 2012, 42, 124–129. [Google Scholar] [CrossRef]
  45. Pang, Q.; Xu, W.; He, F.; Peng, F.; Zhu, X.; Xu, B.; Yu, J.; Jiang, Z.; Wang, L. Functional genera for efficient nitrogen removal under low c/n ratio influent at low temperatures in a two-stage tidal flow constructed wetland. Sci. Total Environ. 2022, 804, 150142. [Google Scholar] [CrossRef] [PubMed]
Figure 1. Basic information on the multi-stage surface flow constructed wetland.
Water 15 01256 g001
Figure 2. Data for the multi-stage surface flow constructed wetland: (a) temperature, (b) removal efficiencies (REs) for pollutants (TN, NO3-N, NH4+-N, and COD), and (cf) influent and effluent concentrations (TN and NO3-N and NH4+-N and COD) and mass removal rates (MRRs) from March 2019 to February 2020.
Water 15 01256 g002
Figure 3. Histogram of nitrogen-associated microbial community composition and relative abundance at the phylum level.
Water 15 01256 g003
Figure 4. Chord diagram of nitrogen-associated microbial community composition at the genus level.
Water 15 01256 g004
Figure 5. Boxplots of differences in α-diversity indexes for nitrogen-associated microbial communities. * Indicates a significant difference between groups (p < 0.05). ** Indicates a larger significant difference between groups (p < 0.01).
Water 15 01256 g005
Figure 6. (a) LDA distribution map for different species (colors represent groups, and the lengths of the bars represent the contributions of different species). (b) Evolutionary branch diagram for different species (circles represent the taxonomic level, from phylum (inner) to species (outer); node size corresponds to species average relative abundance; hollow nodes represent species with no significant differences between groups; significantly different species are colored by group; letters represent the names of significantly different species, which are displayed in the legend).
Water 15 01256 g006
Figure 7. MSSFCW microbial nitrogen metabolism pathway and related functional genes: (a) KEGG pathway for nitrogen metabolism; (b) nitrogen metabolism pathway statistical test; (c) functional gene relative abundance histogram. * Indicates a significant difference between groups (p < 0.05).
Water 15 01256 g007
Table 1. Water purification efficiency of the MSSFCW system and statistical tests at different temperatures.
IndexWater Temperaturep Value
HighMediumLow
Removal efficiency (%)TN63.05 ± 4.2736.31 ± 6.7916.42 ± 3.860.000128 ***
NO3-N67.53 ± 8.0028.03 ± 13.34−17.63 ± 5.730.000128 ***
NH4+-N81.19 ± 2.4677.87 ± 4.0067.92 ± 1.800.000516 ***
COD49.25 ± 3.3145.50 ± 4.1027.45 ± 3.740.000239 ***
Mass removal rate (mg m−2 d−1)TN1016.79 ± 115.25542.94 ± 58.09267.26 ± 54.930.000127 ***
NO3-N661.06 ± 115.63244.20 ± 99.25−151.86 ± 51.130.000128 ***
NH4+-N391.68 ± 58.10392.40 ± 72.83420.87 ± 40.190.508553
COD5835.84 ± 795.805760 ± 293.943573.33 ± 511.560.000393 ***
Note: *** Indicates a highly significant difference between groups (p < 0.001).
Disclaimer/Publisher’s Note: The statements, opinions and data contained in all publications are solely those of the individual author(s) and contributor(s) and not of MDPI and/or the editor(s). MDPI and/or the editor(s) disclaim responsibility for any injury to people or property resulting from any ideas, methods, instructions or products referred to in the content.

