Article

Sedimentary Records of Phytoplankton Communities in Sanmen Bay in China: The Impacts of ENSO Events over the Past Two Centuries

1
Key Laboratory of Marine Ecosystem Dynamics and Second Institute of Oceanography, Ministry of Natural Resources, Key Laboratory of Nearshore Engineering Environment and Ecological Security of Zhejiang Province, Hangzhou 310012, China
2
Fujian Provincial Key Laboratory of Coastal Ecology and Environmental Studies, College of the Environment and Ecology, Xiamen University, Xiamen 361102, China
3
Southern Marine Science and Engineering Guangdong Laboratory (Zhuhai), Zhuhai 519000, China
*
Authors to whom correspondence should be addressed.
These authors contributed equally to this work.
Water 2023, 15(7), 1255; https://doi.org/10.3390/w15071255
Submission received: 27 February 2023 / Revised: 16 March 2023 / Accepted: 21 March 2023 / Published: 23 March 2023
(This article belongs to the Special Issue The Relationship between Phytoplankton Ecology and Marine Pollution)

Abstract

:
Phytoplankton communities, showing significant spatiotemporal variation within bay areas, play an important role in the structure and function of nearshore marine ecosystems. However, the absence of long-term high-resolution datasets has hindered our understanding of the effect of ENSO-driven environmental changes on phytoplankton communities in coastal ecosystems. Herein, by performing biomarker inversion analyses on two centuries’ worth of sedimentary organisms in the Sanmen Bay area, we observed a marked El Niño/La Niña-related succession; specifically, that El Niño-induced warming had increased the biomass of phytoplankton by 57.89%, while also increasing the proportion of diatoms by 76.40%. In contrast, La Niña years exhibited a decrease in the biomass of phytoplankton by 54.23%. Further, over three decades of observational data from the Sanmen Bay suggest that La Niña years can promote occasional blooms through monsoonal mixing and land-based inputs. Consequently, the nearshore marine ecosystem of the bay area, being subject to intense anthropogenic activity and land–sea interactions, can be said to be influenced by global-scale ocean–atmosphere processes. Going forward, the connection between short-term extreme events and long-term changes in the nearshore marine ecosystem should receive greater attention.

1. Introduction

El Niño–Southern Oscillation (ENSO) is a prominent global-scale climate anomaly which occurs on an interannual basis, comprising a so-called ‘El Niño’ phase, which refers to a widespread anomalous warming of sea surface temperatures (SST) in the equatorial Central/East Pacific, and a ‘La Niña’ phase, referring to the opposite [1,2,3]. Phytoplankton are the primary constituent of marine ecosystems and have a diverse and complex community structure, which makes them sensitive to changes in environmental factors such as temperature, light, and nutrients [4,5]. Previous studies have shown that the changes in environmental factors that ENSO-driven events have upon the marine environment can affect the phytoplankton’s biomass, productivity, and community structure; this, in turn, impacts the structure and function of the entire ecosystem. Understanding those changes in the structure and function of the phytoplankton community caused by these interannual variations in natural variability is crucial for identifying which long-term changes are caused by human activities such as global warming.
During non-ENSO years, the south-east Pacific trade winds generate an upwelling bringing with it the cooler, nutrient-rich waters that can support phytoplankton growth. In contrast, El Niño events result in a weaker upwelling, increasing stratification and nutrient restriction in the eastern Pacific; this leads to a decline in phytoplankton biomass [6,7,8]. However, the extent of ENSO warm and cold events varies from region to region, and the degree of impact on the regional environment varies. Together with the already significantly different biological community characteristics, this has led to great uncertainty over the impact of ENSO events on phytoplankton communities [8,9]. Importantly, our understanding of how ENSO events regulate phytoplankton communities is still limited, due to the lack of long-term observations.
Sediment provides an excellent tool for revealing the long-term record of natural and anthropogenic influence on changes in phytoplankton sources. Lipid biomarkers are useful indicators for studying the evolution of plankton in nearshore ecosystems, due to their good stability and source characteristics [10,11,12]. The content of various phytoplankton biomarkers, such as brassicasterol, dinosterol, and C37 alkenones, indicate the biomass of diatoms, dinoflagellates, and coccolithophores; they can also be used to reconstruct the primary productivity of phytoplankton (SUM = brassicasterol + dinosterol + C37 alkenones). Likewise, the ratios between these biomarkers can indicate changes in the phytoplankton community structure [13,14]. Cholesterol is mainly derived from various marine zooplankton [15] and can be used similarly to reconstruct changes in zooplankton biomass. Although there are still uncertainties regarding absolute quantification [16], this biomarker-based relative abundance determination method provides a good way to reconstruct the long-term sequence results of the structure of key plankton taxa.
The East China Sea (ECS) is significantly impacted by ENSO, resulting in changes to community structure and to the productivity of phytoplankton lipid biomarkers [17,18]. Recent studies have shown that human activities and upwelling processes have transformed the dominant marine phytoplankton species in the sediment near the mouth of the Yangtze River in the ECS from temperate–subtropical/eurythermal to subtropical–tropical/eurythermal [19]. The overall biomass of marine phytoplankton is on the rise [20,21,22], but frequent harmful algal blooms (HABs) of diatoms and dinoflagellates have been observed in the area in recent decades, ascribed to both warming and terrestrial source input [23]. ENSO events could further impact the phytoplankton community structure by promoting nearshore phytoplankton blooms through the regulation of terrestrial inputs, or by exacerbating warm water intrusion [24,25,26]. However, the impact of ENSO-driven environmental changes on the nearshore phytoplankton ecosystem in the ECS is still unknown, due to the lack of long-term field survey data.
To address this knowledge gap, we conducted a study on Sanmen Bay; a silty, low-disturbance, semi-enclosed nearshore bay on the southerly side of the Yangtze River estuary in the ECS, representative of many offshore bays in the coastal regions of eastern Asia [27]. We selected Sanmen Bay for sediment sampling and used simultaneous analysis of the seawater phytoplankton’s biomass, community composition, in addition to the sediment biomarker concentrations of major phytoplankton taxa; in this way, we reconstructed the phytoplankton community succession and biomass changes in the bay over the last 200 years. Our study primarily focused on the long-term ecological response and mechanism of phytoplankton to climate anomalies caused by ENSO events in Sanmen Bay, addressing key scientific questions such as the effect of ENSO events on phytoplankton productivity and community diversity, and the impact of ENSO on blooms. By elucidating the phytoplankton’s response to temperature in the Gulf region, which is closely associated with human activities, our study can provide a basis for future predictions of phytoplankton changes on a global scale in the face of increasingly frequent global climate anomalies.

2. Materials and Methods
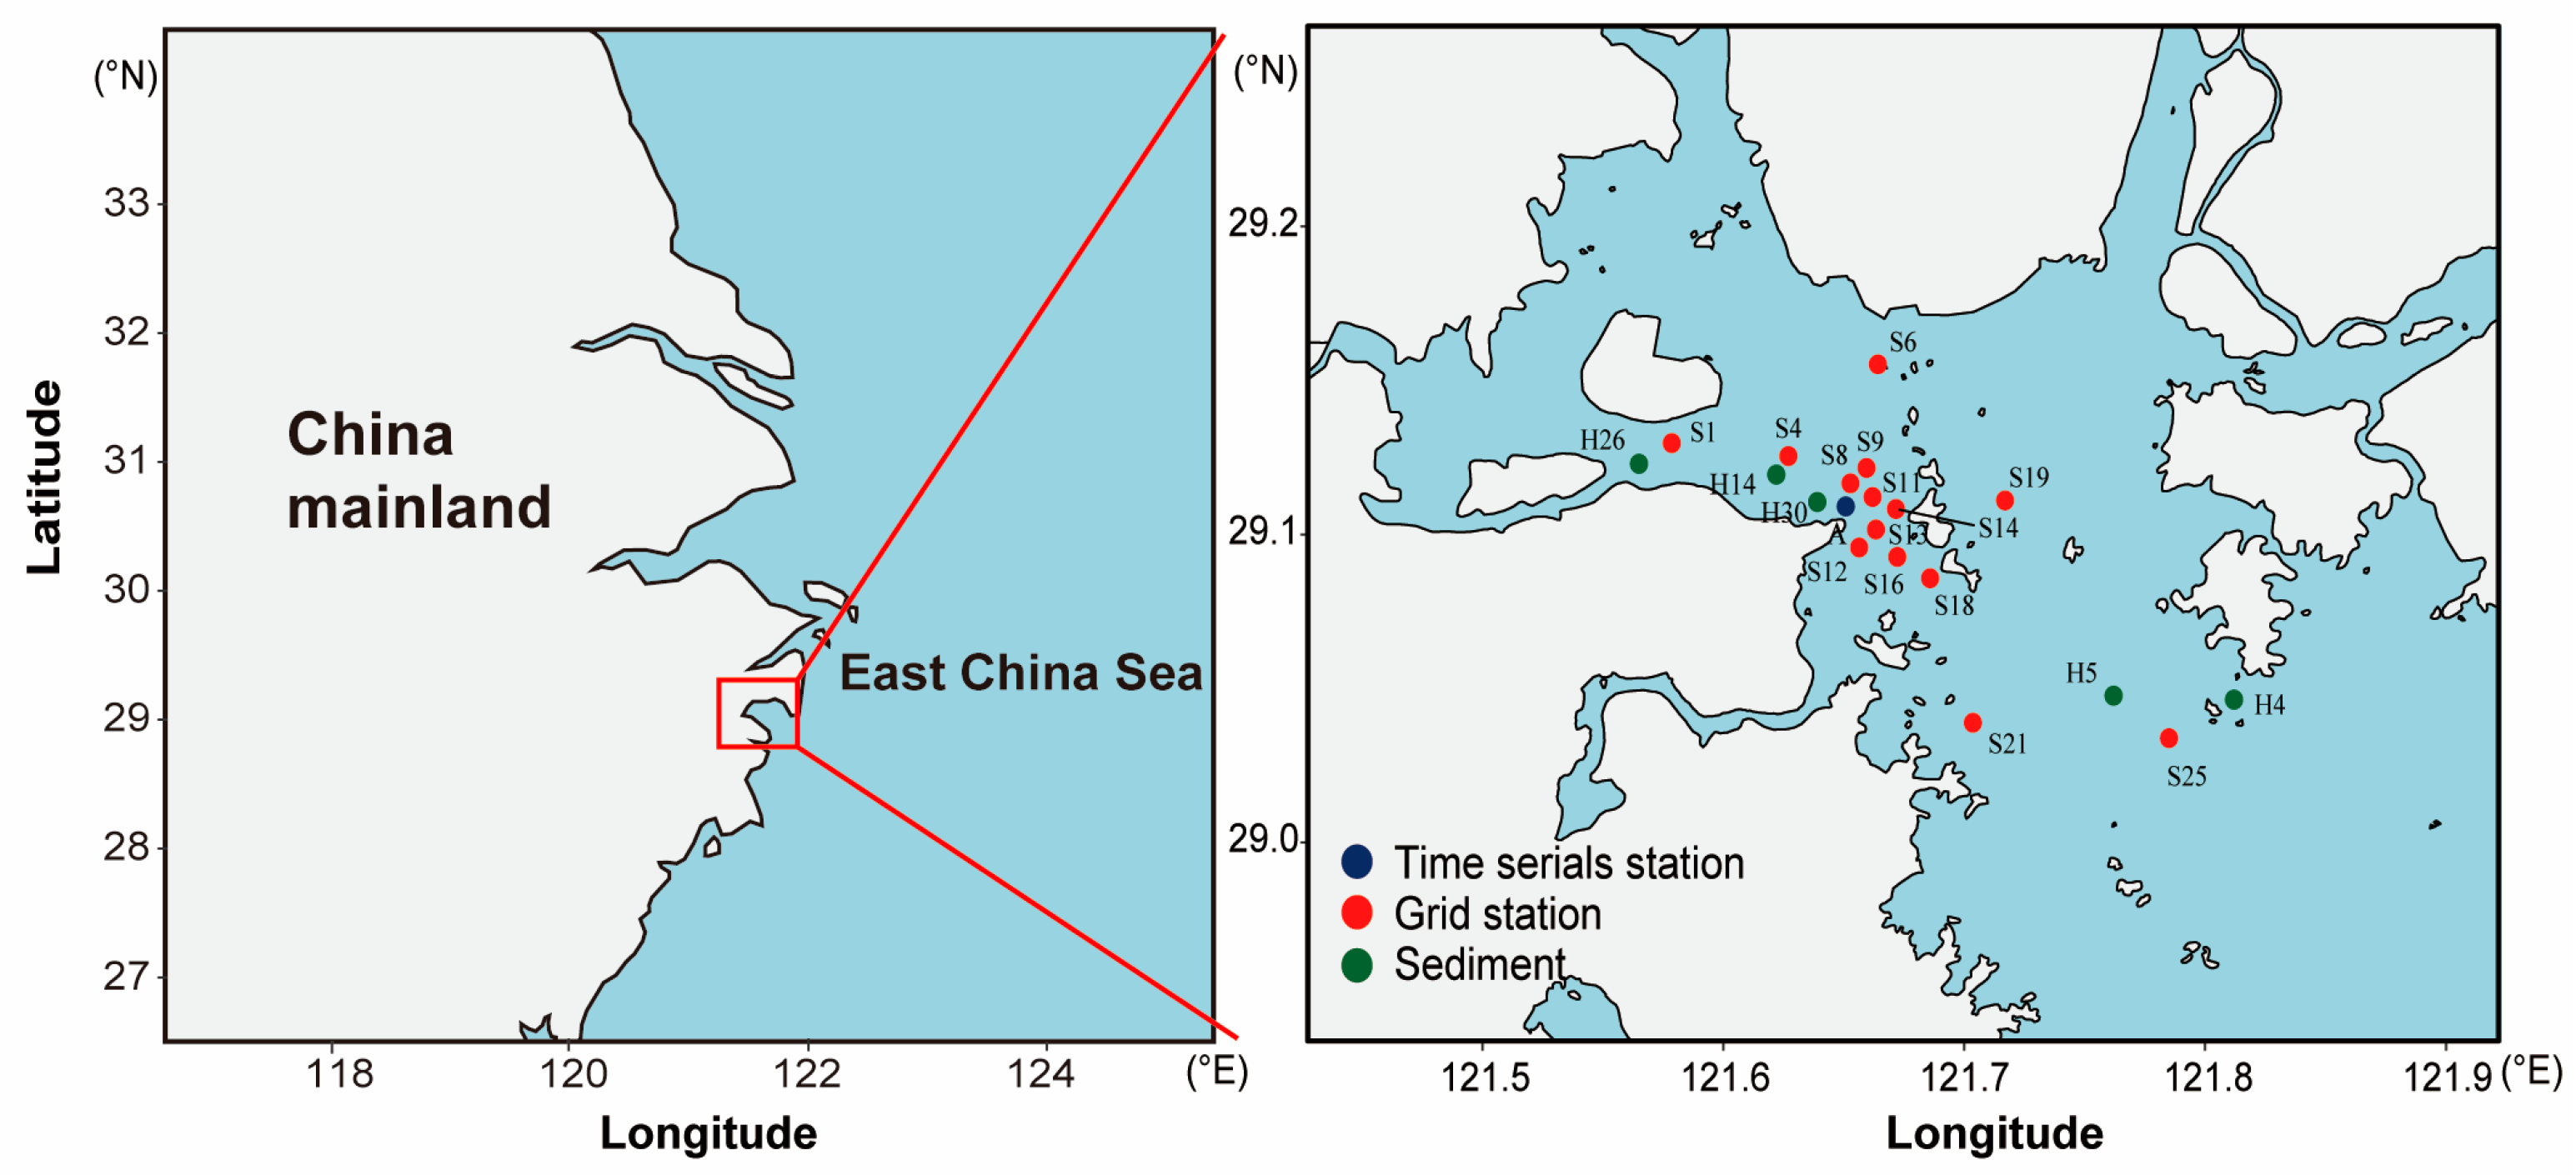
2.1. Study Area

Sanmen Bay, located in the center of the eastern coast of China, covers an area of approximately 775 km2. Sanmen Bay is situated in the temperate monsoon zone, boasting an average surface water temperature of 18.3 °C year-round. However, there are discernible fluctuations in water temperature throughout the seasons, with an average water temperature of 8.2 °C in February and 29.6 °C in August. The water depth in Sanmen Bay is relatively shallow, ranging from 3.8 to 31 m, and the water column stratification in the bay can be ignored due to strong physical mixing. Sanmen Bay is influenced by both the southward discharge of the Yangtze River and the invasion of the Taiwan warm current.

2.2. Phytoplankton Sample Collection

In 2016 and 2017, extensive surface observations were conducted at 14 Grid stations within Sanmen Bay, covering four seasons including summer, winter, spring, and autumn (Table 1). Additionally, continuous observations were conducted every three hours at station A (Figure 1). Samples were collected using a 0.1 m2 small plankton net, fitted with a 77 μm mesh, and trawled vertically (0.5 m/s) from the bottom to the surface. Filtered water was recorded using a flowmeter (HYDRO-BIOS, Kiel, Germany). The collected samples were promptly preserved in a neutral formaldehyde solution and stored in the dark before being transported to the laboratory for microscopic analysis, observation, identification, and cell counting. The analysis was performed using a universal light microscope (Olympus, Tokyo, Japan), wherein 25 mL phytoplankton subsamples were deposited in Hydro-bios Utermöhl counter frames for several hours, and then species identification and counting were performed with an AO inverted microscope at 200-or 400-times magnification.
Previously published comparative data from the same sea area were collected during four surveys across different seasons for the years spanning 2005–2006 [28]; the observational stations and time for these surveys were the basis for those used in the 2016–2017 surveys of this study, with our locations and research times set up to match them (Table 1). In addition, we compiled a measured dataset of phytoplankton for the period spanning 1982–2015 using 8 years of historical records in the study area (Table 2).
Our study employed the use of plankton net sampling rather than bottle sampling. This was primarily because the comparison of historical data needs to use a unified method. On the other hand, the sources of biomarkers in sedimentary deposits were predominantly large-sized phytoplankton. Additionally, we sought to avoid the patchy distribution of nearshore phytoplankton by collecting sufficient samples over a larger spatial scale to identify the dominant species composition.

2.3. Sediment and Core Sample Collection

Between 1995 and 2015, surface sediment and sediment core samples were collected five times within Sanmen Bay. In April 1995, approximately 160 cm of H30 sediment core samples were obtained using a gravity piston sampler during the Sanmen Bay nuclear power environmental survey. Surface sediment samples were collected from station H26 in November 1997, station H14 in November 2002, station H5 in January 2006, and station H4 in August 2015 (Figure 1). All samples were stored at −20 °C until laboratory analysis.

2.4. Pretreatment and Analysis of Sediment Samples

Five grams of freeze-dried sediment sample were extracted using an accelerated solvent extractor (ASE-350) (Thermo Fisher, MA, USA), with deuterated nC24D50 and C19 alcohol (19-OH) as internal standards. The extraction was carried out using dichloromethane and methanol (v/v = 9:1) for 10 min, then raised to a temperature of 100 °C for 5 min; this process was repeated three times to obtain the organic matter. The extract was then air-dried with N2, after which a 6% KOH–methanol solution added to it prior to undergoing ultrasonication, before finally being placed in a desiccator for 12 h. The hydrolysate was then removed, and hexane was added to facilitate centrifugation and re-extraction; a step that was repeated four times. The non-polar fraction was obtained using n-hexane elution, and the polar fraction was obtained using dichloromethane/methanol (v/v = 1:1) elution. Sterols and ketenes were separated using hexane/isopropanol (v/v = 95:5) solution and analyzed using gas chromatography (GC) (Agilent 6890N) (Agilent, California, USA) with a column of HP-1Methy1Siloxane (50 m × 0.32 mm × 0.17 μm) and a flame ionization detector (FID). The injection temperature was 310 °C, and FID detector temperature was 320 °C. N2 was employed as carrier gas, with a flow velocity of 1.2 mL/min. The temperature procedure had an initial temperature of 80 °C, which was held for 1 min, before being ramped up to 200 °C at a rate of 25 °C/min, then to 250 °C at a rate of 3 °C/min, then to 300 °C at a rate of 1.8 °C/min, which was held for 8 min, and finally to 310 °C at a rate of 5 °C/min, which was held for 5 min.
The biomarkers of the polar components were determined using the characteristic ion peaks and retention times of GC and LC–MS under the same conditions, and the content of each target compound was determined using the internal standard method for quantitative analysis, with 19-OH as the internal standard.

2.5. Sediment Chronology

The dating was performed using the 210Pb method, and the deposition rate was calculated using the following equation:
S = λ1 × Z/ln(Co/Cz),
where: S is the deposition rate (cm/a); λ1 is the 210Pb radioactive decay constant of 0.03114/a; Z is the depth (cm); Co and Cz are the surface and depth Z layers, respectively; and the deposition rate is 1.0 cm/a for most of the layers.
In this study, we employed the 210Pb method for dating purposes. Specifically, the H30 core sample’s 210Pb residual specific activity collected in 1995 provided a time frame spanning from 1822 to 1995. Additionally, four surface sediment samples (stations H26, H14, H5, and H4) were collected in 1997, 2002, 2005, and 2015, respectively, and dated based on the respective collection year, thereby extending the temporal scope of this study to 2015 (Table 3).

2.6. Niño Index

The Niño 3.4 index is defined as the number of SST anomalies averaged over the region of 170° W–120° W and 5° S–5° N. We used 30-year moving climatology based on the international climate standard to calculate SST anomalies (Table 3). An El Niño event is considered to have occurred when the 5-month moving average of the Niño 3.4 SST anomaly was >0.5 °C. A La Niña event is considered to have occurred when the Niño 3.4 index was <−0.5 °C for five consecutive months.

2.7. Data Analysis

The rendering was completed using Ocean Data View (5.3.0) software. Other mappings were performed using R4.2.2. We employed the Wilcoxon signed–rank test to examine the difference in phytoplankton abundance between 2005 and 2016 in Sanmen Bay. The Kruskal–Wallis test was utilized to determine the difference in various seasons between the two years, followed by post hoc multiple comparisons using the Steel–Dwass test. Additionally, we used one-way ANOVA to investigate whether there were differences in the effects of different types of ENSO on phytoplankton biomarkers, followed by post hoc comparisons using the Tukey HSD test. We used Pearson Correlation Analysis to test the relationship between lipid biomarker concentrations and Cholesterol concentration.
We used generalized additive models (GAMs) to investigate how phytoplankton changes were affected by the thermotropic effect of ENSO events. We used the function ‘gam’ in the R package ‘mgcv’ to model the functional response of phytoplankton biomarker concentrations to Niño 3.4 index.

3. Results

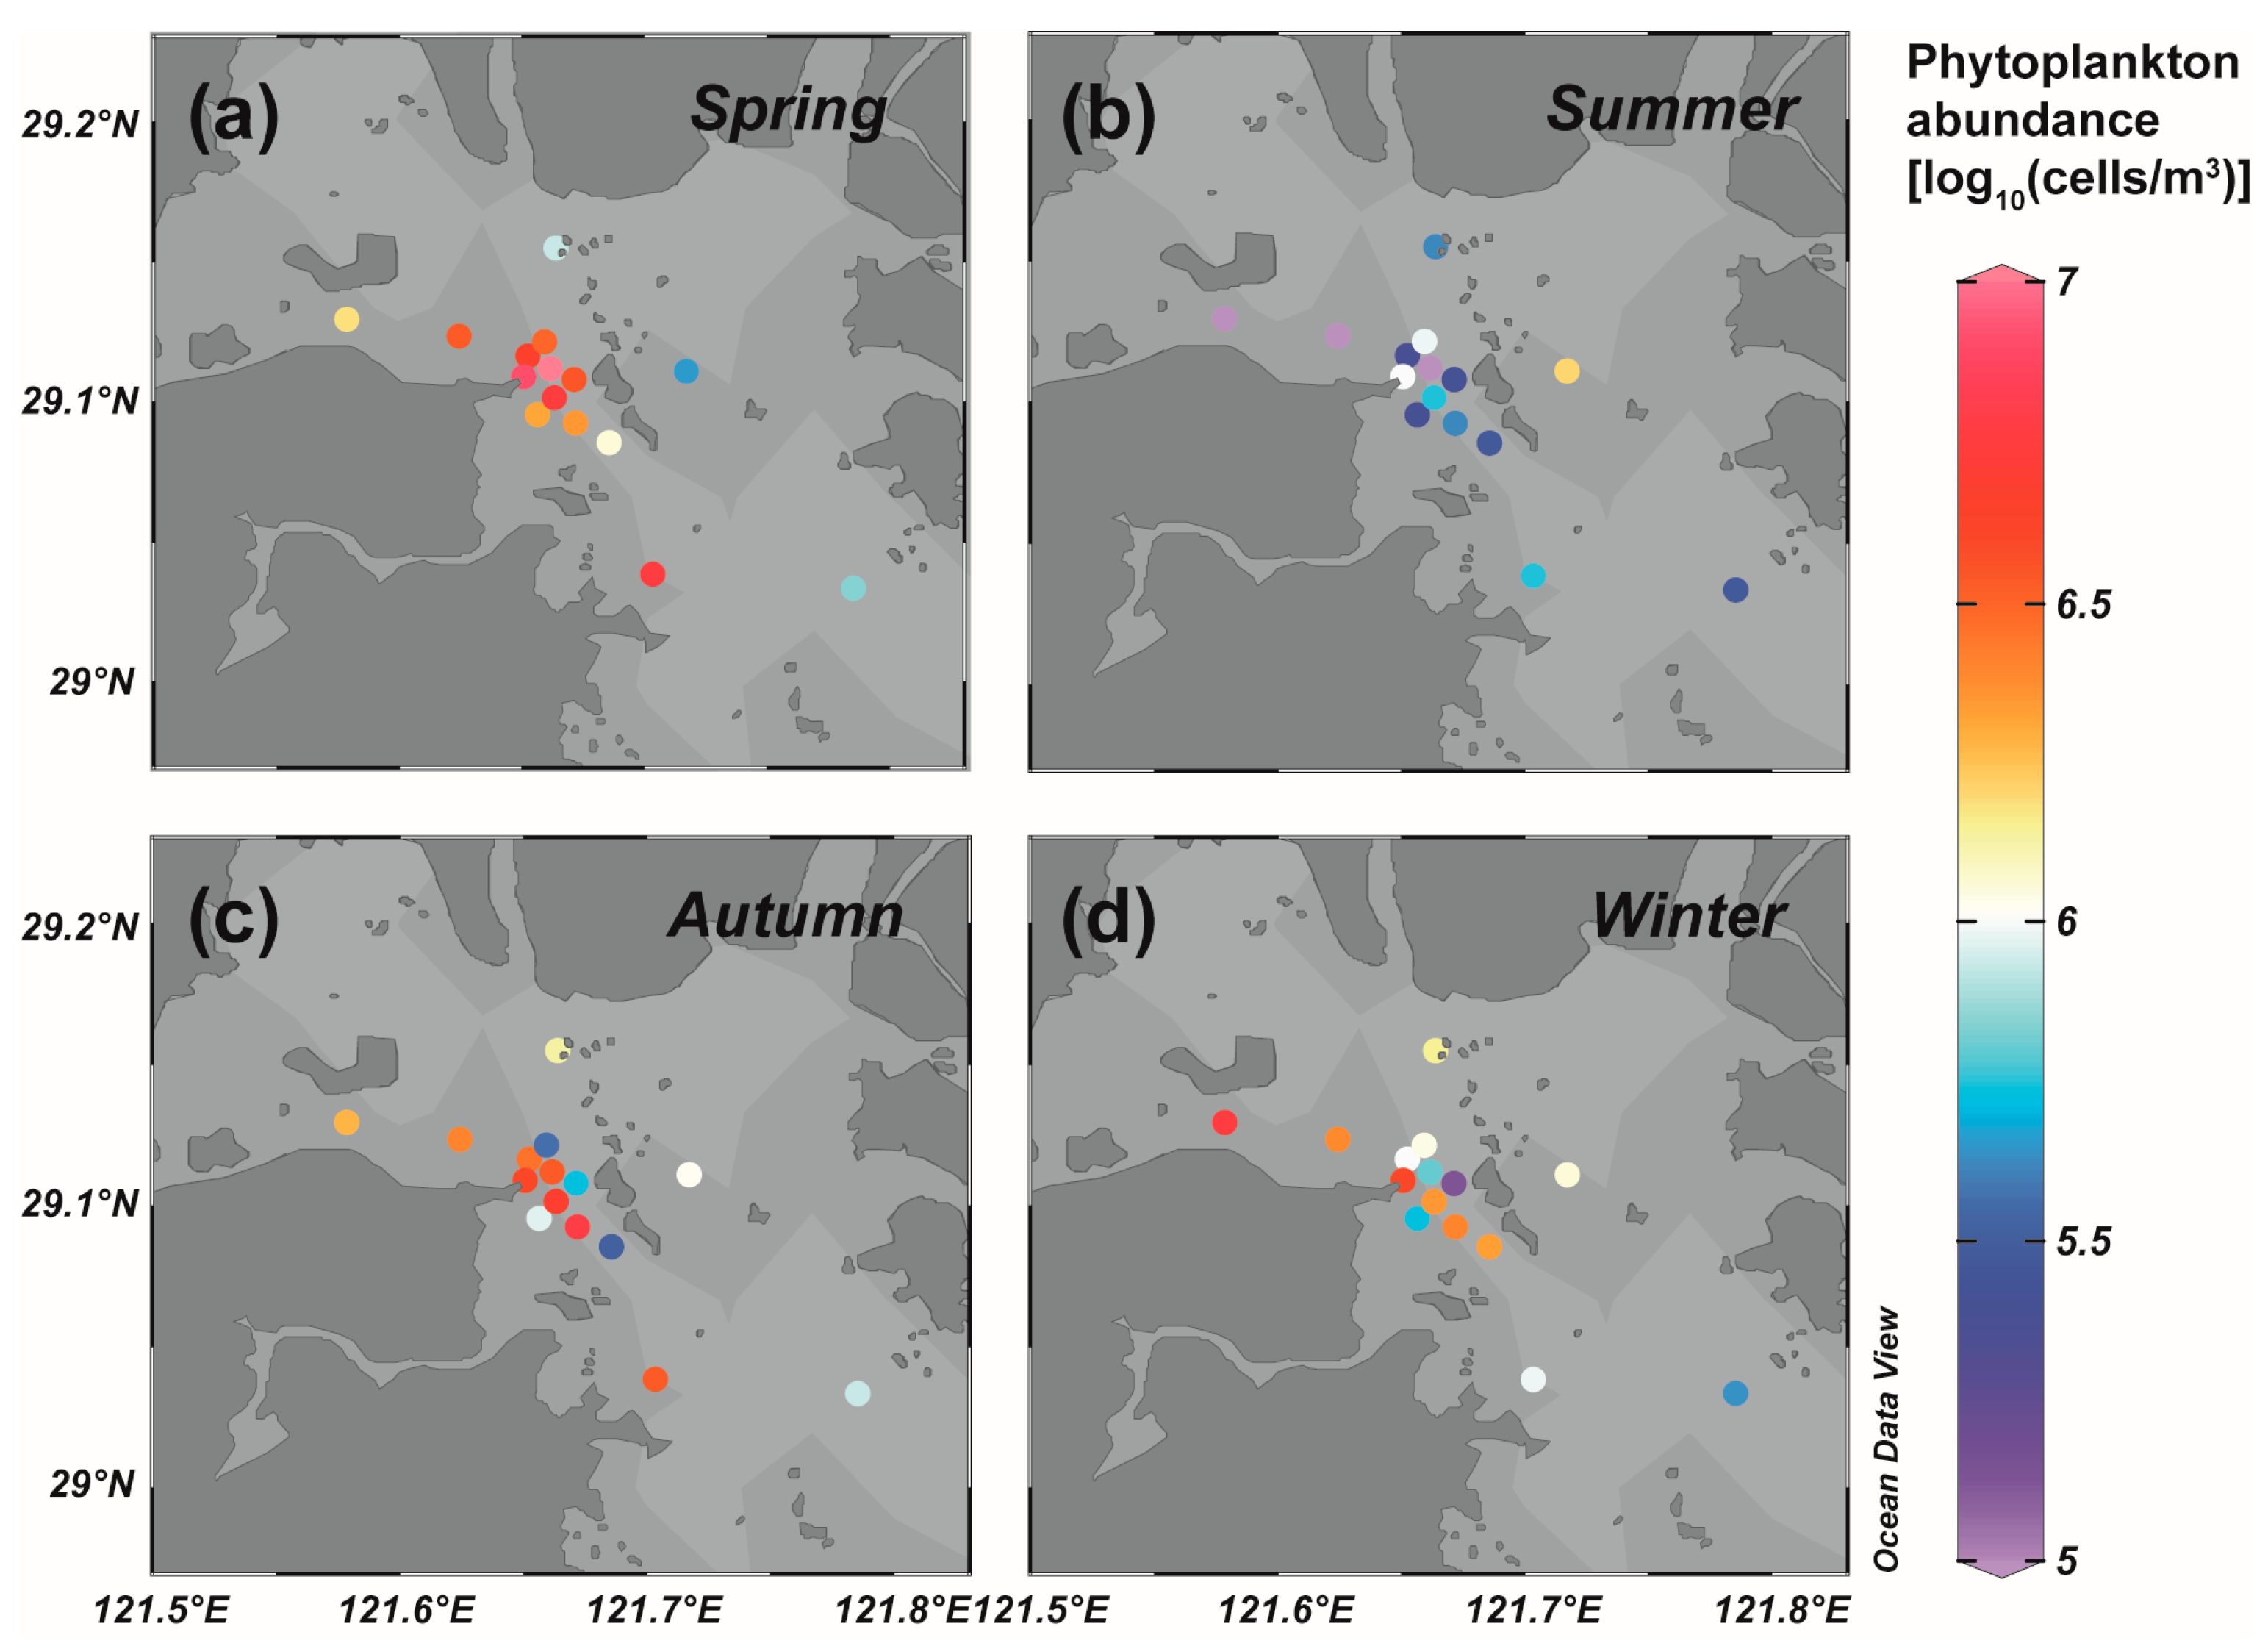
3.1. Phytoplankton Community Structure of the Field Survey in Sanmen Bay

In 2005–2006, the phytoplankton cell abundance in the field ranged from 0.72 × 10⁶ to 1.3 × 10⁹ cells/m3, with an average of 5.13 ± 6.34 × 10⁷cells/m3 and a total of 146 species across six phyla, including 38 genera and 115 species of diatoms (78.8%) and 12 genera and 25 species of dinoflagellates (17.1%). The dominant species in the phytoplankton community across all seasons was Skeletonema costatum (Table 2).
Meanwhile, the phytoplankton abundance measured in the field in 2016–2017 ranged from 7.80 × 10⁴ to 1.47 × 10⁷ cells/m3, with an average of 2.13 ± 2.47×10⁶ cells/m3 and a total of 129 species across five phyla. Among these species, diatoms accounted for 80.6% (104 species) and dinoflagellates 14.7% (19 species), with Coscinodiscus jonesianus being the dominant species in summer and Skeletonema costatum in all other seasons.
The Sanmen Bay marine area has long been dominated by widespread taxa in the coastal inlet. While there were no marked shifts in species composition in 2016 compared to 2005 (Table 2), the abundance declined by one order of magnitude. The abundance of phytoplankton in Sanmen Bay was significantly higher in 2005 than in 2016, and there were distinct seasonal differences observed in both years (p < 0.001). In 2005, the abundance of phytoplankton in winter was significantly higher than in spring and autumn (p < 0.001), while in 2016, the abundance in spring was significantly higher than in other seasons (p < 0.001). Moreover, the data demonstrated a pattern of high abundance in the middle and bottom of the bay and low abundance in the bay mouth (Figure 2).

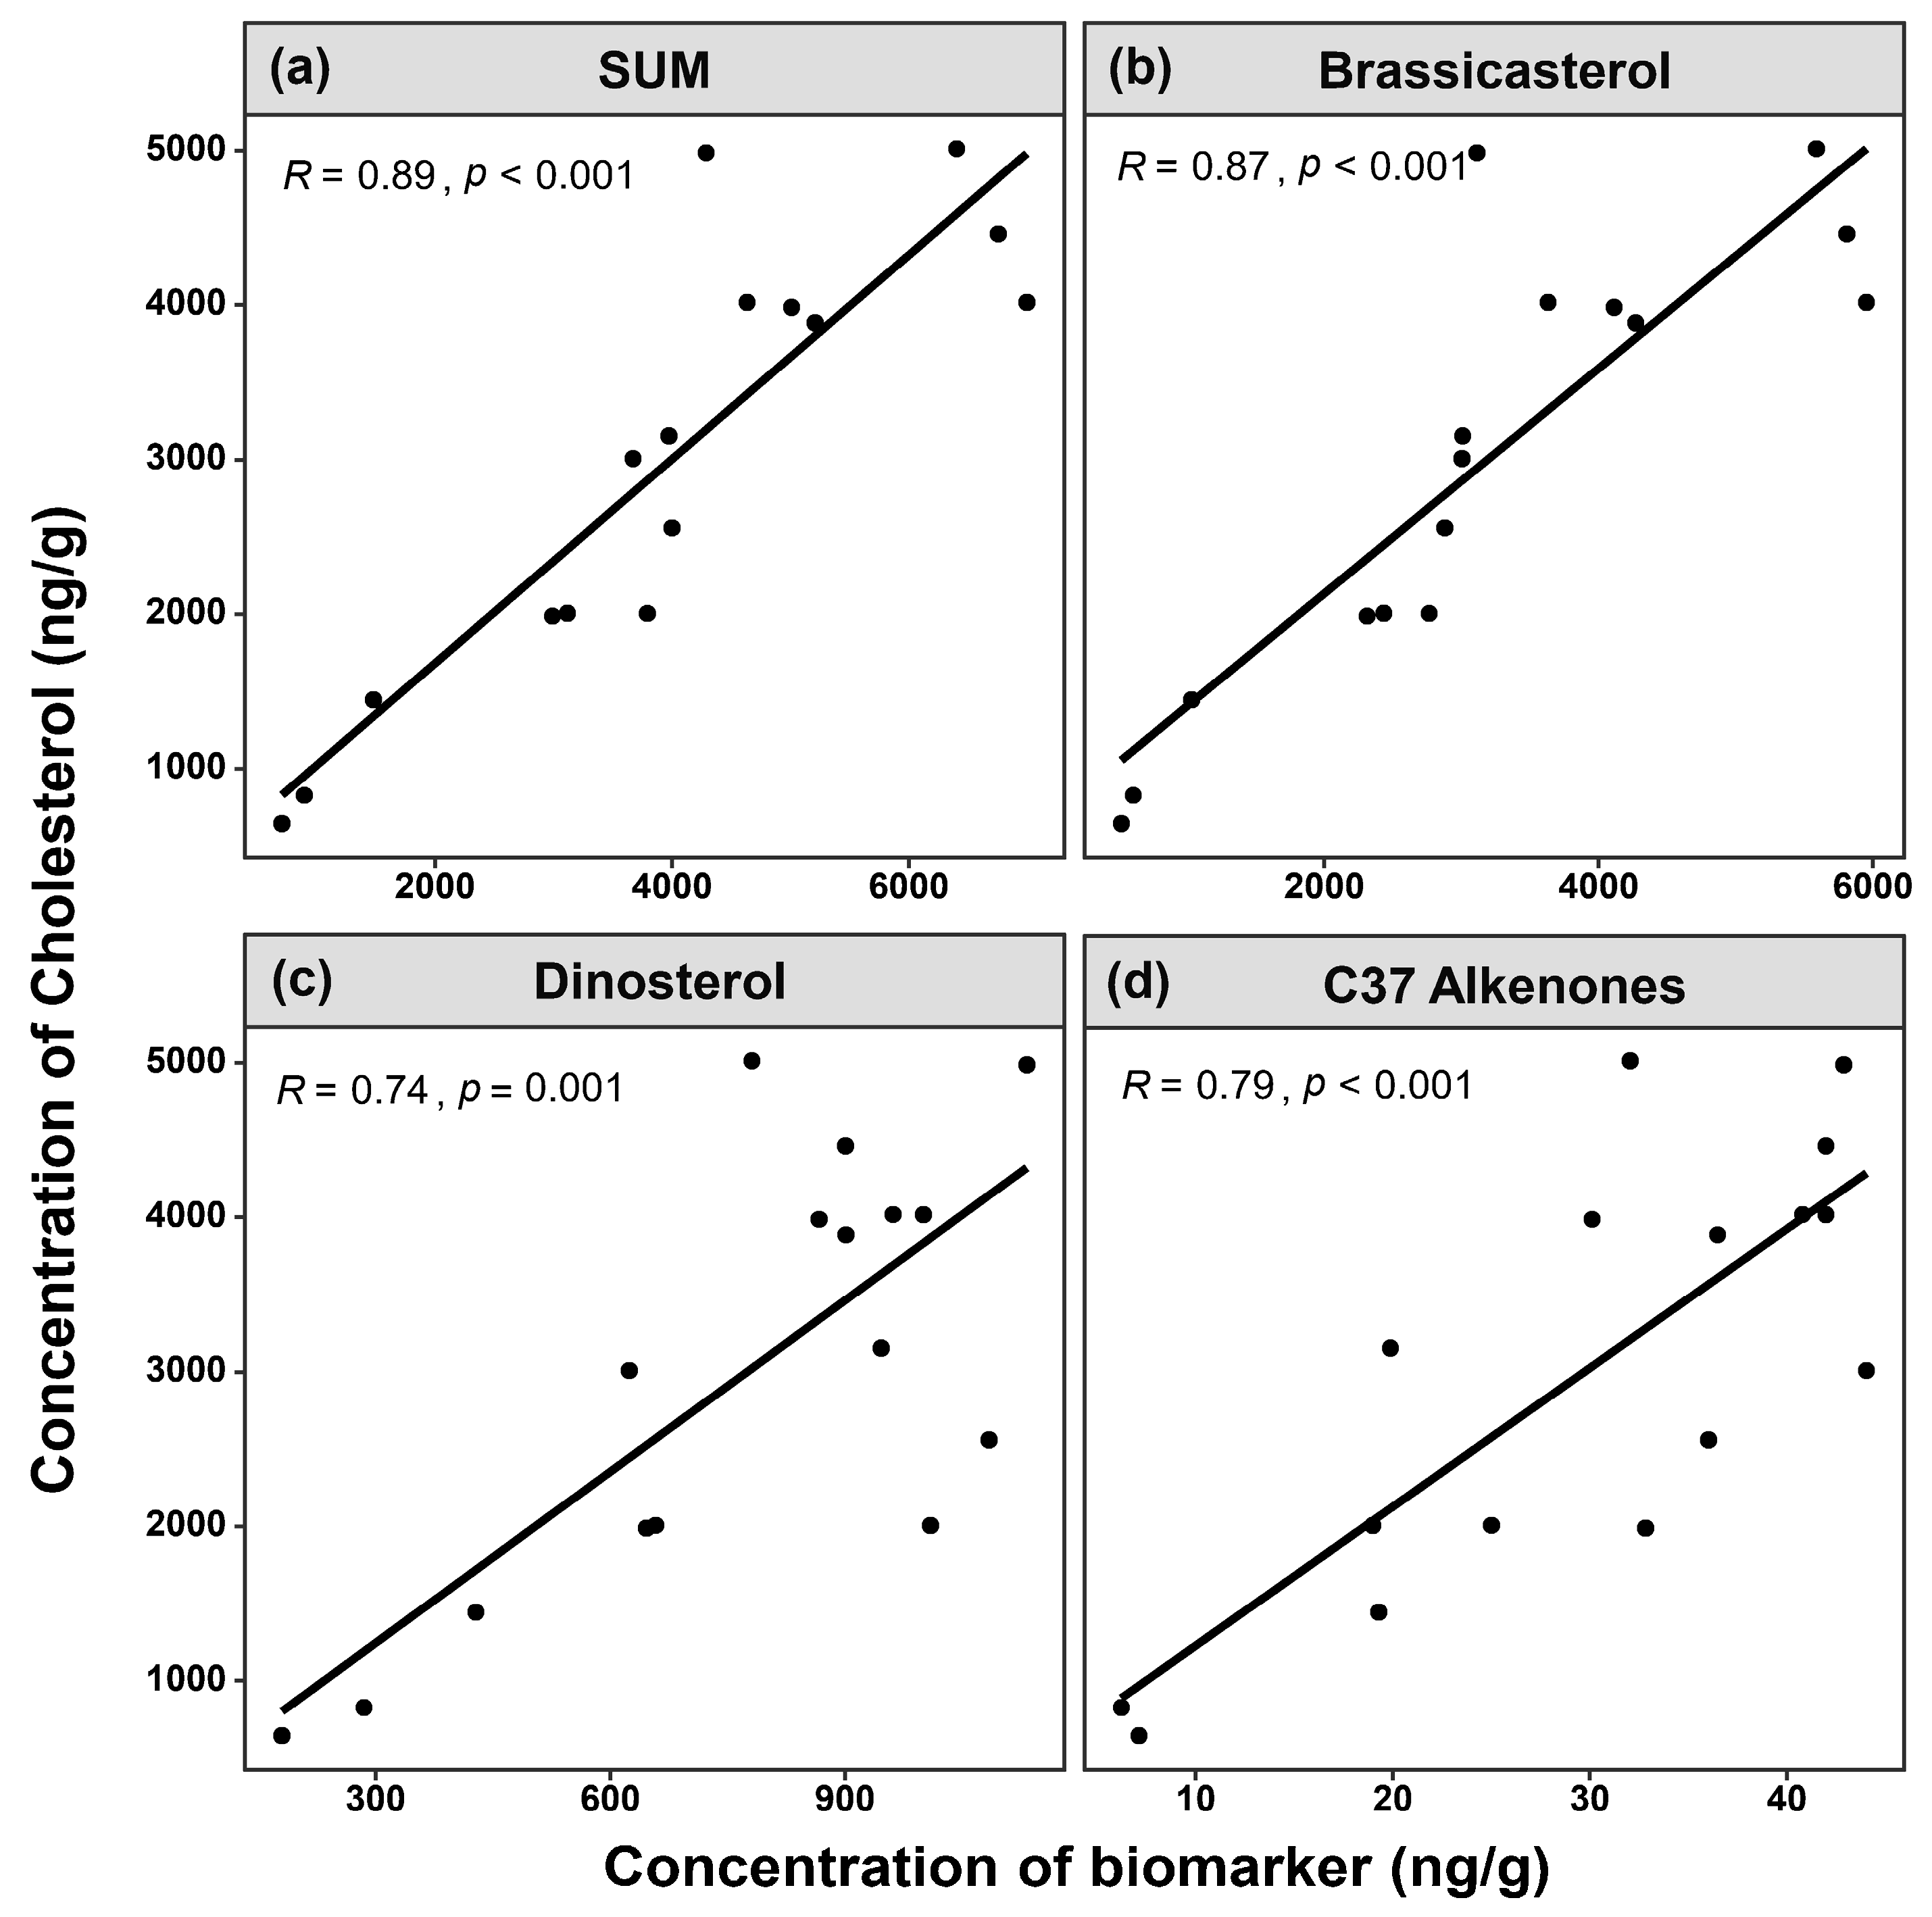
3.2. Comparison of Site Survey and Biomarker Reconstruction in Sanmen Bay

By reconstructing biomass ratios of surface sediments, we discovered that the ratio of brassicasterol/SUM (total phytoplankton biomarkers) ranged from 72.60 to 87.30 (average 81.26%), the ratio of dinosterol/SUM ranged from 12.20 to 26.40 (average 18.00%), and the ratio of C37 long-chain alkenone/SUM ranged from 0.50 to 1.00 (average 0.74%). Moreover, comparing these ratios to biological measurements, we found that the reconstructed ratios of diatoms and dinoflagellates (%) closely matched the values of diatoms, dinoflagellates and coccolithophores in the phytoplankton observed across cruises in Sanmen Bay waters in 2005/2006 and 2016/2017 [32].
The sediment samples’ cholesterol biomarkers exhibited significant positive correlations with various phytoplankton biomasses (R1 = 0.89; R2 = 0.877; R3 = 0.74; R4 = 0.79, p < 0.01, n = 16) (Figure 3). Therefore, we observed higher zooplankton biomass in regions with greater phytoplankton biomass.

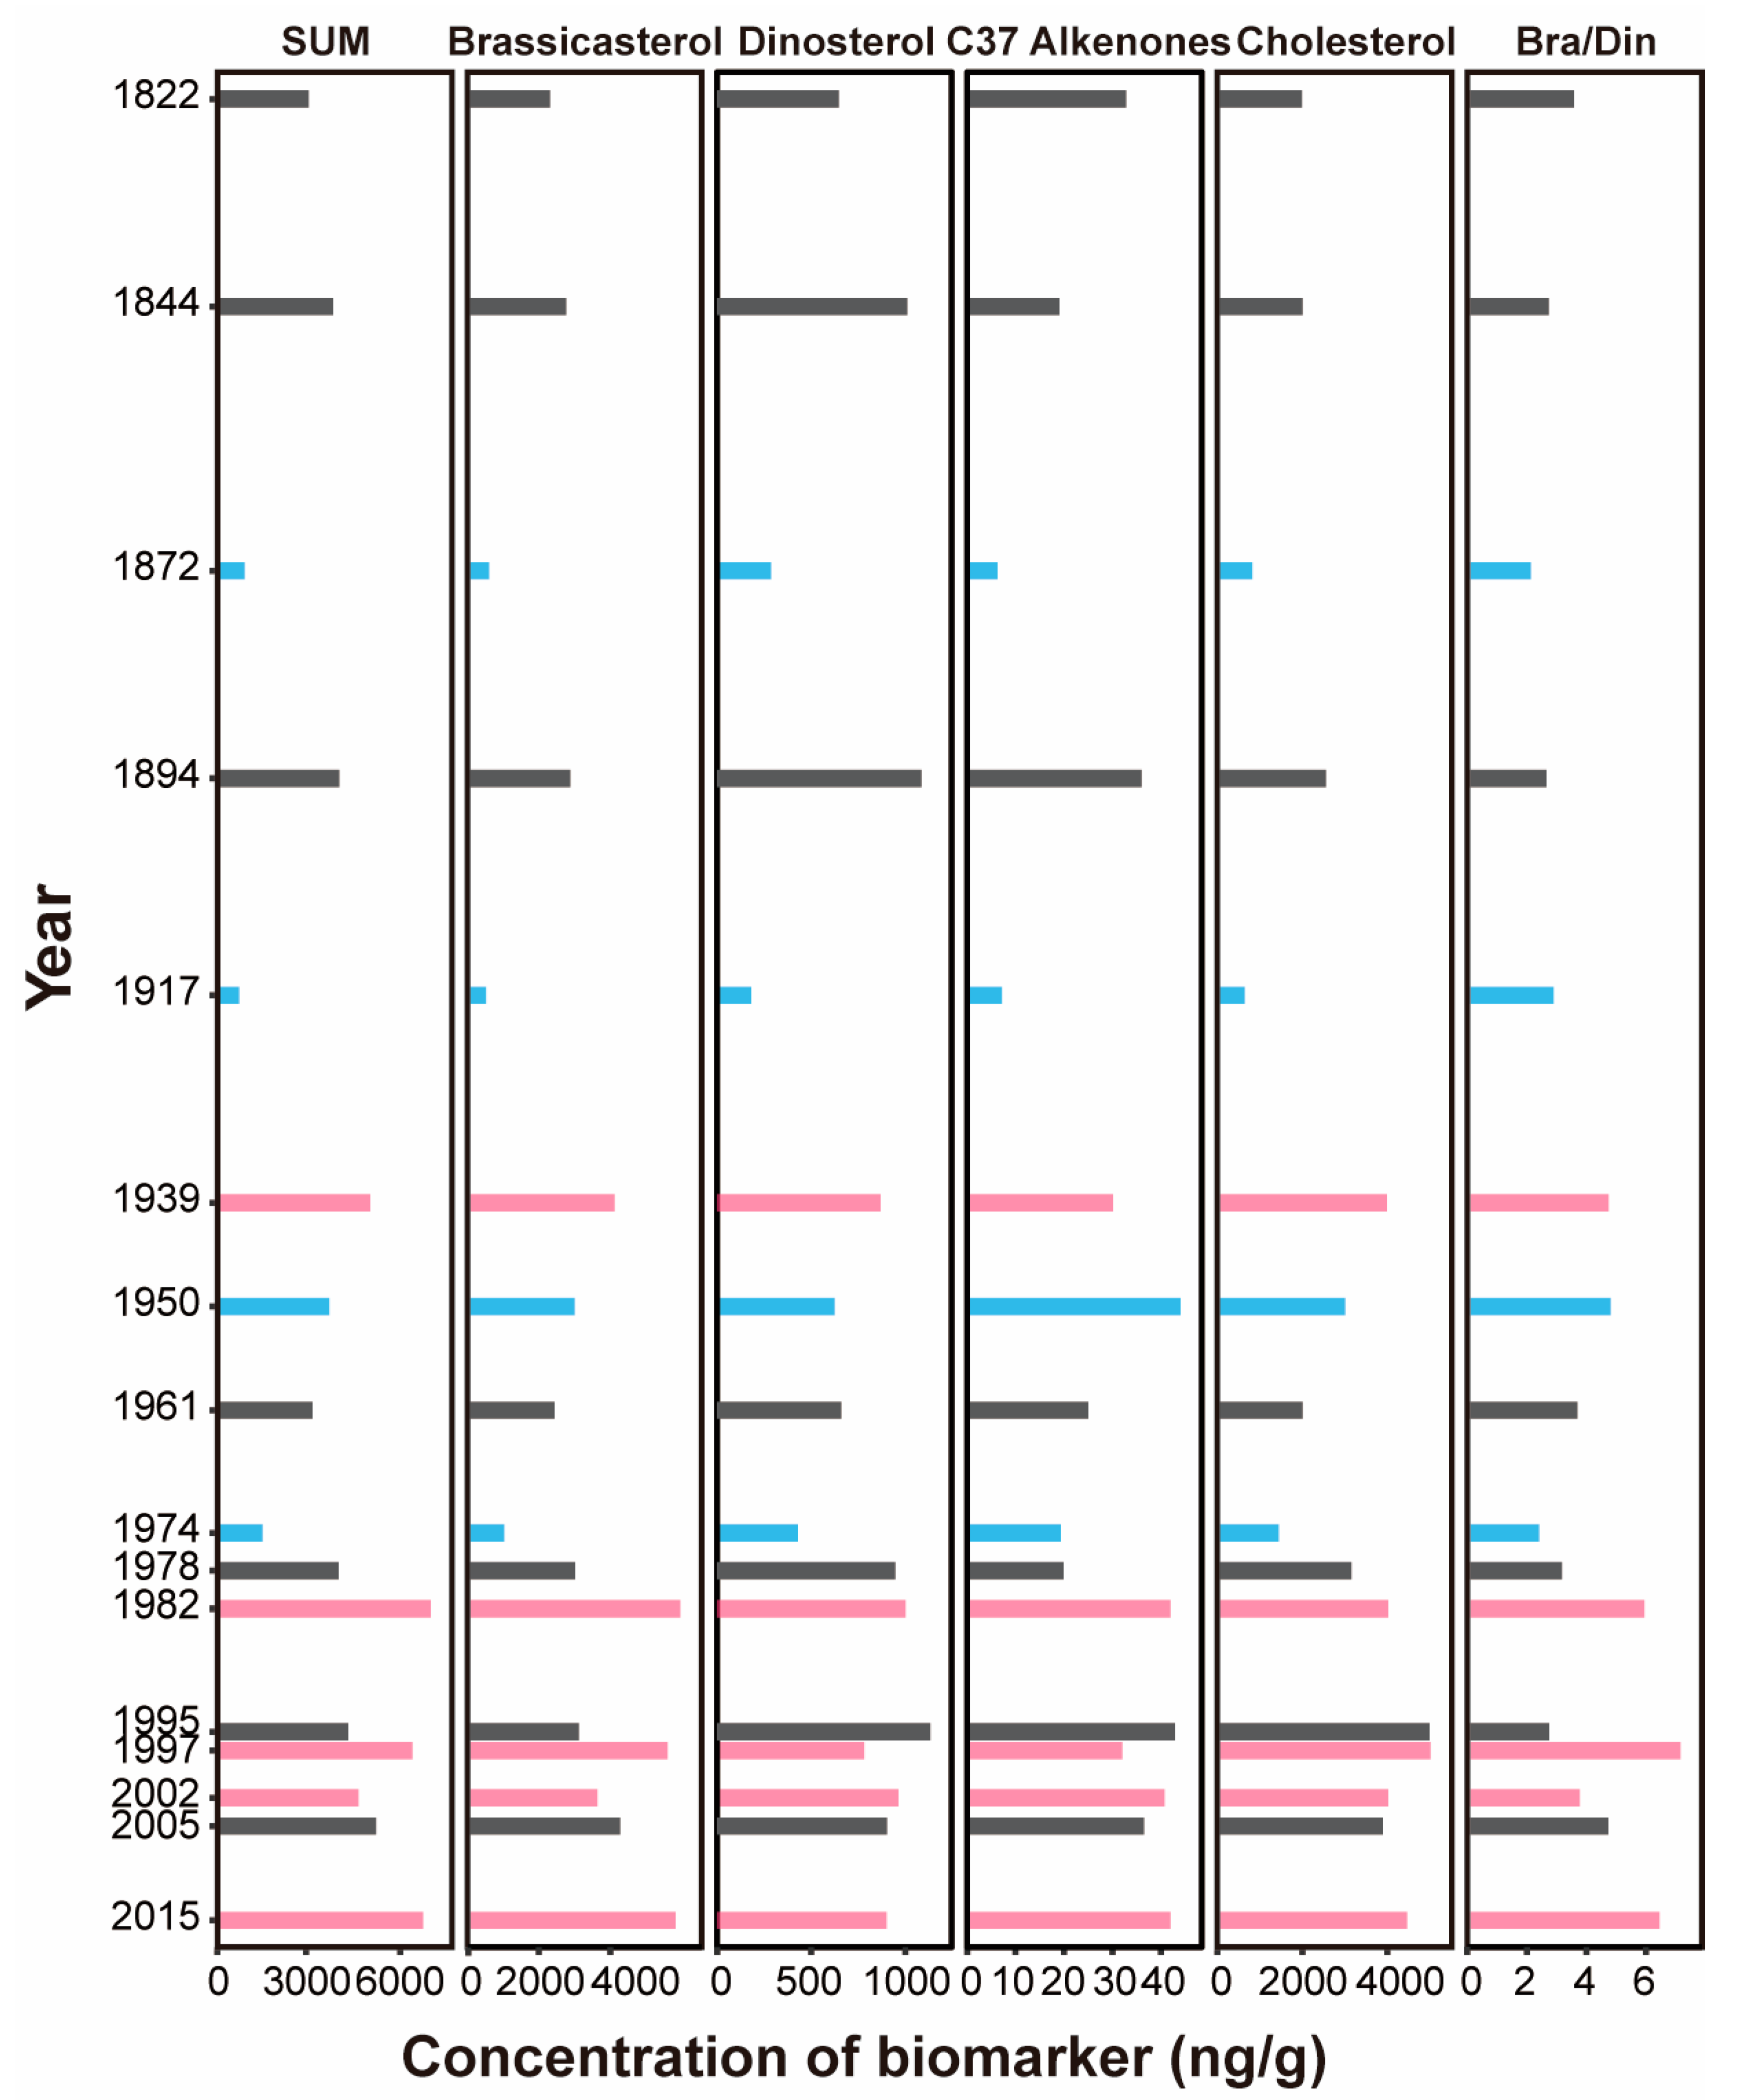
3.3. Interannual Variation in Plankton Community Biomass, Reconstructed from Sediment Biomarkers

Biomarker reconstructions from Sanmen Bay data revealed that the biomass trends of different taxa of phytoplankton and zooplankton were highly similar from 1922 to 2015, indicating clear interannual variation and temperature response (Figure 4). Notably, the biomass of zooplankton, phytoplankton, and the diatom/dinoflagellate ratio exhibited an increasing trend, with a more significant increase observed after 1974 (Figure 4).
Specifically, the biomass of individual phytoplankton biomarkers such as brassicasterol (diatoms), dinosterol (dinoflagellates), and C37 alkenone (coccolithophores) ranged from 523 to 5956 ng/g, 180 to 1133 ng/g, and 6 to 44 ng/g, respectively (Figure 4). The reconstructed phytoplankton biomass was ranked as diatoms > dinoflagellates > coccolithophores. Likewise, a strong correlation was observed between brassicasterol and both dinosterol and C37 alkenones (R1 = 0.68, R2 = 0.73, p < 0.01, n = 16), with their total content serving as an indicator of phytoplankton primary productivity.
Overall, the reconstructed results indicated that diatoms have dominated the phytoplankton in Sanmen Bay for over 200 years, although their proportion fluctuated significantly due to changes in the relative proportions of diatoms and dinoflagellates. Moreover, the brassicasterol/dinosterol ratio ranged between 2.13 and 7.15, with an overall decreasing trend (Figure 4).

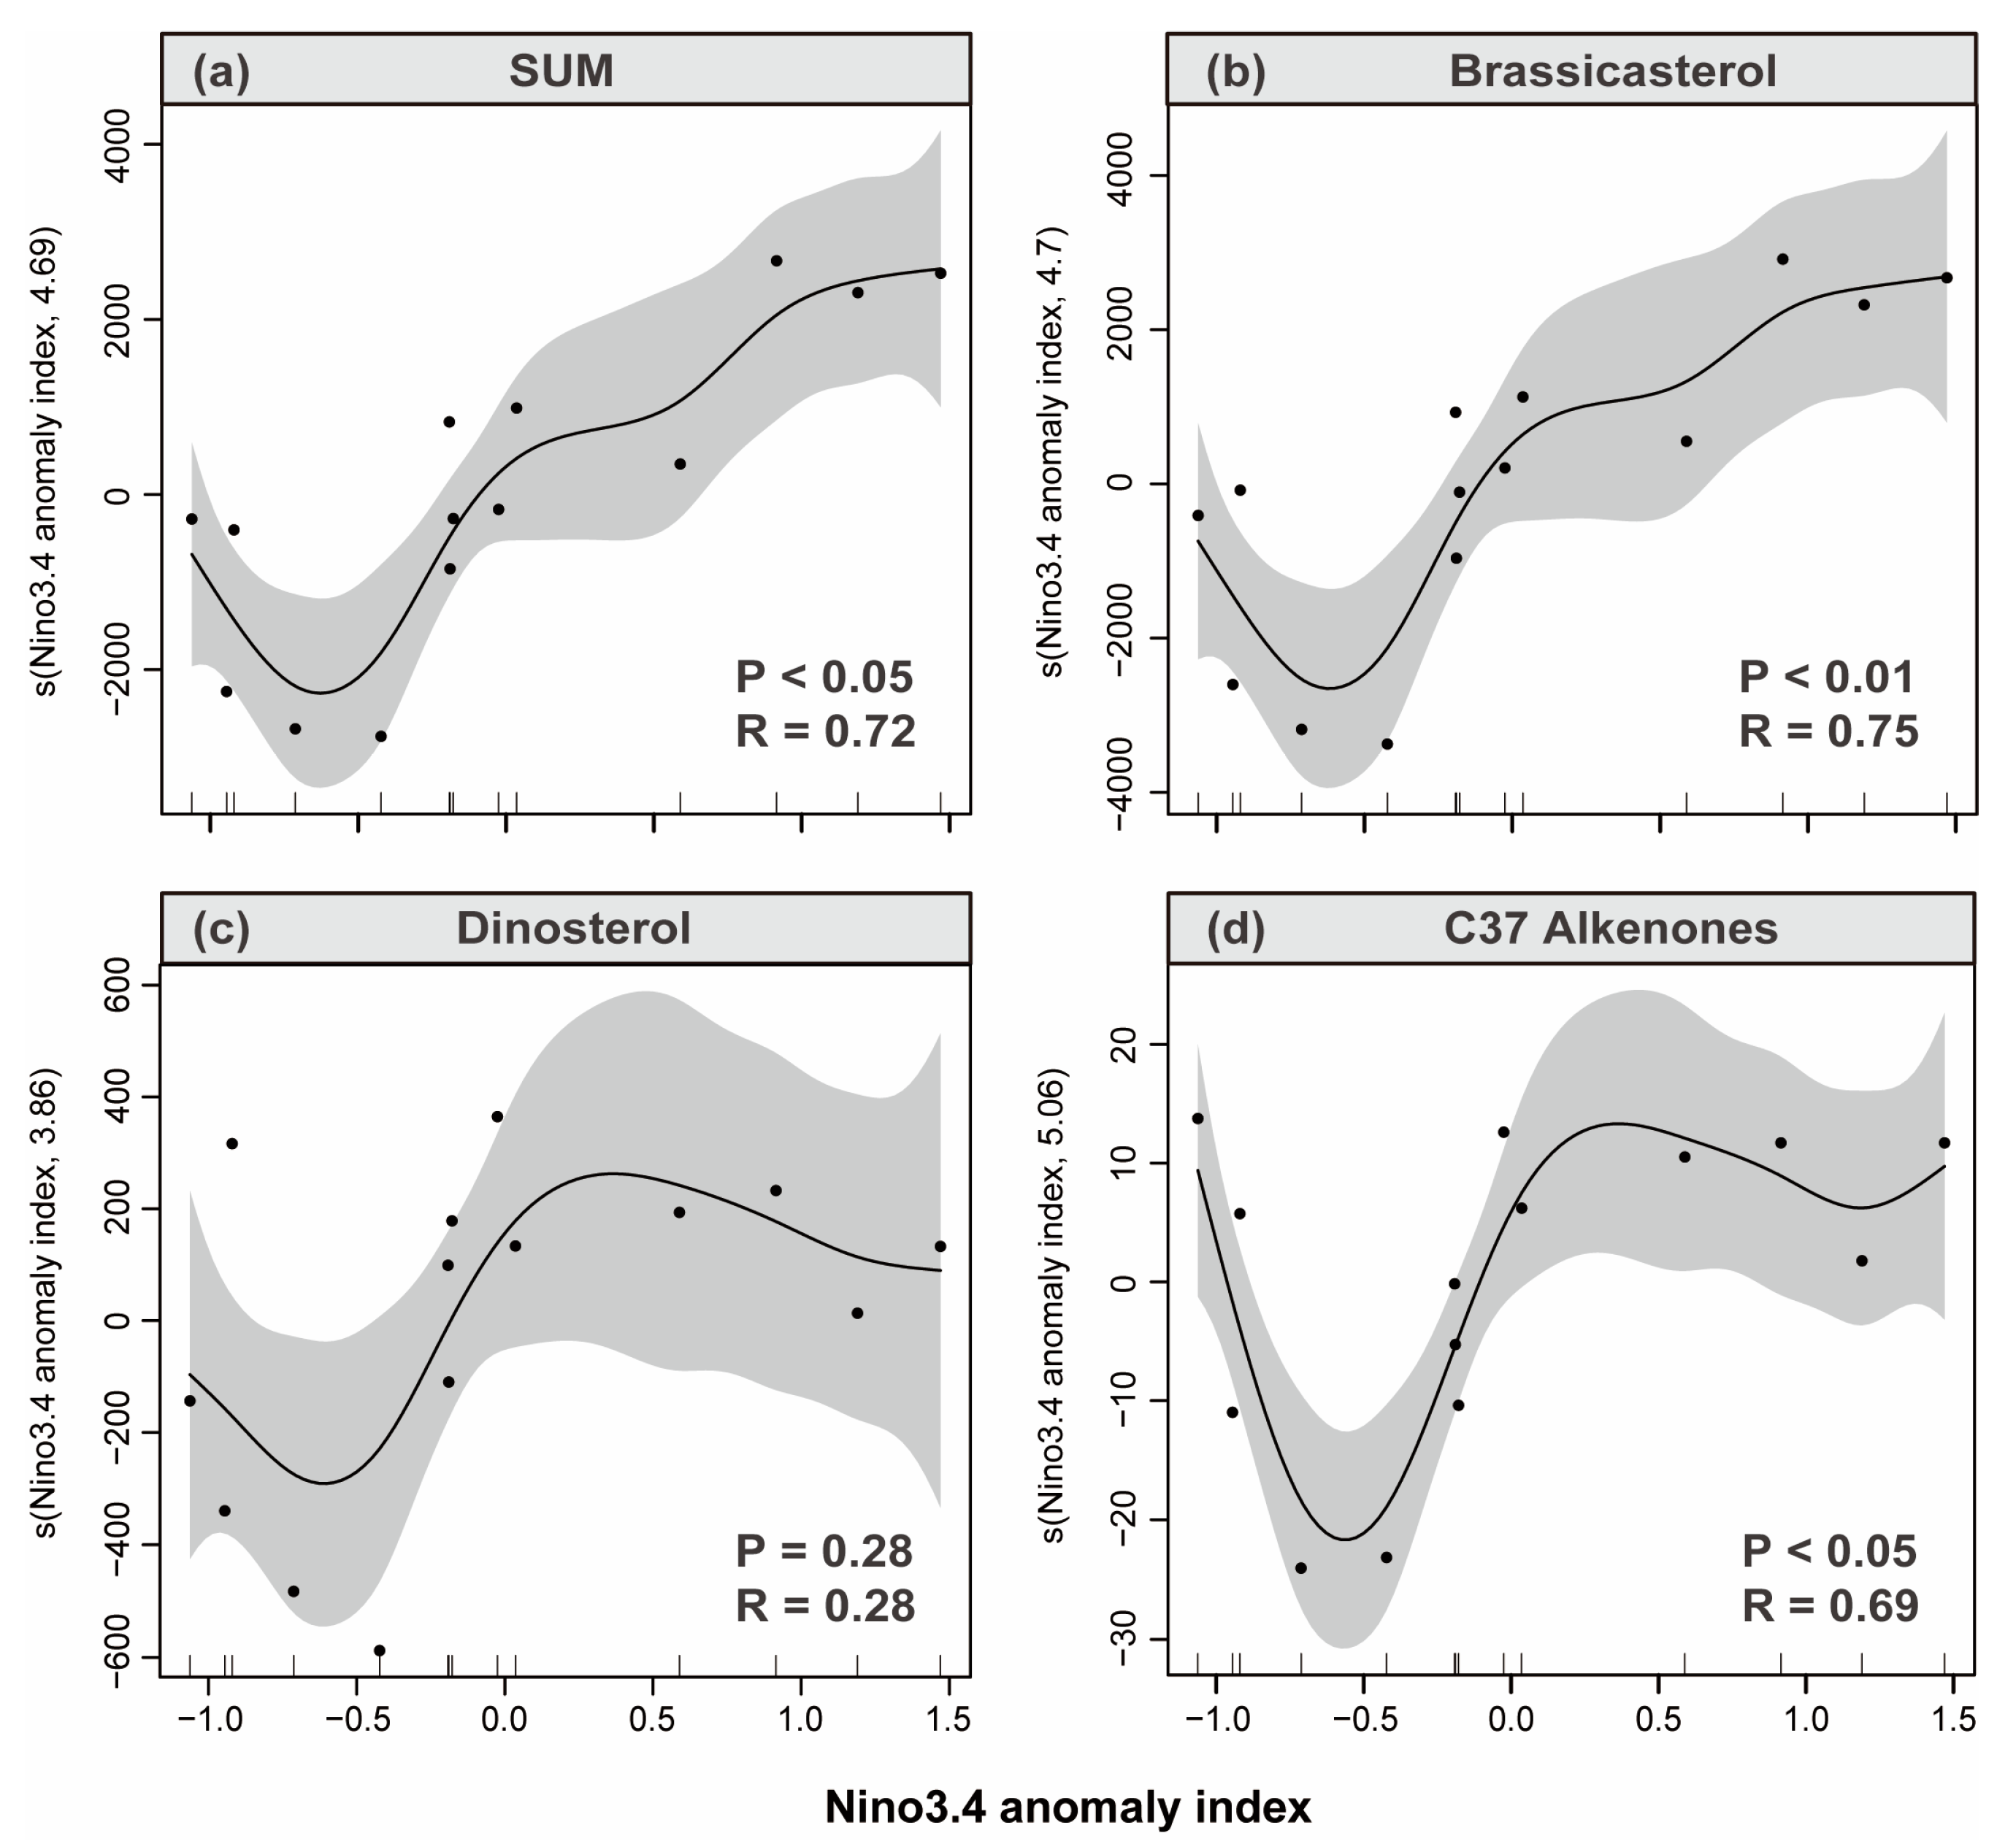
3.4. Sediment Reconstruction of Phytoplankton Response to ENSO

The sedimentary stratigraphy of Sanmen Bay revealed significant interannual variations in zooplankton and phytoplankton biomass and community structure between normal years, and years impacted by El Niño and La Niña events, respectively (Figure 4).
(1) During six normal years, the mean concentration of zooplankton biomarkers was 2781 ± 1174 ng/g, and the mean concentration of total phytoplankton biomarkers was 3697 ± 522 ng/g. The diatom biomass, indicated by brassicasterol concentration (2754 ± 319 ng/g), accounted for 74.51 ± 2.62% of total phytoplankton biomass. The dinoflagellate biomass, indicated by dinosterol concentration (913 ± 212 ng/g), accounted for 24.70 ± 2.65%. The reconstructed diatom/dinoflagellate biomass ratio was 3.10 ± 0.46%.
(2) During four La Niña event impact years, the mean concentration of zooplankton biomarkers decreased to 1480 ± 1074 ng/g, and the mean concentration of total phytoplankton biomarkers decreased to 1692 ± 1362 ng/g. The diatom biomass, indicated by brassicasterol concentration (1293 ± 1163 ng/g), accounted for 76.42 ± 6.24% of total phytoplankton biomass. The dinoflagellate biomass, indicated by dinosterol concentration (380 ± 19 ng/g), accounted for 22.44 ± 6.38%. The reconstructed diatom/dinoflagellate biomass ratio was 3.06 ± 1.21%.
(3) During six El Niño event impact years, including the following year (2005), the mean concentration of zooplankton biomarkers increased to 4229 ± 433 ng/g, and the mean concentration of total phytoplankton biomarkers increased to 5837 ± 1003 ng/g. The diatom biomass, indicated by brassicasterol concentration (4897 ± 1004 ng/g), accounted for 83.90 ± 3.28% of total phytoplankton biomass. The dinoflagellate biomass, indicated by dinosterol concentration (902 ± 76 ng/g), accounted for 15.46 ± 3.17%. The reconstructed diatom/dinoflagellate biomass ratio was 5.47 ± 1.26%.
Biomarker concentrations increased significantly by approximately 57.89% in El Niño years and the following year (p < 0.01), while decreasing significantly by approximately 54.23% in La Niña years (p < 0.05). The reconstructed diatom/dinoflagellate biomass ratio did not differ significantly in normal and La Niña years, but it increased by approximately 76.40% in El Niño years, which indicated a significantly higher proportion of diatoms (Figure 4). In normal years, the biomass of each phytoplankton taxon increased with temperature, with the warming effect more pronounced in El Niño years, leading to a higher biomass of diatoms, while dinoflagellates and coccolithophores remained relatively stable. In La Niña years, an increase in biomass with lower temperature was also observed (Figure 5).

4. Discussion

4.1. Response of Phytoplankton Community Changes to ENSO Signals in Sanmen Bay

Environmental factors such as nutrient concentration, temperature, and salinity are closely related to the ENSO phenomenon, leading to changes in phytoplankton taxa and distribution. The warming effects of El Niño can be transmitted from the Pacific to the southeastern coast of China, thereby increasing SST. In contrast, La Niña brings cooling effects and strong upwelling, which enhances nutrient supply. Furthermore, the strong monsoon associated with La Niña increases the terrestrial freshwater input, resulting in decreased salinity. Numerous studies have demonstrated a strong correlation between phytoplankton response and ENSO index during ENSO events [36,37,38,39]. Phytoplankton biomarker reconstruction techniques based on phytoplankton lipids have been successfully utilized in climate change research to assess the impact on paleoproductivity and phytoplankton community [13,40,41,42]. The reconstructed phytoplankton community structure and biomass in Sanmen Bay agree with the field measurements [32], indicating the effectiveness of the lipid biomarkers in sediment preservation for interannual scale phytoplankton community reconstructions.
During the observation period from 1982 to 2015, Sanmen Bay experienced three El Niño-influenced years and one La Niña-influenced year (Table 2). Previous studies on the ENSO effect on seasonal temperature only considered contemporaneous relationships, but due to the lag in the global climate impact of SST anomalies in the eastern Pacific Ocean, it is more reasonable to define not only the current year of ENSO but both the winter before the outbreak and the following year as constituting ENSO-influenced years. Interannual variation of phytoplankton biomarkers provides a reliable approach to investigating the impact of ENSO events on phytoplankton in Sanmen Bay.

4.1.1. EI Niño Impact Year

The ENSO signal can be transmitted across the ECS, affecting the ecological structure of the Sanmen Bay area by altering its SST. Although the ecosystem response in Sanmen Bay may lag, it is still evident, as reflected in changes in biomass and community structure. El Niño warming promotes phytoplankton biomass and species diversity, which in turn favor algal blooms by suppressing sensitive diatom species (Figure 4).
The type and intensity of EI Niño events can alter the phytoplankton community structure in bay areas. We classified ENSO events into two categories: the eastern type, labeled EI Niño–EP, where warming starts mainly in the equatorial eastern Pacific; and the central type, labeled EI Niño–CP, where warming starts mainly in the equatorial central Pacific [43]. The SST warming zones and atmospheric circulation conditions of these two types of events differ significantly, resulting in different climate impacts and ecological effects [3]. Biological measurements during the mixed EI Niño–CP–EP (2015/3–2016/6) and CP–EI Niño (2002/4–2003/6) events showed significant annual differences in phytoplankton cell abundance, population numbers, and dominant species (Table 2). The reconstructed biomass indicated that super EI Niño events (2015/2016, 1997/1998, 1982/1983) had a significantly greater impact on phytoplankton productivity than the other two recorded EI Niño events, and that both the primary productivity and the diatom/dinoflagellate ratios increased with EI Niño intensity (Figure 4). Therefore, the change in marine ecological response is not only related to the type of EI Niño event, but also closely related to its intensity.
During the medium EI Niño–CP event (2002/5–2003/3), phytoplankton cell abundance averaged 3.87 × 10⁸ cells/m3 across four seasons, with the highest values occurring in summer. The number of other phytoplankton, such as Cyanophyta, Phaeophyta, and Chrysophyta, also increased, with a higher species richness (Table 2).
In the super-intense EI Niño–CP–EP (mixed) event (2015/3–2016/6), which contained features of both central and eastern EI Niño events, the overall development pattern was more similar to that of the central type, showing eastward transmission characteristics in the early stage and westward transmission characteristics in the later stage, in contrast to the 1997/1998 and 1982/1983 EI Niño events [44]. The mean phytoplankton cell abundance across the four seasons during the 2015–2016 super EI Niño was 1.63 × 10⁷ cells/m3, with high values also occurring in summer. The number of other phytoplankton species also increased dramatically (Table 2), indicating that the type and intensity of EI Niño events have significant impacts on the marine ecosystem.
During biological surveys from December 1981 to October 1982, the highest phytoplankton cell abundance in Sanmen Bay occurred during the winter, with a mean of 2.34 × 10⁸ cells/m3, and even reached the magnitude of HABs occurrence; this was significantly different from other EI Niño years, where the peak was in summer (Table 2). This could be due to the fact that December 1981 coincided with the winter before the outbreak of the super EI Niño–EP type event (1982/4–1983/7), which started in the fall, reached its peak in the winter, and had the most significant climatic impact on the winter season [45].
Although both events occurred during the context of a super EI Niño, there were significant differences between the winter climates of Sanmen Bay in 1982/1983 and 2015/2016 [46]. The ecological response to EI Niño was reflected not only in biomass but also in changes in community structure, with the number of phytoplankton species increasing to 199 during the super EI Niño (2015/3–2016/6) impact years, including 149 diatom-dominated species, 27 dinoflagellate species, and a dramatic increase observed in 23 species of other phytoplankton [30].
While the abundance of phytoplankton during El Niño years is similar to that of non-ENSO years in the summer months, there is a marked difference in the magnitude of their respective abundances. In fact, during El Niño years, the abundance of phytoplankton is significantly higher, often differing by several orders of magnitude when compared with non-ENSO years (Table 2). The ecological response of the phytoplankton community in the EI Niño impact year was rapid, and the number of species was greater than in the non-ENSO year. Likewise, the composition of dominant species was different, which may have persistent impacts in the future. This is because after the end of the stronger ENSO, the ecology will continue to be affected by this lag effect, given that the atmospheric response to the ocean will continue for some time.

4.1.2. La Niña Impact Year

During the transition from El Niño to La Niña in the open ocean, the surface layer’s chlorophyll concentration increases significantly, sometimes even exceeding three times the interannual amplitude. The mixing layer deepens, and the nutrient halocline uplifts, leading to the involvement of nutrient-rich cold water in the mixing layer. Additionally, factors such as the reduced feeding pressure that follows El Niño events contribute to algal blooms during La Niña years [47]. In the South China Sea, La Niña-influenced years experience an earlier and more intense summer monsoon, leading to low sea temperatures, heavy precipitation, and strong upwelling, all of which promote the transport of nutrients to the surface, in addition to rapid phytoplankton growth [48]. Thus, the regulation mechanism of La Niña on phytoplankton differs between marine environments.
La Niña events mainly begin in summer, being their strongest by winter [49], and the East Asian monsoon also tends to be stronger [45]. Biological surveys during the La Niña impact years (1985/8~1986/2) showed anomalous winter abundance much higher than the other three seasons (Table 2). The amount of Chaetoceros danicus Cleve and Skeletonema costatum (Crev.) Cleve dramatically increased during winter, with a mean total phytoplankton abundance of 2.40 × 10⁸ cells/m3 (Table 2). The primary reason for this could be that during La Niña, the study area’s salinity decreased by 2‰ from August to December due to increased continental runoff, which brought a large amount of terrestrial phosphate and silicate, thus promoting rapid diatom bloom [50]. The abundance of Chaetoceros danicus Cleve reached 1.7 × 10⁸ cells/m3 (70.8% of total phytoplankton) during winter, with a change in number from autumn to winter of more than 4000 times. Abundance increased from the mouth of the bay to its bottom, and dominant species’ phase succession was particularly apparent. Phytoplankton communities in the water column simplified, with the number of species reducing to 66, and the dominant species shifted to diatoms and warm water species [31].
When analyzing the sediment and the measured data from Sanmen Bay, we observed that the phytoplankton’s response to ENSO signals during La Niña years was less regular than during El Niño years, with low sediment inversion and high measured data (Figure 4). Therefore, the response mechanism of phytoplankton in Sanmen Bay to La Niña may differ from that in the open ocean. Due to Sanmen Bay’s shallow depth, the nutrient restriction is weak. However, under the influence of a strong La Niña, the southeast monsoon intensifies, and sea water mixing increases. At the same time, increased precipitation regulates surface runoff and nutrient input, resulting in bloom formations.

4.2. Regulation of Phytoplankton by Other Physical Processes in Sanmen Bay

The sediment column samples from Sanmen Bay revealed an increasing trend in both zooplankton and phytoplankton biomarkers over the past 200 years, particularly after 1974, which may be attributed to the climate having warmed since the late 1970s (Figure 4). The rise in temperature in Sanmen Bay has had adverse effects on temperature-sensitive diatom species, leading to their gradual replacement by chain diatoms, and facilitating the proliferation of other types of phytoplankton [30].
Between 1982 and 2015, the abundance, population number, community structure, and dominant species composition of phytoplankton in the Sanmen Bay sea area showed significant spatial and temporal differences (Table 2). The distribution of phytoplankton cell abundance varied considerably across different years and seasons, neither consistently high in summer nor low in winter. Additionally, significant differences were observed in the number of phytoplankton species (Table 2).
In Sanmen Bay, the mean values for the number of phytoplankton species, level of biomass, and population abundance were highest in summer during normal years without ENSO, specifically in 2007, 2012, and 2014. The abundance exhibited a decreasing trend in winter during these years (Table 2). Diatoms were the dominant taxa, accounting for more than 80% of the community, while dinoflagellates were relatively low. In 2005, also a non-ENSO year, the abundance was higher compared to other years, and the seasonal variation was opposite to that of the rest of the years, having no marked difference in abundance between summer and other non-ENSO years, but a higher abundance occurring in other seasons, especially winter (Table 2). During the La Niña-affected years of 1985–1986, field surveys revealed anomalously higher levels of both abundance and biomass of phytoplankton in winter (Table 2). In the biomarker reconstruction, we found that the recorded role of La Niña impact years on sedimentary stratigraphy was generally smaller than that of El Niño impact years, with its regularity likewise less pronounced than the response of the phytoplankton’s primary productivity during El Niño events (Figure 4). The effect of these few La Niña events on the increase or decrease in zooplankton and phytoplankton effects recorded in the sedimentary stratigraphy was asymmetric. These anomalies suggested that there may have been other factors besides ENSO influencing phytoplankton community changes in the Sanmen Bay area.
Southeast Asia experiences a typical monsoon climate, and the summer monsoon significantly affects the distribution patterns of major marine phytoplankton [51]. Long-term low-frequency changes in climate and ocean-ecology in the Sanmen Bay marine area are also significantly impacted by the East Asian monsoon (comprising north and north-east winds along the Zhejiang coast) and currents [52]. The seasonal variations of Sanmen Bay are influenced by the interaction between the southward flowing Yangtze River and the northward flowing Taiwan warm current, leading to cyclic fluctuations in nitrogen and phosphorus nutrient levels. The southerly winds in summer increase both the power of the Zhejiang coastal current and the invasiveness of the Taiwan warm current, which in turn alters the phytoplankton community composition, with the abundance of warm-water species increasing in the bay mouth giving dominance to chain diatoms such as Skeletonema costatum and Chaetoceros. In winter, the strong north wind brings cold water from the bottom of the sea to the surface [53], along with nutrient-rich materials from the deeper layers of the ocean, which can trigger phytoplankton proliferation and accumulation. Human activities, such as nuclear power plants, introduce waste heat which warms the surrounding waters, causing temperature rises that may lead to rapid phytoplankton multiplication and an increase in their overall abundance.

4.3. The Focus of Future Research

Although Sanmen Bay is a representative area of the Gulf, its offshore marine ecology is highly complex. This study examined such sediment and water samples within the sampling range that could adequately reflect conditions in the bay, but there are still limitations in terms of spatial scale. In the future, historical data from several bays in the ECS could be integrated and analyzed to better understand phytoplankton dynamics and response mechanisms to large-scale physical processes in the bay area, and do so with a higher vertical resolution. Additionally, representative systems such as offshore coral reefs and upwellings have different sensitivities and response levels to their environment. Therefore, sampling should be increased in these areas, expanding the sampling range and sample size to better observe the long-term response of different systems to climate change.
Since the measured phytoplankton data used in this paper are mainly from the net phytoplankton data collected across the Sanmen Bay’s history, in order to explore the response of phytoplankton to ENSO time on a longer time scale, we also adopted the paleoproductivity method of sediment inversion. Although net phytoplankton samples can only collect phytoplankton with large particle sizes, lipid biomarkers in sediments are also mainly derived from large phytoplankton, so the synchronous analysis of the two methods is reasonably comparable. Lipid biomarkers in sediment were derived from phytoplankton deposition in the water column. The preservation of biomarkers mainly depended on sediment redox conditions and accumulation rates, but different biomarkers have varying degradation efficiencies, leading to potential uncertainty when reconstructing the phytoplankton community structure and species [40]. In this study, we selected Sanmen Bay due to its relatively eutrophic conditions, having both high phytoplankton biomass and high sedimentation rates. However, the temporal resolution of the sediment column was insufficient for obtaining the data of all ENSO impact years in the century range, especially before 1940.
Bivalves in shallow seas can be used to ascertain growth environment information (such as changes in temperature, salinity, or rainfall flux) by analyzing their oxygen isotopes or the element ratios in their shells [54,55]. In the future, indicator organisms such as Tridacna and coral could be used to infer ecological changes of ancient environments and observe changes in the offshore system over a longer time scale [56].
Due to methodological limitations, this study examined changes in phytoplankton groups through sediment inversion, which was less clear than high-frequency field observations, in terms of measuring species composition. High throughput sequencing can be used to reconstruct past states, dynamics, and ecosystem changes of the plankton in sediments, as well as interpret their ecosystem responses to environmental disturbances [57]. In the future, environmental chemistry methods and eDNA could be utilized for further research [58].
The ecological response of the phytoplankton in Sanmen Bay revealed that ocean changes at different temporal and spatial scales have complex impacts on offshore ecosystems. It is challenging to fully clarify the mechanisms of these events (ENSO, human activities, monsoon, etc.) under the coupling effect. Predicting the impact of future ocean warming on biogeochemical cycles critically depends on understanding how existing global temperature changes affect phytoplankton [59]. Future attention should focus on the evolution of phytoplankton adaptation mechanisms in response to short-term special events in the context of long-term changes in global warming and ocean acidification.

5. Conclusions

In this study, we conducted field observations and analyzed sediment biomarkers in Sanmen Bay to provide a long-term record of phytoplankton community structure and biomass. Our results showed that the phytoplankton community in Sanmen Bay responded significantly to interannual-scale temperature changes caused by ENSO events. El Niño years were associated with the highest phytoplankton biomass, primarily driven by an increase in diatoms and overall species richness due to the corresponding warming. In contrast, La Niña years resulted in a reduced phytoplankton biomass, but episodic blooms occurred due to increased mixing of seawater and terrestrial source input during winter monsoons. The bay area was strongly influenced by land–sea interaction and human activities, which, coupled with global climate change over a long-time scale, has led to a complex ecological response mechanism in the gulf ecosystem. As a high-production offshore ecosystem, this complexity poses challenges for future predictions. Due to the lack of high time-resolution methods, this study only focused on interannual-scale changes. In the future, greater attention should be given to the coupling effects of short-term extreme events and long-term trends, such as global warming and acidification.

Author Contributions

G.Z. and X.L. led the working group; L.C. and Z.X. collected and measured samples, and extracted data from publications for the database; G.Z., B.H. and J.Z. provided project support and undertook quality control of the database; Z.X. and L.C. wrote the first draft of the paper; Z.X. and X.L. ran analyses and produced figures and tables. All authors contributed equally to discussion of ideas, development of the database and analyses, in addition to commenting on the manuscript. All authors have read and agreed to the published version of the manuscript.

Funding

This study was supported by National Natural Science Foundation of China (Nos. 41776119; 42141002) and the National Key Research & Development Program “Key Processes of Nitrogen and Phosphorus Transport and Transformation and Ecosystem Response” (2021YFC3101702). Another part of the fund came from the Project supported by Southern Marine Science and Engineering Guangdong Laboratory (Zhuhai) (No. SML2021SP308).

Institutional Review Board Statement

Not applicable.

Informed Consent Statement

Not applicable.

Data Availability Statement

All data of the present study is available. Please contact Professor Liu ([email protected]) or Professor Zhu ([email protected]) if you have any questions.

Acknowledgments

The authors gratefully acknowledge Lizhen Lin, Feipeng Xu, and Jixin Chen for their efforts in data analysis.

Conflicts of Interest

The authors declare no conflict of interest. The funders had no role in the design of the study; in the collection, analyses, or interpretation of data; in the writing of the manuscript; nor in the decision to publish the results.

References

  1. Philander, S.G.; Fedorov, A. Is El Nino sporadic or cyclic? Annu. Rev. Earth Planet. Sci. 2003, 31, 579–594. [Google Scholar] [CrossRef] [Green Version]
  2. Trenberth, K.E.; Hoar, T.J. El Nino and climate change. Geophys. Res. Lett. 1997, 24, 3057–3060. [Google Scholar] [CrossRef]
  3. Yeh, S.W.; Kug, J.S.; Dewitte, B.; Kwon, M.H.; Kirtman, B.P.; Jin, F.F. El Niño in a changing climate. Nature 2009, 461, 511–514. [Google Scholar] [CrossRef] [PubMed]
  4. Righetti, D.; Vogt, M.; Gruber, N.; Psomas, A.; Zimmermann, N.E. Global pattern of phytoplankton diversity driven by temperature and environmental variability. Sci. Adv. 2019, 5, eaau6253. [Google Scholar] [CrossRef] [PubMed] [Green Version]
  5. Cloern, J.E. The relative importance of light and nutrient limitation of phytoplankton growth: A simple index of coastal ecosystem sensitivity to nutrient enrichment. Aquat. Ecol. 1999, 33, 3–15. [Google Scholar] [CrossRef]
  6. Barber, R.T.; Chavez, F.P. Biological consequences of El Niño. Science 1983, 222, 1203–1210. [Google Scholar] [CrossRef]
  7. Chavez, F.P.; Strutton, P.G.; Friederich, C.E.; Feely, R.A.; Feldman, G.C.; Foley, D.C.; McPhaden, M.J. Biological and chemical response of the equatorial Pacific Ocean to the 1997-98 El Nino. Science 1999, 286, 2126–2131. [Google Scholar] [CrossRef]
  8. Behrenfeld, M.J.; Randerson, J.T.; McClain, C.R.; Feldman, G.C.; Los, S.O.; Tucker, C.J.; Falkowski, P.G.; Field, C.B.; Frouin, R.; Esaias, W.E.; et al. Biospheric primary production during an ENSO transition. Science 2001, 291, 2594–2597. [Google Scholar] [CrossRef] [Green Version]
  9. Barber, R.T.; Chávez, F.P. Ocean variability in relation to living resources during the 1982–83 El Niño. Nature 1986, 319, 279–285. [Google Scholar] [CrossRef]
  10. Wang, R.; Wang, J.; Li, F.; Yang, S.; Tan, L. Vertical distribution and indications of lipids biomarkers in the sediment core from East China Sea. Cont. Shelf Res. 2016, 122, 43–50. [Google Scholar] [CrossRef]
  11. Cravo, A.; Pereira, C.; Gomes, T.; Cardoso, C.; Serafim, A.; Almeida, C.; Rocha, T.; Lopes, B.; Company, R.; Medeiros, A.; et al. A multibiomarker approach in the clam Ruditapes decussatus to assess the impact of pollution in the Ria Formosa lagoon, South Coast of Portugal. Mar. Environ. Res. 2012, 75, 23–34. [Google Scholar] [CrossRef] [PubMed]
  12. Ishiwatari, R.; Fujino, N.; Brincat, D.; Yamamoto, S.; Takahara, H.; Shichi, K.; Krivonogov, S.K. A 35 kyr record of organic matter composition and δ13C of n-alkanes in bog sediments close to Lake Baikal: Implications for paleoenvironmental studies. Org. Geochem. 2009, 40, 51–60. [Google Scholar] [CrossRef]
  13. Seki, O.; Ikehara, M.; Kawamura, K.; Nakatsuka, T.; Ohnishi, K.; Wakatsuchi, M.; Narita, H.; Sakamoto, T. Reconstruction of paleoproductivity in the sea of Okhotsk over the last 30 kyr. Paleoceanography 2004, 19, PA1016. [Google Scholar] [CrossRef] [Green Version]
  14. Schubert, C.J.; Villanueva, J.; Calvert, S.E.; Cowie, G.L.; von Rad, U.; Schulz, H.; Berner, U.; Erlenkeuser, H. Stable phytoplankton community structure in the Arabian Sea over the past 200,000 years. Nature 1998, 394, 563–566. [Google Scholar] [CrossRef]
  15. Barrett, S.M.; Volkman, J.K.; Dunstan, G.A.; LeRoi, J.-M. Sterols of 14 species of marine diatoms (bacillariophyta)1. J. Phycol. 1995, 31, 360–369. [Google Scholar] [CrossRef]
  16. Ding, Y.; Bi, R.; Sachs, J.; Chen, X.; Zhang, H.L.; Li, L.; Zhao, M.X. Lipid biomarker production by marine phytoplankton under different nutrient and temperature regimes. Org. Geochem. 2019, 131, 34–49. [Google Scholar] [CrossRef]
  17. Liu, X.Y.; Liu, Y.G.; Guo, L.; Rong, Z.R.; Gu, Y.Z.; Liu, Y.H. Interannual changes of sea level in the two regions of East China Sea and different responses to ENSO. Glob. Planet. Chang. 2010, 72, 215–226. [Google Scholar] [CrossRef]
  18. Xing, L.; Zhao, M.X.; Zhang, H.L.; Zhao, X.C.; Zhao, X.H.; Yang, Z.S.; Liu, C.L. Biomarker evidence for paleoenvironmental changes in the southern Yellow Sea over the last 8200 years. Chin. J. Oceanol. Limnol. 2012, 30, 1–11. [Google Scholar] [CrossRef]
  19. Jiang, Z.B.; Liu, J.J.; Chen, J.F.; Chen, Q.Z.; Yan, X.J.; Xuan, J.L.; Zeng, J.N. Responses of summer phytoplankton community to drastic environmental changes in the Changjiang (Yangtze River) estuary during the past 50 years. Water Res. 2014, 54, 1–11. [Google Scholar] [CrossRef]
  20. Chen, J.L.; Li, F.; He, X.P.; He, X.L.; Wang, J.T. Lipid biomarker as indicator for assessing the input of organic matters into sediments and evaluating phytoplankton evolution in upper water of the East China Sea. Ecol. Indic. 2019, 101, 380–387. [Google Scholar] [CrossRef]
  21. Xing, L.; Zhang, T.; Yu, M.; Duan, S.S.; Zhang, R.P.; Huh, C.A.; Liao, W.H.; Feng, X.W. Ecosystem responses to anthropogenic and natural forcing over the last 100 years in the coastal areas of the East China Sea. Holocene 2016, 26, 669–677. [Google Scholar] [CrossRef]
  22. Li, Y.; Lin, J.; Xu, X.P.; Liu, J.Z.; Zhou, Q.Z.; Wang, J.H. Multiple biomarkers for indicating changes of the organic matter source over the last decades in the Min-Zhe sediment zone, the East China Sea. Ecol. Indic. 2022, 139, 108917. [Google Scholar] [CrossRef]
  23. Xiao, W.P.; Liu, X.; Irwin, A.J.; Laws, E.A.; Wang, L.; Chen, B.Z.; Zeng, Y.; Huang, B.Q. Warming and eutrophication combine to restructure diatoms and dinoflagellates. Water Res. 2018, 128, 206–216. [Google Scholar] [CrossRef]
  24. Ma, W.T.; Chai, F.; Xiu, P.; Xue, H.J.; Tian, J. Modeling the long-term variability of phytoplankton functional groups and primary productivity in the South China Sea. J. Oceanogr. 2013, 69, 527–544. [Google Scholar] [CrossRef]
  25. Zhao, Y.; Yu, R.C.; Kong, F.Z.; Wei, C.J.; Liu, Z.; Geng, H.X.; Dai, L.; Zhou, Z.X.; Zhang, Q.C.; Zhou, M.J. Distribution patterns of picosized and nanosized phytoplankton assemblages in the East China Sea and the Yellow Sea: Implications on the impacts of Kuroshio intrusion. J. Geophys. Res. Oceans 2019, 124, 1262–1276. [Google Scholar] [CrossRef]
  26. Ye, F.; Guo, W.; Shi, Z.; Jia, G.D.; Wei, G.J. Seasonal dynamics of particulate organic matter and its response to flooding in the Pearl River Estuary, China, revealed by stable isotope (delta C-13 and delta N-15) analyses. J. Geophys. Res. Oceans 2017, 122, 6835–6856. [Google Scholar] [CrossRef]
  27. Zhou, H.Q.; Sun, Z.C.; Li, B.G.; Wu, X.Y.; Gong, M.; Yang, H. Distribution changes of suspended sediment concentration and its dynamic analysis in Xiangshan Bay, Zhejiang Province. Mar. Sci. Bull. 2014, 33, 694–702. (In Chinese) [Google Scholar]
  28. Zhejiang Provincial Coastal Zone and Sea Paint Resources Comprehensive Survey Report Preparation Committee. Comprehensive Survey Report on Coastal Zone and Sea Paint Resources of Zhejiang Province; Ocean Press: Beijing, China, 1985. [Google Scholar]
  29. Ning, X.R. Research and Evaluation of Culture Ecology and Culture Capacity in Yueqing Bay and Sanmen Bay; Ocean Press: Beijing, China, 2005; pp. 129–168. [Google Scholar]
  30. Chen, Y.; Liu, J.J.; Gao, Y.X.; Shou, L.; Liao, Y.B.; Huang, W.; Jiang, Z.B. Seasonal variation and the factors on net-phytoplankton in Sanmen Bay. Oceanol. Limnol. Sin. 2017, 48, 101–112. (In Chinese) [Google Scholar]
  31. Zhong, H.Y. Preliminary study on the phytoplankton of Jiantiao Bay of Zhejiang. J. Zhejiang Coll. Fish. 1990, 9, 126–130. (In Chinese) [Google Scholar]
  32. Zhu, G.H.; Chen, L.H.; Qian, J. A study on seasonal variation of phytoplankton in the sea near Sanmen nuclear power station. Environ. Sci. Technol. 2010, 33, 36–45. (In Chinese) [Google Scholar]
  33. Zeng, J.N. Comprehensive Survey Report on the Ecological Environment of Key Harbors and Bays in Zhejiang Province; Ocean Press: Beijing, China, 2011; pp. 195–198. [Google Scholar]
  34. Xie, C.Q.; Ai, W.M.; Peng, X.; Chen, S.B.; Xie, Q.L. Diversity and seasonal variation of phytoplankton in the sea near Sanmen nuclear power station. Bull. Sci. Technol. 2015, 31, 222–228. (In Chinese) [Google Scholar]
  35. Chen, D.Q.; Ye, R.; Wei, Y.J.; Yu, H.B.; Yang, Q.; Wang, Y.C.; Liao, Y.G. Correlation between phytoplankton community and environmental variables in Sanmen bay, East China Sea. Mar. Environ. Sci. 2017, 36, 70–86. (In Chinese) [Google Scholar]
  36. Hernandez-de-la-Torre, B.; Gaxiola-Castro, G.; Alvarez-Borrego, S.; Gomez-Valdes, J.; Najera-Martinez, S. Interannual variability of new production in the southern region of the California Current. Deep Sea Res. Part II 2003, 50, 2423–2430. [Google Scholar] [CrossRef]
  37. Rittenour, T.M.; Brigham-Grette, J.; Mann, M.E. El Nino-like climate teleconnections in New England during the late Pleistocene. Science 2000, 288, 1039–1042. [Google Scholar] [CrossRef]
  38. Behrenfeld, M.J.; O’Malley, R.T.; Siegel, D.A.; McClain, C.R.; Sarmiento, J.L.; Feldman, G.C.; Milligan, A.J.; Falkowski, P.G.; Letelier, R.M.; Boss, E.S. Climate-driven trends in contemporary ocean productivity. Nature 2006, 444, 752–755. [Google Scholar] [CrossRef] [PubMed]
  39. Wolter, K.; Timlin, M.S. El Nino/Southern Oscillation behaviour since 1871 as diagnosed in an extended multivariate ENSO index (MEI.ext). Int. J. Climatol. 2011, 31, 1074–1087. [Google Scholar] [CrossRef]
  40. Bolton, C.T.; Lawrence, K.T.; Gibbs, S.J.; Wilson, P.A.; Cleaveland, L.C.; Herbert, T.D. Glacial–interglacial productivity changes recorded by alkenones and microfossils in late Pliocene eastern equatorial Pacific and Atlantic upwelling zones. Earth Planet. Sci. Lett. 2010, 295, 401–411. [Google Scholar] [CrossRef]
  41. Prahl, F.G.; Muehlhausen, L.A.; Zahnle, D.L. Further evaluation of long-chain alkenones as indicators of paleoceanographic conditions. Geochim. Cosmochim. Acta 1988, 52, 2303–2310. [Google Scholar] [CrossRef]
  42. Volkman, J.K.; Barrerr, S.M.; Blackburn, S.I.; Sikes, E.L. Alkenones in Gephyrocapsa oceanica: Implications for studies of paleoclimate. Geochim. Cosmochim. Acta 1995, 59, 513–520. [Google Scholar] [CrossRef]
  43. Kao, H.Y.; Yu, J.Y. Contrasting eastern-Pacific and central-Pacific types of ENSO. J. Clim. 2009, 22, 615–632. [Google Scholar] [CrossRef]
  44. Palmeiro, F.M.; Iza, M.; Barriopedro, D.; Calvo, N.; García-Herrera, R. The complex behavior of El Niño winter 2015–2016. Geophys. Res. Lett. 2017, 44, 2902–2910. [Google Scholar] [CrossRef] [Green Version]
  45. Chen, W.; Ding, S.Y.; Feng, J.; Chen, S.F.; Xue, X.; Zhou, Q. Progress in the study of impacts of different types of ENSO on the East Asian monsoon and their mechanisms. Chinese J. Atmos. Sci. 2018, 42, 640–655. (In Chinese) [Google Scholar]
  46. Song, W.L.; Yuan, Y. Uncertainty analvsis of climate prediction for the 2015/2016 winter under the backaround of super El Niño event. Meteorol. Mon. 2017, 43, 1249–1258. (In Chinese) [Google Scholar]
  47. Tian, F.; Zhang, R.H.; Wang, X. Indian Ocean warming as a potential trigger for super phytoplankton blooms in the eastern equatorial Pacific from El Niño to La Niña transitions. Environ. Res. Lett. 2021, 16, 054040. [Google Scholar] [CrossRef]
  48. Signorini, S.R.; Murtugudde, R.G.; McClain, C.R.; Christian, J.R.; Picaut, J.; Busalacchi, A.J. Biological and physical signatures in the tropical and subtropical Atlantic. J. Geophys. Res. Oceans 1999, 104, 18367–18382. [Google Scholar] [CrossRef] [Green Version]
  49. Chen, H.Y.; Xu, F.; Li, X.H.; Xia, T.Z.; Zhang, Y. Intensities and time-frequency variability of ENSO in the last 65 years. J. Trop. Meteorol. 2017, 33, 683–694. (In Chinese) [Google Scholar]
  50. Zhou, Z.X.; Yu, R.C.; Zhou, M.J. Resolving the complex relationship between harmful algal blooms and environmental factors in the coastal waters adjacent to the Changjiang River estuary. Harmful Algae 2017, 62, 60–72. [Google Scholar] [CrossRef]
  51. Li, L.; Li, Q.Y.; He, J.; Wang, H.; Ruan, Y.M.; Li, J.R. Biomarker-derived phytoplankton community for summer monsoon reconstruction in the western South China Sea over the past 450 ka. Deep Sea Res. Part II 2015, 122, 118–130. [Google Scholar] [CrossRef]
  52. Zhang, H.S.; Lu, D.D.; Zhu, X.Y.; Lu, B.; Gao, A.G.; Wu, G.H. Stratigraphic record of U37K in Sanmen Bay: The effect of SST and EI Niño on life activity in macrobenthos communities. Acta Ecol. Sin. 2007, 27, 4935–4943. [Google Scholar] [CrossRef]
  53. Cui, M.C.; Hu, D.X.; Wu, L.J. Seasonal and intraseasonal variations of the surface Taiwan warm current. Chin. J. Oceanol. Limnol. 2004, 22, 271–277. [Google Scholar]
  54. Yan, H.; Shao, D.; Wang, Y.H.; Sun, L.G. Sr/Ca profile of long-lived Tridacna gigas bivalves from South China Sea: A new high-resolution SST proxy. Geochim. Cosmochim. Acta 2013, 112, 52–65. [Google Scholar] [CrossRef]
  55. Poulain, C.; Gillikin, D.P.; Thébault, J.; Munaron, J.M.; Bohn, M.; Robert, R.; Paulet, Y.-M.; Lorrain, A. An evaluation of Mg/Ca, Sr/Ca, and Ba/Ca ratios as environmental proxies in aragonite bivalve shells. Chem. Geol. 2015, 396, 42–50. [Google Scholar] [CrossRef] [Green Version]
  56. Corrège, T. Sea surface temperature and salinity reconstruction from coral geochemical tracers. Palaeogeogr. Palaeoclimatol. Palaeoecol. 2006, 232, 408–428. [Google Scholar] [CrossRef]
  57. Ibrahim, A.; Capo, E.; Wessels, M.; Martin, I.; Meyer, A.; Schleheck, D.; Epp, L.S. Anthropogenic impact on the historical phytoplankton community of lake constance reconstructed by multimarker analysis of sediment-core environmental DNA. Mol. Ecol. 2021, 30, 3040–3056. [Google Scholar] [CrossRef]
  58. Domaizon, I.; Winegardner, A.; Capo, E.; Gauthier, J.; Gregory-Eaves, I. DNA-based methods in paleolimnology: New opportunities for investigating long-term dynamics of lacustrine biodiversity. J. Paleolimnol. 2017, 58, 1–21. [Google Scholar] [CrossRef]
  59. Thomas, M.K.; Kremer, C.T.; Klausmeier, C.A.; Litchman, E. A global pattern of thermal adaptation in marine phytoplankton. Science 2012, 338, 1085–1088. [Google Scholar] [CrossRef] [PubMed] [Green Version]
Figure 1. Location of Sampling stations in Sanmen Bay (red, grid station; blue, time serials station; green, sediment sampling station).
Water 15 01255 g001
Figure 2. Spatial and temporal distribution of phytoplankton abundance in Sanmen Bay in 2016.
Water 15 01255 g002
Figure 3. Linear relationship between phytoplankton biomarker and zooplankton biomarker concentrations (SUM = brassicasterol + dinosterol + C37 alkenones).
Water 15 01255 g003
Figure 4. Changes in plankton biomarker concentrations and ratios of brassicasterol to dinosterol from 1822 to 2015 (Red, El Niño years; blue, La Niña years; gray, normal years).
Water 15 01255 g004
Figure 5. Fit of different plankton biomarker concentration and Niño 3.4 index anomaly from 1822 to 2015 (gray, 95% confidence interval).
Water 15 01255 g005
Table 1. Location parameters of phytoplankton net sampling stations in Sanmen Bay from 2016 to 2017.
StationLatitude (°N)Longitude (°E)TypeSample Number
SpringSummerAutumnWinter
S129.130121.579Grid station1212
S429.124121.625Grid station1212
S629.155121.664Grid station1212
S829.117121.653Grid station1212
S929.122121.659Grid station1212
S1129.112121.662Grid station1212
S1229.096121.656Grid station1212
S1329.102121.663Grid station1212
S1429.108121.672Grid station1212
S1629.093121.672Grid station1212
S1829.086121.686Grid station1212
S1929.111121.717Grid station1212
S2129.039121.704Grid station1212
S2529.034121.785Grid station1212
A29.109121.651Time serials station918918
Notes: The water depth of the sampling station is 3.8–31 m. The six expeditions were carried out in January (twice), April, July (twice) and October respectively.
Table 2. Historical phytoplankton data from Sanmen Bay.
DateENSOPhytoplankton Abundance (Cells m−3)Dominant SpeciesReferences
SpringSummerAutumnWinter
December 1981, May 1982,
July 1982, October 1982
EI Niño–EP3.35 × 1051.04 × 1063.93 × 1052.34 × 108Coscinodiscus spp, Skeletonema spp., Ditylun brightwelli, Chaetoceros spp.[28]
August 2002, November 2002, February 2003, May2003EI Niño–CP7.88 × 1061.52 × 1099.11 × 1061.60 × 107Calanus sinicus, Labidocera euchaeta, Tortanus derjugini,
Acartia clause, Pseudeuphausia sinica,
Zonosagitta bedoti, Zonosagitta nagae
[29]
May 2015, August 2015, November 2015, January 2016EI Niño–CP–EP
(mixed)
5.31 × 1055.55 × 1077.81 × 1065.81 × 106Coscinodiscus jonesianus, Thalassionema frauenfeldii, Skeletonema spp., Chaetoceros pseudocurvisetus[30]
February 1985, August 1985, December 1985, February 1986La Niña–EP2.15 × 1051.50 × 1055.14 × 1042.40 × 108Chaetoceros danicus, Coscinodiscus jonesianus, Coscinodiscus spinosus, Coscinodiscus asterromphalus, Skeletonema costatum[31]
April 2005,
July 2005, October 2005, January 2006
Normal1.63 × 1072.51 × 1064.72 × 1071.27 × 108Skeletonema costatum, Coscinodiscus jonesianus, Chaetoceros affinis, Melosira discigera, Ceratium furca, Planktoniella sol[32]
October 2006, January 2007, April 2007,
July 2007
Normal1.30 × 1068.30 × 1061.59 × 1061.44 × 106Coscinodiscus jonesianus, Skeletonema spp.,
Paralia sulcata, Tripos muelleri
[33]
February 2012, May 2012, August 2012,
November 2012
Normal2.97 × 1053.72 × 1061.77 × 1051.43 × 105Skeletonema costatum, Biddulphia sinensis,
Coscinodiscus oculus-iridis, Coscinodiscus jonesianus
[34]
May 2014, August 2014Normal2.20 × 1051.88. × 106--Coscinodiscus jonesianus, Coscinodiscus oculus-iridis,
Skeletonema costatum, Nitzschia lorenziana,
Coscinodiscus centralis, Ditylun brightwellii
[35]
Table 3. Geological age of Sanmen Bay sedimentary column sample H30 measured by 210Pb.
Sediment Depth
(cm)
Radioactive Specific Activity
(dpm/g)
YearNiño 3.4 Index
(°C)
0~0.5Based on sampling time20151.47
0~0.5Based on sampling time20050.04
0~0.5Based on sampling time20020.59
0~0.5Based on sampling time19971.19
0~0.52.95 ± 0.131995−0.03
11~11.53.96 ± 0.2519820.92
15.0~15.52.12 ± 0.091978−0.18
19.0~19.52.44 ± 0.121974−0.95
30.0~30.53.15 ± 0.141961−0.19
40.0~40.52.87 ± 0.141950−1.06
50.0~50.51.49 ± 0.061939−0.19
70.0~70.52.17 ± 0.121917−0.42
90.0~90.51.24 ± 0.051894−0.92
110.0~110.51.27 ± 0.051872−0.71
135.0~135.51.12 ± 0.051844-
155.0~155.51.00 ± 0.051822-
Disclaimer/Publisher’s Note: The statements, opinions and data contained in all publications are solely those of the individual author(s) and contributor(s) and not of MDPI and/or the editor(s). MDPI and/or the editor(s) disclaim responsibility for any injury to people or property resulting from any ideas, methods, instructions or products referred to in the content.

