Article

Estimation of Aquifer Storativity Using 3D Geological Modeling and the Spatial Random Bagging Simulation Method: The Saskatchewan River Basin Case Study (Central Canada)

CARTEL—Centre d’Applications et de Recherches en Télédétection, Département de Géomatique Appliquée, Université de Sherbrooke, Québec, QC J1K 2R1, Canada
*
Author to whom correspondence should be addressed.
Water 2023, 15(6), 1156; https://doi.org/10.3390/w15061156
Submission received: 3 March 2023 / Revised: 13 March 2023 / Accepted: 14 March 2023 / Published: 16 March 2023
(This article belongs to the Section Hydrogeology)

Abstract

:
Hydrosystems in the Saskatchewan River Basin of the Canadian Prairies are subject to natural and socioeconomic pressures. Increasingly, these strong pressures are exacerbating problems of water resource accessibility and depletion. Unfortunately, the geometric heterogeneity of the aquifers and the presence of lithologically varied layers complicate groundwater flow studies, hydrodynamic characterization, and aquifer storativity calculations. Moreover, in recent hydrogeological studies, hydraulic conductivity has been the subject of much more research than storativity. It is in this context that the present research was conducted, to establish a 3D hydrostratigraphic model that highlights the geological (lithology, thickness, and depth) and hydrodynamic characteristics of the aquifer formations and proposes a new uncertainty framework for groundwater storage estimation. The general methodology is based on collecting and processing a very fragmentary and diverse multi-source database to develop the conceptual model. Data were harmonized and entered into a common database management system. A large quantity of geological information has been implemented in a 3D hydrostratigraphic model to establish the finest geometry of the SRB aquifers. Then, the different sources of uncertainty were controlled and considered in the modeling process by developing a randomized modeling system based on spatial random bagging simulation (SRBS). The results of the research show the following: Firstly, the distribution of aquifer levels is controlled by tectonic activity and erosion, which further suggests that most buried valleys on the Prairies have filled over time, likely during multiple glaciations in several depositional environments. Secondly, the geostatistical study allowed us to choose optimal interpolation variographic parameters. Finally, the final storativity maps of the different aquifer formations showed a huge potential of groundwater in SRB. The SRBS method allowed us to calculate the optimal storativity values for each mesh and to obtain a final storativity map for each formation. For example, for the Paskapoo Formation, the distribution grid of groundwater storage shows that the east part of the aquifer can store up to 5920 × 103 m3/voxel, whereas most areas of the west aquifer part can only store less than 750 × 103 m3/voxel. The maximum storativity was attributed to the Horseshoe Canyon Formation, which contains maximal geological reserves ranging from 107 to 111 × 109 m3. The main contribution of this research is the proposed 3D geological model with hydrogeological insights into the study area, as well as the use of a new statistical method to propagate the uncertainty over the modeling domain. The next step will focus on the hydrodynamic modeling of groundwater flow to better manage water resources in the Saskatchewan River Basin.

1. Introduction

Recent hydrogeological research confirms that groundwater depletion is the most common problem affecting water supplies in many arid to semi-arid regions worldwide [1,2,3,4,5,6,7,8]. Indeed, climate change is causing water scarcity in many regions due to irregular or declining rainfall, rising water levels, flooding, prolonged drought, changes in the water cycle, and other mechanisms that are dependent upon it [9]. These situations result in scarce and irregular surface runoff in different regions. Groundwater then becomes the main available water resource that can be exploited. Unfortunately, these water sources are often characterized by low turnover rates and are highly sensitive to climate change [10,11,12].
The depletion of water resources has been the subject of several hydrogeological studies, which have demonstrated that the status of the resource depends mainly upon the internal architecture of aquifers, precipitation, and exploitation [13,14,15,16]. Therefore, it becomes essential to understand the processes and phenomena controlling the response of aquifer systems, which are increasingly exposed to global change. From this perspective, several hydrogeological approaches have been used to simulate the mechanisms and predict the dynamics of groundwater.
For example, it has been shown that the geometry of aquifer systems largely determines the variability of groundwater stocks [5,17,18,19]. Nevertheless, the geometric heterogeneity of aquifers and the presence of various lithologic layers complicate the understanding of hydrodynamic processes, as well as the development of aquifer-specific conceptual models. This situation makes it difficult to predict the response of these systems to external forces as well as estimate the available reserves [20].
Conceptual models are fundamental elements in hydrogeological studies, given that they bring together a set of assumptions, including aquifer geometry, hydraulic properties, and conditioning and processes in hydrogeological problems [21,22]. The development of conceptual hydrogeological models relies heavily upon the interpretation of existing data. Thus, it is possible that several different conceptual models could be proposed to explain the same phenomena. A further drawback is that ambiguities may arise, especially when the data are non-homogeneous or fragmentary, thereby generating uncertainties in the validity of these models [23,24,25,26].
In this context, new technologies, particularly mathematical modeling, provide useful tools to facilitate filling in missing data and providing quality control of hydrogeological information, the construction of hydrogeological models, and the understanding and conceptualization of complex aquifer systems [22,27,28,29,30,31,32]. Hydrogeological conceptualization is a way of simplifying the reality of environments while contributing to improving our understanding of the functioning of an aquifer system, together with estimating its storage capacity and the spatial distribution of its reserves.
Nowadays, hydrogeologists have resorted to the development of mathematical models to understand the functioning of subsurface systems, including 3D geological models. Indeed, geological modeling is a very good tool for representing the architecture of subsurface layers. It allows an understanding of the shapes, the functioning, and the relationships between different geological layers. By definition, a 3D geological model constitutes a passage from 2D geo-structural maps to a 3D representation of stratigraphic layers and their sedimentary arrangement. Traditionally, the results of geological studies and geophysical data collection are presented in 2D geological maps and cross-sections. However, for a better understanding of hydrogeological processes and the calculation of reserves, a 3D representation of the subsurface geometry, with hydrodynamic characteristics, is required. The importance of a 3D geological model lies in the fact that it allows us to interpret the variations in the thickness of the geological layers and the spacing of the sedimentary units. This variability has a great impact on the hydrodynamic functioning of aquifers and the circulation of water between the different saturated layers. More precisely, geological models are the best tool to visualize the arrangement of geological layers.
Geological modeling is a delicate work that requires a lot of verification and validation. Many geologists use geostatistical tools to properly select the appropriate type of interpolation and capture the heterogeneity of geological layers and the complexity of their arrangements. For example, [33] used the kriging technique to predict the vertical and horizontal distribution and overall geometry of each stratigraphic unit at the Canadian level. Due to the large differences in the spatial extent of the stratigraphic units, it was necessary to produce modeled surfaces for the top and base of each unit. In this study, the authors have shown the importance of variographic analysis in the validation of the 3D geological model.
Additionally, in Italy, Ref. [34] constructed a geological model for an archaeological site to establish a conceptual model for the area of the colosseum (Rome, Italy). Geostatistical techniques were used in their study to properly select the type of interpolation. The resulting conceptual model was used to identify the main gaps in existing knowledge about the groundwater system and optimize the planning of a piezometric monitoring network. In addition, Ref. [35] used data from 300 hydraulic boreholes to set up a 3D geological model in the subalpine basin in Italy. The resulting model represents the complexity of the fluvioglacial stratigraphy and hydrogeological units in the study area and demonstrates the retarding effect that glacial terraces can have on flood wave propagation in aquifers. It allows the assessment of total groundwater volume and areas of low conductivity. These findings are common to many areas around the world, and here, we can cite the example of the Saskatchewan River Basin (SRB) in central Canada, which is subject to the dual actions of climate change and anthropogenic activities.
The SRB is located in central Canada and is of great importance in the Canadian Prairies, which is a semi-arid region where the water that is available in aquifers is under enormous pressure [36]. This pressure is incurred not only by high domestic, agricultural, and industrial demands but also by the adverse effects of ongoing climate change [37]. The SRB is a complex system due to its great expanse, the complexity of its geology, and the challenges that are inherent in vast and remote areas to estimating exchanges with the surrounding environment, including recharge and pumping. This is especially true given that access to water becomes increasingly difficult to control, both in the agricultural and drinking water supply sectors [36]. To address overexploitation due to unplanned access, priority research in the SRB is required to increase our knowledge of water resources and to establish future water management models.
Therefore, the main objective of this research is to construct a significant 3D geological model and propose a new integrated uncertainty calculation framework for groundwater storage appraisal of the SRB.
Our approach to achieving this objective was based upon the following steps: (i) the collection of geological and hydrogeological data that were available from numerous agencies within each of the three provinces constituting the Canadian Prairies and which are covered by the basin (Alberta, Saskatchewan, and Manitoba), (ii) the proposal of a global hydrogeological 3D geological model for the SRB, and (iii) an uncertainty assessment by developing a randomized modeling system based on spatial random bagging simulation (SRBS) and groundwater storage calculation.

2. Study Area and Database

2.1. Location, Physiography, and Climate

The SRB is one of the largest drainage basins in central Canada, spanning the provinces of Alberta, Manitoba, and Saskatchewan. Located between latitudes 53° and 56° and longitudes −114° and −98°, it drains a watershed of about 406,000 km2 (Figure 1a). Topographic relief of the SRB ranges from 218 m to 3487 m above sea level. The source of the basin is the Eastern Slopes of the Canadian Rockies in Alberta, which includes portions of the Columbia Icefield. The two main tributaries of the SRB are the South and North Saskatchewan Rivers, both of which flow east and northeast across the Saskatchewan Prairies before merging to form the Saskatchewan River, which flows through the Saskatchewan Delta (the largest inland freshwater delta in North America) before emptying into Lake Winnipeg (Manitoba). Readers may wish to consult [38,39] for further details.
Extensive landforms in the southwestern portion of the basin act as barriers that divert stormwater runoff into the North Saskatchewan and South Saskatchewan Rivers. Other water resources in the basin are derived locally as meltwater from icefields perched astride the Continental Divide in Banff and Jasper National Parks (i.e., Columbia Icefields). Water from the basin flows northeastward through the foothills, passing through boreal forest and parkland natural regions on its way to Saskatchewan. Some of this water is stored in Lake Abraham and detained behind the Bighorn and Brazeau dams. The remaining runoff flows into Lake Winnipeg, which eventually drains into Hudson Bay by way of the Nelson River. In the headwaters and foothills, major floods in the basin are closely related to heavy precipitation events. In contrast, flooding on the plains is primarily related to rapid runoff from snowmelt. The largest recorded flood in the northern portion of the SRB occurred in late June 1915, primarily affecting floodplain communities in and around the city of Edmonton.
The average annual precipitation in the SRB is about 437 mm/year. Temperatures have an interannual average of about 2.9 °C, with a maximum in July (16.7 °C) and a minimum in January (−12.4 °C) (Figure 1b). They exhibit significant variations between the coldest month of the winter season (January) and the warmest month of the summer growing season. Estimated potential evapotranspiration (PET) varies from 494 mm/year to 559 mm/year. The lowest values of potential evapotranspiration are typically recorded in the northeastern portion of the SRB, while the highest values are recorded in the southwestern part of the basin. Consequently, the northern portion of the basin exhibits a temperate continental climate in the center and east, changing to a semi-arid steppe climate in the south and southwest.

2.2. Geology and Hydrogeology

On a regional scale, the SRB is part of the Interior Platform domain. Most of the outcropping series in this domain are Cretaceous in age. Cretaceous series are overlain in places by recent Quaternary deposits. The basin is limited by natural structural zones and by different geometries. It is bound on the southwest by the Cordilleran Orogeny, which formed the Rocky Mountains. The mountains are affected by multi-kilometer faults and are characterized by folded structures and a thrust zone. The Bear, Slave, and Churchill regions delimit the Interior Platform domain on the northeast side. These regions are characterized by folding and basin zones, which are bound by normal faults. On the eastern side, the basin is bound by volcanic zones.
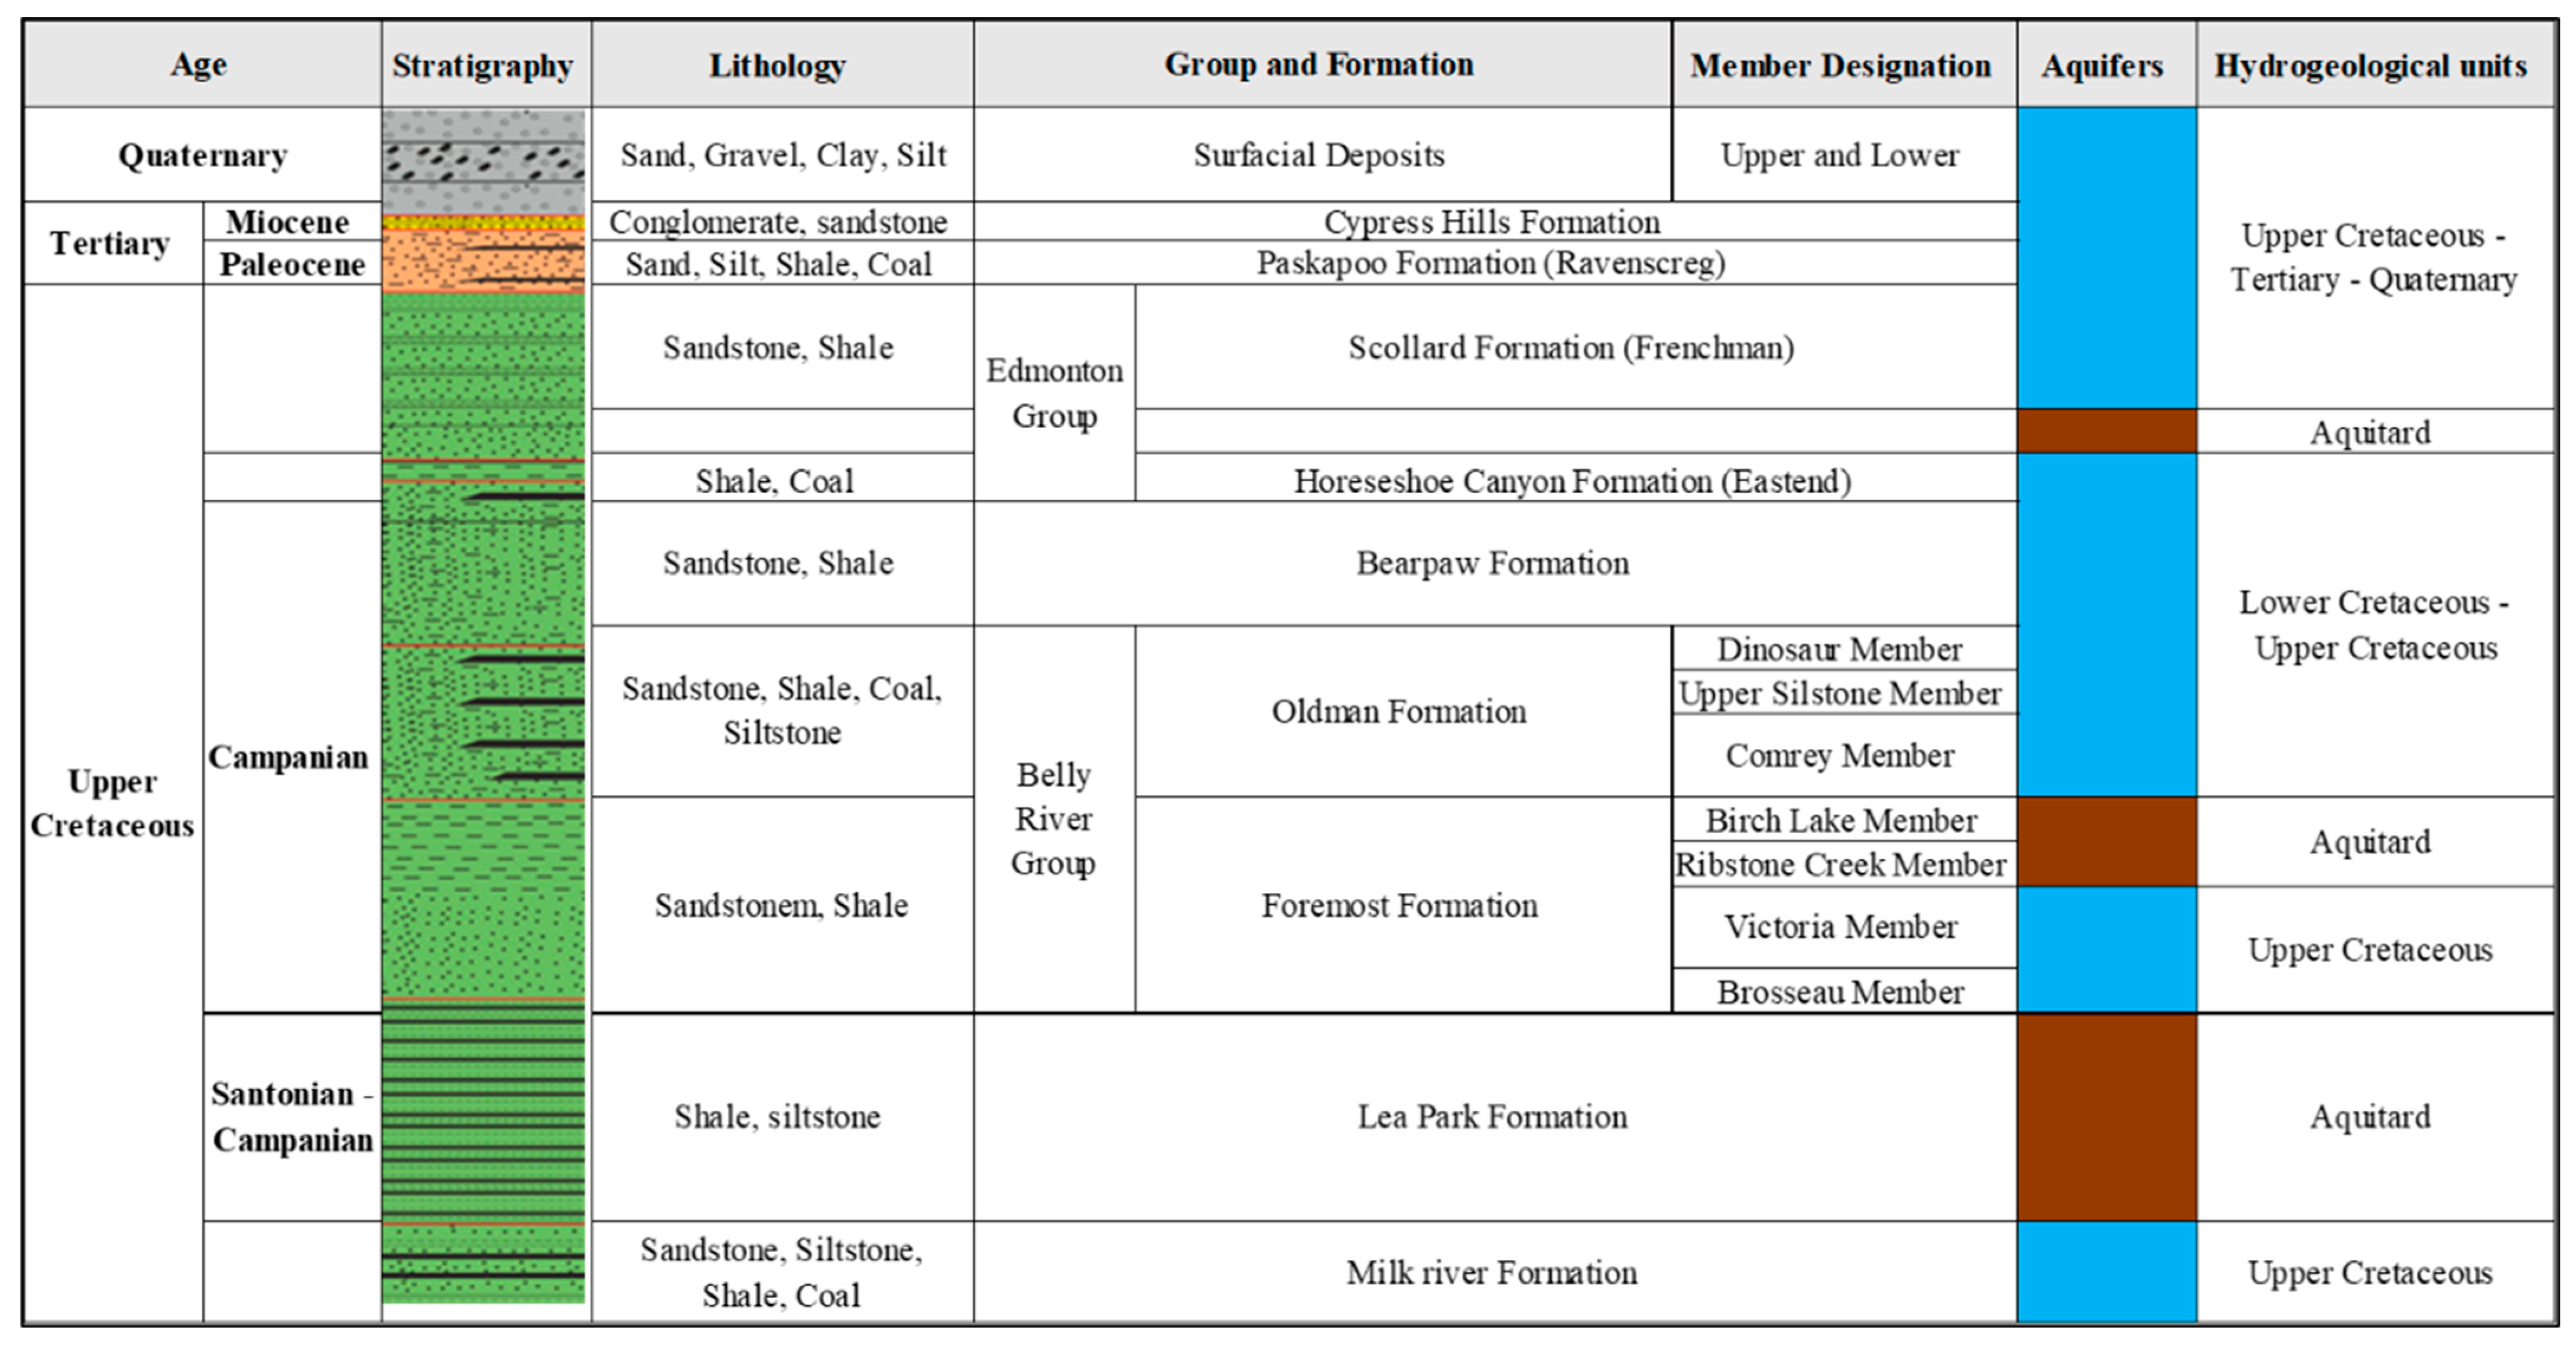
The stratigraphic column for the Saskatchewan Basin (Figure 2) shows extensive Upper Cretaceous outcrops. These extend across the entire Interior Platform domain. The Lower Cretaceous series extends to the edges of the basin, forming a halo. The Upper Cretaceous includes series that are formed mainly by deposits of sands, shales, coal, and clays. The most recent series form outcrops in the southwestern portion of the basin. These Upper Cretaceous series are Campanian in age. They are spatially discontinuous and include Paleocene, Miocene, and Quaternary series.

2.3. Geological, Hydrogeological, and Hydrodynamic Databases

To achieve better characterization of aquifers, it is essential to understand the different hydrogeological components to determine their quantitative and qualitative contexts. This understanding is achieved from information gathered at the regional to the local scale. Similarly, temporal scales must be considered in hydrogeological and geochemical processes. To successfully predict the behavior of a hydrological system, one must be able to translate information between different spatiotemporal scales.
Geological, hydrodynamic, piezometric, and water quality data (i.e., hydrogeological data) are essential for conceptual model development. In the case of the SRB, which is the subject of this study, these data have been acquired over several decades by various agencies, including geological surveys, municipalities, consulting or engineering firms, and university researchers (Table 1). Before interpreting the data, several steps must be taken given that the data originate from a variety of sources that are located across the three Prairie Provinces (Alberta, Saskatchewan, and Manitoba) and from the federal government of Canada. Consequently, the data acquisition protocols are harmonized neither in space nor in time. Furthermore, stations in the monitoring network may vary from one campaign to another; similarly, measurement dates are not necessarily controlled or well archived. In a preliminary first step, we proceeded to collect and archive all available hydrogeological data from different agencies, as indicated in Table 1 (Government of Canada, historical climate data; Natural Resources Canada; Alberta Water Well Information Database; Water Security Agency, Saskatchewan; The Groundwater Management Section, Manitoba, etc.). In the second step, we verified, checked, and harmonized the data.
After harmonizing the collected data, all of the information was stored in a geo-database in ArcGIS Version 10.6. In this study, special attention was devoted to the data that were collected from hydraulic boreholes: geographical location, results of pumping tests (pumping and recovery phase for estimation of transmissivity and storage capacity of the aquifers), hydraulic conductivity of the aquifers, lithological and stratigraphic descriptions of the aquifers that were obtained from good logs, and surface and borehole geophysical investigations. Figure 1a shows the locations of the hydraulic boreholes that were used in this study, and Table 1 summarizes several different parameters that were entered into the spatial database, which was used to construct and interpret the 3D geological model.

3. Methods

The general methodology that has been adopted is described in the flow chart presented in Figure 3. The work that was conducted in this article can be summarized in three main steps.
The first step concerns a bibliographic study of the geology and hydrogeology of the SRB. The various data that were collected were entered in the form of an integrated information system, which allowed us to reconstitute them in various forms (tables, graphs, and thematic maps, among others) or other computer files that could be utilized by the various numerical models being used. Many geological correlations of drilling logs were conducted, and geological sections were established. Each hydrogeological formation was subsequently characterized hydrodynamically, particularly by determining its transmissivity (T, m2/day) and hydraulic conductivity (K, m/s).
In the second step, a 3D geological model was created and validated. This model was constructed from the harmonized multi-source database by applying several approaches, i.e., local geology, geophysics, and structural geology, among others. Before constructing the 3D geological model, a variographic study was conducted to choose the best method of horizon interpolation.
Finally, an uncertainty assessment by developing a randomized modeling system based on spatial random bagging simulation (SRBS) was tested and validated, and groundwater storage was calculated based on this SRBS.

3.1. Three-Dimensional Geological Modeling of the SRB Basin

To develop this fine-grained geological study of the SRB, we had to schematize geological cross-sections that have already been made for the provinces of Alberta [54,60,61,62,63,64,65,66], Saskatchewan [67,68], and Manitoba [22].
The 3D geological model of the SRB was built using the Rock Works 15 interface. This software contains two very important tabs: borehole manager and utilities. In this work, the borehole manager was used for borehole data management and analysis, mapping, meshing, and solid geo-modeling. Given the huge amount of borehole data consulted (2780 boreholes), a Python code was designed and implemented to select the most representative boreholes in terms of variations in the thickness of stratigraphic formations. For more details on this process, please see [69]. This code allowed us to select a total of 61 hydraulic boreholes and 10 oil boreholes that were integrated to build the 3D geological solid model (Figure 4a).
To realize the 3D solid model, the stratigraphic model lateral mixing algorithm was used to interpolate the different geological units horizontally and vertically (Figure 4b). The conditions that were respected are the discretization of the stratigraphic units and the continuity of the geological environment. Indeed, the conceptual models established have been respected in terms of the shape of the units and their architectures and in terms of color. Furthermore, the studied environment was assumed to be anisotropic, homogeneous, and continuous. Before the interpolation task, a variographic analysis was performed using the same Rock Works software.
The correlation coefficient was used to evaluate the correspondence between the theoretical mathematical model of the variogram and the geological data, which reflects information on the reliability of the estimate. This parameter’s value is between 1 and −1. The correlation is said to be perfectly negative if the value of this indicator is equal to −1, and it is perfectly positive if the value is equal to 1. The absence of a correlation between the regionalized variables (the data points) and the variographic model is expressed by a zero value of this statistical parameter, which confirms that the adjusted mathematical model does not present the phenomenon under study.
The behavior at the origin of the variogram reflects the degree of spatial regularity of the regionalized variable studied. The nugget effect is the discontinuity of the variogram at the origin (γ (h) ≠ 0 when h = 0), which indicates weak autocorrelation between observations sampled at two closely spaced sites. The nugget effect value is the intercept of the variogram function at an offset distance of almost zero. This discontinuity corresponds to a very local variability of the studied phenomenon (variation of geological and sedimentary context, measurement errors, etc.); a high equidistance between the regionalized variables could, for example, induce a discontinuity at the origin by masking the structure of a possible local variation of geological processes [70].
Finally, the 3D geological model grid was created. The size of the grid was an option used to establish the number of nodes that will be created in the model and the coordinate boundary of the model. The dimensions of the model were adjusted according to the spacing of the selected boreholes, the area of the study zone, and the depth of the lithological logs. In total, there were 43 horizontal nodes with an X-spacing of 25,000 m; 28 vertical nodes with a Y-spacing of 25,000 m; and 39 nodes with a Z-spacing of 50 m. This fit was considered sufficient to illustrate the variations in the thickness of the stratigraphic formations. The number of nodes was 1204 nodes per layer, for a total of 46,956 nodes in the whole model with 39 layers.
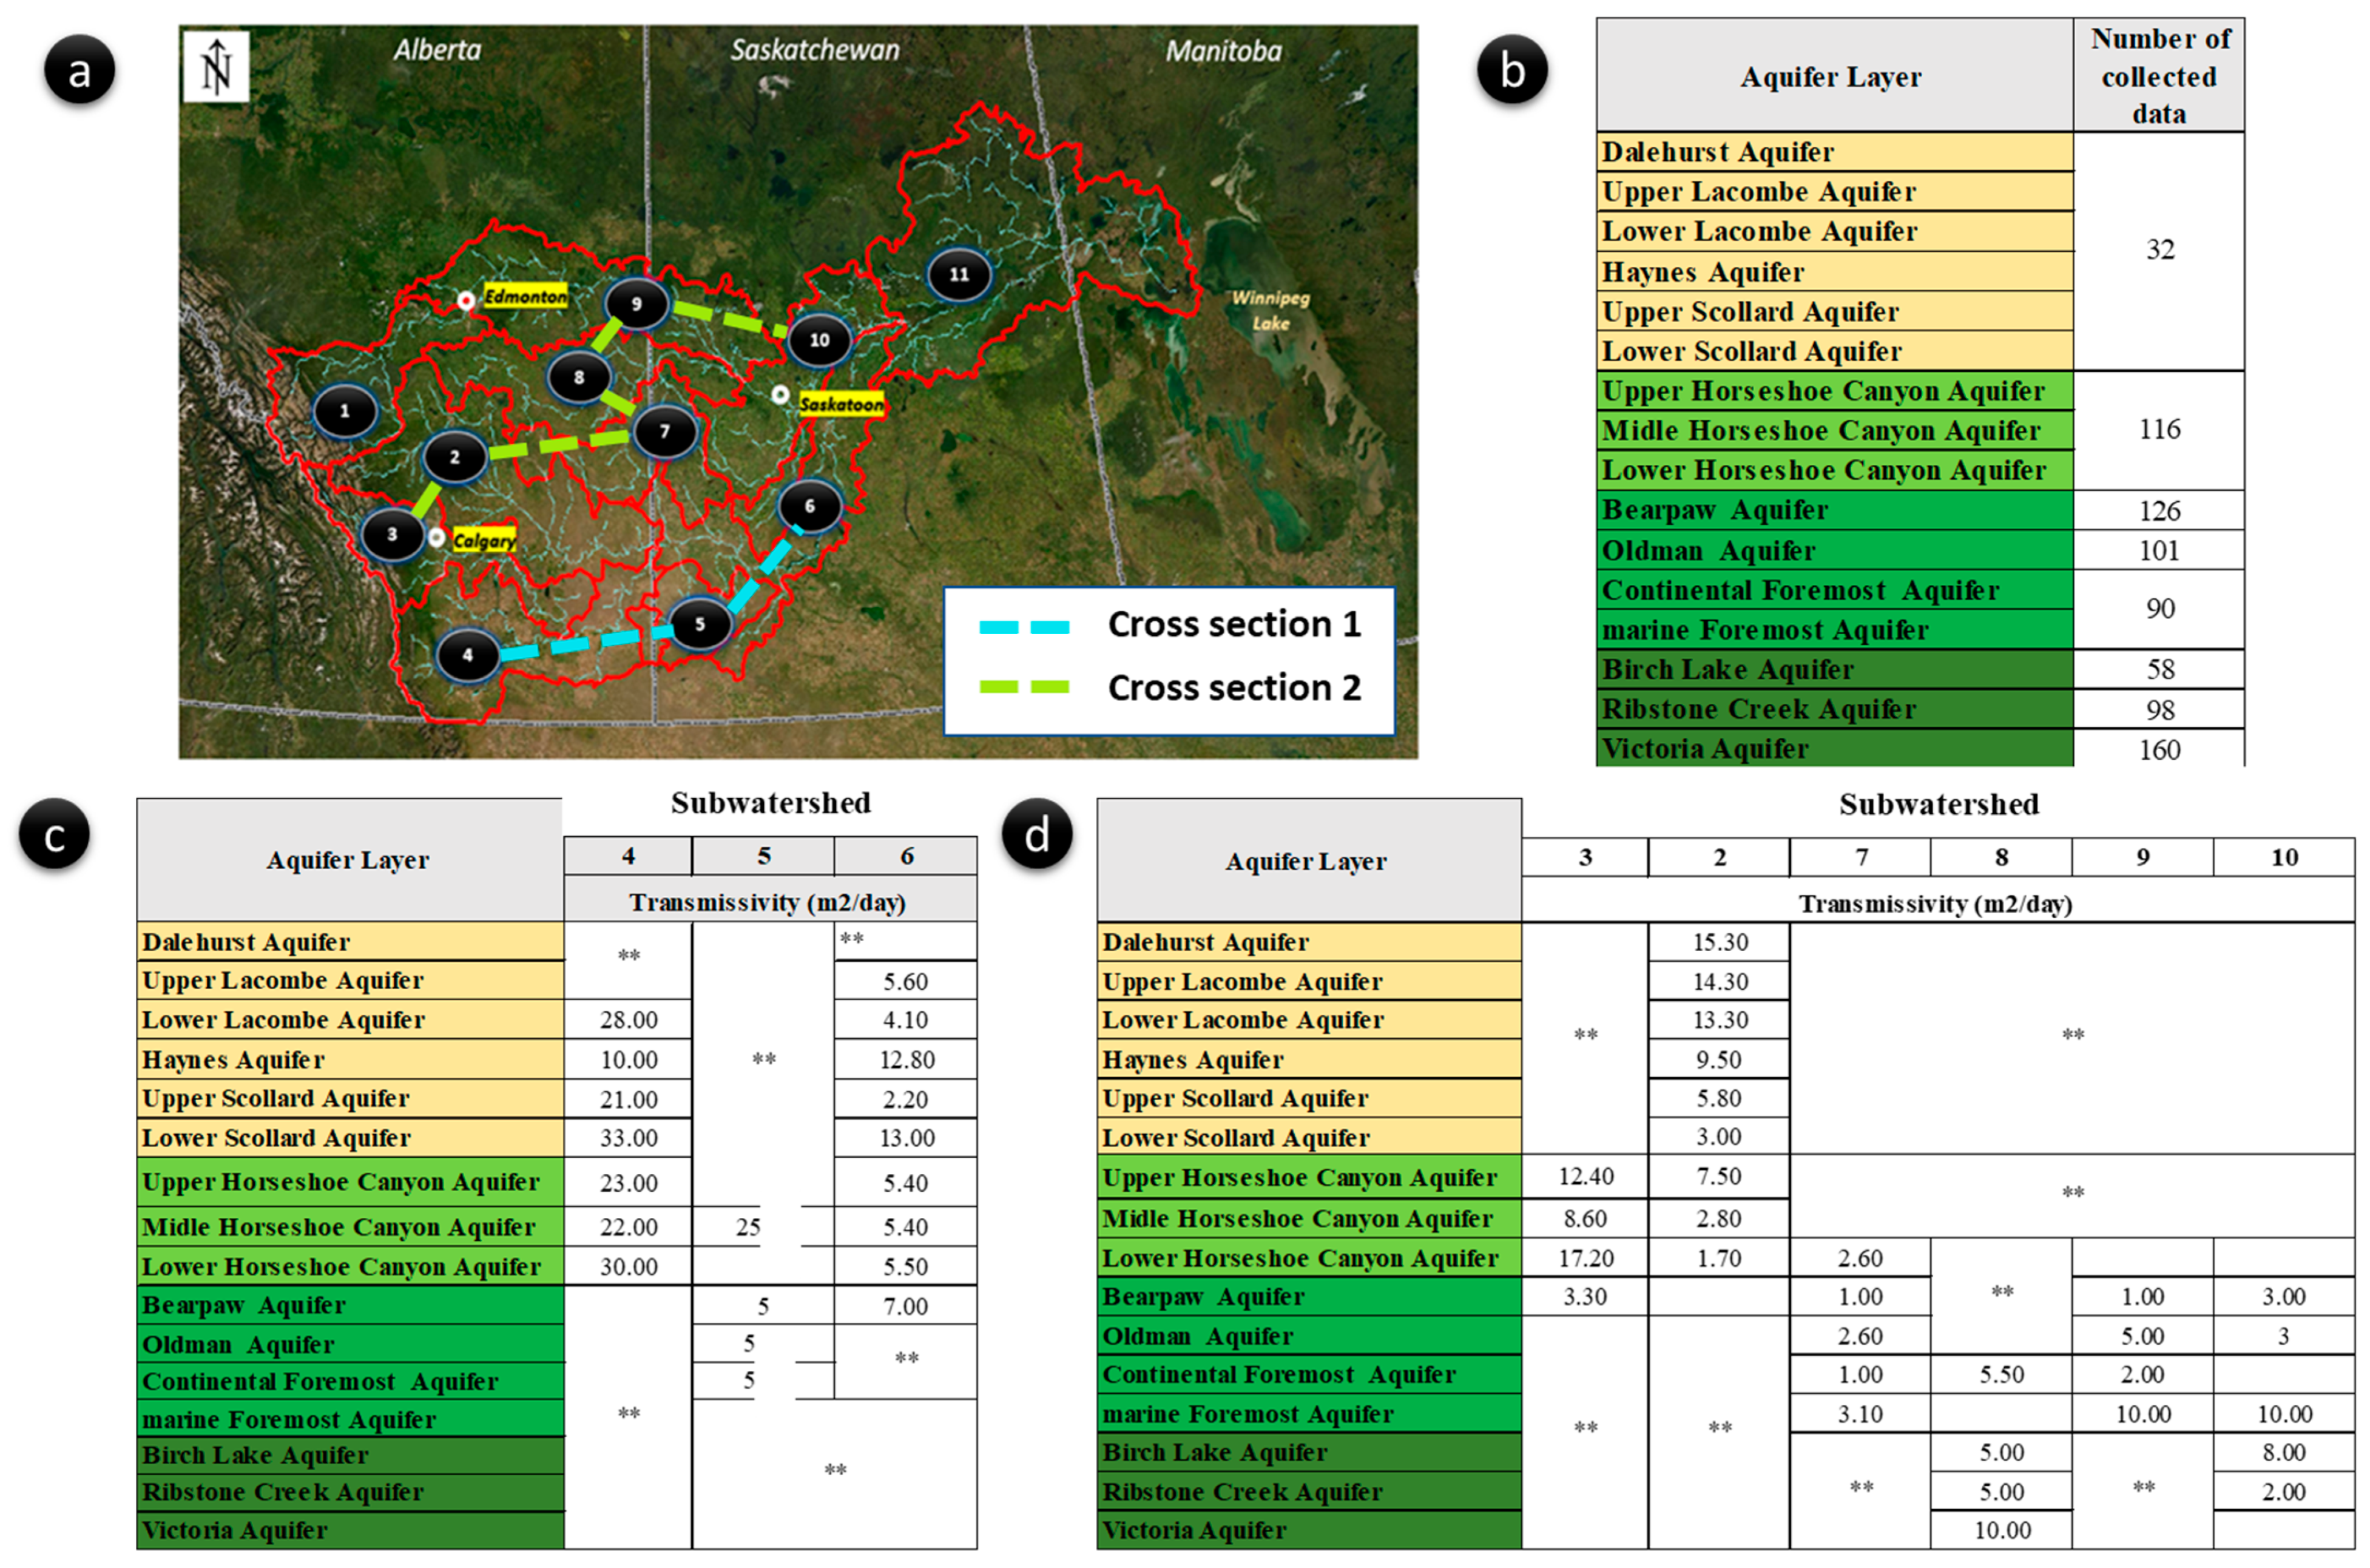
For the hydrodynamic parameters of each aquifer, several data points were collected and harmonized (Table 1) to yield a more homogeneous and representative database. A total of 781 transmissivity values were processed and classified by the aquifer. These average values are shown in Figure 5, particularly for cross-section 1 (Figure 5c) and cross-section 2 (Figure 5d).

3.2. Groundwater Storage Calculation

Groundwater reserves represent the volume of free water stored in aquifers. Three types of reserves can be distinguished: regulatory reserves, geological reserves, and potential reserves. Estimation of these quantities of water requires a knowledge of the hydrogeological structures and hydrodynamic parameters of the aquifer as well as the outflow and inflow to the aquifer.
The reserves of an aquifer are different from the resources, and terminological confusion of these two concepts often prevails in the literature. In [71], reserves are defined as the volume of water in an aquifer that is conditioned by the geological structure, porosity, and storage coefficient, whereas resources consider only the volume of exploitable water. The latter are determined by technical, economic, and conservation imperatives, and therefore, other parameters in addition to the hydrogeological characteristics of the aquifer are taken into consideration when talking about resources. The regulating reserves of a free aquifer are defined as the volume of gravity water stored in the aquifer horizon delimited by the maximum and minimum piezometric surfaces. Geological reserves constitute the volume of water stored in the aquifer between the minimum piezometric surface and the impermeable bedrock. The potential reserves represent the totality of the reserves, namely the sum of two regulatory and geological reserves [71]. In this work, we restrict ourselves to the estimation of the maximum geological reserve.
In a confined aquifer, the piezometric variations do not influence the thickness of the saturated zone; therefore, the regulatory reserves are not defined, and the geological reserve is equal to the maximum potential reserve.
-
Calculation of geological reserves in an unconfined aquifer
In an unconfined aquifer, the power of the aquifer is equal to the thickness of the saturated zone between the bedrock and the minimum piezometric level. The geological reserve is the volume of land limited by the minimum piezometric surface and the bedrock multiplied by the gravity porosity of the aquifer formations in percentage. The gravity porosity is the ratio of the volume of water that a porous medium can contain in a state of saturation and then release under the effect of complete drainage; it is equivalent in practice to the storage coefficient of an aquifer with a free water table [71]. Porosity is often estimated from field data.
For an unconfined aquifer with porosity Pe, thickness E, and area A, the groundwater storage is calculated according to the following equation [71]:
G W S = P e × A × H
where H ≤ E (H being the hydraulic head—here, the saturated slice of the aquifer). In our case study, only the Paskapoo Formation is considered a free aquifer.
-
Calculation of geological reserves in a confined aquifer
In a confined aquifer, the release of water is directly related to the storage coefficient Ss, which is always much lower than the effective porosity of the aquifer. Therefore, the geological water reserve of a confined aquifer is equal to the volume of the slice of aquifer between the piezometric surface and the impermeable roof multiplied by the storage coefficient to which is added the volume between the impermeable roof and the substratum multiplied by the drainage porosity. According to [71], the volume of water stored in a porous formation depends essentially on the porosity of the rock and the pressure of the water in the pores.
For a confined aquifer where the pressure is greater than atmospheric pressure with a storage coefficient Ss, porosity Pe, confined layer thickness E, and surface area A, groundwater storage (GWS) is calculated according to the following equation [71]:
G W S = A × P e × E + S s × H E
where H is the hydraulic head.
To consider the heterogeneity of the hydrodynamic parameters of the aquifer (porosity, permeability, and pore pressure), Equations (1) and (2) could be generalized [71] by discretizing the aquifer into n homogeneous elements of porosity Pei, storage coefficient Si, hydraulic head Hi, aquifer thickness Ei, and area Ωi.
Thus, for an unconfined aquifer, we have the following:
G W S = i n P e i × A i × H i
For a confined aquifer, we have the following:
G W S = i n A i P e i × E i + S s i × H i E i
For spatial mapping and calculation, the capabilities of the MATLAB interface were used for 3D map formatting and display.
A grid of the average piezometric for the years 2002–2020 was established and constitutes the boundary of the saturated zone of the free aquifer sub-model. Thus, a total of two piezometric maps were established: one for the Paskapoo Formation and the other for the deeper formations. The ultra-deep formations are classified as captive and water-saturated.

3.3. Uncertainty Assessment Using Spatial Random Bagging Simulation

3.3.1. Spatial Random Bagging Simulation (SRBS)

SRBS is a statistical technique used in spatial analysis to improve the accuracy of predictive models. It involves creating multiple random subsets of the original data, fitting a model to each subset, and then aggregating the results to produce a final prediction and an accurate quantification of the uncertainty.
In this work, the quantification of the uncertainty was performed using SRBS. The number of bagging iterations was set to 1000 for this modeling work. This simulation allowed us to obtain a random vector (Vi) for each pixel, composed of 10,000 values of each parameter. These values have a Vocc(i), which constitutes the threshold of the number of occurrences.
The occurrence and variance of these thresholds allowed us to determine a probability distribution of thresholds on the modeled geological voxels, which are characterized by a mean (µ) and a variance (σ). Based on these statistical moments, it was possible to quantify the uncertainty of the classification by the following equations:
μ = V i f ( V i ) × P ( V i ) × d V i
σ = V i f V i μ 2 × P ( V i ) × d V i
where Vi is the random vector belonging to V that represents the space of the model input variables, f (Vi) is the output of the model, and P (Vi) is the conditional distribution of input variables.
However, considering this large number of thresholds composing the ensemble-based classifiers (EBCs) to make a decision will certainly require a huge computational time. In [72], an approach was proposed based on the Gaussian quadrature formula (GQF), which allows converting these probabilistic integrals (Equations (1) and (2)) into weighted summations that are functions of n voxels (n optimal thresholds (nopt), set to 3 in our model) of the original distribution. Thus, Equations (5) and (6) take the following forms [72]:
μ = i = 0 n o p t w i × f z i
σ = i = 0 n o p t w i × f z i μ 2
and
o p t = μ + σ × z i
where μ and σ are the mean and variance of the standardized random vector  f z i , respectively, and  z i  and  w i  are the abscissas and weights related to each optimal threshold (opt; (i = 1: nopt)), respectively. Table 2 summarizes the abscissas and weights related to each optimal threshold as proposed in the paper [72], where the mathematical details of the GQF demonstration and its validation can also be found.

3.3.2. The Application of SRBS to Uncertainty Calculation and GWS Estimation

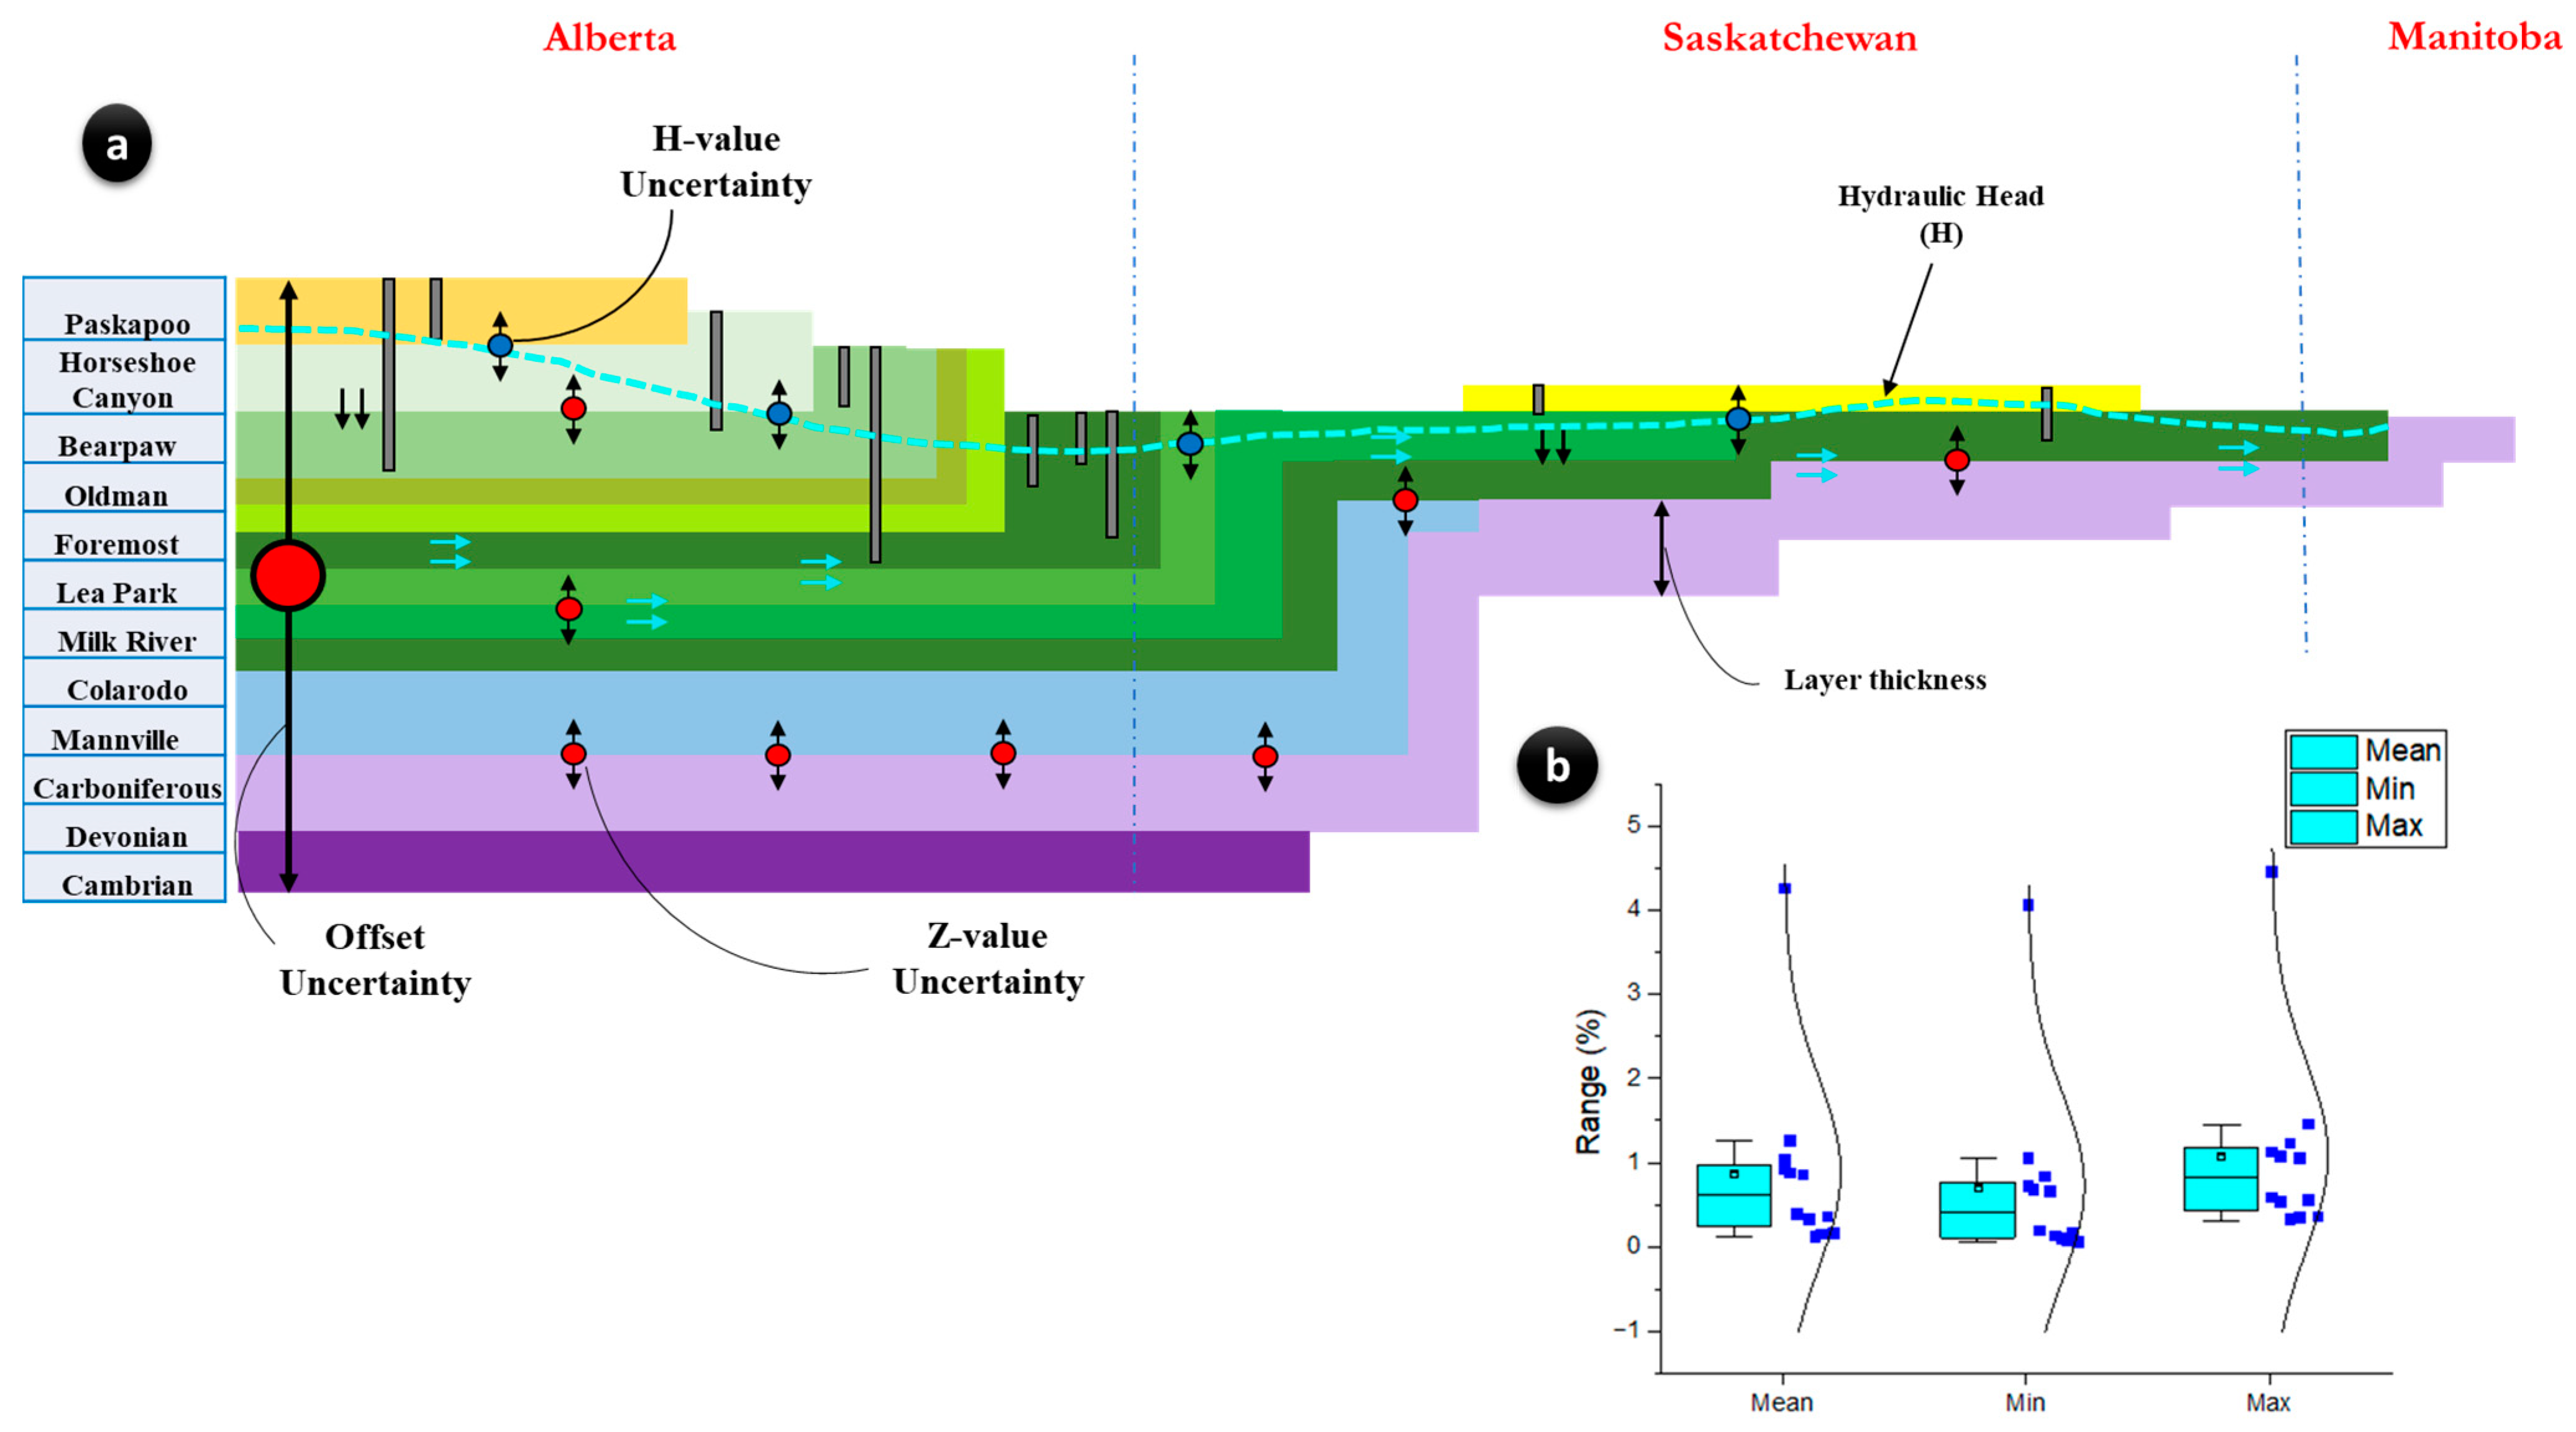
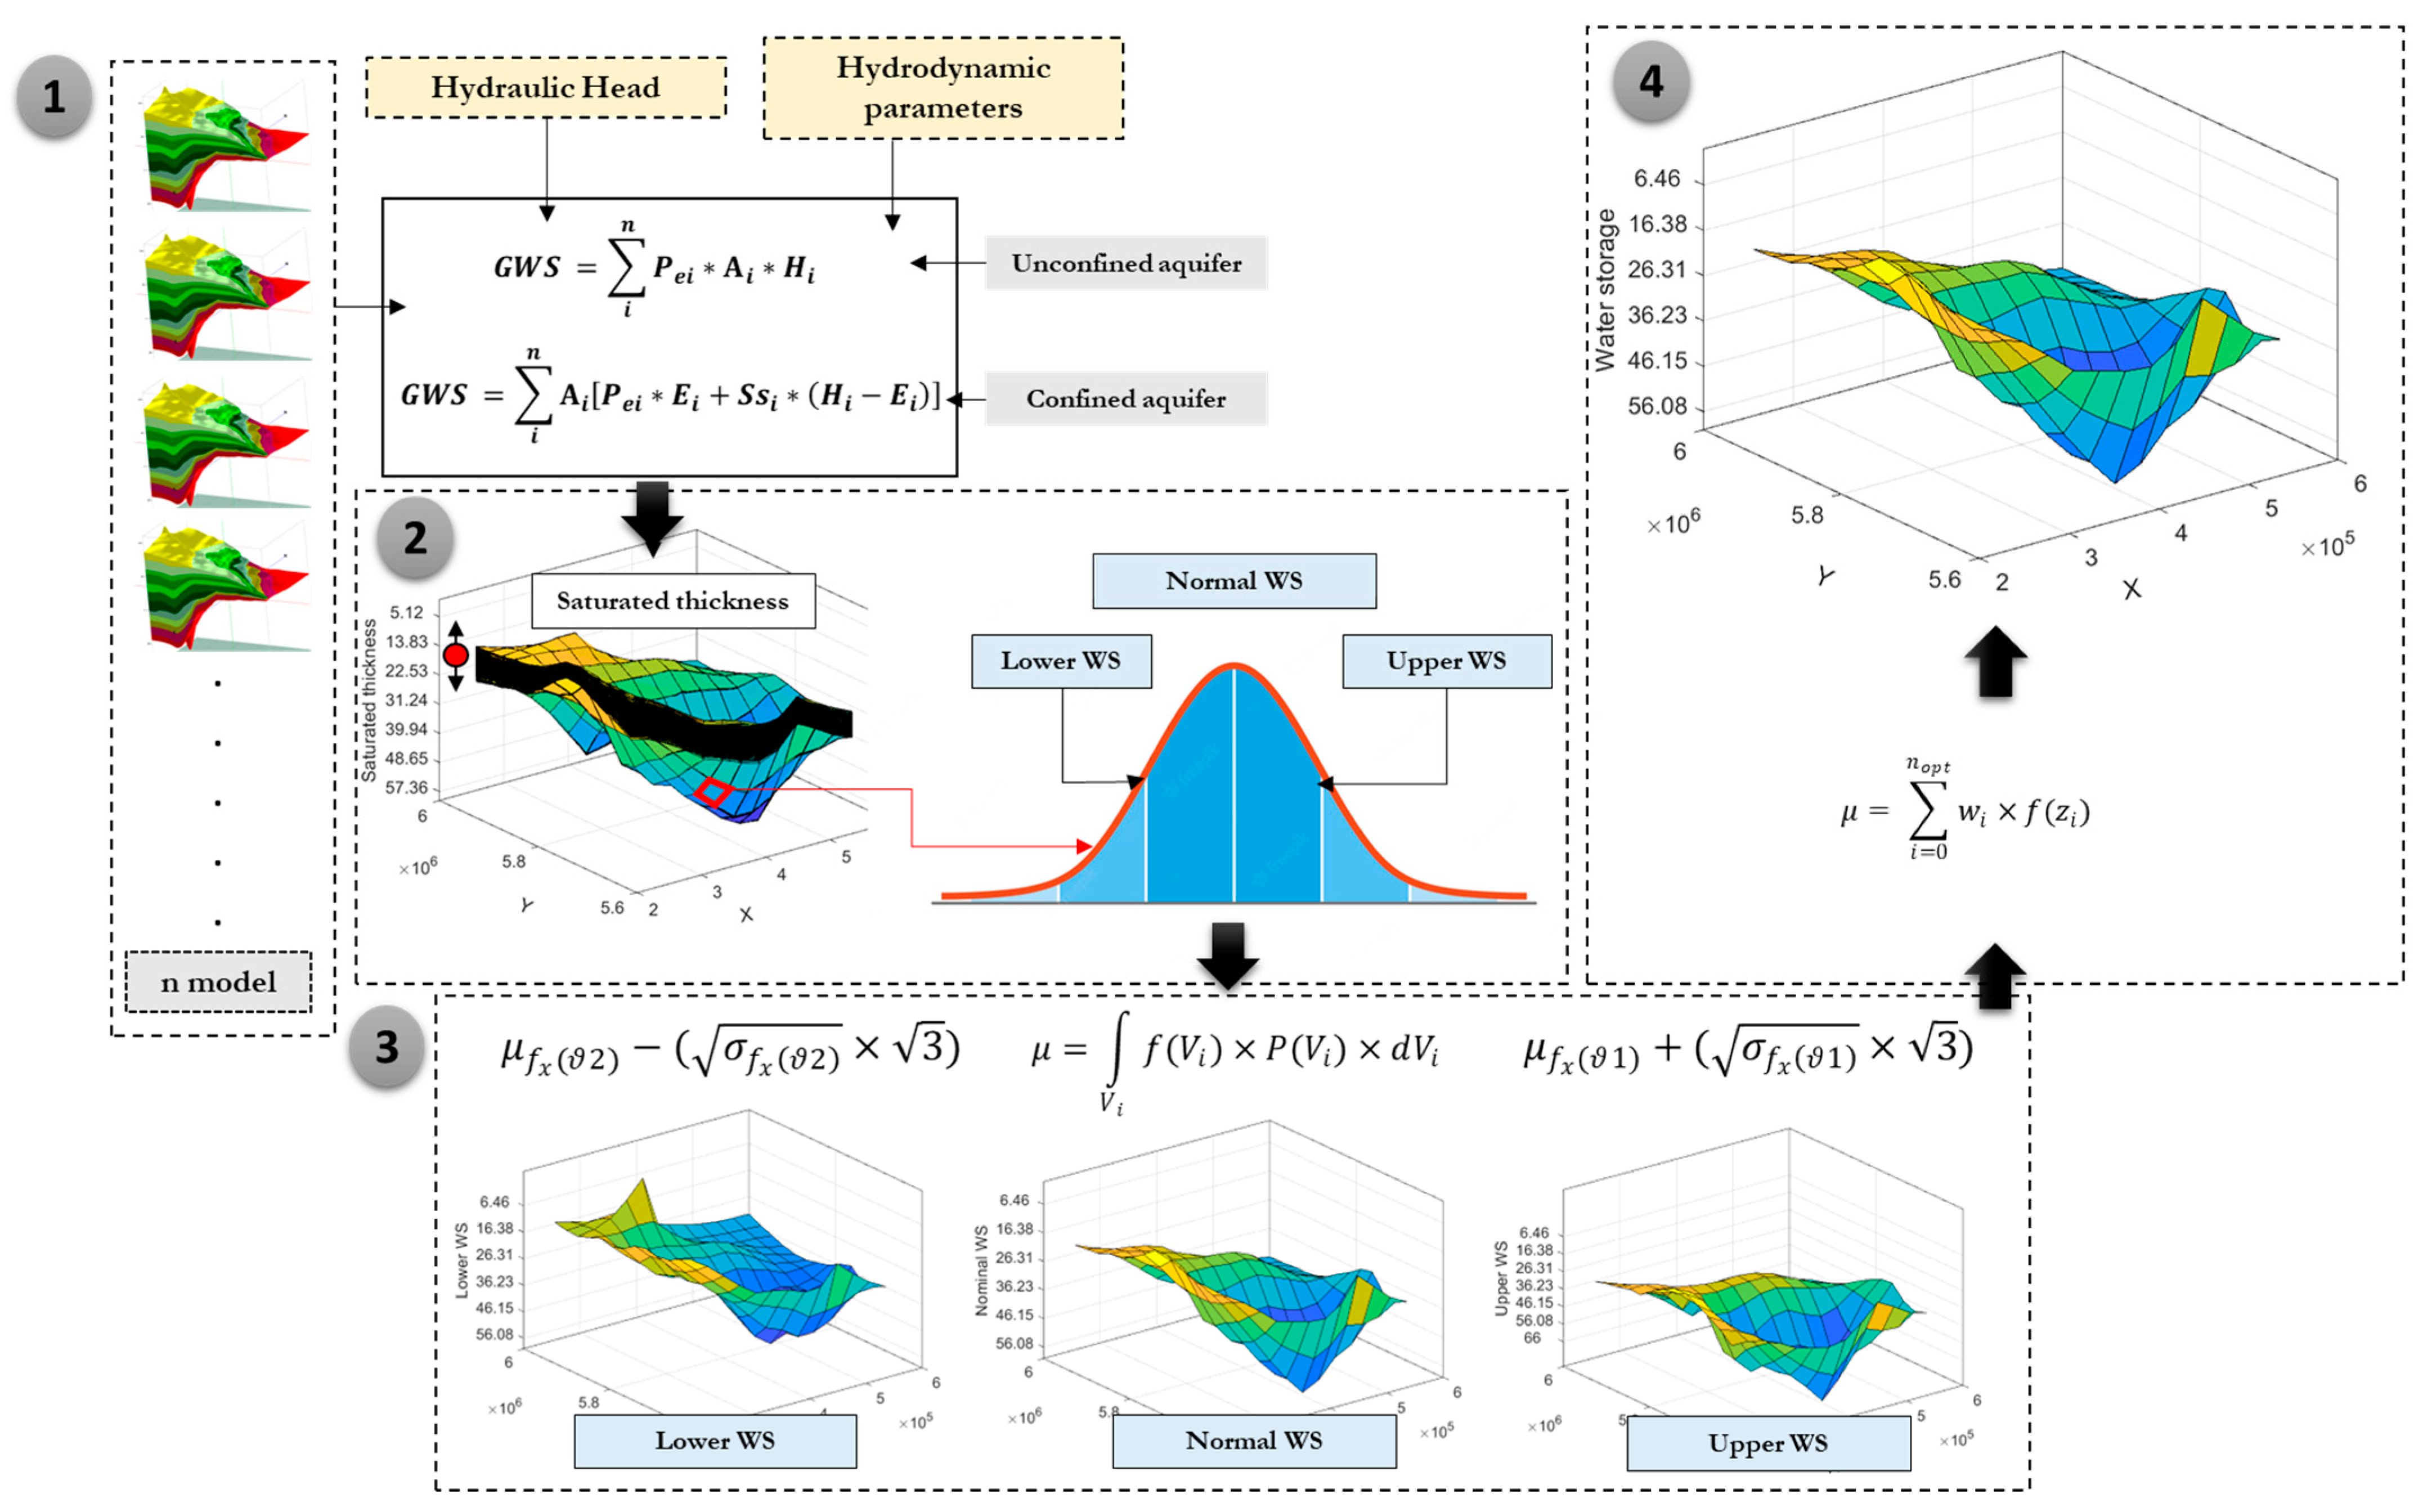
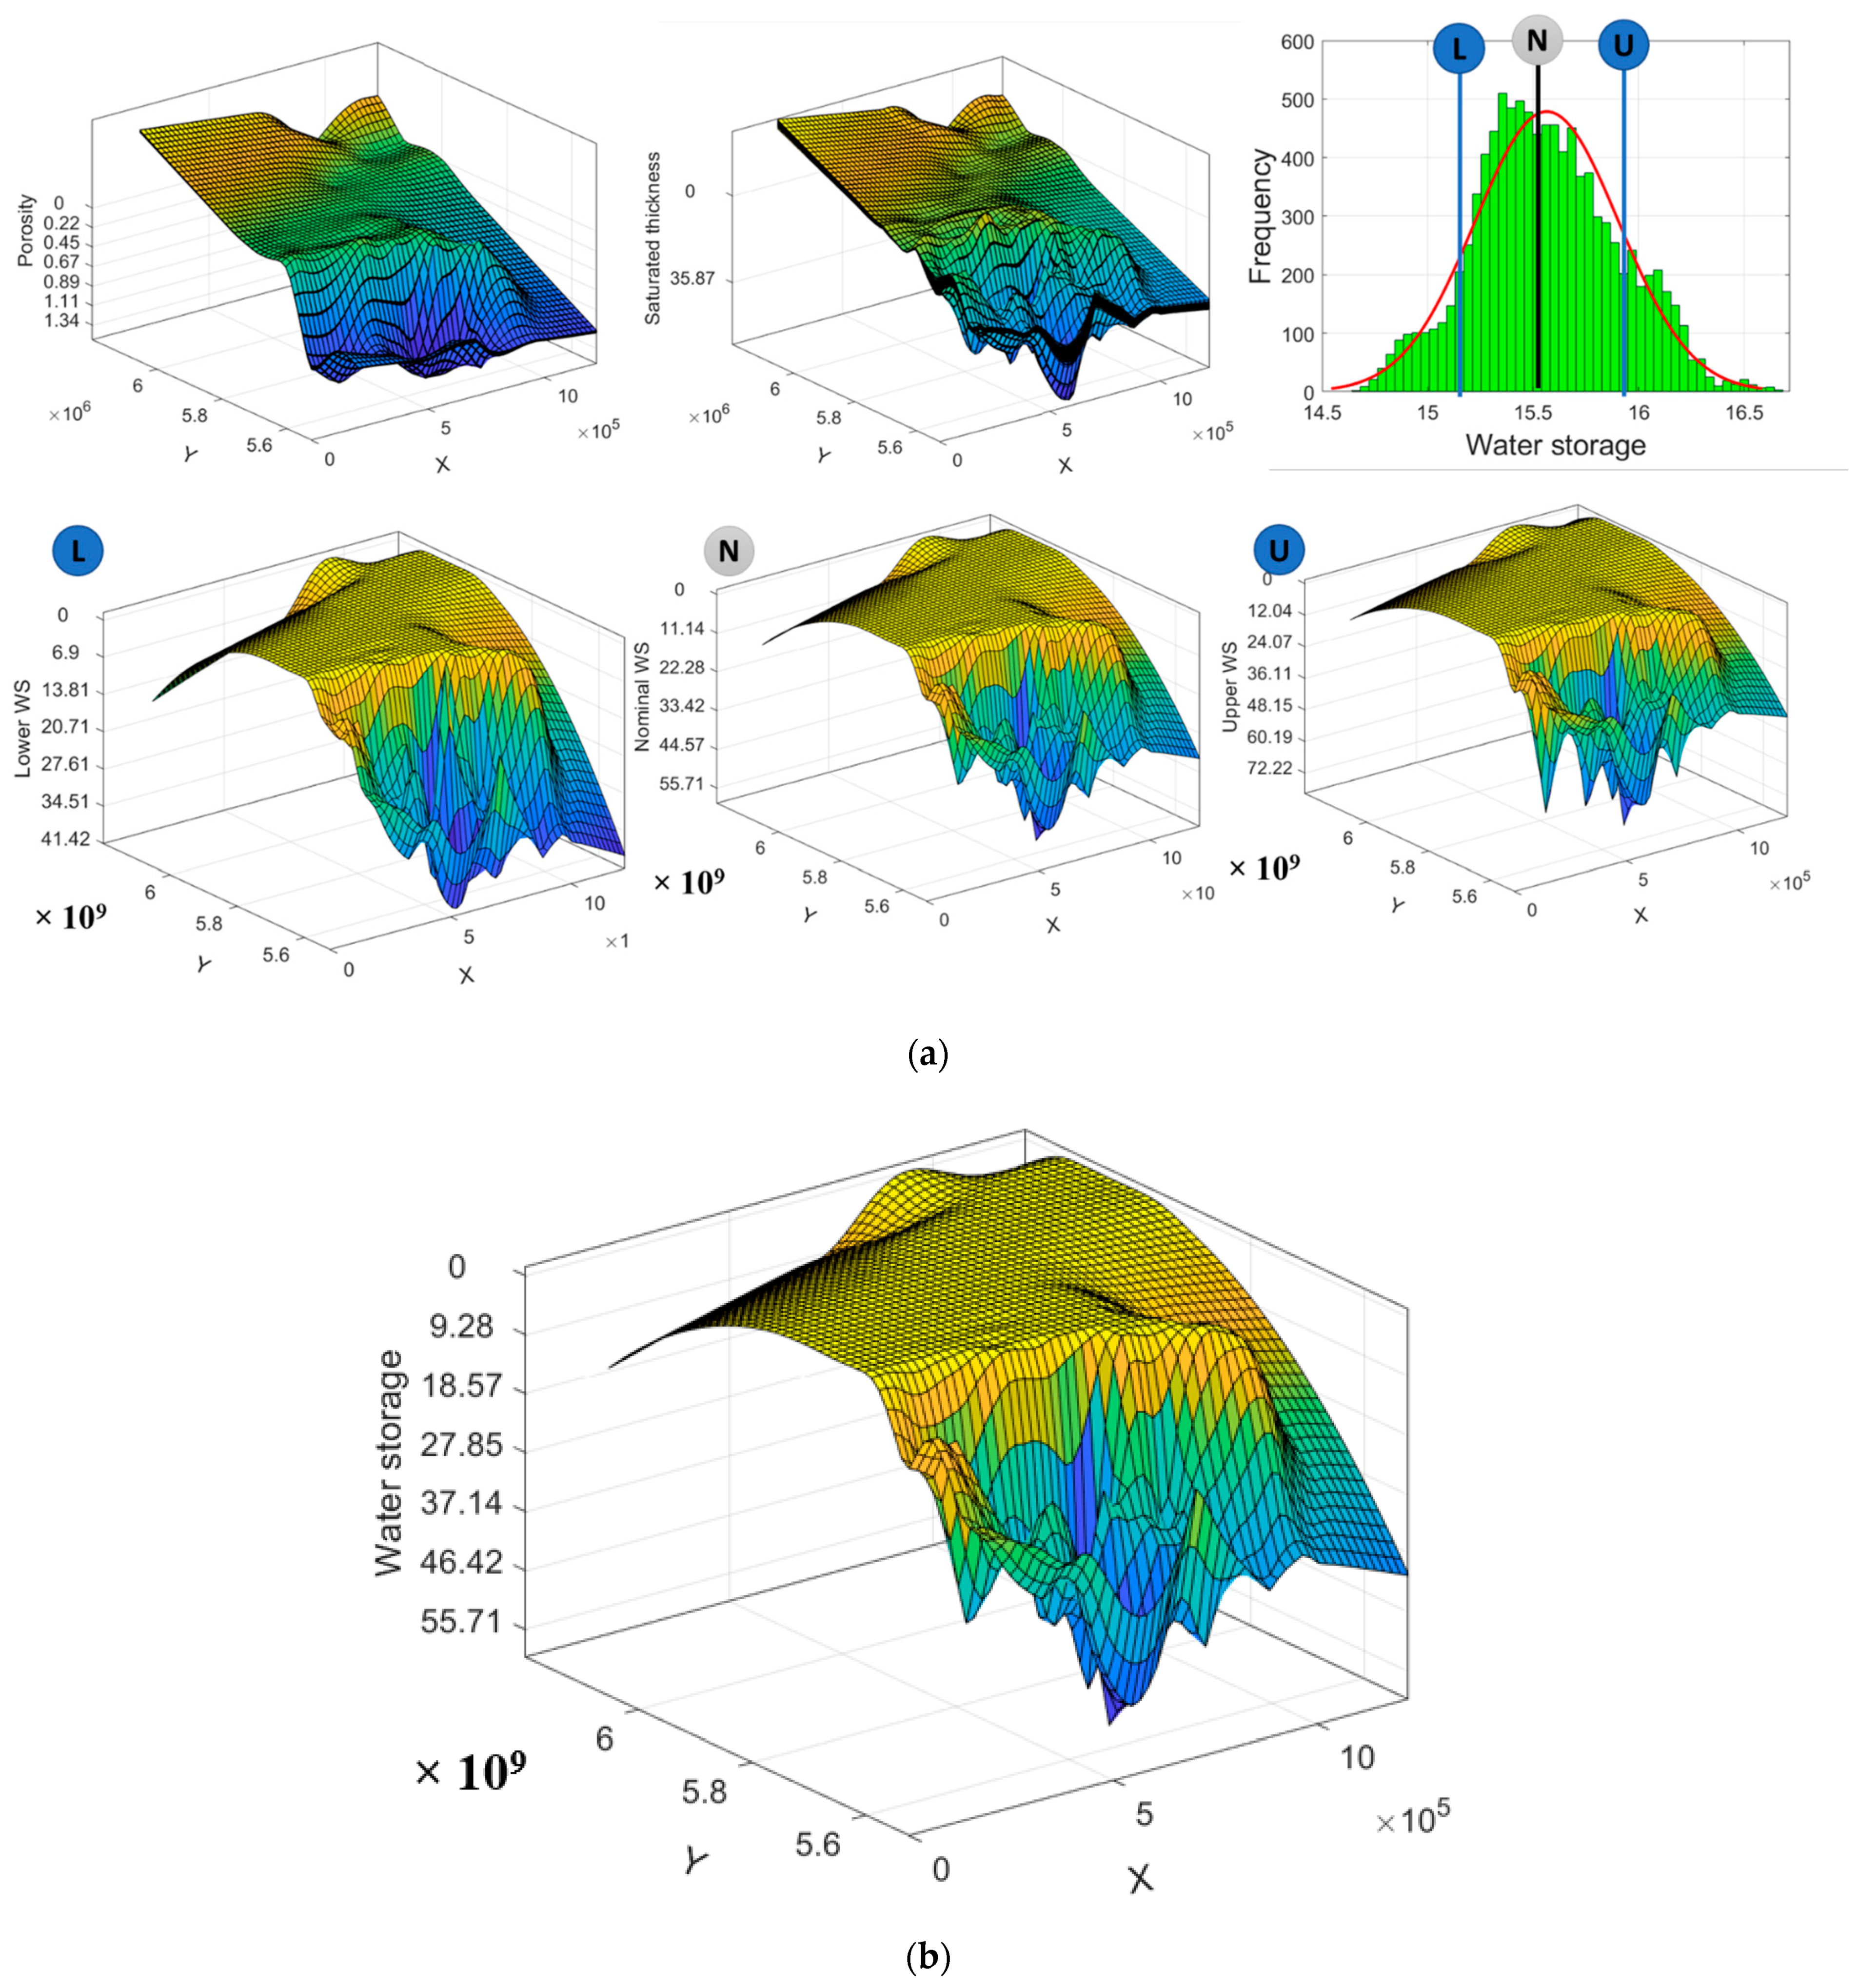
Several models can be proposed from the kriging method using several types of variograms. N 3D geological models may be tangible, despite the significant variation in formation thicknesses between one model and another. As shown in Figure 6, the propagation of the uncertainty and the error on the thicknesses of the formations gives rise to a global offset uncertainty that will be considered later in the estimation of the GWS (Figure 6a). The same process is applicable also for the hydraulic head data for the Paskapoo Formation (Figure 6a) and for the hydrodynamic data (Figure 6b). To quantify these uncertainties, the 3D geological model was run 150 times. This gave us 150 3D geological models based on 150 variograms (150 sills and 150 ranges). The 3D geological modeling induced a systematic error range. After the interpolation, we could quantify the error range, which was between −4.67% and 5.41% in terms of the thickness of geological formations; that is, ±5% of the thickness of the formations in each hydraulic or oil drilling taken into consideration. The overall workflow of SRBS application is shown in Figure 7.
An attempt to model the variograms was made by modifying the sill once and the range once. The variogram models chosen for each geological formation modeled were not sensitive to sill variations. The 150 sill values gave the same results, so the initial sill was kept. On the other side, changing the range of the variograms gave different results and radical changes in the decision tree. Therefore, an uncertainty analysis of the ranges was performed with logarithmic bagging on the values to choose the optimal range. Indeed, at the beginning, 1,000,000 iterations (1000 × 1000) were conducted to fix the interval of the optimal ranges, and after, three simulations of 21 iterations were performed to fix the exact number of the optimal range. After fixing the optimal ranges, the 3D geological model was reconstructed, and the geological layers were re-interpolated using the initial sill and the final range (optimal range).
The next step was the computation of groundwater storage using Equations (3) and (4). This was performed using a dynamic algorithm in MATLAB. The Gaussian quadrature was used for each pixel to convert the bagged values into weighted summations that are a function of the error interval determined by the SRBS. Based on the distribution explained in Figure 7, a lower water storage (WS), upper WS, and normal WS were defined and selected to estimate the final groundwater storage map using the abscissas and weights for the standard normal distribution, presented in Table 2.

4. Results

4.1. Geostatistical Analysis

The results obtained following the geostatistical analysis (see Section 3.1) in the methodology) are summarized here. Several variogram models were tested, and the best variogram was chosen for each geological formation. Table 3 shows the metrics related to the best variograms selected for each geological formation.
The variograms relative to the geological data studied show a correlation coefficient close to 1 (varying between 0.86 and 0.95), indicating a good fit between the experimental variogram (relative to the observed data) and the theoretical mathematical model that will be used for the spatial interpolation. The correlation coefficient was taken as the first indicator of precision for the estimation. In this work, it was useful to measure the efficiency of the fitted model in estimating horizontal and vertical variations in the thickness of stratigraphic units.
For the studied formations, an absence of the nugget effect was noticed, except for the Devonian Formation (Devonian potash) (γ (0) = 237.5). This confirms a very local variability of the studied phenomenon, which is the variation of the formation thickness.
The variographic patterns show an interval of sill values that spans between 2490 and 16,977, with an average value of 6245. Ranking the variograms studied by bearing value gave very close bearing values for the Bearpaw, Oldman, Foremost, and Cambrian formations, also the Paskapoo, Lea Park, and Mannville Formations. The very high range values indicate variability in the geological data used and, hence, variability in depositional conditions, sedimentary facies, and other geological mechanisms that control the geological setting of the SRB.
The rate of anisotropy determines the continuity of the studied phenomenon along the direction. To determine the direction for which the range is more important—i.e., the variogram that produces the greatest correlation over a large distance—the variograms were evaluated in two directions: 0° and 90°. This made it possible to determine the major and minor significance of each variogram. The test of evaluation of the anisotropy of the studied phenomenon is based on the study of the ranges according to different directions. Indeed, this test allows the determination of the distance from which two observations are no longer autocorrelated (are no longer linearly related and the covariance is zero). The higher range provides information on the directions in which the sedimentary thickness data are more consistent from point to point; in the SRB, the variographic range shows clear consistency between borehole data in the province of Alberta, while poor consistency was observed in the province of Manitoba. This is because the autocorrelation distance between observation points is a parameter that varies from one area to another depending on the fitting model and the geological processes in the study area. Thus, given the regional geology well represented by the borehole data in the Alberta region, it was relatively simple and clear to estimate the horizontal and vertical variograms in that area. Moreover, given that the range allows for defining a zone of influence of a point on its neighborhood, the ideal variograms in the Saskatchewan and Alberta areas were chosen. Referring to the variability of the range along the direction, the formations with values close to the range present a spatial continuity in the structure of the geological data.
The following variographic models were selected: (i) the Gaussian model without a nugget effect for the Paskapoo, Horseshoe Canyon, Bearpaw, and Oldman Formations; (ii) the exponential model without a pipit effect for the Foremost, Lea Park, Milk River, Colorado, Mannville, Cambrian, and Precambrian Formations; and (iii) the exponential model with a nugget effect for the Devonian Formation. Indeed, this last model is not recommended for 3D geo-modeling because it is based on simulation algorithms that only lead to a random distribution and do not represent the geological complexity of the studied structure. However, in our case, only this model showed the best correlation and anisotropy; therefore, it was chosen for the Devonian Formation.

4.2. Regional 3D Geological Model of the Saskatchewan River Basin

According to the approach presented in Section 3.1, we established two regional hydrogeological sections along the SRB (Figure 8a,b). In these figures, we present the hydrogeological conceptual model modified after our comprehension of the functioning of the SRB. The 3D geological model of the SRB was proposed based on these conceptual cross-sections (Figure 9). The 3D geological model is interpreted according to the type of aquifer, i.e., those that are phreatic or deep. Although only the deep aquifers are modeled, we studied (i) the horizontal and vertical spatial extension of the aquifer layers and their hydrodynamics and (ii) the regional flow direction. These interpretations are based essentially on the conceptual models and the 3D geological model.
-
Horizontal and vertical spatial extension of superficial aquifers and their hydrodynamics
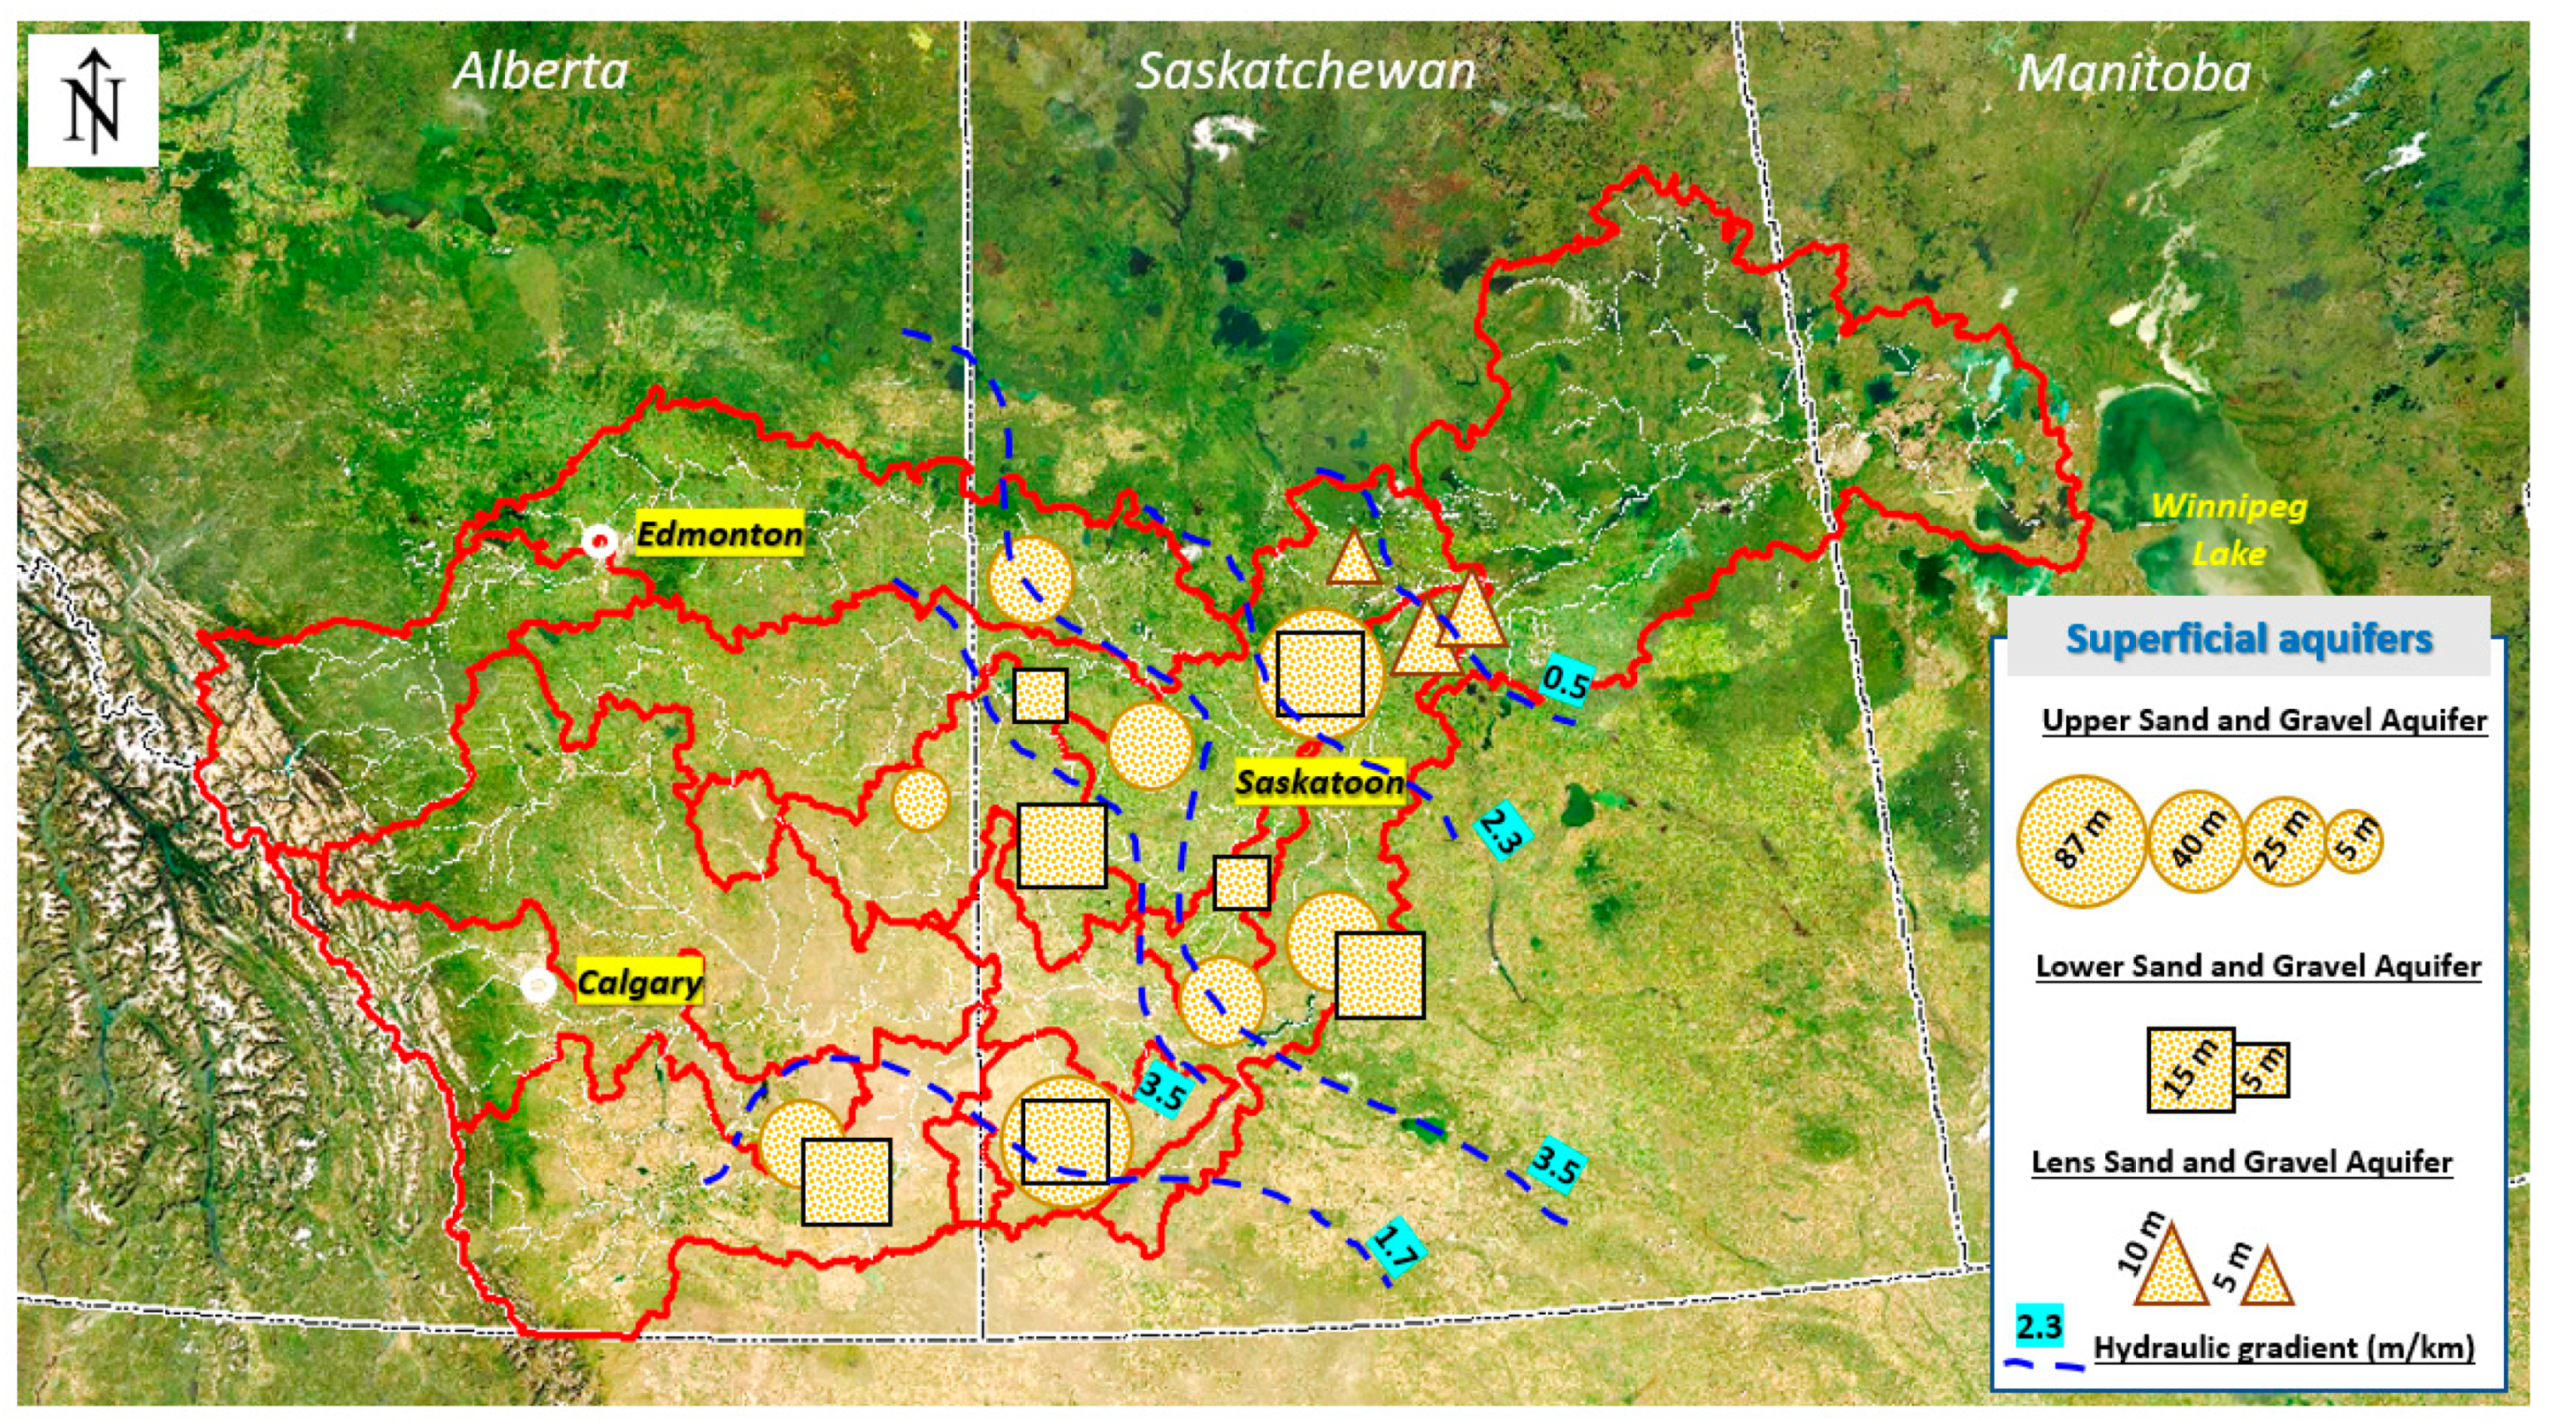
Superficial deposits are sediments that accumulate above bedrock. They include pre-glacial materials that were deposited before glaciation, together with directly or indirectly deposited materials that had resulted from glaciation. Lower surficial deposits include pre-glacial deposits. Upper surficial deposits include ancient fluvioglacial sedimentary deposits. According to the results in Figure 10, these lens aquifers are mainly distributed in quaternary alluvium over the entire province of Saskatchewan and a portion of the Saskatchewan–Manitoba transboundary zone but are absent in Alberta. A single borehole indicates a depth of 17 m for the lower sand and gravel aquifer and 40 m for the upper aquifer (Figure 8a,b). These surficial deposits host the following three aquifer levels:
Sand and Gravel Aquifer(s): This aquifer is hosted in surficial deposits of a sandy and gravelly nature. The saturated portion of the aquifer is less than 20 m thick (Figure 10). The base of the superficial deposits is formed by bedrock.
Upper Sand and Gravel Aquifer: This aquifer is housed in sand and gravel. These upper surficial sand and gravel deposits are water-saturated but are not continuous over large areas. The thickness of this aquifer is controlled primarily by two parameters: the water level in the aquifer formation contained within the surficial deposits, and the depth to bedrock. This aquifer is less than 5 m thick but can reach 15 m thickness in valleys where the bedrock is buried. Potential exploitation flows of this aquifer are typically lower than 100 m3/day.
Lower Sand and Gravel Aquifer: This aquifer is contained within sand and gravel deposits of the lower portion of the surficial deposits. The depth of this aquifer is less than 10 m. Pumping tests that have been conducted on this aquifer show that possible flow rates that can be exploited for drilling vary from 85 m3/day to 1000 m3/day.
-
Horizontal and vertical spatial extension of the deep aquifers and their hydrodynamics
The SRB contains several deep aquifers (depth higher than 50 m) according to the hydrogeological sections that are depicted in Figure 8a,b and Figure 9. The aquifer formations are as follows: Paskapoo Aquifer, Horseshoe Aquifer, Bearpaw Aquifer, Oldman Aquifer, Off-shore Foremost Formation, Lea Park Formation, and Milk River Aquifer.
Paskapoo Aquifer
The Paskapoo Formation is Paleocene (56-65 Mya BP) in age. It forms the bulk of the Cypress Hills in the southwestern portion of the SRB. This formation outcrops in the Cypress Hills and consists of interbedded non-marine sandstone, siltstone, and mudstone with minor amounts of coal seams and bentonite. These series form the most pronounced and sharp relief landforms in the southwestern portions of the SRB, as shown in Conceptual Model 1 (Figure 8a). The eroded top of this formation marks the uppermost bedrock layer across its subsurface and outcrop extent (Figure 9). The extension of this formation is spatially limited and has several gaps. Its hydrodynamic characteristics are moderate, given that the hydraulic conductivity ranges from 10−9 to 10−5 m/s and transmissivity is 17.28 m2/day, as mentioned in Figure 5.
Horseshoe Aquifer
This aquifer resides in three permeable levels of the Horseshoe Canyon Formation. These permeable levels are very heterogeneous, consisting of mainly shale, sandstone, coal, bentonite, limestone, and ironstone facies formations. We distinguish the following:
(i) 
Upper Horseshoe Canyon Aquifer: This aquifer ranges in thickness from 95 m to 180 m, while the ceiling depths range from 10 m to 700 m (Figure 9). The transmissivity (T) of this aquifer level varies from 5.4 to 25 m2/day. The variation in transmissivity is explained mainly by variation in its thickness, which is largely affected by erosion. The highest values of transmissivity were recorded in sub-catchments 2 and 5, on the order of 23 and 25 m2/day, respectively, given the sandy nature of the aquifer. However, the lowest transmissivities were recorded in sub-catchment 7 (T = 5.4 m2/day), in the northern part (T = 6 m2/day (Figure 5)) and center (T = 7.6 m2/day (Figure 5)). These low values are attributed to this aquifer level being enriched with sandy clay and bentonite at the level of these sub-catchments. In this area, the aquifers develop narrow and deep drawdown cones.
(ii) 
Middle Horseshoe Canyon Aquifer: This aquifer level ranges in thickness from 50 m to 200 m (Figure 9). As was the case with the Upper Horseshoe Canyon Aquifer, the thickness of this aquifer is controlled by erosion, which explains the variability in its hydrodynamic behavior. The highest values of transmissivity were recorded in sub-catchment 2, averaging at 22 m2/day. This is due to the sandy nature of the aquifer. However, the lowest transmissivity values were recorded in the center of the basin (T = 2.8 to 5 m2/day (Figure 5)) and the southwestern part (T = 5.4 m2/day (Figure 5)), where it is enriched with discontinuous lenses of clay.
(iii) 
Lower Horseshoe Canyon Aquifer: This aquifer level has a minimum thickness of ~60 m and a maximum thickness of about 170 m (Figure 9). The highest values of transmissivity were recorded at the level of sub-catchment 2, on the order of 30 m2/day. The lowest values were recorded at the level of sub-catchment 8 (T = 1.7 m2/day). This area is more exposed to drawdown and overexploitation of resources.
Bearpaw Aquifer
This aquifer is contained within the porous layers of the Bearpaw Formation. The Bearpaw Formation is composed mainly of sandstone, siltstone, and shale. The thickness of the aquifer varies from 80 m to 200 m (Figure 9). The depth of the Bearpaw Formation ceiling is variable, ranging from less than 10 m to more than 1100 m in the northern part of the SRB. The exploitation of this aquifer level can reach 10 to 100 m3/day per well (Figure 5). The transmissivity of this aquifer varies from 0.6 to 7.8 m2/day. The highest values of transmissivity were recorded in the northern part of the basin, on the order of 7, 7.3, and 7.8 m2/day (Figure 5). This is due to the presence of purely sandy layers. In contrast, the lowest transmissivity values were recorded in the center of the basin (T = 0.6 m2/day and 1 m2/day) and the eastern part (T = 1 m2/day). This is because the thickness of this aquifer level undergoes a substantial reduction in this region moving towards Lake Winnipeg, where the level disappears completely due to erosion. This phenomenon is well presented in the 3D geological model (Figure 9). Erosion is achieved by incision by the valleys of the main rivers that run through the aforementioned sub-watersheds.
Oldman Aquifer
This aquifer is contained in porous levels of the Oldman Formation, which is essentially made up of sandstone, siltstone, shale, and coal. The thickness of this aquifer is highly variable, i.e., from 20 to 250 m due to the effects of erosion (Figure 9). The depth of the ceiling of the Oldman Aquifer increases from a few meters to 1300 m deep from east to west in the SRB (Figure 9). The transmissivity ranges from 2 to 8.8 m2/day. The transmissivity values that were determined from pumping tests on the boreholes tapping the Oldman Aquifer were heterogeneous. This is due to both the variation in the thickness of the Oldman Aquifer and the nature of the fine to coarse lithology of that aquifer. The variation in the transmissivity of the Oldman Sandstone Aquifer, in turn, may be related to the nature of the aquifer itself, which is free in some parts and confined in others. This condition is referred to as a convertible aquifer.
Offshore Foremost Formation Aquifer
The Foremost Formation is represented in the SRB by two well-individualized lithologic formations, which are arranged from bottom to top as the Marine Foremost Formation and the Continental Foremost Formation. This formation lies sandwiched between the overlying Oldman Formation and the underlying Lea Park Formation. The Marine Foremost Formation consists primarily of sandstone and shale, with an average thickness of 80 to 200 m (Figure 9). The depth of this formation is highly variable. It ranges from less than 10 m at the edge of sub-basin 10 to more than 1500 m in the west of the basin (Figure 9). This formation is partially eroded in most of the sub-catchments in the northern part of the SRB. Indeed, there are sedimentary gaps in this formation in most of its sub-catchments. The transmissivity of this aquifer varies between 1 and 5 m2/day in the center of the basin.
Lea Park Formation
This formation is represented by shales and silts with an average thickness varying between 100 and 200 m. Geologically, the top of the Lea Park Formation represents a boundary between marine and continental formations. According to established conceptual models, the depth of this formation ranges from less than 50 m in the basin margins to more than 1600 m in the center of the basin (Figure 9). It is characterized by low permeability. Indeed, this formation may act as the bedrock for the aquifer system captured or known in the northern part of the SRB.
Milk River Aquifer
The Milk River Formation was deposited during the Upper (Late) Cretaceous Epoch (100.5-66 Mya BP). According to Conceptual Model 2 (Figure 8a,b), it is 150 m thick in the southwestern part of the SRB and thinner towards the northeast (Figure 9). The formation is essentially interbedded with sandy shale, siltstone, shaly sandstone, fine- to medium-grained sandstone, shale, siltstone, and fine-grained sandstone with coal seams.
The transmissivity values for the Milk River Aquifer that were obtained from shut-in tests on gushing wells ranged from 1.21 to 45 m2/day (Figure 5). Pakowki Lake is a local outlet for various aquifer levels, and all flows converge on this depression. Nevertheless, low transmissivity values (<1.47 m2/day) were located in the northeast portion of the study area and in the western portion of the SRB center (0.59 m2/day). This is due to the reduction in the thickness of the aquifer formation (Figure 9). This formation loses its hydrogeological interest in this area.

4.3. Uncertainty Assessment Using the New Spatial Random Bagging Simulation (SRBS) System and Groundwater Storage Calculation

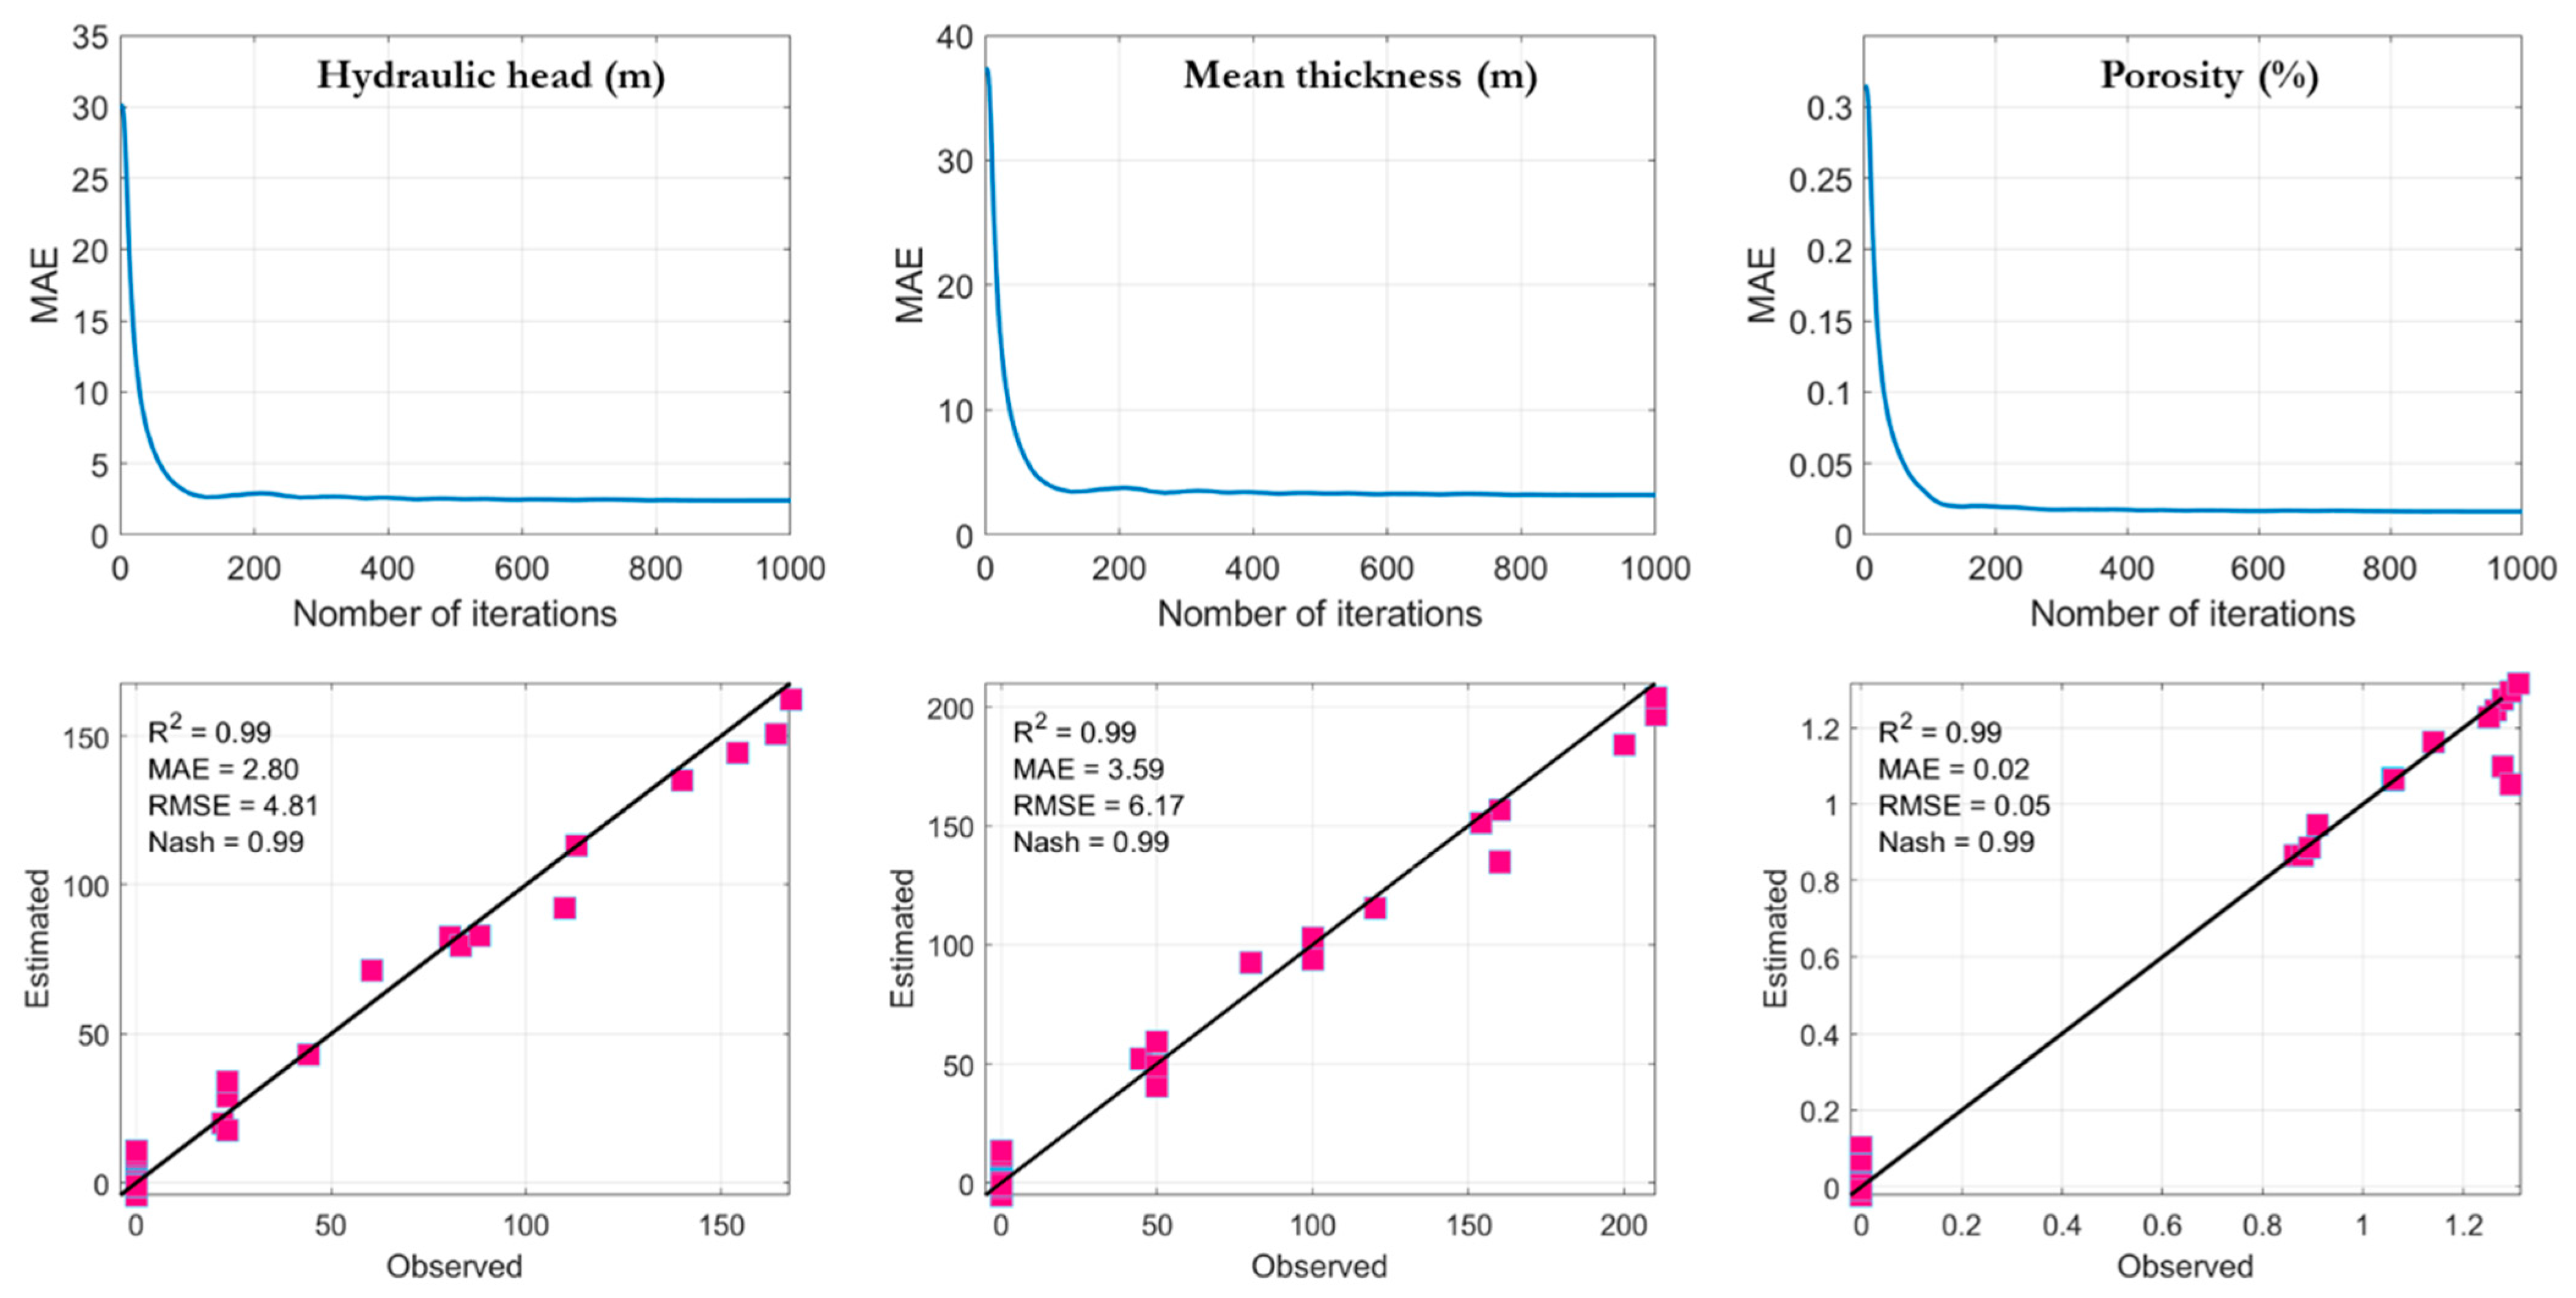
As mentioned in Section 3.3.1, several iterations (1, 10, 100, and 1000) were performed to minimize the uncertainty on the thickness, porosity, and hydraulic head data and to define the most optimal range for the kriging interpolation and estimation of the optimal storativity of each aquifer. Based on the MAE values between the observed and simulated values and the number of iterations, we were able to find the optimal range for the Paskapoo Formation. After 10 iterations, the MAE values stabilized at a minimum value of about 3.2 m for the average formation thickness, 2.5 m for the hydraulic head, and 2.5% for the porosity.
In Figure 11, the MAE values are plotted as a function of the number of iterations in the process of determining the optimal variogram range. In the experiments, the number of iterations was set to 1000, then 100, then 10, then 1. As shown in the figure, we can observe a significant decrease in MAE values during the first few iterations. Beyond this point, the MAE values stabilize. These experimental results give the optimal range of the variogram that must be adapted for the interpolation of the different layers of information for the calculation of groundwater storage. Figure 11 represents the case of the outcropping Paskapoo Formation.
Figure 11 shows a good R2 of 0.99, indicating that the interpolation with the variogram range explains 99% of the variance of each parameter. The Nash coefficient, which is a very severe performance metric, shows that the ranges chosen are robust and that kriging interpolation using the variograms with the optimal ranges perfectly predicts the observed values of hydraulic head, average formation thickness, and porosity. Visually, Figure 11 shows good alignment with the 1:1 line, showing the robustness of our interpolation work and data preparation for the SRBS work.
The SRBS work was then performed on the re-interpolated layer of each formation, and the groundwater storage was calculated referring to Section 3.3.1. The thickness grid of each aquifer layer was extracted from the 3D model to estimate the total volume occupied by the aquifer. To estimate the groundwater storage in the modeled area, the aquifer had to be evaluated for regions where it is fully unconfined or confined. Porosity values were assigned for the unconfined aquifer where a clay lens is absent and specific storage for areas where a clay lens is present.
In Figure 12a,b, we present the Paskapoo Formation as an example. For the Paskapoo Formation, the piezometric surface grid was obtained by interpolating the water level values applied to the piezometric data. The water table contours were generated from all available measurements in 2019 (10 piezometers). This grid was used to estimate the saturated thickness for the calculation of groundwater storage under unconfined conditions. Using the SRBS method, a histogram of the normal distribution was created for each layer grid (piezometer, thickness, and porosity). This allowed us to establish upper, lower, and nominal storativity maps. Finally, by the Gaussian quadrature method, we obtained the final storativity map (Figure 12b).
Considering the conditions for the 2019 Paskapoo Formation, the amount of water stored in the aquifer ranged from 10 to 56 × 109 m3 (Figure 12). The distribution grid of groundwater storage in this aquifer shows that the east part of the aquifer can store up to 5920 × 103 m3/voxel, whereas most areas of the west aquifer part can only store less than 750 × 103 m3/voxel (Figure 12a). This is primarily due to the variation in storage characteristics and the high slope at the Rocky Mountain Foothills. Overall, the groundwater storage distribution grid for the Paskapoo Aquifer shows promising groundwater potential, covering about 200 km2 in the middle and northern parts of the aquifer, with a maximum groundwater storage of 4950 m3/voxel (Figure 12b).
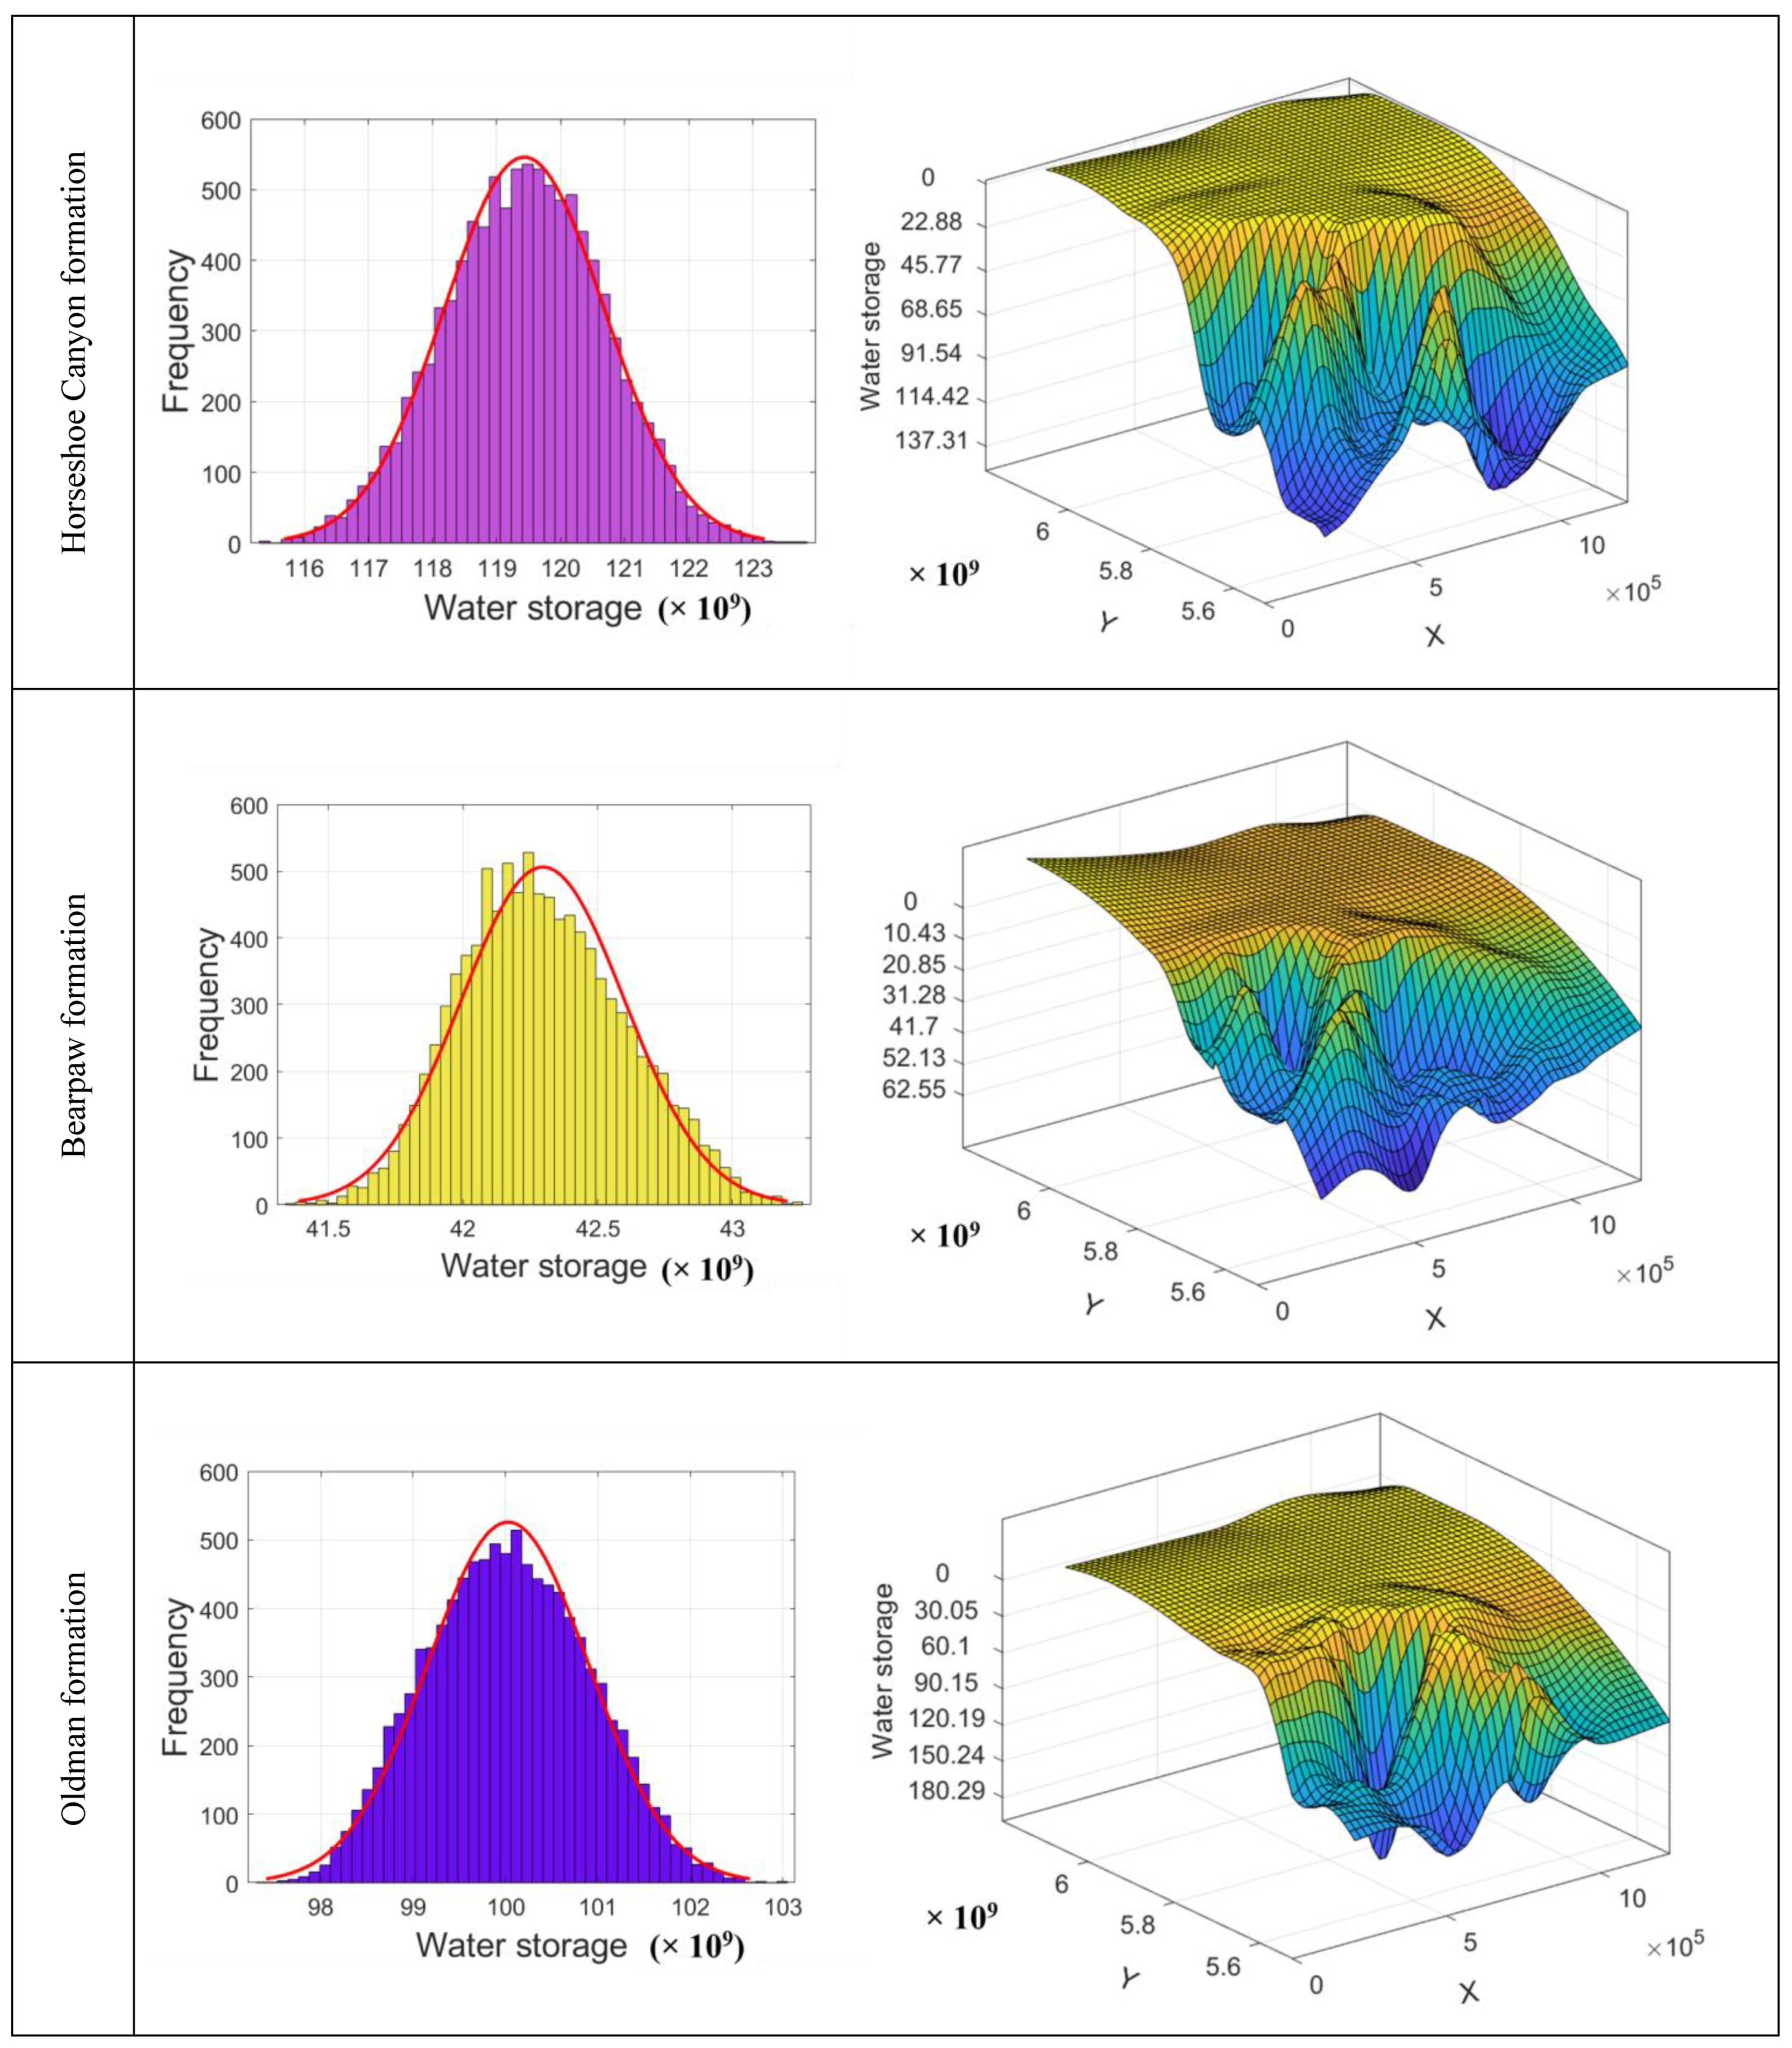
Similarly, all the storativity dates for the other formations have been deduced (Figure 13). For the Horseshoe Canyon Formation, the maximum geological reserves range from 107 to 111 × 109 m3. This formation is considered the most potential groundwater formation in this area, followed by the Oldman Formation (Figure 13). The modeled formation with the least amount of storativity is the Lea Park Formation. Its maximum geological reserves range from 37 to 38 × 109 m3.

5. Discussion

The complexity of aquifer systems can make it difficult to accurately establish a hydrogeological conceptual model, conceive a 3D geological model, and measure storativity, which can have important implications for the management and protection of groundwater resources. It is therefore important to consider these challenges when developing strategies to assess and protect groundwater resources. Indeed, calculating the storativity of a complex aquifer system can be challenging for several reasons. Firstly, complex aquifer systems can have considerable heterogeneity [30,73,74] in their geological and hydrogeological structure, as in the case of SRB aquifers, which can make it difficult to accurately characterize the porosity, permeability, and hydraulic conductivity of the aquifer. Secondly, the presence of different geological layers and the presence of fractures or faults make it difficult to accurately measure the hydraulic gradient [75,76,77]. Thirdly, the dual effect of recharge and pumping [3,14] can have a significant influence on storativity by changing the hydraulic pressure and affecting the aquifer’s ability to store water. Finally, regarding the availability of data [78], measurement of storativity requires accurate data on the hydraulic pressure, permeability, hydraulic conductivity, and porosity of the aquifer. The availability of these data may be limited in a complex aquifer system due to factors such as difficulty of access and the depth of the aquifer. In the case of the SRB, we have already mentioned the scarcity and heterogeneity of data. Therefore, many processing steps were performed before calculating the storativity of the aquifers in this research.
Therefore, to understand the functioning of this basin, we undertook in this research an initial task to collect and organize a diversified database and to conceptualize the aquifer system. Hydrogeological conceptual models are sets of assumptions describing the understanding of aquifer systems based on the available and accessible data. This means that the available evidence—i.e., all types of geological and hydrogeological data—may result in different conceptual understandings [31]. Several studies have shown that experts using the same data generally offer different interpretations of the conceptual structure [79,80,81], thus making the 3D geological modeling and GWS storage assessment work a hard task with many sources of uncertainty.
Regarding the 3D geological model, the SRB contains a complex, multi-layered structure. This important hydrosystem has no internal barriers preventing the propagation of flow between aquifer layers. The influence of the exploitation fields on the hydrodynamic behavior of the aquifers remains local, and no drop in the productivity of surface or deep drillings has been observed. The geometric heterogeneity of the aquifers, the presence of varied lithological layers, and the major actions of erosion on the thicknesses of the geological formations hinder the understanding of hydrodynamic processes as well as the prediction of the response of these systems to external forces and the estimation of reserves at the scale of a basin such as the SRB. Furthermore, the fragmentation of available geological and hydrogeological data that have been offered by the different provincial authorities (Alberta, Saskatchewan, and Manitoba) makes the task of conceptualizing and estimating reserves a particularly complex exercise.
This is why the last specific objective of this research was concentrated on the quantification and propagation of the error through the SRBS method. SRBS is particularly useful in spatial statistical models where the dependent variable has a complex spatial structure, such as spatial trends, spatial autocorrelations, edge effects, etc. This method has shown considerable effectiveness in a variety of fields, such as ecology, climatology, geology, etc. [82,83,84]. In this research, SRBS was used by combining the bagging technique with the consideration of the spatial structure of the dependent variable to improve the predictions of spatial statistical models.
Although SRBS has undeniable advantages, it also has some limitations and precautions to consider when using it [82,83,84]. The most difficult task is to adapt the method to the geological context and the implementation complexity. First, SRBS can be more complex to implement than other statistical modeling methods due to the need to account for the spatial structure of the dependent variable and spatial interactions between predictor variables. Second, SRBS may be very sensitive to data quality [83]. As with all statistical modeling methods, SRBS is sensitive to the quality and representativeness of the data used. If the data are biased or unrepresentative, it can affect the accuracy of the predictions found.

6. Conclusions

This research work examined the hydrogeological context of the Saskatchewan River Basin at a regional scale via a 3D geological modeling work, and it proposes a new framework for propagating uncertainty in storativity calculation.
The development of a 3D hydrogeological model based on uncertainty propagation, such as the one established in this paper, is probably the best way to overcome the remaining uncertainties on the distribution of water resources at a regional scale. Indeed, the spatial distribution of hydraulic parameters and water storativity is usually assessed by extrapolating point measurements (i.e., the accuracy of the spatial variability is conditioned by the 1D extrapolation). The SRBS method allowed us to calculate the optimal storativity for each of the modeled layers of the basin by considering the spatial uncertainty of these point measurements. This combination of statistical methods reduced variabilities and allowed good estimation of groundwater storage in the basin.
The final results found provide valuable information for the sustainable management of groundwater resources by allowing a better understanding of the storage capacity of the aquifer and identifying areas where groundwater resources can be used efficiently and sustainably.

Author Contributions

Conceptualization, M.H.; methodology, M.H. and K.G.; software, M.H. and K.G.; validation, M.H. and K.G.; formal analysis, M.H. and K.G.; investigation, M.H. and K.G.; resources, M.H. and K.G.; data curation, M.H. and K.G.; writing—original draft preparation, M.H. and K.G.; writing—review and editing, M.H. and K.G.; visualization, M.H. and K.G.; supervision, K.G.; project administration, K.G.; funding acquisition, K.G. All authors have read and agreed to the published version of the manuscript.

Funding

This study was funded by grants from the Natural Sciences and Engineering Research Council of Canada (NSERC Discovery Grant Number: RGPIN-2018-06101; NSERC Create Grant: 543360-2020).

Institutional Review Board Statement

Not applicable.

Informed Consent Statement

Not applicable.

Data Availability Statement

All the data collected are enumerated in Table 1. All the links were verified on the day of submission.

Acknowledgments

We thank all the data and product providers.

Conflicts of Interest

The authors declare no conflict of interest.

References

  1. Saha, G.C.; Li, J.; Thring, R.W.; Hirshfield, F.; Paul, S.S. Temporal Dynamics of Groundwater-Surface Water Interaction under the Effects of Climate Change: A Case Study in the Kiskatinaw River Watershed, Canada. J. Hydrol. 2017, 551, 440–452. [Google Scholar] [CrossRef]
  2. Jaxa-Rozen, M.; Kwakkel, J.H.; Bloemendal, M. A Coupled Simulation Architecture for Agent-Based/Geohydrological Modelling with NetLogo and MODFLOW. Environ. Model. Softw. 2019, 115, 19–37. [Google Scholar] [CrossRef]
  3. Xiang, W.; Cheng, B.; Biswas, A.; Li, Z. Geoderma Quantifying Dual Recharge Mechanisms in Deep Unsaturated Zone of Chinese Loess Plateau Using Stable Isotopes. Geoderma 2019, 337, 773–781. [Google Scholar] [CrossRef]
  4. Nong, X.; Shao, D.; Zhong, H.; Liang, J. Evaluation of Water Quality in the South-to-North Water Diversion Project of China Using the Water Quality Index (WQI) Method. Water Res. 2020, 178, 115781. [Google Scholar] [CrossRef] [PubMed]
  5. Zhu, R.; Croke, B.F.W.; Jakeman, A.J. Diffuse Groundwater Recharge Estimation Confronting Hydrological Modelling Uncertainty. J. Hydrol. 2020, 584, 124642. [Google Scholar] [CrossRef]
  6. Jiang, X.; Huang, J.G.; Cheng, J.; Dawson, A.; Stadt, K.J.; Comeau, P.G.; Chen, H.Y.H. Interspecific Variation in Growth Responses to Tree Size, Competition and Climate of Western Canadian Boreal Mixed Forests. Sci. Total Environ. 2018, 631–632, 1070–1078. [Google Scholar] [CrossRef]
  7. Saha, S.; Kundu, B.; Paul, G.C.; Mukherjee, K.; Pradhan, B.; Dikshit, A.; Abdul Maulud, K.N.; Alamri, A.M. Spatial Assessment of Drought Vulnerability Using Fuzzy-Analytical Hierarchical Process: A Case Study at the Indian State of Odisha. Geomat. Nat. Hazards Risk 2021, 12, 123–153. [Google Scholar] [CrossRef]
  8. Lian, X.; Piao, S.; Chen, A.; Huntingford, C.; Fu, B.; Li, L.Z.X.; Huang, J.; Sheffield, J.; Berg, A.M.; Keenan, T.F.; et al. Multifaceted Characteristics of Dryland Aridity Changes in a Warming World. Nat. Rev. Earth Environ. 2021, 2, 232–250. [Google Scholar] [CrossRef]
  9. La Pasta Cordeiro, M.; da Silva Junior, G.C.; Dereczynski, C.P.; Chrispim, Z.M.P.; Condesso de Melo, M.T. Analysis of Indicators of Climate Extremes and Projection of Groundwater Recharge in the Northern Part of the Rio de Janeiro State, Brazil. Environ. Dev. Sustain. 2021, 23, 18311–18336. [Google Scholar] [CrossRef]
  10. Pulido-Velazquez, M.; Peña-Haro, S.; García-Prats, A.; Mocholi-Almudever, A.F.; Henriquez-Dole, L.; Macian-Sorribes, H.; Lopez-Nicolas, A. Integrated Assessment of the Impact of Climate and Land Use Changes on Groundwater Quantity and Quality in the Mancha Oriental System (Spain). Hydrol. Earth Syst. Sci. 2015, 19, 1677–1693. [Google Scholar] [CrossRef] [Green Version]
  11. Webster, K.L.; Beall, F.D.; Creed, I.F.; Kreutzweiser, D.P. Impacts and Prognosis of Natural Resource Development on Water and Wetlands in Canada’s Boreal Zone. Environ. Rev. 2015, 23, 78–131. [Google Scholar] [CrossRef] [Green Version]
  12. Gleeson, T.; Befus, K.M.; Jasechko, S.; Luijendijk, E.; Cardenas, M.B. The Global Volume and Distribution of Modern Groundwater. Nat. Geosci. 2016, 9, 161–164. [Google Scholar] [CrossRef]
  13. Abdelmohsen, K.; Sultan, M.; Ahmed, M.; Save, H.; Elkaliouby, B.; Emil, M.; Yan, E.; Abotalib, A.Z.; Krishnamurthy, R.V.; Abdelmalik, K. Response of Deep Aquifers to Climate Variability. Sci. Total Environ. 2019, 677, 530–544. [Google Scholar] [CrossRef]
  14. Aliyari, F.; Bailey, R.T.; Tasdighi, A.; Dozier, A.; Arabi, M.; Zeiler, K. Coupled SWAT-MODFLOW Model for Large-Scale Mixed Agro-Urban River Basins. Environ. Model. Softw. 2019, 115, 200–210. [Google Scholar] [CrossRef]
  15. Hamdi, M.; Zagrarni, M.F.; Jerbi, H.; Tarhouni, J. Hydrogeochemical and Isotopic Investigation and Water Quality Assessment of Groundwater in the Sisseb El Alem Nadhour Saouaf Aquifer (SANS), Northeastern Tunisia. J. Afr. Earth Sci. 2018, 141, 148–163. [Google Scholar] [CrossRef]
  16. Yang, L.; Guan, Q.; Lin, J.; Tian, J.; Tan, Z.; Li, H. Evolution of NDVI Secular Trends and Responses to Climate Change: A Perspective from Nonlinearity and Nonstationarity Characteristics. Remote Sens. Environ. 2021, 254, 112247. [Google Scholar] [CrossRef]
  17. Kalbus, E.; Reinstorf, F.; Schirmer, M. Measuring Methods for Groundwater—Surface Water Interactions: A Review. Hydrol. Earth Syst. Sci. 2006, 10, 873–887. [Google Scholar] [CrossRef] [Green Version]
  18. Raiber, M.; Webb, J.A.; Cendón, D.I.; White, P.A.; Jacobsen, G.E. Environmental Isotopes Meet 3D Geological Modelling: Conceptualising Recharge and Structurally-Controlled Aquifer Connectivity in the Basalt Plains of South-Western Victoria, Australia. J. Hydrol. 2015, 527, 262–280. [Google Scholar] [CrossRef]
  19. Ligavha-Mbelengwa, L.; Gomo, M. Investigation of Factors Influencing Groundwater Quality in a Typical Karoo Aquifer in Beaufort West Town of South Africa. Environ. Earth Sci. 2020, 79, 196. [Google Scholar] [CrossRef]
  20. Tellam, J.H.; Barker, R.D. Towards Prediction of Saturated-Zone Pollutant Movement in Groundwaters in Fractured Permeable-Matrix Aquifers: The Case of the UK Permo-Triassic Sandstones. Geol. Soc. Spec. Publ. 2006, 263, 1–48. [Google Scholar] [CrossRef]
  21. Wang, T.Y.; Chang, C.L.; Zhou, N.Q. The Effects of Climate Change on Water Resources of Xiangjiang River Basin. J. Taiwan Agric. Eng. 2015, 61, 71–78. [Google Scholar] [CrossRef]
  22. Coffin, L.M.; Russell, H.A.J. 3D Surficial Geological Models in Canada: An Annotated Bibliography. Geol. Surv. Can. Open File 2017, 8186, 1–57. [Google Scholar] [CrossRef]
  23. Sun, A.Y.; Green, R.; Swenson, S.; Rodell, M. Toward Calibration of Regional Groundwater Models Using GRACE Data. J. Hydrol. 2012, 422–423, 1–9. [Google Scholar] [CrossRef]
  24. Rahmati, O.; Pourghasemi, H.R.; Melesse, A.M. Application of GIS-Based Data Driven Random Forest and Maximum Entropy Models for Groundwater Potential Mapping: A Case Study at Mehran Region, Iran. Catena 2016, 137, 360–372. [Google Scholar] [CrossRef]
  25. Khaki, M.; Hoteit, I.; Kuhn, M.; Forootan, E.; Awange, J. Assessing Data Assimilation Frameworks for Using Multi-Mission Satellite Products in a Hydrological Context. Sci. Total Environ. 2019, 647, 1031–1043. [Google Scholar] [CrossRef] [PubMed] [Green Version]
  26. Lee, S.; Hyun, Y.; Lee, S.; Lee, M.-J. Groundwater Potential Mapping Using Remote Sensing and GIS-Based Machine Learning Techniques. Remote Sens. 2020, 12, 1200. [Google Scholar] [CrossRef] [Green Version]
  27. Moya, C.E.; Raiber, M.; Cox, M.E. Three-Dimensional Geological Modelling of the Galilee and Central Eromanga Basins, Australia: New Insights into Aquifer/Aquitard Geometry and Potential Influence of Faults on Inter-Connectivity. J. Hydrol. Reg. Stud. 2014, 2, 119–139. [Google Scholar] [CrossRef]
  28. Jørgensen, F.; Høyer, A.S.; Sandersen, P.B.E.; He, X.; Foged, N. Combining 3D Geological Modelling Techniques to Address Variations in Geology, Data Type and Density—An Example from Southern Denmark. Comput. Geosci. 2015, 81, 53–63. [Google Scholar] [CrossRef]
  29. Watson, C.; Richardson, J.; Wood, B.; Jackson, C.; Hughes, A. Improving Geological and Process Model Integration through TIN to 3D Grid Conversion. Comput. Geosci. 2015, 82, 45–54. [Google Scholar] [CrossRef] [Green Version]
  30. Sandoval, J.A.; Tiburan, C.L. Identification of Potential Artificial Groundwater Recharge Sites in Mount Makiling Forest Reserve, Philippines Using GIS and Analytical Hierarchy Process. Appl. Geogr. 2019, 105, 73–85. [Google Scholar] [CrossRef]
  31. Hamdi, M.; Goïta, K.; Karaouli, F.; Zagrarni, M.F. Hydrodynamic Groundwater Modeling and Hydrochemical Conceptualization of the Mining Area of Moulares Redeyef (Southwestern of Tunisia): New Local Insights. Phys. Chem. Earth 2021, 121, 102974. [Google Scholar] [CrossRef]
  32. Tolche, A.D. Groundwater Potential Mapping Using Geospatial Techniques: A Case Study of Dhungeta-Ramis Sub-Basin, Ethiopia. Geol. Ecol. Landsc. 2021, 5, 65–80. [Google Scholar] [CrossRef]
  33. Russell, H.A.J.; Brodaric, B.; Keller, G.R.; Maccormack, K.E.; Snyder, D.B. A Perspective on a Three Dimensional Framework for Canadian Geology. AER AGS Spec. Rep. 2015, 101, 21–32. [Google Scholar]
  34. Di Salvo, C.; Mancini, M.; Cavinato, G.P.; Moscatelli, M.; Simionato, M.; Stigliano, F.; Rea, R.; Rodi, A. A 3d Geological Model as a Base for the Development of a Conceptual Groundwater Scheme in the Area of the Colosseum (Rome, Italy). Geosciences 2020, 10, 266. [Google Scholar] [CrossRef]
  35. Ehrendorfer, J.; National, S.; Erlmeier, K.; Formentin, G. 3D Geological Modelling of Fluvio-Glacial Aquifers to Improve Water Work Operations 3D Geological Modelling of Fluvio-Glacial Aquifers to Improve Water Work Operations. In Proceedings of the 24th EGU General Assembly, Vienna, Austria, 23–27 May 2022; pp. 3–4. [Google Scholar] [CrossRef]
  36. Statistics Canada Human Activity and the Environment: Freshwater Supply and Demand in Canada. 2010, 61. Available online: https://www150.statcan.gc.ca/n1/pub/16-201-x/16-201-x2017000-eng.pdf (accessed on 2 March 2023).
  37. Elshamy, M.; Pietroniro, A.; Wheater, H.S. Modelling the Hydrology and Streamflow of the Mackenzie River Basin. In Proceedings of the CGU & CSAFM Joint annual Scientific Meeting, Vancouver, BC, Canada, 28–31 May 2017. [Google Scholar]
  38. George, S.S. Streamflow in the Winnipeg River Basin, Canada: Trends, Extremes and Climate Linkages. J. Hydrol. 2007, 332, 396–411. [Google Scholar] [CrossRef]
  39. Hayashi, M.; van der Kamp, G.; Rosenberry, D.O. Hydrology of Prairie Wetlands: Understanding the Integrated Surface-Water and Groundwater Processes. Wetlands 2016, 36, 237–254. [Google Scholar] [CrossRef]
  40. Hendry, M.J. Hydrogeology of Clay Till in a Prairie Region of Canada. Groundwater 1988, 26, 607–614. [Google Scholar] [CrossRef]
  41. Eilers, R.G.; Eilers, E.D.; Fitzgerald, M.M. Eilers1997_Article_ASalinityRiskIndexForSoilsOfTh.Pdf. Hydrogeol. J. 1997, 5, 68–79. [Google Scholar] [CrossRef]
  42. Perez-Valdivia, C.; Sauchyn, D.; Vanstone, J. Groundwater Levels and Teleconnection Patterns in the Canadian Prairies. Water Resour. Res. 2012, 48, 1–13. [Google Scholar] [CrossRef]
  43. Berthold, S.; Bentley, L.R.; Hayashi, M. Integrated Hydrogeological and Geophysical Study of Depression-Focused Groundwater Recharge in the Canadian Prairies. Water Resour. Res. 2004, 40, 332–346. [Google Scholar] [CrossRef] [Green Version]
  44. Ireson, A.M.; van der Kamp, G.; Ferguson, G.; Nachshon, U.; Wheater, H.S. Hydrogeological Processes in Seasonally Frozen Northern Latitudes: Understanding, Gaps and Challenges. Hydrogeol. J. 2013, 21, 53–66. [Google Scholar] [CrossRef]
  45. Tóth, J. The Canadian School of Hydrogeology: History and Legacy. Ground Water 2005, 43, 640–644. [Google Scholar] [CrossRef]
  46. Cummings, D.I.; Russell, H.A.J.; Sharpe, D.R. Buried-Valley Aquifers in the Canadian Prairies: Geology, Hydrogeology, and Origin. Can. J. Earth Sci. 2012, 49, 987–1004. [Google Scholar] [CrossRef]
  47. Şener, E.; Varol, S.; Şener, Ş. Hydrochemistry and Geogenic Pollution Assessment of Groundwater in Akşehir (Konya/Turkey) Using GIS. In Computers in Earth and Environmental Sciences; Elsevier: Amsterdam, The Netherlands, 2022; pp. 477–490. [Google Scholar] [CrossRef]
  48. Li, Y.; Yan, D.; Peng, H.; Xiao, S. Evaluation of Precipitation in CMIP6 over the Yangtze River Basin. Atmos. Res. 2021, 253, 105406. [Google Scholar] [CrossRef]
  49. Dawson, F.M.; Evans, C.G.; Marsh, R. Uppermost Cretaceous and Tertiary Strat of the Western Canada Sedimentary Basin. J. Exp. Zool. 1997, 277, 345–352. [Google Scholar]
  50. Harrison, S.M.; Gentzis, T.; Payne, M. Hydraulic, Water Quality, and Isotopic Characterization of Late Cretaceous-Tertiary Ardley Coal Waters in a Key Test-Well, Pembina-Warburg Exploration Area, Alberta, Canada. Bull. Can. Pet. Geol. 2006, 54, 238–260. [Google Scholar] [CrossRef]
  51. Cheung, K.; Klassen, P.; Mayer, B.; Goodarzi, F.; Aravena, R. Major Ion and Isotope Geochemistry of Fluids and Gases from Coalbed Methane and Shallow Groundwater Wells in Alberta, Canada. Appl. Geochem. 2010, 25, 1307–1329. [Google Scholar] [CrossRef]
  52. (HCL) Hydrogeological Consultants Ltd. R Well Addendum; pp. 1–2.
  53. (HCL) Hydrogeological Consultants Ltd. County of Barrhead No. 11 Parts of the Pembina and Athabasca River Basins; W5M Regional Groundwater Assessment; Agriculture and Agri-Food Canada and the Prairie Farm Rehabilitation Administration: Ottawa, ON, Canada, 1999; Volume 1998.
  54. (HCL) Hydrogeological Consultants Ltd. County of Camrose No. 22; W5M Regional Groundwater Assessment; Agriculture and Agri-Food Canada and the Prairie Farm Rehabilitation Administration: Ottawa, ON, Canada, 2005.
  55. (HCL) Hydrogeological Consultants Ltd. Cardston County Part of the South Saskatchewan and Missouri River Basins PERMIT NUMBER P 385; W5M Regional Groundwater Assessment; Agriculture and Agri-Food Canada and the Prairie Farm Rehabilitation Administration: Ottawa, ON, Canada, 2003.
  56. (HCL) Hydrogeological Consultants Ltd. Clearwater County; W5M Regional Groundwater Assessment; Agriculture and Agri-Food Canada and the Prairie Farm Rehabilitation Administration: Ottawa, ON, Canada, 2004.
  57. (HCL) Hydrogeological Consultants Ltd. County of Minburn No. 27 Part of the North Saskatchewan River Basin PERMIT NUMBER: P 385; W5M Regional Groundwater Assessment; Agriculture and Agri-Food Canada and the Prairie Farm Rehabilitation Administration: Ottawa, ON, Canada, 1999.
  58. (HCL) Hydrogeological Consultants Ltd. Westlock County; W5M Regional Groundwater Assessment; Agriculture and Agri-Food Canada and the Prairie Farm Rehabilitation Administration: Ottawa, ON, Canada, 2000.
  59. (HCL) Hydrogeological Consultants Ltd. County of Wetaskiwin; W5M Regional Groundwater Assessment; Agriculture and Agri-Food Canada and the Prairie Farm Rehabilitation Administration: Ottawa, ON, Canada, 2008.
  60. (HCL) Hydrogeological Consultants Ltd. Wheatland County Part of the South Saskatchewan River Basin; W5M Regional Groundwater Assessment; Agriculture and Agri-Food Canada and the Prairie Farm Rehabilitation Administration: Ottawa, ON, Canada, 2003.
  61. (HCL) Hydrogeological Consultants Ltd. County of Vermilion River No. 24—Part of the North Saskatchewan and Battle River Basins—Regional Groundwater Assessment; W5M Regional Groundwater Assessment; Agriculture and Agri-Food Canada and the Prairie Farm Rehabilitation Administration: Ottawa, ON, Canada, 1999.
  62. (HCL) Hydrogeological Consultants Ltd. County of Two Hills No. 21 Part of the North Saskatchewan River Basin PERMIT NUMBER: P 385; W5M Regional Groundwater Assessment; Agriculture and Agri-Food Canada and the Prairie Farm Rehabilitation Administration: Ottawa, ON, Canada, 1999; ISBN 1800661797.
  63. (HCL) Hydrogeological Consultants Ltd. M.D. of Provost No. 52 Part of the Battle River Basin PERMIT NUMBER: P 385; W5M Regional Groundwater Assessment; Agriculture and Agri-Food Canada and the Prairie Farm Rehabilitation Administration: Ottawa, ON, Canada, 1999.
  64. (HCL) Hydrogeological Consultants Ltd. County of Forty Mile No. 8; W5M Regional Groundwater Assessment; Agriculture and Agri-Food Canada and the Prairie Farm Rehabilitation Administration: Ottawa, ON, Canada, 2004.
  65. (HCL) Hydrogeological Consultants Ltd. County of Athabasca No. 12 Part of the Athabasca River Basin PERMIT NUMBER P 385; W5M Regional Groundwater Assessment; Agriculture and Agri-Food Canada and the Prairie Farm Rehabilitation Administration: Ottawa, ON, Canada, 2000; ISBN 1800661797.
  66. (HCL) Hydrogeological Consultants Ltd. County of Stettler No. 6 Part of the Red Deer River and Battle River Basins PERMIT NUMBER: P 385; W5M Regional Groundwater Assessment; Agriculture and Agri-Food Canada and the Prairie Farm Rehabilitation Administration: Ottawa, ON, Canada, 1999.
  67. Van Everdingen, R.O. Influence of the South Saskatchewan Reservoir (Canada) on Piezometric Levels in Underlying Bedrock Aquifers. J. Hydrol. 1967, 5, 351–359. [Google Scholar] [CrossRef]
  68. Maathuis, H. Conceptual Aquifers Management Framework Study. In SRC Publication No. 12092-1C07; SRC: SK, Canada, 2007; p. 28. [Google Scholar]
  69. De La Varga, M.; Schaaf, A.; Wellmann, F. GemPy 1.0: Open-Source Stochastic Geological Modeling and Inversion. Geosci. Model Dev. 2019, 12, 1–32. [Google Scholar] [CrossRef] [Green Version]
  70. Schlosser, P.; Stute, M.; Sonntag, C.; Otto Münnich, K. Tritiogenic 3He in Shallow Groundwater. Earth Planet. Sci. Lett. 1989, 94, 245–256. [Google Scholar] [CrossRef]
  71. Struckmeier, W.F.; Margat, J. Hydrogeological Maps: A Guide and a Standard Legend. In International Contributions to Hydrogeology; Heise: Hannover, Germany, 1995; Volume 17, ISBN 3922705987. [Google Scholar]
  72. Tørvi, H.; Hertzberg, T. Estimation of Uncertainty in Dynamic Simulation Results. Comput. Chem. Eng. 1997, 21, 3–7. [Google Scholar] [CrossRef]
  73. Alkhatib, J.; Engelhardt, I.; Ribbe, L.; Sauter, M. An Integrated Approach for Choosing Suitable Pumping Strategies for a Semi-Arid Region in Jordan Using a Groundwater Model Coupled with Analytical Hierarchy Techniques. Hydrogeol. J. 2019, 27, 1143–1157. [Google Scholar] [CrossRef]
  74. Green, T.R.; Taniguchi, M.; Kooi, H. Potential Impacts of Climate Change and Human Activity on Subsurface Water Resources. Vadose Zone J. 2007, 6, 531. [Google Scholar] [CrossRef] [Green Version]
  75. D’Affonseca, F.M.; Finkel, M.; Cirpka, O.A. Combining Implicit Geological Modeling, Field Surveys, and Hydrogeological Modeling to Describe Groundwater Flow in a Karst Aquifer. Hydrogeol. J. 2020, 28, 2779–2802. [Google Scholar] [CrossRef]
  76. Hamdi, M.; Zagrarni, M.F.; Djamai, N.; Jerbi, H.; Goita, K.; Tarhouni, J. 3D Geological Modeling for Complex Aquifer System Conception and Groundwater Storage Assessment: Case of Sisseb El Alem Nadhour Saouaf Basin, Northeastern Tunisia. J. Afr. Earth Sci. 2018, 143, 178–186. [Google Scholar] [CrossRef]
  77. Purvis, K.; Kao, J.; Flanagan, K.; Henderson, J.; Duranti, D. Complex Reservoir Geometries in a Deep Water Clastic Sequence, Gryphon Field, UKCS: Injection Structures, Geological Modelling and Reservoir Simulation. Mar. Pet. Geol. 2002, 19, 161–179. [Google Scholar] [CrossRef]
  78. Sood, A.; Smakhtin, V. Revue Des Modèles Hydrologiques Globaux. Hydrol. Sci. J. 2015, 60, 549–565. [Google Scholar] [CrossRef]
  79. Harvey, J.; Gomez-Velez, J.; Schmadel, N.; Scott, D.; Boyer, E.; Alexander, R.; Eng, K.; Golden, H.; Kettner, A.; Konrad, C.; et al. How Hydrologic Connectivity Regulates Water Quality in River Corridors. J. Am. Water Resour. Assoc. 2019, 55, 369–381. [Google Scholar] [CrossRef]
  80. Massuel, S.; Riaux, J.; Molle, F.; Kuper, M.; Ogilvie, A.; Collard, A.L.; Leduc, C.; Barreteau, O. Inspiring a Broader Socio-Hydrological Negotiation Approach With Interdisciplinary Field-Based Experience. Water Resour. Res. 2018, 54, 2510–2522. [Google Scholar] [CrossRef] [Green Version]
  81. Sophocleous, M. Interactions between Groundwater and Surface Water: The State of the Science. Hydrogeol. J. 2002, 10, 52–67. [Google Scholar] [CrossRef]
  82. Arabameri, A.; Saha, S.; Roy, J.; Tiefenbacher, J.P.; Cerda, A.; Biggs, T.; Pradhan, B.; Thi Ngo, P.T.; Collins, A.L. A Novel Ensemble Computational Intelligence Approach for the Spatial Prediction of Land Subsidence Susceptibility. Sci. Total Environ. 2020, 726, 138595. [Google Scholar] [CrossRef] [PubMed]
  83. Prasad, A.M.; Iverson, L.R.; Liaw, A. Newer Classification and Regression Tree Techniques: Bagging and Random Forests for Ecological Prediction. Ecosystems 2006, 9, 181–199. [Google Scholar] [CrossRef]
  84. Chen, W.; Hong, H.; Li, S.; Shahabi, H.; Wang, Y.; Wang, X.; Ahmad, B. Bin Flood Susceptibility Modelling Using Novel Hybrid Approach of Reduced-Error Pruning Trees with Bagging and Random Subspace Ensembles. J. Hydrol. 2019, 575, 864–873. [Google Scholar] [CrossRef]
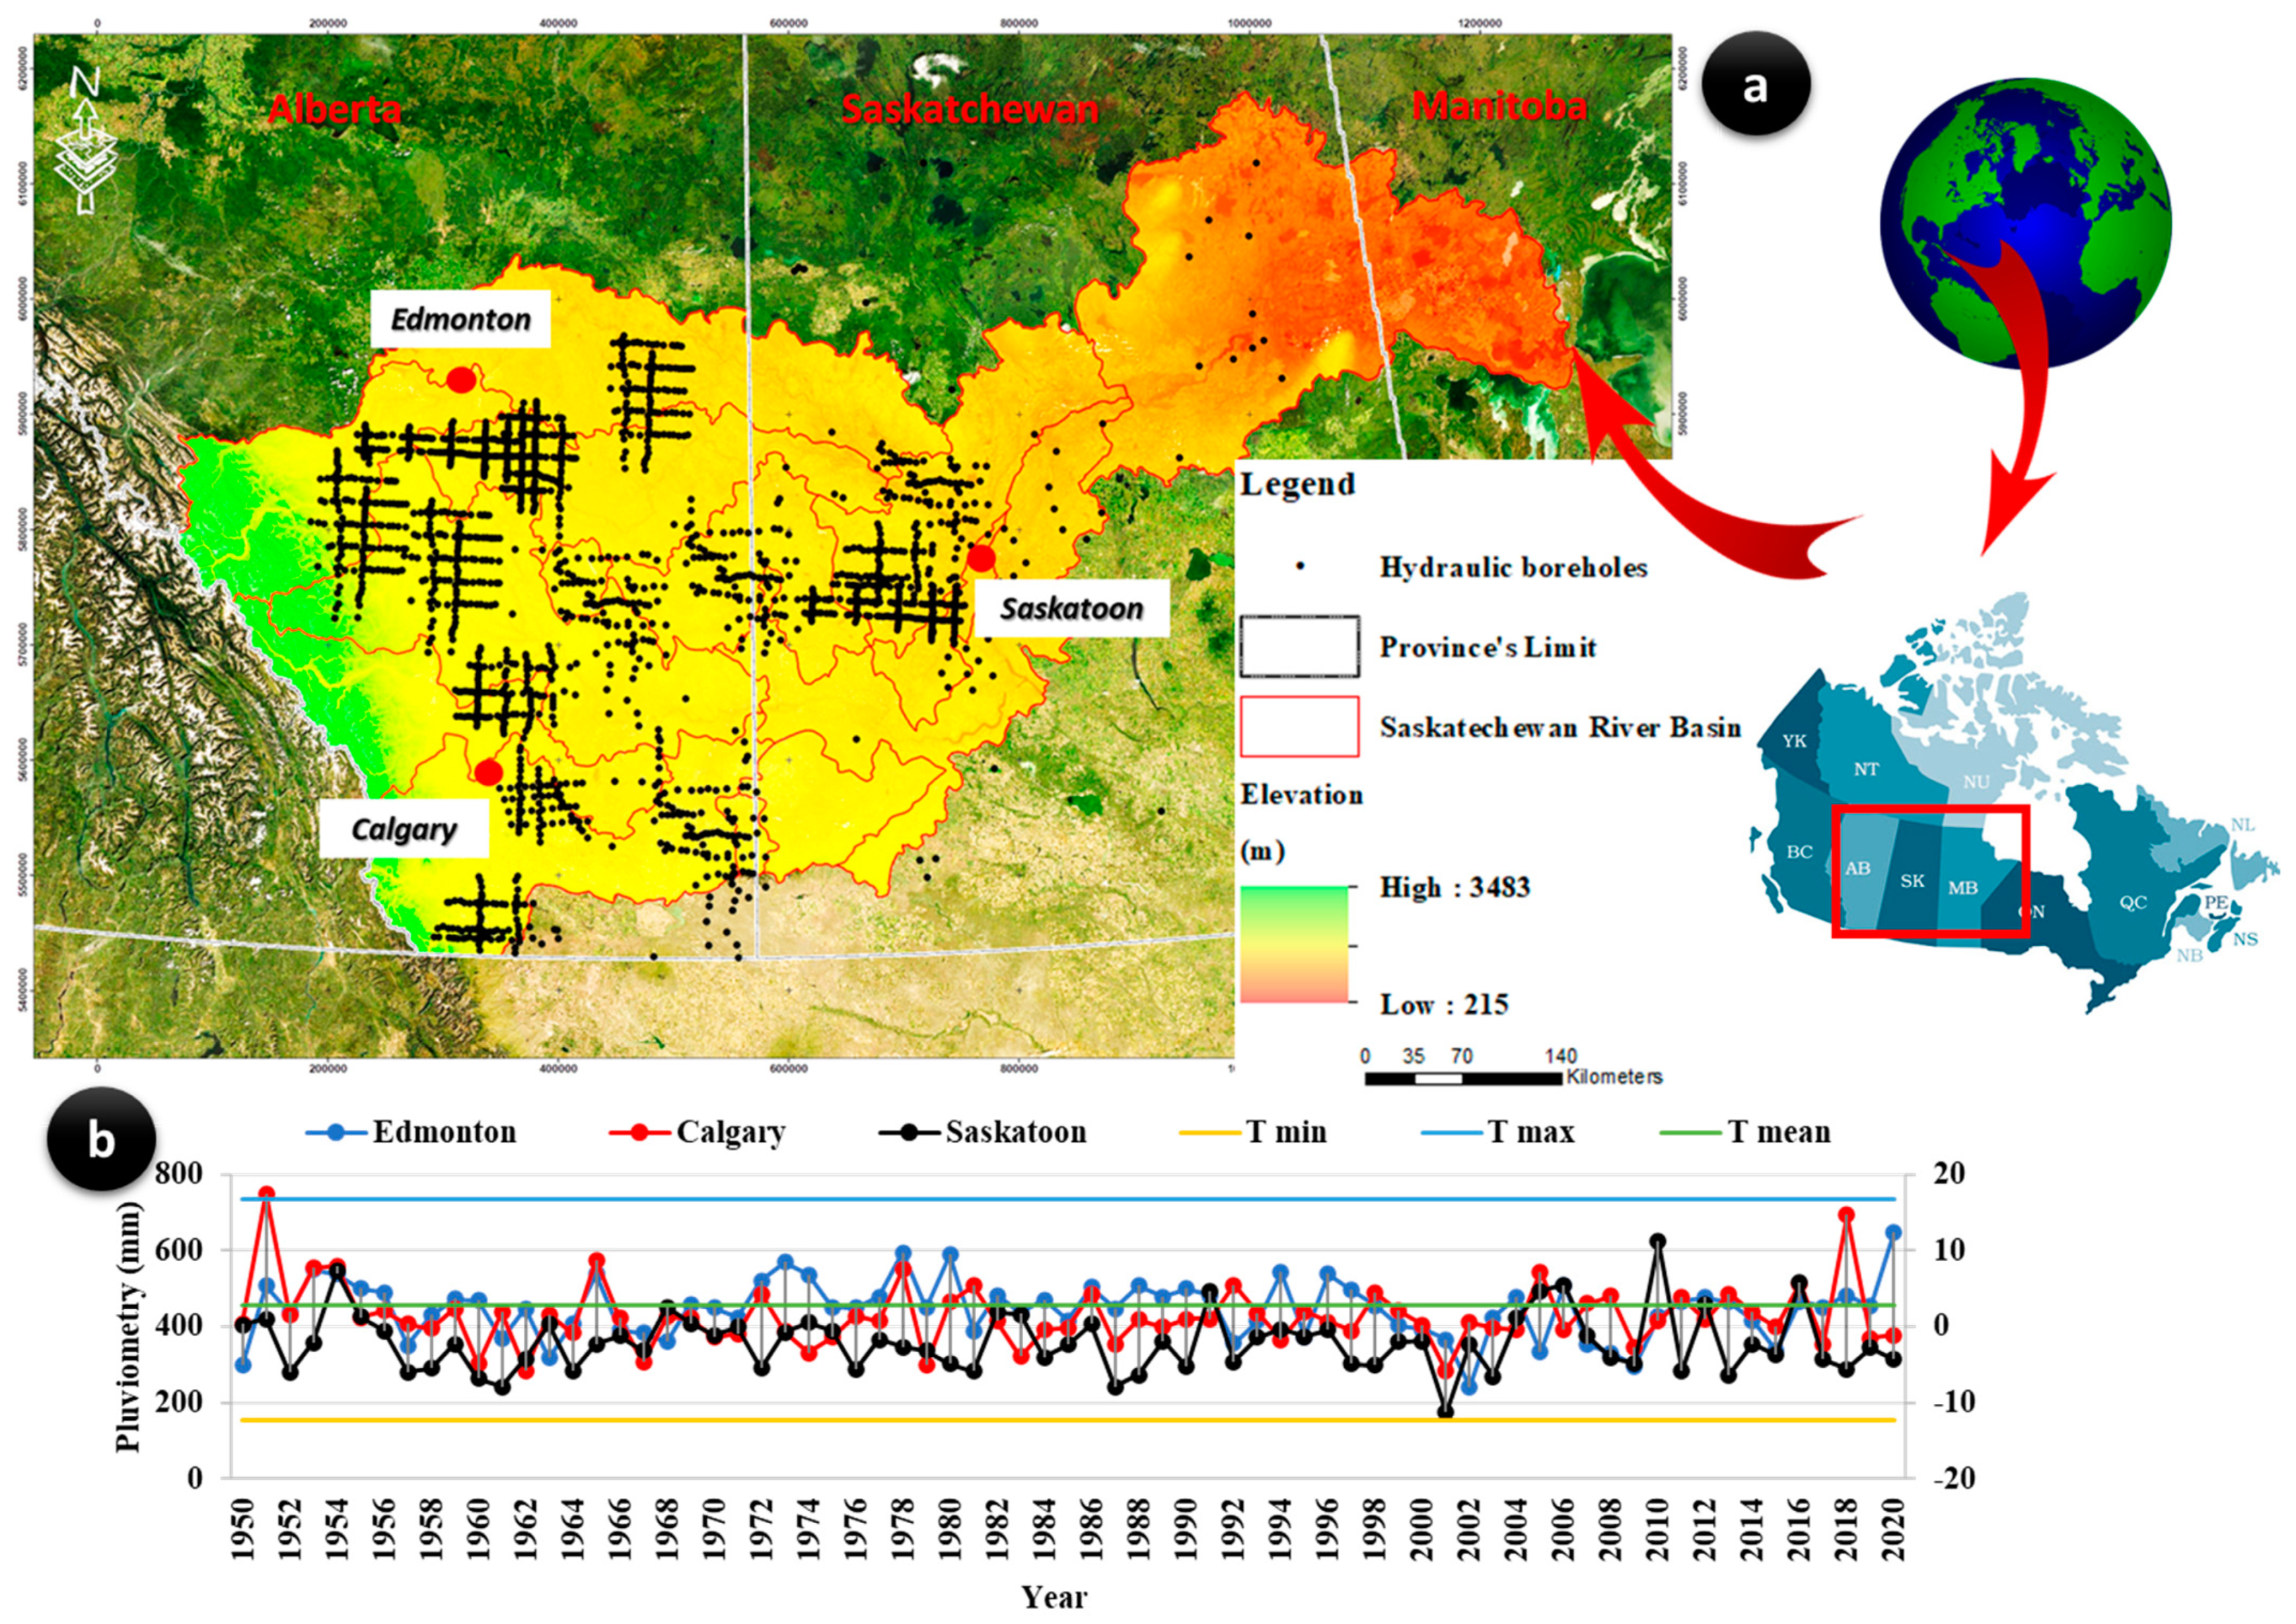
Figure 1. (a) Geographic localization of the Saskatchewan River Basin (SRB) and sample hydraulic boreholes. (b) Climatological characteristics of the SRB: mean between 1950 and 2020 (Government of Canada, Weather, Climate, and Hazard: past weather and climate, 2021).
Water 15 01156 g001
Figure 2. Stratigraphic column of the Saskatchewan River Basin.
Water 15 01156 g002
Figure 3. Methodological scheme for the construction and implementation of the hydrogeological conceptual model of the SRB: (a) database design and preparation, (b) 3D geological modeling using a geostatistical study, and (c) the uncertainty assessment using the SRBS and groundwater storativity estimation.
Water 15 01156 g003
Figure 4. (a) Stratigraphic log of the boreholes used in 3D geological modeling. (b) Fence diagram of the geological model. (c) Legend of the modeled geological formations.
Water 15 01156 g004
Figure 5. Mean transmissivity values of aquifer layers: (a) position of cross-sections, (b) several transmissivity values that were collected for each aquifer layer, (c) mean transmissivity values of aquifer layers along cross-section 1, and (d) average transmissivity values of aquifer layers along cross-section 2. ** = uncaptured aquifer.
Water 15 01156 g005
Figure 6. (a) Different sources of uncertainty taken into consideration in the modeling work and (b) errors in the hydrodynamic parameters.
Water 15 01156 g006
Figure 7. Workflow of the new spatial random bagging simulation (SRBS) system (WS: water storage).
Water 15 01156 g007
Figure 8. Hydrogeological conceptual model (SW-NE transect) of the Saskatchewan River Basin. P indicates annual precipitation.
Water 15 01156 g008
Figure 9. Proposed 3D geological model of the Saskatchewan River Basin.
Water 15 01156 g009
Figure 10. Spatial distribution of surficial aquifer thicknesses: circles and squares represent upper and lower sand and gravel aquifer thicknesses, respectively, while triangles represent aquifer lens thicknesses.
Water 15 01156 g010
Figure 11. MAE vs. the number of iterations and observed vs. estimated values of the hydraulic head, the mean thickness, and the porosity based on the chosen optimal range.
Water 15 01156 g011
Figure 12. (a) Example of lower, upper, and normal storativity map calculated after SRBS, Paskapoo Formation. (b) Final storativity map for Paskapoo Formation.
Water 15 01156 g012
Figure 13. Variation of the maximum geological reserves of the different modeled formations.
Water 15 01156 g013aWater 15 01156 g013b
Table 1. Presentation of climatic, geological, and hydrogeological data and their sources. Note: n.d. = no date available. (access date: all the links was verified on the 3 March 2023).
Category Data Type Description
ClimatePrecipitation Daily measurements at 13 rainfall stations (1950–2020)
Source: Government of Canada, historical climate data
TemperatureMinimum, maximum, and mean temperatures (1950–2020)
Source: Government of Canada, historical climate data, https://climate.weather.gc.ca/historical_data/search_historic_data_e.html
EvapotranspirationA map of average annual potential evapotranspiration (PET) from soil and plant surfaces in areas of continuous ground cover and sufficient soil moisture for plant use
Source: Government of Canada (Natural Resources Canada)
WindDaily wind speed and direction from 1959 to the present
Source: Government of Canada, historical climate data, https://climate.weather.gc.ca/historical_data/search_historic_data_e.html
Relative humidityPercentage values from 1959 to the present
Source: Government of Canada, historical climate data, https://climate.weather.gc.ca/historical_data/search_historic_data_e.html
Sunshine Hours and duration of sunshine from 1950 to the present
Source: Government of Canada, historical climate data, https://climate.weather.gc.ca/historical_data/search_historic_data_e.html
HydrogeologyHydraulic wells Structure, lithology, and hydrodynamic parameters
Data (lithological sections and logs) and hydraulic soundings
Pump tests conducted on public and private water wells
Source 1 (Alberta): Alberta Water Well Information Database, https://www.alberta.ca/alberta-water-well-information-database.aspx
Source 2 (Saskatchewan): Water Security Agency, Saskatchewan, https://www.wsask.ca/water-info/ground-water/observation-well-network/
Source 3 (Manitoba): The Groundwater Management Section, Manitoba https://www.gov.mb.ca/water/groundwater/wells_groundwater/index.html
Piezometric histories for several monitoring points
Source 1 (Alberta): Groundwater Observation Well Network, Alberta, https://www.alberta.ca/lookup/groundwater-observation-well-network.aspx
Source 2 (Saskatchewan): Water Security Agency, Saskatchewan, https://www.wsask.ca/water-info/ground-water/observation-well-network/
Source 3 (Manitoba): data are not available
Surface water Gauging in control sections: water level and daily, monthly, and annual flow
Their characteristics (conductance, topography, etc.)
Common source for the three provinces: Explorateur de données d’Environnement et Changement Climatique Canada, base de données HYDAT,
https://www.canada.ca/fr/environnement-changement-climatique/services/eau-apercu/volume/surveillance/releves/produits-donnees-services/archives-nationales-hydat.html
Common source for the three provinces: Historical Hydrometric Data Search,
https://wateroffice.ec.gc.ca/search/historical_e.html
Geology 1:250,000 geological maps that have been digitized and which include the following attributes:
Geological units
Formations
Faults
Outcrop lithology
Coefficient of permeability
Common source for the three provinces: GEOSCAN (Geological Survey of Canada (GSC)) Publications Database,
https://geoscan.nrcan.gc.ca/starweb/geoscan/servlet.starweb?path=geoscan/geoscan_f.web
Geophysical data Results of geophysical campaigns in several sectors of the provinces
Common source for the three provinces: Natural Resources Canada (NRC),
http://gdr.agg.nrcan.gc.ca/gdrdap/dap/index-fra.php?db_project_no=429&db_project_part=1;2;3
PedologySoil unit (Soil type, rock, type of rock, saline load, texture, etc.)
Common source for the three provinces: Canadian Soil Information Service (CanSIS), Government of Canada,
https://sis.agr.gc.ca/siscan/nsdb/slc/index.html
Gas and oil wellsHeader
Drill/Summary
Geology of the well
Licensee, status, fluid (water or gas), type (exploitation or injection), depths, location
Casing, types of cement, completion summary
Stratigraphic log: depths and formation
Common source for the three provinces: Petro Ninja Maps,
https://petroninja.com/
Archived data: scientific articles, internal reports, theses, dissertationsScientific articles
Internal reports
[39,40,41,42,43,44,45,46,47,48,49,50,51,52,53,54,55,56,57,58,59,60]
Table 2. Abscissas and weights for the standard normal distribution.
Nodes (Opt)   z i   w i
101
2−1, +1½, ½
3   - 3   ,   0 , + 3 1/6, 2/3, 1/6
Table 3. Variogram characteristics for each modeled geological formation.
FormationMathematical Variogram ModelCorrelation CoefficientAnisotropy Ratio Nugget Relative SillMajor Axis Direction Minor Axis Direction Major Axis RangeMinor Axis Range
Paskapoo FormationGaussian without nugget0.910.84049144.694.6170,835143,854
Horseshoe Canyon FormationGaussian without nugget0.920.903787.9176.186.1172,975156,145
Bearpaw FormationGaussian without nugget0.940.95029189.999.9176,416171,074
Oldman FormationGaussian without nugget0.950.8102490177.187.1188,086153,192
Foremost FormationExponential without nugget0.930.79040271.191.1182,141143,957.2
Lea Park FormationExponential without nugget0.890.55016,977292189,186103,874
Milk River FormationExponential without nugget0.920.5011,6690.290.2252,468125,141
Colorado FormationExponential without nugget0.930.79040271.191.1182,141143,957
Mannville FormationExponential with nugget0.890.44066451.991.921,95995,779
Devonian FormationExponential without nugget0.860.5223760270.790.623,145100,584
Cambrian FormationExponential without nugget0.940.76029100.190.1183,626140,234
Precambrian FormationExponential without nugget0.920.5011,6690.290.2252,468125,141
Disclaimer/Publisher’s Note: The statements, opinions and data contained in all publications are solely those of the individual author(s) and contributor(s) and not of MDPI and/or the editor(s). MDPI and/or the editor(s) disclaim responsibility for any injury to people or property resulting from any ideas, methods, instructions or products referred to in the content.