Article

Dynamic Simulation Study on Water-Supply Volume of the Hanjiang-to-Weihe River Water Diversion Project

1
State Key Laboratory of Eco-Hydraulics in the Northwest Arid Region, Xi’an University of Technology, Xi’an 710048, China
2
Hanjiang-to-Weihe River Valley Water Diversion Project Construction Co., Ltd., Xi’an 710100, China
*
Author to whom correspondence should be addressed.
Water 2023, 15(4), 627; https://doi.org/10.3390/w15040627
Submission received: 25 November 2022 / Revised: 30 January 2023 / Accepted: 2 February 2023 / Published: 5 February 2023
(This article belongs to the Section Water Resources Management, Policy and Governance)

Abstract

:
The calculation of water supply is affected by many factors, such as water requirements, water-supply capacity, etc., which change with time and the environment. The traditional calculation methods are generally used under several fixed operating situations. The scenarios are too few to cover the various situations encountered in actual operations and take insufficient account of boundary conditions, such as reservoir inflow, water requirements, etc. The water-supply schemes facilitated by these methods are finite and not adaptable to the ever-changing, producing environment. Therefore, based on a traditional water supply-demand balance analysis, this study established a dynamic calculation model that takes into account different variables, such as reservoir inflow, ecological flow, and water demand. This study also constructed a dynamic simulation system based on the comprehensive, integrated platform and dynamic calculation model, which shortens the calculation period from a month to a day. The results show that the water-supply assurance rates calculated under different conditions reach higher than 93.9% for domestic and production, and higher than 50.9% for agriculture, which all exceed the design assurance rates. Additionally, the dynamic calculation model can significantly improve the calculation efficiency, playing an important role in the formulation of the project-operation plan and project-benefit evaluation.

1. Introduction

The Hanjiang-to-Weihe River Water Diversion (HWWD) Project is known as the “South-to-North Water Diversion Project” in Shaanxi Province. It is one of the largest and most influential water-resource operations and dispatch projects in China. With the steady progress of the project, researching project operations from an adaptive perspective is urgently required.
The most basic method of water-resources management and exploitation is a water-resources supply-demand balance analysis. Many relevant studies on water management are based on this scientific analysis method. Some studies have established balance models of water resources in different areas and analyzed the water supply-demand balance using various typical situations to provide an essential basis for the rational use of water resources when alleviating water shortages [1,2,3,4]. Some researchers carried out the planning and design of water conservation projects using a water supply-demand balance [5,6,7]. Additionally, some other studies have used this method to analyze the impact on the supply-and-demand balance of different factors (sustainability levels, water conservation policies, recycled water, etc.) in certain regions [8,9,10]. Those studies considered the many factors affecting the supply-and-demand side. They are useful for some typical and fixed operation simulations, but it is difficult to guide the actual engineering operation due to a limited adaptability.
The available water supply is the information element of the water supply-demand balance analysis. Additionally, it is also the principal calculation indicator for the supply side. The calculation results of available water supply directly affect the results of the water supply-demand analysis. Some studies used different methods to analyze the water supply, which provided essential ways to calculate the water supply of the projects and basins [11,12]. Some other studies also investigated the factors affecting water availability through scenario analysis and applied them to actual water-supply planning [13]. There are also some more targeted studies that take the water supply as the research focus, thus, exerting the maximum water-supply capacity of the reservoir [14,15,16]. These studies have the value of practical applications for efficient water-resource management and meeting various water requirements. However, there are still some problems that need to be solved about available water supply, such as the incomplete consideration of the factors affecting water supply and fixed situations leading to poor adaptability, and the literature did not fully take the dynamic changes into account.
There are also some applied studies about water supply and a water supply–demand balance analysis. Browne conducted a practice-oriented study on water-supply sustainability, which inspired the application of related research to real life [17]. Additionally, Aoun-Sebaiti has developed a water evaluation and planning system, which uses scenarios to simulate the impact of dynamic-supply and variable-development patterns on water supply and demand [18]. The above studies show the positive changes of using information technology to solve actual water-resource management problems; however, the small number of management solutions obtained using scenario simulations cannot be adapted to the complex and changing actual environment.
Many studies have been conducted on the issue of water-resource allocation and supply since the planning and design stage of the HWWD Project. Xiao and Kong established an allocation model and solved the issue using optimization algorithms, which provided some guidance for the project’s operation and scheduling [19,20]. Hui analyzed and calculated the water-supply volume for the HWWD Project and obtained a result for some typical scenarios [21]. Lei et al. analyzed different risk profiles, assessments, and methods of control by establishing the discharge system-failure risk-calculation theory of the Sanhekou Reservoir, which is considerable for making improvements to project management [22]. The studies described above show that many researchers remain at a macroscopic and theoretical perspective, which focuses on the optimization dispatch and operation model, and emphasize an optimal solution under a few typical scenarios. However, this project will face different and complex operation situations that are far different from the generalization of one or several optimal operation situations. Therefore, those studies have a weak effect in guiding the operation and dispatch of the HWWD Project.
The traditional calculation of water supply involves a water volume that the hydraulic projects can provide to meet a water demand under different typical years, guarantee rates, or frequencies. It is generally carried out by a monthly calculation method. From the above studies, we observed some problems in the traditional calculation of available water-supply volume. First, the unit of calculation period is a month, which is an interval that is too long. Second, the traditional method only considers the impact of the supply side, and its in-demand side is weak, which is quite different from the actual situation of supply-and-demand as a whole. Finally, the calculation method is overgeneralized, which does not accord with the practical water-use situations of different levels and industries. Therefore, adopting a new calculation method is vital to overcome the above problems.
Due to the practical situations of water conservation projects and requirements of water-resource-management businesses, research should consider more comprehensive influential factors to achieve high-accuracy simulations of water resources, laying the foundation for the guidance of actual water-resource management and hydraulic-engineering operations. Therefore, given the practical situations of water resources and diversion projects, this study established a dynamic calculation-model of water supply. This model considers the various influential factors of water supply to build the calculated model. Furthermore, we used the Comprehensive Integrated Platform (CIP) to construct the dynamic calculation model [23,24]. To better illustrate the dynamic calculation model, we established a calculation model that considered influencing factors, including the inflow of supply reservoirs, ecological flow, and water demand in the receiving area of the project. We also constructed a dynamic simulation system using the CIP to calculate the water-supply volume. The simulation system separately depicts the supplied object, operation business, and flow of the physical project togther with the topology diagram, business components, and data flow, respectively. By changing the input and boundary conditions of the compute components, the simulation system changes the fixed and few situations into operational situations that consider more influential factors. The system realizes the calculation and decision-making process of the computer through information technology and simulates different, practical operational situations. Therefore, the simulation system realizes the change in the operation-calculation situations, from the finite to the infinite, which means that any operational situation can be calculated by changing the model’s input, methods, and boundary conditions. The calculation model of the water supply and the simulation system make up the dynamic simulation system, which lays a foundation for the operational decision and the improvements to the operational benefit of the HWWD Project.
This paper proposes a dynamic water-supply model based on a water supply–demand balance and the CIP and its application to a simulation of complex diversion systems with multiple supply-and-demand objects. The dynamic water supply model was constructed based on engineering operation rules, in which water conversion and movement in the system are informalized and clearly described. The natural and artificial water processes are described simply and comprehensively under reasonable assumptions, and various results and information are provided based on supply-and-demand conditions. Ultimately, we obtained a new method to perform a fast and accurate simulation of water supply-and-demand through repeated testing and refinement of the dynamic water-supply model.

2. Calculation Model of Water Supply

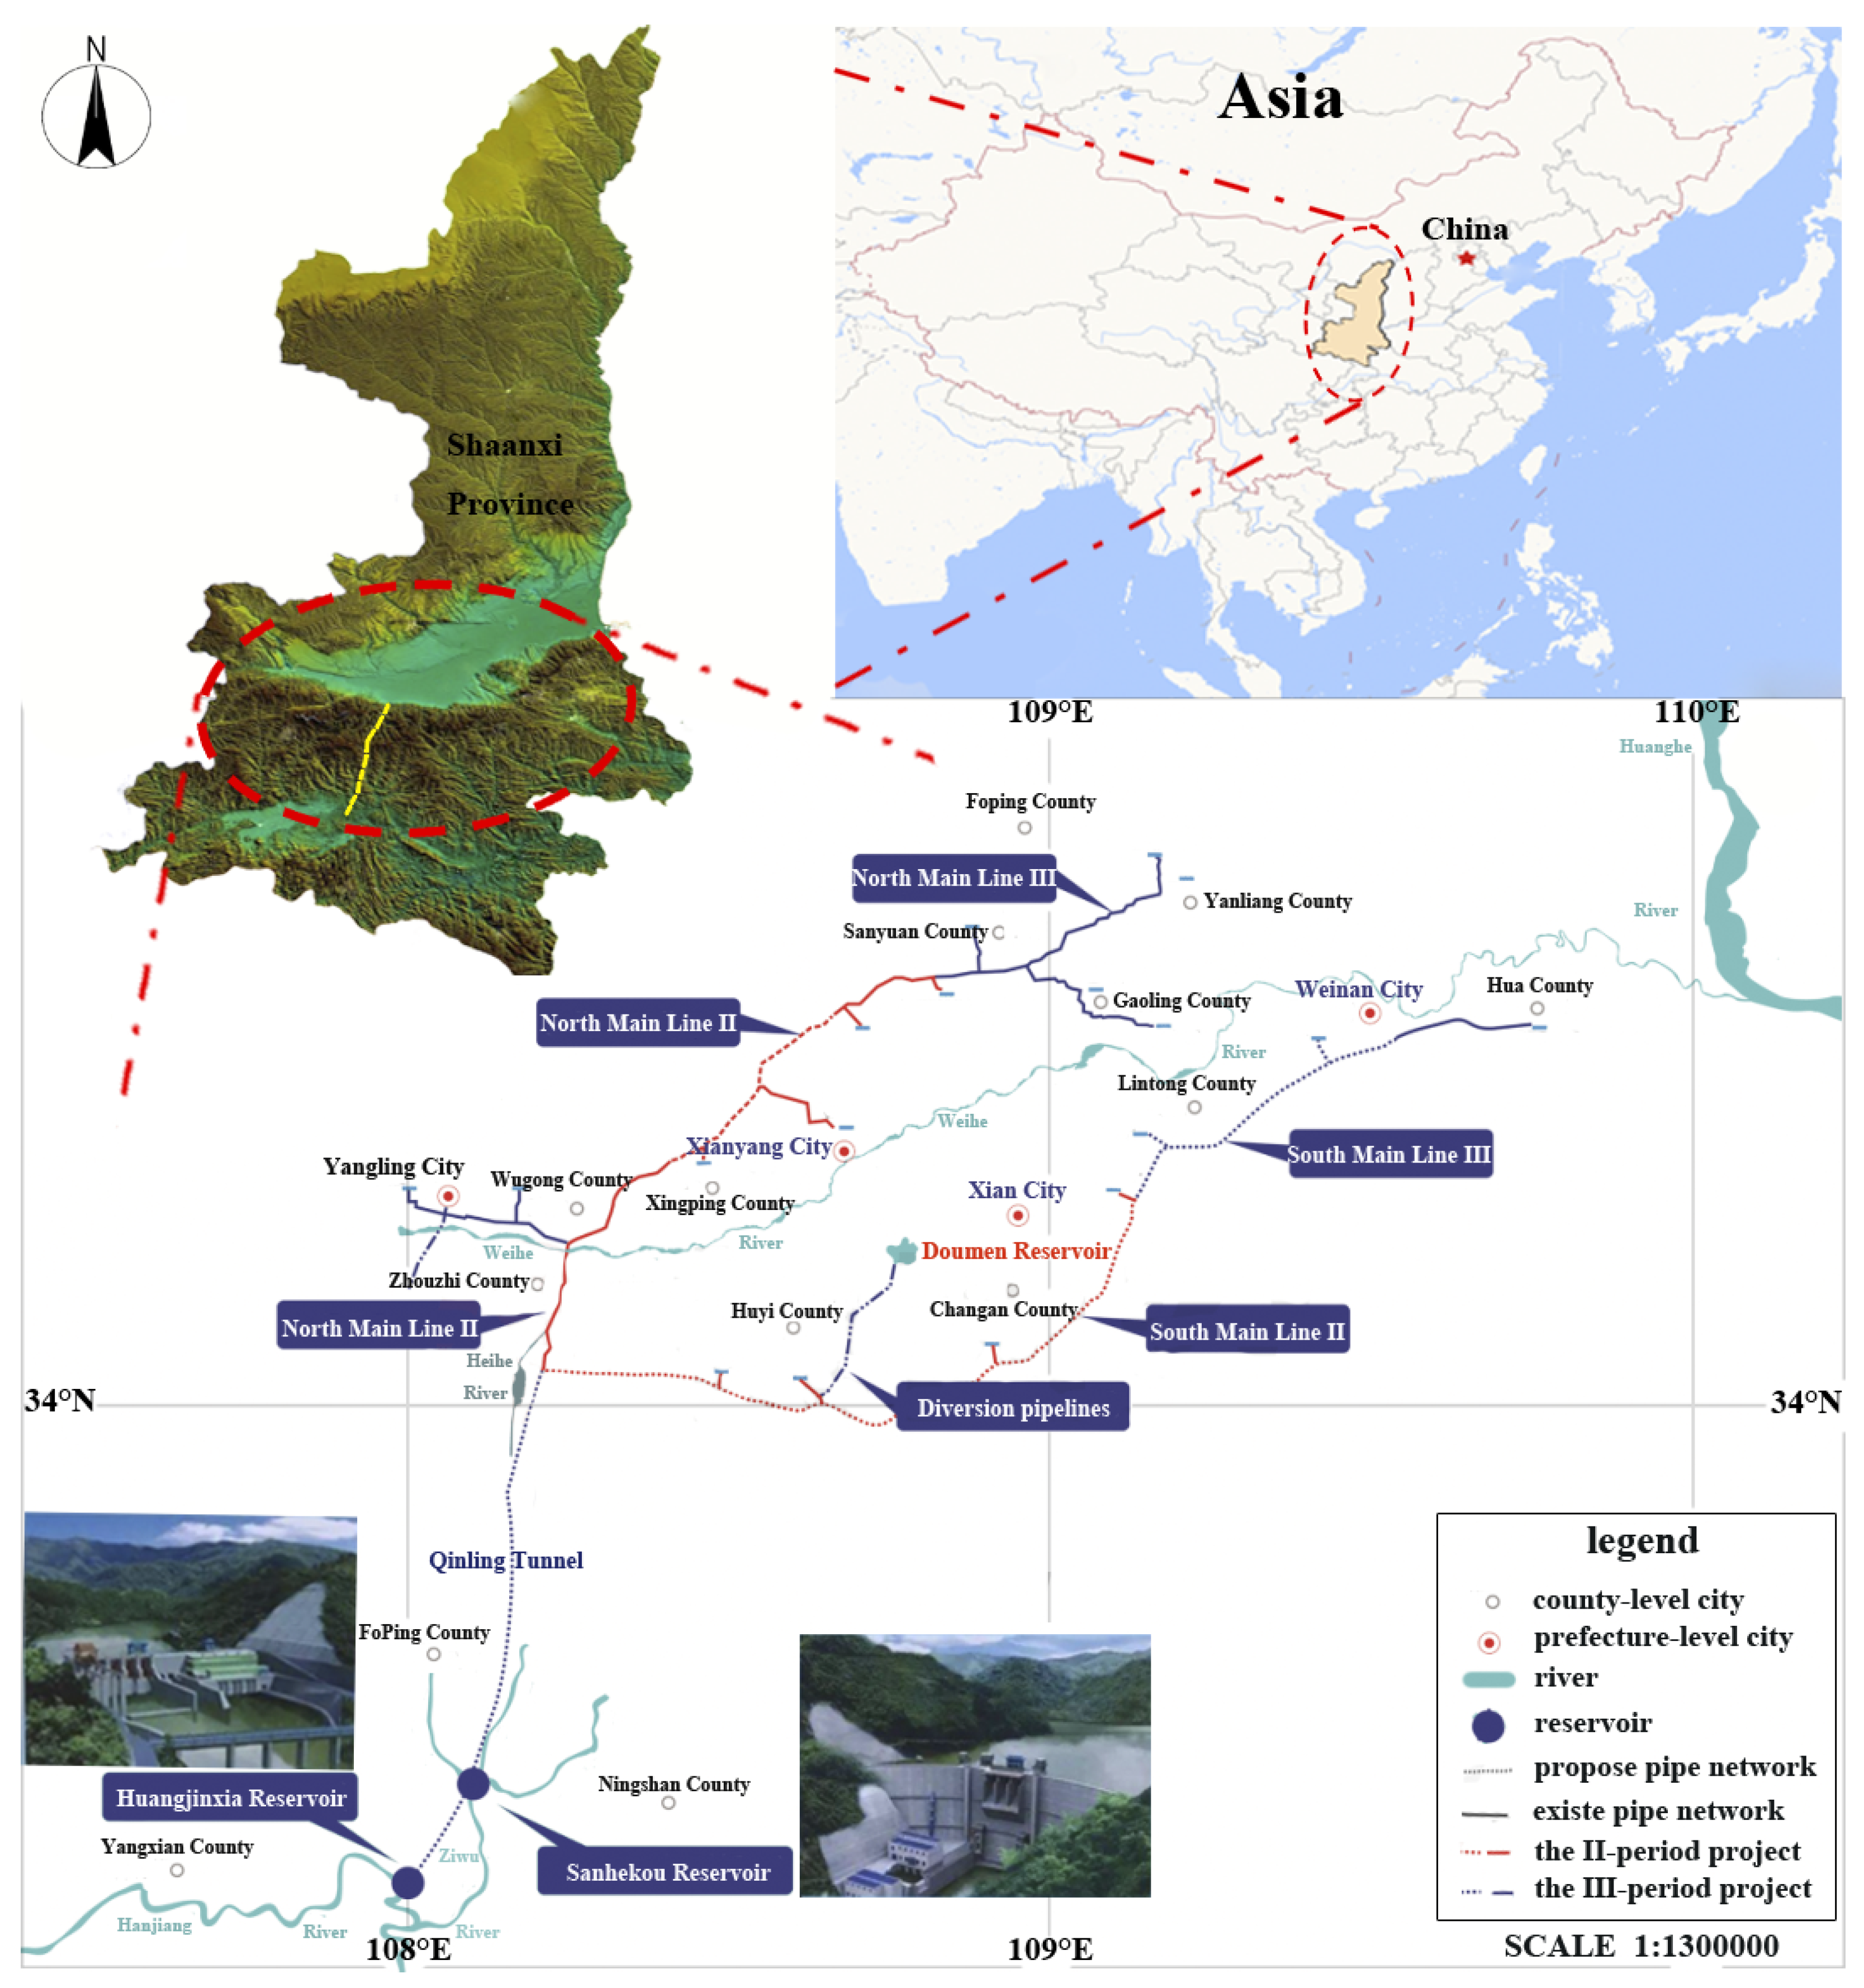
2.1. Overview of the Study Area

The HWWD Project is a typical trans-basin water-diversion project. Additionally, it is also a milestone in the history of water conservation projects in terms of engineering quantity and technical difficulty around China. The whole project is composed of two parts, one is the water diversion project, and another is the water transport and distribution project. The diversion project consists of three parts, namely the Sanhekou Reservoir, Huangjinxia Reservoir, and Qinling underground water-transmission tunnel. The water transportation and distribution project consists of the Huangchigou pivotal project, the south and north pipeline of the Weihe River, and the corresponding branch pipeline (Figure 1). The HWWD Project and the reservoirs in the receiving area together meet the water requirements for the receiving area.
The HWWD Project transfers abundant water resources from the Han River basin to the Weihe River basin through the Qinling tunnel. Additionally, the project also is one of the most important engineering measures that alleviates the lack of water resources in the Guanzhong area. The project’s task is to meet the water requirements of major and county-level cities, as well as the industrial parks along the Weihe River in the Guanzhong area. This engineering measure not only gradually returns the agricultural and ecological occupied water to the local area but also promotes improvements to the ecological environment.

2.2. Dynamic Calculation Model of Water Supply

The dynamic calculation model of water supply is based on the traditional calculation method. According to the HWWD Project’s practical operation situations, the incoming water in different target years, different water requirements in receiving areas, different downstream ecological flows, and other factors constitute the simulation-calculation situations. The more factors considered, the closer the relationship between the simulation and practical situations. Therefore, it is necessary to generate water-supply schemes under multiple situations through calculating reservoir-runoff regulations and supply-and-demand calculations [25].
The dynamic calculation model analyzes the balance of supply-and-demand based on the water-supply principle and acquires the water-supply volume through reverse calculation. According to the steps of the water-supply calculation model, first, we need to analyze the water requirements of the source and receiving areas. The water requirement comprises five parts: domestic, production, agricultural, downstream ecological, and eco-environment. The production-water requirement includes secondary (thermal power, general, and construction industries) and tertiary industries (catering industry). Additionally, the eco-environment water requirement includes urban green space and the replenishment of urban rivers and lakes. The water requirement is determined by the quota method used to simplify the calculation.
The water requirements of downstream ecology should be met first when calculating the water-supply volume; therefore, it should be deducted before water diversion. In the calculation of water-supply volume, we took the water requirement of downstream ecology as the variable factor, which can be calculated using 10% of the annual average runoff, the minimum monthly average discharge in the last 10 years, and the Q90 method, respectively [26].
The long-series method calculates reservoir regulations with long series of hydrological data. According to the project’s basic characteristics and operation principles, we carried out the daily operation calculation in this sequence: First, ensuring the water diversion meets the demand for downstream ecological water; next, determining whether it meets the water requirements for urban residents; then, determining whether it meets the ecological water requirements; and finally, making sure it meets the production water requirements. The explanation of parameters and variables that appear in the following content, such as water volume (104 m3) and flow (m3/s), is given in the Nomenclature. The calculation steps are as follows:
Calculation model:
Input: reservoir inflow runoff series, engineering parameters, and water requirements for different users.
Output: the variable water supply of receiving area.
Steps of calculation:
Step 1: The water requirements of each type of water user in different years are calculated by the fixed-amount method. Water requirements include Wdn, Wpn, Wan, and Wen.
Step 2: The principle of water supply in the water source area is priority, thereby meeting the downstream water requirements before water supply. Based on this principle, the water supply is calculated using the daily regulation of the reservoir.
2.1 Based on the dispatching interval of the Sanhekou Reservoir (Table 1), we determined the operation method of reservoirs in the water source area, and calculated the Wsp_max and Wb_max.
2.2 We determined the operation method of the Huangjinxia Reservoir according to its dispatching interval (Table 2) and then calculated the Wsp and Wb.
Step 3: According to the reservoir application principles of the reservoirs in the receiving area, the priority was to meet the Wre and then carry out the daily regulation calculation to obtain the Wrp.
Step 4: We calculated the actual water supply for each type of water object through a supply-and-demand balance analysis in the receiving area. If the calculated result is less than 0, we assumed it was 0.
4.1 The water supply from the source area was mainly used as domestic and production water. The actual water supply volume of domestic is:
W p p = { W d n , ( W s p W d n ) W s p , ( W s p < W d n )

The actual production water supply volume can be calculated as follows:
W p p = { W p n , ( W s p W d n + W p n ) W s p W d n , ( W s p < W d n + W p n )

4.2 The water supply from the receiving area is mainly used as agricultural and ecological environment water. The actual agricultural water supply is determined by the following formula:
W a p = { W a n , ( W r p W a n ) W r p , ( W r p < W a n )

The actual ecological environment water supply is calculated by the following formula:
W e p = { W e n , ( W r p W a n + W e n ) W r p W a n , ( W r p < W a n + W e n )

4.3 If there was a surplus of water supply in source area and inadequate water supply in the receiving area, we used the former as the latter, which is according to the principle of water supply in the receiving area.
Step 5: We obtained the available water supply in the source area by back-calculation, which is based on the various types of water requirements and supply, and it is determined by the formula below.
W s u p = { min ( W s p , W n ) W d n + W p n ( W r p W a n W e n ) , ( W s p W d n + W p n ) W d p + W p p , ( W s p < W d n + W p n )
There are some essential constraints for the dynamic calculation model of water supply volume:
(1)
Water balance.
W t + 1 = W t + ( Q a r r Q o u t ) · Δ t
(2)
Reservoir capacity.
V d V V n o r m
(3)
Water flow.
Q d i v Q l i m
(4)
Variables are not negatively.
All of the variables are non-negative. If the value of any variable is less than 0, directly set its value to 0.

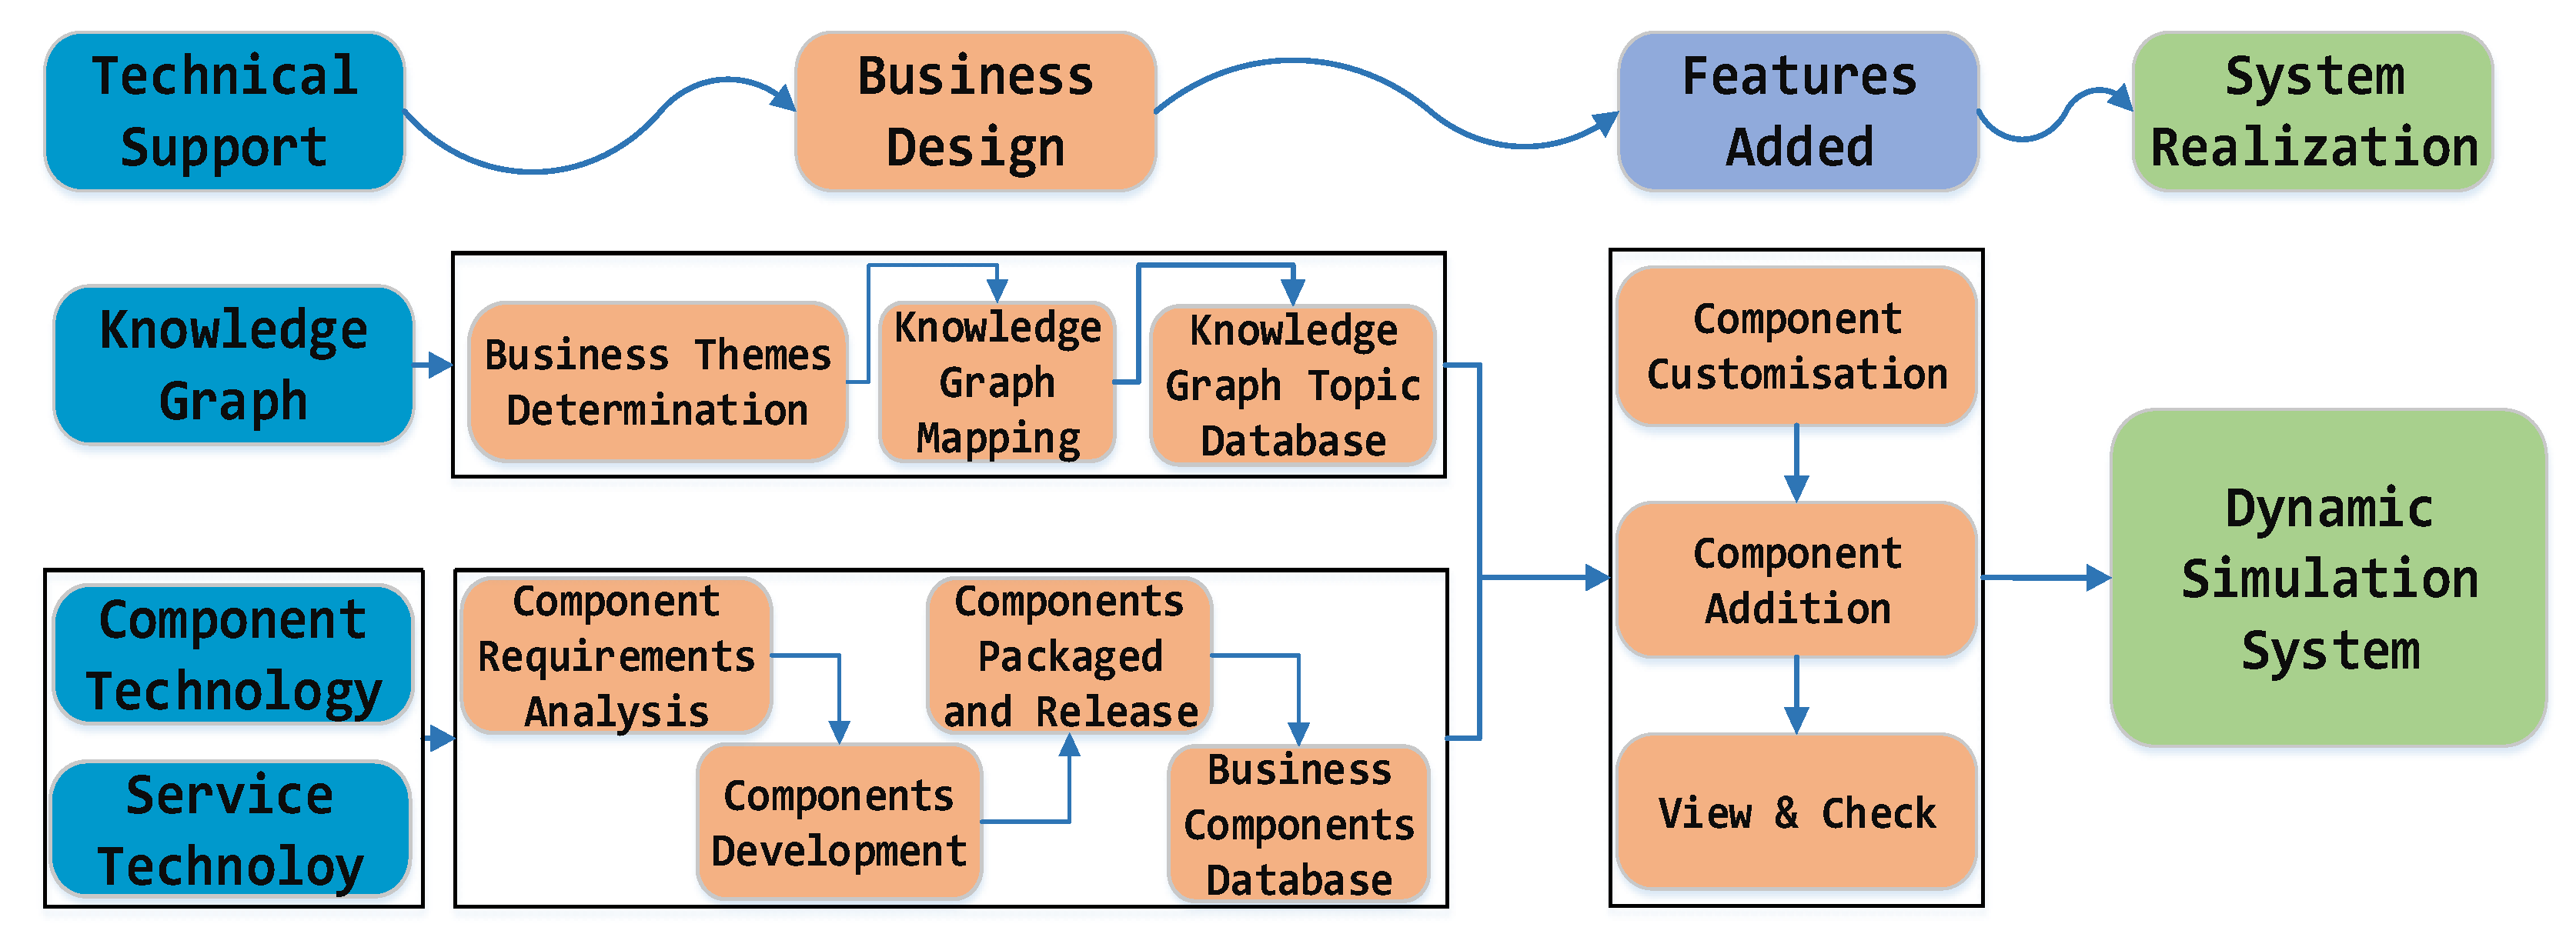
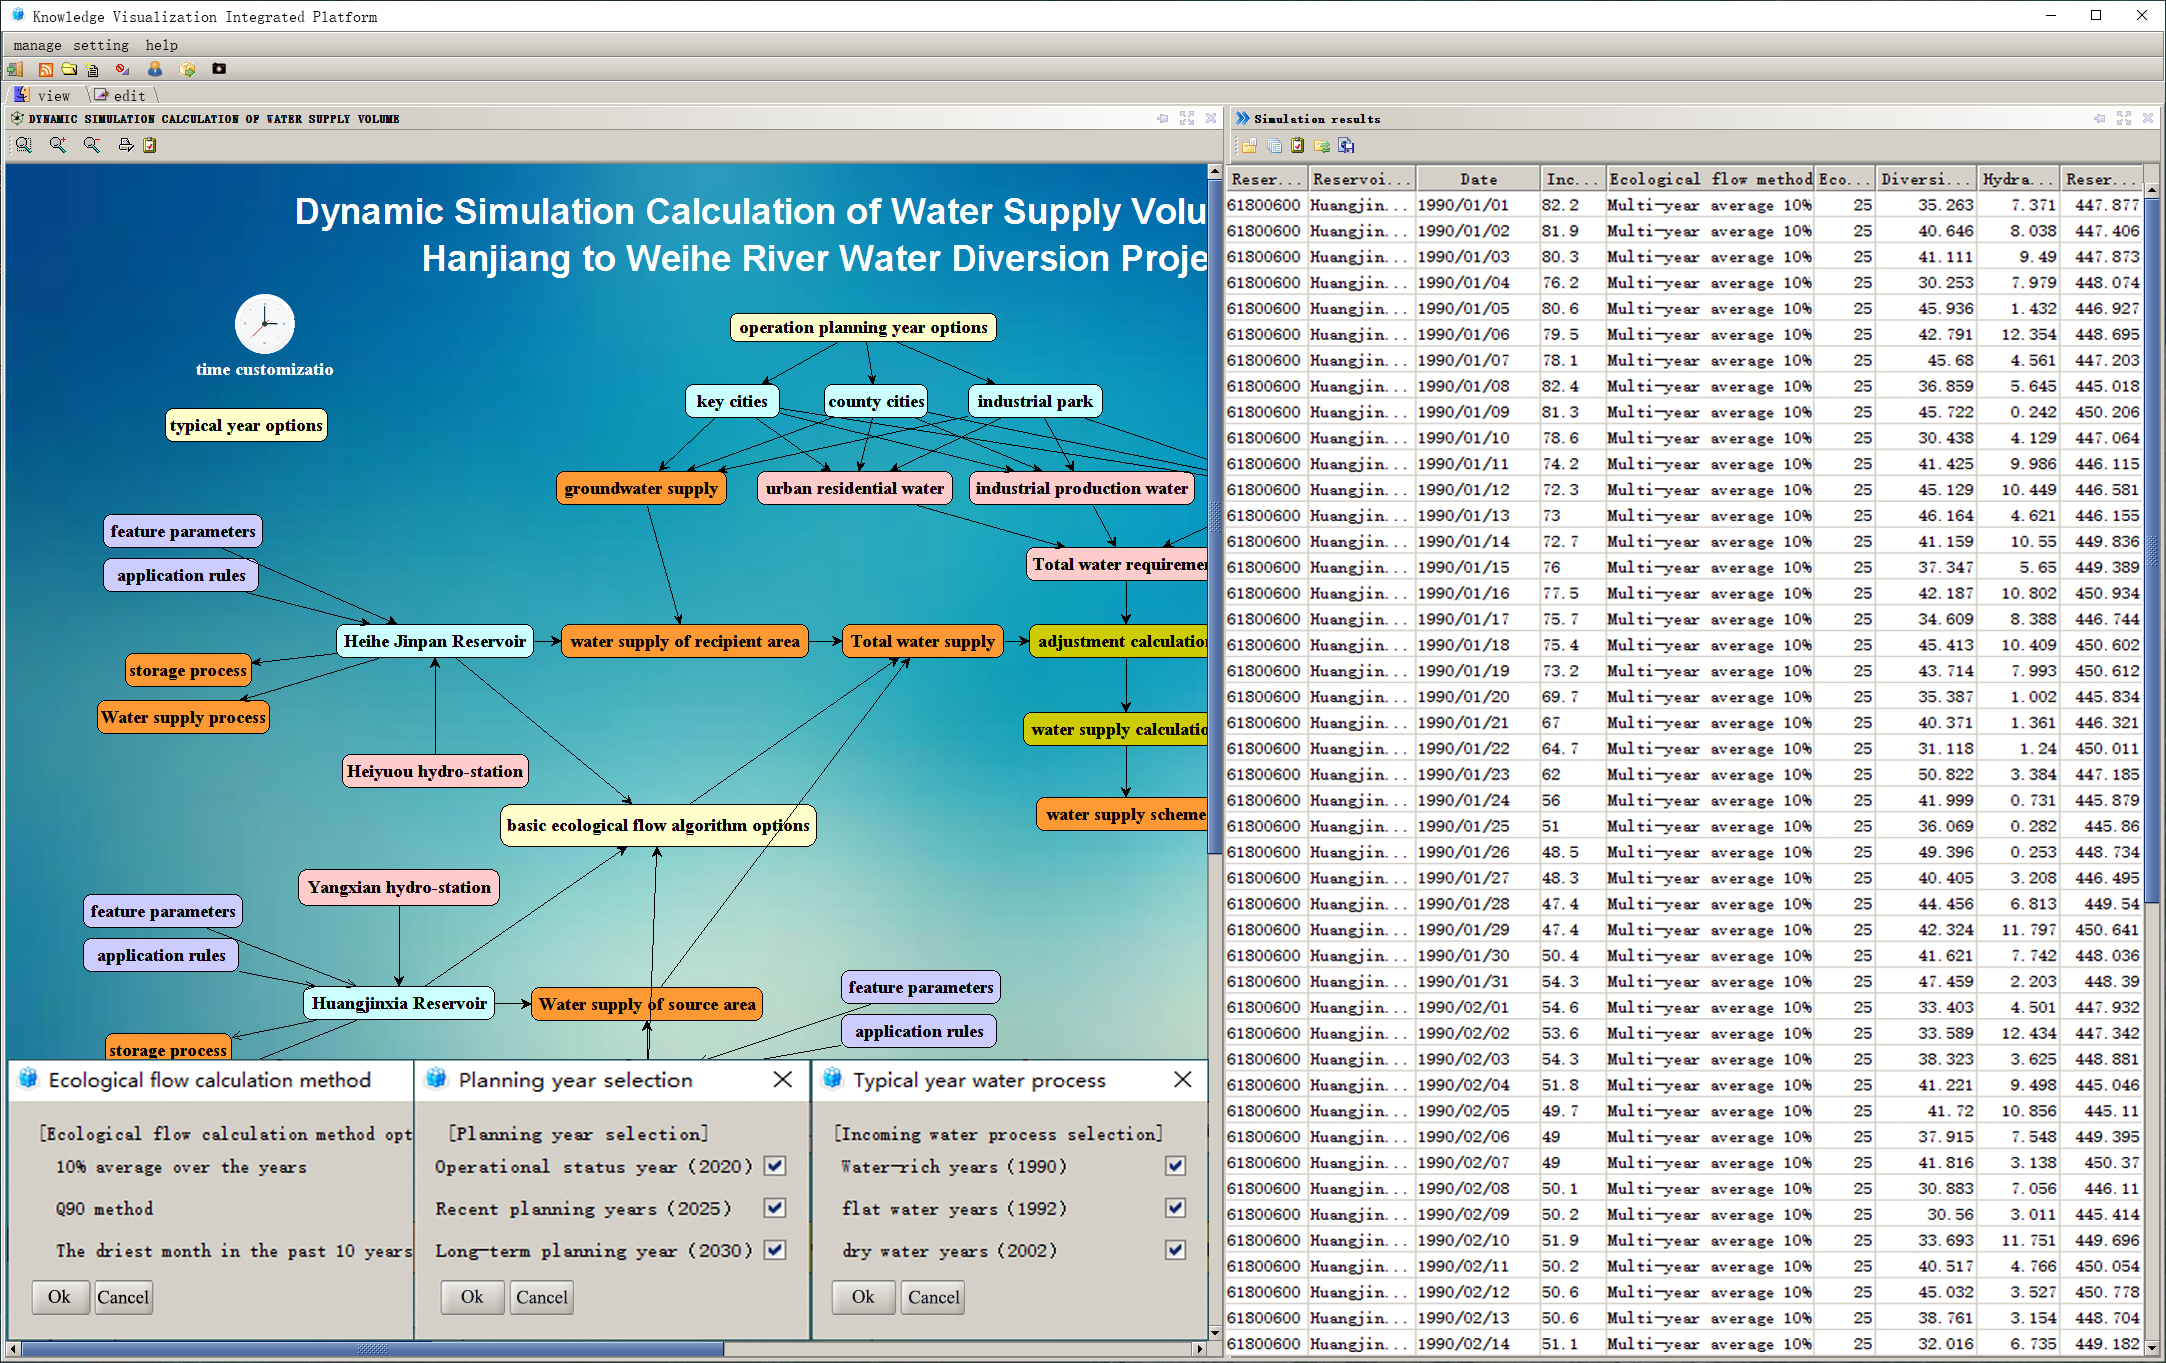
2.3. Construction of the Simulation-Calculation System

The CIP is the basic platform of the Water Conservancy Information Processing Platform Technical Regulation in the water conservancy industry of China. Moreover, it has realized an understanding of the application-support platform’s technical standards. The difference between the CIP and the traditional platform is the service-oriented design of the platform framework, which does not involve specific business functions. The business-implementation techniques include component customization [27], web service [28], knowledge visualization, and cloud computing [29], etc. Therefore, the CIP can be applied to most fields with process characteristics.
The CIP has many advantages due to its advanced design concept, which is described as follows:
  • The construction of the business or application system is convenient, fast, and has a high degree of reuse. Decision-makers can construct the system on the visual panel of the CIP, which has excellent flexibility and adaptability. Decision-makers can add and delete nodes at any time to adapt to the changes in operation situations.
  • The calculation and business implementation of the knowledge graph is detailed and intuitive. With the sequential computation of the knowledge graph nodes, decision-makers can change the computation scenarios and instantly view the results. The CIP’s scenario simulation makes it well suited for dynamic computation [30].
Of course, there are certain limitations to the platform’s application, such as the need to develop new services that have not been performed on the CIP, and the preparation of the relevant components, which requires a technical foundation.
The dynamic calculation model is a real-time and rapid adjustment model to calculate the water-supply volume. This model simulates the project’s practical operational situations by changing the calculation model’s input, output, boundary, and even supply objects to adapt to variations in the actual operating environment. The CIP can change the input, output, and nodes of components to adapt to changes in the calculation model and use the computer’s high-speed information process and computing power, which can rapidly deal with complex, simulated situations. In brief, the calculation model simulates practical situations, and the simulation system simulates the calculation model.
Based on the CIP, we drew a knowledge graph by combining various elements of project’s topology relationship and calculation process. Its elements include three parts: the point, line, and surface. According to the logic and function of each computing or business node in the calculation flowchart or topology diagram, we used Java, SQL, and other programming languages to compile components in the development-tool. The compilation of components is the programmatic implementation of the model’s calculation methods. Next, we finished the debug and packaged, uploaded, and published components to the server. Then, we customized the components on the CIP and added them to the related knowledge-graph nodes to complete the simulation of the data flow to the water flow. The construction process of the simulation calculation system is shown in Figure 2.
Figure 3 is the simulation-calculation system of water-supply volume for the HWWD Project, as drawn on the CIP. It was clear from the figure that the simulation-calculation system clearly describes the distribution and connection relationship of supply objects in the project’s source and receiving areas. Moreover, it calculates and displays each component of the dynamic simulation system of water-supply volume separately. This topology interface is just a display interface for the calculation results, and the actual calculation nodes have been hidden in this interface. The computational component net is the entity of the computational model that is hidden in the editing function of the CIP. Some nodes of the component net are connected to the resulting topology net so that the topology net can display the computation results.
According to the simulation system’s construction principles and process, we constructed the dynamic simulation system of water-supply volume for the HWWD Project. The computational-components net of the simulation system is shown in Figure 4. The simulation-calculation system gradually and visually presents the calculation process of water-supply volume. The decision-makers can click on any node in the calculation flowchart to check the calculation results, and the simulation system can calculate this node progressively. This computing paradigm makes the calculation process more clear and transparent, for example, by clicking the Huangjinxia Reservoir node and checking the calculation results of Huangjinxia Reservoir.

3. Result

The simulation system selects different variable conditions for different operating situations to conduct the simulation calculations. In the actual application, multiple variable conditions can be set in the simulation calculation system according to the practical requirements. To obtain better results and reflect the advantages of the simulation’s calculation, we selected the following variable conditions as control variables for the simulation calculation. The water-inflow conditions were categorized into different typical years of abundance (10%), normal (50%), and dry (90%). The calculation methods of ecological base flow were 10% of the annual average runoff, the minimum monthly average discharge in the last 10 years, and the Q90 method; and the water demand conditions included the current year (2020), near-term plan year (2025), and long-term plan year (2030). The results of water-supply-volume calculation in the simulation-calculation system of the HWWD Project under different situations are shown in Table 3.
According to the simulation-calculation results, the water requirement in the receiving areas continued to increase along with the economic and social development of the local areas. Additionally, the water diversion also increased with the continuous improvement of the HWWD Project, which can supplement water shortages in the receiving area and maintain the water-supply volume at a qualified level. In the current-, near-, and long-term plan years, the average water-supply guarantee rate of domestic and production (ratio of the number of satisfied days to the total days in a year) reached 92.84%, 95.22%, and 93.89%, respectively, which are all higher than the design supply guarantee rate of domestic and production, which was 90%. Additionally, the average water-supply guarantee rate of agriculture was 50.88%, which was higher than the design supply guarantee rate of agriculture (50%). The water-supply schemes are reasonable and can satisfy the HWWD Project’s operational requirements.

4. Discussion

This study comprehensively considered the various influencing factors of water supply to establish a dynamic calculation model as well as to develop the simulation-calculation system in real-time based on the CIP to implement the model. The system simulates practical operating scenarios by changing the simulation conditions to meet the available water-supply calculation requirements in various operating conditions. To clearly present the results, our example used three important influence factors as variable conditions for the simulation situations. The factors include different rates of inflow water, water demand, and downstream ecological flow. The results show that the average calculated values of water transfer in the near-term (2025) and the long-term planning year (2030) are 840 million and 1.23 billion, respectively, which are close to the maximum water-transfer design values of 1 billion and 1.5 billion in the project’s near-term and long-term planning and design, respectively [31,32]; therefore, the water-supply volume’s total results are reasonable. Second, the calculated guaranteed rate of water supply is greater than the required value, so the guaranteed rate of water supply is reasonable.
The dynamic calculation model improves the efficiency of the calculated water supply volume. It can also calculate and generate reasonable schemes of water-supply volume in different situations through the simulation system. Additionally, by adjusting input and boundary conditions in real-time, the simulation system can generate a water supply scheme that is most suitable for the running situation at this time, which provides support for the project’s operation decision. Overall, the dynamic calculation model has strong adaptability for an ever-changing production environment.

5. Conclusions

The results show that the dynamic calculation model of water supply in different situations is practicable. It can deal with the disadvantages of traditional water-supply calculation methods, including single calculation situations, unchangeable results, poor adaptability, and limited application effect. The dynamic calculation model can rapidly calculate and generate water-supply schemes in different situations through timely adjustment, which has good adaptability to the complex and changing actual operating environment. The dynamic calculation model and simulation calculation system of water supply can improve the calculation efficiency. They provide an efficient and dynamic way to manage and simulate the supply and demand of water resources.
However, many complicated factors need to be considered when calculating water supply, such as complex pipeline systems, and businesses, etc. Compared with the traditional calculation method, we conducted a beneficial exploration of the model in terms of application; however, our research was somewhat insufficient. For example, we did not consider the loss and duration of water transmission, or the risks of the discharge in the supply system. Further research is needed to improve the simulation system’s adaptability and flexibility in any operating situation. Moreover, the technical threshold poses a problem when developing computing systems for new businesses; therefore, we need to continue to conduct useful explorations on improving the computing component library and reducing the difficulty of system development.

Author Contributions

Methodology, Q.H., J.L. and J.X.; data curation, X.D. and X.S.; validation, X.D., X.S. and Q.H.; writing—original draft preparation, Q.H.; writing—review and editing, J.L. and J.X.; visualization, Q.H. and N.W.; supervision, N.W. All authors have read and agreed to the published version of the manuscript.

Funding

This work was supported by the Natural Science Basic Research Program of Shaanxi Province (Grant No.: 2019JLZ-15, 2019JLZ-16, 2017JQ5076), Special Scientific Research Plan Projects of Shaanxi Education Department (Grant No. 17JK0558), and the Research Fund of the State Key Laboratory of Eco-hydraulics in the Northwest Arid Region, Xi’an University of Technology (Grant No. 2019KJCXTD-5).

Informed Consent Statement

Informed consent was obtained from all subjects involved in the study.

Data Availability Statement

The raw data supporting the conclusions of this article will be made available by the authors.

Acknowledgments

The authors are grateful to the Editor and anonymous reviewers for their constructive comments and suggestions.

Conflicts of Interest

The authors declare no conflict of interest.

Nomenclature

SymbolsDescription
Δ t Duration of time intervals, Δ t = 1d
V d Dead storage of reservoir
V n o r m Utilizable storage of reservoir
Q l i m Flow constraint of tunnel
W d n Domestic water requirement
W d p Domestic water supply volume
W p n Produced water requirement
W p p Produced water supply volume
W a n Agricultural water requirement
W a p Agricultural water supply volume
W e n Ecological water requirement of environment
W e p Ecological water supply of environment
W s e Downstream ecological flow in source area
W r e Downstream ecological flow in receiving area
W s p Water supply in resource area
W r p Water supply in receiving area
W n Water demand in receiving area
W b Replenish water of reservoir
W p _ h j x Water supply of Huangjinxia Reservoir
W a r r Inbound water of reservoir
Q a r r Inbound flow of reservoir
V Capacity of reservoir
W s u p Available water of source area
Q s p _ m a x Maximum water supply flow in source area
W s p _ m a x Maximum water supply volume in source area
W b _ m a x Maximum replenish water
Q o u t Outflow of reservoir

References

  1. Mohamed, M.M.; El-Shorbagy, W.; Kizhisseri, M.I.; Chowdhury, R.; McDonald, A. Evaluation of policy scenarios for water resources planning and management in an arid region. J. Hydrol. Reg. Stud. 2020, 32, 100758. [Google Scholar] [CrossRef]
  2. Comair, G.F.; Gupta, P.; Ingenloff, C.; Shin, G.; McKinney, D.C. Water resources management in the Jordan River Basin. Water Environ. J. 2013, 27, 495–504. [Google Scholar] [CrossRef]
  3. Yang, M.; Yang, G.; He, X.; Wang, C.; Li, X. Analysis of water supply and demand balance in Manas River irrigation area based on system dynamics. J. Arid Land Resour. Environ. 2018, 32, 174–180. [Google Scholar] [CrossRef]
  4. Jamali, A.A.; Ghorbani Kalkhajeh, R. Spatial modeling considering valley’s shape and rural satisfaction in check dams site selection and water harvesting in the watershed. Water Resour. Manag. 2020, 34, 3331–3344. [Google Scholar] [CrossRef]
  5. Aibibuli, A. Analysis of Water Resources Supply and Demand Balance in Alagou Reservoir. Energy Energy Conserv. 2021, 4, 96–97+154. [Google Scholar] [CrossRef]
  6. Yang, L. Analysis on the balance of supply and demand of water resources in the drinking water project in the border area of Bole City. Shaanxi Water Resour. 2022, 126–127. [Google Scholar] [CrossRef]
  7. Zhang, X. Calculation method of reserve capacity and available water supply for reserve water source reservoir. Water Resour. Plan. Des. 2018, 73–76. [Google Scholar] [CrossRef]
  8. Karamouz, M.; Mohamadpour, P. Water balance based sustainability analysis of supply and demand, towards developing a hybrid index (case study: Aharchay watershed). Iran-Water Resour. Res. 2017, 12, 1–11. Available online: http://www.iwrr.ir/article_65162_67aae7a216b1ebad5cc41daa2f0cd491.pdf (accessed on 29 July 2020).
  9. Jamali, A.A.; Tabatabaee, R.; Randhir, T.O. Ecotourism and socioeconomic strategies for Khansar River watershed of Iran. Environ. Dev. Sustain. 2021, 23, 17077–17093. [Google Scholar] [CrossRef]
  10. Qaiser, K.; Ahmad, S.; Johnson, W.; Batista, J.R. Evaluating water conservation and reuse policies using a dynamic water balance model. Environ. Manag. 2013, 51, 449–458. [Google Scholar] [CrossRef]
  11. Brekke, L.; Larsen, M.D.; Ausburn, M.; Takaichi, L. Suburban water demand modeling using stepwise regression. J. AWWA 2002, 94, 65–75. [Google Scholar] [CrossRef]
  12. Chen, L.; Guan, H.; Wu, L.; Yi, K.; Wang, Y. Analysis and prediction of water supply capacity of water conservancy project in Qinzhou city, China. Water Saving Irrig. 2018, 91–96. [Google Scholar] [CrossRef]
  13. Zhang, Z.; Getahun, E.; Mu, M.; Chandrasekaran, S. Water supply planning considering uncertainties in future water demand and climate: A case study in an Illinois watershed. JAWRA 2021, 1–17. [Google Scholar] [CrossRef]
  14. Zheng, H.; Ding, X.; Wang, Z.; Hou, X.; Hu, Y. Analysis and Research on Water Demand and Available Water in Small River Basin. Rural Econ. Sci. -Technol. 2020, 31, 227–228+256. [Google Scholar] [CrossRef]
  15. Bhat, T.A. An analysis of demand and supply of water in India. J. Environ. Earth Sci. 2014, 4, 67–72. [Google Scholar] [CrossRef]
  16. Asghar, A.; Iqbal, J.; Amin, A.; Ribbe, L. Integrated hydrological modeling for assessment of water demand and supply under socio-economic and IPCC climate change scenarios using WEAP in Central Indus Basin. J. Water Supply Res. Technol. Aqua 2019, 68, 136–148. [Google Scholar] [CrossRef]
  17. Browne, A.L. Insights from the everyday: Implications of reframing the governance of water supply and demand from ‘people’ to ‘practice’. WIRES Water 2015, 2, 415–424. [Google Scholar] [CrossRef]
  18. Aoun-Sebaiti, B.; Hani, A.; Djabri, L.; Chaffai, H.; Aichouri, I.; Boughrira, N. Simulation of water supply and water demand in the valley of Seybouse (East Algeria). Desalin. Water Treat. 2014, 52, 2114–2119. [Google Scholar] [CrossRef]
  19. Xiao, Y.; Luo, J.; Ye, J. Multi-Objective Optimization for Reservoir Operation Simulation for Huangjinxia Reservoir in the Hanjiang-to-Weihe River Water Diversion Project. Yellow River 2021, 141–144. [Google Scholar] [CrossRef]
  20. Kong, B.; Fu, S.; Huang, Q. Multi-objective optimal operation of hydropower plant-reservoir-pumping station group in large complex inter-basin water transfer projects. Water Resour. Prot. 2020, 36, 67–72. [Google Scholar] [CrossRef]
  21. Hui, Q. Research and System Realization of Digital Water Network and Water Allocation in the Han-to-Wei River Diversion Project. Master’s Thesis, Xi’an University of Technology, Xi’an, China, 2021. [Google Scholar] [CrossRef]
  22. Lei, G.J.; Wang, W.C.; Liang, Y.; Yin, J.X.; Wang, H. Failure risk assessment of discharge system of the hanjiang-to-weihe river water transfer project. Nat. Hazards 2021, 108, 3159–3180. [Google Scholar] [CrossRef]
  23. Luo, J. Study on Water Resources Business Informatization and Meta-Synthesis Application Mode. Ph.D. Thesis, Xi’an University of Technology, Xi’an, China, 2009. [Google Scholar] [CrossRef]
  24. Xie, J.; Luo, J. Integrated service platform for the information explosion process in water resources industry and its application pattern. Water Resour. Informatiz. 2010, 5, 18–23. [Google Scholar] [CrossRef]
  25. Sun, X.; Luo, J.; Xie, J. Dynamic simulation on available water supply in Heihe river waterworks. J. Water Resour. Water Eng. 2016, 27, 21–26. [Google Scholar] [CrossRef]
  26. Wang, Q.; Hao, H.; Li, Y. Study on the Ecological Discharge of the Lower Reaches of the Maliba Reservoir Based on Q90 Method and R2-Cross Method. Environ. Sci. Surv. 2021, 40, 51–55. [Google Scholar] [CrossRef]
  27. Qiu, Y. Technology of components and its comparison. Comput. Eng. Des. 2003, 7, 13–17+42. [Google Scholar] [CrossRef]
  28. Lv, H. Discussion of the Web Service Technology in the SOA. Comput. Program. Ski. Maint. 2010, 4, 75+78. [Google Scholar] [CrossRef]
  29. Zhang, Y. Cloud computing and virtualization technology. Comput. Secur. 2011, 5, 80–82. [Google Scholar] [CrossRef]
  30. Xie, J.; Chai, L.; Gao, Y.; Liu, J. Theme-oriented Service for Business Application Mode based on Platform. Water Resour. Informatiz. 2015, 6, 18–24. [Google Scholar] [CrossRef]
  31. Xiaoru, Y.; Liangjun, F.; Yongyong, Z. Research on optimal allocation of water resources for Hanjiang-to-Weihe River Water Transfer Project. J. Water Resour. Archit. Eng. 2012, 10, 6–10+54. [Google Scholar] [CrossRef]
  32. Zhenghao, C.; Na, Z.; Ping, Q. Water resources assessment on water diversion project from Hanjiang River to Weihe River. Yangtze River 2014, 45, 30–33. [Google Scholar] [CrossRef]
Figure 1. Layout of Hanjiang-to-Weihe River Water Diversion (HWWD) Project.
Water 15 00627 g001
Figure 2. Construction process of simulation system.
Water 15 00627 g002
Figure 3. Topological structure (using topological theory to reduce engineering to a combination of point-line-surface structures) of Hanjiang-to-Weihe River Water Diversion (HWWD) Project.
Water 15 00627 g003
Figure 4. Computational components net of dynamic simulation system.
Water 15 00627 g004
Table 1. Sanhekou Reservoir dispatching interval.
Scheduling Interval Q s p _ m a x Engineering Application Criteria
The preventative-abandonment
water level
50Priority use of water from
the Sanhekou Reservoir
50Priority use of water from
the Huangjinxia Reservoir
Water-supply control
water level
21.2Simultaneous application in
the water source and receiving areas
Joint-supply assurance
water level
12.8Groundwater in the receiving area
is the primary source
The dead-water level
in extra-dry year
9.8
Table 2. Huangjinxia Reservoir dispatching interval.
Scheduling IntervalWater Volume JudgmentWater Supply SequenceWater Replenishment
Higher than
normal water level
W p _ h j x > W s p Huangjinxia ReservoirReplenishment
W p _ h j x = W s p Huangjinxia ReservoirNo replenishment
Dead-water line
to normal water level
W p _ h j x = W s p Sanhekou and Huangjinxia Reservoir
Dead-water line W a r r W s p + W s e Sanhekou Reservoir
W a r r < W s p + W s e Huangjinxia Reservoir
Table 3. Simulation-calculation results of water-supply volume.
SchemeTypical YearYearEcological WaterWater Supply Volume (104 m3)
202020252030
1Dry year200210% of the annual average runoff55,17559,60293,910
2Normal year199262,31067,534121,275
3Abundant year1990115,453124,996153,504
4Dry year2002Q90 method55,02559,45293,816
5Normal year199262,21667,403121,218
6Abundant year1990115,396124,921153,410
7Dry year2002Monthly average discharge in the last ten years55,24259,66993,952
8Normal year199262,35367,664121,291
9Abundant year1990115,478125,029153,546
Disclaimer/Publisher’s Note: The statements, opinions and data contained in all publications are solely those of the individual author(s) and contributor(s) and not of MDPI and/or the editor(s). MDPI and/or the editor(s) disclaim responsibility for any injury to people or property resulting from any ideas, methods, instructions or products referred to in the content.

