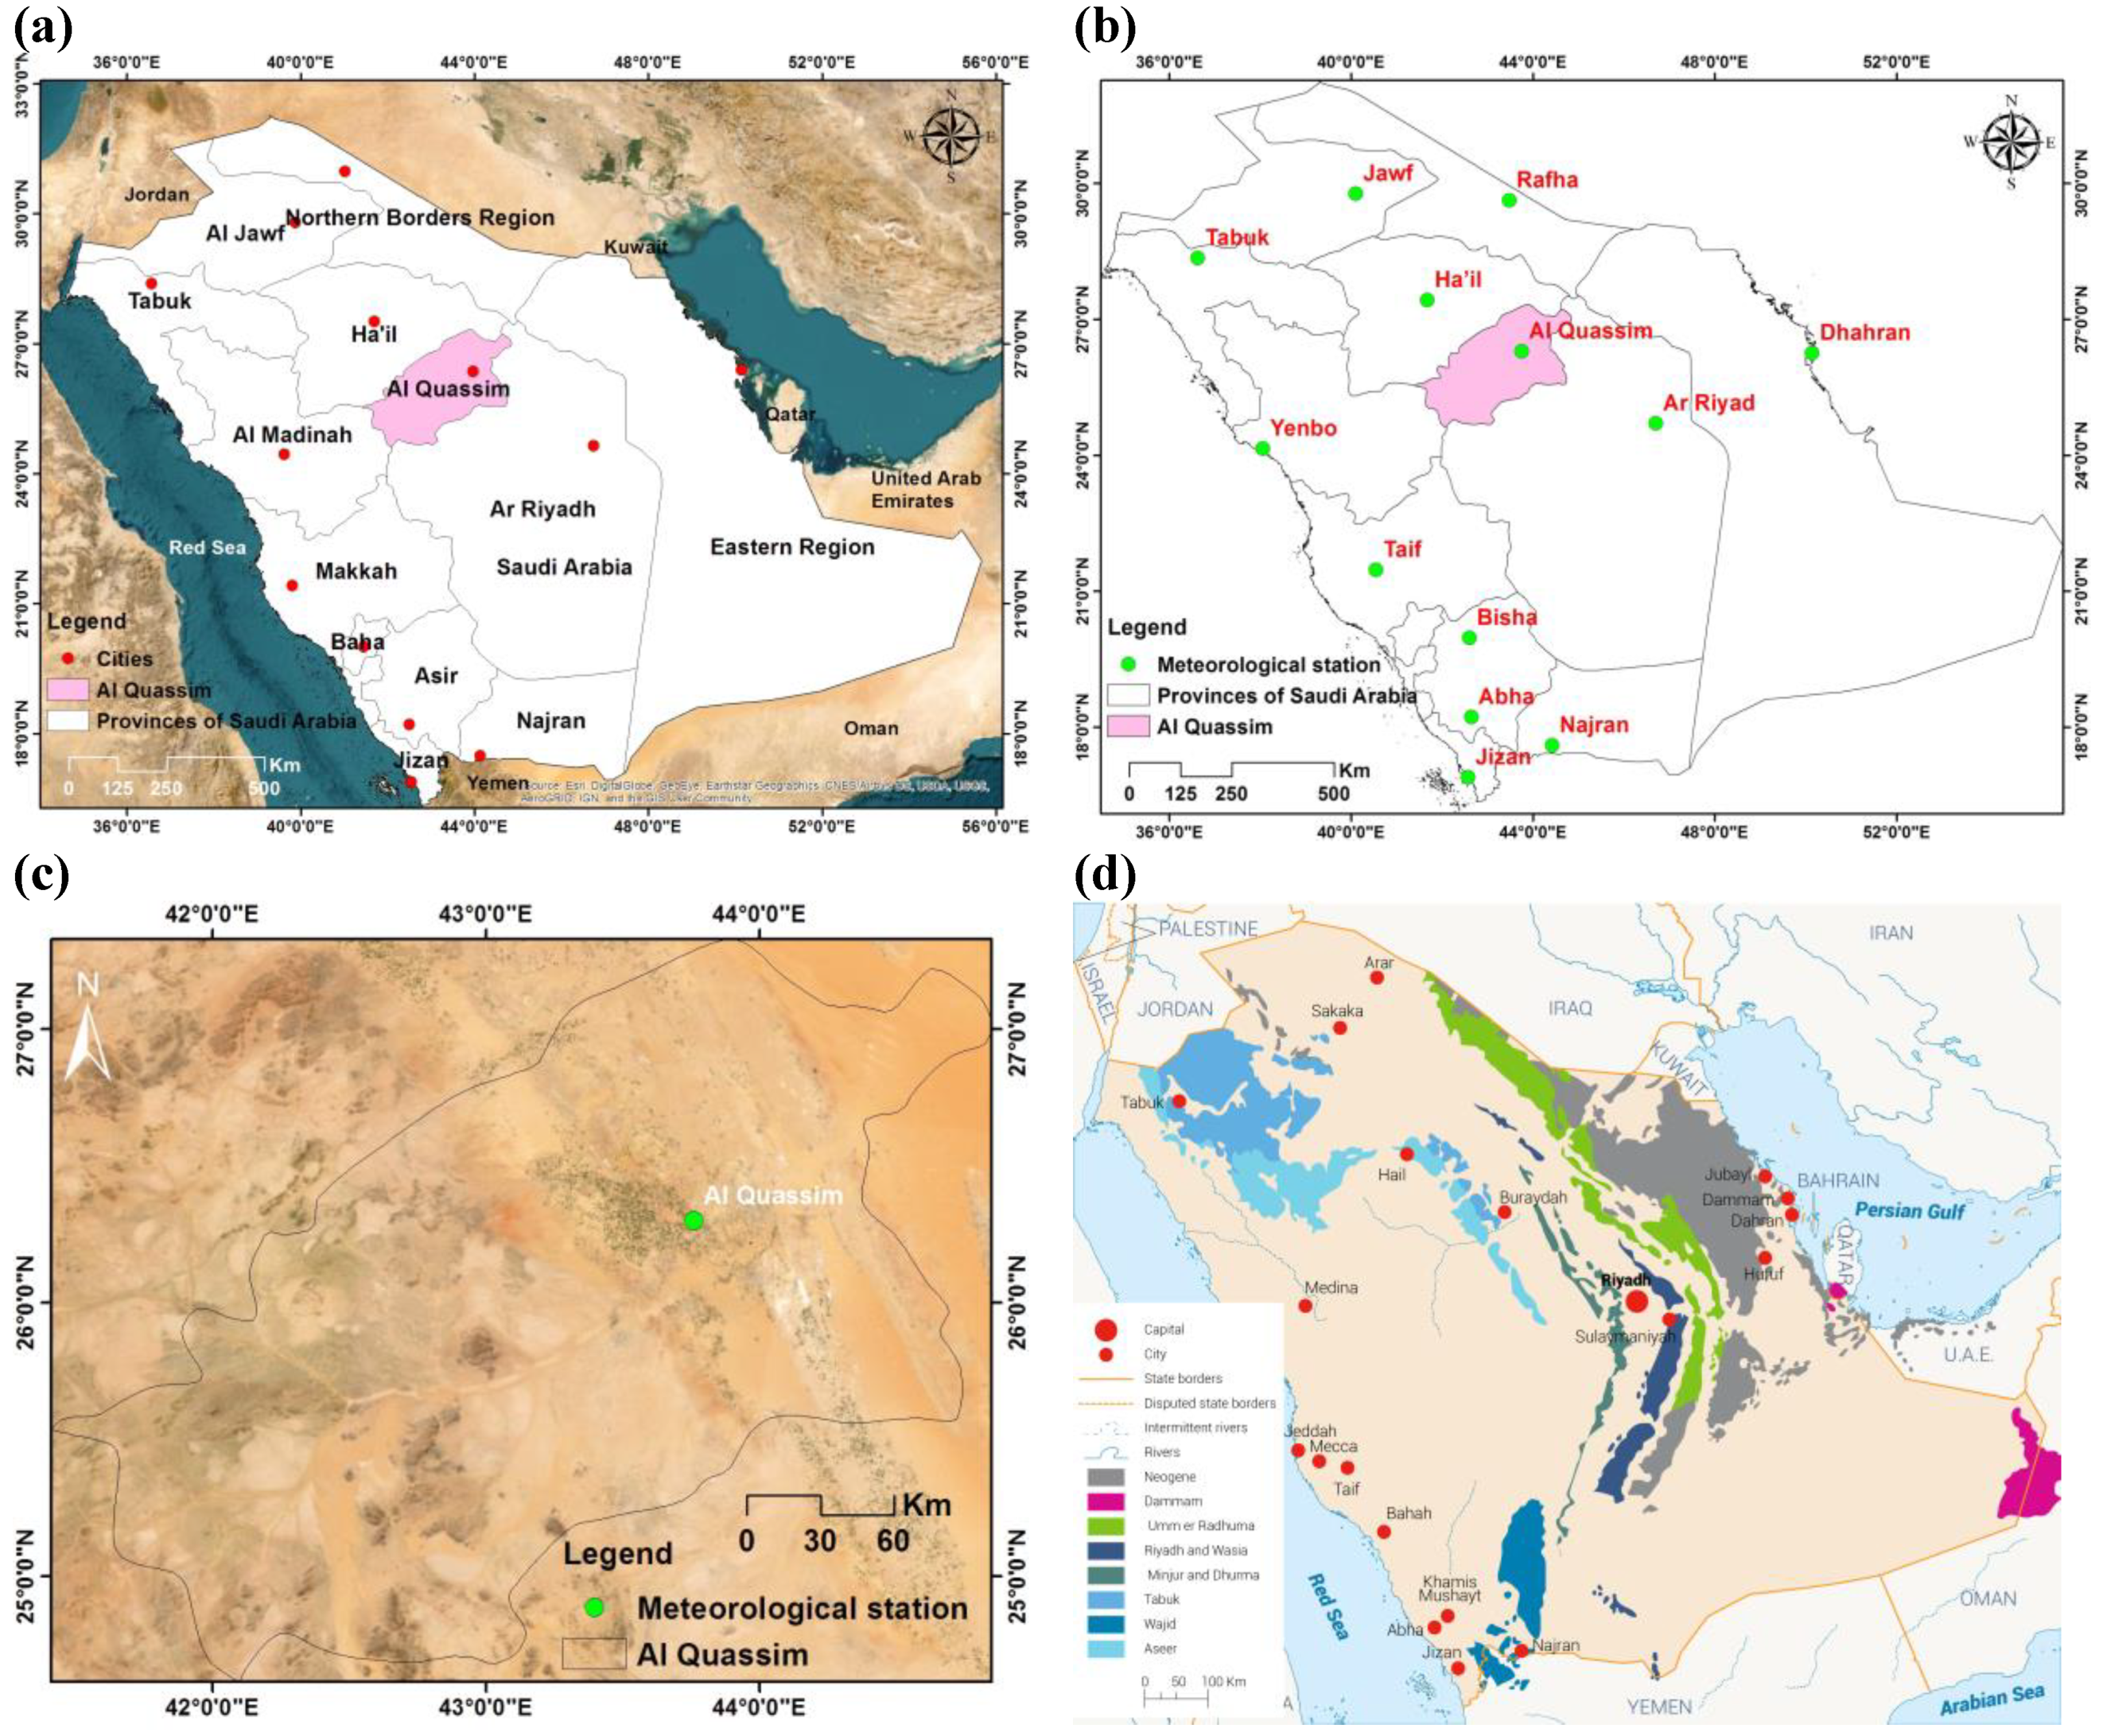
Figure 1.
(a) Provinces of Saudi Arabia, (b) meteorological stations in Saudi Arabia, (c) the Al Quassim region, and (d) main aquifers in Saudi Arabia [Ministry of Environment, Water and Agriculture, 2018. National Water Strategy 2030].
Figure 1.
(a) Provinces of Saudi Arabia, (b) meteorological stations in Saudi Arabia, (c) the Al Quassim region, and (d) main aquifers in Saudi Arabia [Ministry of Environment, Water and Agriculture, 2018. National Water Strategy 2030].
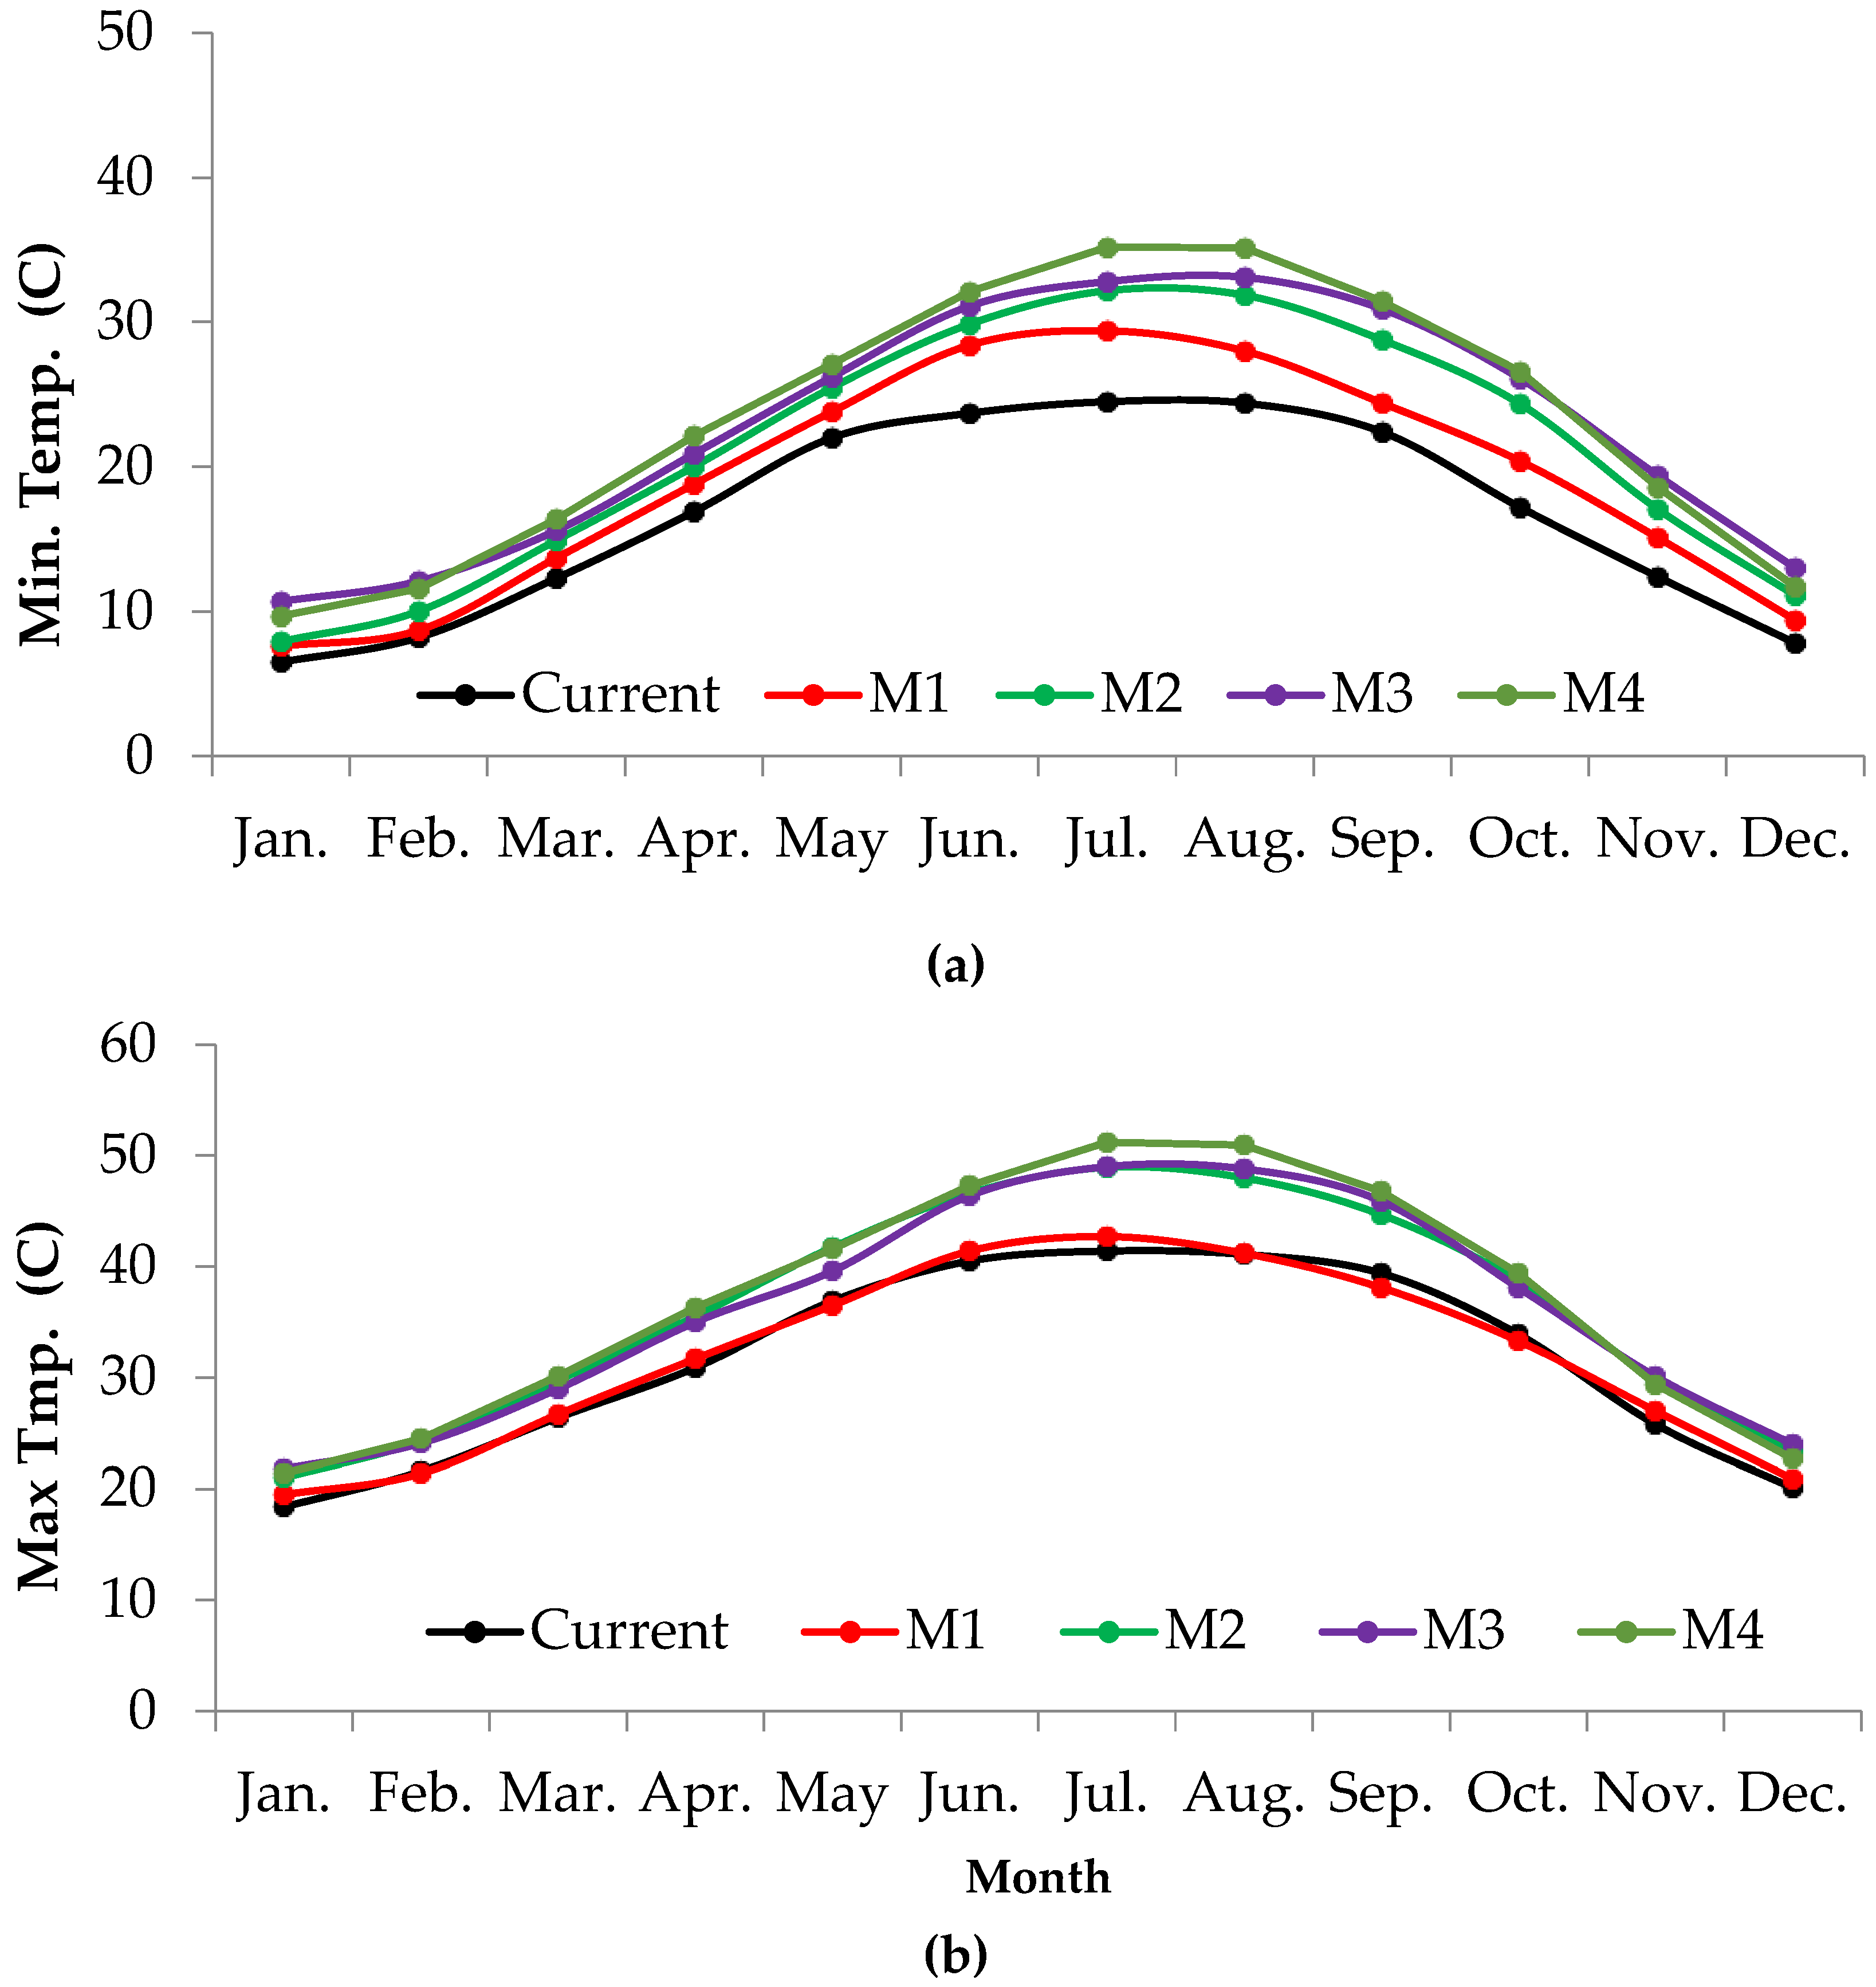
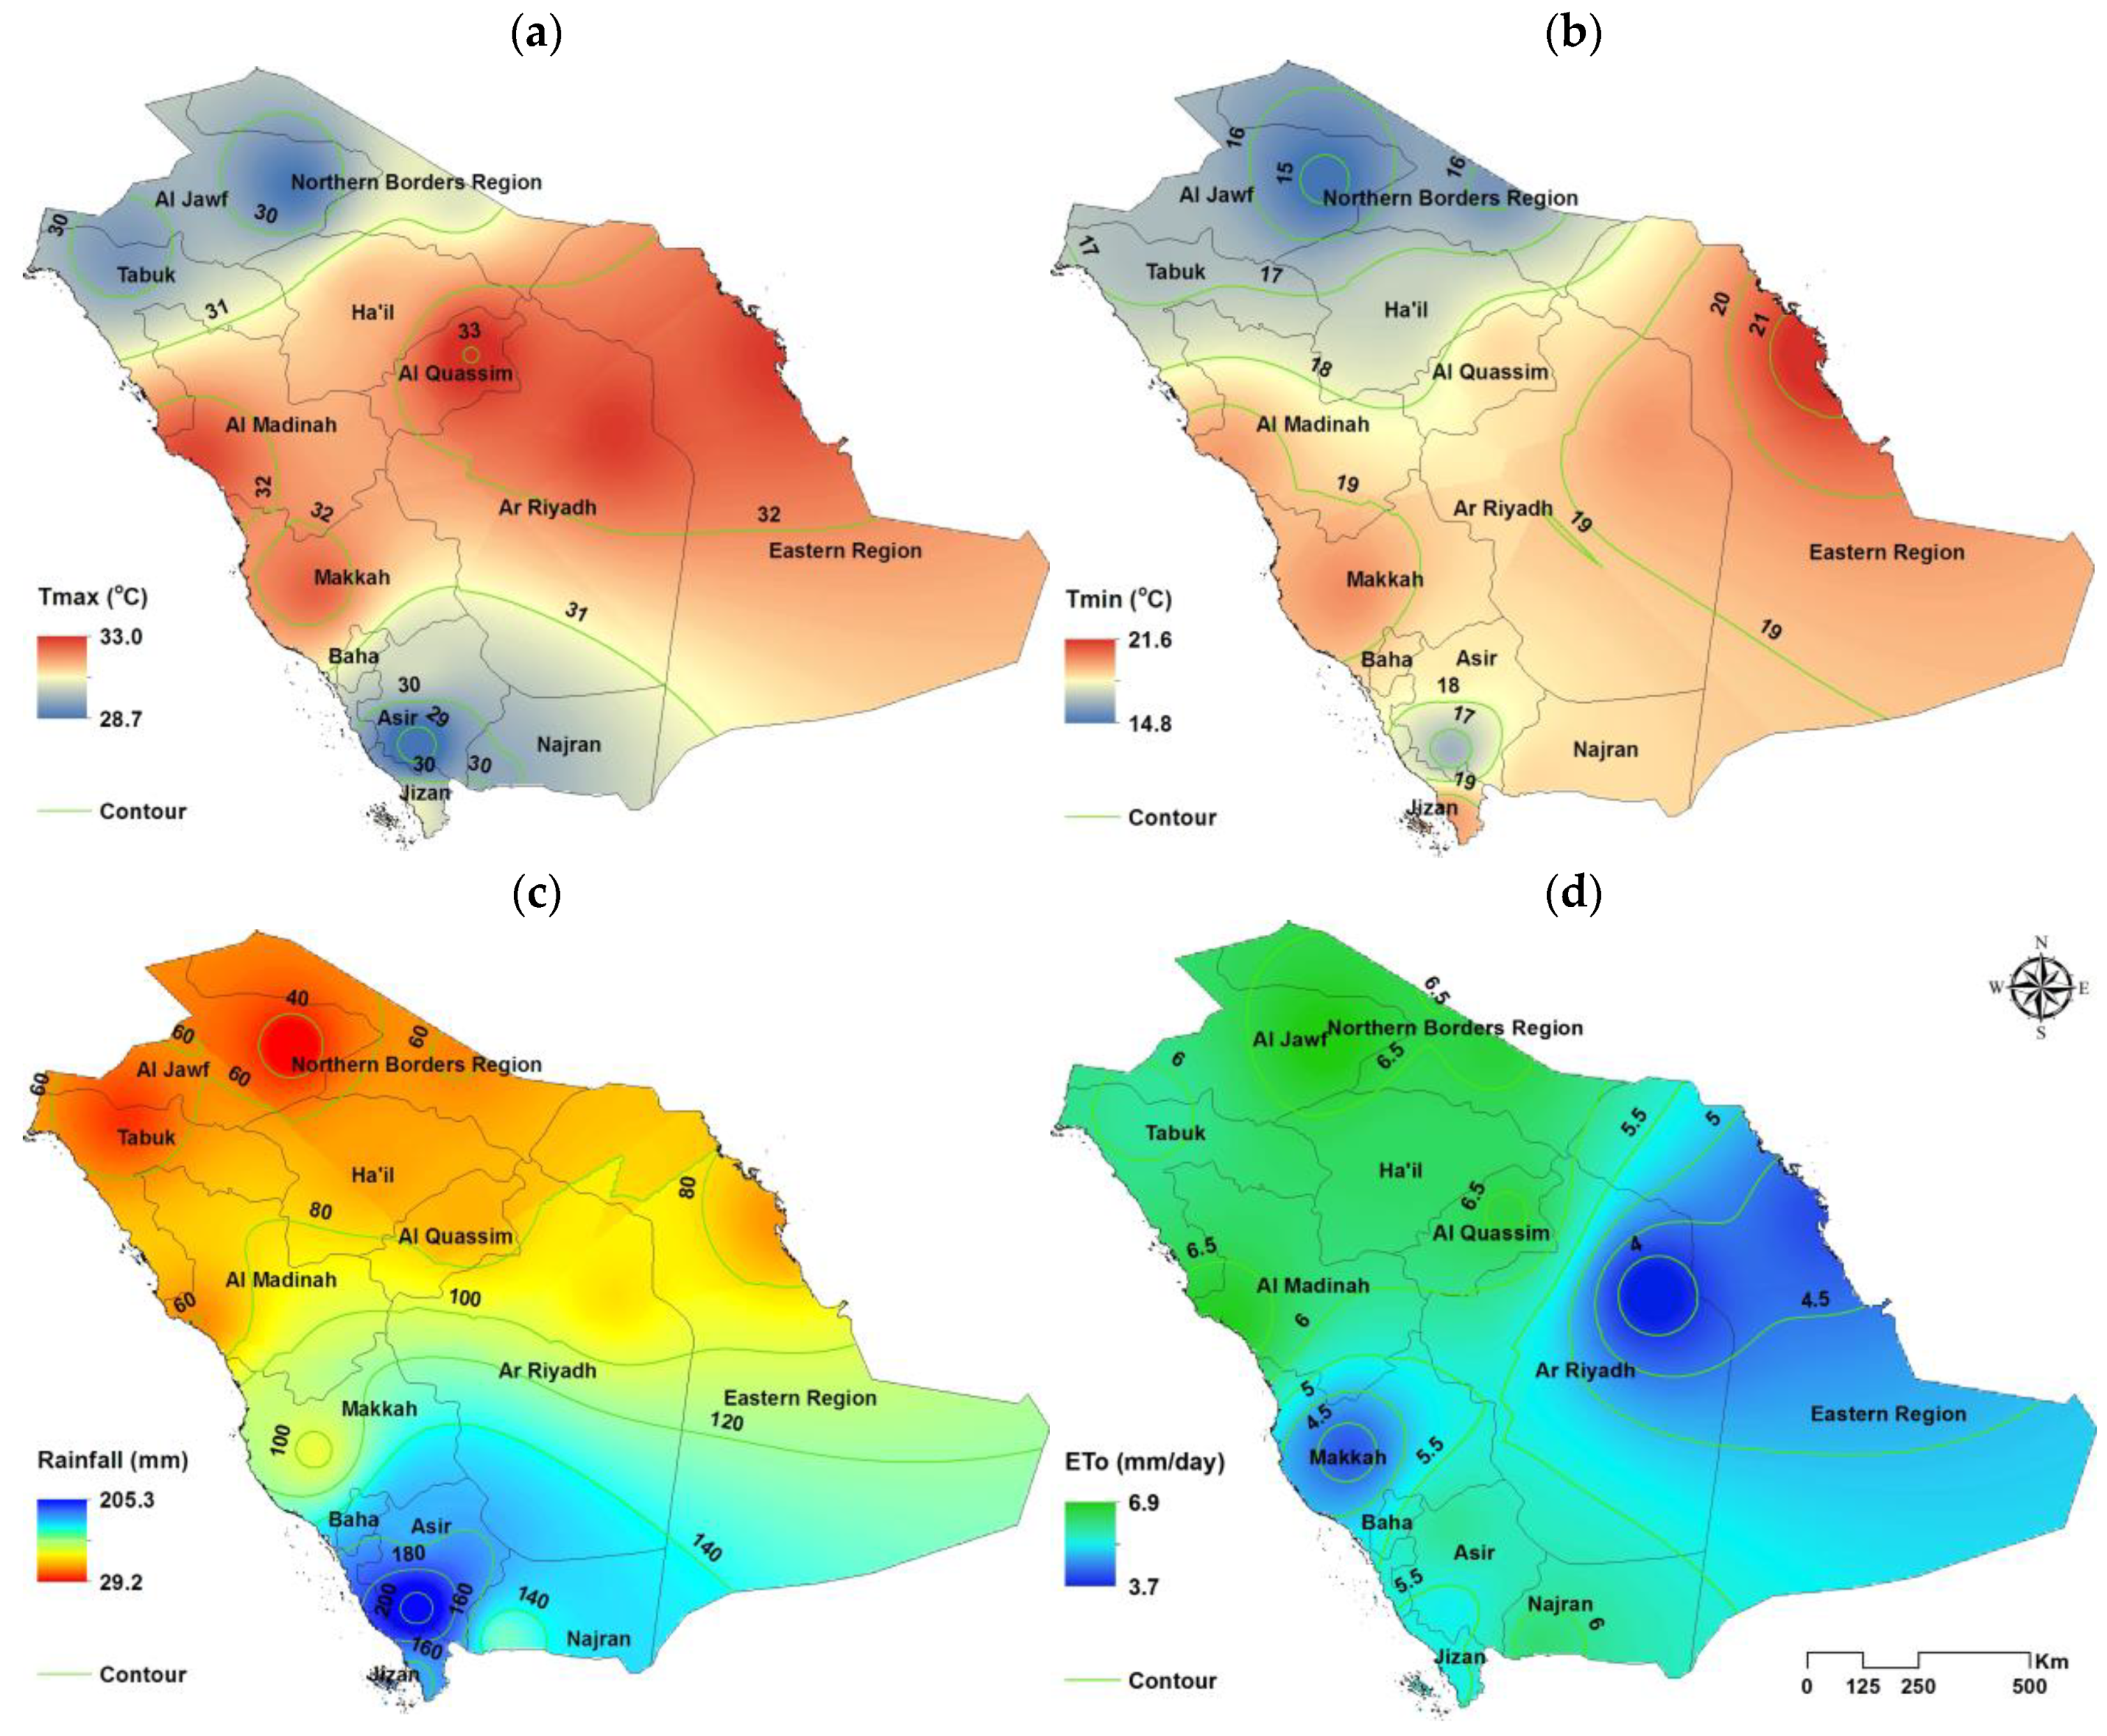
Figure 2.
(a) Maximum and (b) minimum temperature (°C), (c) rainfall (mm), and (d) reference evapotranspiration (ETo) (mm) for 1991–2020.
Figure 2.
(a) Maximum and (b) minimum temperature (°C), (c) rainfall (mm), and (d) reference evapotranspiration (ETo) (mm) for 1991–2020.
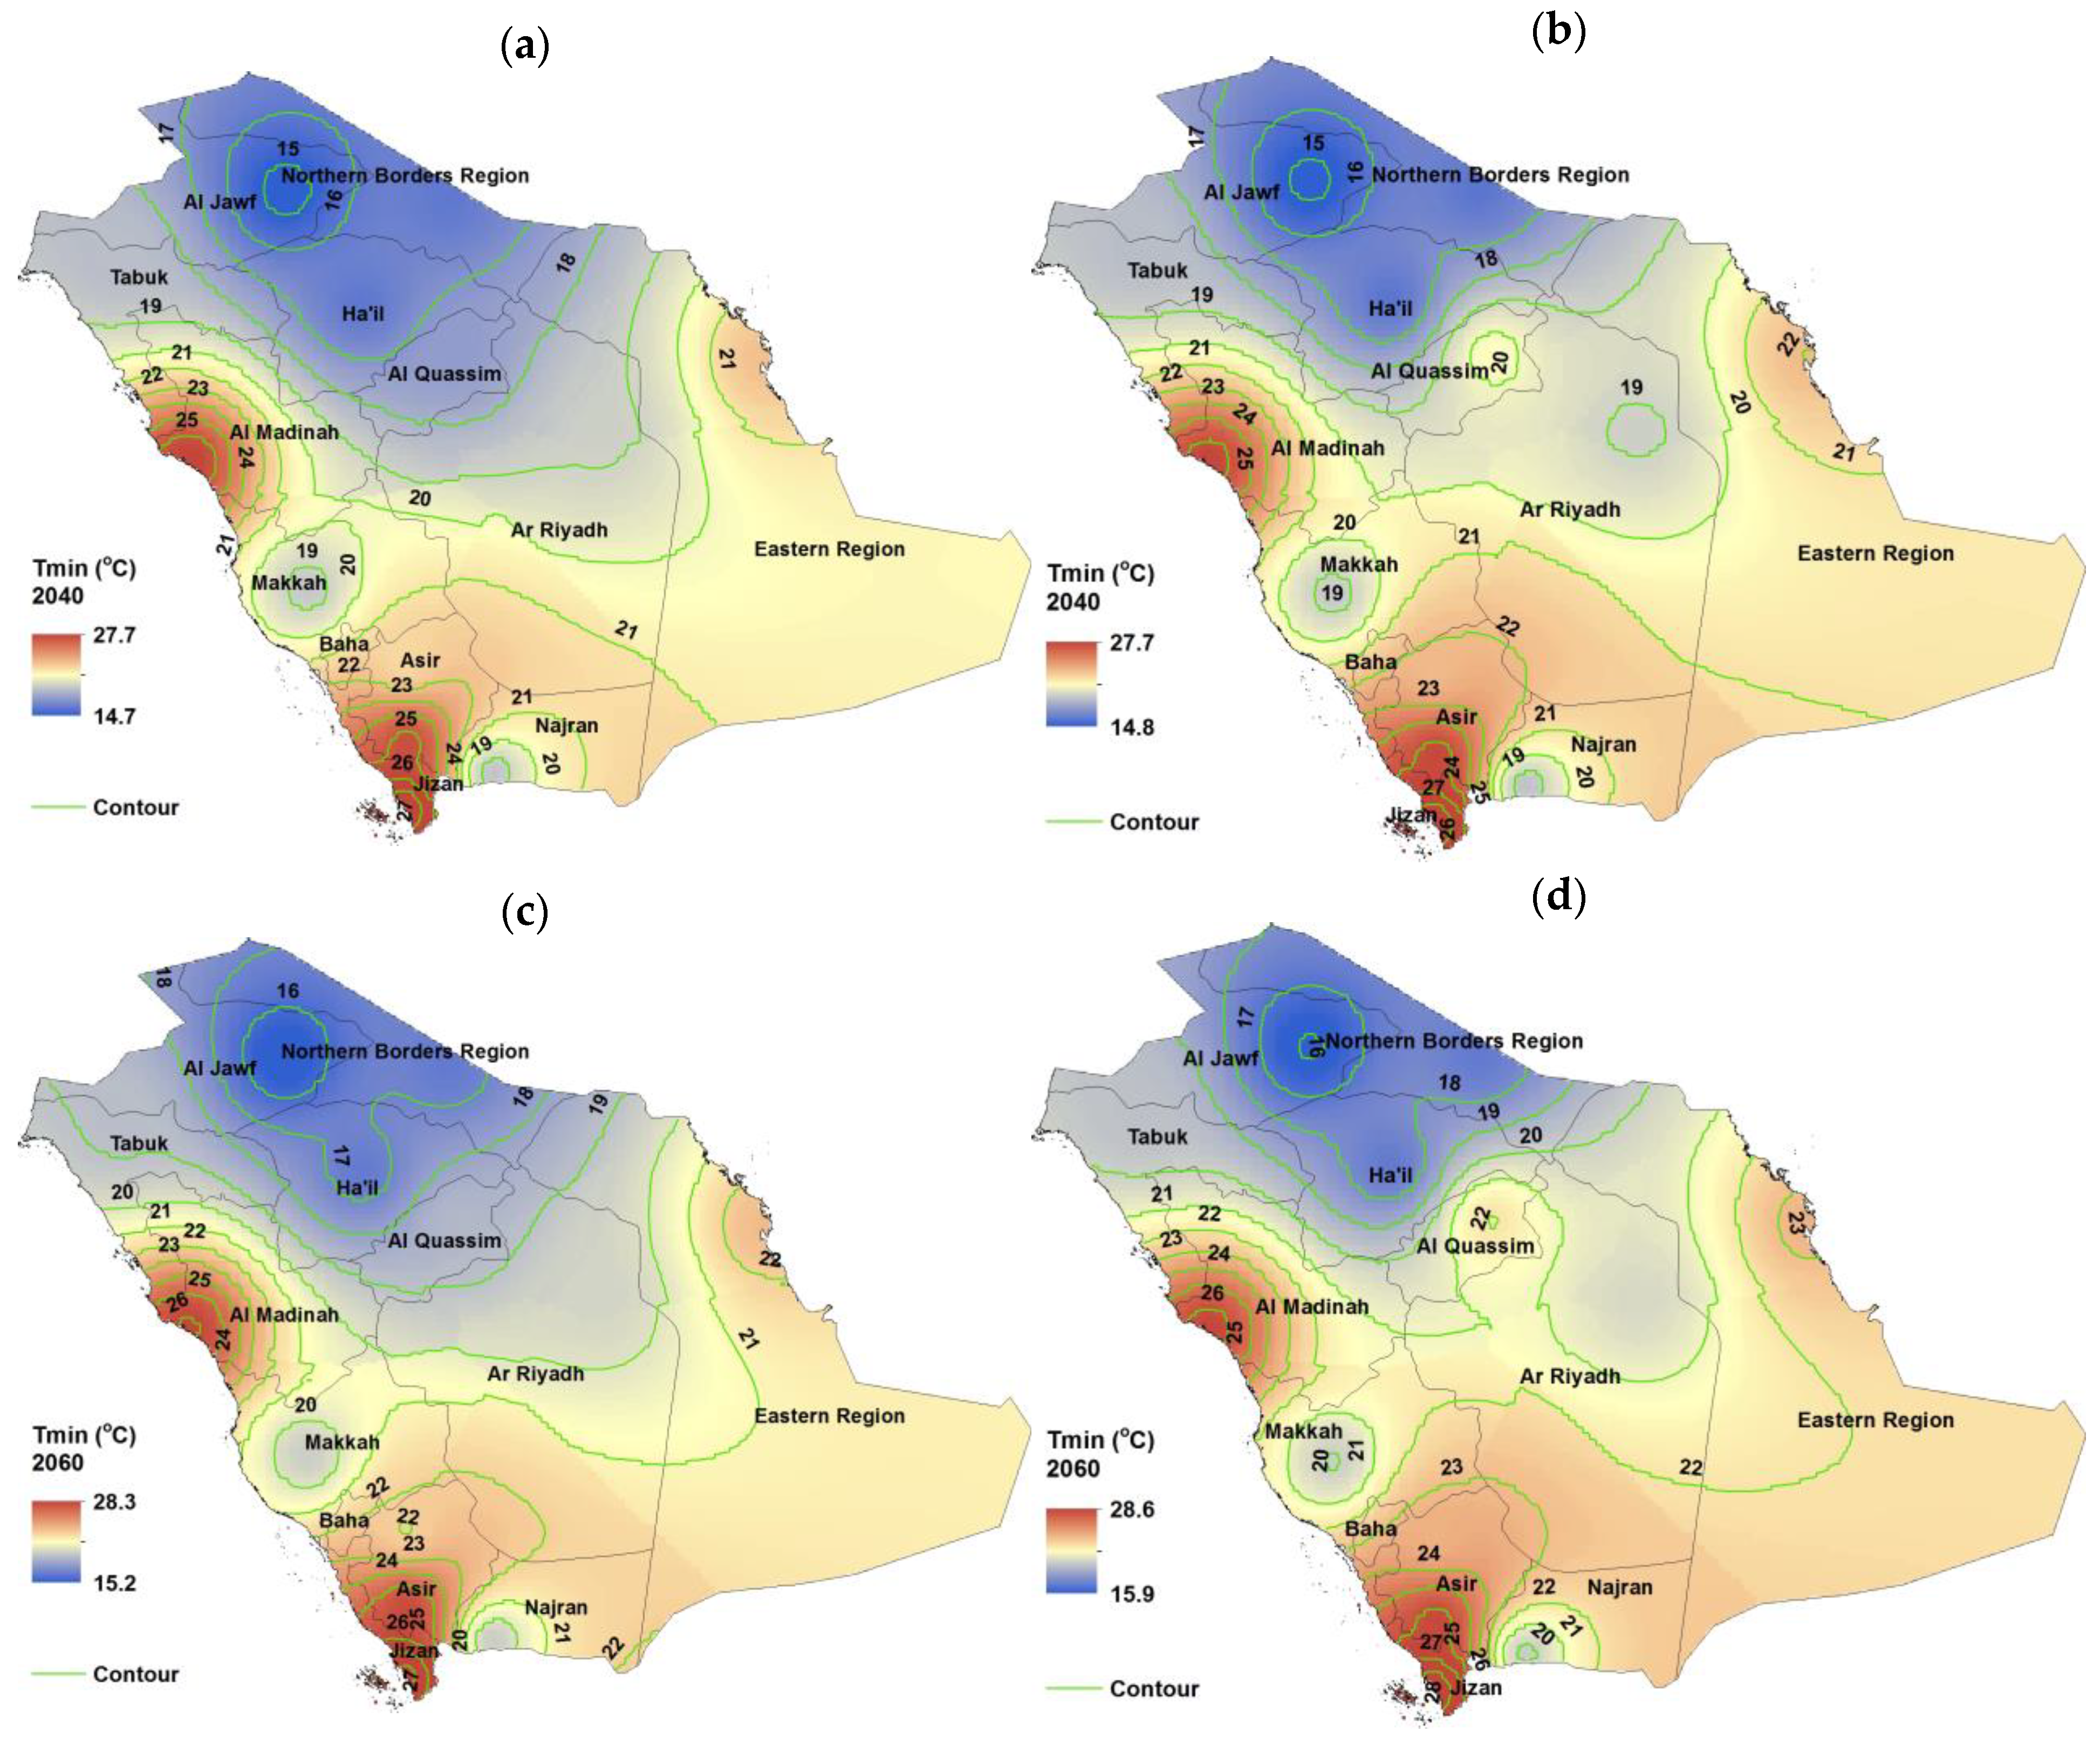
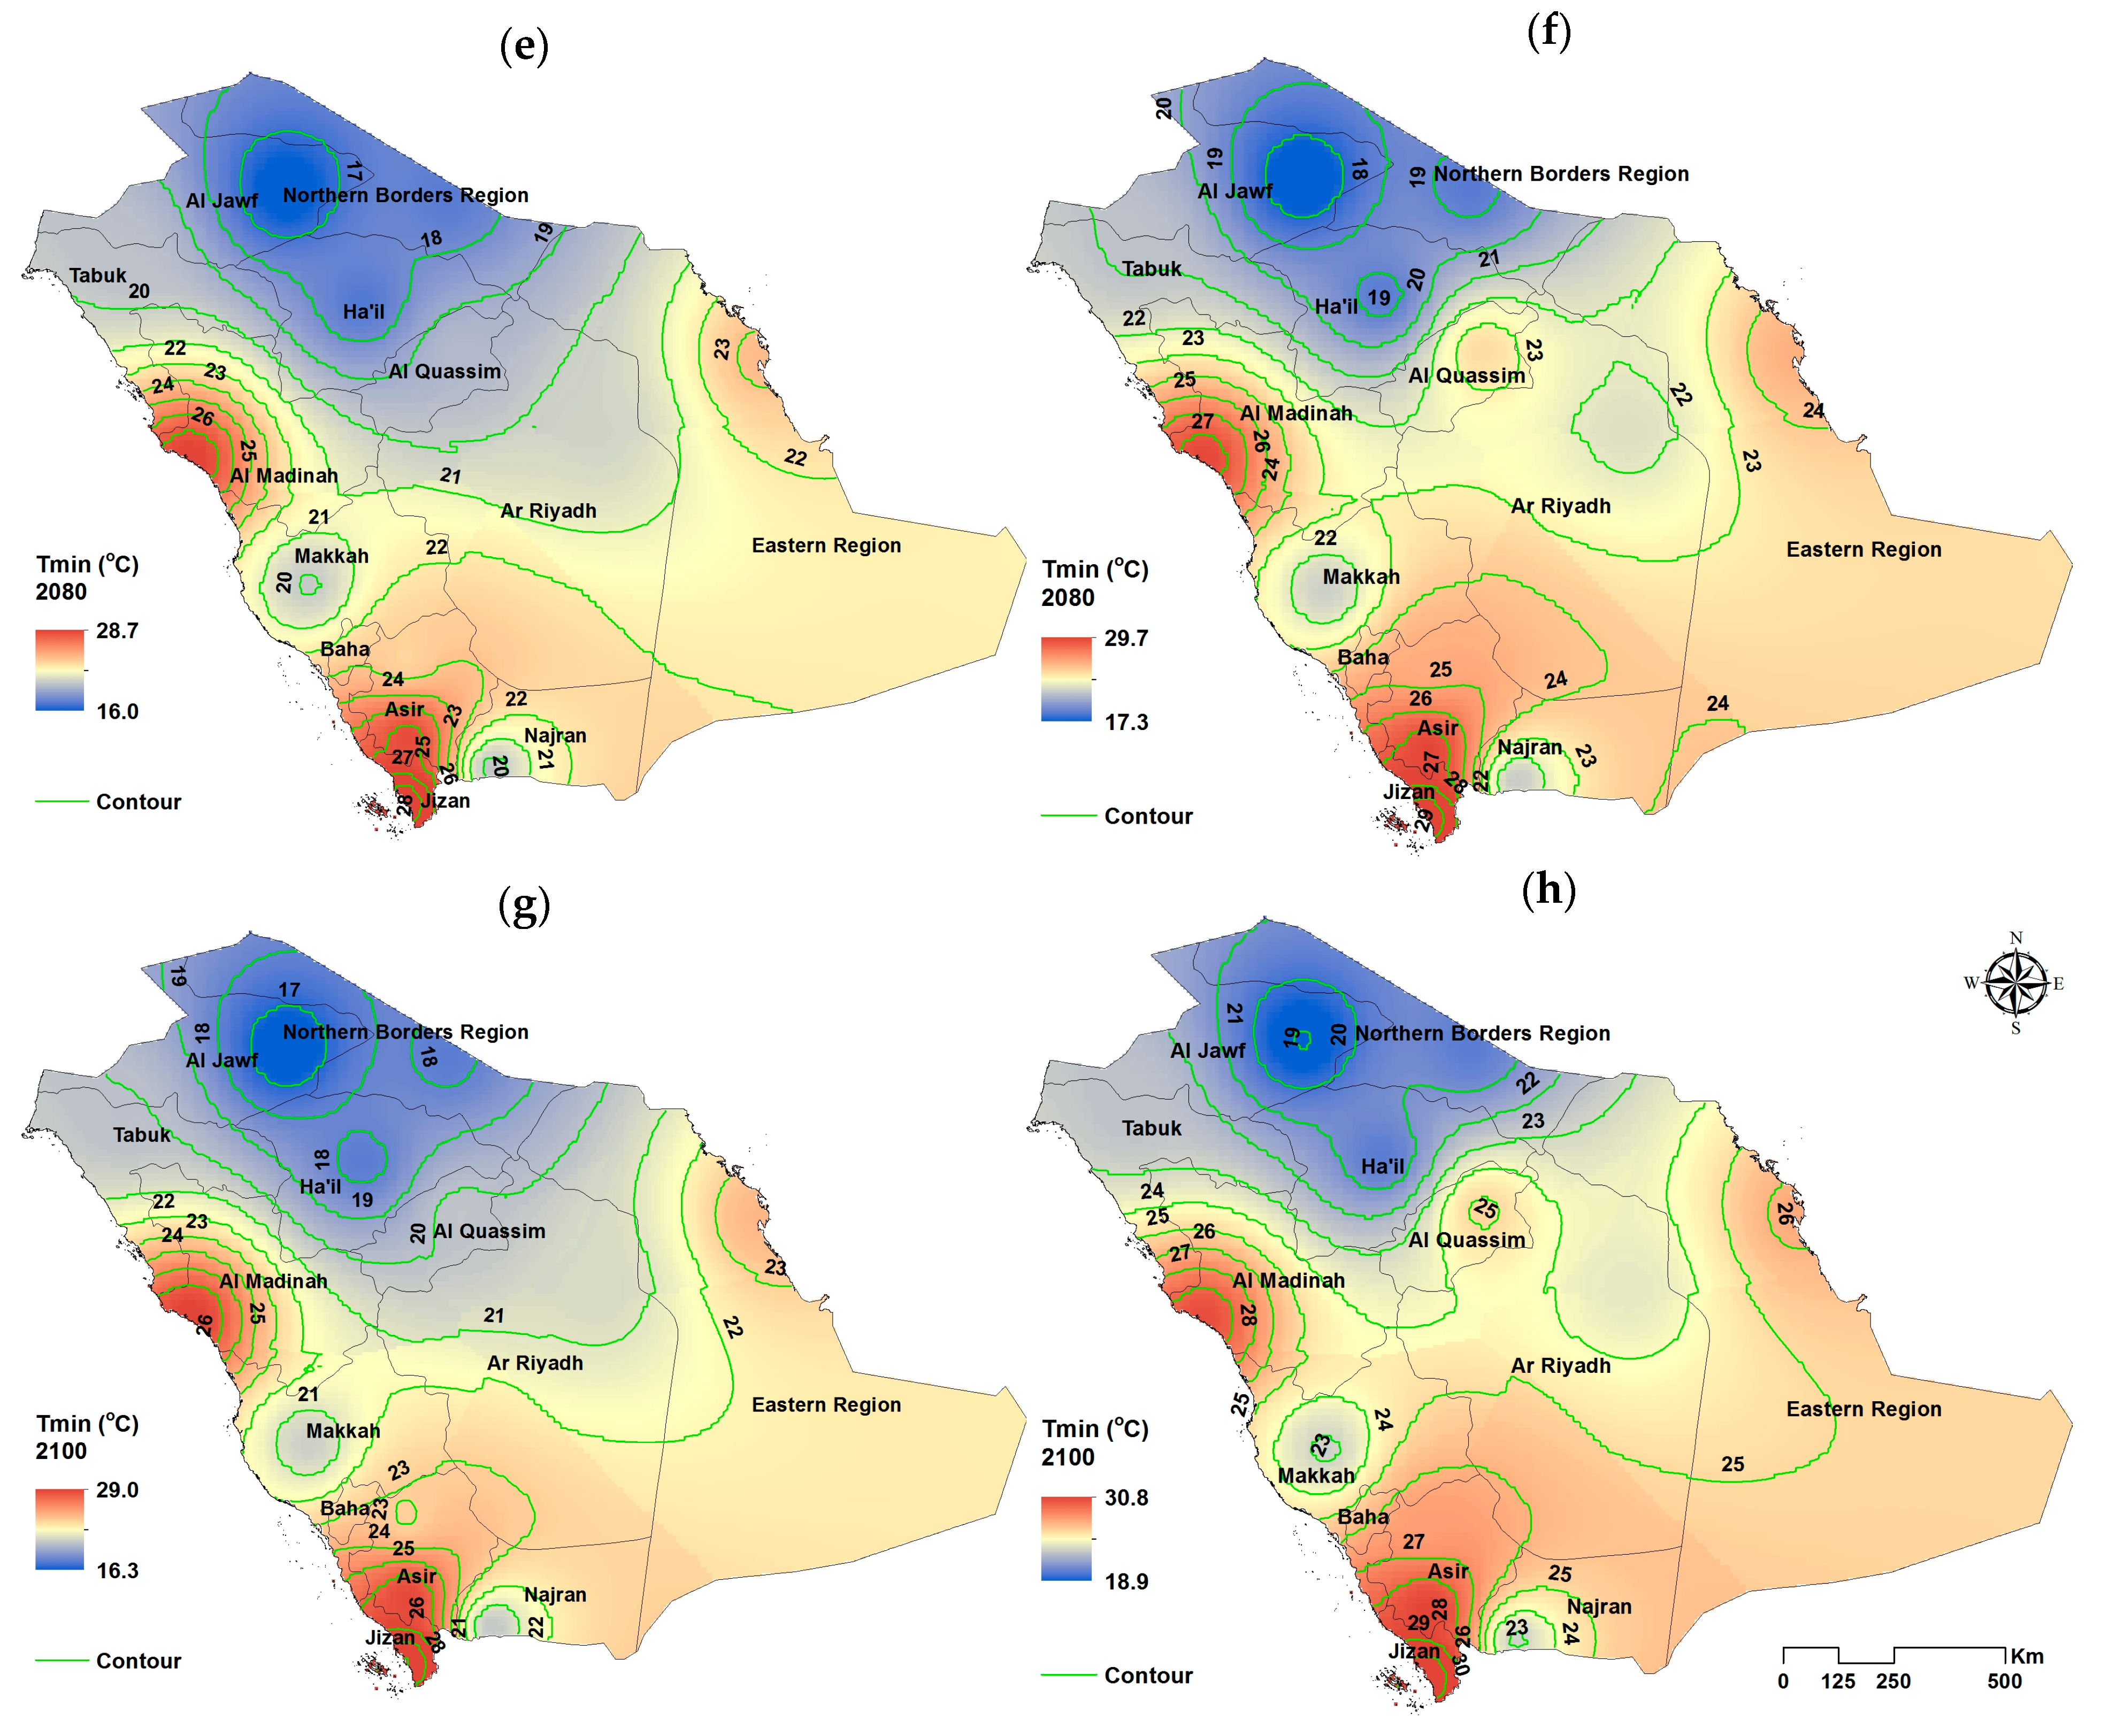
Figure 3.
Annual-averaged Tmin (°C) under SSP2-4.5 on the left for (a) 2040, (c) 2060, (e) 2080, and (g) 2100 and SSP2-8.5 on the right for (b) 2040, (d) 2060, (f) 2080, and (h) 2100.
Figure 3.
Annual-averaged Tmin (°C) under SSP2-4.5 on the left for (a) 2040, (c) 2060, (e) 2080, and (g) 2100 and SSP2-8.5 on the right for (b) 2040, (d) 2060, (f) 2080, and (h) 2100.
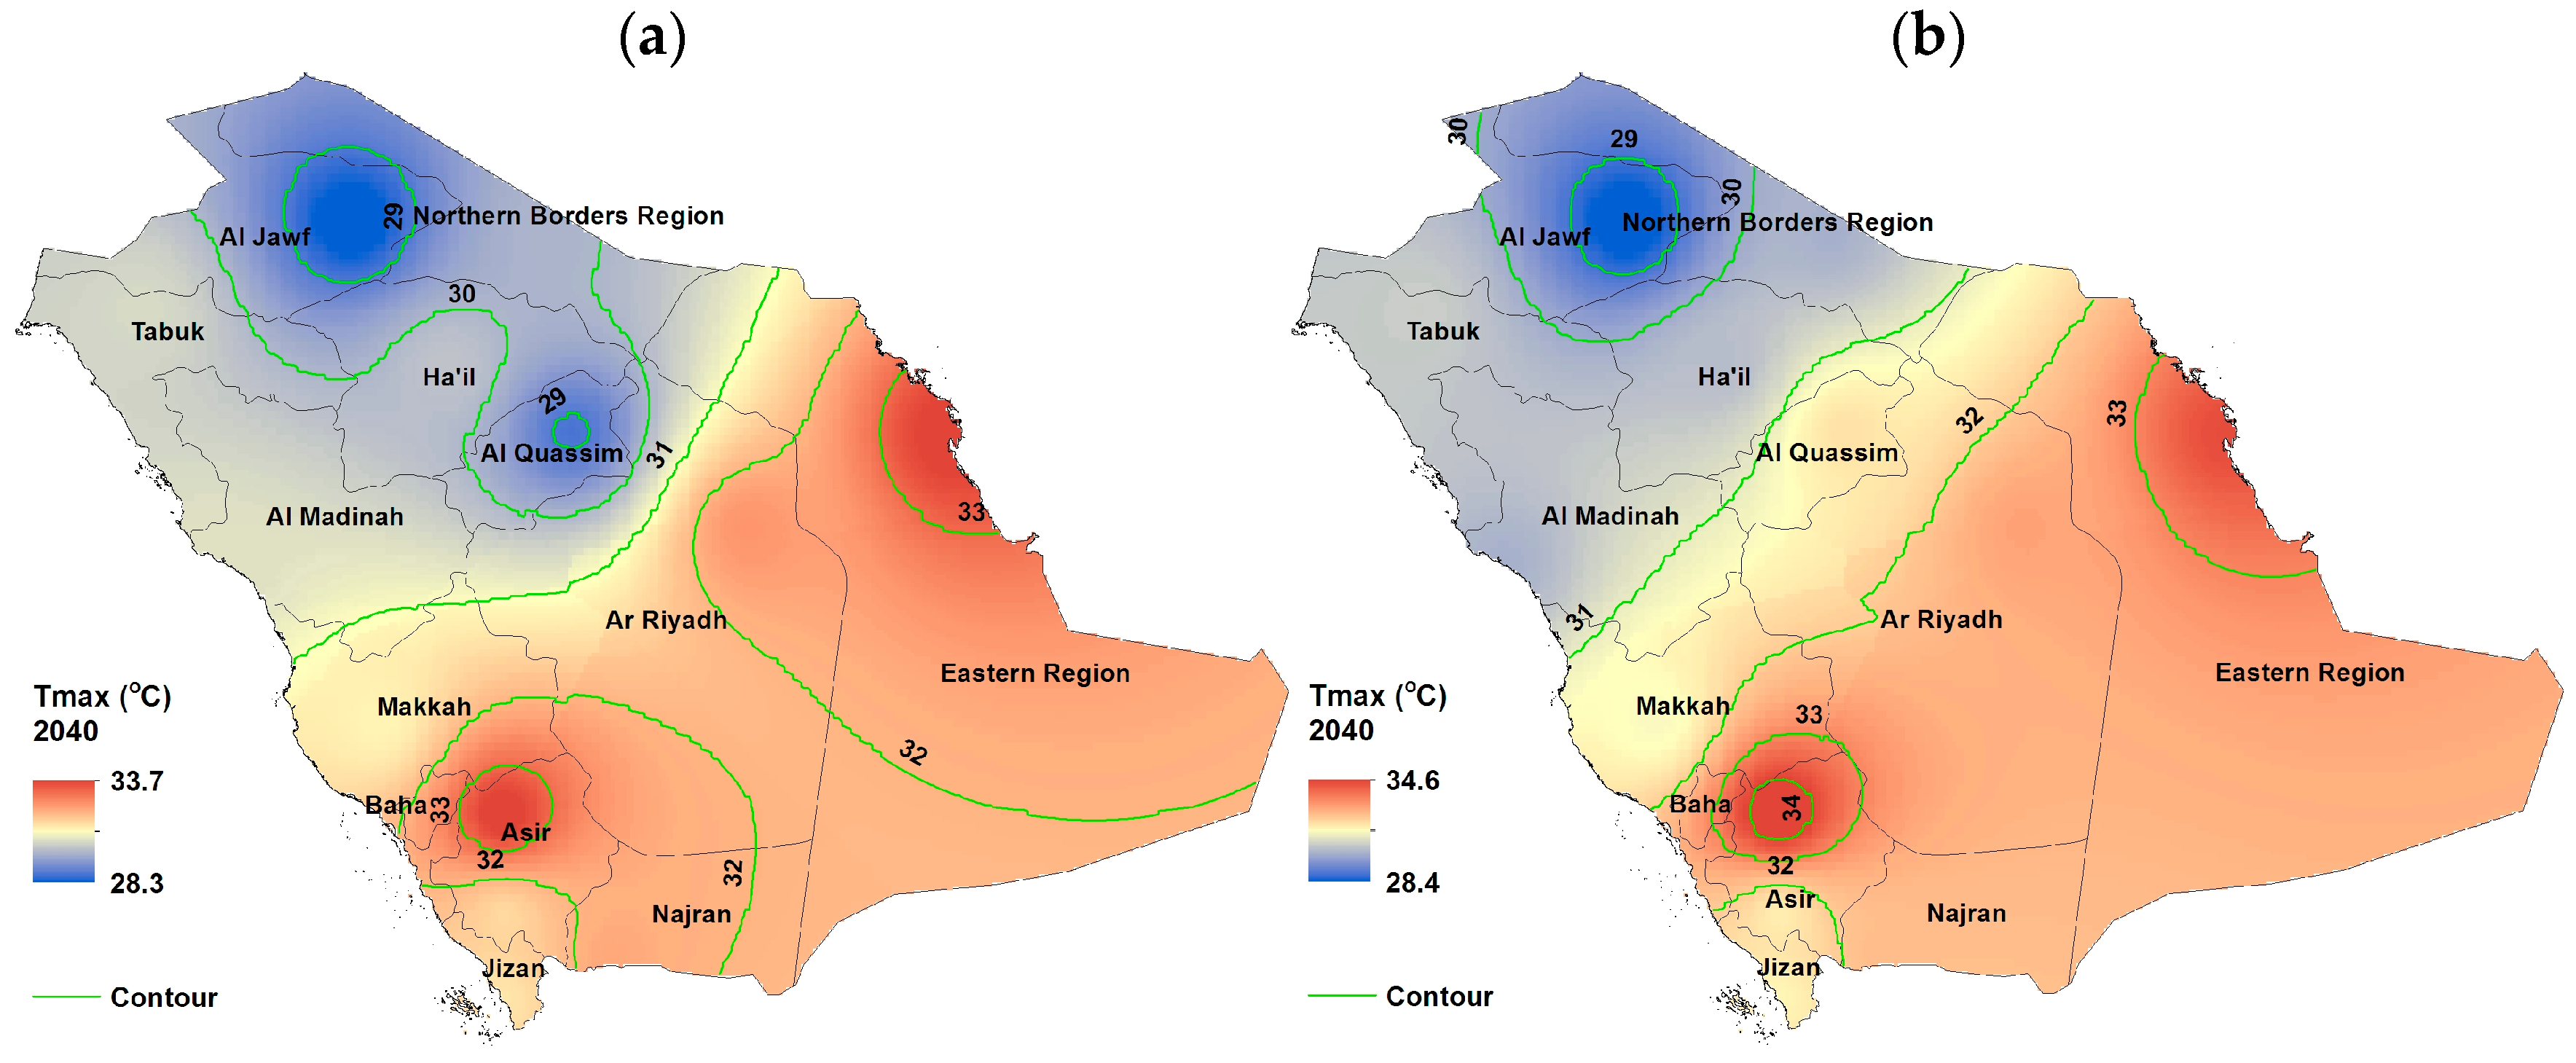
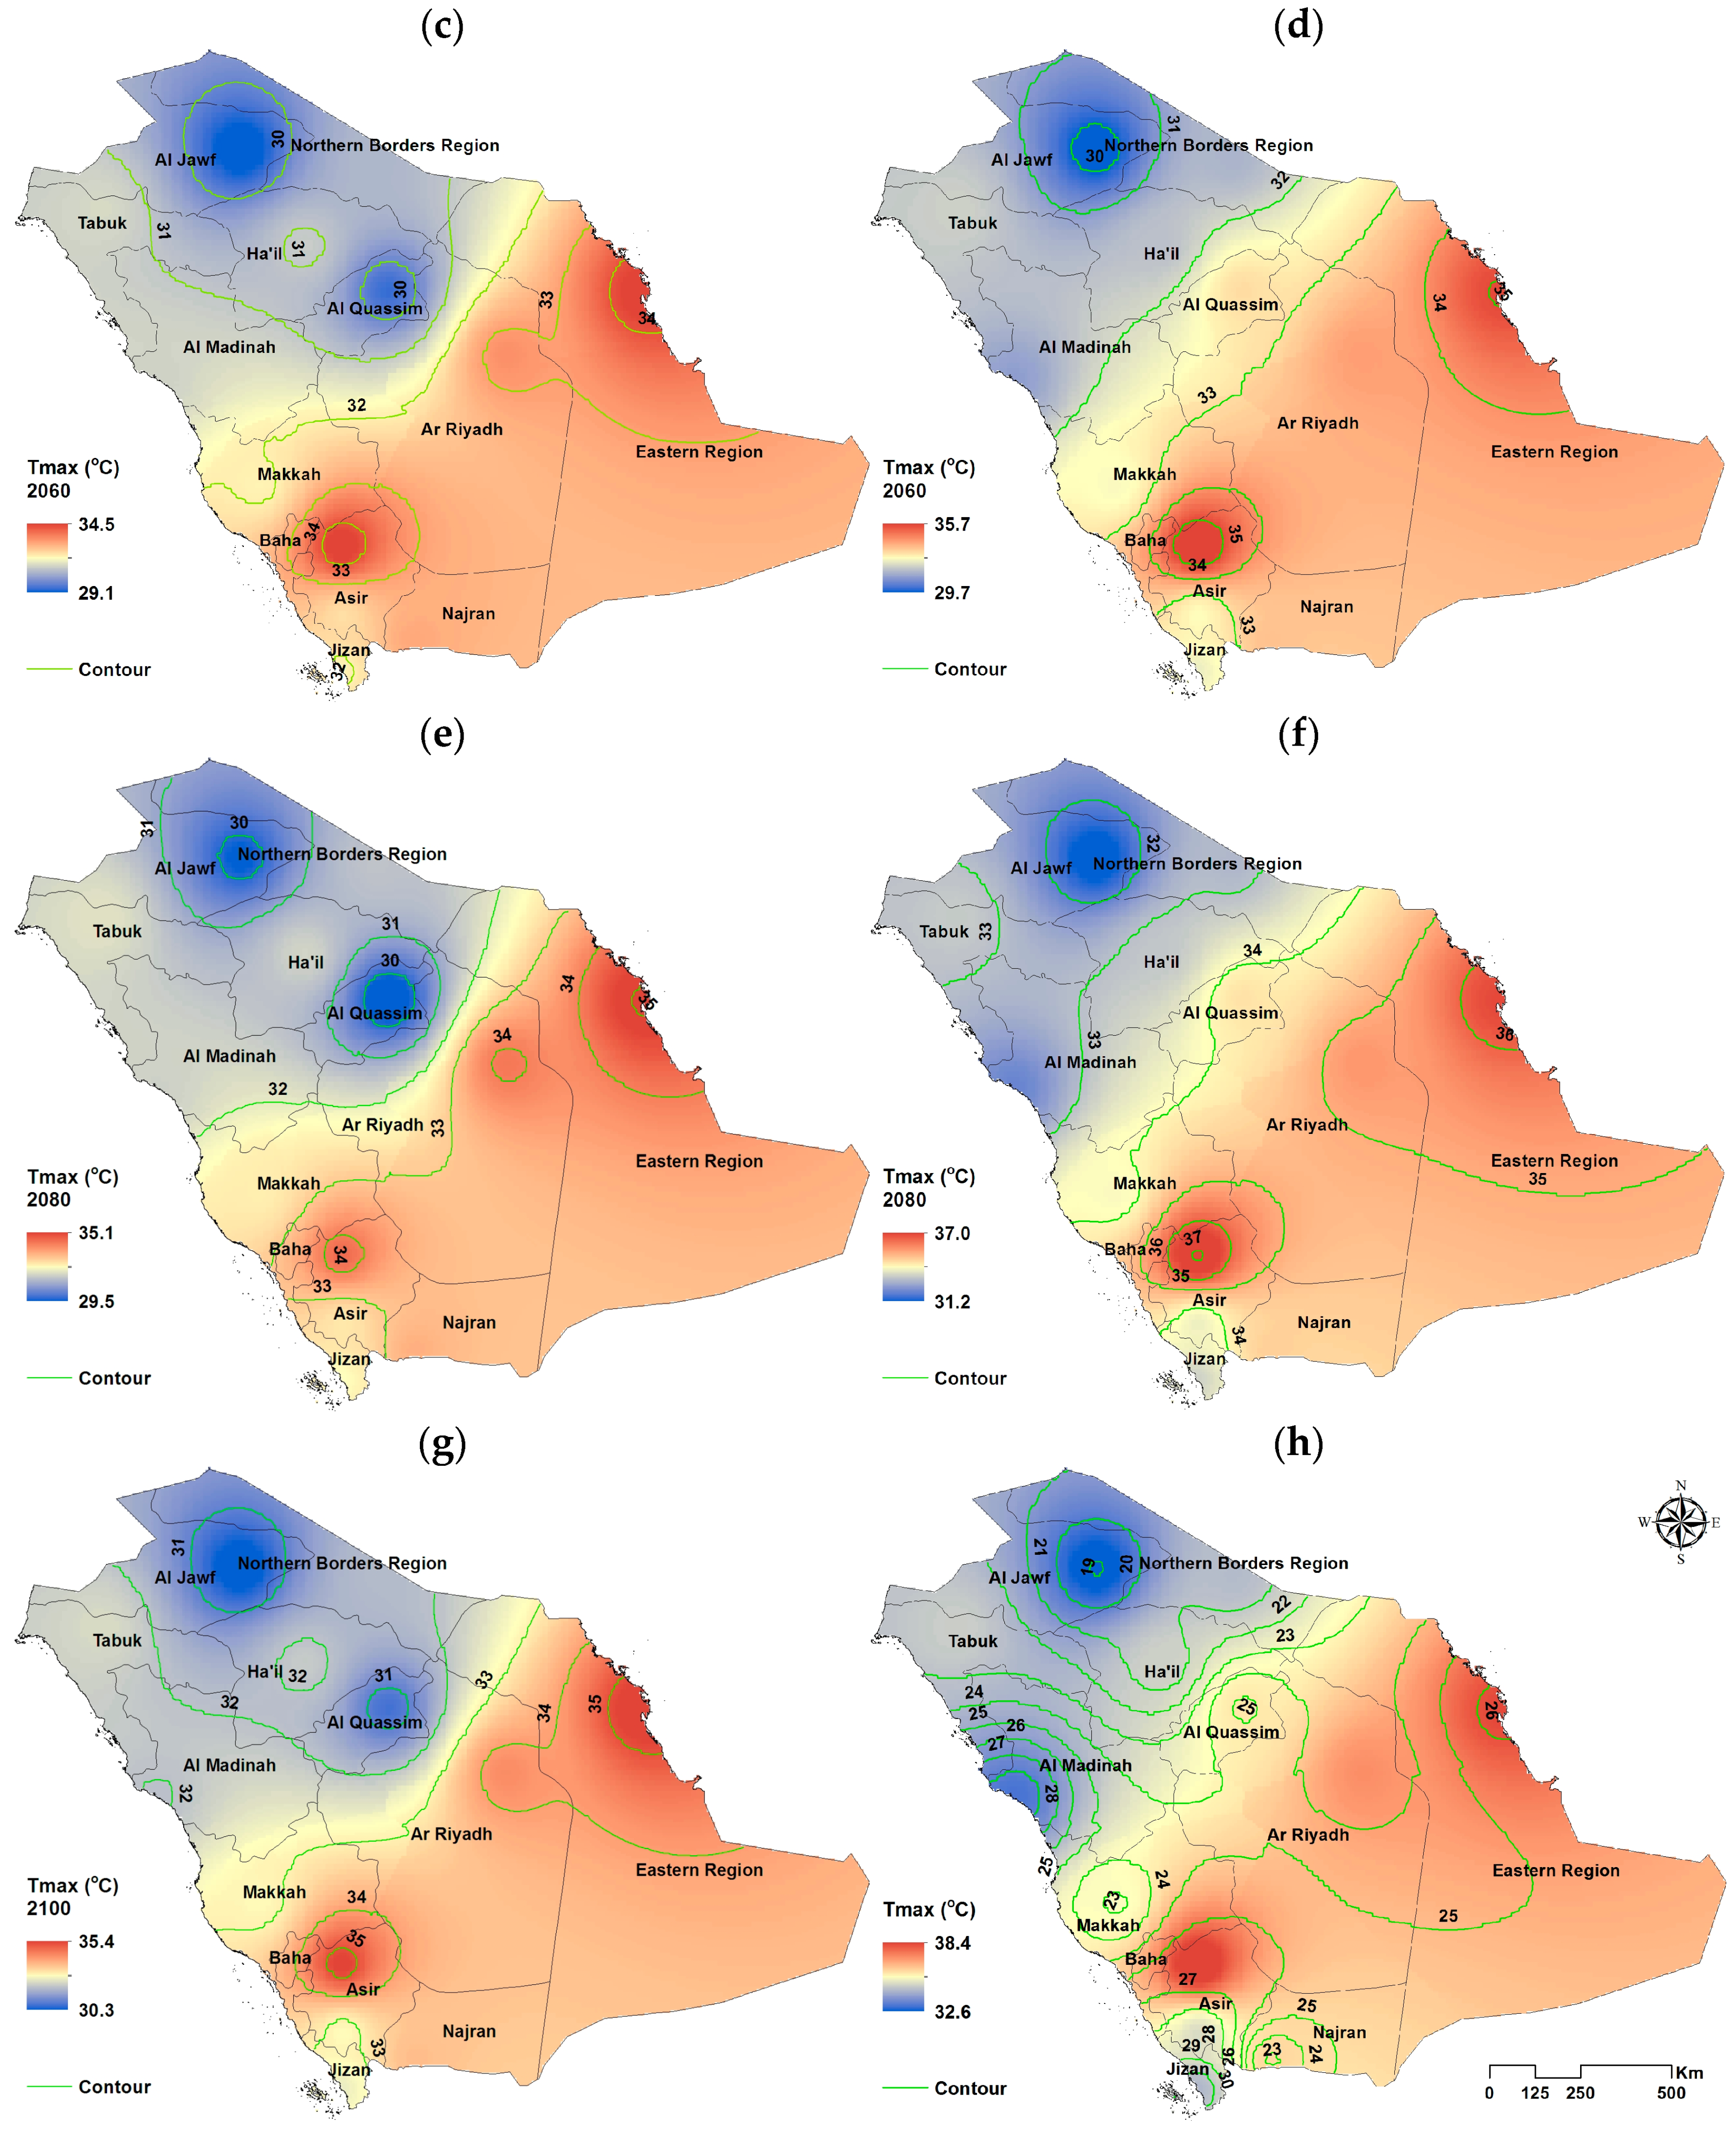
Figure 4.
Annual-averaged Tmax (°C) under SSP2-4.5 on the left for (a) 2040, (c) 2060, (e) 2080, and (g) 2100 and SSP2-8.5 on the right for (b) 2040, (d) 2060, (f) 2080, and (h) 2100.
Figure 4.
Annual-averaged Tmax (°C) under SSP2-4.5 on the left for (a) 2040, (c) 2060, (e) 2080, and (g) 2100 and SSP2-8.5 on the right for (b) 2040, (d) 2060, (f) 2080, and (h) 2100.
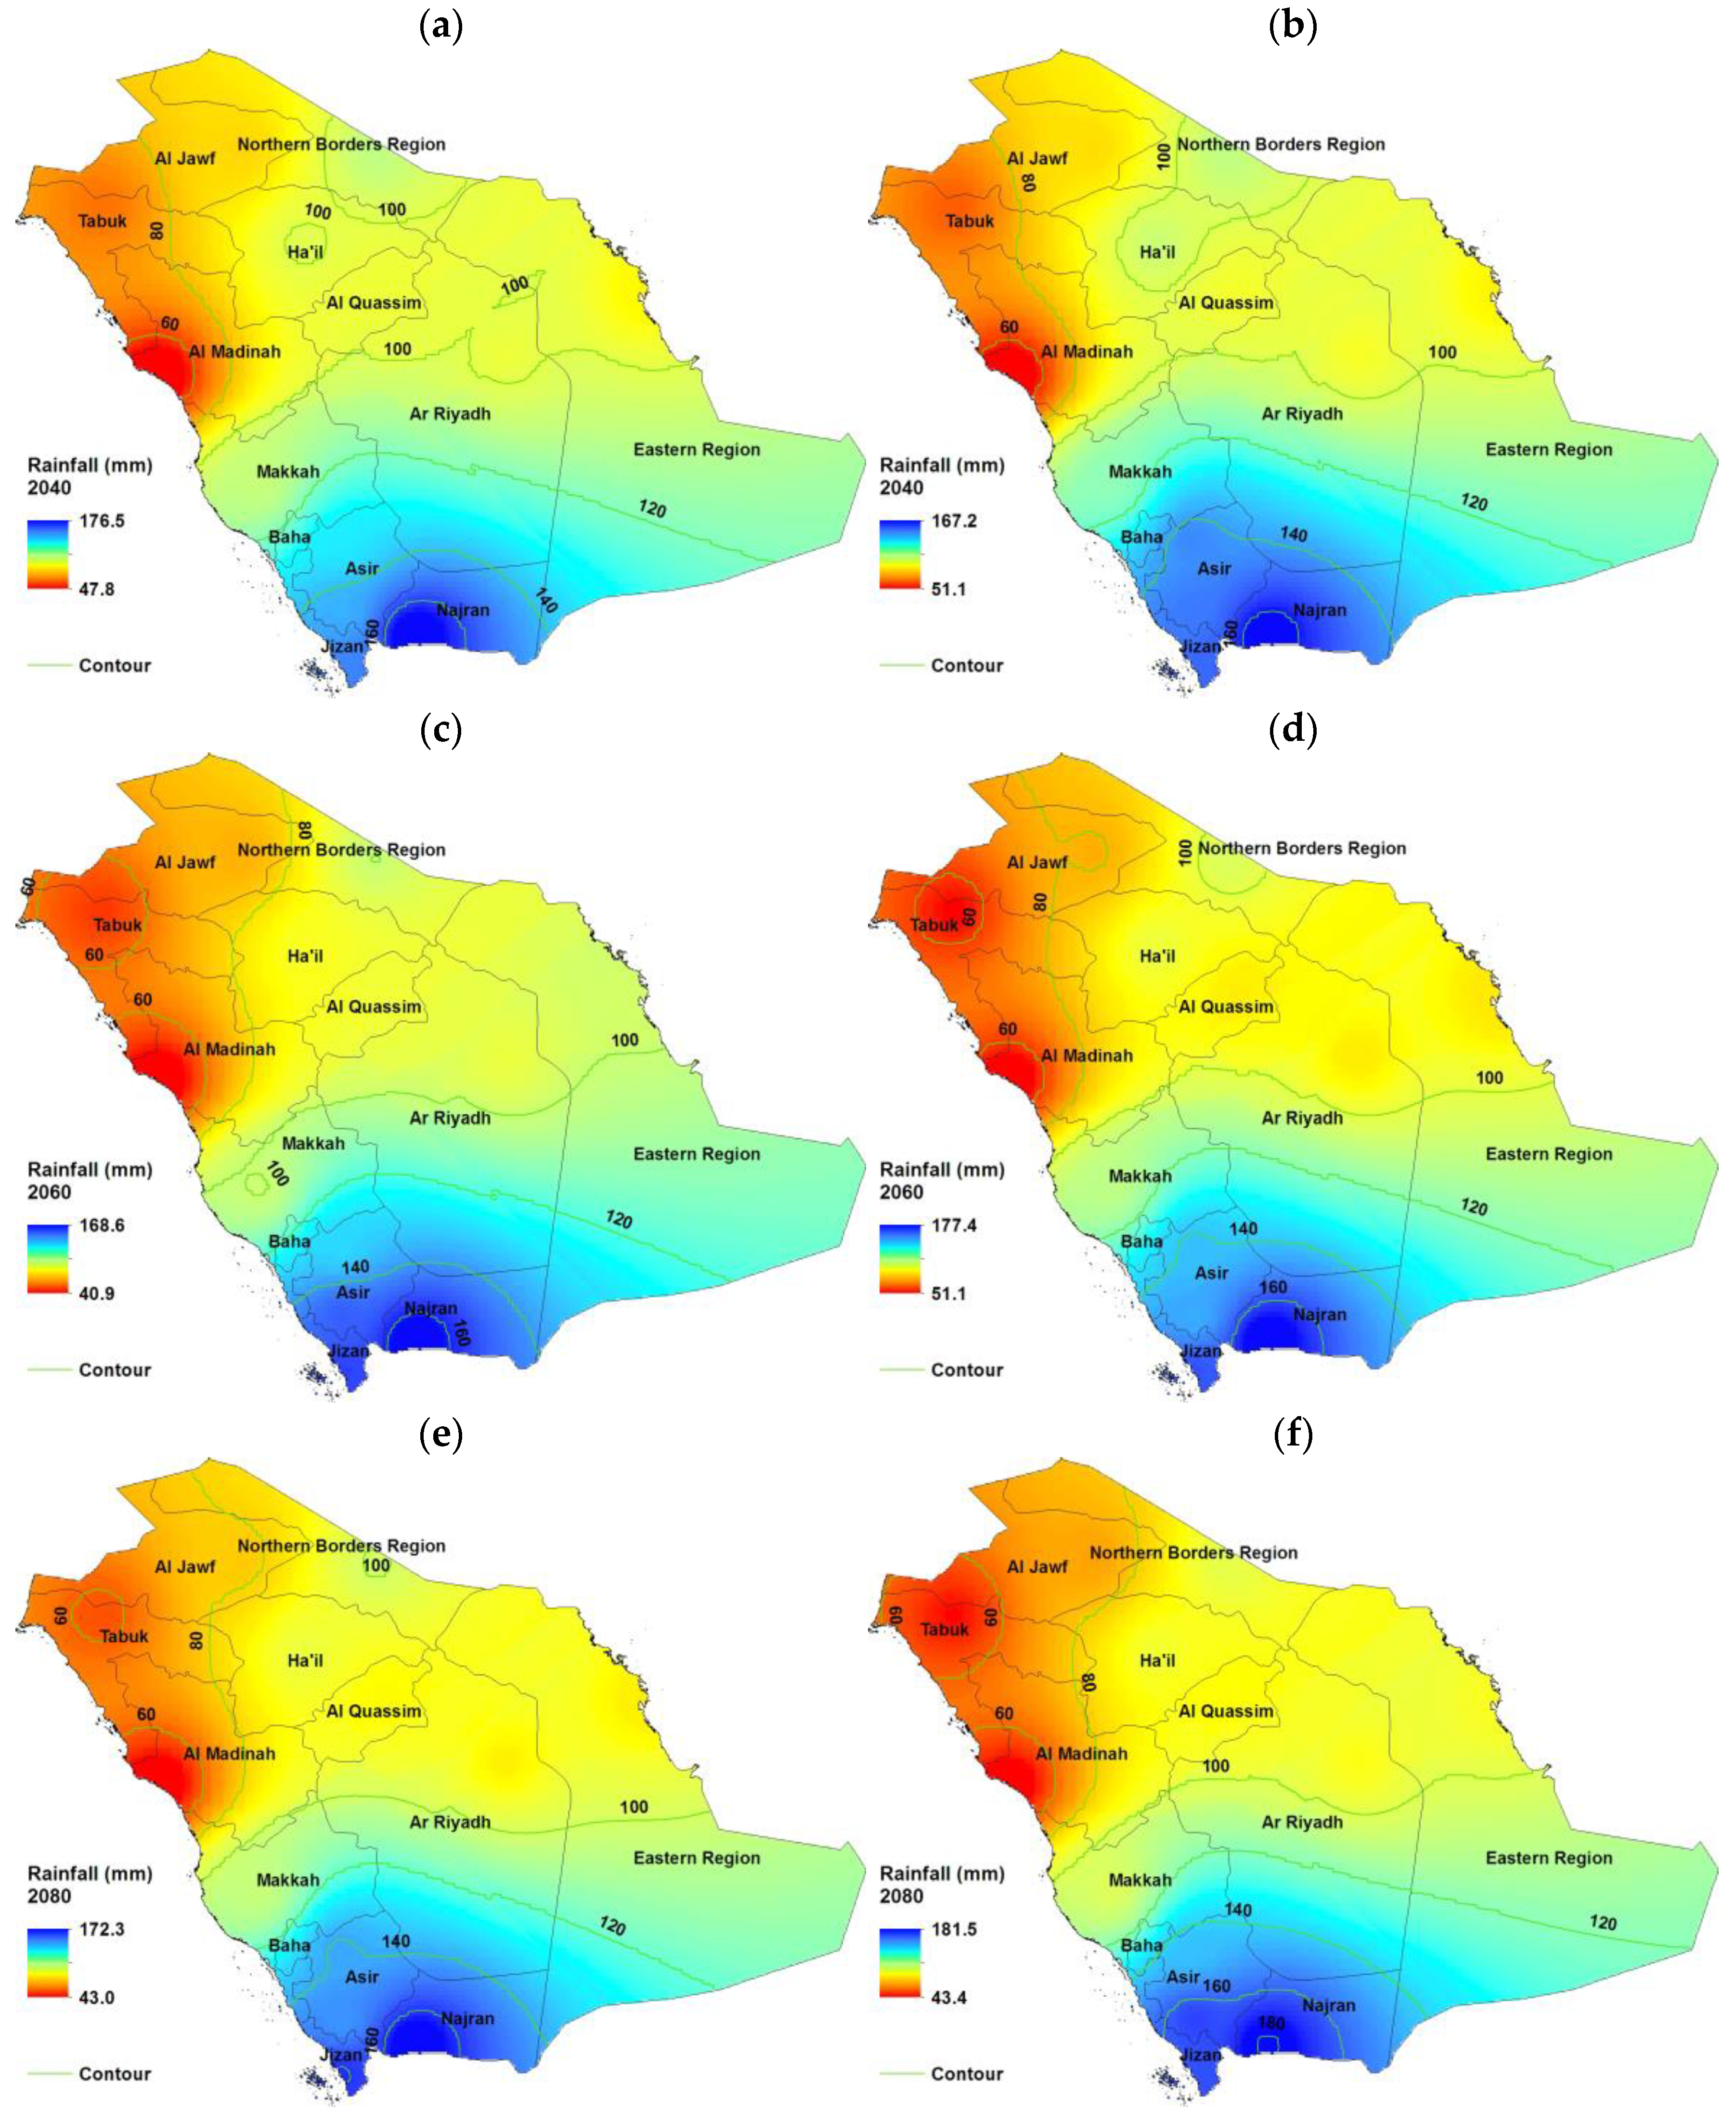
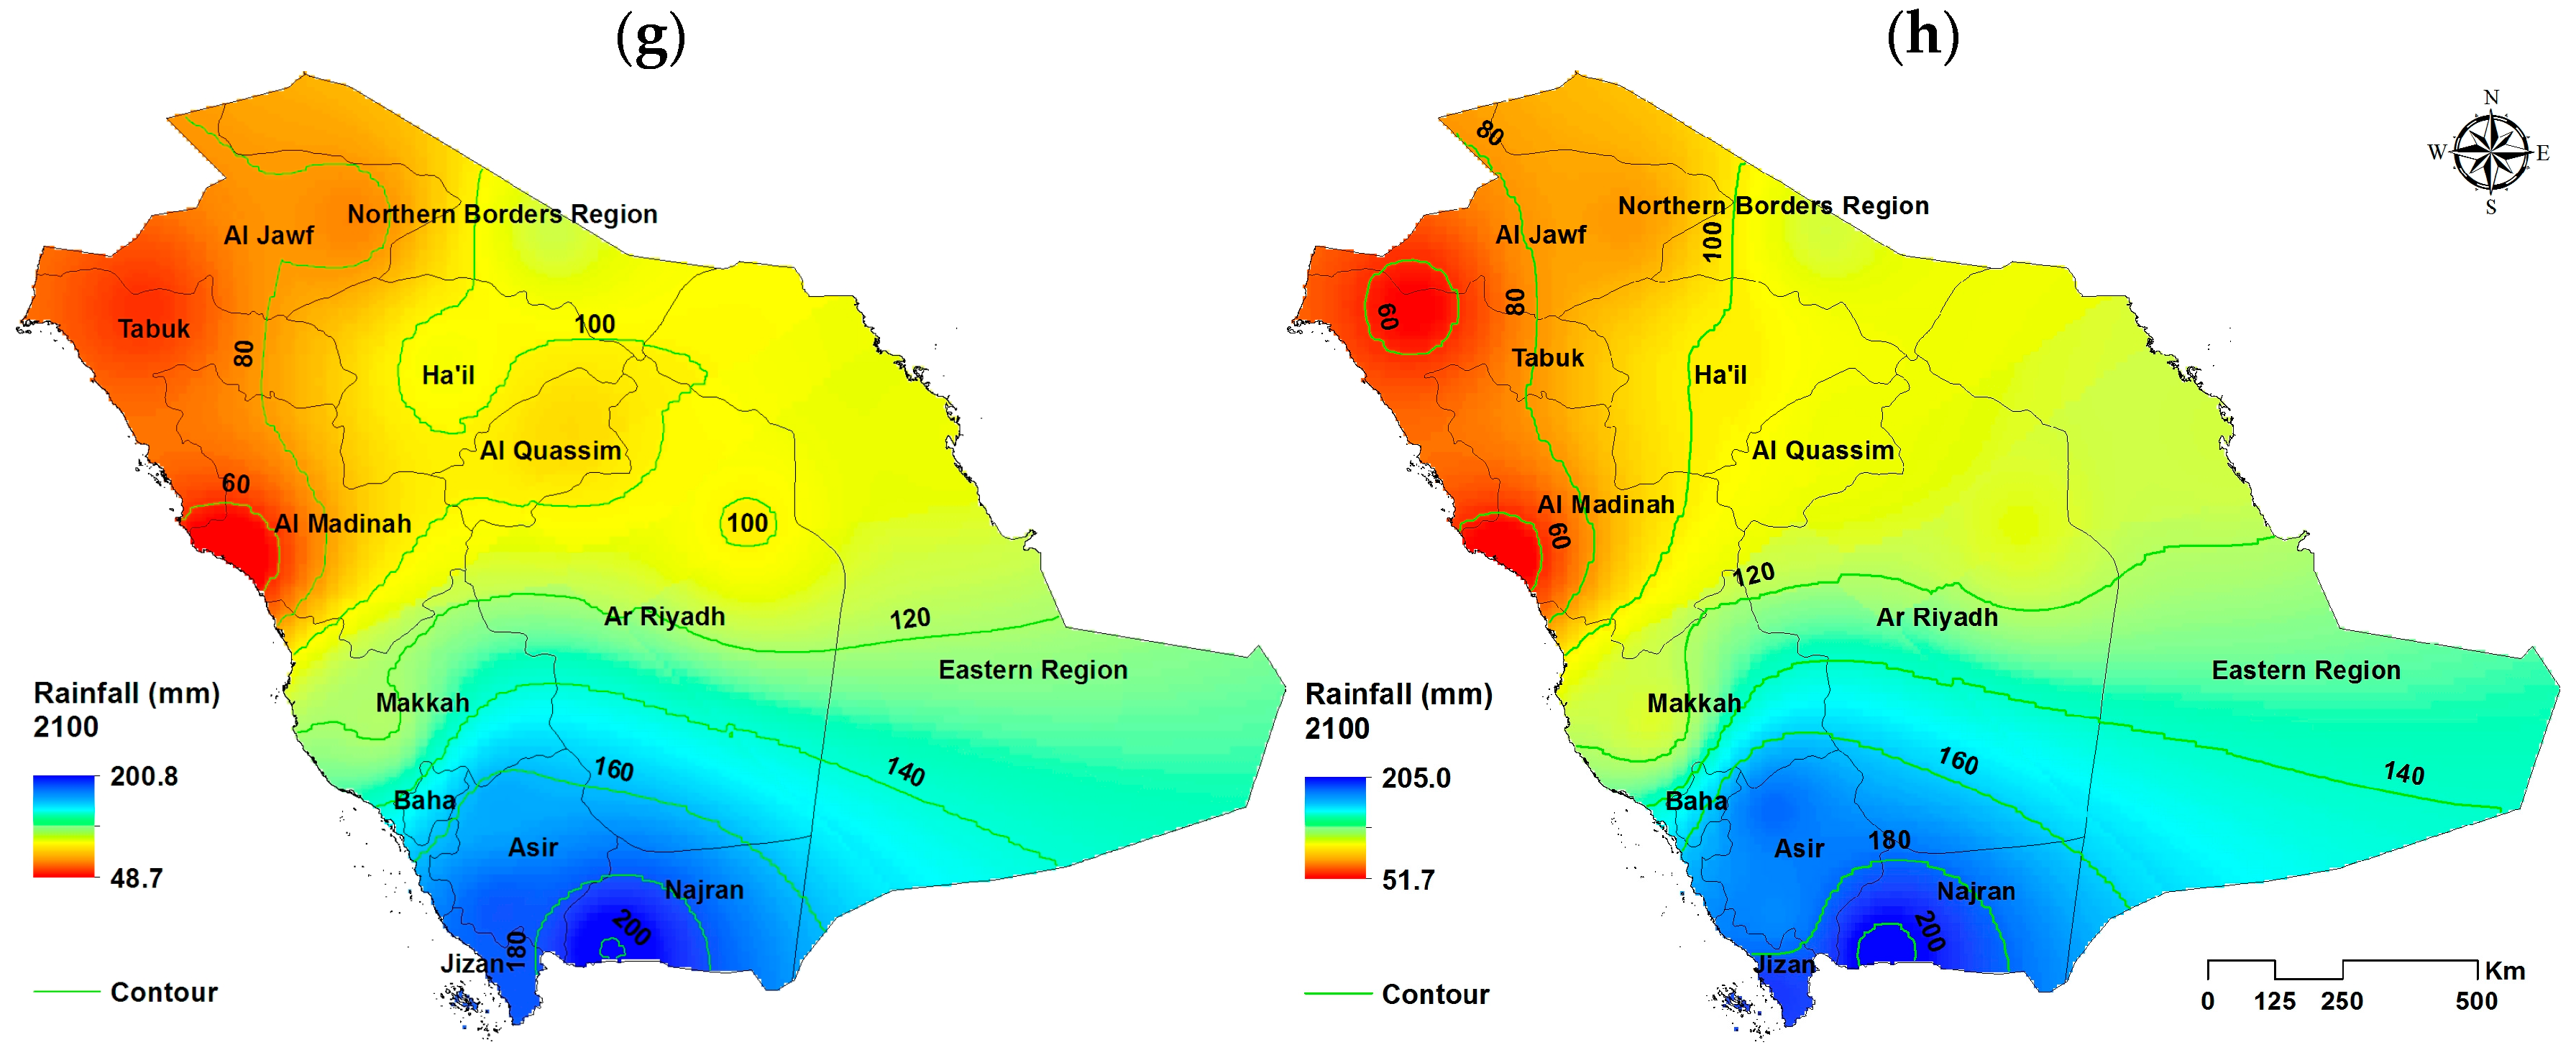
Figure 5.
Annual-averaged rainfall (mm) SSP2-4.5 on the left for (a) 2040, (c) 2060, (e) 2080, and (g) 2100 and SSP2-8.5 on the right for (b) 2040, (d) 2060, (f) 2080, and (h) 2100.3.3. Reference Evapotranspiration Distribution and Change.
Figure 5.
Annual-averaged rainfall (mm) SSP2-4.5 on the left for (a) 2040, (c) 2060, (e) 2080, and (g) 2100 and SSP2-8.5 on the right for (b) 2040, (d) 2060, (f) 2080, and (h) 2100.3.3. Reference Evapotranspiration Distribution and Change.
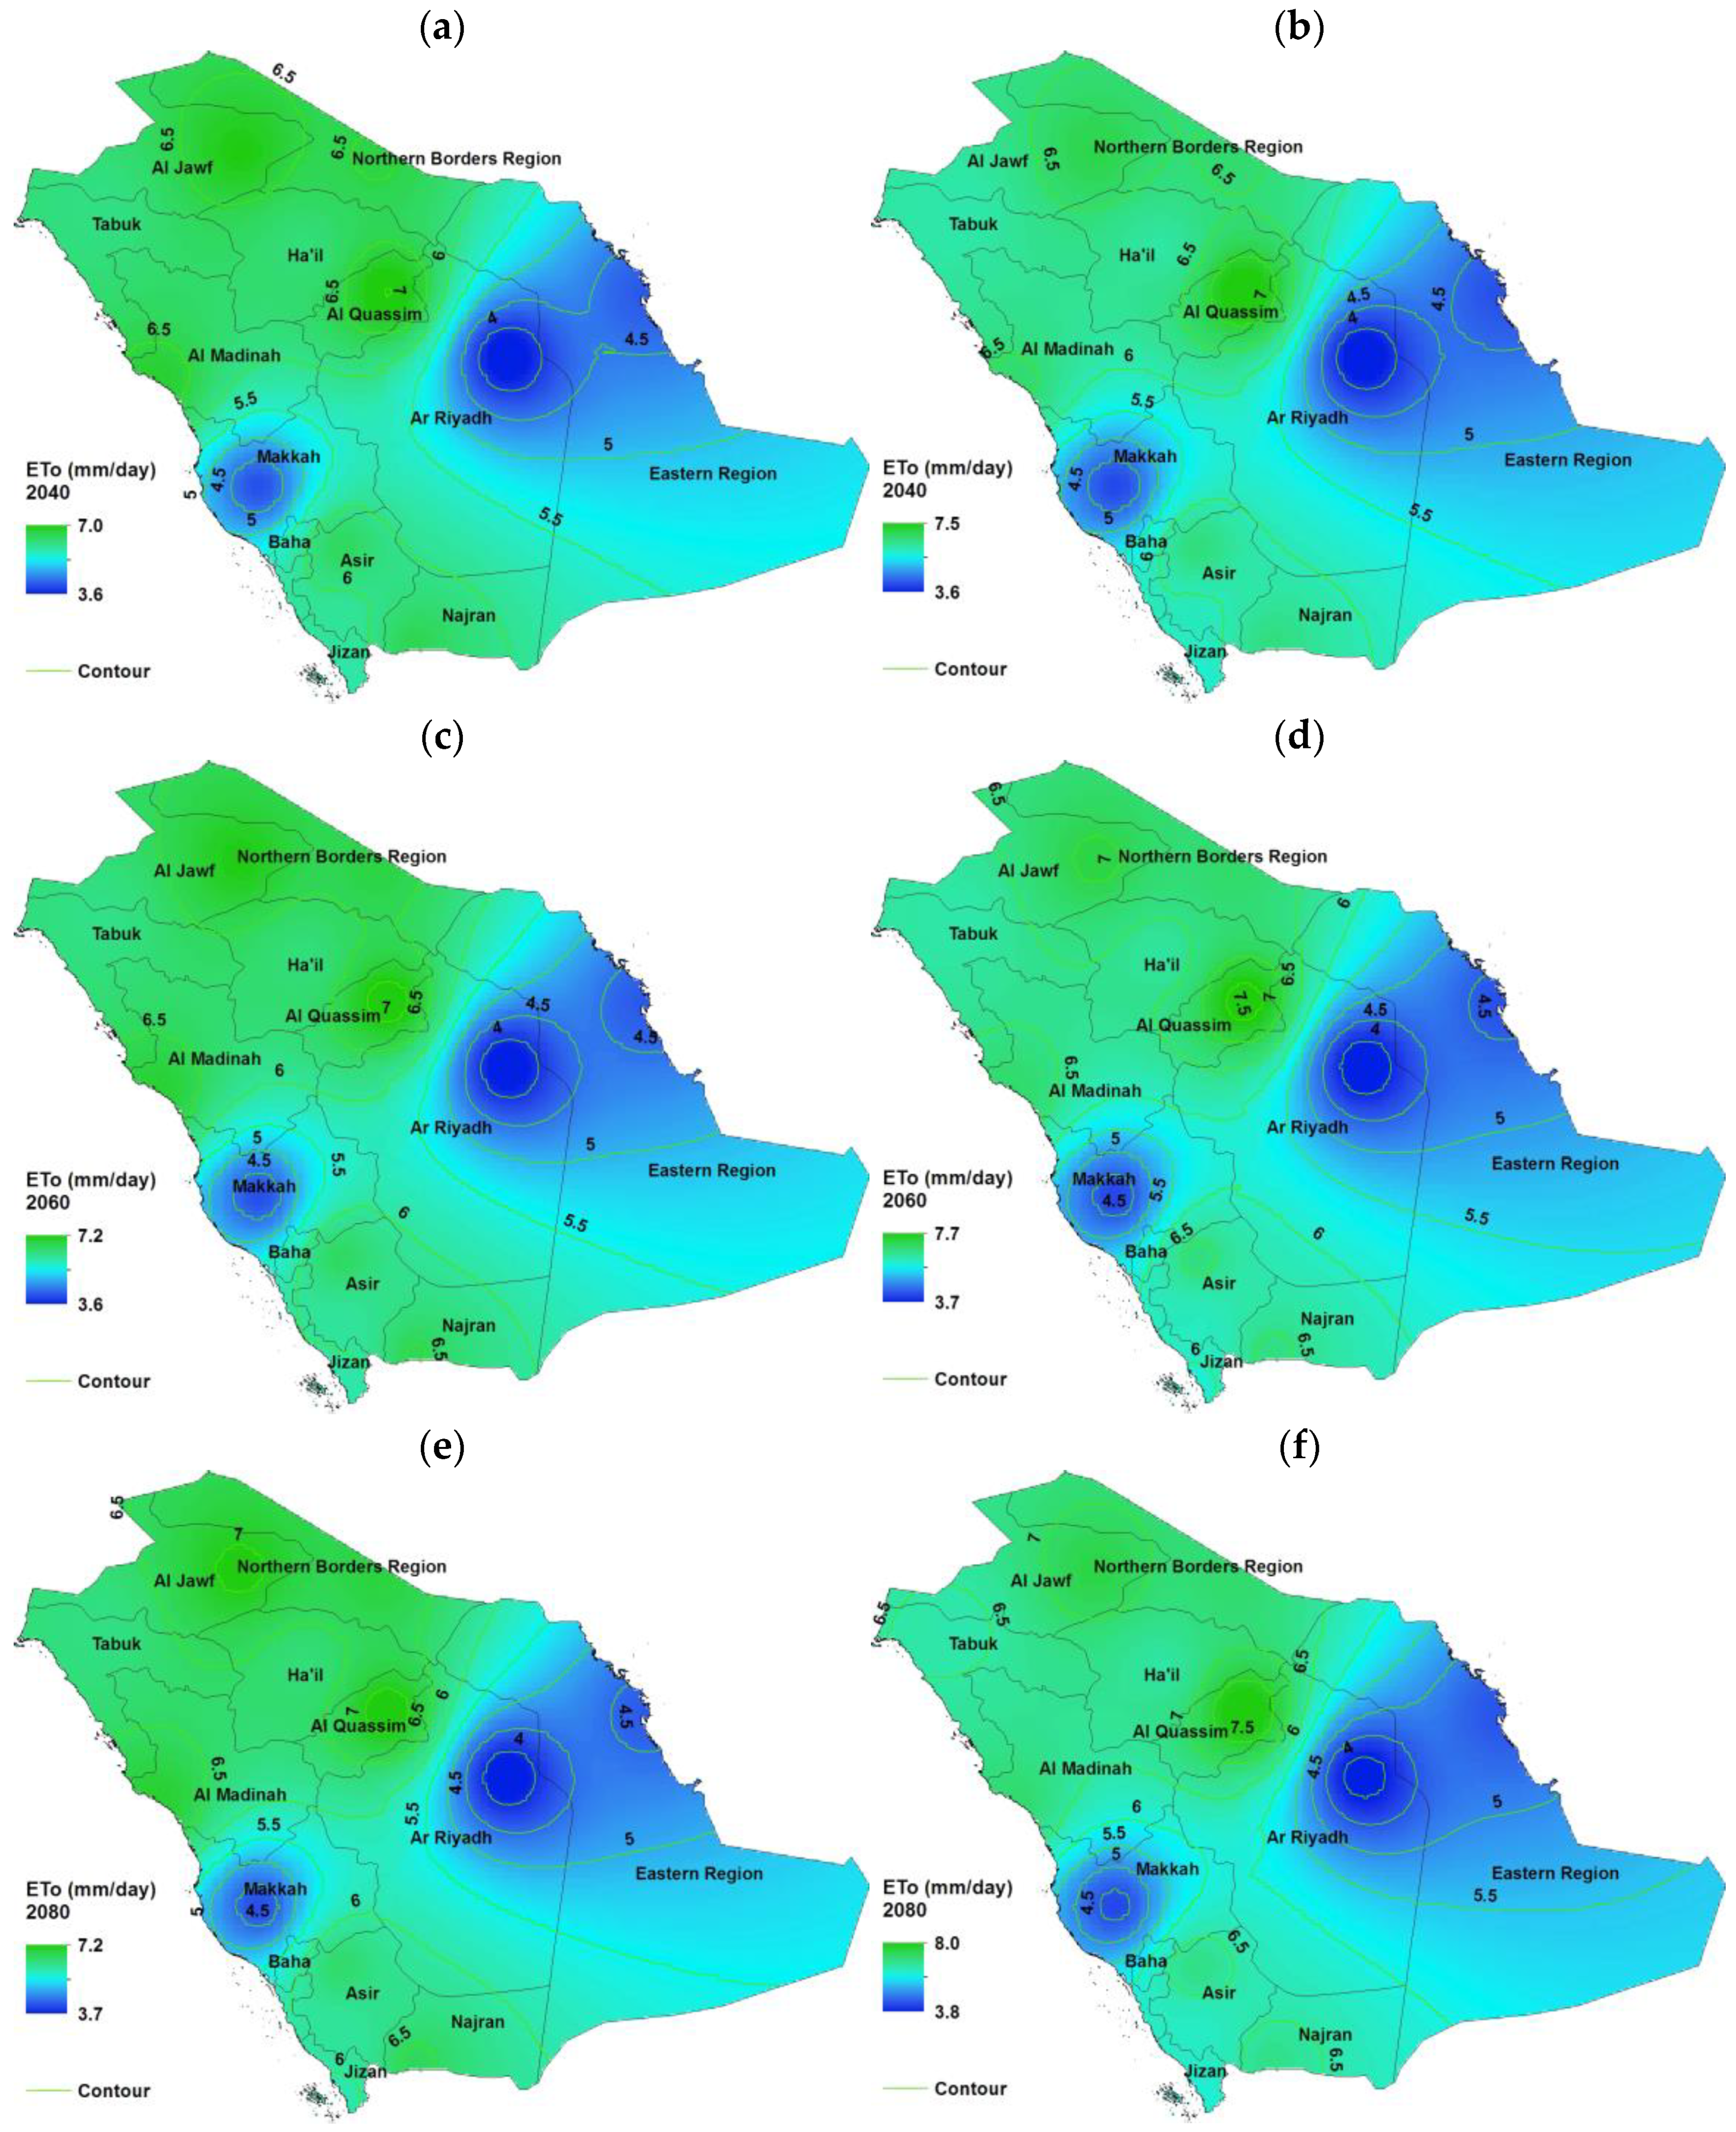
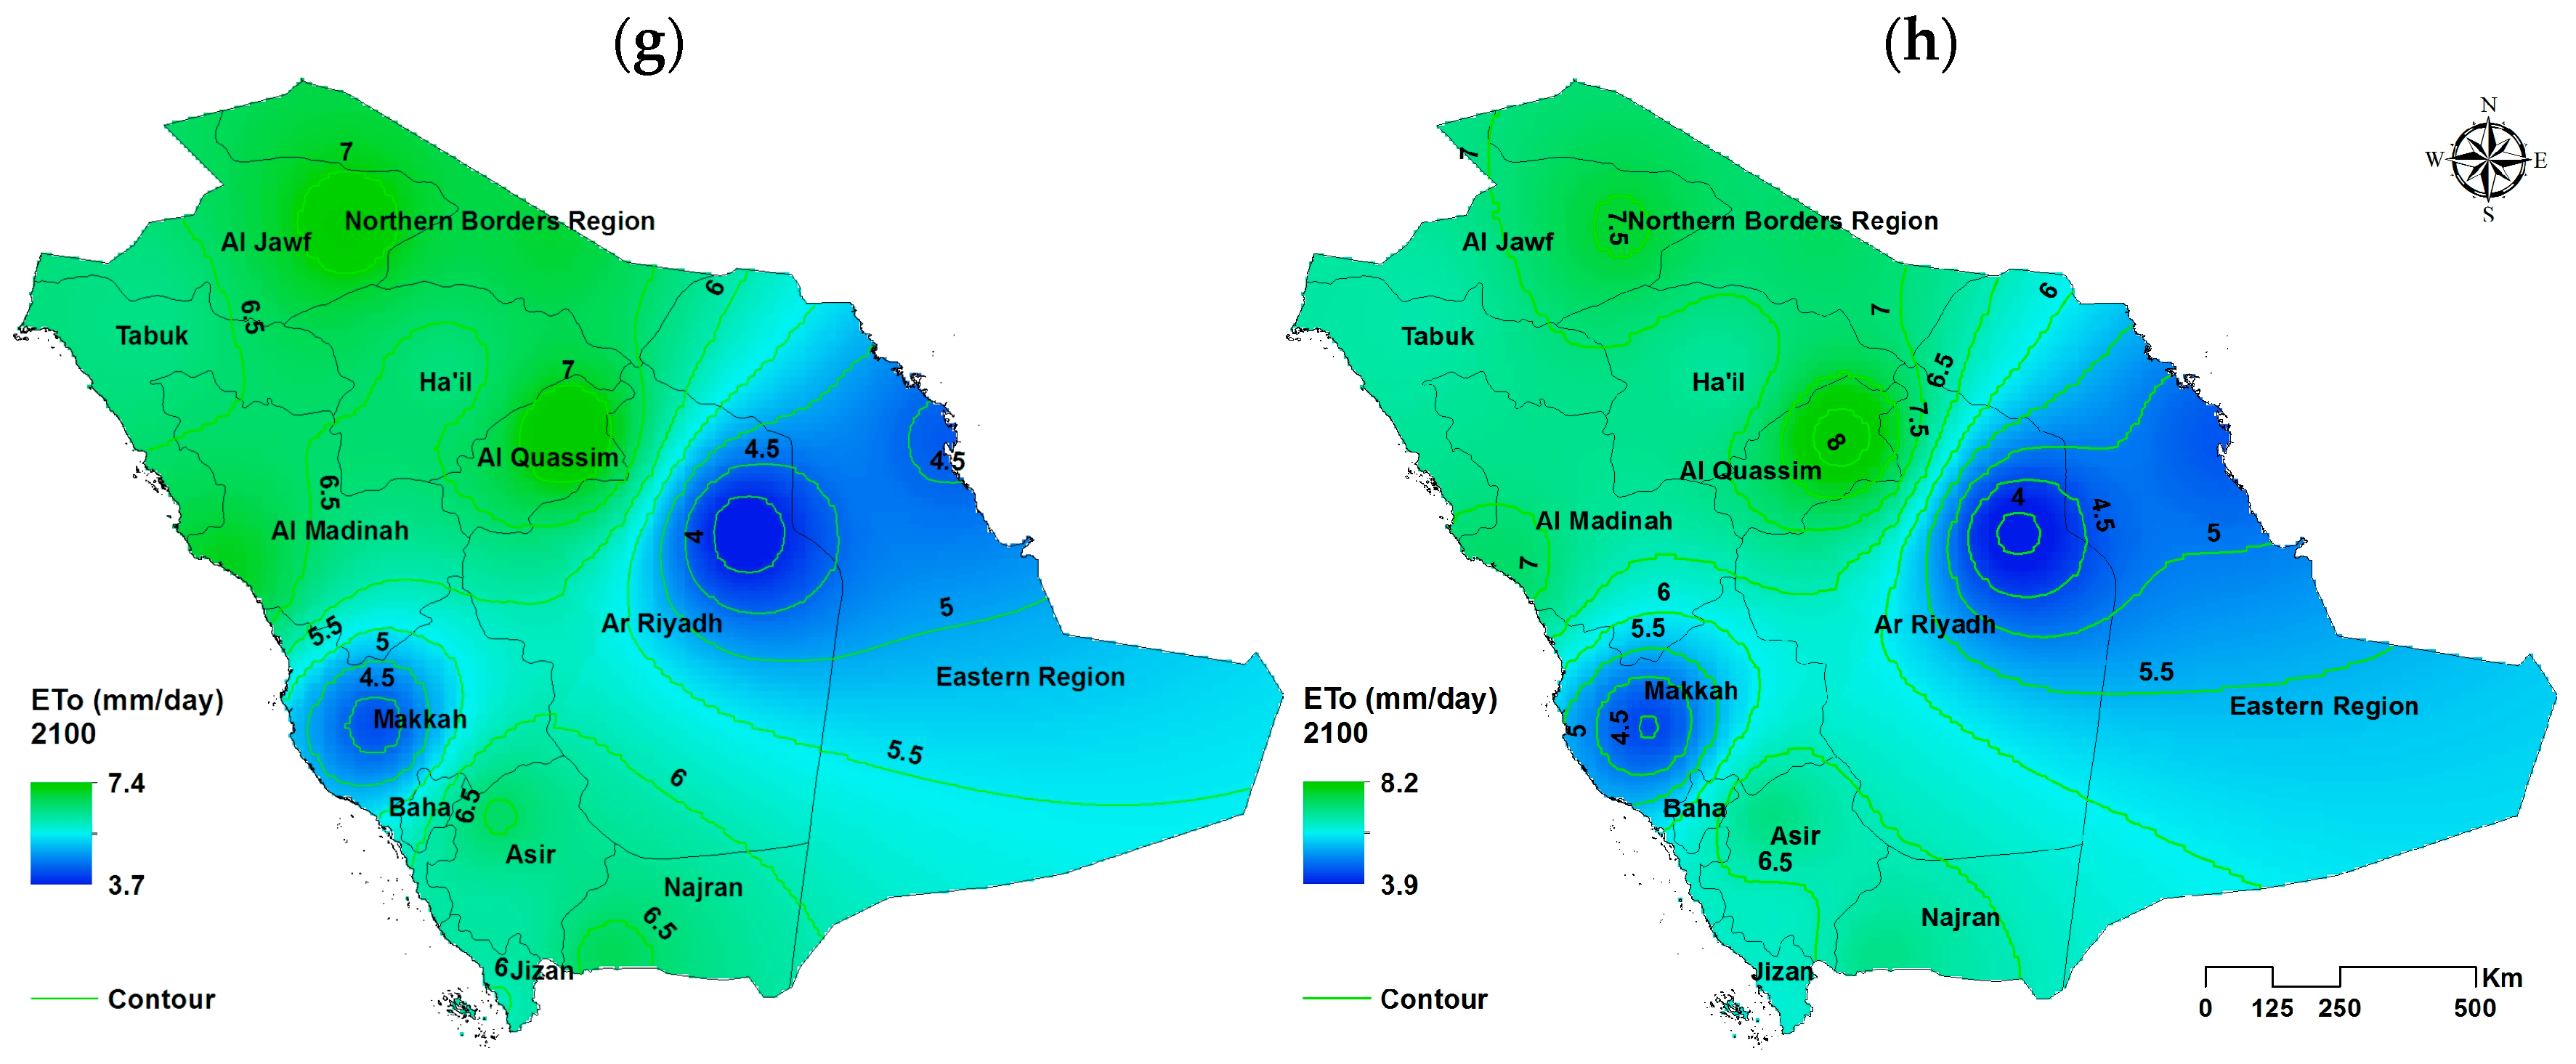
Figure 6.
Annual-averaged ETo (mm/day) under SSP2-4.5 on the left for (a) 2040, (c) 2060, (e) 2080, and (g) 2100 and SSP2-8.5 on the right for (b) 2040, (d) 2060, (f) 2080, and (h) 2100, using average data from the four CMIP6 climate models.
Figure 6.
Annual-averaged ETo (mm/day) under SSP2-4.5 on the left for (a) 2040, (c) 2060, (e) 2080, and (g) 2100 and SSP2-8.5 on the right for (b) 2040, (d) 2060, (f) 2080, and (h) 2100, using average data from the four CMIP6 climate models.
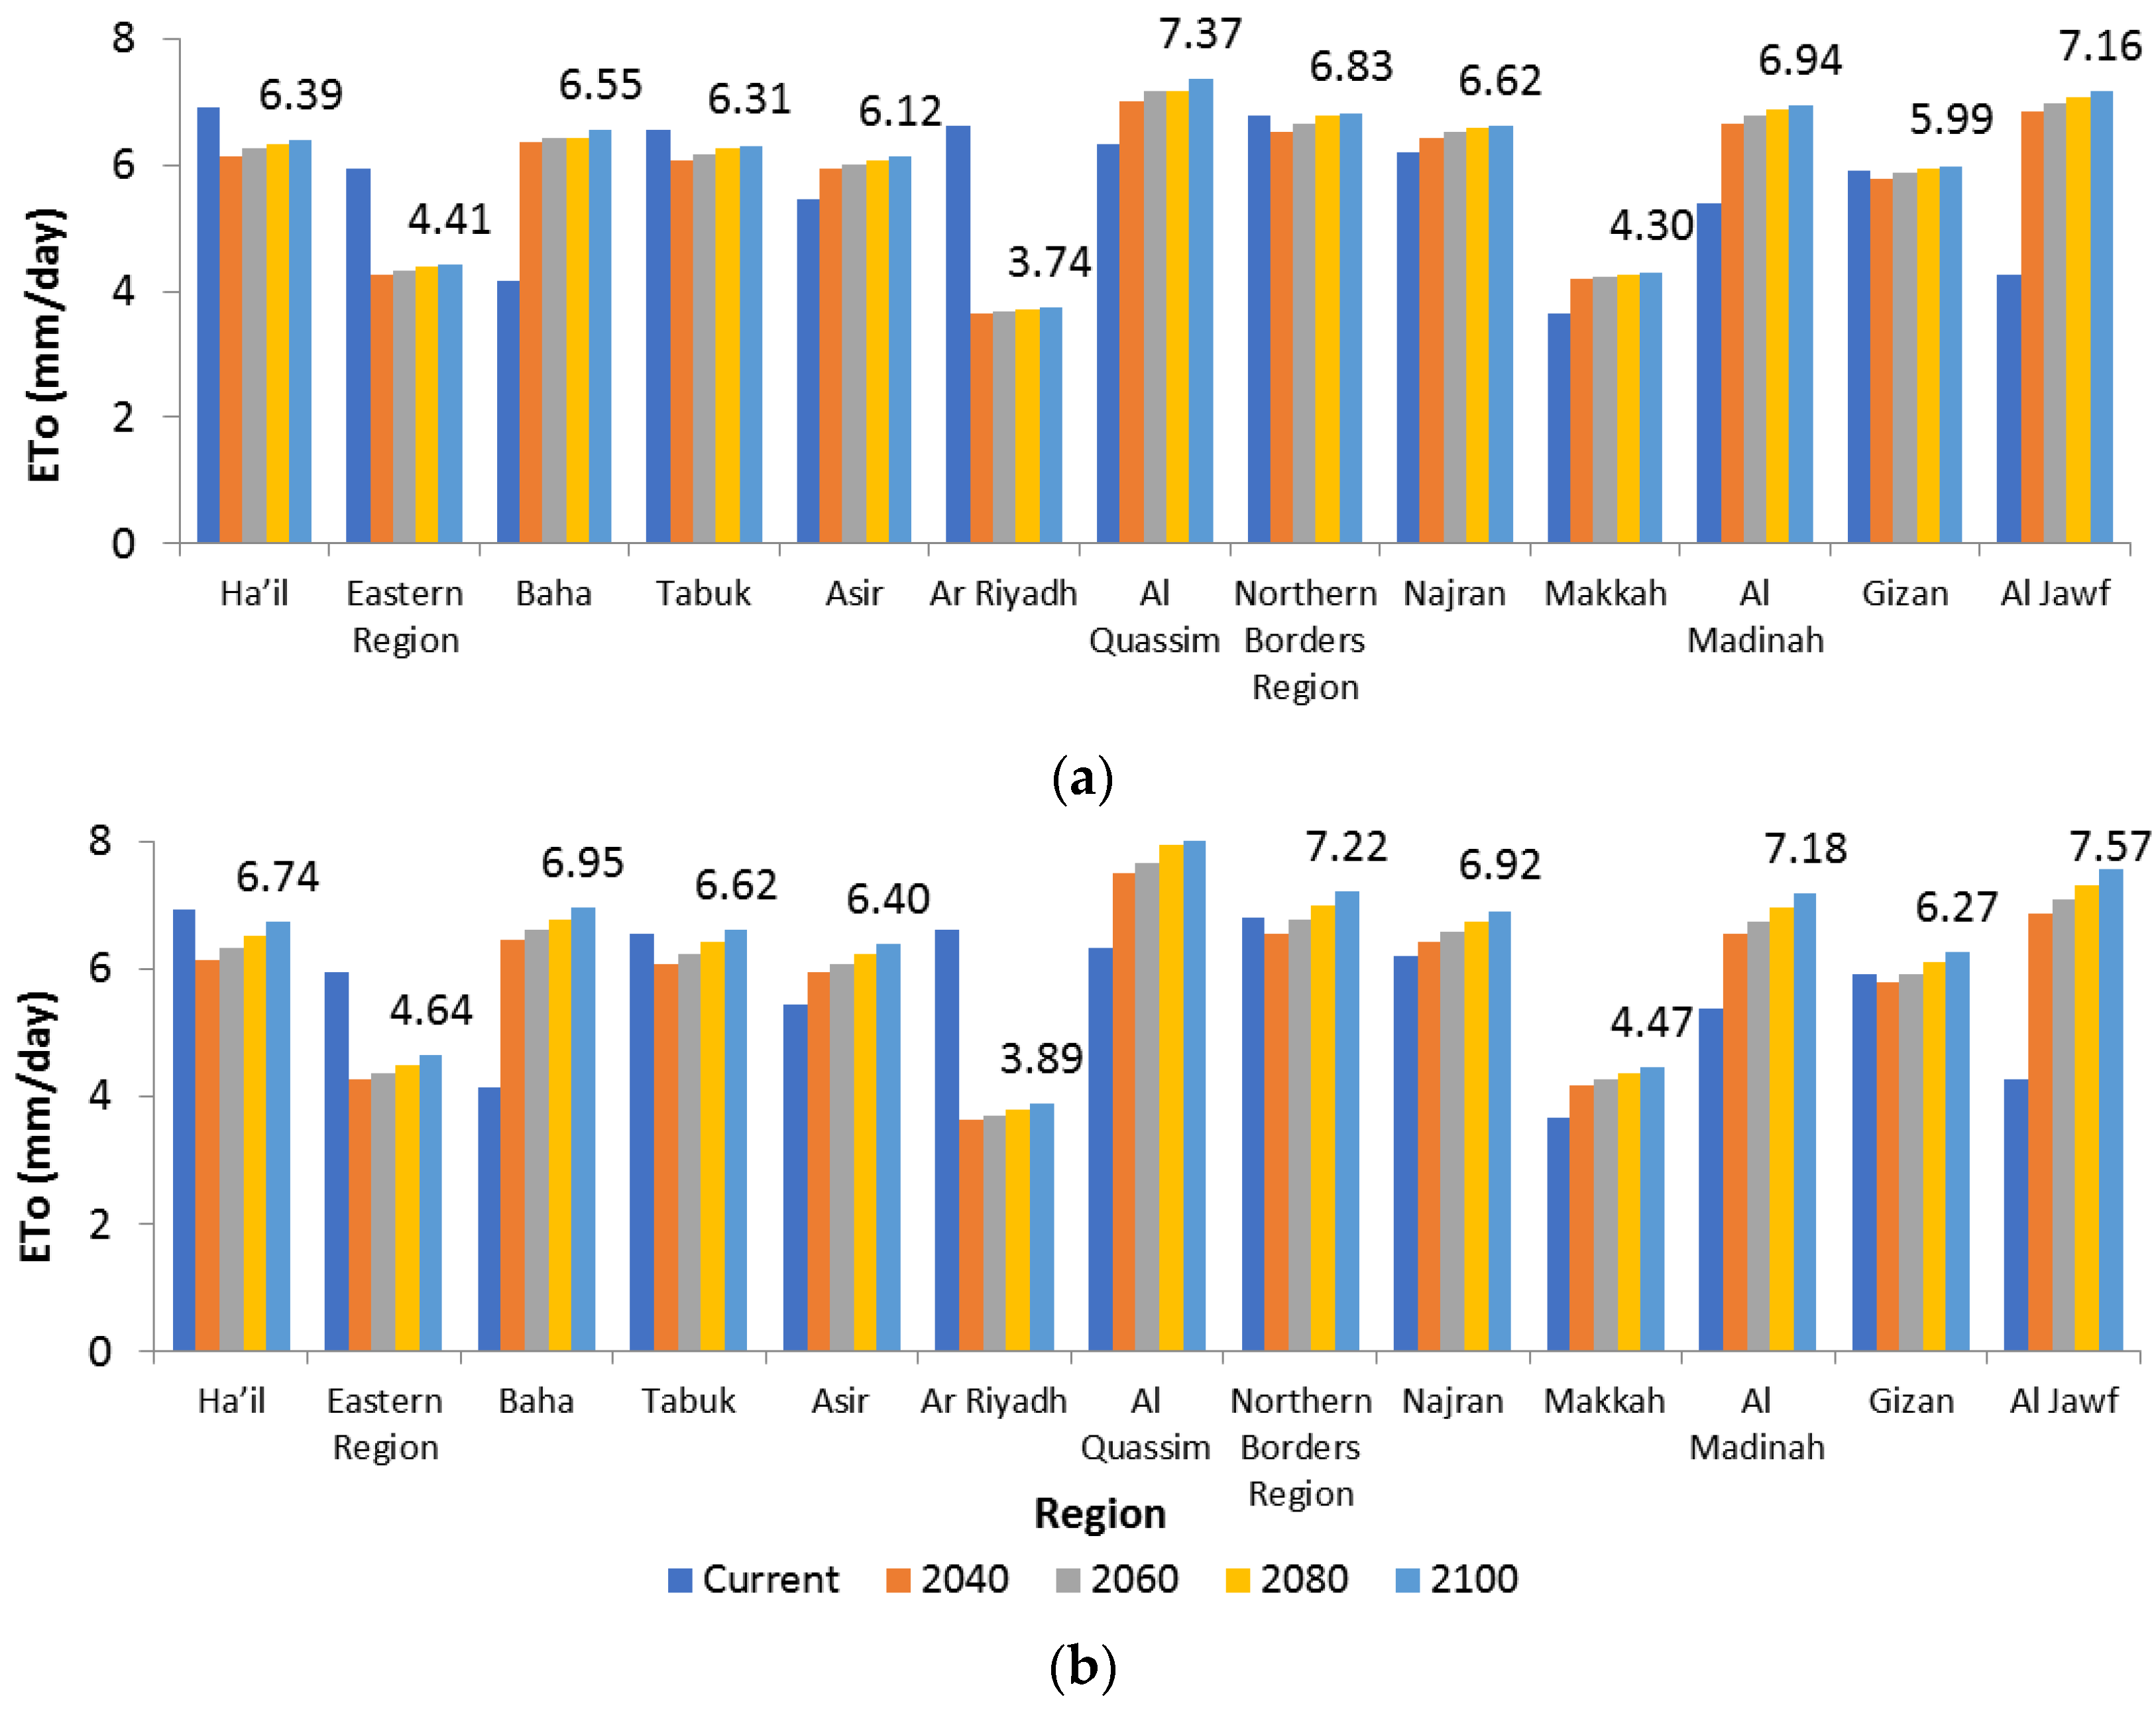
Figure 7.
Estimated annual-averaged ETo (mm) under SSP2-4.5 (a) and SSP5-8.5 (b) for 2040, 2060, 2080, and 2100, using average data from the four CMIP6 climate models and the current 2020 data.
Figure 7.
Estimated annual-averaged ETo (mm) under SSP2-4.5 (a) and SSP5-8.5 (b) for 2040, 2060, 2080, and 2100, using average data from the four CMIP6 climate models and the current 2020 data.
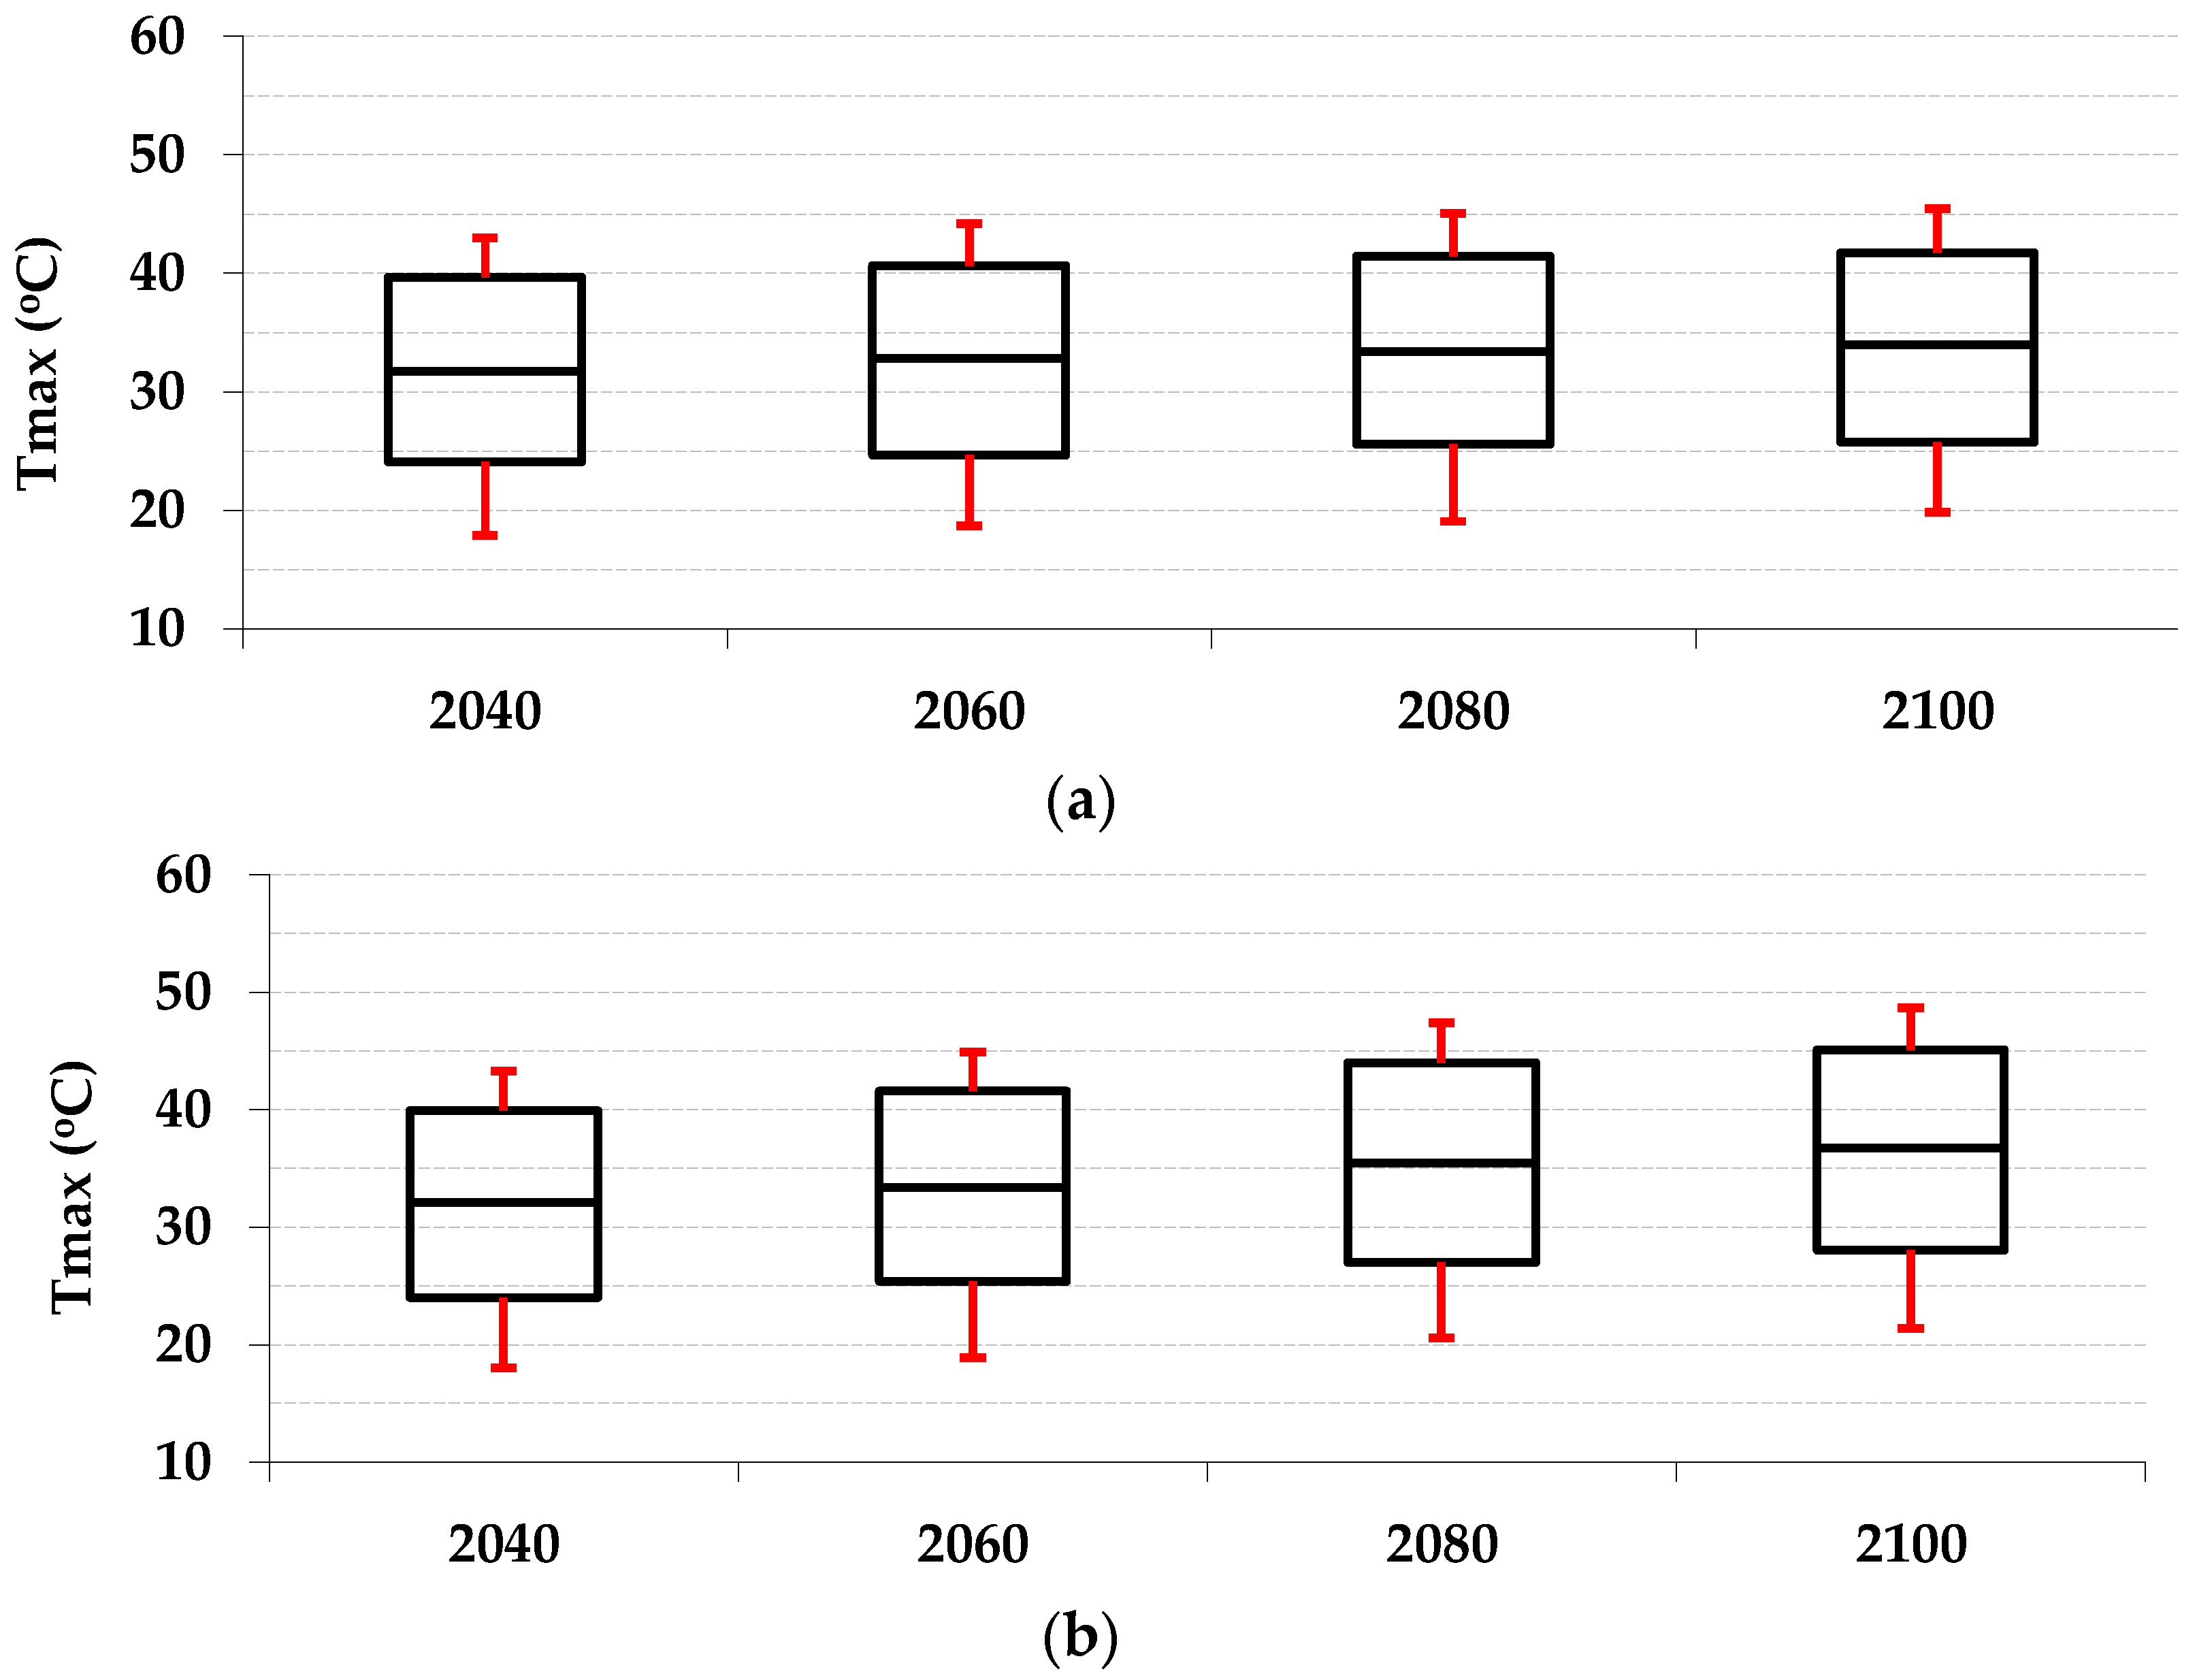
Figure 8.
Box Plot of annual Tmax for four climate models under (a) SSP2-4.5 and (b) SSP5-8.5.
Figure 8.
Box Plot of annual Tmax for four climate models under (a) SSP2-4.5 and (b) SSP5-8.5.
Figure 9.
Box Plot of annual Tmin for four climate models under (a) SSP2-4.5 and (b) SSP5-8.5.
Figure 9.
Box Plot of annual Tmin for four climate models under (a) SSP2-4.5 and (b) SSP5-8.5.
Figure 10.
ΔT values for Tmax using four climate models under (a) SSP2-4.5 and (b) SSP5-8.5.
Figure 10.
ΔT values for Tmax using four climate models under (a) SSP2-4.5 and (b) SSP5-8.5.
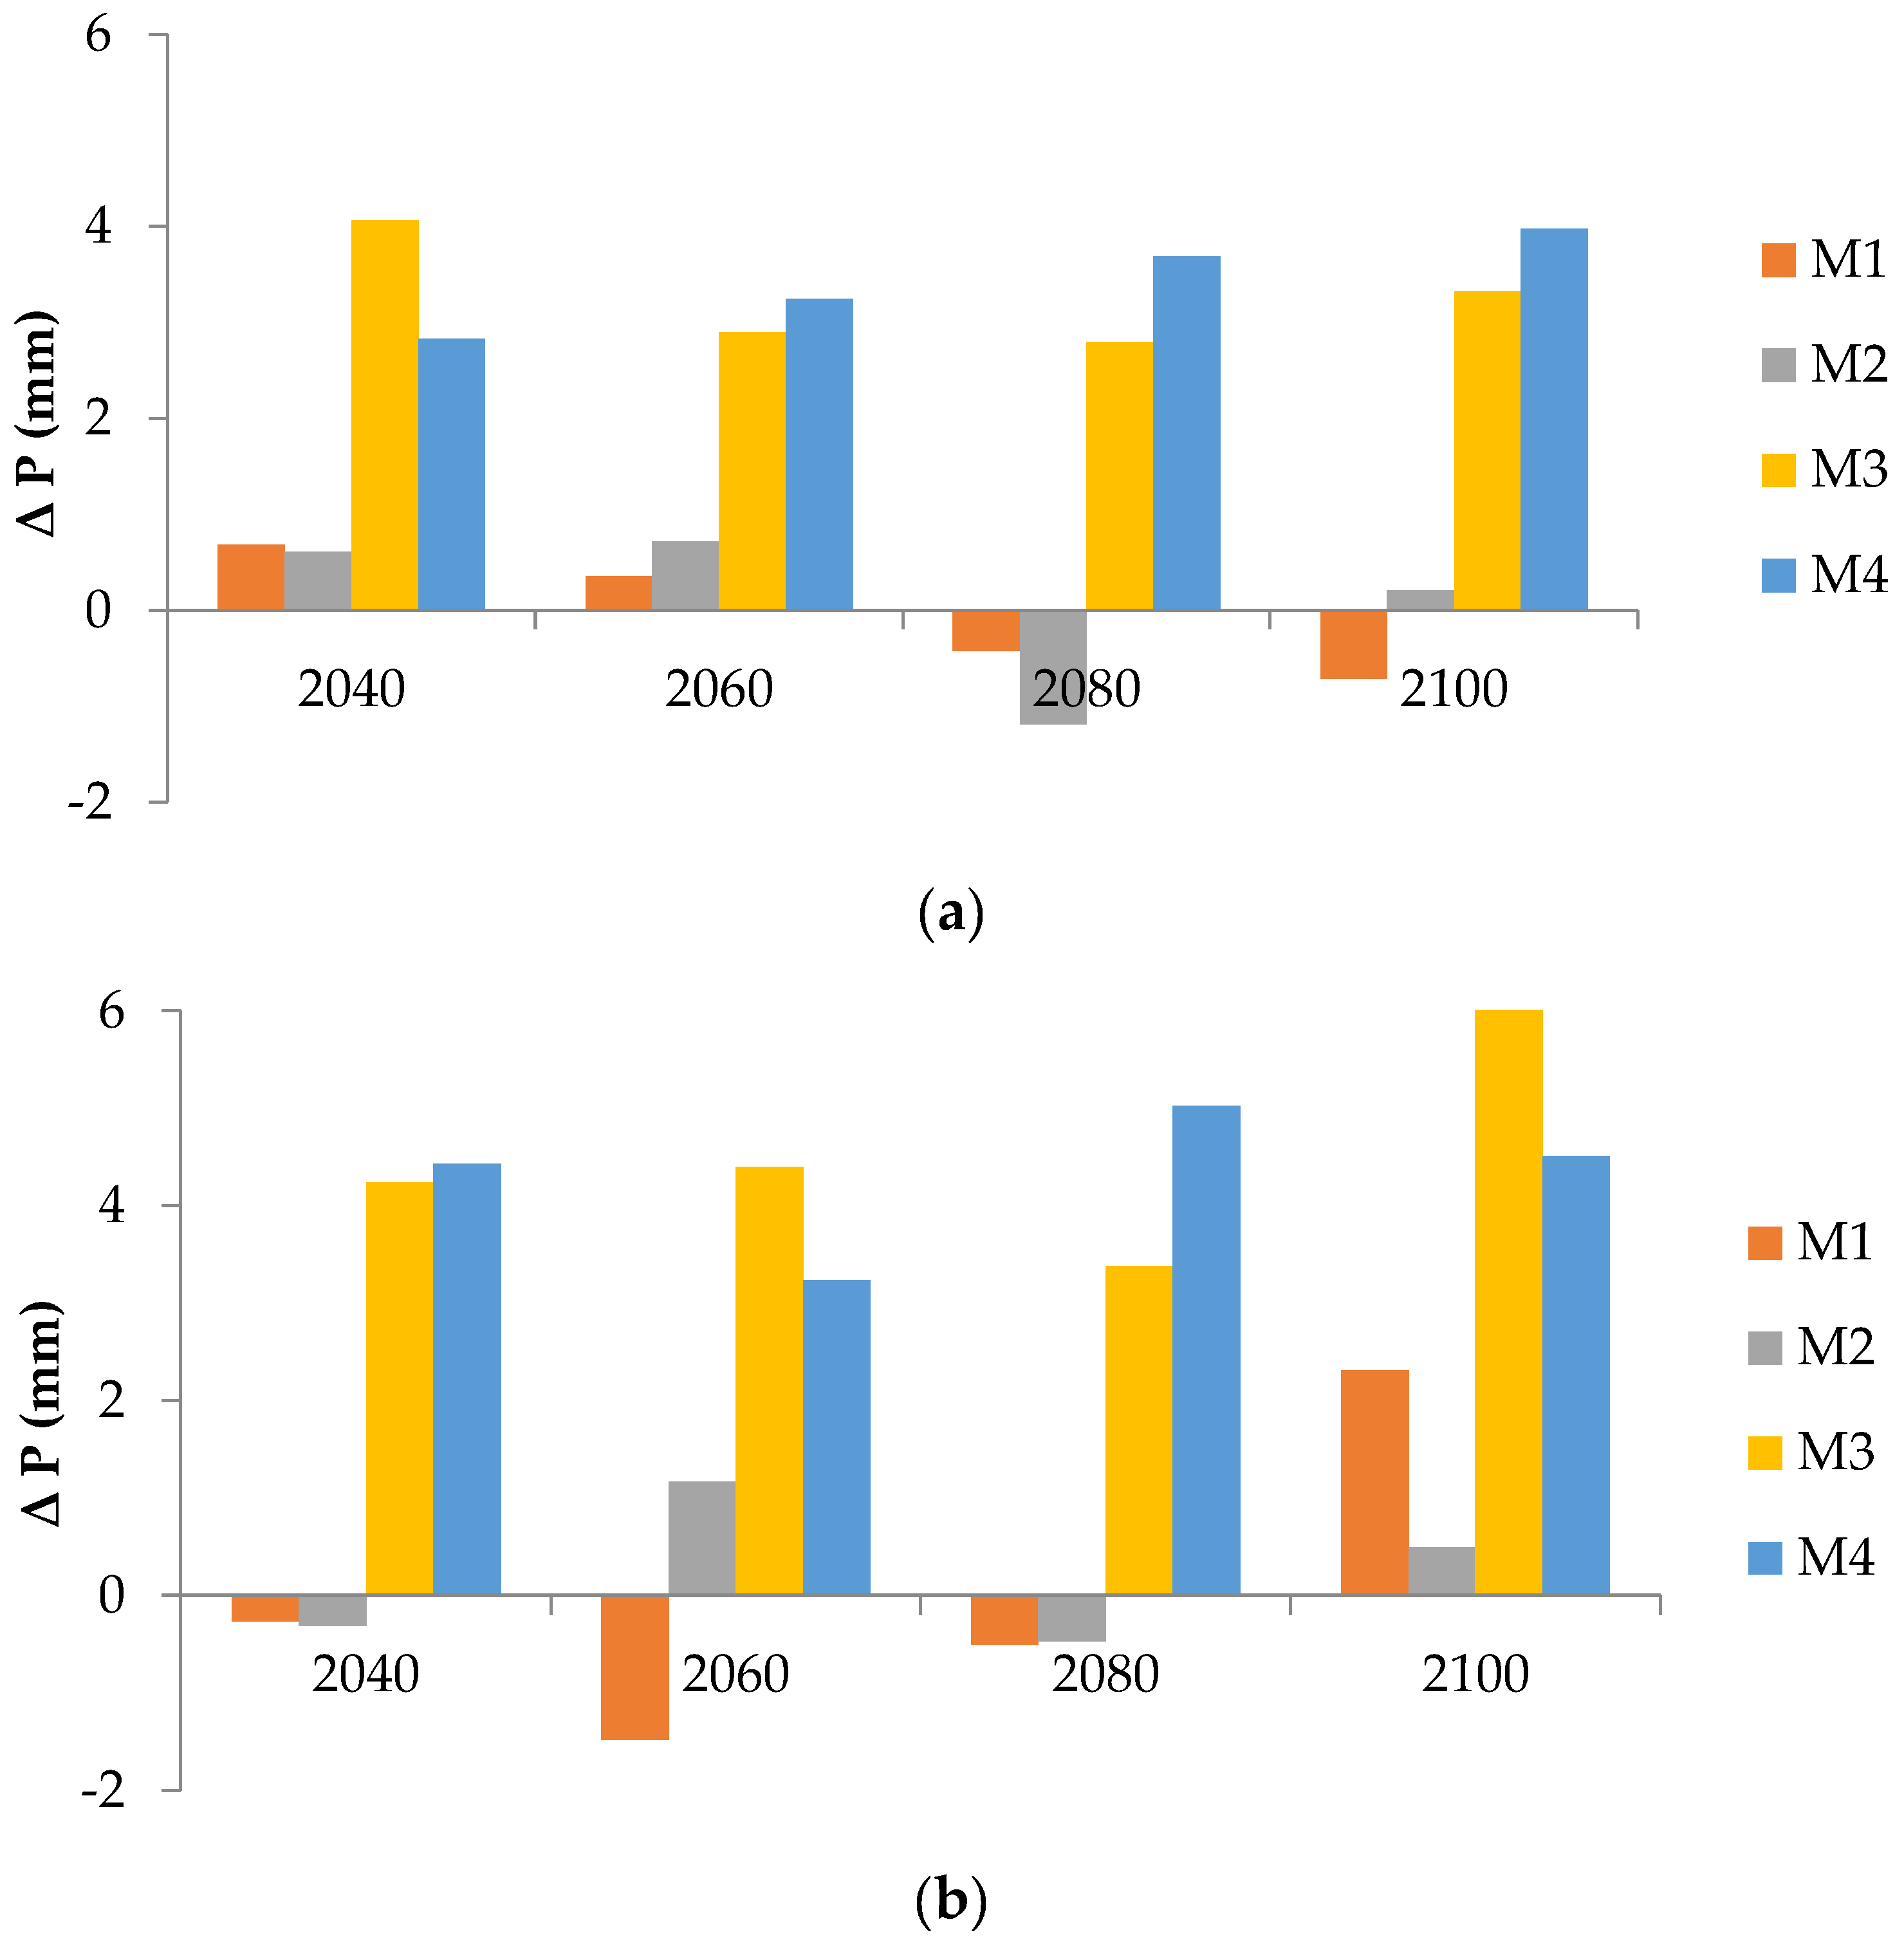
Figure 11.
Δ Rainfall values for the four climate models under (a) SSP2-4.5 and (b) SSP5-8.5.
Figure 11.
Δ Rainfall values for the four climate models under (a) SSP2-4.5 and (b) SSP5-8.5.
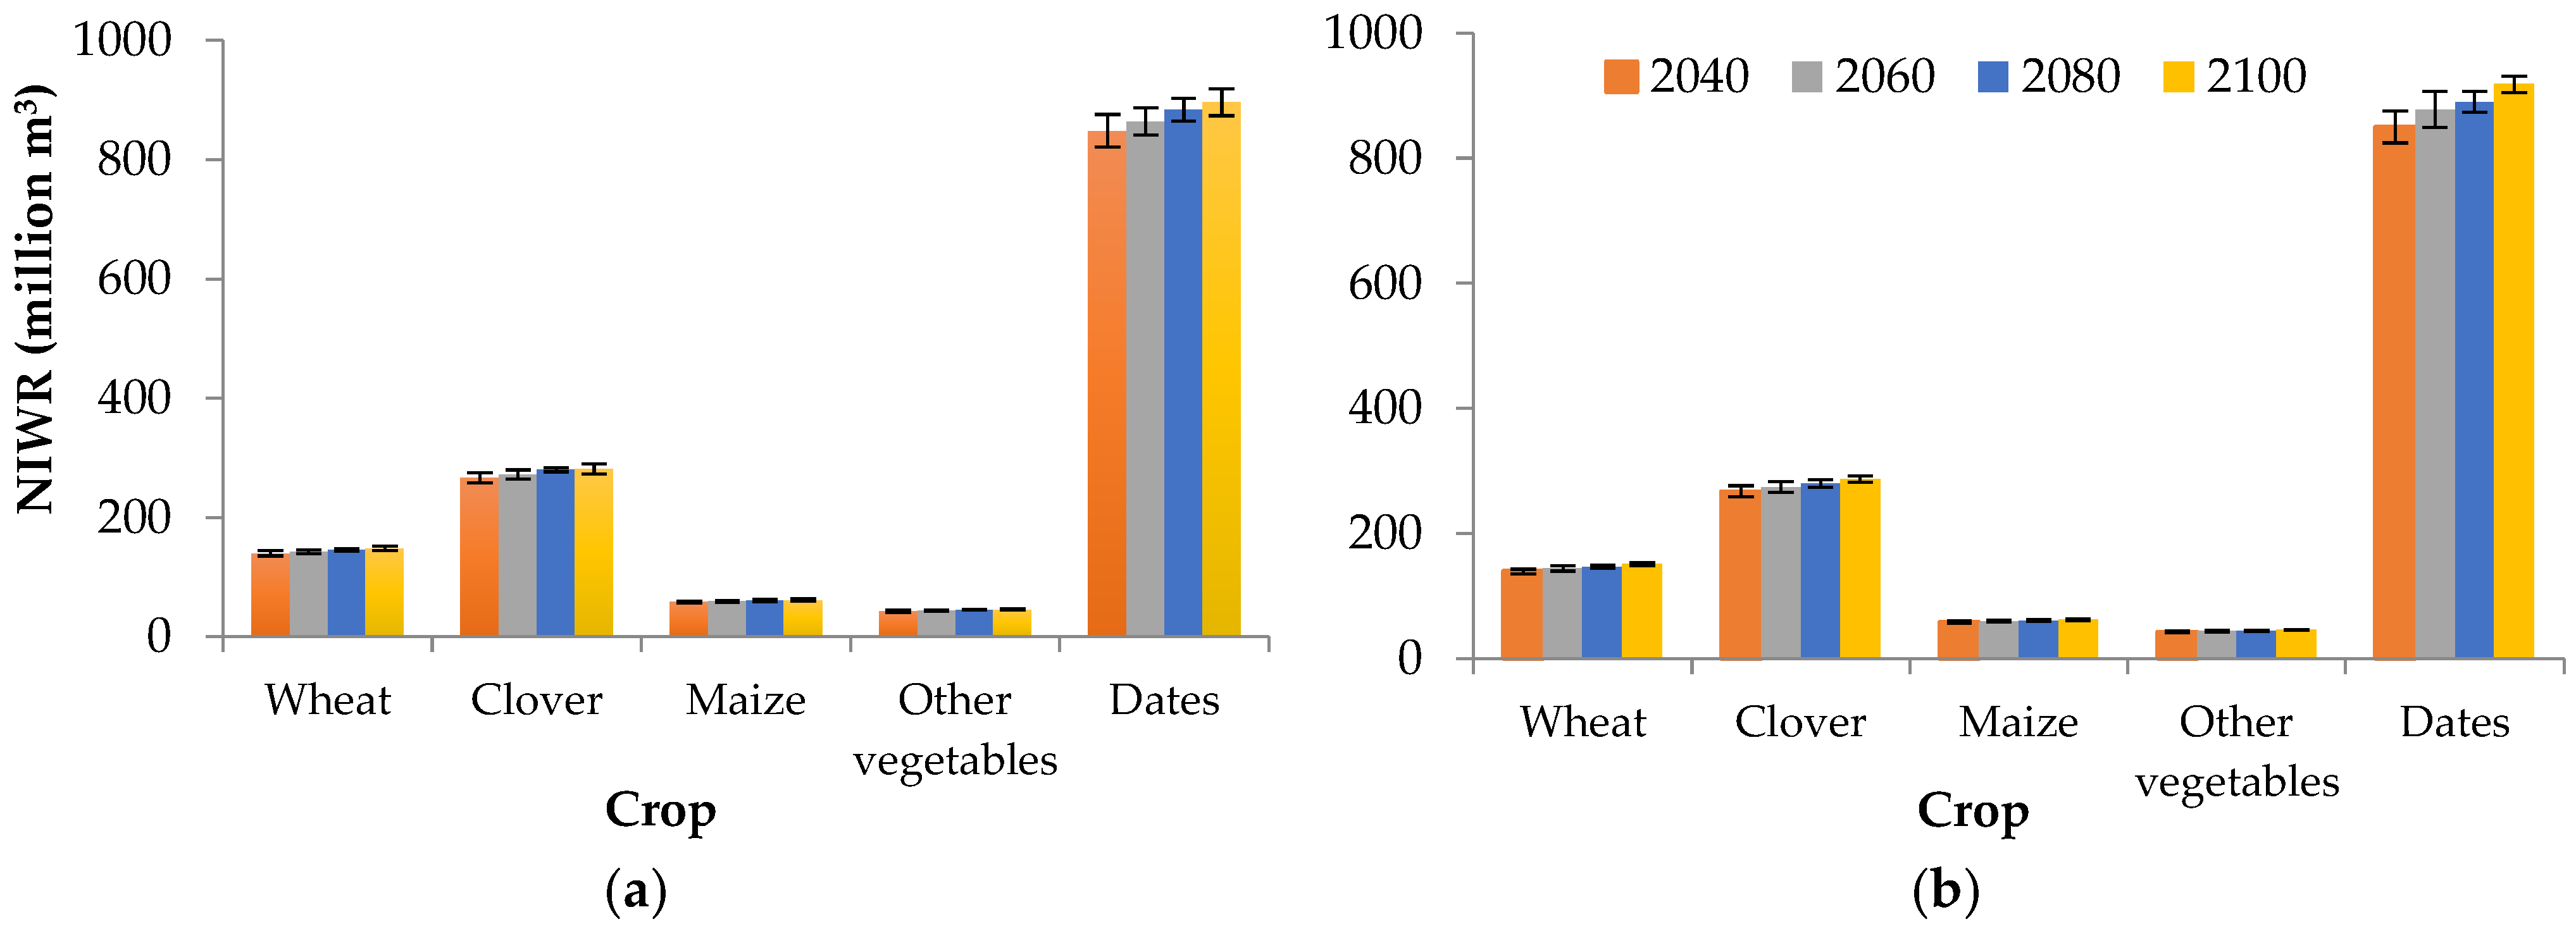
Figure 12.
NIWR (net irrigation water requirement) variability in Al Quassim region for five crops and four climate models (indicated by error bar) for 2040, 2060, 2080, and 2100 under (a) SSP2-4.5 and (b) SSP5-8.5.
Figure 12.
NIWR (net irrigation water requirement) variability in Al Quassim region for five crops and four climate models (indicated by error bar) for 2040, 2060, 2080, and 2100 under (a) SSP2-4.5 and (b) SSP5-8.5.
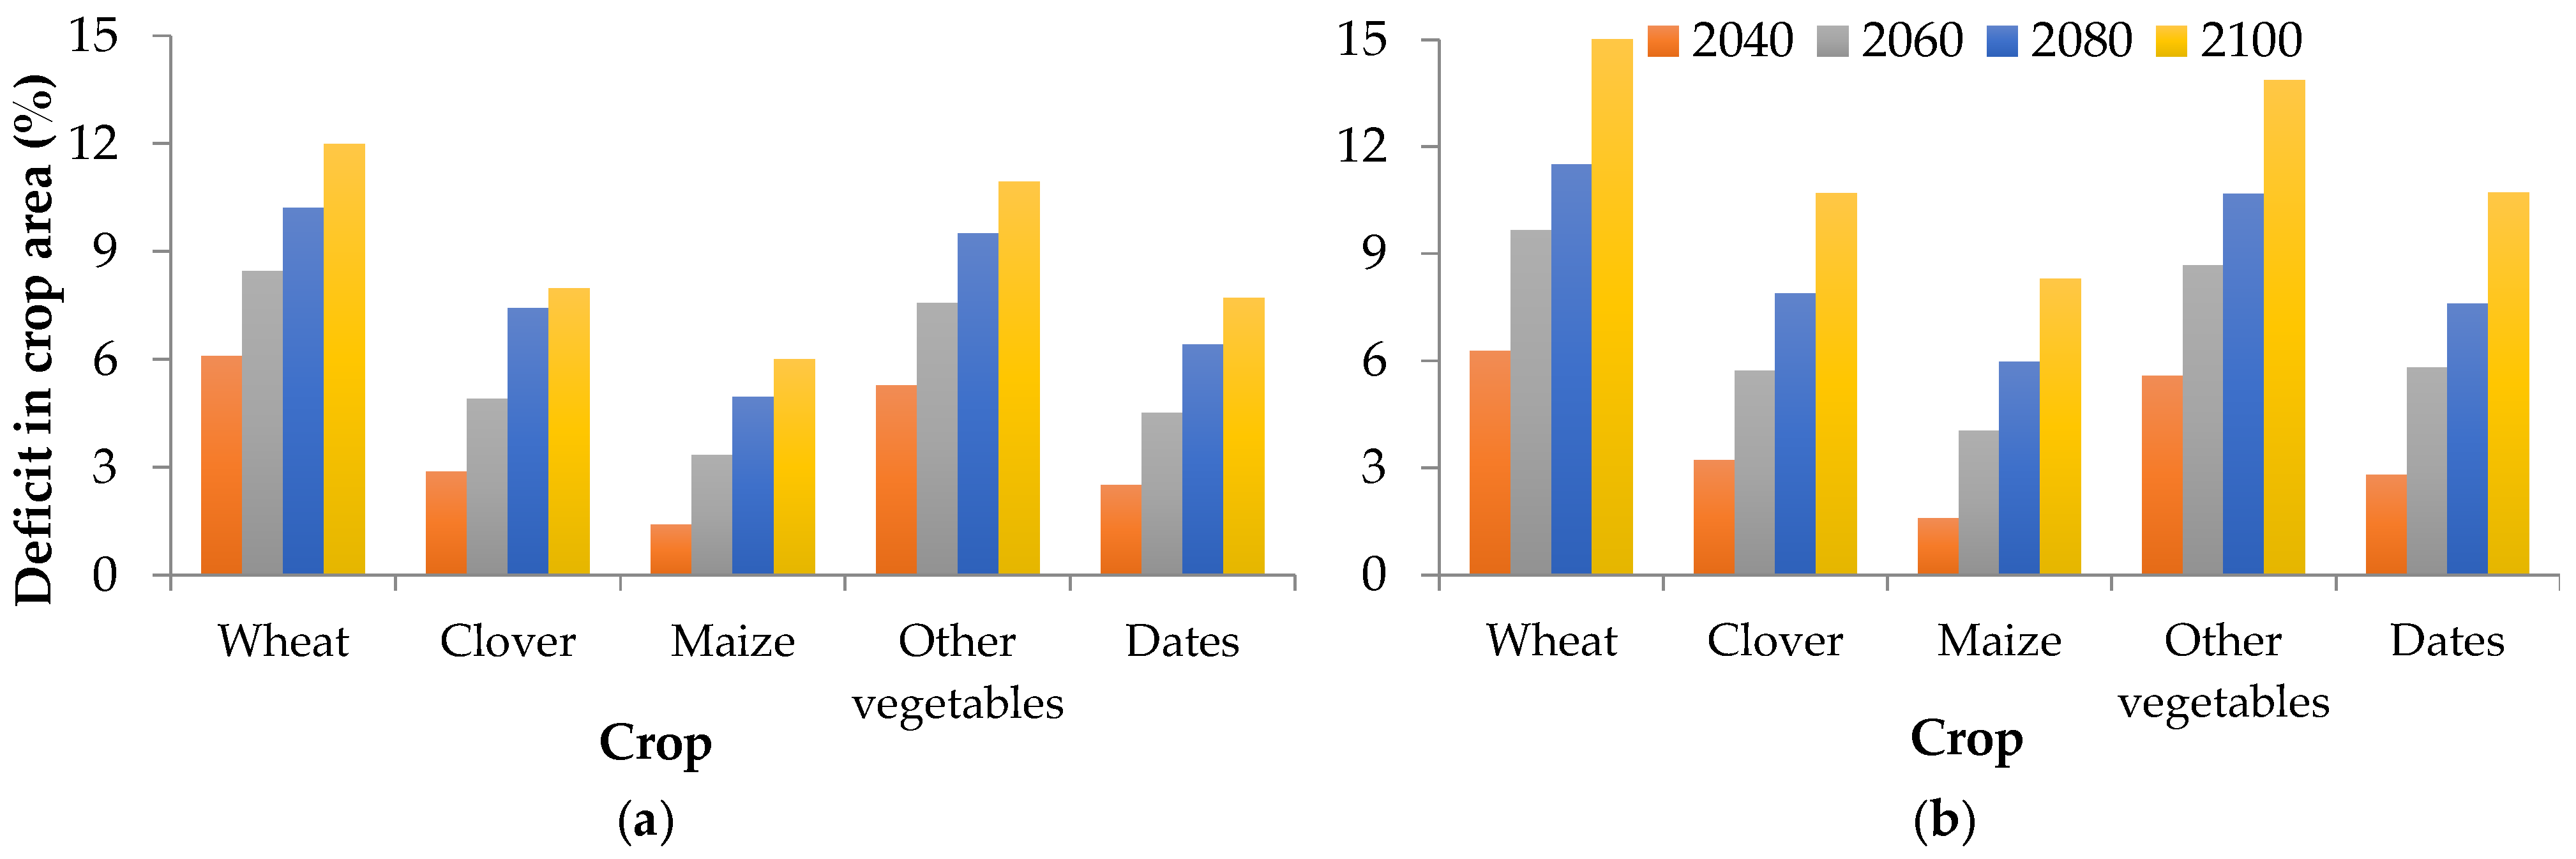
Figure 13.
Deficit in crop areas (%) in Al Quassim region for 2040, 2060, 2080, and 2100: (a) SSP2-4.5 and (b) SSP5-8.5.
Figure 13.
Deficit in crop areas (%) in Al Quassim region for 2040, 2060, 2080, and 2100: (a) SSP2-4.5 and (b) SSP5-8.5.
Table 1.
Characteristics of the four CMIP6 climate models utilized in the study.
Table 1.
Characteristics of the four CMIP6 climate models utilized in the study.
| Model No. | Multi-Model Ensemble | Country | Model Center | Responsible INSTITUTION | Resolution
(Lon × Lat) | Ensemble Member | Key Reference |
|---|
| M1 | ACCESS-CM2 | Australia | CSIRO-ARCCSS | CSIRO (Commonwealth Scientific and Industrial Research Organization, Australia), and ARCCSS (Australian Research Council Centre of Excellence for Climate System Science) | 1.9° × 1.3° | r1i1p1f1 | [40] |
| M2 | BCC–CSM2–MR | China | BCC | Beijing Climate Center | 1.1° × 1.1° | r1i1p1f1 | [41] |
| M3 | CNRM–CM6–1 | France | CNRM | Centre National de Recherches Meteorologiques | 1.4° × 1.4° | r1i1p1f2 | [42] |
| M4 | MRI-ESM2-0 | Japan | MRI | Meteorological Research Institute | 1.1° × 1.1° | r1i1p1f1 | [43] |
Table 2.
Coordinates, altitude and average climatic parameters for the 13 stations between 1991 and 2020 in Saudi Arabia.
Table 2.
Coordinates, altitude and average climatic parameters for the 13 stations between 1991 and 2020 in Saudi Arabia.
| Station Name | Altitude (m) | Latitude (No) | Longitude (Eo) | Min. Temp. (°C) | Max. Temp. (°C) | Relative Humidity (%) | Wind Speed (km/day) | Sunshine (Hours) | Solar Radiation (MJ/m2/day) | Rainfall (mm) | ETo (mm/day) |
|---|
| Al Jawf | 689 | 29.78 | 40.1 | 15.8 | 28.3 | 29 | 324 | 8.4 | 19 | 58 | 6.93 |
| Baha (Bisha) | 1163 | 19.98 | 42.61 | 16.9 | 32.1 | 29 | 209 | 7.7 | 19.3 | 124 | 5.96 |
| Eastern Region (Dhahran) | 17 | 26.26 | 50.15 | 20.3 | 32.2 | 50 | 79 | 7.3 | 18 | 79 | 4.16 |
| Al Quassim | 650 | 26.3 | 43.76 | 16.5 | 31.4 | 30 | 238 | 8.1 | 19.1 | 183 | 6.57 |
| Gizan | 3 | 16.9 | 42.58 | 26.1 | 34.5 | 65 | 317 | 7.7 | 19.6 | 104 | 5.45 |
| Northern Borders Region (Rafha) | 447 | 29.63 | 43.48 | 15.8 | 30.7 | 33 | 284 | 8.4 | 19 | 69 | 6.62 |
| Ha’il | 1013 | 27.43 | 41.68 | 13.7 | 28.3 | 33 | 248 | 8.4 | 19.4 | 171 | 6.32 |
| Al Madinah (Yenbo) | 6 | 24.15 | 38.06 | 20.1 | 32.4 | 59 | 432 | 8.4 | 19.8 | 97 | 6.8 |
| Najran | 1210 | 17.61 | 44.43 | 16.2 | 32.1 | 25 | 220 | 7.7 | 19.6 | 136 | 6.2 |
| Ar Riyadh | 612 | 24.71 | 46.71 | 18.6 | 32.7 | 30 | 42 | 7.9 | 19.1 | 101.3 | 3.66 |
| Asir (Abha) | 2093 | 18.23 | 42.65 | 11.9 | 24.7 | 56 | 320 | 7.3 | 18.9 | 272 | 5.38 |
| Tabuk | 776 | 28.36 | 36.63 | 13.6 | 28.9 | 32 | 230 | 7.8 | 18.4 | 58 | 5.92 |
| Makkah (Taif) | 1454 | 21.48 | 40.55 | 15.7 | 29.1 | 31 | 61 | 8.6 | 20.4 | 119 | 4.26 |
Table 3.
Soil parameters and crop planting and harvesting dates for the Al Quassim region.
Table 3.
Soil parameters and crop planting and harvesting dates for the Al Quassim region.
| | Al Quassim Region |
|---|
| No. | Soil Parameter | Value |
|---|
| Medium soil (sandy loam) | 1 | Total available soil moisture (Field capacity-Wilting point) | 200 mm m−1 |
| 2 | Maximum infiltration rate | 40 mm day−1 |
| 3 | Maximum rooting depth | 250 cm |
| 4 | Initial soil moisture depletion | 0% |
| 5 | Initial available soil moisture | 190 mm m−1 |
| Crop data (planting, harvest dates, and cultivated area) |
| Crop | Planting date | Harvest date | Cultivated area (ha) |
| |
| Wheat | 15-Jan. | 24-May | 22,792 |
| Maize | 1-Apr. | 3-Aug. | 5983 |
| Barley | 1-Nov. | 28-Feb. | 55 |
| Tomato | 1-Apr. | 23-Aug. | 920 |
| Potato | 15-Jan. | 24-May | 3826 |
| Other | 1-Mar. | 3-Jun. | 6671 |
| vegetables |
| Clover | 1-Dec. | 30-Nov. | 14,786 |
| Dates | 1-Apr. | 3-Aug. | 39,303 |
| Citrus | 1-Mar. | 28-Feb. | 2014 |
| Grapes | 1-Apr. | 31-Mar. | 1058 |
| Total | | | 97,408 |
Table 4.
Minimum and maximum temperatures (°C) and rainfall (mm) (average, range, difference, and change) using the four CMIP6 climate models for the four periods (2040, 2060, 2080, and 2100) under SSP2-4.5 and SSP5-8.5 and current conditions (2020).
Table 4.
Minimum and maximum temperatures (°C) and rainfall (mm) (average, range, difference, and change) using the four CMIP6 climate models for the four periods (2040, 2060, 2080, and 2100) under SSP2-4.5 and SSP5-8.5 and current conditions (2020).
| Tmin (°C) |
|---|
| | Current (2020) | 2040 | 2060 | 2080 | 2100 |
|---|
| SSP2-4.5 | Average | 18.3 | 20.0 | 20.7 | 21.3 | 21.8 |
| Range | 14.8–21.6 | 14.7- 27.7 | 15.2–28.3 | 16.0 -28.7 | 16.3–29.0 |
| Δ T | - | 1.8 | 2.4 | 3.0 | 3.5 |
| Change (%) | - | 10 | 13 | 17 | 19 |
| SSP5-8.5 | Average | 18.3 | 20.3 | 21.5 | 22.9 | 24.4 |
| Range | 14.8–21.6 | 14.8–27.8 | 15.9–28.6 | 17.3–29.7 | 19.0–30.8 |
| Δ T | - | 2.1 | 3.3 | 4.6 | 6.2 |
| Change (%) | - | 11 | 18 | 25 | 34 |
| Tmax (°C) |
| SSP2-4.5 | Average | 31.2 | 31.4 | 31.8 | 32.3 | 32.8 |
| Range | 28.7–33.0 | 28.3–33.7 | 29.1–34.5 | 29.5–35.1 | 30.3–35.4 |
| Δ T | - | 0.2 | 0.7 | 1.2 | 1.6 |
| Change (%) | - | 1 | 2 | 4 | 5 |
| SSP5-8.5 | Average | 31.2 | 31.4 | 32.6 | 33.9 | 35.2 |
| Range | 28.7–33.0 | 28.4–34.6 | 29.7–35.7 | 31.2–37.0 | 32.6–38.4 |
| Δ T | - | 0.3 | 1.4 | 2.7 | 4.1 |
| Change (%) | - | 1 | 5 | 9 | 13 |
| Rainfall (mm) |
| SSP2-4.5 | Average | 93.2 | 108.1 | 102.6 | 104.1 | 118.7 |
| Range | 29.2–205.3 | 47.8–176.5 | 40.8–168.7 | 43.0 -172.3 | 48.6–200.8 |
| Δ Rainfall | - | 14.9 | 9.4 | 10.9 | 25.5 |
| Change (%) | - | 16 | 10 | 12 | 27 |
| SSP5-8.5 | Average | 93.2 | 108.7 | 106.9 | 106.7 | 122.8 |
| Range | 29.2–205.3 | 51.0–167.2 | 51.1–177.4 | 43.4–181.6 | 51.7–205.1 |
| Δ Rainfall | - | 15.5 | 13.7 | 13.5 | 29.6 |
| Change (%) | - | 17 | 15 | 15 | 32 |
Table 5.
Daily ETo (average, range, difference, and change) for 2040, 2060, 2080, and 2100 under SSP2-4.5 and SSP5-8.5 using data from the four CMIP6 climate models, with current condition (2020) for the 13 stations.
Table 5.
Daily ETo (average, range, difference, and change) for 2040, 2060, 2080, and 2100 under SSP2-4.5 and SSP5-8.5 using data from the four CMIP6 climate models, with current condition (2020) for the 13 stations.
| ETo (mm/day) |
|---|
| | Current (2020) | 2040 | 2060 | 2080 | 2100 |
|---|
| SSP2-4.5 | Average | 5.71 | 5.8 | 5.9 | 6.0 | 6.1 |
| Range | 3.7–6.9 | 3.6–7.0 | 3.7–7.2 | 3.7–7.2 | 3.7–7.4 |
| Δ T | - | 0.1 | 0.2 | 0.28 | 0.35 |
| Change (%) | - | 2 | 4 | 5 | 6 |
| SSP5-8.5 | Average | 5.71 | 5.9 | 6.0 | 6.2 | 6.4 |
| Range | 3.7–6.9 | 3.6–7.5 | 3.7–7.7 | 3.8–8.0 | 3.9–8.2 |
| Δ T | - | 0.2 | 0.3 | 0.5 | 0.7 |
| Change (%) | - | 3 | 6 | 9 | 12 |
Table 6.
Minimum and maximum temperatures (°C) and rainfall (mm) (average, range, difference, and change) for the 2040s, 2060s, 2080s, and 2100s under SSP2-4.5 and SSP5-8.5 using data from the four CMIP6 climate models and current conditions (2020) for the Al Quassim region.
Table 6.
Minimum and maximum temperatures (°C) and rainfall (mm) (average, range, difference, and change) for the 2040s, 2060s, 2080s, and 2100s under SSP2-4.5 and SSP5-8.5 using data from the four CMIP6 climate models and current conditions (2020) for the Al Quassim region.
| Min. Temp. (°C) |
|---|
| | Current (2020) | 2040 | 2060 | 2080 | 2100 |
|---|
| SSP2-4.5 | Average | 16. 5 | 17.5 | 18.2 | 18.9 | 19.3 |
| Range | 6.5 (Jan.)–24.5 (Jul.) | 5.9 (Jan.)–27.8 (Jul.) | 6.5 (Jan.)–28.6 (Jul.) | 6.8 (Jan.)–29.3 (Jul.) | 7.6 (Jan.)–29.7 (Jun.) |
| Δ T | - | 1.0 | 1.7 | 2.3 | 2.8 |
| Change (%) | - | 6.0 | 10.3 | 14.2 | 17.1 |
| SSP5-8.5 | Average | 16.5 | 17.5 | 18.9 | 20.5 | 22.2 |
| Range | 6.5 (Jan.)–24.5 (Jul.) | 5.8 (Jan.)–27.8 (Jul.) | 6.7 (Jan.)–29.3 (Jul.) | 8.3 (Jan.)–31.2 (Jul.) | 9.5 (Jan.)–33.1 (Jul.) |
| Δ T | - | 1.0 | 2.4 | 3.9 | 5.7 |
| Change (%) | - | 5.9 | 14.4 | 23.9 | 34.3 |
| Max. Temp. (°C) |
| SSP2-4.5 | Average | 31.4 | 31.6 | 32.0 | 32.7 | 33.2 |
| Range | 18.4 (Jan.)–41.4 (Jul.) | 17.9 (Jan.)–43.0 (Jun.) | 18.7 (Jan.)–44.2(Jul.) | 19.0 (Jan.)–45.1 (Jul.) | 22.1 (Jan.)–45.8 (Jul.) |
| Δ T | - | 0.2 | 0.6 | 1.4 | 1.8 |
| Change (%) | - | 1 | 2.0 | 4.4 | 5.8 |
| SSP5-8.5 | Average | 31.4 | 31.7 | 32.7 | 34.7 | 35.8 |
| Range | 18.4 (Jan.)–41.4 (Jul.) | 18.0 (Jan.)–43.3 (Jul.) | 18.9 (Jan.)–44.9 (Jul.) | 20.6 (Jan.)–47.4 (Jul.) | 21.4 (Jan.)–48.7 (Jul.) |
| Δ T | - | 0.3 | 1.3 | 3.3 | 4.4 |
| Change (%) | - | 1 | 4.1 | 10.5 | 14.1 |
| Rainfall (mm/day) |
| SSP2-4.5 | Average | 5.8 | 7.8 | 7.6 | 7.0 | 7.5 |
| Range | 0.44 (Jul.)–19.5 (Apr.) | 0.3 (Jul.)–18.9 (Oct.) | 0.3 (Jul.)–18.6 (Nov.) | 0.2 (Jul.)–15.4 (Oct.) | 0.5 (Aug.)–15.6 (Nov.) |
| Δ Rainfall | - | 2.0 | 1.8 | 1.2 | 1.7 |
| Change (%) | - | 35.4 | 31.2 | 21.1 | 29.5 |
| SSP5-8.5 | Average | 5.8 | 7.7 | 7.6 | 7.6 | 9.1 |
| Range | 0.44 (Jul.)–19.5 (Apr.) | 0.4 (Jul.)–20.4 (Nov.) | 0.4 (Jul.)–21.6 (Nov.) | 0.3 (Jul.)–18.6 (Nov.) | 0.4 (Jul.)–22.9 (Sep.) |
| Δ Rainfall | - | 1.93 | 1.83 | 1.9 | 3.3 |
| Change (%) | - | 33.1 | 31.7 | 32.2 | 58.0 |
| | | | ETo (mm/day) | | | |
| SSP2-4.5 | Average | 6.3 | 6.3 | 6.5 | 6.5 | 6.6 |
| Range | 2.8 (Jan.)–9.6 (Jul.) | 2.8 (Jan.)–9.9 (Jul.) | 2.9 (Jan.)–10.1 (Jul.) | 2.9 (Jan.)–10.2 (Jul.) | 3.0 (Jan.)–10.3 (Jul.) |
| Δ Rainfall | - | 0.02 | 0.12 | 0.22 | 0.28 |
| Change (%) | - | 0.2 | 1.9 | 3.5 | 4.5 |
| SSP5-8.5 | Average | 6.3 | 6.4 | 6.5 | 6.8 | 7.0 |
| Range | 2.8 (Jan.)–9.6 (Jul.) | 2.8 (Jan.)–9.9 (Jul.) | 2.9 (Jan.)–10.2 (Jul.) | 3.1 (Jan.)–10.5 (Jul.) | 3.2 (Jan.)–10.8 (Jul.) |
| Δ Rainfall | - | 0.03 | 0.21 | 0.43 | 0.64 |
| Change (%) | - | 0.4 | 3.3 | 6.7 | 10.2 |
Table 7.
Predicted net irrigation water requirements (NIWR) values in million m3 (MCM) and changes (%) compared to current obtained from four climate models for 2040, 2060, 2080, and 2100 under SSP2-4.5 and SSP5-8.5 emission scenarios and current condition (2020) for Al Quassim region.
Table 7.
Predicted net irrigation water requirements (NIWR) values in million m3 (MCM) and changes (%) compared to current obtained from four climate models for 2040, 2060, 2080, and 2100 under SSP2-4.5 and SSP5-8.5 emission scenarios and current condition (2020) for Al Quassim region.
| | | | SSP2-4.5 |
| Year | | Current | M1 | M2 | M3 | M4 | Average | Standard Deviation | Maximum | Minimum |
| 2040 | NIWR (MCM) | 1327.7 | 1294.7 | 1384.5 | 1332.7 | 1406.8 | 1354.7 | 43.8 | 1425.9 | 1294.7 |
| NIWR % | | −2.5 | 4.3 | 0.4 | 6.0 | 2.0 | 3.3 | 6.0 | −2.5 |
| 2060 | NIWR (MCM) | 1327.7 | 1327.6 | 1402.5 | 1366.0 | 1425.9 | 1380.5 | 37.3 | 1425.9 | 1327.6 |
| NIWR % | | −0.01 | 5.6 | 2.9 | 7.4 | 4.0 | 2.8 | 7.4 | −0.01 |
| 2080 | NIWR (MCM) | 1327.7 | 1368.5 | 1421.8 | 1427.1 | 1434.5 | 1431.1 | 37.3 | 1473.5 | 1371.2 |
| NIWR % | | 3.1 | 7.1 | 7.5 | 8.0 | 6.4 | 2.0 | 8.0 | 3.1 |
| 2100 | NIWR (MCM) | 1327.7 | 1371.2 | 1436.0 | 1473.5 | 1443.6 | 1431.1 | 37.3 | 1473.5 | 1371.2 |
| NIWR % | | 3.3 | 8.2 | 11.0 | 8.7 | 7.8 | 2.8 | 11.0 | 3.3 |
| | | | SSP5-8.5 |
| Year | | Current | M1 | M2 | M3 | M4 | Average | Standard Deviation | Maximum | Minimum |
| 2040 | NIWR (MCM) | 1327.7 | 1302.7 | 1387.4 | 1332.7 | 1405.8 | 1357.2 | 41.4 | 1405.8 | 1302.7 |
| NIWR % | | −1.9 | 4.5 | 0.4 | 5.9 | 2.2 | 3.1 | 5.9 | −1.9 |
| 2060 | NIWR (MCM) | 1327.7 | 1346.1 | 1436.4 | 1366.0 | 1448.7 | 1399.3 | 44.1 | 1448.7 | 1346.1 |
| NIWR % | | 1.4 | 8.2 | 2.9 | 9.1 | 5.4 | 3.3 | 9.1 | 1.4 |
| 2080 | NIWR (MCM) | 1327.7 | 1390.6 | 1462.5 | 1427.1 | 1405.8 | 1421.5 | 27.0 | 1462.5 | 1390.6 |
| NIWR % | | 4.7 | 10.1 | 7.5 | 5.9 | 7.1 | 2.0 | 10.1 | 4.7 |
| 2100 | NIWR (MCM) | 1327.7 | 1439.0 | 1499.4 | 1473.5 | 1447.9 | 1465.0 | 23.6 | 1499.4 | 1439.0 |
| NIWR % | | 8.4 | 12.9 | 11.0 | 9.1 | 10.3 | 1.8 | 12.9 | 8.4 |
Table 8.
Averaged net irrigation water requirements (NIWR) and growth irrigation water requirements (GIWR) in million m3 (MCM) for four climate models under SSP2-4.5 and SSP5-8.5 for 2040, 2060, 2080, and 2100, with current condition (2020) for Al Quassim region.
Table 8.
Averaged net irrigation water requirements (NIWR) and growth irrigation water requirements (GIWR) in million m3 (MCM) for four climate models under SSP2-4.5 and SSP5-8.5 for 2040, 2060, 2080, and 2100, with current condition (2020) for Al Quassim region.
| Year |
|---|
| | Current (2020) | 2040 | 2060 | 2080 | 2100 |
|---|
| SSP2-4.5 | NIWR (MCM) | 1327.7 | 1354.7 | 1380.5 | 1413.0 | 1431.1 |
| GIWR (MCM) * | 1584.7 | 1617.7 | 1648.6 | 1687.6 | 1708.9 |
| GIWR Change (%) | - | 2.5 | 4.8 | 7.8 | 9.4 |
| SSP5-8.5 | NIWR (MCM) | 1327.7 | 1357.2 | 1399.3 | 1421.5 | 1465.0 |
| GIWR (MCM) * | 1584.7 | 1620.6 | 1670.6 | 1697.5 | 1749.2 |
| GIWR Change (%) | - | 2.7 | 6.5 | 8.5 | 12.4 |


 ,
, 


