Article

Evaluation of Pressure Types Impacted on Sediment Supply to Dam Reservoirs: Selected Examples of the Outer Western Carpathians Catchments Area

1
Faculty of Natural Sciences, University of Silesia in Katowice, Będzińska 60, 41-200 Sosnowiec, Poland
2
Doctoral School, University of Silesia in Katowice, Bankowa 14, 40-007 Katowice, Poland
3
National Water Management Authority, State Water Holding Polish Waters, Żelazna 59A, 00-848 Warsaw, Poland
*
Author to whom correspondence should be addressed.
Water 2023, 15(3), 597; https://doi.org/10.3390/w15030597
Submission received: 28 December 2022 / Revised: 22 January 2023 / Accepted: 29 January 2023 / Published: 2 February 2023
(This article belongs to the Special Issue Sediment Transport, Budgets and Quality in Riverine Environments)

Abstract

:
The proper characteristics of the catchment area of dammed reservoirs is of great importance when managing their capacity in the context of enabling proper functioning, including retention of the planned amount of water and counteracting the effects of drought. Therefore, detailed analyses covered mountain reservoirs with varying degrees of capacity changes: Goczałkowice on the Vistula, Rożnów on the Dunajec and Tresna on the Soła, thanks to which reasons for the differences in these changes were determined. For this purpose, data on the volume of the suspended load was used. Diversity in its transport is mainly caused by the presence of damming structures. Correlation of morphological and hydraulic indicators was carried out, preceded by the identification and characteristics of all transverse and longitudinal structures located in catchments upstream of individual reservoirs. Analysis of the geological structure, as well as the structure of land use in the basins of the reservoirs, was also performed. The obtained results allowed for the preparation of recommendations for further work, allowing, among other things, an increase in water retention. The key factors for maintaining the capacity of retention reservoirs were defined, which may be useful in national plans or programs in the field of counteracting the effects of drought or flood protection.

1. Introduction

Water reservoirs are the basis of modern water management and an integral part of the global hydraulic infrastructure [1]. The exploitation of existing reservoirs and their sustainable management is a challenge, resulting primarily from the growing demand for water, the observed effects of climate change, and the reduction of their capacity due to the accumulation of sediments in them [2,3]. In addition, reservoir management is a complex process that requires reconciling various, often opposing, functions, that hinder operational activities [4,5]. Worldwide, reservoir water supplies approximately 30–40% of irrigated land, provides 20% of the world’s electricity production through hydroelectric turbines installed on barrages, and serves many other purposes, including flood protection, counteracting the effects of drought, recreation and creating conditions for inland navigation [6]. At the same time, the use of individual facilities and the fulfilment of the above functions are associated with the need to maintain proper damming levels. Sustainable water resources of reservoirs depend on the preservation of valuable retention capacity. For this reason, sediment management is a key task in the operation of reservoirs [7].
Accumulation of sediments in the reservoir reduces its capacity, hinders its operation, and may accelerate the rate of wear of the hydraulic infrastructure located on the barrage, which reduces the efficiency of the performance of specific functions and may result in higher maintenance costs [8]. In this respect, an important factor is to maintain the continuity of sediment transport in the river downstream of a given impoundment. Therefore, when designing retention reservoirs, appropriate solutions related to small hydropower plants, ecology, fisheries, flood protection, river morphology, tourism, etc., are used [9]. Proper diagnosis of reservoir desludging needs and planning of this process, together with subsequent management, is important for maintaining appropriate parameters of individual reservoirs, as well as retention in a given area [10].
The average degree of filling reservoirs with sediment in Europe is 0.73% of the initial capacity each year, which is mainly influenced by fluvial processes occurring in facilities located in the dry and sparsely vegetated southern part of the continent. Lower capacity loss values are recorded only in North America (0.68%), comparable in Central (0.74%) and South America (0.75%), and higher in other regions: Asia (0.79%), Africa (0.85%), Australia and Oceania (0.94%), and the Middle East (1.02%) [11]. For comparison, the average annual silting rate of 47 large water reservoirs in Poland, which is crucial for water management, amounts to 0.2% of the loss of their initial capacity [10]. Annual economic losses due to the loss of 1% of the water retention capacity of reservoirs range from USD 6 to USD 10 billion [12]. Therefore, sediment management should be obligatorily taken into account when designing new hydraulic structures for river training, as well as applying to the existing ones. The principles of sediment management should also be included in strategic or planning documents at a national level [11].
The main reasons for the decrease in the capacity of retention reservoirs include: the geological structure of the catchment, relief, climatic conditions, vegetation, hydrological conditions and anthropogenic elements, such as the size of the reservoir, hydraulic structures for riverbed training, and land development in the catchment area [13]. Land use and land cover are considered to be the most important factors influencing the amount of surface runoff and related erosion processes. The main drivers of sediment supply in many areas are natural (e.g., geology, topography and climate) and anthropogenic (e.g., changes in land use and management practices), especially in mountain and foothill areas [14]. The topographic features of the reservoir itself (riparian width, slope, and elevation) and the associated ecosystem may also be important [15]. Taking into account these factors during the stage of planning the construction of a barrage is extremely important, because decisions on the location of a given reservoir determine its future performance to a great extent, i.e., the effectiveness of fulfilling the functions for which it was created. So far, to a great extent, individual objects have been located mainly on the basis of engineering, economic and often also political analyses. To ensure sustainable development, location decisions should take into account the wider spatial and temporal context [4]. It is also essential to prepare more detailed water management programs and plans, which the European Union states are obliged to do under the Water Framework Directive [16]. Drought is also an important issue [17]. In response to this, the Drought Effects Counteracting Plan was developed and implemented in Poland. The document’s purpose is to indicate the most important directions of action to help prevent a water crisis [18]. Flood, next to drought, is one of the most severe and dangerous natural phenomena. In order to increase safety, periodic flood risk management plans are developed [19] in accordance with the provisions of the Flood Directive [20] and the Water Law Act [21].
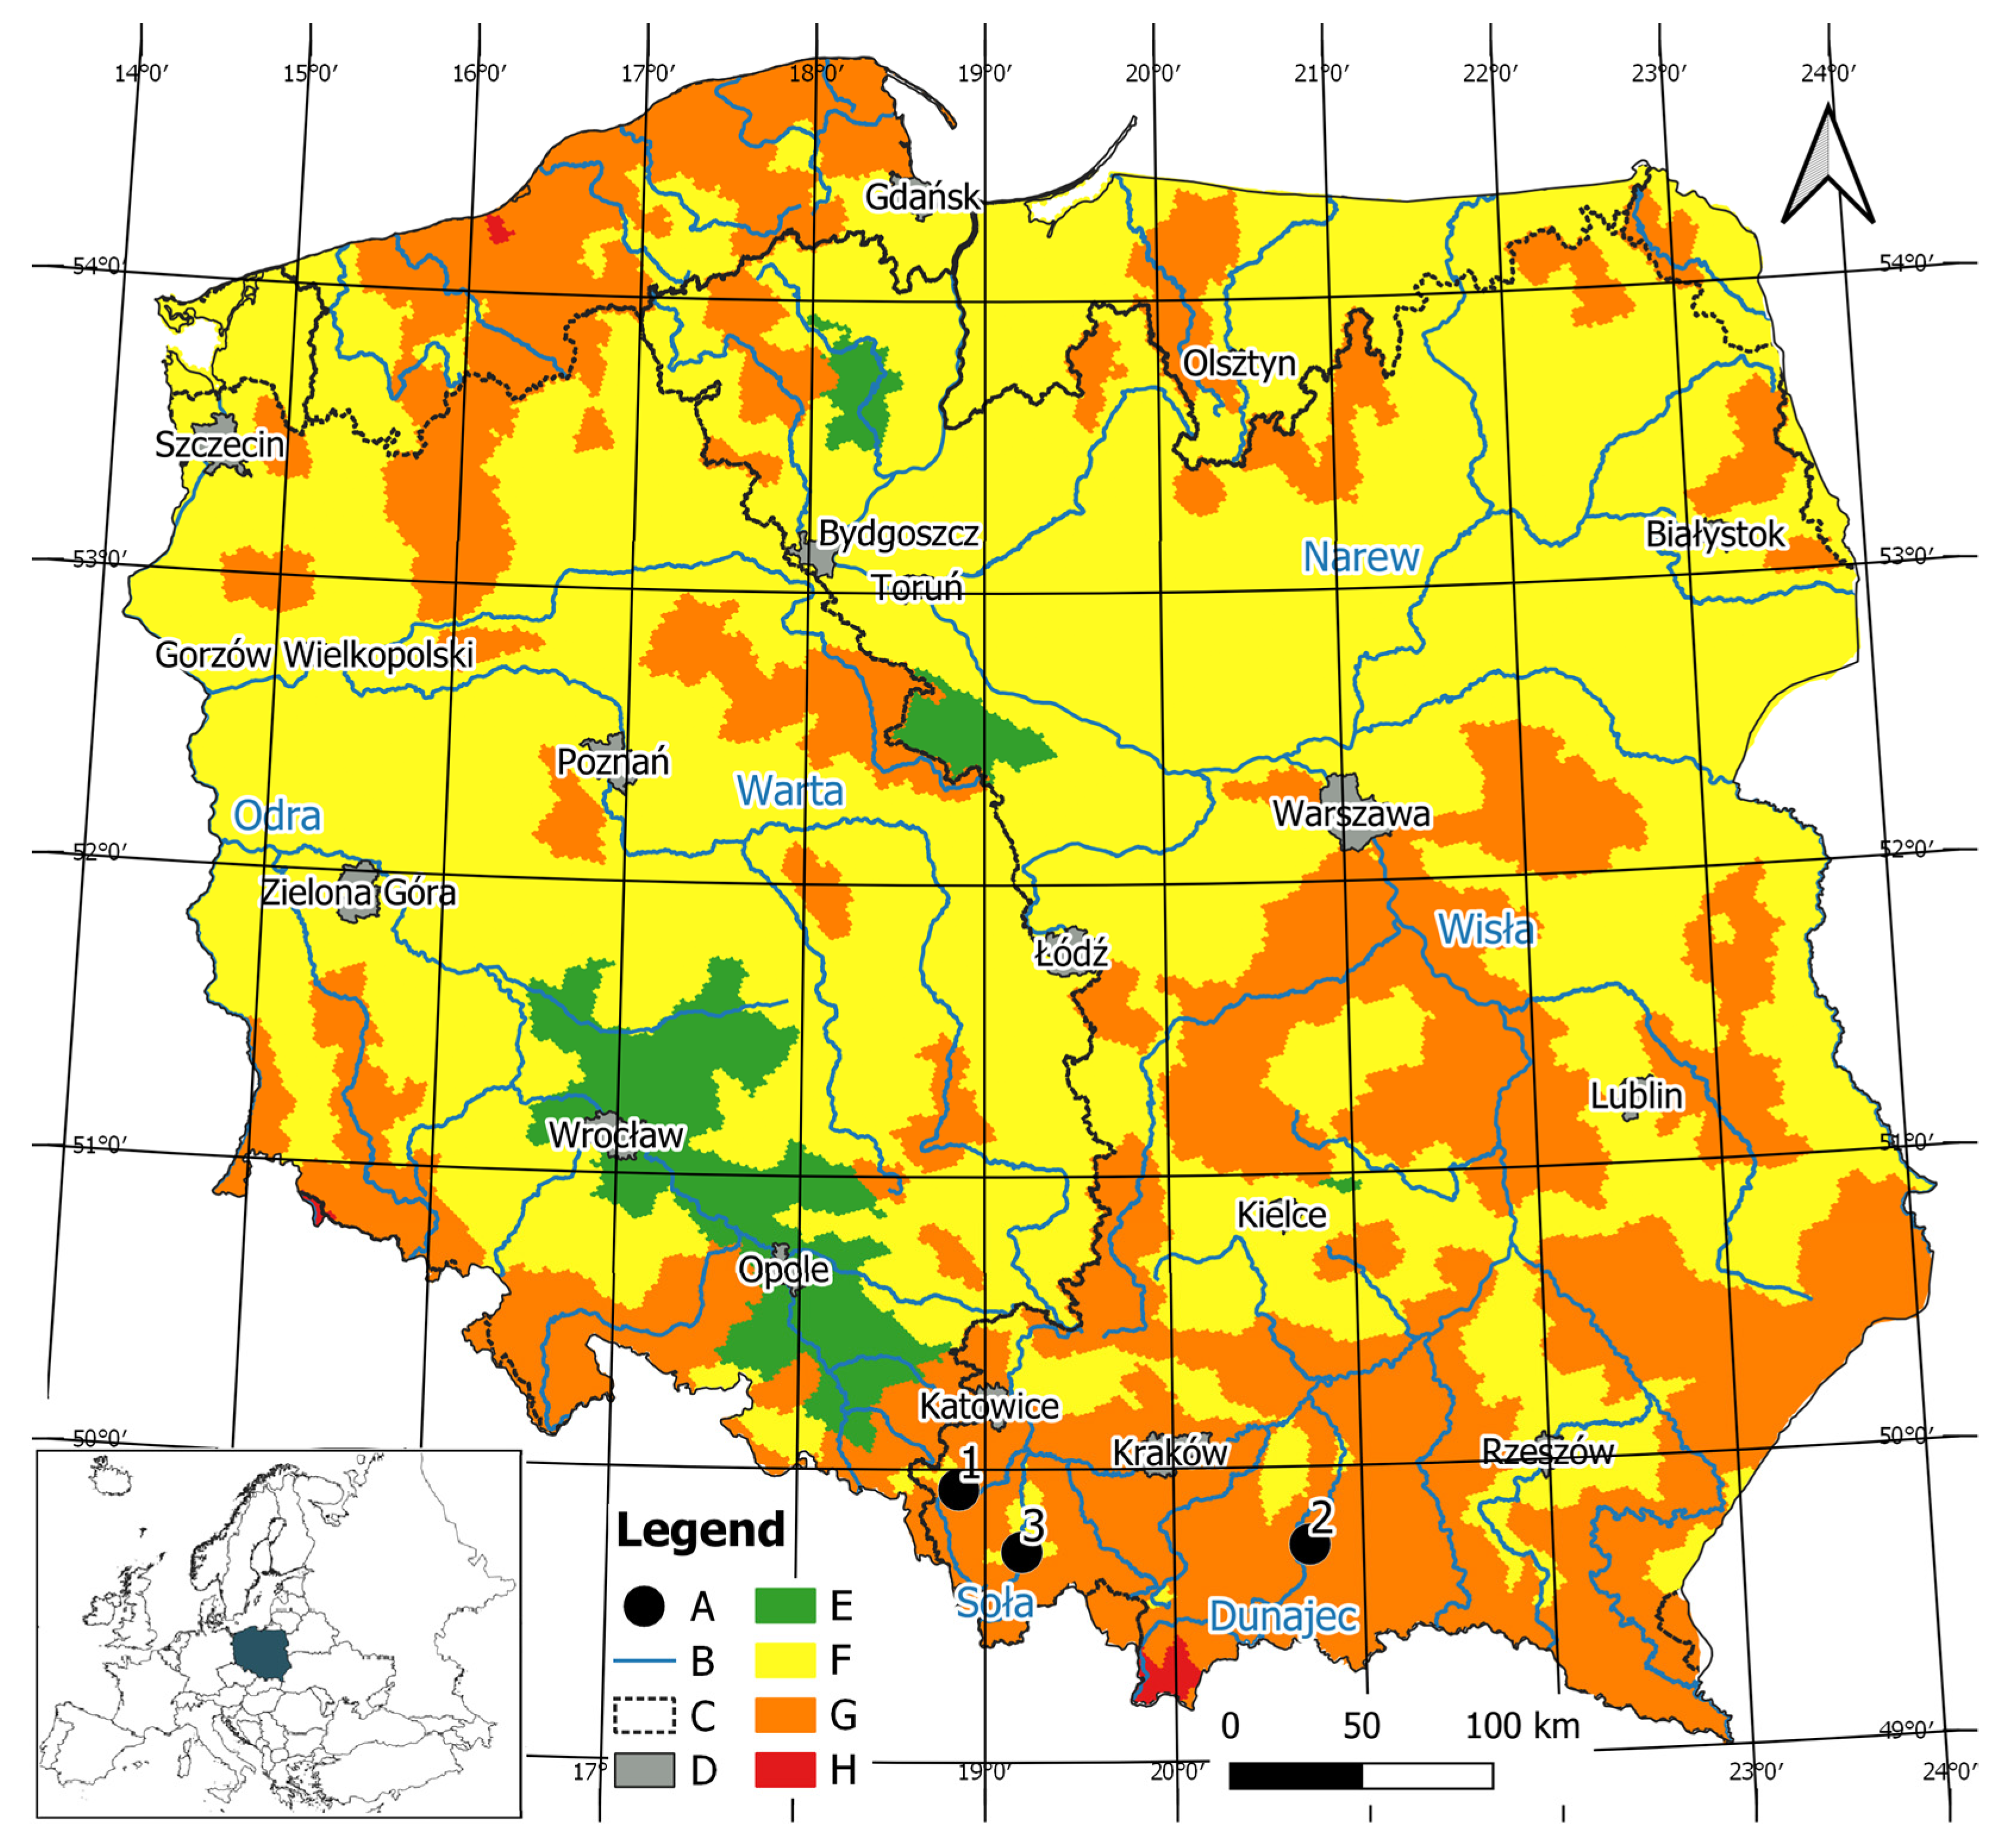
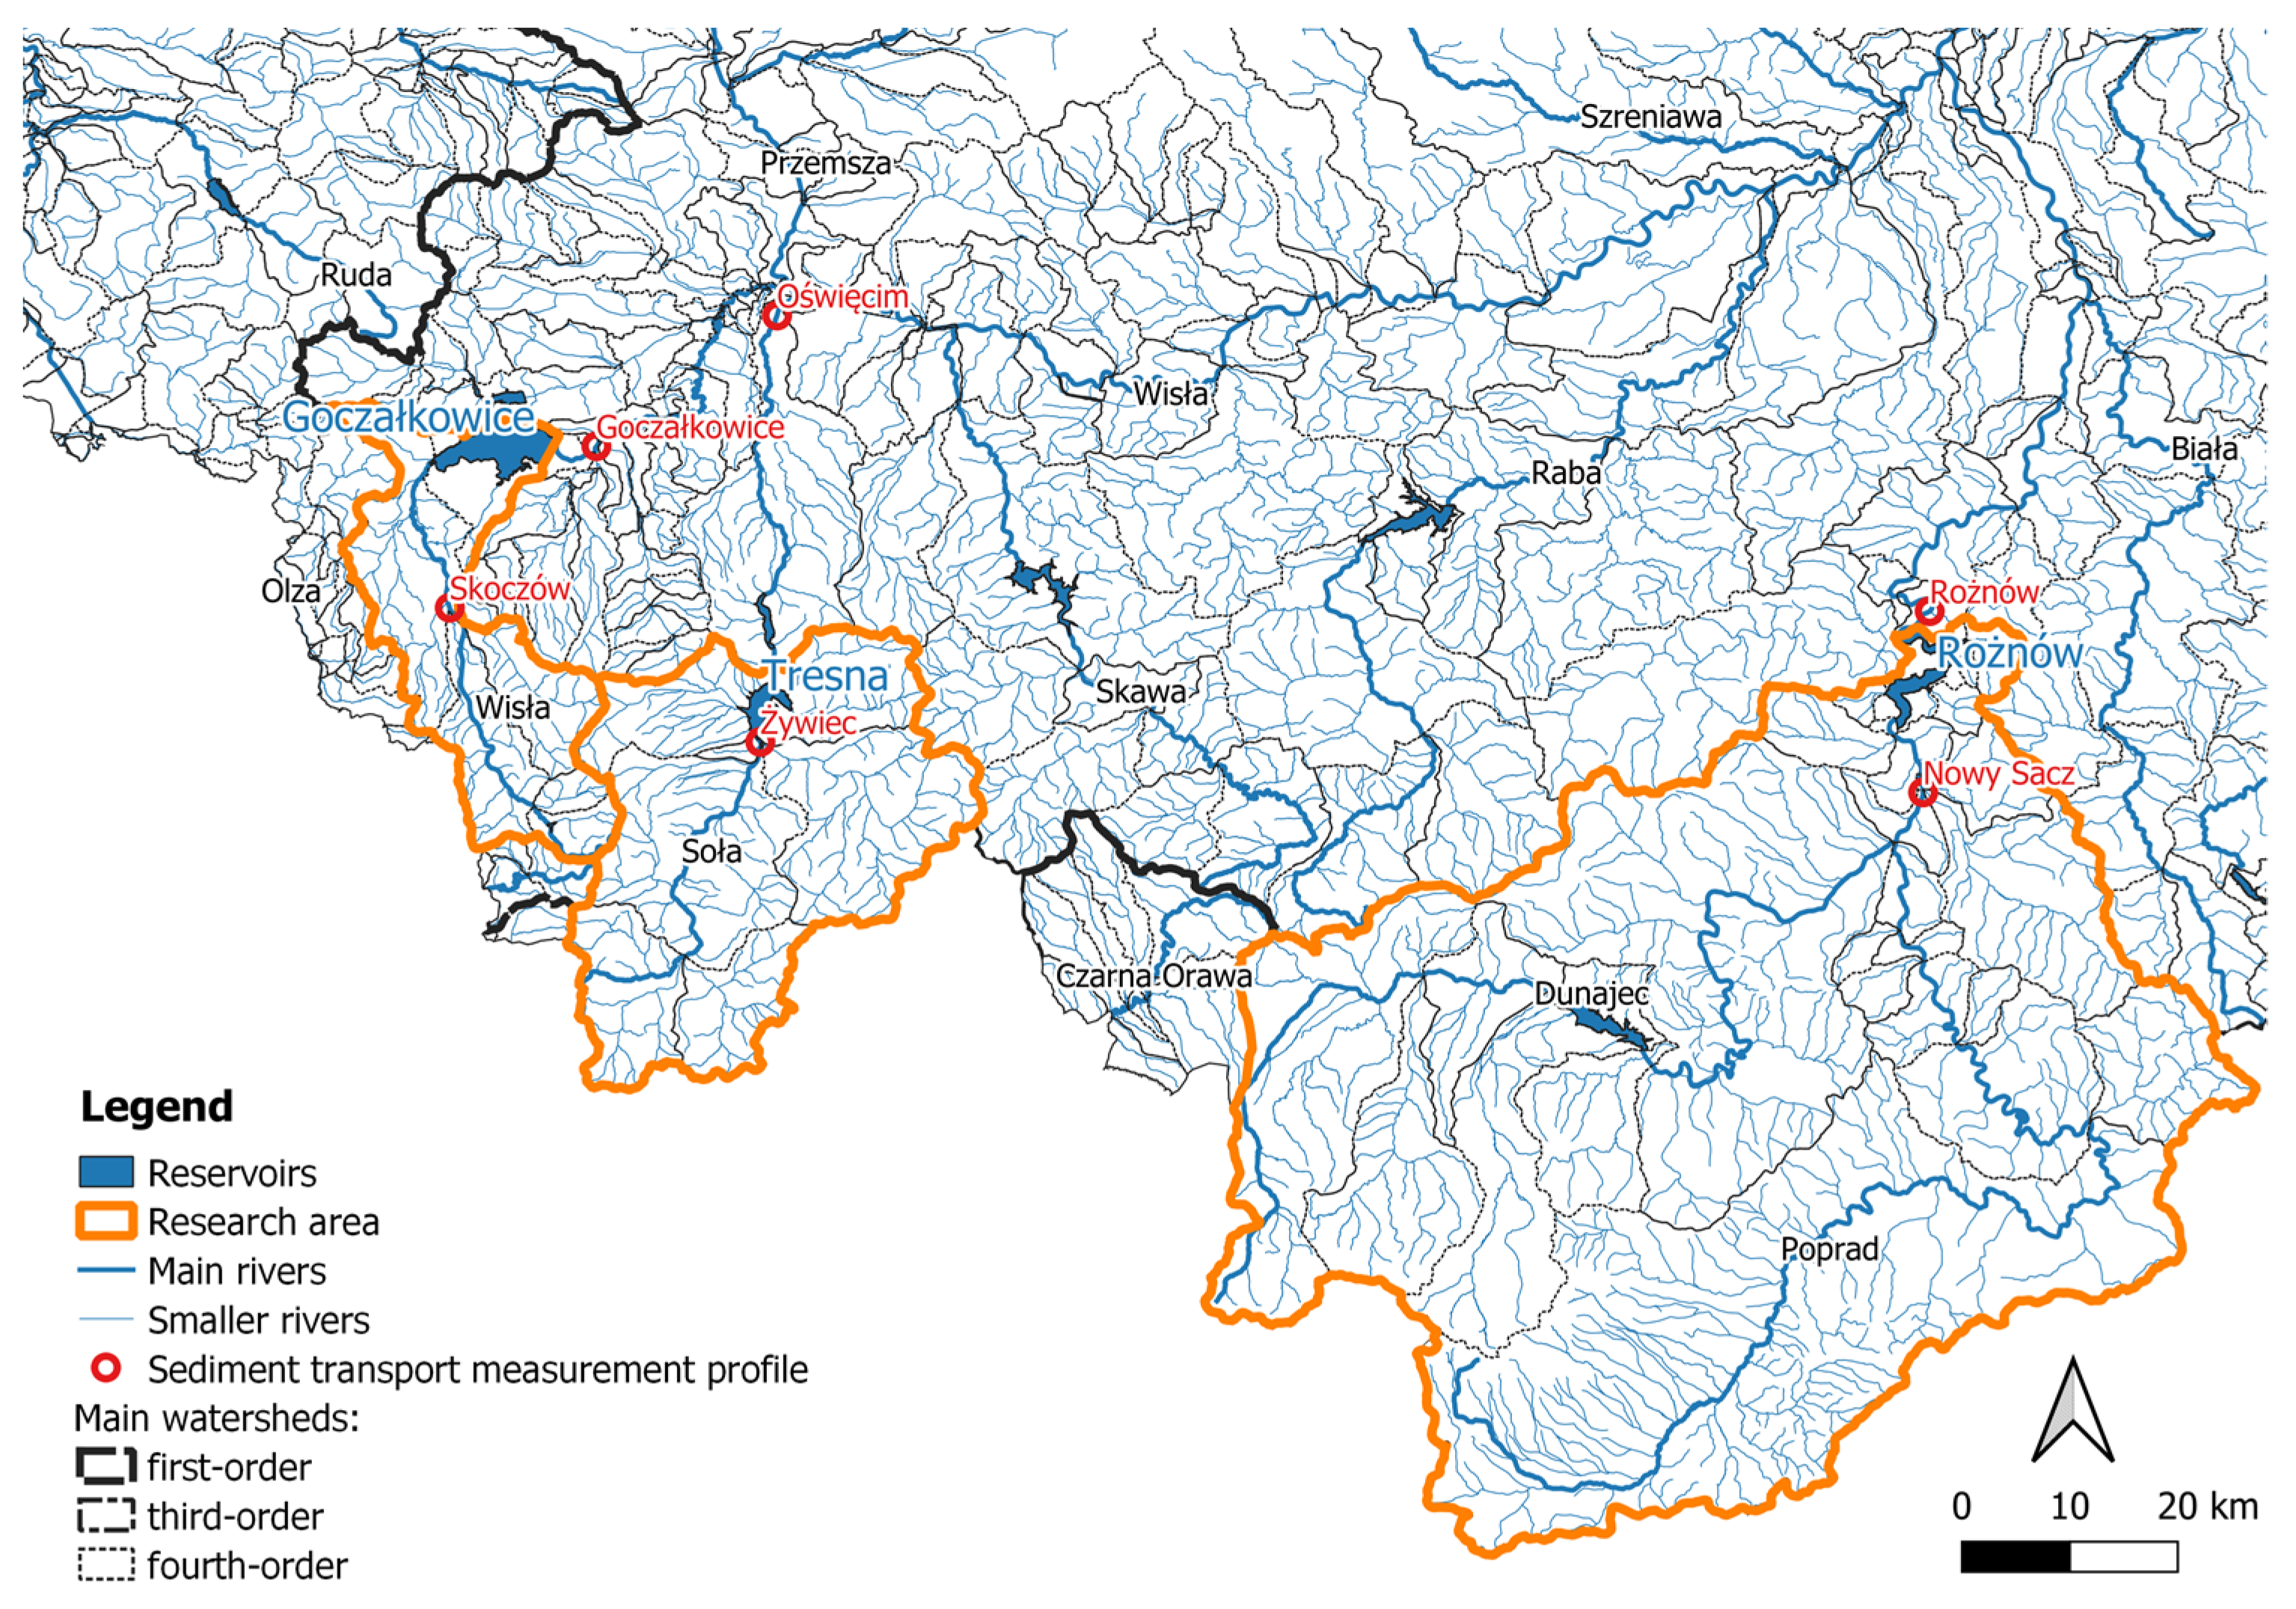
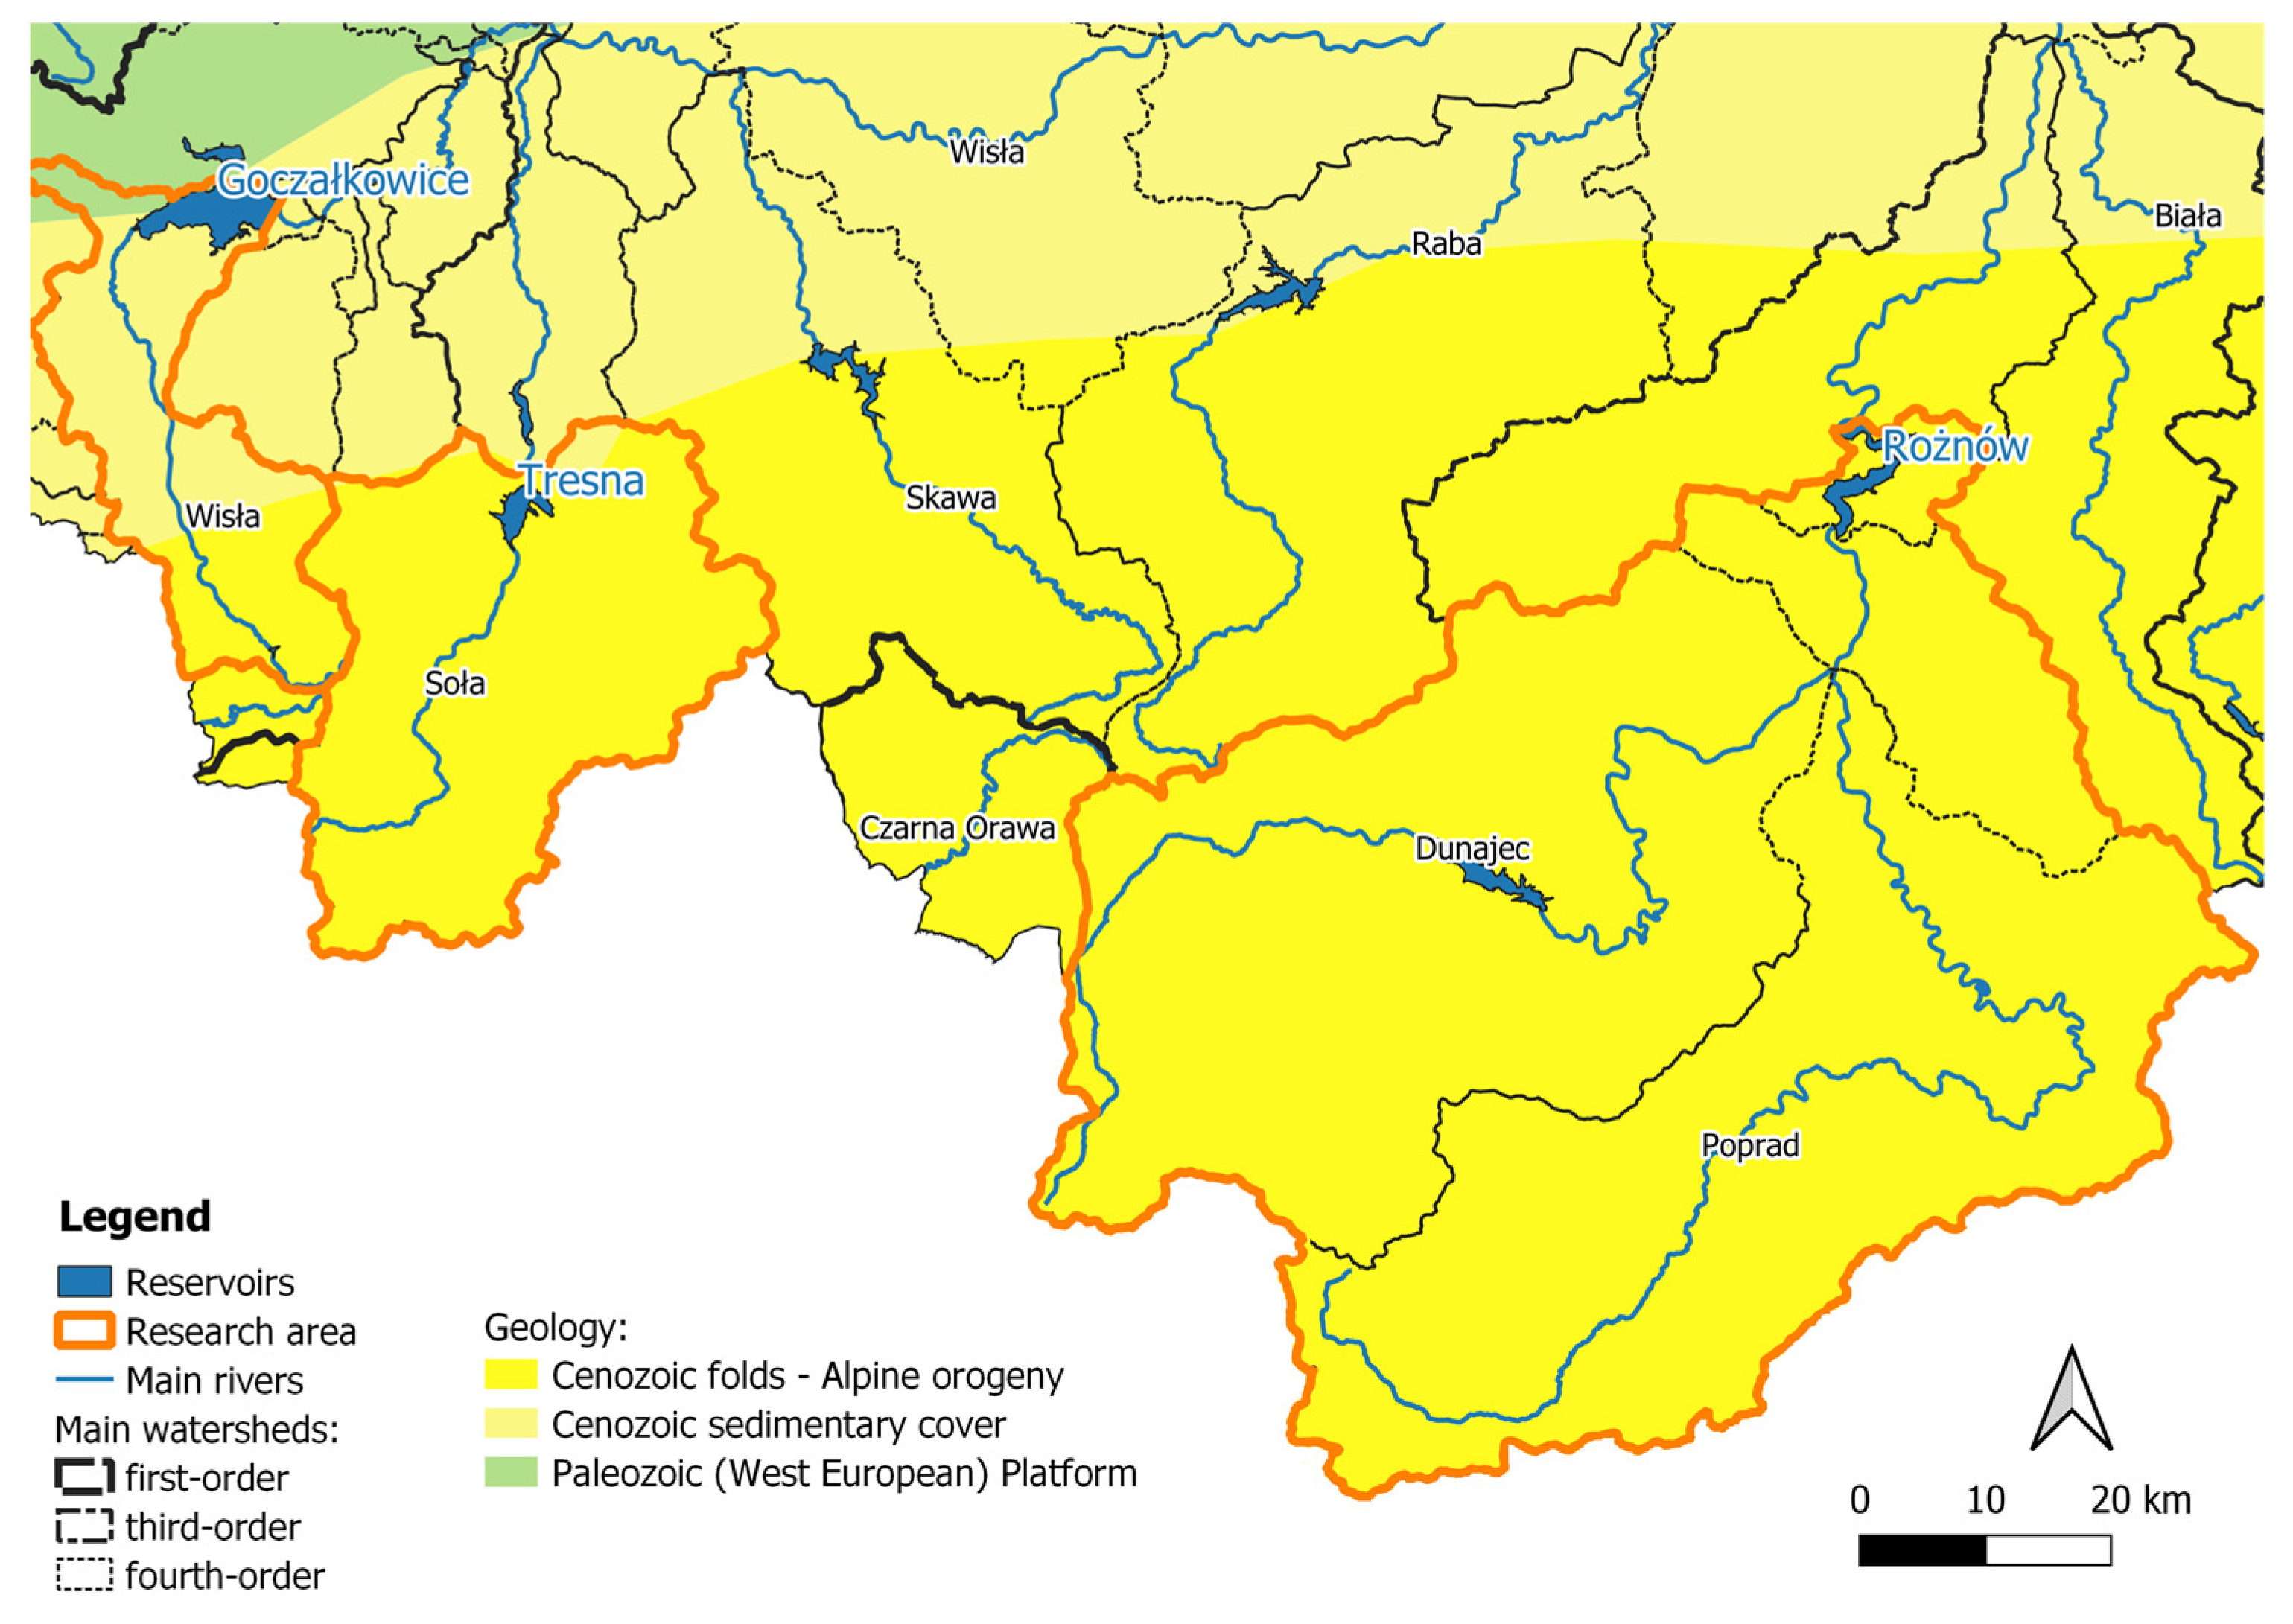
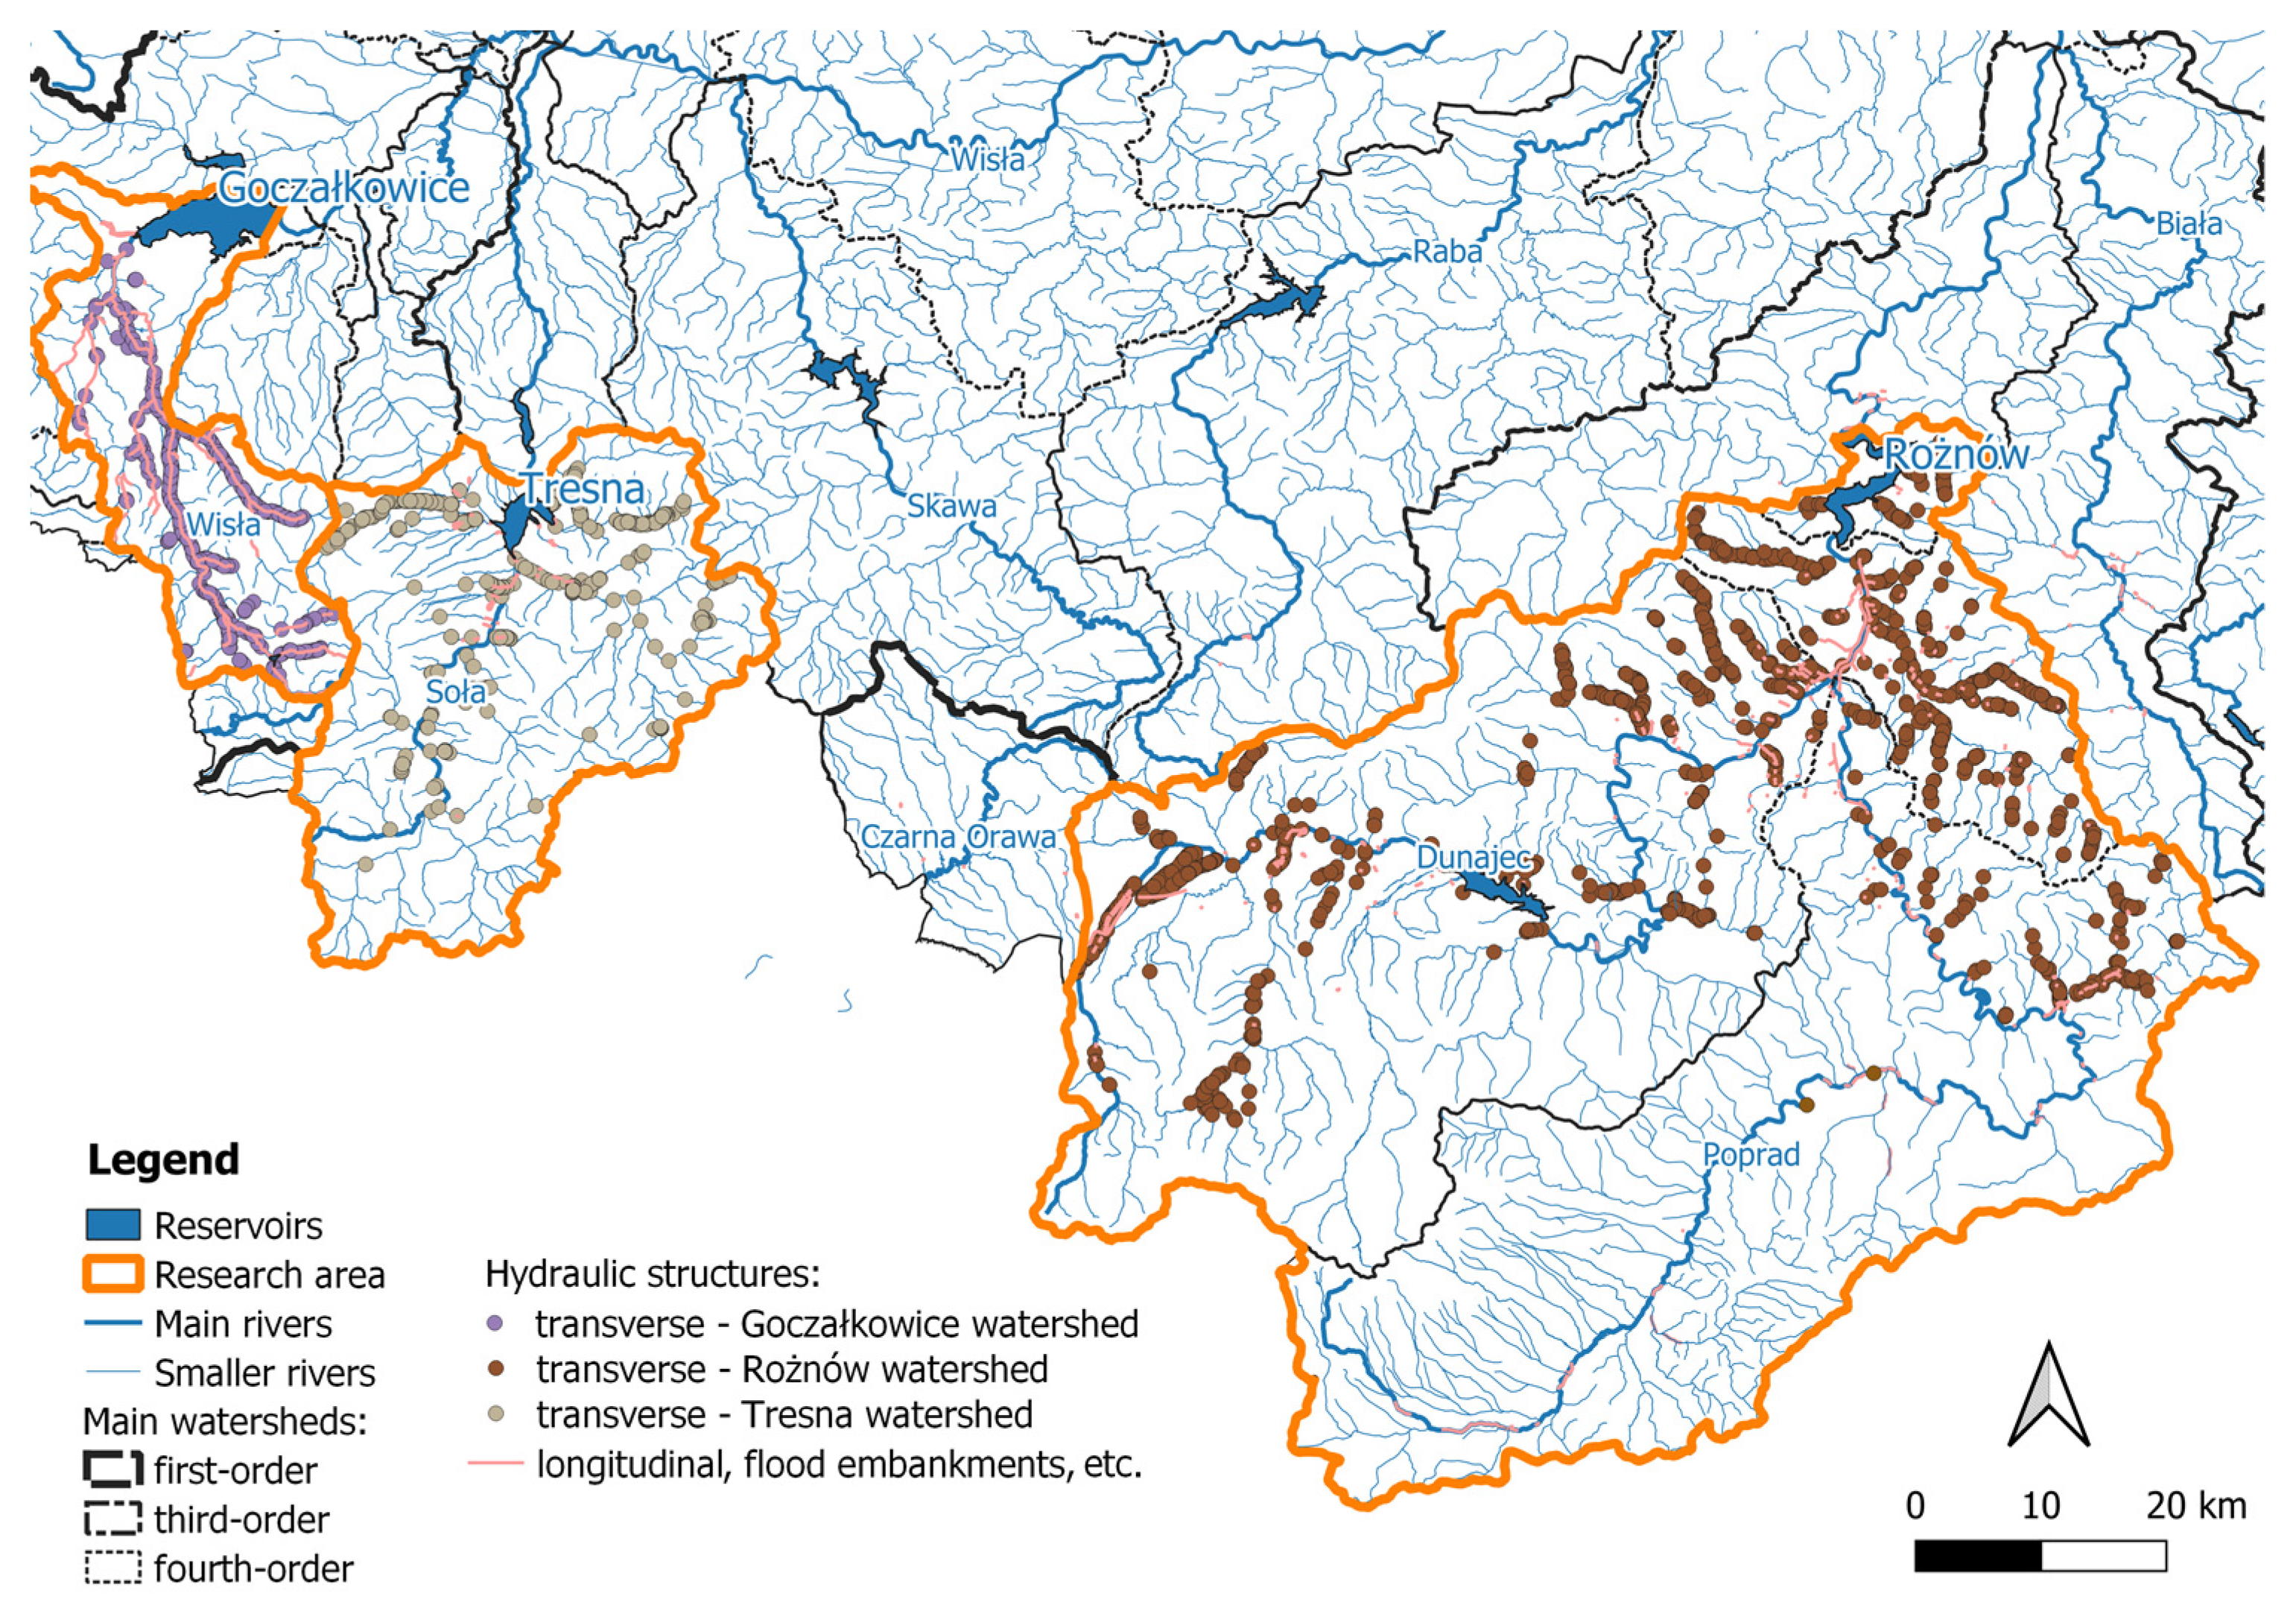
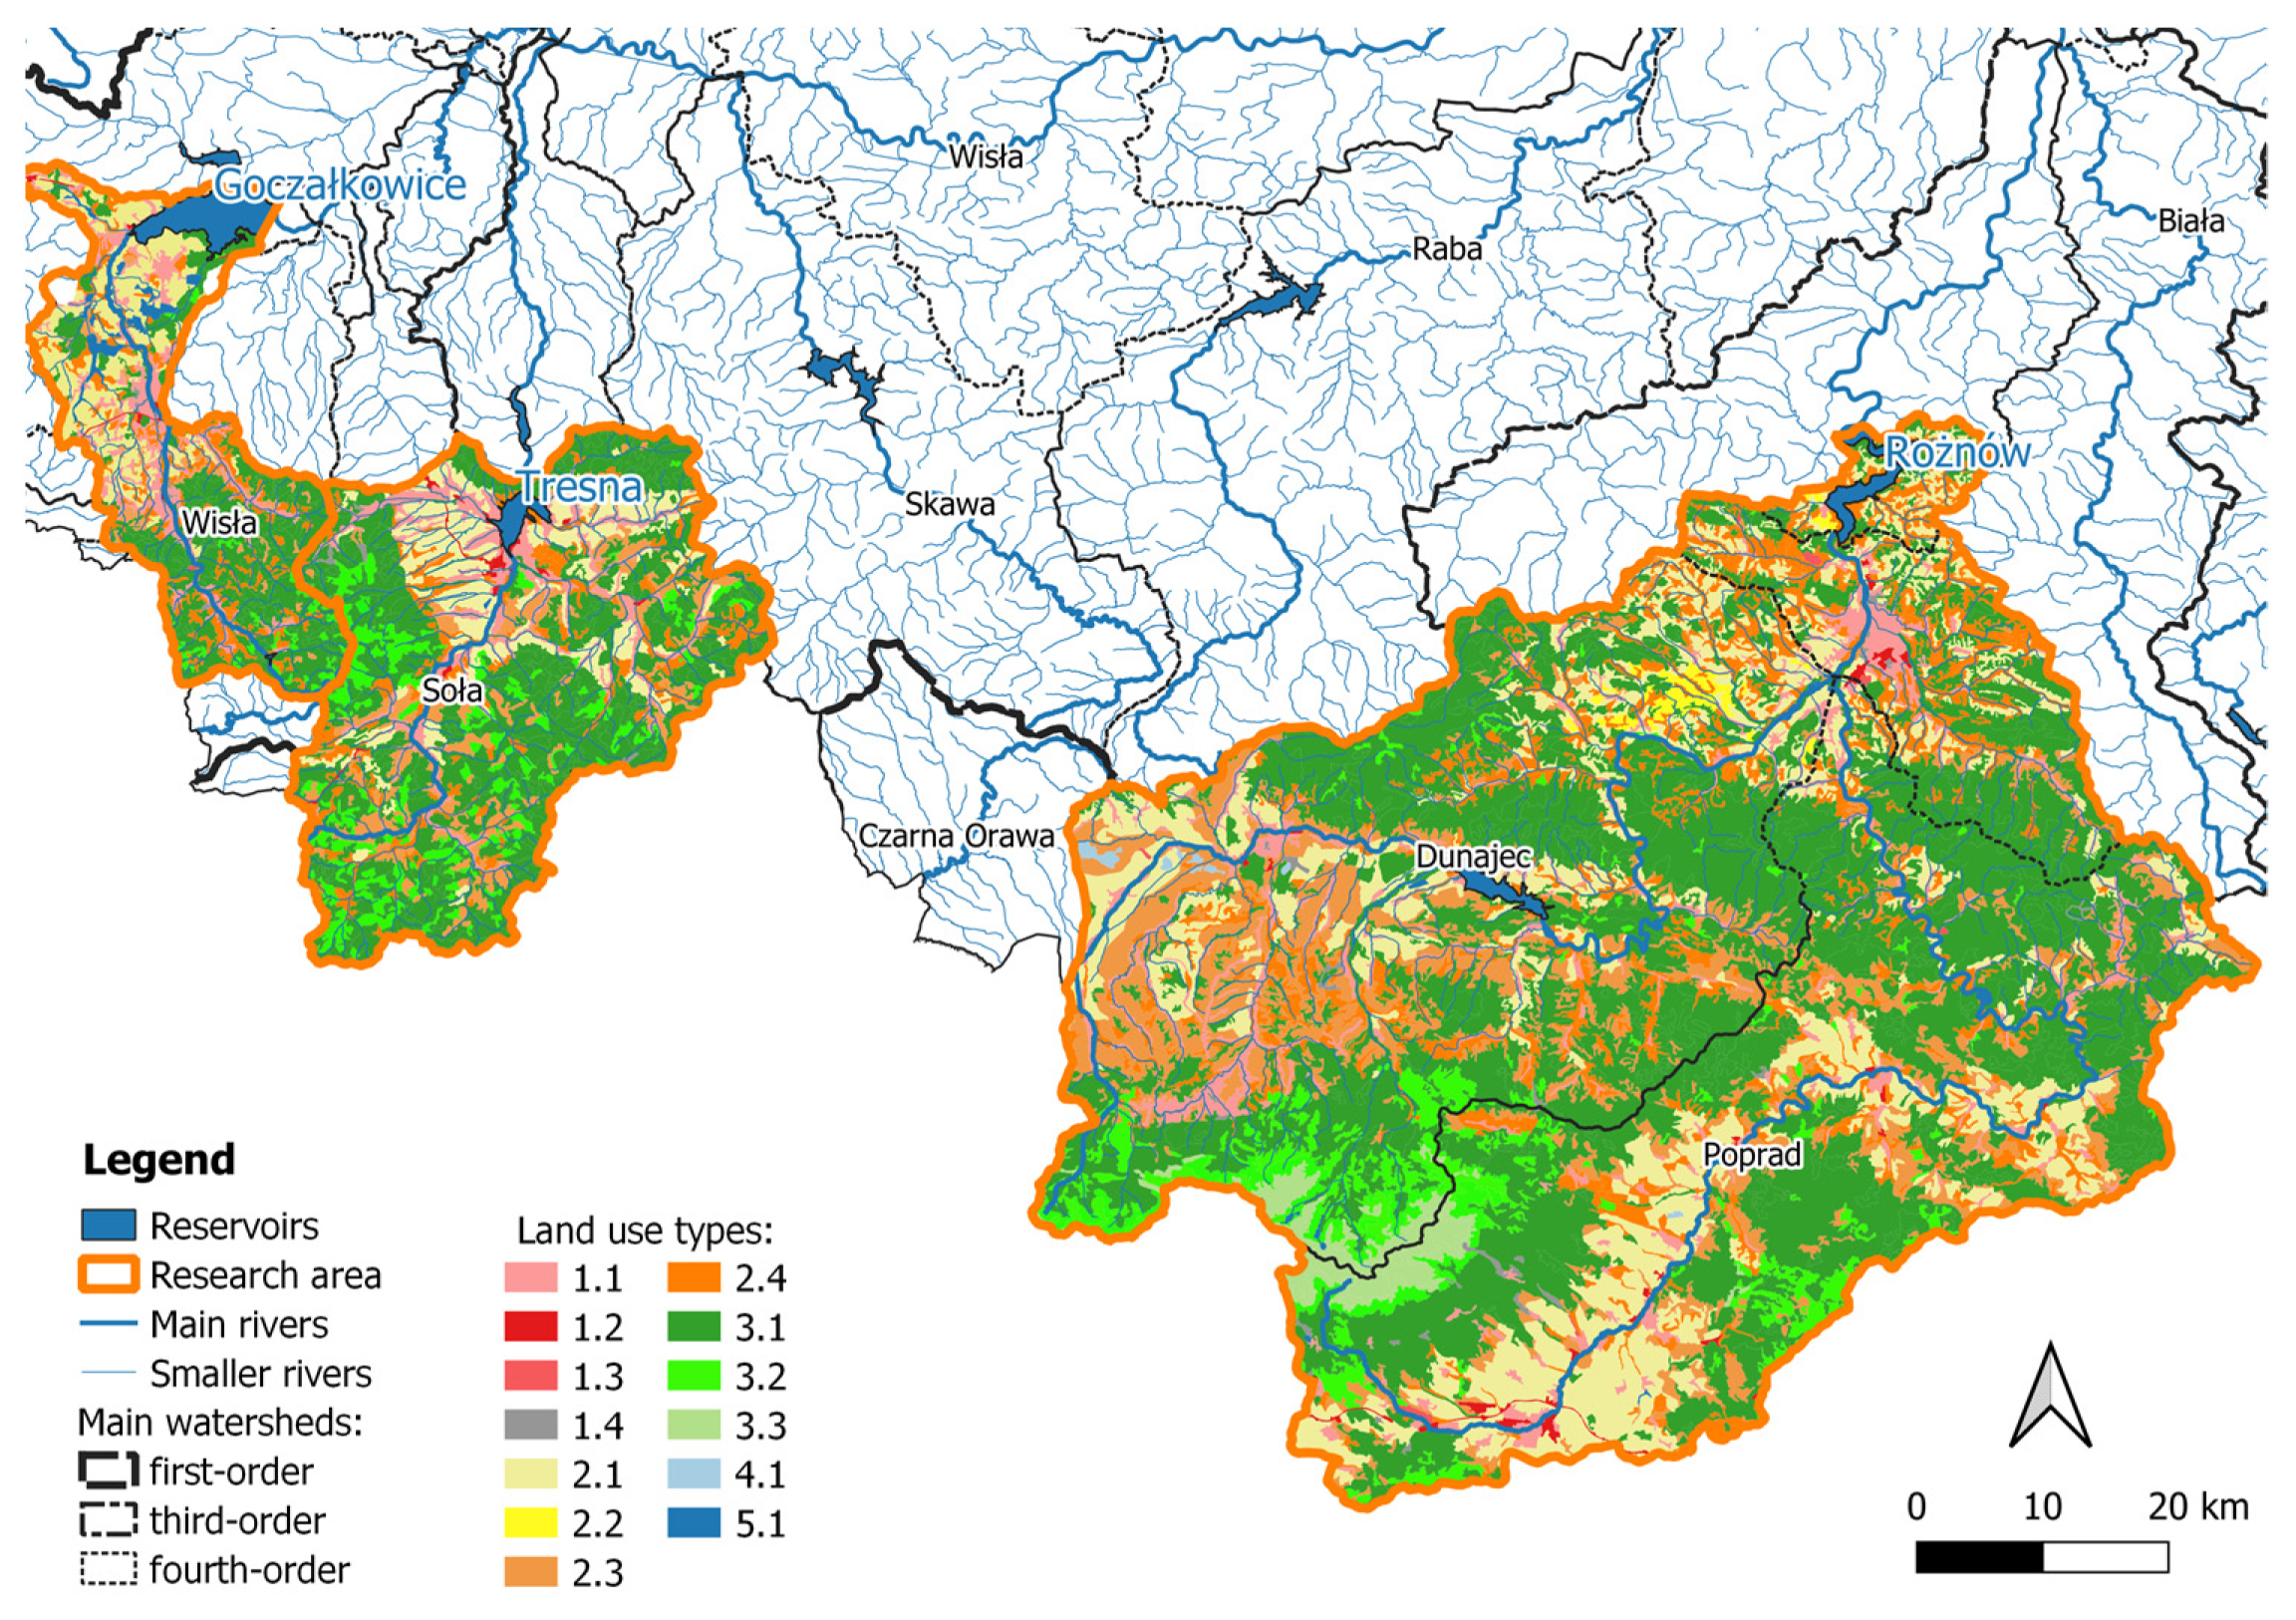
The motivation to conduct research is, therefore, to determine the appropriate conditions in the catchment, provision and maintenance, which will consequently enable the appropriate use of dam reservoirs. Therefore, the main objective of the conducted research is to assess the factors influencing the changes in the capacity of artificial retention reservoirs located on rivers. This paper focuses on the analysis of conditions affecting the diversification of sediment transport, affecting changes in the capacity of retention reservoirs. Three mountain reservoirs (with catchments) located on the Outer Western Carpathians, in the southern part of Poland, were selected as the subject of the study: Goczałkowice on the Vistula River, Rożnów on the Dunajec River and Tresna on the Soła River. Taking into account the results of previous studies, it should be stated that they are characterised by a different degree and average annual rate of capacity loss (respectively, 0.027 million m3, 0.02% of the initial capacity, 0.923 million m3, 0.40% and 0.172 million m3, 0.17 %) [10]. In the analysis of the reasons for changes in the capacity of the indicated reservoirs, the natural factor, i.e., the geological structure, was taken into account, as well as very important aspects related to human activity, from which the following choice has been made: hydraulic structures (all structures located on the main rivers and its tributaries, as well as longitudinal reinforcement of the banks have been taken into account) and the land use structure. This made it possible to indicate the most important natural impacts and anthropogenic pressures, which translate into the volume of suspended load supplied to reservoirs and its accumulation. The results of the analyses made it possible to formulate recommendations for the management of sediments within the existing reservoirs and the construction of new facilities, thanks to which the volume of retained water resources will increase. The results can be used to prepare plans or programs in the field of counteracting the effects of drought or flood protection.

2. Materials and Methods

2.1. Study Area

Out of 47 retention reservoirs located in the Baltic Sea catchment, which are of key importance for water management in Poland, three objects located on the Outer Western Carpathians have been selected for analyses (together with their catchments): Goczałkowice on the Vistula, Rożnów on the Dunajec and Tresna on the Soła (Figure 1). When making the selection, particular attention was paid to the varied rate and size of their capacity reduction in relation to the original parameters, as well as the geologically and geomorphologically similar nature of the catchment area and the functions performed. In addition, when delimiting the study area, an important factor was the location of the indicated reservoirs and their catchments in areas at risk of hydrological drought. The characterised fragment of the Goczałkowice reservoir catchment is mostly at high risk of hydrological drought. In the catchment area of the Tresna reservoir, there is a comparable share of both categories (high and moderate drought risk), with a small percentage of areas at an extreme drought risk. On the other hand, the catchment area of the Rożnów reservoir is characterised by the worst parameters, where, in its upper part, there are areas at an extreme risk of hydrological drought, and in the lower part, only areas at a high risk of drought (Figure 1) [18]. Large differences in relief and absolute height in mountain areas result in uneven spatial distribution of precipitation, which results in diversification of the volume of river resources. Large slopes and low permeability of the subsoil are conducive to rapid outflow of the water to the valleys, where there are also often no convenient retention conditions [18].
Changes in climatic parameters, i.e.,temperature and rainfall, depend on the height above sea level. Precipitation in the Carpathians is lower than in the mountains of Western Europe and, depending on the exposure of the ranges and altitude above sea level, annual sums range from 800 to 1200 mm, while in valleys they do not reach 600 mm; they reach the highest values in the Tatra Mountains (up to 1800 mm) [22]. The largest sums of precipitation are usually recorded in the summer months, culminating in June and July. Most often, precipitation in summer is convective in nature, which can be very efficient for supplying surface and underground water resources [23].
The total area of the analysed reservoirs at the maximum damming level is 58 km2, while their total capacity is 409.77 million m3 (Table 1). Taking both parameters into account, the largest object is the Goczałkowice reservoir, which has the capacity to store approximately 74% more water than the smallest Tresna reservoir, while occupying more than three times more land (32 km2). In terms of capacity, the Rożnów reservoir is slightly inferior to the Goczałkowice reservoir, but its catchment area is over 10 times larger (4900 km2 compared to 430 km2). The Rożnów reservoir has no flood reserve (normal damming level corresponds to the maximum damming level), and for Goczałkowice and Tresna, they are at a similar level (43.2 million m3 and 38.8 million m3, respectively). An important parameter from the point of view of the processes taking place within the reservoirs is the rate of water exchange. In this aspect, the Rożnów reservoir is the most favourable, where this period is on average 31 days, and in the case of Goczałkowice and Tresna 80 days and 90 days, respectively (Table 1).
Table 1. Basic parameters of the analysed retention reservoirs.
IDReservoirRiverCommissioningBasin Area [km2]Reservoir Area at MaxDL [km2]CapacityHydraulic Resistance Time [days−1]
NDL [M m3]MaxDL [M m3]
1GoczałkowiceWisła195543032118.10161.3080
2RożnówDunajec1942490016155.77155.7731
3TresnaSoła196711001053.9092.7090
Explanations: MaxDL—the Maximum Damming Level, NDL—the Normal Damming Level. Source: own study based on [24,25].
The reservoirs in question are multifunctional facilities, and the main purpose of their construction was flood protection. In addition, Tresna and Rożnów are also used for the purposes of hydropower and recreation [24]. On the other hand, the basic tasks of the Goczałkowice reservoir also include water supply to a part of the Metropolis GZM [25].
The presented reservoirs are located on the upper Vistula, and their right tributaries, the Soła and the Dunajec, which are located in the Vistula basin (Figure 1), covering a total area of 194,424 km2—the 6th position in terms of area among all European river basins flowing into the sea [26]. The rivers on which the reservoirs were built have their sources in the Carpathians: the Dunajec in the Western Tatras, the Soła in the Żywiec Beskids, and the Vistula in the Silesian Beskids. The Dunajec flows through the territory of two countries (Poland and Slovakia), while the other rivers are located only in Poland. It is also interesting that the Soła and the Vistula differ from the Dunajec in their hydrological regime. It is assumed that, in their case, we are dealing with a nival-pluvial regime, characterised by two clear culminations of floods during the spring thaw (March–April) and summer rainfall (June–July), translating into higher flows in the period from March to July compared to the average annual values. On the other hand, on the Dunajec river, a pluvial-nival regime was identified, resulting from spring thaw floods recorded since March, which come later than in the case of the Soła and Vistula rivers, resulting in a merger with the summer flood caused by heavy rainfall. Therefore, the period of increased flow lasts a very long time (April–July), and the maximum values are relatively even and last from May to July [27]. At the same time, the average annual flows (SSQ) for observations carried out for over 40 years, in water gauge profiles located upstream of the analysed reservoirs, are as follows: 66 m3/s on the Dunajec (Nowy Sącz station), 15.9 m3/s on the Soła (Żywiec) and 6.21 m3/s on the Vistula (Skoczów) [28]. However, during a flood wave, the inflow to the Tresna reservoir, for example, may exceed 1000 m3/s. This is often the result of intense rainfall, during which the flooding in the Soła catchment in 2021 could reach up to 143 mm per day [29].

2.2. Data

The complexity of the considered issue, i.e., determining the causes of changes in the capacity of selected retention reservoirs: Goczałkowice on the Vistula, Rożnów on the Dunajec and Tresna on the Soła, required the use of numerous data sources and a number of research methods. The selection of objects was made on the basis of the authors’ previous research on the volume of water stored in dam reservoirs. The calculated changes in the capacity of selected objects, along with the determined rate of fluvial processes, were also used as the basic element for further analyses.
For the purposes of the analysis of anthropogenic pressures and natural impacts occurring within the studied objects, the characteristics of selected parameters of their catchments, as well as hydraulic structures upstream of them, were presented, along with the identification of transverse and longitudinal infrastructure on the main river and its tributaries, using the digital Database of Topographic Objects [30], and, in the case of the Dunajec, also data from the national geoportal of Slovakia [31]. Data obtained from the State Water Holding Polish Waters: Regional Water Management Authority in Gliwice [25] and Regional Water Management Authority in Kraków [24], were used to determine the current parameters of retention reservoirs. In order to illustrate the impact of the studied reservoirs on the transport of suspended load, a query was carried out in the hydrological yearbooks of surface water, the Vistula river basin and Przymorze rivers east of the Vistula from the years 1979 [32], 1981 [32] and 1983 [32]. The geological characteristics of the study area were based on the Detailed Geological Map of Poland in 1:50,000 [33], and the database developed by the Institute of Geodesy and Cartography [34] was used to determine the structure of land use in the area of the considered catchments. Collecting the presented materials made it possible to start spatial analysis carried out in the GIS software (QGIS 3.18, MapInfo Pro 2019), enabling the determination of the cause of the differences in the changes in the capacity of the analysed reservoirs. In order to fully illustrate the obtained results, an assessment of individual factors was carried out to determine the correlations of individual morphological and hydrological parameters of the catchment. In addition, the results obtained in the field of existing hydraulic structures were compiled using GIS spatial analysis in designated grids of basic fields in the shape of hexagons. For this purpose, three ranges were defined for parameters in the studied catchments: the weakest parameters, average parameters, the best parameters; and the method of natural breaks was used.
At the same time, the availability of data was also one of the elements related to the delimitation of the research area. Previous experience shows that for some large reservoirs in Poland there is no information about the initial capacity. Moreover, for some objects, it is impossible to identify the initial parameters, i.e., to distinguish the normal damming level from the maximum damming level. It is also important to be able to check the reliability of data for the purposes of conducting individual analyses (e.g., on the basis of current bathymetric measurements or issued water management instructions), which was done in the case of the reservoirs taken into account.

3. Results

3.1. Capacity Changes

The results of the authors’ previous research indicate that 47 water reservoirs in Poland, key for flood protection and counteracting the effects of drought, in the period from their commissioning to 2021, lost a total of almost 200 million m3 of water retention capacity (i.e., 5.2% of the initial capacity at maximum damming level). In 27 of them, a decrease in retention capacity was noted, in 7 it increased, and in 13 no changes were observed. The largest percentage of lost volume is characteristic of the Czchów reservoir (37.3%), while in the case of a unit value, Włocławek stands out, which lost the most: over 79 million m3 (approximately 15% of its capacity). Its average annual bed-load accumulation is 1.549 million m3, which means that on average, each year the size of the object decreases by 0.29% compared to the initial dimensions [10].
A large loss of capacity, in relation to the value recorded at the time of commissioning, is characteristic of the Rożnów reservoir. The conducted research showed that it lost almost 73 million m3, i.e., nearly 32% of its volume (Table 2). The values recorded for the other reservoirs are much lower; in the Tresna reservoir the retention capacity decreased by 9.3 million m3, and in the case of Goczałkowice by 1.8 million m3 (9.1 and 1.1% of the initial parameters, respectively) (Table 2). The average annual capacity loss also varies between individual facilities: Rożnów loses an average of 0.923 million m3 (0.40% of the initial value), Tresna 0.172 million m3 (0.17%) and Goczałkowice 0.027 million m3 (0.02%) each year (Table 2).
If the rate of fluvial processes, including primarily sediment transport, remained the same, the Rożnów reservoir would lose 50% of its initial capacity by 2066, and 80% still in the 21st century (i.e., in 2093). For the Tresna reservoir, the same indicators would be achieved in 242 and 387 years. On the other hand, the rate of capacity reduction within the Goczałkowice reservoir is so low that it should be classified as long-lived (Table 2).
In this aspect, it is also worth assessing the volume of sediment transported to the analysed reservoirs, showing the diversity in its transport, caused by the occurrence of damming, i.e., the accumulation of sediments within the reservoir and, consequently, their frequent deficit downstream of it. Research on the sediment transport in the Carpathian rivers made it possible to determine that the main type of suspended load supplied to the dam reservoirs in the Vistula basin is the suspended mineral load, while the share of bed load sediment is small and is gaining importance in lowland rivers [35]. Therefore, turbidity data from gauging stations located upstream and downstream of the reservoirs, in the immediate vicinity of the barrage, were taken into account (Figure 2). For the gauging stations located upstream of the reservoirs, information from three different years is presented: 1979, 1981 and 1983. However, downstream of them, complete data in the indicated time period are available only for the Vistula, while on Soła in 1981 and Dunajec in 1983, measurements were discontinued at stations enabling the assessment of the degree of retention of fluvial material in the analysed reservoirs.
The examined volume of sediment transported to the reservoirs varies in individual years, likely resulting from the number and volume of floods. The increase in the transport of fluvial material in 1983 is particularly clear, based on data from the gauging stations in Nowy Sącz on the Dunajec and Żywiec on the Soła (Table 3). Another similarity between the two rivers is visible in the retention of suspended load by the Rożnów and Tresna reservoirs, which accumulate them in almost 90%. In the case of the Soła, the obtained results confirm the observations carried out so far, and in the case of Rożnów, it should be noted that as a result of its commissioning, the Dunajec river introduces, on average, two times less clastic material into the Vistula [13]. Thus, the accumulation of sediment within reservoirs causes significant changes in its transport downstream of water barrages, but then, along the course of the river, the transport of suspended material increases, which is confirmed by proven data from the gauging station on the Dunajec River in Żabno (the catchment area is 6755 km2), where in 1979 231,000 t of suspended load was transported [32]. The results for the Vistula River and the Goczałkowice reservoir located on it are slightly different. In this case, no reduction of fluvial material was identified within the reservoir, which is potentially related to the use of transverse development of the riverbed upstream of it and the presence of the Wisła Czarne reservoir in the upper part of the catchment area, and may also result from the large distance between the considered gauging stations of Skoczów and Goczałkowice (reconstruction of sediment transport downstream of the Goczałkowice barrage).

3.2. Geological Conditions

In terms of physiogeography, all the rivers considered have their sources in the mesoregions of the Carpathians: the Dunajec in the Western Tatras, the Soła in the Żywiec Beskids, and the Vistula in the Silesian Beskids. The Dunajec also flows through the Beskids, and the Rożnów reservoir itself is located in the Carpathian Foothills. On the border of the Beskids and the Carpathian Foothills, there is the Tresna reservoir on the Soła. The Vistula, flowing out of the Beskids, flows in part through the Carpathian Foothills, while the Goczałkowice reservoir is entirely located in the area of the Subcarpathian Basins (the Flysch Carpathians).
Taking into account the geological structure, the analysed catchments are located mainly in the zone of orogen and Alpine sinkholes (Figure 3). In the case of the catchment area of the Rożnów reservoir, the proper unit is the Cenozoic folding, the Alpine orogeny (Figure 3). Most of the catchment area of the Tresna reservoir is also located on it, which is partly located within the sedimentary cover in the area of Cenozoic folds (Figure 3). The catchment area of the Goczałkowice Reservoir is located within the indicated sedimentation cover for the largest part, in the initial course of the Vistula, and it is associated with the Alpine orogeny and distinguished from the other two analysed areas by the presence of the Palaeozoic West European Platform (Figure 3).
The location of individual reservoirs, as well as the geological conditions of the catchment, translate into the type and size of the sediment supplied. The lithological conditions in the Vistula basin mean that the load is transported in the studied sections of the Dunajec, the Soła and the Vistula rivers, upstream of the analysed reservoirs, mainly in a suspended form [35]. The conducted research made it possible to determine the differentiation between individual units.
The sources of the Vistula, and its initial course on a long section, are associated with the occurrence of sandstones, claystones, marls and conglomerates. Further on, the river valley is covered with sands, gravels, alluvial soils as well as peats and silts. Then, in the catchment, there are mainly relatively small, alternating areas with sandstones, clay stones, marls and conglomerates, as well as sandy loess and loess-like dusts. On the other hand, in the immediate vicinity of the Goczałkowice reservoir, there are also sands, gravels and river silts [33].
The fragment of the Soła catchment, which is lithologically related to the Tresna reservoir, is dominated by sandstones with thin-bedded mudstones and claystones, as well as sandstones, shales, conglomerates, marls, minor claystones and mudstones. As in the case of the Vistula, there are fragments of sandstones, claystones, marls and conglomerates, as well as sands, gravels, alluvial soils, peats and silts characteristic of all the rivers studied. To a small extent, in the direct catchment area of the Tresna reservoir, the following two formations are also present, i.e., sands, gravels and river silts, as well as sandy loess and loess-like dusts [33].
On the other hand, the Dunajec catchment, much larger in terms of area than those described above, is built of rocks characteristic of the Tatra massif in the upper course of the river:
  • Sands, gravels and rock debris of heap cones and kame terraces in the Carpathians,
  • Gneisses, migmatites, amphibolites and granites of the Tatra Mountains,
  • Sandstones, shales, limestones, dolomites and marls of the Tatra Mountains,
  • Limestones, sandstones, shales, radiolarites and marls of the Tatra Mountains,
  • Shales, mudstones and sandstones of the Podhale flysch [33,37].
Upstream of the Czorsztyn Niedzica reservoir, there are sands, gravels and river silts, as well as sands, gravels, alluvial soils, peats and silts, which are also observed in the catchment area downstream of this barrage. On the other hand, in the fragment of the catchment located in the vicinity of the Rożnów reservoir, sandstones with thin-bedded mudstones and claystones, as well as sandstones, shales, conglomerates, marls, minor claystones and mudstones, are leading in terms of lithology. Sandstones, mudstones and claystones, i.e., sediments from the same group, are also observed [33,37].

3.3. Hydraulic Structures

In the basins of the reservoirs Goczałkowice, Rożnów and Tresna, we observe numerous hydraulic structures (transverse and longitudinal) (Figure 4) built in order to protect against flooding, but also to reduce the amount of suspended load transported to them by the Vistula, the Dunajec and the Soła, respectively, along with their tributaries. The existing transverse structures are located in the riverbeds and the longitudinal structures mainly strengthen their banks.
The analyses carried out allowed for the conclusion that in the catchment area of the Vistula, up to the Goczałkowice reservoir, there are 351 transverse structures, of which over a third are located on the Vistula itself (126) (Figure 4). Very dense development (0.82 transverse structures per 1 km2 of the catchment area and 0.82 per 1 km of watercourses located in it (Table 4)) threshold corrections, steps and single weirs were designed to stabilise the riverbed and limit the movement of the sediment, significantly reducing the transport of the sediment. The largest structure in the upper part of the catchment is the frontal dam of the Wisła Czarne reservoir, with a total area of 0.41 km2 and a capacity of 4.044 million m3 (at the maximum damming level) [25]. It is worth noting that during the nearly 30 years of operation, it lost approximately 10% of its initial capacity [10]. There is a high concentration of transverse hydraulic structures on the tributaries of the Vistula, especially the Brennica, but also on the Biała Wisełka, Bładnica, Dobka, Kopydło and Malinka streams (Figure 4). In addition, along the entire length of the Vistula and its main tributaries, there are retaining walls limiting the supply of material from bank erosion (Figure 4).
In the catchment area of the Tresna reservoir, 512 transverse hydraulic structures were found (Figure 4), which include various types of weirs, thresholds, steps and debris barriers. There are 0.47 objects of this type per 1 km2 of the catchment area, and the indicator is 0.59 per 1 km of watercourses (Table 4). The specific location of individual objects is also visible, as there are only three weirs and one regulating barrage in the analysed section of the Soła (Figure 4). In addition, unlike the catchment area of the Goczałkowice and Rożnów reservoirs, there is no additional large retention reservoir upstream. In turn, as many as 71% of hydraulic structures were built on the direct tributaries of the Tresna reservoir and the Koszarawa river flowing into the Soła near the beginning of damming (Figure 4). Therefore, in the catchment area upstream of the Tresna reservoir, individual transverse structures are very rare and constitute only 29% of the total. At the same time, longitudinal hydraulic structures occur sporadically throughout the catchment area (Figure 4).
In the catchment area of the Rożnów reservoir there are 1758 hydraulic structures crossing the riverbeds: 1664 on the Polish side and only 94 in the Slovak part of the catchment (Figure 4). Such a large quantitative diversification, in comparison to the catchments of the Goczałkowice and Tresna reservoirs, results primarily from it having the largest catchment area amongst those analysed by far. However, this does not translate into the density of transverse development, which is the lowest among the analysed reservoirs, amounting to 0.36 per 1 km2 of the catchment area (Table 4). As in the Soła catchment, we note various types of weirs, thresholds, steps and debris dams. A large retention reservoir on the Dunajec river, i.e., Czorsztyn Niedzica, was built in this catchment. Its area is 12.3 km2, and the capacity at the maximum damming level reaches 238.553 million m3 [24]. It is part of a reservoir complex which also includes the Sromowce Wyżne equalising reservoir. This facility enables the operation of the Niedzica hydropower plant in the peak and pumped-storage mode. Therefore, the analysed area should be divided into two parts: upstream of the Czorsztyn Niedzica reservoir, where there are 416 regulatory structures, and downstream of it, up to the Rożnów reservoir with other structures. It is in the latter location that a much greater density of transverse hydraulic structures is visible, particularly on the larger tributaries (e.g., Czarna Woda, Kamienica, Słomka and Smolnik) (Figure 4). A small number of structures can also be observed on the Poprad river, which is the largest tributary within the analysed catchment. On the other hand, on the Dunajec itself, there are relatively few hydraulic structures: only 98, including the above mentioned Czorsztyn Niedzica reservoir (Figure 4). In the catchment area, there is also a linear infrastructure in the form of retaining walls, observed mainly in the vicinity of larger urbanised areas (in particular, the area of Nowy Sącz).

3.4. Land Use

Sedimentation processes in retention reservoirs occur most intensively in river valleys under the influence of anthropopressure [35]. That is why it is so important to determine the structure of land use in the basins of reservoirs in order to determine the human impact on the transport of suspended load and the related capacity loss.
When analysing the catchment area of the studied reservoirs, it was found that the catchment area of the Goczałkowice reservoir is the most urbanised area, where the urban fabric occupies 13% of the area (Table 5). For the Tresna and Rożnów reservoirs, the areas of such use account for 8.5% and 4.9% of the catchment area, respectively (Table 5). From built-up areas, surface runoff can be faster and more concentrated, thus delivering larger amounts of the sediment to watercourses. When considering land related to agriculture, the highest percentage of such use occurs in the catchment area of the Rożnów reservoir at 41.4%. For Goczałkowice, the value is slightly lower at37.1%, and for Tresna it is 28.3% (Table 5). However, arable land, which is important for the supply of suspended load, constitutes the majority of the catchment area of the Goczałkowice reservoir (Figure 5). The largest share in the area of all the analysed catchments are forests (Figure 5), typical of most mountain slopes in the Carpathians in Poland (except for the upper parts of the Tatra Mountains). In the catchment area of the Tresna reservoir, forest areas constitute more than half of the area (as much as 50.5%), in the catchment area of the Rożnów reservoir 45.6%, and the least in the catchment area of the Goczałkowice reservoir, at38.1% (Table 5). Forests reduce the rate of sediment delivery to rivers [35], and additionally, increased forest cover has a positive effect on water retention [38]. In the catchment area of the Tresna reservoir, an additional 10.7% is covered by scrub and/or herbaceous vegetation associations, which means that the total share of forest and semi natural areas in the total area is 61.2% (Table 5). In addition, in the catchment area of the Goczałkowice reservoir, a much higher share of areas covered with water, is visible (Figure 5), which is primarily due to the large area of the reservoir itself, but also, to a lesser extent, the presence of the Wisła Czarne reservoir and breeding ponds on the Vistula. For comparison, in the catchment area of the Rożnów reservoir, the areas covered by water take up only 0.8%, despite the presence of the complex of Czorsztyn Niedzica and Sromowce Wyżne reservoirs, which results from the large area of the entire analysed area. On the other hand, the share of other forms of land use is at a similar level in all the considered catchments, as exemplified by artificial, non-agricultural, vegetated areas (within the range of 0.2–0.3%) or inland wetlands (0.0–0.4%). In addition, they constitute a small percentage of the total analysed land (Figure 5).

3.5. Correlation of Indicators

Summing up the conducted analysis of anthropogenic pressures and natural impacts on the reservoirs Goczałkowice, Tresna and Rożnów, a list of individual tested elements was used: capacity changes, geological conditions, hydraulic structures and land use. Based on the collected and developed data, a two-stage assessment of the factors affecting the reduction of the retention capacity of the indicated reservoirs was carried out, identifying potentially the most important reasons for this condition. On this basis, the initial action was to prepare a matrix with scores for the components taken into account, and the second part was to carry out a spatial analysis in terms of key elements.
In the first stage, all of these factors were individually assessed, on the basis of which a score was assigned to each of them according to the following criteria:
  • Three points: the tested parameter was considered the most favourable among those taken into account,
  • Two points: the tested parameter was considered average among those taken into account,
  • One point: the tested parameter was considered the weakest among those taken into account.
Then, a collective summary of the obtained results was made, in which the reservoir with the highest number of points assigned was selected as having the best conditions in the catchment area. As a result of the assessment, the catchment of the Goczałkowice reservoir (10 points) was determined to be the most favourable for the functioning of the dam reservoir, which scored much better compared to the catchments of the Tresna (eight points) and Rożnów reservoirs (seven points) (Table 6). The best result is mainly due to a slight loss of capacity in relation to the initial capacity, the geological structure and the dense network of hydraulic structures on the Vistula and its tributaries, limiting the transport of bed load. Thus, the indicated elements were considered as potentially the main reason for the differences of the changes in water retention capacity in the analysed water reservoirs. However, special attention in this regard is required for hydraulic structures, within which a large variation is visible (Figure 4) and, in the opinion of the authors, is the main factor influencing the results of the research. A surprising conclusion regarding the impact of land use on silting of reservoirs is the fact that the least forested and most urbanised catchment area of the Goczałkowice reservoir is characterised by the most favourable parameters (Figure 5). This shows that in the case of examining the reasons for the loss of capacity in existing reservoirs and at the design stage of new ones, all of the above-mentioned factors should be treated collectively.
The obtained results are consistent with the calculated change in the capacity of the considered reservoirs (Table 2), but the difference in scores between the Tresna and Rożnów reservoirs is clearly smaller than the results of the loss of water storage capacity.
The confirmation of the above opinion is the result map from the GIS spatial analyses for individual factors (hydraulic structures), which were intersected and entered into the grid of basic fields. By analogy with the above methodology, appropriate ranks were assigned to the tested element, which were defined in terms of its impact on sediment transport to reservoirs (Table 7).
The hexagon verification showed significant differences in the hydrotechnical development of the studied catchments. Thus, it confirms the previously mentioned arrangements showing this element as critical for maintaining the capacity of the retention reservoirs in question, for their significant functions in water management, including counteracting the effects of drought. The catchment area of the Goczałkowice reservoir stands out positively, where areas occupy as much as 31.8% with the best parameters (with transverse buildings), 28.6% with medium parameters (with longitudinal structures), and 39.6% with poor parameters (without buildings) (Figure 6). The distribution of all classes is similar. Still, most importantly, over 60% of the area is covered by at least one hydrotechnical structure that positively impacts sediment transport. Within the catchment area of the Tresna reservoir, the share of places with the following parameters was calculated: 20.6% the best, 16.4% average, and 63.0% the worst (Figure 6). Therefore, we have a reverse situation than in the case of the Goczałkowice reservoir catchment, and almost two thirds of the surveyed area did not use any hydrotechnical structures. However, the catchment area of the Rożnów reservoir is by far the worst in this respect. Only 15.2% of the site is covered with transverse buildings (best conditions) and 7.8% with longitudinal facilities (average conditions) (Figure 6). As a result, on 77.1%, no hydrotechnical structures limit the supply of sediment to the Rożnów reservoir, affecting the loss of its capacity. This result is worse by 14.1 percentage points than the catchment area of the Tresna reservoir, and as much as 37.5 percentage points (almost twice) than the catchment area of the Goczałkowice reservoir.

4. Discussion

Water reservoirs can be used to counteract the effects of drought, but they are also designed to achieve many other goals, such as flood protection, irrigation, municipal and industrial water supply, hydropower, water quality management, and recreation. Therefore, management of a multi-purpose reservoir is a complex process due to the potential conflict of interest between these objectives [39]. Particularly large reservoirs reduce the frequency of hydrological droughts, shortening their duration and severity by storing water during floods and releasing it during the dry season [40]. Acting in this way, we increase water resources and reduce surface runoff in favour of ground runoff. Thus, during droughts, water reservoirs play an important role in regulating flows to meet the established water needs [41]. Therefore, increasing the potential conditions for water retention, i.e., the systemic ability to accumulate water resources and keep them for a longer time in the biotic and abiotic environment, is the optimal action to adapt to the effects of climate change and to mitigate these changes [42]. The climatic scenarios for Poland show that an intensification of extreme hydrological and meteorological phenomena, including long-term periods of drought, should be expected [43].
The ongoing and forecast changes in meteorological and climatic conditions will potentially affect the performance of the above-mentioned functions by retention reservoirs. The processes taking place in the catchment, related to the supply of sediment to reservoirs and its accumulation, may also contribute to limiting the possibility of their implementation, affecting the loss of capacity of reservoirs located in southern Poland: Goczałkowice on the Vistula, Rożnów on the Dunajec and Tresna on the Soła.
There is no doubt that geological conditions are an important factor for the design of a given reservoir and its correct location, particularly affecting its stability during the period of use. The geological structure of the catchment basins of the analysed reservoirs does not differ enough to be the most important reason for the loss of reservoir capacity. Therefore, the conducted research shows that human activity is the basic factor of the observed changes. Anthropogenic impacts on the natural environment are noticeable in the transport of suspended load (constituting the main clastic material moved by the Carpathian rivers), showing that it is retained in the Rożnów and Tresna reservoirs. As a result of human activity, initially increased and then decreased soil erosion in catchments and watercourse beds is noticeable, as well as increasing land development and urbanisation of individual areas, but also building hydraulic structures in catchments and river beds [26].
Land use, including, above all, the presence of forests in the catchment, is presented by many researchers as the basic element determining the limitation of sediment supply of water reservoirs, affecting their retention capacity. In forested areas, less sediment is displaced as a result of surface runoff than in areas used for agricultural purposes, and thus, the effective use of reservoirs located in the lower parts of the Outer Western Carpathians is much shorter than facilities built in higher parts, including the upper forested sections of the Beskids [35]. Interestingly, in places of forest felling (with a high density of used dirt roads), similar results with the neighbouring agricultural areas may be recorded, and the most rapid changes occur as a result of the progressing urbanisation of the catchment [13]. The obtained information shows that some human activities, carried out in the analysed area since the mid-20th century, resulted in positive changes, including, above all, afforestation of areas no longer used for agriculture and the creation of orchards and plantations of fruit bushes. Their result is a significant decrease in sediment transport in rivers [26]. In addition, land use (both the entire catchment area and the areas directly adjacent to the reservoir) is an important causative factor also affecting the quality of water in dammed reservoirs [44].
The obtained results show hydraulic structures in the catchment area upstream of the reservoir are a very important factor in the transport of sediment, both on the section of the river where the barrage is located, and on the tributaries. Densely located dams on the Vistula and its tributaries upstream of the Goczałkowice reservoir cause a significant reduction in the transport of suspended load. As a result, the average annual rate of capacity loss is 0.027 million m3, which is 1.1% of the initial capacity [10]. In the catchments of the Rożnów and Tresna reservoirs, there is a lower density of transverse and longitudinal developments in river, stream beds and floodplains, which results in a much larger volume of clastic material entering the reservoirs.
As indicated by Kondolf et al. [4] and Randle et al. [3], basic methods of sediment management assume three categories of approaches that focus on balancing sediment outflows and inflows to stabilise reservoir capacity:
  • Reduce sediment yield entering the reservoir (watershed management practices).
  • Route sediments through or around the reservoir to minimise sediment deposition within the reservoir (sediment pass-through or bypassing).
  • Remove sediments already deposited in the reservoir (drawdown flushing or dredging).
In connection to the data obtained for the studied reservoirs in Poland, in order to extend the service life of dam reservoirs, i.e., the possibility of retaining a certain amount of water for the purpose of performing the functions for which they were designed, the use of hydraulic structures should be considered, as exemplified by the effective operation of structures found in the catchment area of the Goczałkowice reservoir. They effectively reduce the transport of suspended load, therefore every effort should be made to maintain them properly. The recommended course of action is also the development of hydraulic structures in the catchment area of the Różnów and Tresna reservoirs, i.e., on the Dunajec and Soła rivers, along with their tributaries, respectively. This will result in a reduction of sediment supplied to both objects, which is consequently largely accumulated within them, according to the presented results. When implementing this proposal, it should be remembered that due to the location of a transverse structure on the watercourse, located in the bottom of the river, the transport of mineral and organic matter is disturbed. Therefore, it is necessary to take measures simultaneously to limit the interference of these types of hydraulic structures in the river ecosystem, as well as to provide for compensatory measures [45]. At the same time, it is suggested to take a broader approach to the proposal of using technical measures in basins of reservoirs by drawing up a strategic or planning document, comprehensively discussing the issue of sediment management in river basins. In addition, when analysing the location conditions of a potential new retention reservoir, it would be necessary to combine the analyses at the pre-design and design stages, by proposing appropriate hydraulic structures in the catchment area, which would constitute a comprehensive investment measure affecting the operational efficiency of a given facility. An essential element in these considerations, despite the lack of clear indications in the present study, is also land use. The experience of other researchers speaks for the need to address this issue. For example, the silting rate of the Porąbka reservoir on the Soła decreased more than 20 times after filling the analysed Tresna reservoir [13], which took over the main supply of suspended load and further reduced its transport to a minimum. Therefore, the construction of new, deep reservoirs could be one of the elements of preparation for the assumed climate changes and the risk of hydrological drought.
The above recommendations are proposed to be implemented in the context of counteracting the effects of drought. In this regard, it is advisable to maintain the initial parameters of retention reservoirs, i.e., to maintain the designed capacity, as far as possible. It is important for the performance of specific functions by a given facility related to water management and the implementation of economic and social tasks, as well as for the needs of subsequent shortages in dry periods and increasing the value of flows on sections of rivers located downstream of barrages. Such action is also desirable due to the observed delays in the reaction of the hydrological conditions in the catchment to the current meteorological situation, e.g., the occurrence of normal (multi-year average) rainfall may not lead to adequate flows in rivers [46]. In addition, the technical measures of the catchment basins of individual reservoirs presented in the article could slow down the outflow of meltwater and rainwater, and maintain appropriate water conditions (soil moisture) necessary for agriculture and forestry in the long term to increase the retention capacity. However, this must be combined with continuous monitoring and forecasting the periods of occurrence of hydrological drought, their range and intensity (scale of the observed situation).
It should also be remembered that this type of research in reservoir catchments, apart from the indicated positive aspects, is also characterised by various limitations. The critical element is the already stated availability of data and their reliability. The authors’ most significant challenge was data unification between the Polish and Slovak sides. This mainly concerned database attributes. The databases of individual countries differ, and it would be a good practice to prepare supra-regional materials (in this case, for the European Union). It was also planned to publish a lithological map, but the terminology and graphic design used were different, making it impossible to publish it in a qualitative form. In studying river processes, the volume of sediment delivered to the reservoirs and the degree of its accumulation is also essential. In Poland, the hydrological service carried out the last measurements in the 1980s. Since then, no work has been carried out in this area, which means that it is necessary to rely on possibly outdated and unreliable data when analysing sediment transport.

5. Conclusions

The current practice of continuously filling the studied reservoirs with sediment is unsustainable. These reservoirs have no capacity to retain sediment indefinitely, and without proper management, sedimentation will eventually deprive them of their original functions.
Achieving sustainable use of domestic water resources requires better data collection from monitoring the capacity of reservoirs and the supply of sediments from catchments, changes in the operation of damming structures, and modification of the law regulating the use of the environment.
In the era of climate change, the construction and maintenance of multifunctional reservoirs are the basis for water retention in order to protect against hydrological drought. Therefore, in terms of the existing reservoirs in Poland, it is necessary to maintain adequate water storage capacity. Based on the analysed causes of changes in the capacity of dam reservoirs in Poland (Goczałkowice on the Vistula, Rożnów on the Dunajec and Tresna on the Soła), it was shown that the solution that effectively reduces the transport of suspended sediment and is worth implementing in other areas is the use of appropriate hydraulic structures in the catchments of the reservoirs.
The analysis of land use forms of the studied catchments did not clearly indicate the importance of this factor for the reservoirs in question. This does not mean, however, that this aspect has no impact on fluvial processes, but it emphasises the need to check land cover changes in a broader time perspective, including the verification of land use in various periods of operation for a given reservoir. It also shows that a catchment is a set of communicating vessels and all conditions should be considered comprehensively.
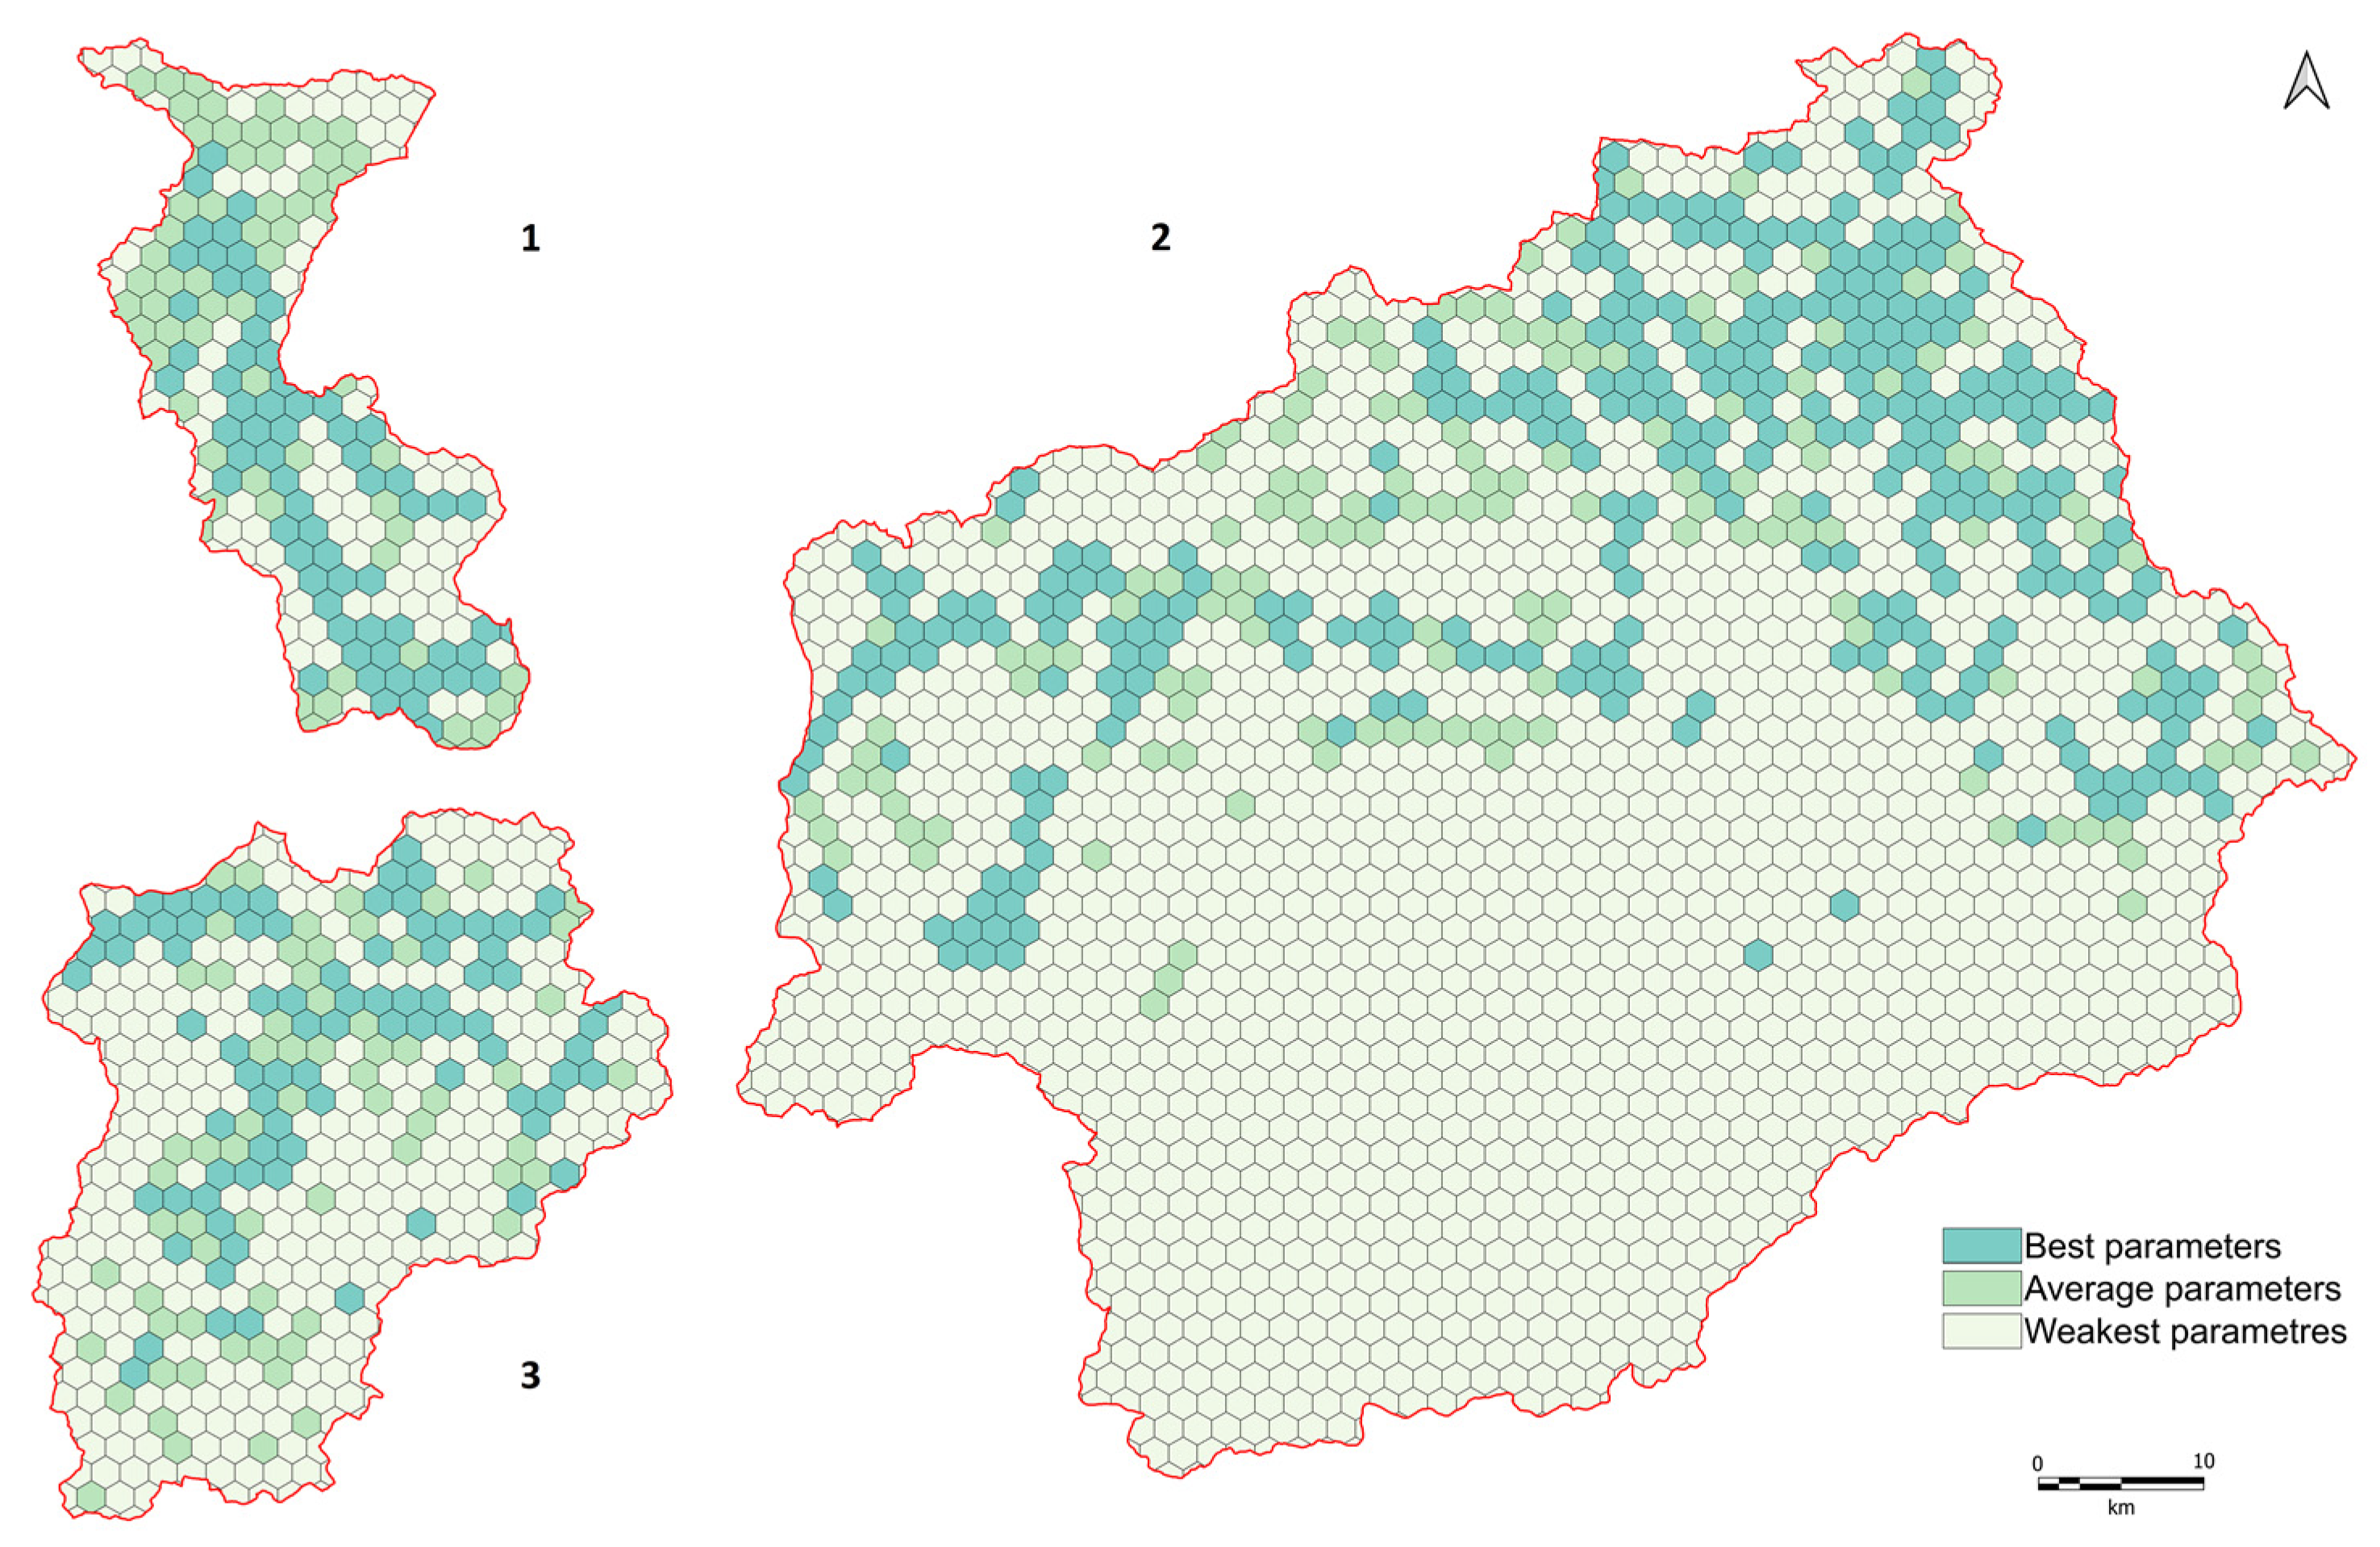
The development of GIS tools for conducting spatial analyses and hydraulic modelling is necessary to expand the scope of research into the causes of changes in the capacity of retention reservoirs. As our research has shown, the use of basic hexagonal grids, with the classification of their parameters using natural breaks, enabled us to determine both the degree of anthropogenic pressure on various elements and natural elements within the selected catchments.

Author Contributions

Conceptualisation, M.M., Ł.P. and D.A.; methodology, M.M. and Ł.P.; validation, D.A.; formal analysis, D.A. and M.M.; investigation, Ł.P and M.M..; resources, Ł.P.; writing—original draft preparation, Ł.P., M.M and D.A.; writing—review and editing, D.A, and Ł.P.; visualisation, M.M. and Ł.P.; supervision, D.A.; funding acquisition, D.A. All authors have read and agreed to the published version of the manuscript.

Funding

This research received no external funding.

Institutional Review Board Statement

The study did not require ethical approval.

Informed Consent Statement

Not applicable.

Data Availability Statement

Publicly available data sets were analysed in this study. These data can be found here: www.sedhyd.org/reservoir-sedimentation/National%20Res%20Sed%20White%20Paper%202019-06-21.pdf (accessed on 1 April 2022), https://infoscience.epfl.ch/record/147714 (accessed on 1 April 2022), https://eur-lex.europa.eu/legal-content/EN/TXT/?uri=celex%3A32000L0060 (accessed on 19 January 2023), https://www.europarl.europa.eu/RegData/docs_autres_institutions/commission_europeenne/com/2007/0414/COM_COM(2007)0414_EN.pdfhttps://www.europarl.europa.eu/RegData/docs_autres_institutions/commission_europeenne/com/2007/0414/COM_COM(2007)0414_EN.pdf (accessed on 19 January 2023), https://isap.sejm.gov.pl/isap.nsf/DocDetails.xsp?id=WDU20210001615 (accessed on 1 April 2022), https://hydro.imgw.pl/#map/19.5,51.5,7,true,false,false,true,false,false,- (accessed on 1 April 2022), https://www.geoportal.gov.pl/dane/baza-danych-obiektow-topograficznych-bdot (accessed on 1 April 2022 https://geoportal.gov.sk/sk/cat-client (accessed on 1 April 2022), http://geoportal.pgi.gov.pl/portal/page/portal/PIGMainExtranet (accessed on 1 April 2022), https://www.geology.sk/?lang=en (accessed on 1 April 2022), https://dane.gov.pl/pl/dataset/2167,mapa-podzialu-hydrograficznego-polski-w-skali-110 (accessed on 1 April 2022), http://isap.sejm.gov.pl/isap.nsf/DocDetails.xsp?id=WMP20190000941 (accessed on 1 April 2022), https://isap.sejm.gov.pl/isap.nsf/DocDetails.xsp?id=WDU20220002625 (accessed on 20 January 2023), https://eur-lex.europa.eu/legal-content/PL/TXT/?uri=CELEX%3A32007L0060 (accessed on 20 January 2023), https://isap.sejm.gov.pl/isap.nsf/DocDetails.xsp?id=WDU20160001841 (accessed on 20 January 2023).

Acknowledgments

The authors would like to thank Thomas Riley, BA Hons English Literature, University of Central Lancashire, UK for editing of English language and linguistic correction of the paper.

Conflicts of Interest

The authors declare no conflict of interest.

References

  1. Stefanyshyn, D. Probability assessment of the Kyiv reservoir overflow. Environ. Saf. Nat. Resour. 2022, 40, 73–99. [Google Scholar] [CrossRef]
  2. Bekri, E.S.; Economou, P.; Yannopoulos, P.C.; Demetracopoulos, A.C. Reassessing Existing Reservoir Supply Capacity and Management Resilience under Climate Change and Sediment Deposition. Water 2021, 13, 1819. [Google Scholar] [CrossRef]
  3. Randle, T.J.; Morris, G.L.; Tullos, D.D.; Weirich, F.H.; Kondolf, G.M.; Moriasi, D.N.; Annandale, G.W.; Fripp, J.; Minear, J.T.; Wegner, D.L. Sustaining United States reservoir storage capacity: Need for a new paradigm. J. Hydrol. 2021, 602, 126686. [Google Scholar] [CrossRef]
  4. Kondolf, G.M.; Gao, Y.; Annandale, G.W.; Morris, G.L.; Jiang, E.; Zhang, J.; Cao, Y.; Carling, P.; Fu, K.; Guo, Q.; et al. Sustainable sediment management in reservoirs and regulated rivers: Experiences from five continents. Earth’s Future 2014, 2, 256–280. [Google Scholar] [CrossRef]
  5. Randle, T.; Morris, G.; Whelan, M.; Baker, B.; Annandale, G.; Hotchkiss, R.; Boyd, P.; Minear, J.T.; Ekren, S.; Collins, K.; et al. Reservoir Sediment Management: Building a Legacy of Sustainable Water Storage Reservoirs, White Paper, 57 pp., Natl. Reservoir Sediment. Sustainability Team. 2019. Available online: www.sedhyd.org/reservoir-sedimentation/National%20Res%20Sed%20White%20Paper%202019-06-21.pdf (accessed on 15 December 2022).
  6. Wisser, D.; Frolking, S.; Hagen, S.; Bierkens, M.F.P. Beyond peak reservoir storage? A global estimate of declining water storage capacity in large reservoirs. Water Resour. Res. 2013, 49, 5732–5739. [Google Scholar] [CrossRef]
  7. Lee, F.-Z.; Lai, J.-S.; Sumi, T. Reservoir Sediment Management and Downstream River Impacts for Sustainable Water Resources—Case Study of Shihmen Reservoir. Water 2022, 14, 479. [Google Scholar] [CrossRef]
  8. Ayele, G.T.; Kuriqi, A.; Jemberrie, M.A.; Saia, S.M.; Seka, A.M.; Teshale, E.Z.; Daba, M.H.; Ahmad Bhat, S.; Demissie, S.S.; Jeong, J.; et al. Sediment Yield and Reservoir Sedimentation in Highly Dynamic Watersheds: The Case of Koga Reservoir, Ethiopia. Water 2021, 13, 3374. [Google Scholar] [CrossRef]
  9. Lenzi, M.A.; Picco, L.; Moretto, J. Sediment Management—WP7 Report. Project: SedAlp “Sediment Management in Alpine basins: Integrating Sediment Continuum, Risk Mitigation and Hydropower”. 2015. [Google Scholar] [CrossRef]
  10. Pieron, Ł.; Absalon, D.; Habel, M.; Matysik, M. Inventory of Reservoirs of Key Significance for Water Management in Poland—642 Evaluation of Changes in Their Capacity. Energies 2021, 14, 7951. [Google Scholar] [CrossRef]
  11. Schleiss, A.J.; De Cesare, G.; Althaus, J.J. Verlandung der Stauseen gefährdet die nachhaltige Nutzung der Wasserkraft. Wasser Energ. Luft 2010, 102, 31–40. Available online: https://infoscience.epfl.ch/record/147714 (accessed on 15 December 2022).
  12. Mazhar, N.; Mirza, A.I.; Abbas, S.; Akram, M.A.N.; Ali, M.; Javid, K. Effects of climatic factors on the sedimentation trends of Tarbela Reservoir, Pakistan. SN Appl. Sci. 2021, 3, 122. [Google Scholar] [CrossRef]
  13. Łajczak, A. Contemporary transport and sedimentation of the material floating in the Vistula and its tributaries. Monogr. Kom. Gospod. Wodnej PAN 1999, 15, 215. [Google Scholar]
  14. Sinha, R.; Nepal, S.; Uddin, K. Understanding Sediment Management. Int. Cent. Integr. Mt. Dev. 2018. Available online: https://lib.icimod.org/record/33718/files/icimodKoshiSediments.pdf (accessed on 15 December 2022).
  15. Arif, M.; Jiajia, L.; Dongdong, D.; Xinrui, H.; Qianwen, G.; Fan, T.; Songlin, Z.; Changxiao, L. Effect of topographical features on hydrologically connected riparian landscapes across different land-use patterns in colossal dams and reservoirs. Sci. Total Environ. 2022, 851, 158131. [Google Scholar] [CrossRef] [PubMed]
  16. Directive 2000/60/EC of the European Parliament and of the Council of 23 October 2000 Establishing a Framework for Community Action in the Field of Water Policy. Available online: https://eur-lex.europa.eu/legal-content/EN/TXT/?uri=celex%3A32000L0060 (accessed on 19 January 2023).
  17. Communication from the Commission to the European Parliament and the Council Addressing the Challenge of Water Scarcity and Droughts in the European Union. 2007. Available online: https://www.europarl.europa.eu/RegData/docs_autres_institutions/commission_europeenne/com/2007/0414/COM_COM (accessed on 19 January 2023).
  18. Regulation of the Minister of Infrastructure of 15 July 2021 on the adoption of the Drought Effects Counteracting Plan. Available online: https://isap.sejm.gov.pl/isap.nsf/DocDetails.xsp?id=WDU20210001615 (accessed on 1 April 2022).
  19. Journal of Law 2016 Item 1911 Flood Risk Management Plan for the Vistula Basin Area. Available online: https://isap.sejm.gov.pl/isap.nsf/DocDetails.xsp?id=WDU20160001841 (accessed on 20 January 2023).
  20. Directive 2007/60/EC of the European Parliament and of the Council of 23 October 2007 on the Assessment and Management of Flood Risks. Available online: https://eur-lex.europa.eu/legal-content/PL/TXT/?uri=CELEX%3A32007L0060 (accessed on 20 January 2023).
  21. Journal of Law 2022 Item 2625 Water Law. Available online: https://isap.sejm.gov.pl/isap.nsf/DocDetails.xsp?id=WDU20220002625 (accessed on 20 January 2023).
  22. Soja, R. Hydrological aspects of anthropopresion in the Polish Carpatian. Pr. Geogr. IGiPZ PAN 2002, 186, 30. [Google Scholar]
  23. Stolarska, M.; Matysik, M.; Absalon, D.; Czernecki, B.; Bernadowska, A.; Łukasiewicz, G. Raport: Zmiany Klimatu a Zasoby Wody na Żywiecczyźnie. Jak je Skutecznie Chronić I Budować. [Climate Change and Water Resources in the Żywiec Region]. 2021. Available online: https://www.dbamyowode.pl/raport-zmiany-klimatu-a-zasoby-wody-na-zywiecczyznie/ (accessed on 15 January 2021).
  24. Regional Water Management Authority in Kraków, State Water Holding Polish Waters Data—E-mail Dated 26 March 2021 and 9 April 2021.
  25. Regional Water Management Authority in Gliwice, State Water Holding Polish Waters Data—E-mail dated 2 April 2021.
  26. Łajczak, A.; Babiński, Z.; Falkowski, T.; Gierszewski, P.; Habel, M.; Plit, J.; Soja, R.; Szmańda, J. Współczesne Przemiany Rzeźby Koryta i Równiny Zalewowej Wisły. [Contemporary Transformations of the Relief of the River Bed and Floodplain of the Vistula River] W: Współczesne Przemiany Rzeźby Polski. Bogucki Wydawnictwo Naukowe 2021, 625–680. [Google Scholar] [CrossRef]
  27. Wrzesiński, D. Identification of features of the river outflow regime in Poland at different levels of grouping. Bad. Fizjogr. Nad Pol. Zach. 2017, 68, 253–264. [Google Scholar] [CrossRef]
  28. Institute of Meteorology and Water Management—National Research Institute Data. Available online: https://hydro.imgw.pl/#map/19.5,51.5,7,true,false,false,true,false,false,- (accessed on 1 April 2022).
  29. Woś, K.; Radoń, R.; Tekielak, T.; Wrzosek, K.; Pieron, Ł.; Piórecki, M. Role of Multifunctional Water Reservoirs in the Upper Vistula Basin in Reducing Flood Risk. Water 2022, 14, 4025. [Google Scholar] [CrossRef]
  30. Database of Topographic Objects (BDOT10k). Available online: https://www.geoportal.gov.pl/dane/baza-danych-obiektow-topograficznych-bdot (accessed on 1 April 2022).
  31. National Geoportal. Available online: https://geoportal.gov.sk/sk/cat-client (accessed on 1 April 2022).
  32. Hydrological Yearbook of Surface Water—The Oder Basin and the Rivers of the Coast Region between the Oder and Vistula; Wydaw Komunikacji i Łączności: Warszawa, Poland, 1979; pp. 395–415.
  33. Detailed Geological Map of Poland. Available online: http://geoportal.pgi.gov.pl/portal/page/portal/PIGMainExtranet (accessed on 1 April 2022).
  34. CORINE Land Cover. Available online: https://clc.gios.gov.pl/ (accessed on 1 April 2022).
  35. Łajczak, A. A study on the silting of selected dam reservoirs in the Vistula basin. Monogr. Kom. Gospod. Wodnej PAN 1995, 8, 106. [Google Scholar]
  36. Map of the Hydrographic Division of Poland in the Scale of 1:10,000. Available online: https://dane.gov.pl/pl/dataset/2167,mapa-podzialu-hydrograficznego-polski-w-skali-110 (accessed on 1 April 2022).
  37. Geological Map of Slovakia 1:50000. Available online: https://www.geology.sk/?lang=en (accessed on 1 April 2022).
  38. Wojkowski, J.; Wałęga, A.; Radecki-Pawlik, A.; Młyński, D.; Lepeška, T. The influence of land cover changes on landscape hydric potential and river flows: Upper Vi stula, Western Carpathians. CATENA 2022, 210, 105878. [Google Scholar] [CrossRef]
  39. Lin, N.M.; Rutten, M. Optimal Operation of a Network of Multi-purpose Reservoir: A Review. Procedia Eng. 2016, 154, 1376–1384. [Google Scholar] [CrossRef]
  40. Wu, J.; Yuan, X.; Yao, H.; Chen, X.; Wang, G. Reservoirs regulate the relationship between hydrological drought recovery water and drought characteristics. J. Hydrol. 2021, 603, 127127. [Google Scholar] [CrossRef]
  41. Chang, F.-J.; Wang, K.-W. A systematical water allocation scheme for drought mitigation. J. Hydrol. 2013, 507, 124–133. [Google Scholar] [CrossRef]
  42. Journal of Law 2019 Item 92 (Uchwała nr 92 Rady Ministrów z dnia 10 Września 2019 r. w Sprawie Przyjęcia Założeń do Programu Przeciwdziałania Niedoborowi Wody na Lata 2021–2027 z Perspektywą do Roku 2030). Available online: http://isap.sejm.gov.pl/isap.nsf/DocDetails.xsp?id=WMP20190000941 (accessed on 1 April 2022).
  43. Pieron, Ł.; Wujek, A. Development of small water retention in Poland—implementation of assumptions to the Water Resource Development Program. Gospod. Wodna 2022, 5, 29–32. [Google Scholar]
  44. Matysik, M.; Absalon, D.; Habel, M.; Maerker, M. Surface water quality analysis using CORINE data: An application to assess reservoirs in Poland. Remote Sens. 2020, 12, 979. [Google Scholar] [CrossRef] [Green Version]
  45. Europejskie Regionalne Centrum Ekohydrologii Polskiej Akademii Nauk. Environmental Guidelines for the Use of Ecohydrology for Planning and Designing Investments Aimed at Improving the Navigability of the Odra River. 2019. Available online: https://odw-rozwoj.pl/wytyczne-srodowiskowe-dotyczace-zastosowania-ekohydrologii-dla-planowania-i-projektowania-inwestycji-majacych-na-celu-poprawe-zeglownosci-rzeki-odry (accessed on 15 December 2022).
  46. Tokarczyk, T.; Szalińska, S.; Walczykiewicz, T.; Adynkiewicz-Piragas, M. Drought: Causes, propagation and consequences—part II. Gospod. Wodna 2022, 5, 9–17. [Google Scholar]
Figure 1. Location of the analysed reservoirs in Poland (A) against the river network (B), the main river basins and first-order watersheds (C) and main cities (D). The basic parameters of the reservoirs listed on the map are given in Table 1. The background of the map are areas at the following risk of hydrological drought: weak (E), moderate (F), high (G) and extreme (H) [18]. Reservoirs: Goczałkowice, Rożnów, Tresna.
Water 15 00597 g001
Figure 2. Location of the analysed reservoirs and measuring points for sediment transport against the background of the hydrographic network and main catchments. Elaboration based on data from [36].
Water 15 00597 g002
Figure 3. Location of the analysed reservoirs against the background of geological units [33,37].
Water 15 00597 g003
Figure 4. Hydraulic structures of the catchment basin of the reservoirs Goczałkowice, Rożnów and Tresna. Elaboration based on data from [30,31].
Water 15 00597 g004
Figure 5. Land use structure of the catchment area of the Goczałkowice, Rożnów and Tresna reservoirs.Elaboration based on data from [34]. CLC Classification: 1.1 = urban fabric, 1.2 = industrial, commercial and transport units, 1.3 = mine, dump and construction sites, 1.4 = artificial, non-agricultural vegetated areas, 2.1 = arable land, 2.2 = permanent crops, 2.3 = pastures, 2.4 = heterogeneous agricultural areas, 3.1 = forests, 3.2 = scrub and/or herbaceous vegetation associations, 3.3 = open spaces with little or no vegetation, 4.1 = inland wetlands, 5.1 = inland waters.
Water 15 00597 g005
Figure 6. Correlation of the factor hydraulic structures affecting the change in the capacity of retention reservoirs. Own study based on data from [30,31,32]. Basin of the reservoirs: 1. Goczałkowice, 2. Rożnów, 3. Tresna.
Water 15 00597 g006
Table 2. Size and rate of capacity loss of the analysed reservoirs.
IDReservoirRiverCapacity ChangesAverage Annual Rate of Capacity LossTime to Loss from Initial Capacity [Years]
M m3%M m3%50%80%
1GoczałkowiceWisła−1.80−1.10.0270.0229244679
2RożnówDunajec−72.93−31.90.09230.404572
3TresnaSoła−9.30−9.10.1720.17242387
Source: own study based on [10].
Table 3. The volume of sediment delivered to the analysed reservoirs, and the degree of its accumulation.
ReservoirMeasurement PointSediment Transport in Given Years [t]
Gauging StationLocation vs. ReservoirBasin Area [km2]197919811983Average Value 1979–1983
GoczałkowiceSkoczówUpstream2972950288017302520
GoczałkowiceDownstream738743015,30010,60011,110
Difference4414480 (+152%)12,420 (+431%)8870 (+513%)8590
RożnówNowy SączUpstream4342117,000140,000332,00019,633
RożnówDownstream48661220021,200no data16,700
Difference524−104,800 (−90%)−118,800 (−85%)-−111,800
TresnaŻywiecUpstream78510,60026,300211,00082,633
OświęcimDownstream13861100no datano data1100
Difference601−9500 (−90%)--−9500
Source: own study based on [32].
Table 4. Occurrence of transverse hydraulic structures on watercourses in the catchment basin of the reservoirs Goczałkowice, Rożnów and Tresna.
IDReservoirRiverNumber of Transverse Structures in the River CorridorTransverse Density Index of the Hydraulic Structures Converted Into:
1 km2 of the Catchment Area1 km of Watercourses in the Catchment
1GoczałkowiceWisła3510.820.82
2RożnówDunajec17580.360.55
3TresnaSoła5120.470.59
Source: own study based on data from [30,31,38].
Table 5. Land use structure in the catchment basins of the Goczałkowice, Rożnów and Tresna reservoirs.
IDReservoirShare of CLC Land Use Groups in the Catchment Area [%]
1.11.21.31.42.12.22.32.43.13.23.34.15.1
1Goczałkowice13.00.70.00.321.10.03.312.738.12.90.00.47.5
2Rożnów4.90.40.10.317.00.512.411.545.64.31.90.20.8
3Tresna8.50.80.00.212.70.010.45.250.510.70.00.00.9
Source: own study based on data from [34]. CLC Classification: 1.1 = urban fabric, 1.2 = industrial, commercial and transport units, 1.3 = mine, dump and construction sites, 1.4 = artificial, non-agricultural vegetated areas, 2.1 = arable land, 2.2 = permanent crops, 2.3 = pastures, 2.4 = heterogeneous agricultural areas, 3.1 = forests, 3.2 = scrub and/or herbaceous vegetation associations, 3.3 = open spaces with little or no vegetation, 4.1 = inland wetlands, 5.1 = inland waters.
Table 6. Matrix of anthropogenic pressures and natural impacts on retention reservoirs Goczałkowice, Rożnów and Tresna.
IDReservoirRiverCapacity ChangesGeological ConditionsHydraulic StructuresLand UseTotal
1GoczałkowiceWisła333110
2RożnówDunajec12227
3TresnaSoła22138
Scoring: 3 = the best parameters, 2 = average parameters, 1 = the weakest parameters.
Table 7. Ranks of the analysed factor (hydraulic structures) in terms of limiting the transport of sediment to the reservoir.
Hydraulic StructuresParameter ClassificationThe Determined Value of the Analysed Factor
TransverseBest parameters3
LongitudinalAverage parameters2
NoneWeakest parameters1
Disclaimer/Publisher’s Note: The statements, opinions and data contained in all publications are solely those of the individual author(s) and contributor(s) and not of MDPI and/or the editor(s). MDPI and/or the editor(s) disclaim responsibility for any injury to people or property resulting from any ideas, methods, instructions or products referred to in the content.

