Article

KDE-Based Rainfall Event Separation and Characterization

1
School of Civil Engineering, Shandong University, Jinan 250061, China
2
Department of Civil and Environmental Engineering, Politecnico di Milano, 20133 Milano, Italy
*
Author to whom correspondence should be addressed.
Water 2023, 15(3), 580; https://doi.org/10.3390/w15030580
Submission received: 31 December 2022 / Revised: 27 January 2023 / Accepted: 29 January 2023 / Published: 1 February 2023
(This article belongs to the Special Issue Urban Stormwater Control, Utilization, and Treatment)

Abstract

:
Rainfall event separation is mainly based on the selection of the minimum inter-event time (MIET). The traditional approach to determining a suitable MIET for estimating the probability density functions is often using the frequency histograms. However, this approach cannot avoid arbitrariness and subjectivity in selecting the histogram parameters. To overcome the above limitations, this study proposes a kernel density estimation (KDE) approach for rainfall event separation and characterization at any specific site where the exponential distributions are suitable for characterizing the rainfall event statistics. Using the standardized procedure provided taking into account the Poisson and Kolmogorov–Smirnov (K-S) statistical tests, the optimal pair of the MIET and rainfall event volume threshold can be determined. Two climatically different cities, Hangzhou and Jinan of China, applying the proposed approach are selected for demonstration purposes. The results show that the optimal MIETs determined are 12 h for Hangzhou and 10 h for Jinan while the optimal event volume threshold values are 3 mm for both Hangzhou and Jinan. The KDE-based approach can facilitate the rainfall statistical representation of the analytical probabilistic models of urban drainage/stormwater control facilities.

1. Introduction

Rainfall is one of the most important input variables in hydrologic models. Considering the behavior of rainfall intermittency [1], many hydrologic studies on modelling and analysis adopt the use of rainfall events [2]. Event-based modelling techniques are widely applied in the urban drainage design which requires the rainfall event statistics as the input of the hydrologic model [3]. As rainfall event characteristics are key factors in the hydrologic analysis and design of urban drainage system [4], the statistical analysis of rainfall events plays an important role in the urban stormwater management [5]. The partition of rainfall series into events is of vital importance for the characterization of rainfall events, which may further affect the accuracy of the simulated/derived hydrologic variables [6] or the sizing of the stormwater control infrastructures [7].
The analytical probabilistic approach is a useful method in the urban drainage system design [8,9] in addition to the continuous simulation [10,11] and the design storm event-based simulation [12,13]. The analytical probabilistic approach can not only integrate the merits of the probabilistic reliability of continuous simulations and simplicity of design storm methods [14], but also trade off the model complexity and performance [15]. The wide applications of analytical probabilistic models in urban drainage system analysis involve the fields of the frequency analysis of runoff volumes [6] and flood peaks [12], evaluation of water quality control performance [8], hydrologic design of the end-of-pipe storage facilities [16], sizing of low impact development facilities [9,14,17], etc. All the above-described studies employing the analytical probabilistic approach are dependent upon proper rainfall event characterization. Therefore, the approach to rainfall event characterization forms the basis of analytical derivations in the hydrologic modelling.
The rainfall event characteristics can be obtained by the statistical frequency analysis of the individual rainfall events resulting from the separation of the observed continuous rainfall series with a selected minimum inter-event time (MIET, also referred to as the inter-event time definition in some of the literature) and a threshold of minimum rainfall event volume (denoted as rainfall event volume threshold) [18]. These rainfall events are usually characterized by rainfall event depth, event duration, and inter-event time [1,16]. It has been adopted worldwide that the probability density function (PDF) of an exponential probability distribution function can favorably fit the observed frequency distributions of the three characteristics [3,5,19,20,21]. The exponential PDF has the advantage of analytical tractability for derivations compared to other types of distributions [22]. With a pair of selected MIET and rainfall event volume threshold values, the rainfall event characterization can be completed, and the fitted PDF can be determined. However, it is difficult to propose a universal procedural criterion of selecting the appropriate MIET and rainfall event volume threshold values for any location of interest.
The conventional approaches to estimating MIET can be generally classified into three types, namely, the autocorrelation analysis, average annual number of events analysis, and coefficient of variation analysis. Refs. [3,23] proposed similar concepts of autocorrelation coefficient based on the lag time which represents the temporal spacing between the observations; the lag time when it causes autocorrelation function sufficiently close to zero is then defined as MIET. Refs. [24,25] determined the suitable MIET according to the principle that the average annual event number corresponding to the increasing value of MIET diminishes and approaches an essentially unchanged number. Ref. [1] assumed that the probability density of MIET follows an exponential distribution, and the appropriate MIET can be obtained while the coefficient of variation is equal to one. These three approaches have the limitations of not providing mathematically standardized procedures and lacking reliable statistical tests. In addition, there is no unified way to determine the rainfall event volume threshold. Since events with a total depth less than hydrological loss do not produce any runoff, it is necessary to apply the rainfall event volume threshold in the rainfall event characterization [6,22,26]. Ref. [6] chose a rainfall event volume threshold of 1 mm and discovered that the exponential PDF fits well with the observed frequency distributions. The recommended values of the rainfall event volume threshold that is suitable for the urban environment is usually no greater than 5 mm [8,18,22,27].
Frequency histogram is the most widely used way to estimate the PDF of a random variable. Using the histogram to represent the observed frequency distributions of rainfall event characteristics causes inevitable arbitrariness and subjectivity in selecting parameters, especially when dealing with the large sample size such as inter-event time. Non-parametric statistical test is an effective way to evaluate the goodness-of-fit (GOF) between the specific theoretical distribution and the observed frequency distribution of rainfall event characteristics. Ref. [22] suggested using the Poisson test for the exponentiality of inter-event times and using the chi-square GOF test for the exponentiality of rainfall event volume and duration. The Kolmogorov–Smirnov (K-S) GOF test [16] and Anderson-Darling (A-D) GOF test [23] are also widely applied to the exponentiality of rainfall event characteristics. The chi-square GOF test has limitations with its parameters that are often selected with arbitrariness to some extent because of the high sensitivity of test results to the number and width of bins grouped from the sample data [22]. However, the statistical tests above based on frequency histograms may result in high rejection rates of the hypothesis because of the arbitrariness in selecting the number of bins and the minimum number of samples between bins.
As an alternative to frequency histogram methods for estimating the PDFs of the rainfall data, the kernel density estimation (KDE) is a non-parametric method to estimate the PDF of a random variable based on kernels as weights [28,29]. Ref. [30] first came up with the kernel distribution. Ref. [31] proved that the produced KDE is strongly consistent with the theoretical PDF of a variable using the integrated absolute error (IAE) as the evaluation indicator. Unlike the discrete form of histograms, using KDE can resolve such discontinuity problems [32]. Additionally, KDE only requires the use of the sample data itself and has the advantage without any prior knowledge or hypothesis of the data distribution [33]. The KDE approach has been recently adopted and applied in hydrology fields such as flash floods [34], ecological streamflow [35], the stream water quality indicator [36], etc. Nevertheless, the KDE approach has not yet been attempted in the use of rainfall event separation and characterization.
To address the above-mentioned limitations, this study aims to propose a kernel-based approach to achieving the optimal MIET and rainfall event volume threshold for rainfall event separation and characterization. The proposed method can overcome the shortcomings of a traditional PDF estimation approach using histograms, i.e., empirical distribution parameters are often selected with arbitrariness and subjectivity while the GOF performance is usually poor for a variable with large sample size. In this paper, a kernel-based approach to estimating the exponential distribution of rainfall event characteristics is put forward as well as the procedures to evaluate the K-S GOF performance are proposed. The optimal MIET and rainfall event threshold are further determined based on the GOF performance indicators. Finally, this study takes two representative and climatically different cities in China (i.e., Hangzhou representing a humid climate and Jinan representing a semi-humid climate) as an example to demonstrate the validity and accuracy of the KDE-based approach used in rainfall event separation and rainfall characterization.

2. Materials and Methods

2.1. Statistical Representation of Rainfall Events

Isolated from a historical continuous rainfall series, a series of rainfall event-dry period cycles are obtained, and each cycle can be characterized by three characteristics: rainfall event volume (v), rainfall event duration (t), and rainfall inter-event time (b) based on a pair of selected MIET and rainfall event volume threshold (vt) values. v, t and b can be regarded as three random variables with units expressed in mm over the catchment for v and in hours for t and b. Using the exponential PDFs to approximate the observed frequency distributions of rainfall event characteristics, these PDFs can be expressed as [9,37]:
f V ( v ) = ζ e ζ v , v > 0
f T ( t ) = λ e λ t , t > 0
f B ( b ) = ψ e ψ b , b > 0
where ζ, λ, and ψ are the exponential distribution parameters for rainfall event volume, duration, and inter-event time, respectively. The single-parameter exponential distribution has the simplest form in theoretical distributions to be used to represent rainfall event characteristics. The advantage of its analytical tractability and its validity has been recognized in many studies [3,16,38].

2.2. Rainfall Event Characterization Using KDE Approach

2.2.1. KDE for Estimating PDFs of Rainfall Characteristics

The kernel density estimation is defined as adding a kernel function to every sample value, then convoluting all kernel functions to obtain the final estimation [35,39].
f ( x ) ^ = 1 n h i = 1 n K ( x x i h )
where n is the total number of samples; h is the window width; xi is the ith independent identically distributed sample of the total rainfall sample data x; K ( ) is the kernel function, which is the symmetry function and the integral is unity where the upper and lower limit of integration is positive infinity and negative infinity, respectively, i.e., + K ( x ) d x = 1 for K ( x ) > 0 [39,40].
Common kernel functions include Gaussian kernel, Epanechnikov kernel, Exponential kernel, Cosine kernel, Box kernel, etc., which are all based on the characteristics of symmetry and unbiasedness. In this study, the Gaussian kernel function was adopted for the kernel function which is expressed as:
K ( u ) = 1 2 π e u 2 2
where u is the variable of Gaussian kernel function. It is noted that the kernel types have much less influence on density estimation than the choice of window width since the integrated mean squared error (IMSE) is quite insensitive to the shape of the kernel [41]. The optimal choice of h can be obtained by minimizing the asymptotic mean of integrated squared error. As a commonly used method to determine the window width, Silverman’s rule of thumb replaces the theoretical function (denoted as ft(x) hereinafter) by a normal density in which the unknown standard deviation is replaced by the estimator σ ^ . When the Gaussian function is used, the Silverman’s rule-of-thumb formulae [35,42] was used to determine h in this study:
h = ( 4 3 n ) 1 5 σ ^
where σ ^ = standard deviation of the sample.

2.2.2. Correction for Boundary Bias of KDE

The increased bias often exists within one bandwidth of the boundary (e.g., in the neighborhood of zero for data from exponential distribution) of the sample space. Such boundary bias is a consequence of the increasingly asymmetric distribution of the random variable as one approaches the boundary [28]. Data reflection is a method of bias correction by adding data points outside the boundary so as to expand the data set. Since the rainfall event characteristics are all non-negative values, a boundary bias issue exists when dealing with the sample data of rainfall event characteristics (x1, x2, …, xn) using KDE. Therefore, the data reflection approach is applicable to correct the boundary bias. The common practice of the data reflection technique is to mirror the data around the boundary. Given a new data set { x 1 , x 1 , x 2 , x 2 , , x n , x n }, a new reflection KDE incorporating the mirrored data (denoted as f n ( x ) ^ ) can be expressed as:
f n ( x ) ^ = 1 n h ( i = 1 n K ( x x i h ) + i = 1 n K ( x x i h ) )
The mean square error (MSE) between fn(x) and ft(x) is defined as E [ ( f n ( x ) ^ f t ( x ) ^ ) 2 ] where E[⋅] represents the mathematic expectation function. It is found that E [ ( f n ( x ) ^ f t ( x ) ^ ) 2 ] approaches zero when the term of nh approaches positive infinity, which demonstrates that fn(x) is close to ft(x) and proves the feasibility of reflection method [43,44].

2.2.3. KDE for Estimating PDFs of Rainfall Characteristics

K-S statistical test was used to evaluate the GOF between the KDE-induced PDF and the theoretical exponential distribution. In this study, the Simpson’s Rule Formula was applied to calculate the incremental value of the cumulative distribution function (CDF) by integrating the KDE-induced PDF f n ( x ) ^ with x in the range between a and b where the range is divided into a number of 2ns intervals with equal width [45,46,47]. Using Simpson’s Rule Formula, the integral of the PDF f n ( x ) ^ with x in the range between a and b obtained is expressed as:
a b f n ( x ) ^ d x h s 3 [ f n ( a ) ^ + 4 k = 1 n s f n ( x 2 k 1 ) ^ + 2 k = 1 n s 1 f n ( x 2 k ) ^ + f n ( b ) ^ ]
where hs = (ba)/2ns, in which hs is the width of the interval and ns is a positive integer. The CDF of the KDE-induced PDF f n ( x ) ^ with a specific value of x (denoted as F n ( x ) ^ ) can be calculated using Equation (8).
The statistical test methods for rainfall event characteristics and criterion for selecting the optimal MIET are described below:
(1) Poisson Statistical Test: The exponential distribution assumption for inter-event times between rainfall events indicates that the occurrence of rainfall events follows a Poisson process approximately when b is much longer than t [1]. As a result, the annual number of rainfall events (denoted as θ ) is Poisson distributed as reasonably assumed. Using the Poisson distribution test technique as detailed in Ref. [27], the ratio rp = Var(θ)/⟨θ⟩; is defined as the Poisson test statistic. When specifying different MIET values, the numbers of annual rainfall events (denoted as N) change. rp can be further calculated based on the transformed test statistic (N–1)rp that follows a chi-square distribution with (N–1) degrees of freedom and a specified level of significance α [48,49].
(2) K-S GOF Test: As described in Equations (1)–(3), rainfall event characteristics v, t and b are assumed to follow exponential distributions. This study selected the Kolmogorov–Smirnov (K-S) test for testing the goodness-of-fit (GOF) of exponential distributions for v, t, and b. In the K-S test, the maximum deviation between the theoretical CDF and the observational cumulative distribution is determined. A null hypothesis is made that the GOF between the theoretical exponential distribution and the empirical distribution is favorable. With a specified significance level α, the decision of acceptance or rejection can thus be made [50].
(3) Criterion for Selecting the Optimal MIET: The rainfall event volume v is the predominant role among the three rainfall event characteristics from a perspective of water quantity in urban stormwater management; therefore, the relative error (denoted as Rr) is proposed to evaluate the agreement between the KDE-induced CDF and theoretical exponential distribution for v. For a pair of selected MIET and vt, Rr can be calculated using Equation (9).
R r = max | F n ( v ) ^ F ( v ) | F ( v ) × 100 %
where F n ( v ) ^ is the KDE-based CDF for v; F ( v ) = 1 exp ( ζ v ) , represents the CDF value of theoretical exponential distribution; F ( v ) corresponds to the theoretical exponential CDF when the maximum absolute difference between the KDE-based CDF and the theoretical exponential CDF for v is achieved at v*. For 24 combinations of MIET and vt, their corresponding Rr can be calculated, respectively. The optimal combination of MIET and vt can be determined when the minimum Rr is achieved.

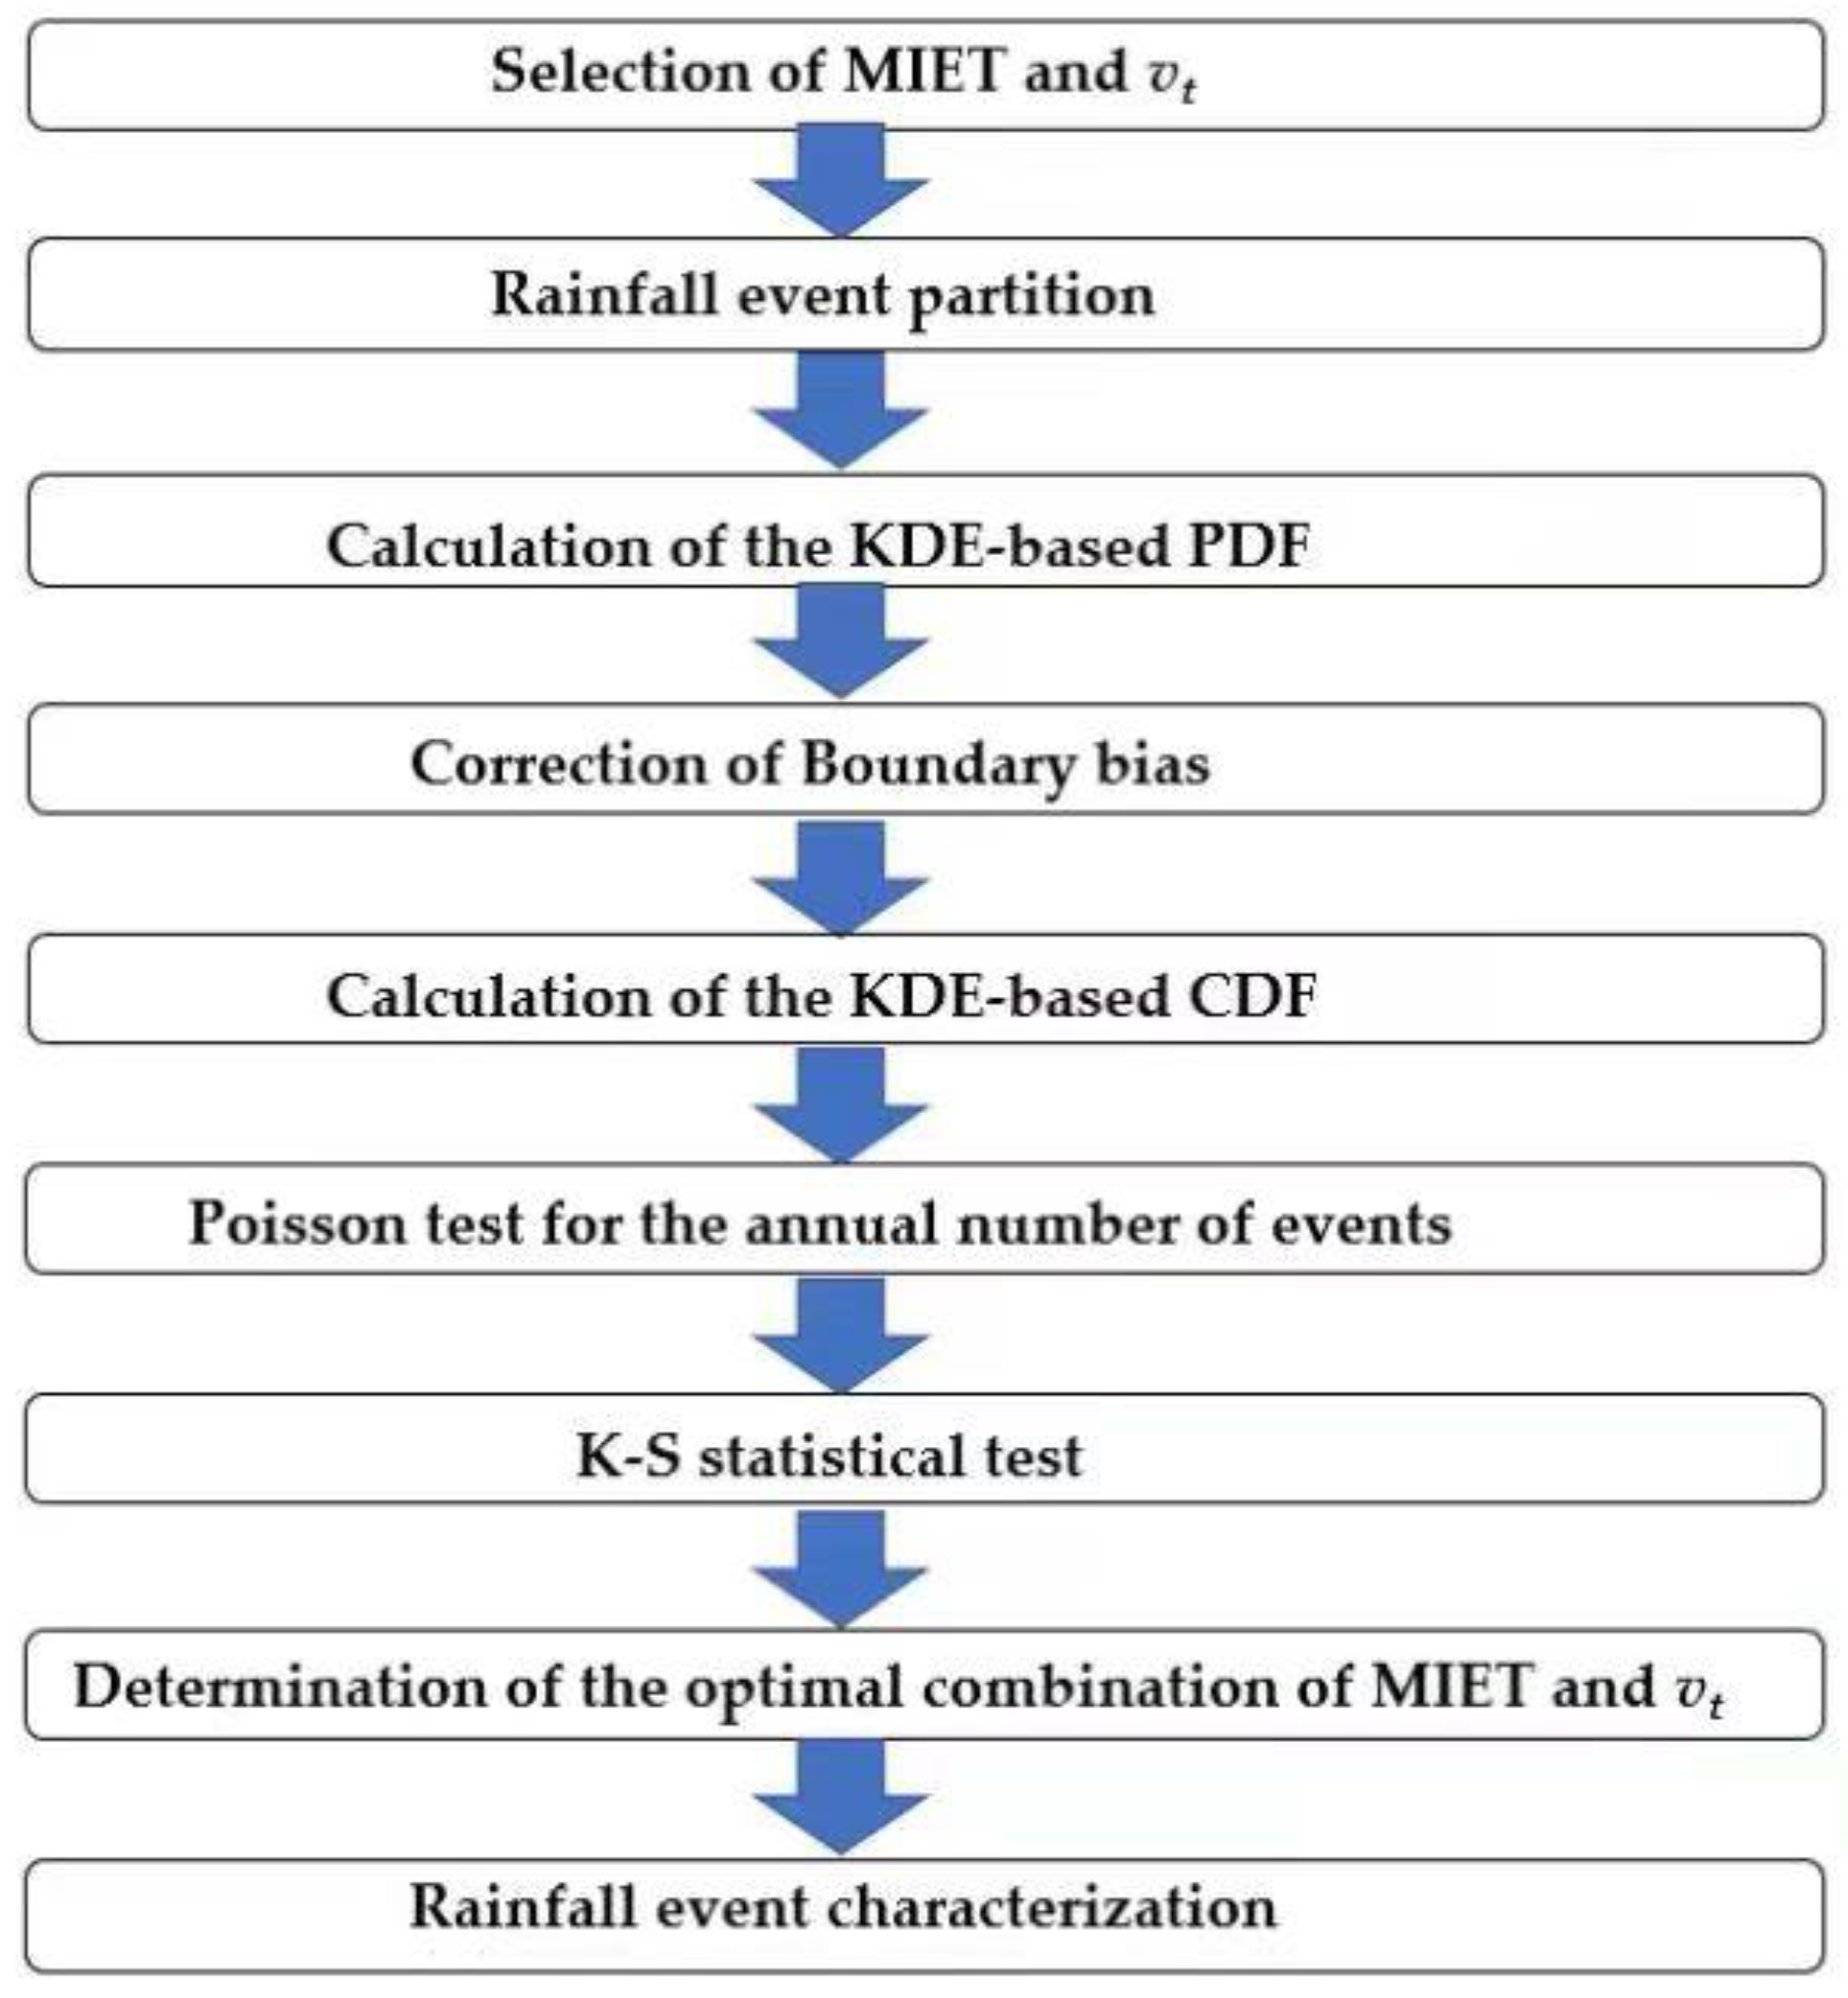
2.2.4. Procedures of Rainfall Event Separation and Characterization Based on KDE

Based on the abovementioned statistical tests approach and optimization criterion, the standardized procedures of rainfall event separation and characterization for historical hourly rainfall time series are recommended as follows:
(1) Selection of MIET and vt: pairs of suitable values for the minimum inter-event time (MIET) (from 6–12 h) and the volume threshold vt (from 0–5 mm) are selected first;
(2) Rainfall event separation: secondly, with any pair of selected MIET and vt, the hourly rainfall time series is divided into several discrete rainfall events following the rule that b is smaller than MIET, as well as the rule that the small rainfall events with a volume less than the threshold vt should be removed; the three time series of the corresponding rainfall event characteristics, i.e., rainfall event volume v, rainfall event duration t, and inter-event time b, are then obtained;
(3) Calculation of the KDE-based PDF: with a selected pair of MIET and vt, KDE is applied to obtain the PDFs for each variable of v, t, and b based on the Gaussian kernel function and Silverman’s rule-of-thumb formulae;
(4) Correction of boundary bias: boundary bias correction using the reflection method is performed for the KDE-based PDFs of three characteristics in all cases of MIET-vt combinations;
(5) Calculation of the KDE-based CDF: Simpson’s rule is used to integrate the PDF after boundary bias correction for all combinations of the three characteristics to obtain CDF;
(6) Poisson test for the annual number of events: the Poisson test as described in Section 2.2.3 is used to test the annual number of events θ; the rainfall event separation results for specific combinations of MIET and vt are excluded if the corresponding Poisson test results are not acceptable;
(7) K-S statistical test: the Kolmogorov–Smirnov (K-S) test was used to test v, t, and b, respectively; the rainfall event separation results for specific combinations of MIET and vt are further excluded if the corresponding K-S statistical test results are not acceptable;
(8) Determination of the optimal combination of MIET and vt: for the separated rainfall events with all acceptable pairs of selected MIET and vt after finishing the step (8), using Equation (9) to calculate Rr for the corresponding CDF of v; the optimal pair of MIET and vt is determined when the minimum value of the calculated Rr among all pairs is achieved; then the combination of MIET and vt corresponding to for the minimum Rr is selected as the optimal one;
(9) Rainfall event characterization: the distribution parameters in Equations (1)–(3) are finally obtained to calculate the mean values of three rainfall event characteristics (donated as ⟨v⟩, ⟨t⟩, ⟨b⟩, respectively) with the optimal pair of MIET and vt determined in step (8).
Performing the procedures above for rainfall event separation and characterization can provide a standardized approach from a perspective of statistics as an alternative to the conventional histogram approach. Figure 1 shows the flow chart of the methodology for rainfall event separation and characterization.

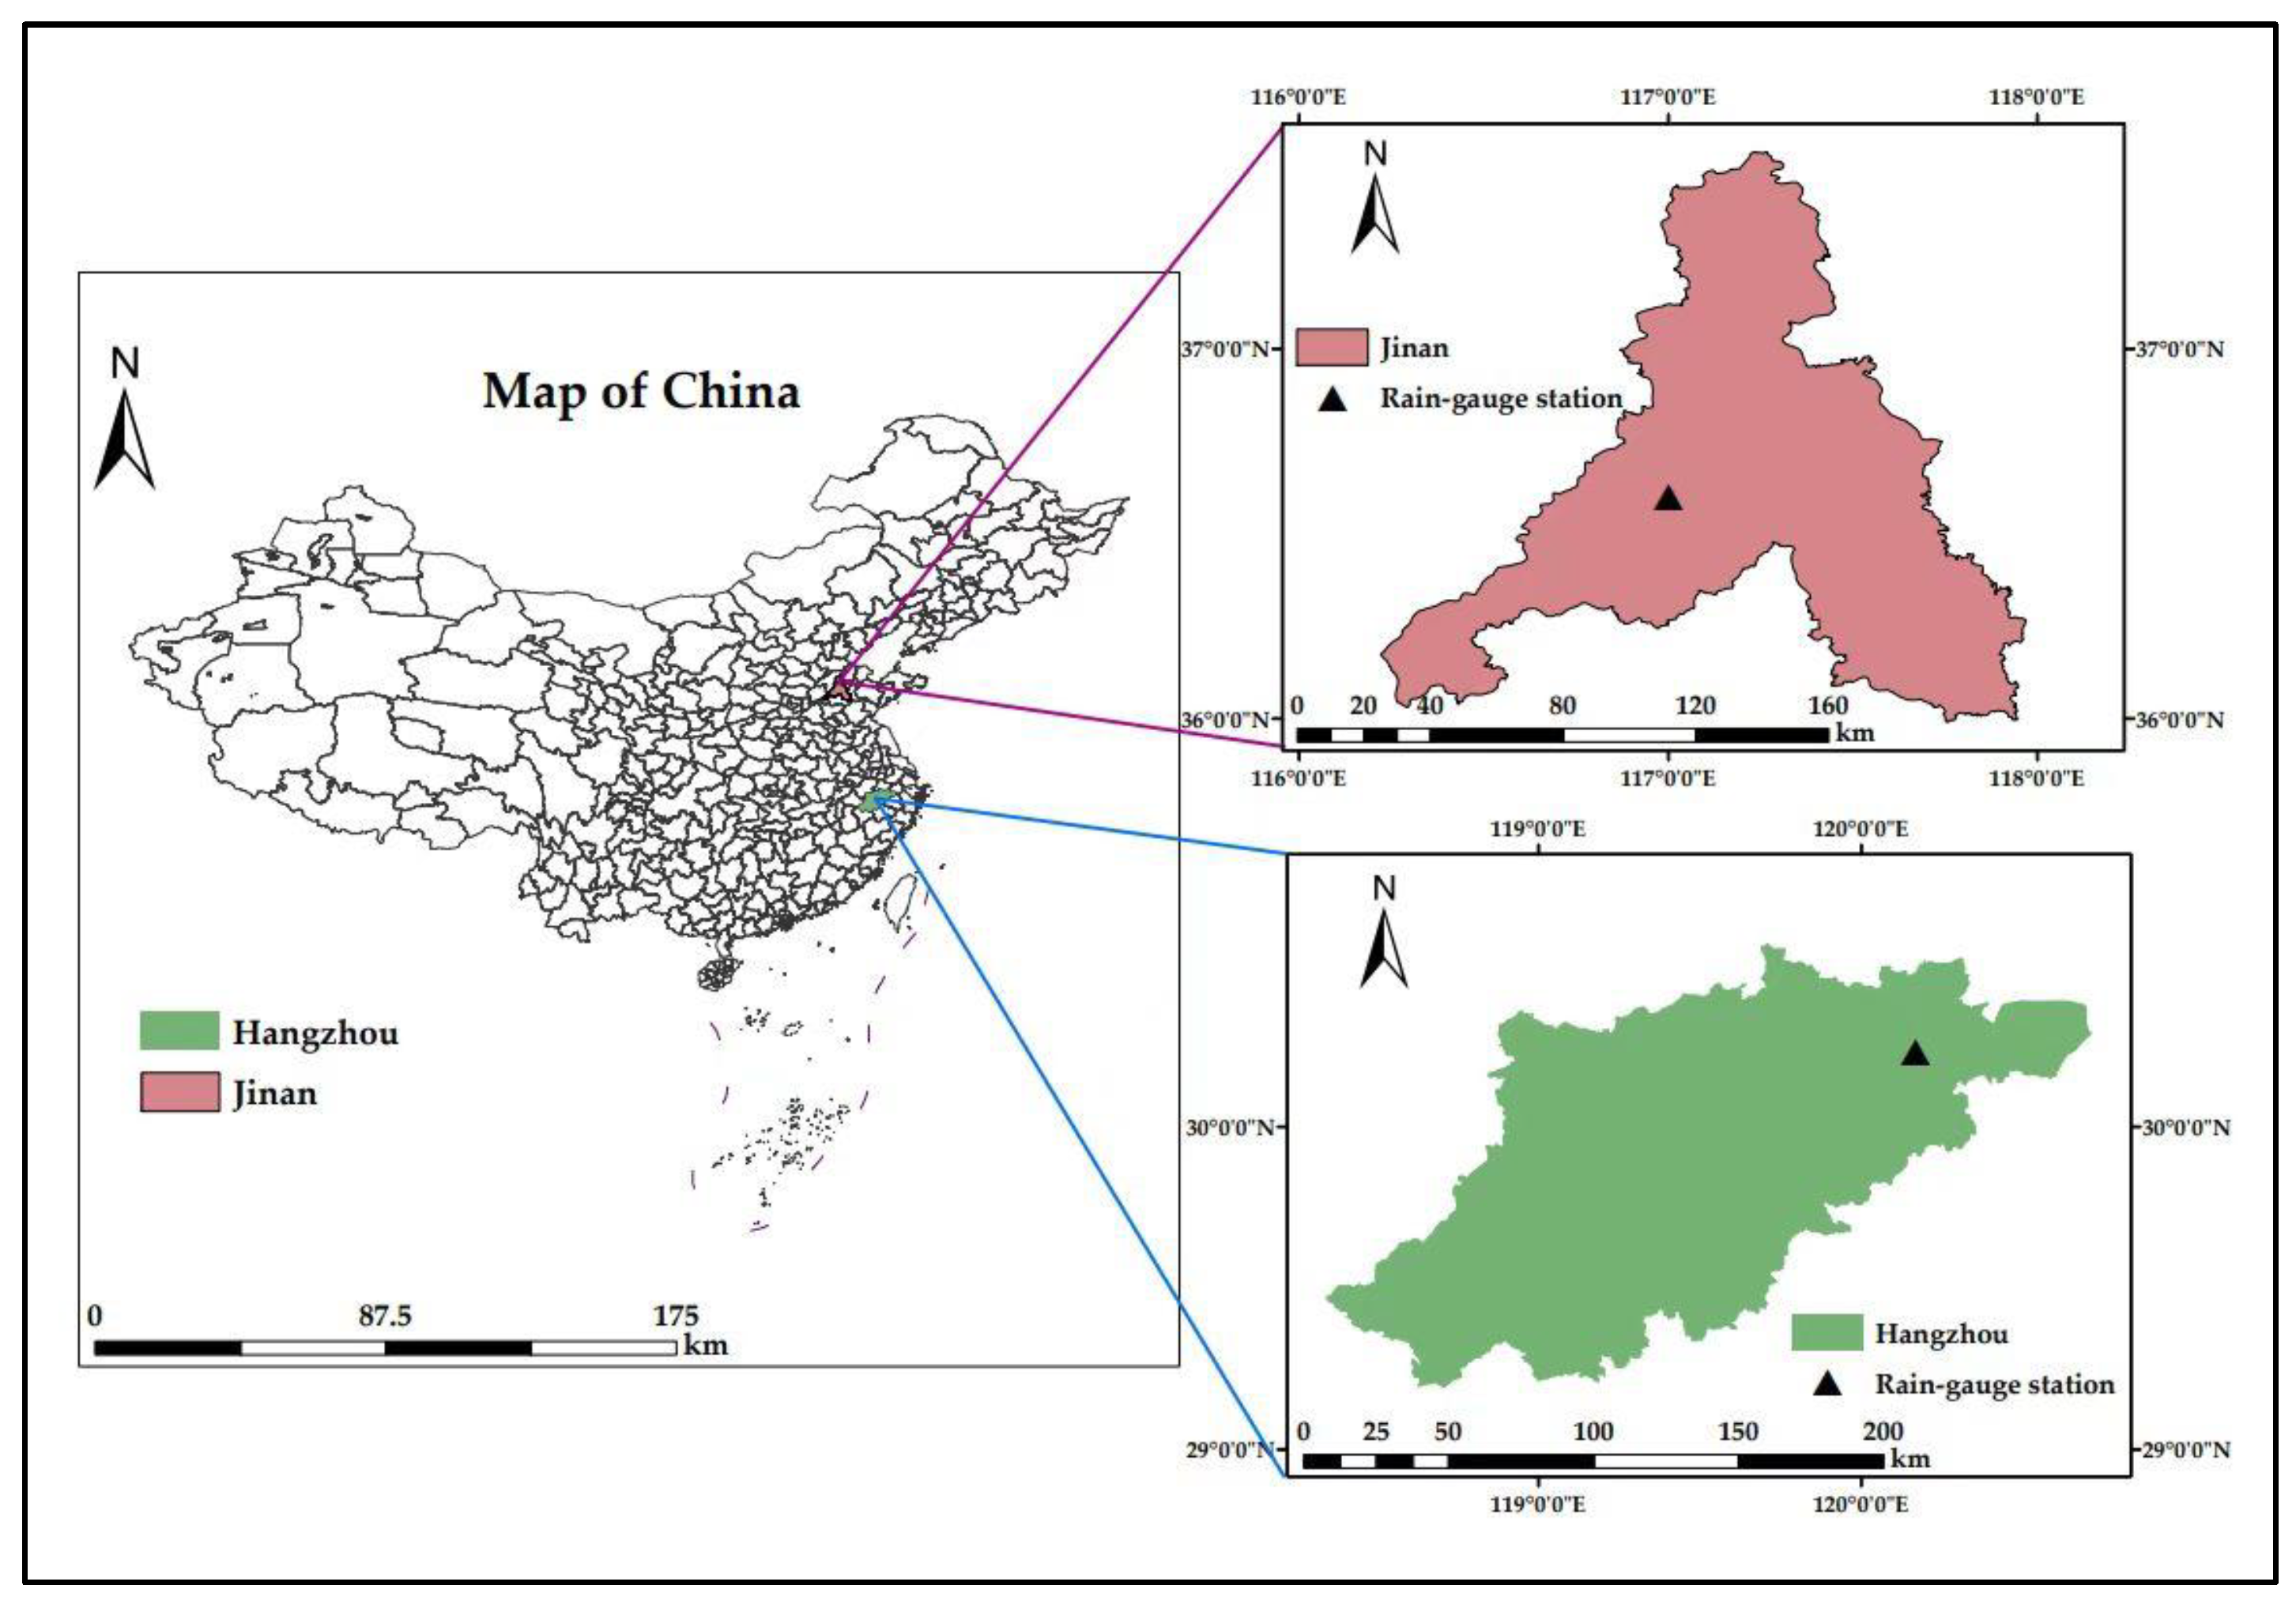
2.3. Study Area and Data

Two climatically represented regions in China were selected as the case study areas. They are Jinan in Shandong Province representing a semi-humid climate, and Hangzhou in Zhejiang Province representing a humid climate, respectively. The historical hourly rainfall data were retrieved from China Meteorological Data Service Centre (https://data.cma.cn, accessed on 31 December 2022). The geographic and climatic information of the rain gauge stations for the two cities are shown in Table 1. It is noted that the ranges of years and months for the two stations are not exactly the same due to the limited hourly rainfall data collected from the database as well as the data quality control. Additionally, winter months are usually excluded in the rainfall event analysis for the purpose of stormwater management [51]. The results of rainfall event separation and characterization obtained using the proposed method in this study can be easily updated once more recent and high-quality rainfall data are available in future. The location map of the two case study areas is displayed in Figure 2.

3. Case Study of the Rainfall Event Separation

3.1. Parameters for Rainfall Event Separation

In this study, the typical values of MIET are selected as 6 h, 8 h, 10 h and 12 h while those of vt are 0, 1, 2, 3, 4 and 5 mm as suggested in the reasonable ranges of MIET (6–12 h) and threshold vt (0–5 mm) for typical urban catchments. The total combination number of different MIET and vt values is 24 for each study area.
In processing the hourly rainfall data, three series of v, t, and b are obtained with a selected pair of MIET and vt combination values. More specifically, if the dry time between two adjacent rainfall episodes is less than the selected MIET, these two rainfall episodes are treated as if they belong to the same rainfall event, and they should be further merged into one rainfall episode; otherwise, they are identified as two individual and consecutive rainfall events. Additionally, when the volume of the rainfall episode (v) is no larger than the selected threshold value (vt), the rainfall volume of this episode should be removed and adjusted to be zero and the duration of this episode will be appended to the inter-event time between the current and the previous rainfall episodes. In such circumstances, the redefined rainfall event is characterized by an event volume and an event duration that are, respectively, equal to those of the previous rainfall episode. However, the inter-event time of the redefined rainfall event should be equal to the original inter-event time between the current and the previous rainfall episodes with the addition to the duration of the current rainfall episode.
Table 2 presents the total numbers of rainfall events obtained using different pairs of MIET and vt for event separation at Jinan and Hangzhou. It is worth noting from Table 2 that the numbers of rainfall event volume v, rainfall event duration t, and rainfall inter-event time b are equal with the same combination of MIET and vt, and the decrease in the number of rainfall events is observed with the increase in either MIET or vt. The rainfall characterization results (i.e., ⟨v⟩,⟨t⟩,⟨b⟩) for all possible pairs of MIET or vt before performing statistical tests are shown in Table 3. It is found that all the mean values of three event characteristics decrease with the increase in either MIET or vt from Table 3.

3.2. Results and Discussion

3.2.1. Poisson Test for the Annual Number of Events θ

For each pair of MIET (6–12 h) and vt (0–5 mm), Poisson tests for the annual number of events were performed for the two study cities. As shown in Table 4, with a level of significance α = 0.1, the Poisson test results for the annual number of events θ for 22 out of 24 cases with pairs of MIET and vt at Hangzhou indicate the acceptance of the hypothesis that θ follows the Poisson distribution. In the meanwhile, the rp of Jinan was found to lie within the interval between 0.71 and 1.33 of critical values in all 24 cases with pairs of MIET and vt, demonstrating that the hypothesis cannot be rejected. It is worth noting that while vt is too large or too small, the rejection of the Poisson distribution hypothesis may occur.

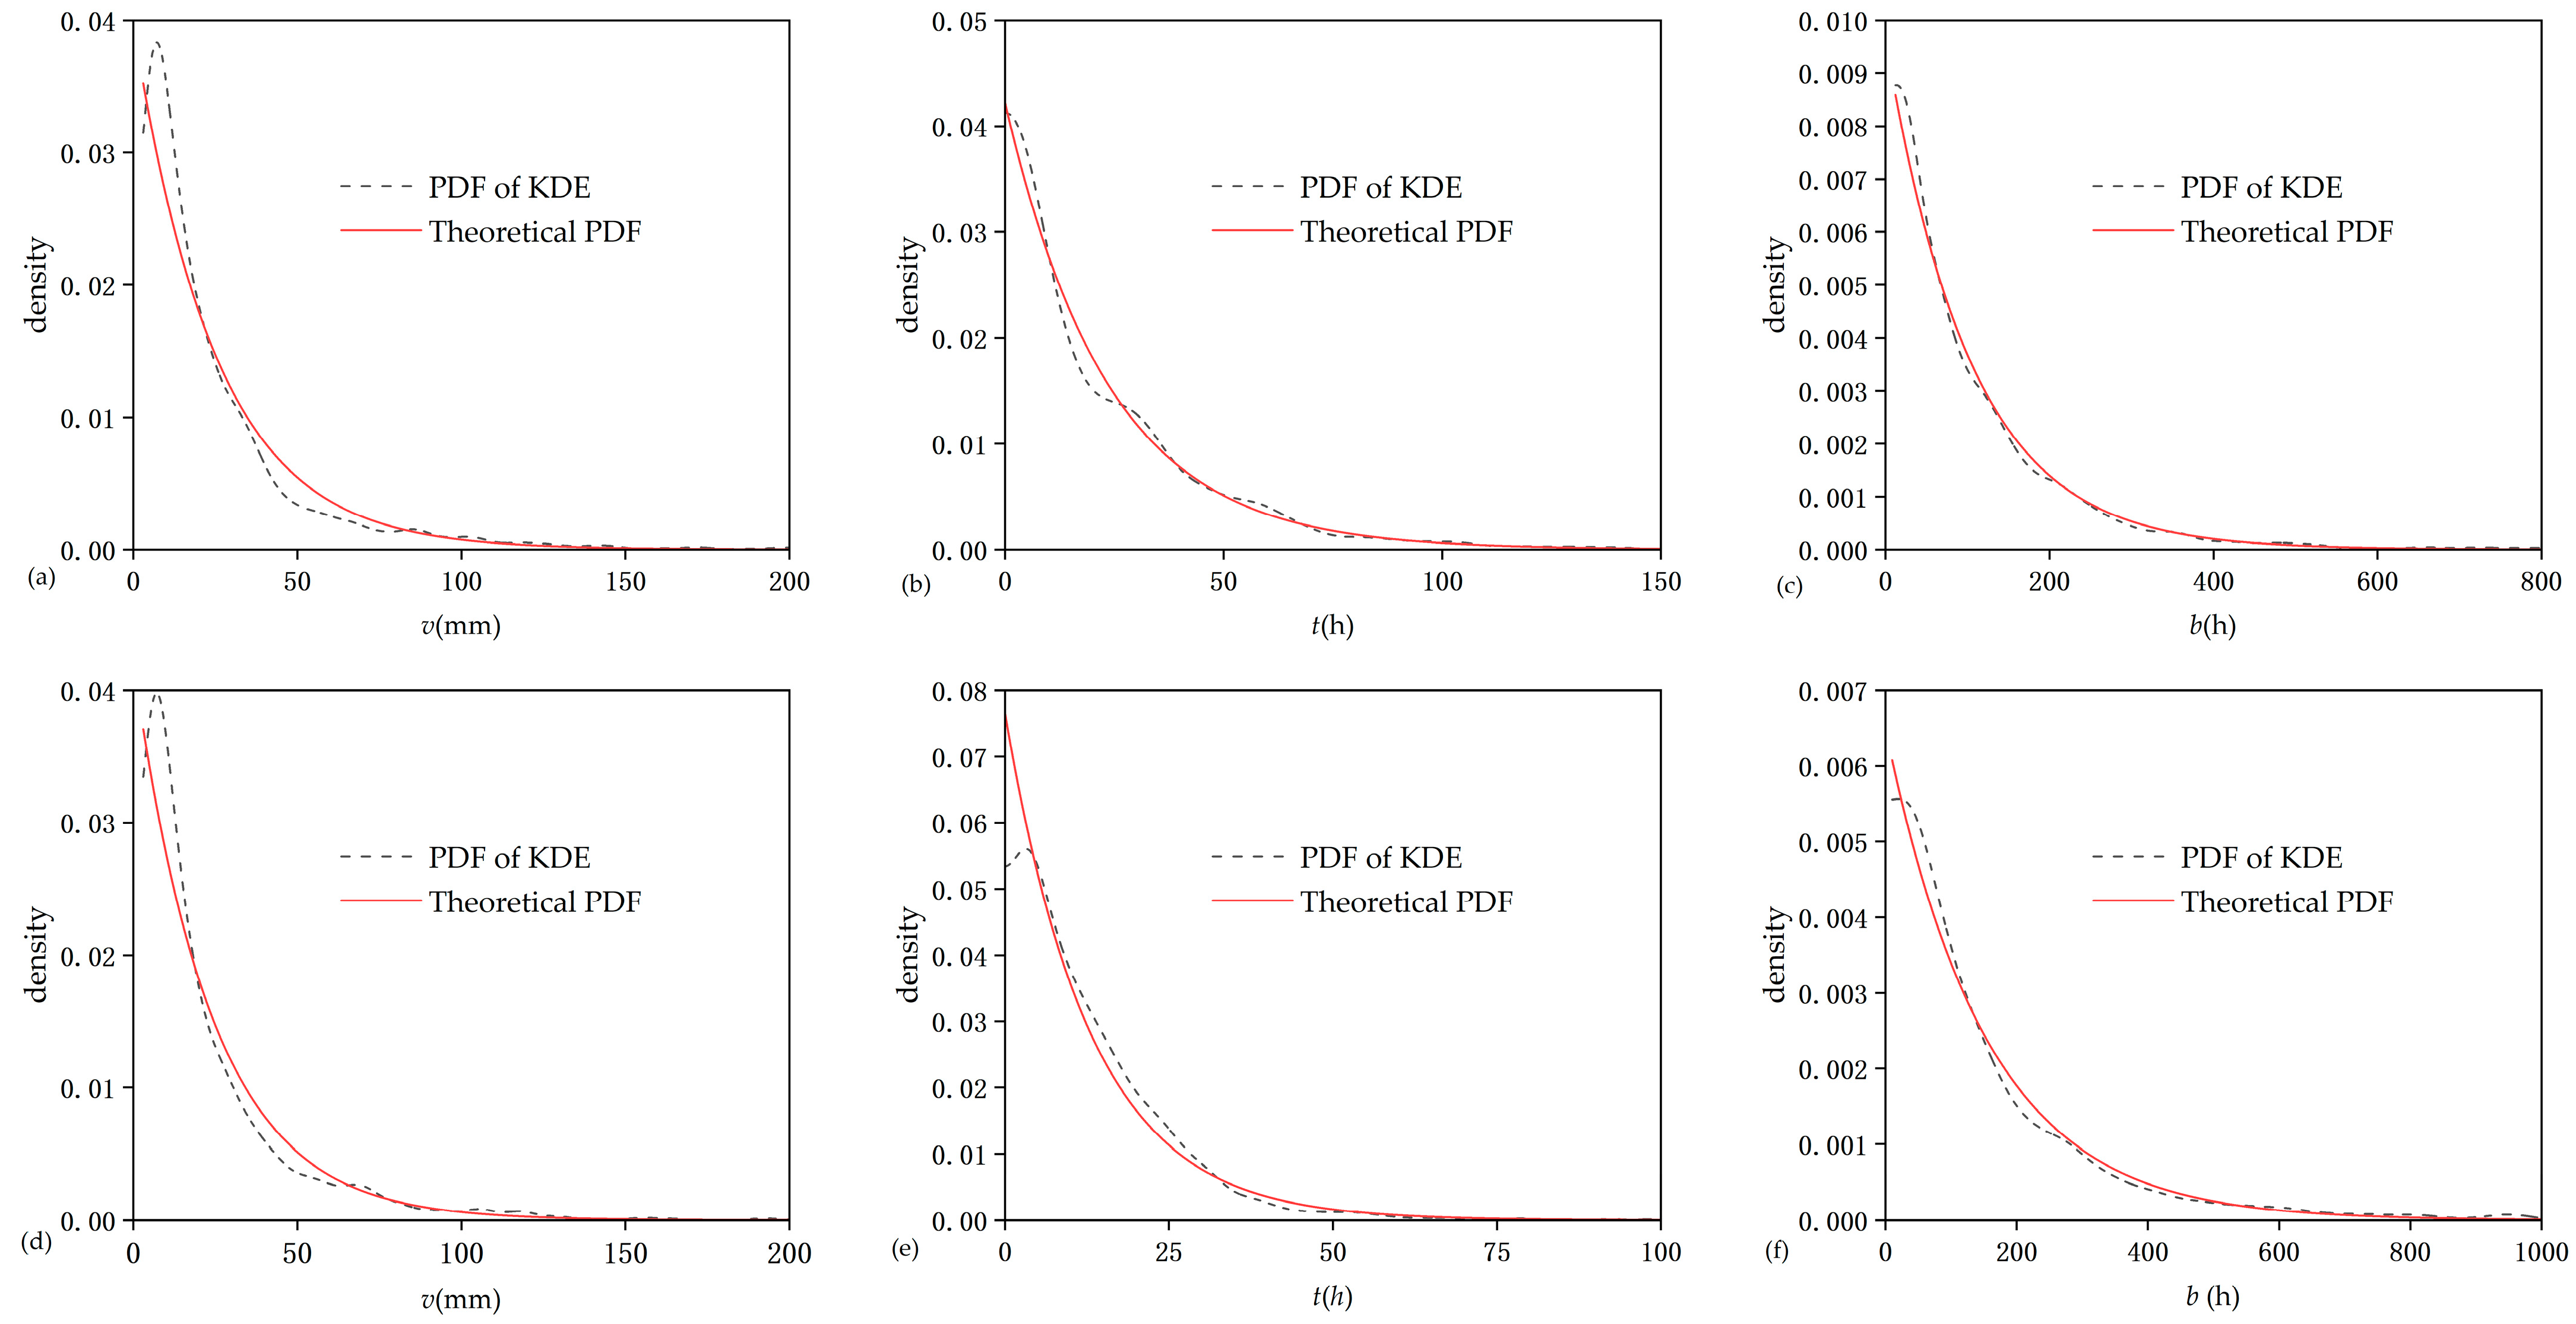
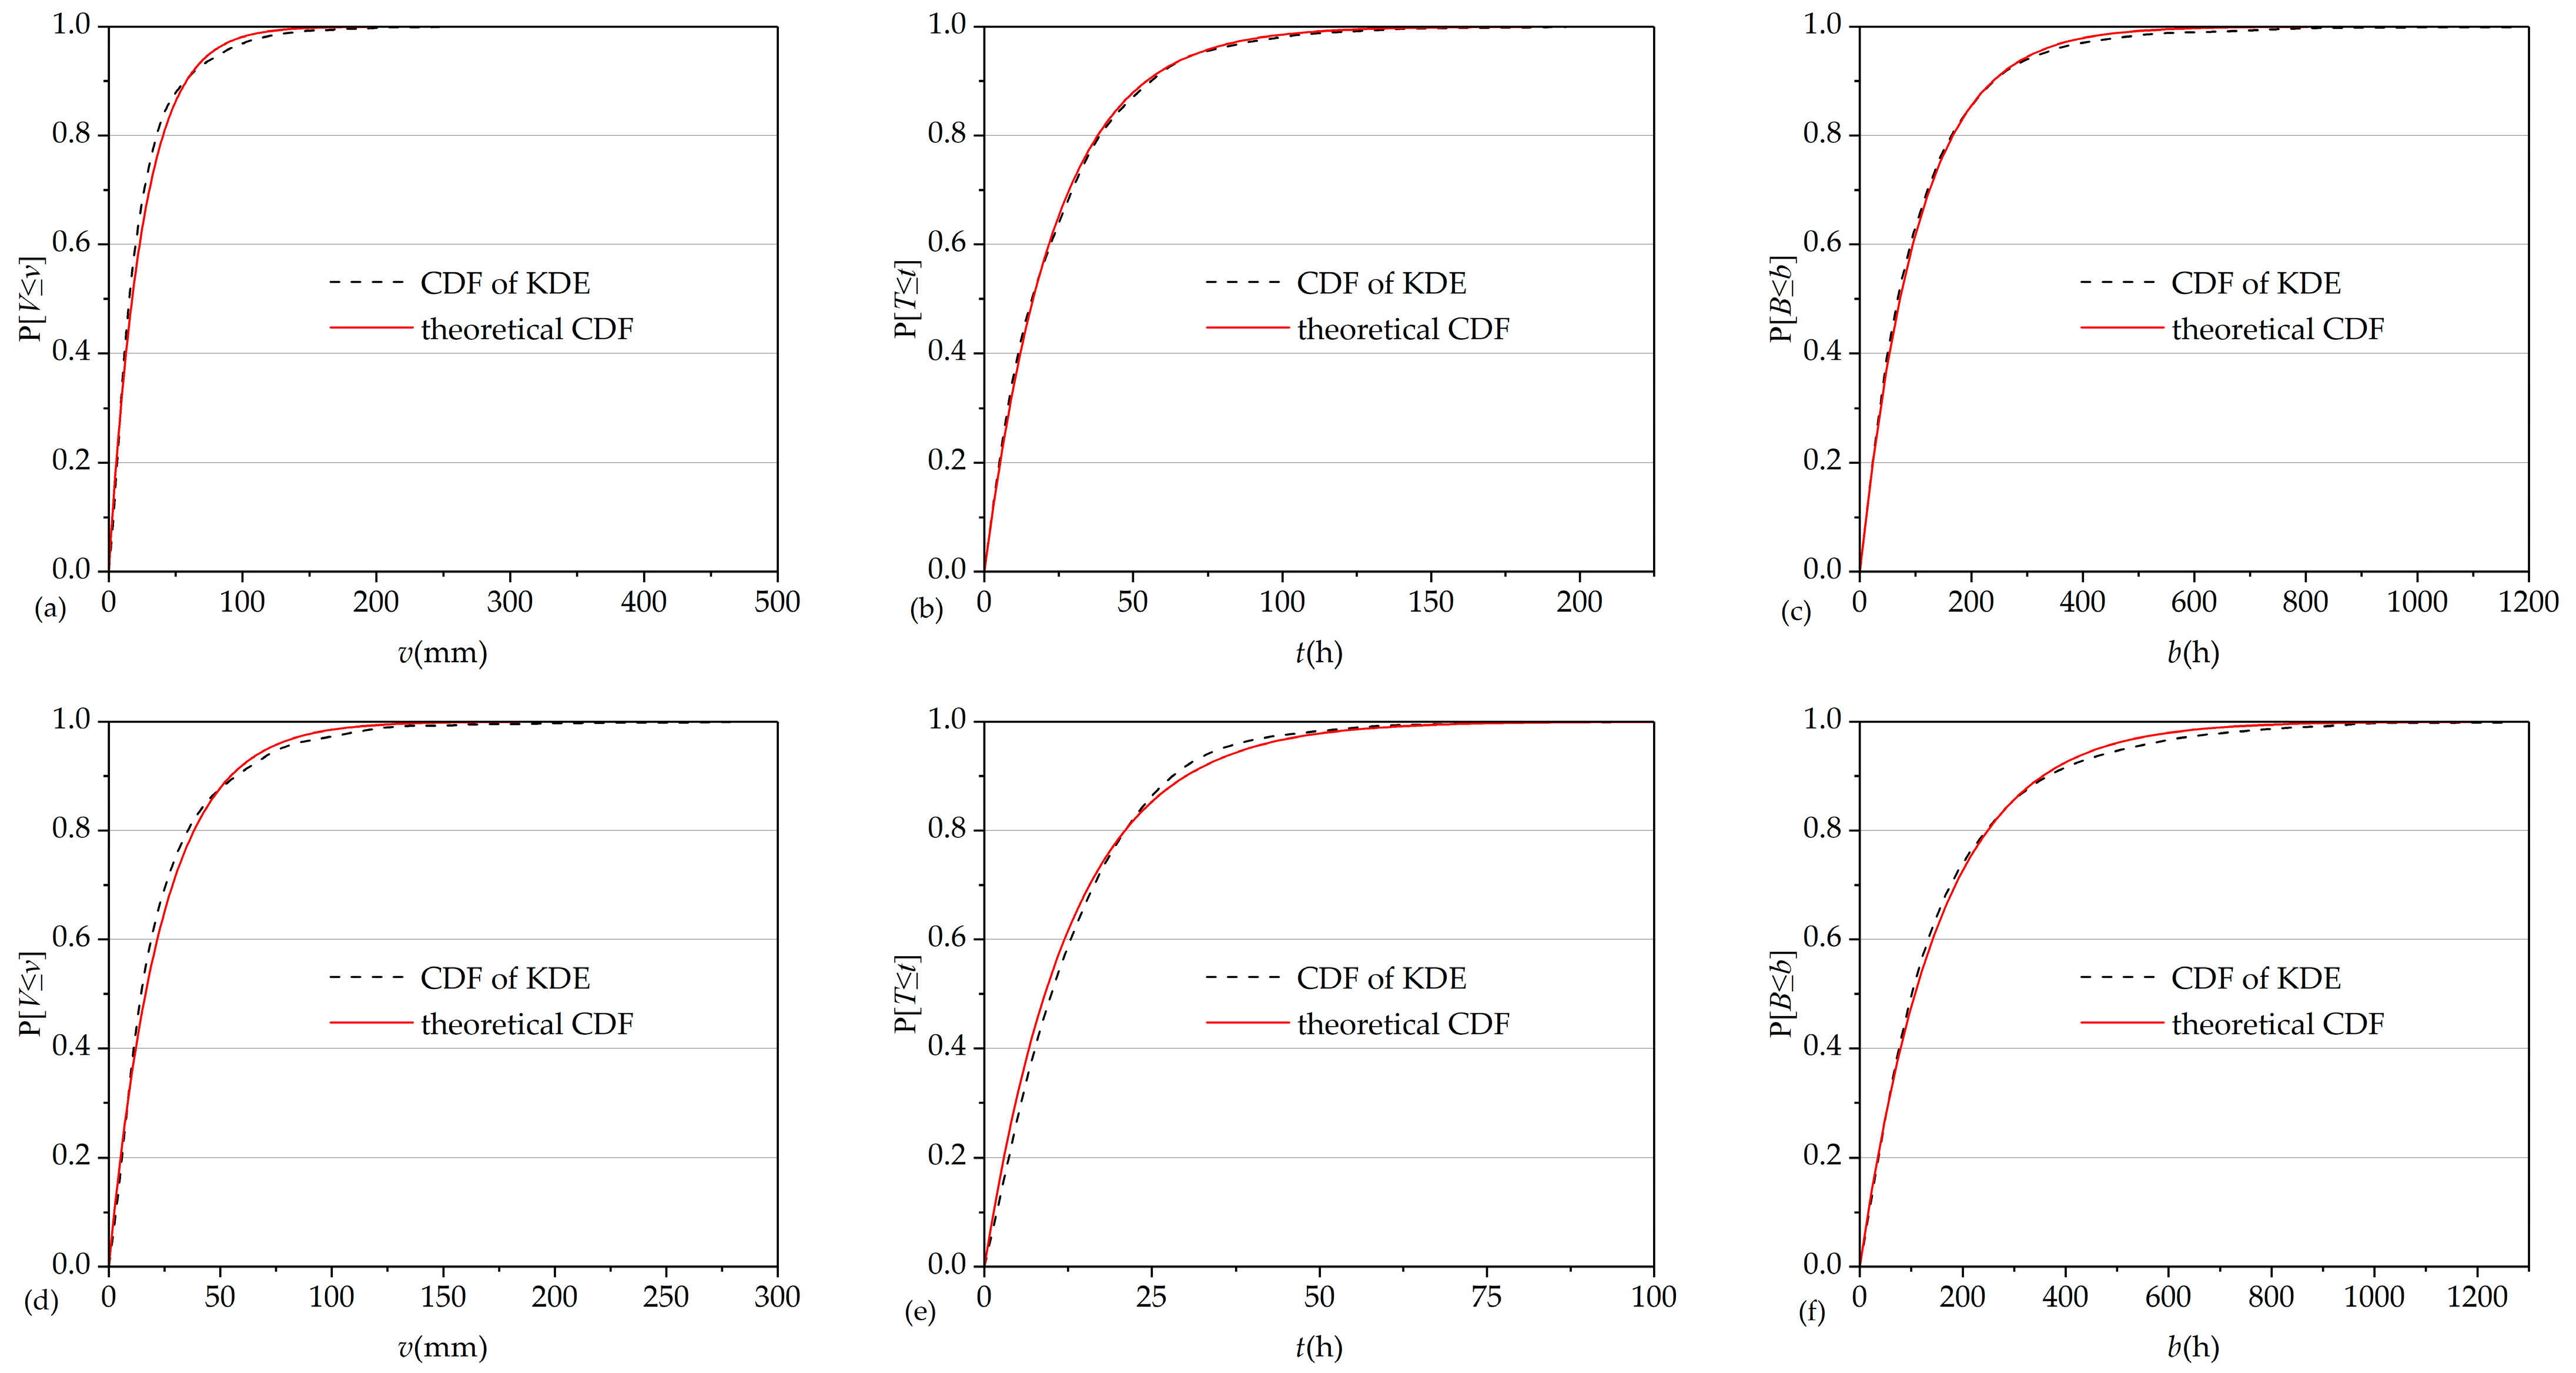
3.2.2. GOF Test of Exponentiality Using KDE

GOF tests were performed using KDE with all pairs of MIET and vt for Jinan and Hangzhou. Silverman’s rule of thumb was used for choosing the window width and Gaussian kernel function is used for the kernel function. The algorithms of the convolution of KDE and the data reflection (i.e., mirror the data) for correcting the boundary bias were coded in Python. Each pair of MIET and vt uses the same window width method, kernel function type, and boundary correction method to estimate the kernel density. As shown in Figure 3, the PDF of the rainfall event sample data obtained by KDE fits theoretically PDF very well overall, although slight downward trends near the origin are observed due to the formula property of kernel density.
Figure 4 shows the KDE-derived PDF and the theoretical exponential PDF for rainfall event volume v with different MIETs and fixed vt of 2 mm at Jinan. It is found in Figure 4 that both the PDFs obtained from KDE and theoretical values present a decreasing trench with the increase in MIET when v is very small. The maximum values and the PDF curve shape fit favorably between the PDFs obtained from KDE and theoretical PDFs from visual observation. It is noted that the PDFs estimated by KDE have a larger variation compared to the theoretical PDFs for v near the origin.
Apart from visual observation of the GOF, statistical GOF tests were further performed. The PDFs of three event characteristics (v, t, b) of 24 pairs of MIET and vt for Jinan and Hangzhou were estimated by KDE using Equation (7). The CDFs were further calculated using Equation (8) and K-S test was performed accordingly. It is noted that the pair of MIET and vt is accepted when the resulting v, t, and b all pass their corresponding K-S tests. The K-S statistical test results for v, t, and b at Hangzhou and Jian are displayed in Table 5 and Table 6, respectively. As shown in Table 5 and Table 6, there are 13 out of 24 pairs of MIET and vt that are accepted in Jinan, while 5 out of 24 of those are accepted in Hangzhou. It is, generally, found that the pass rates of K-S statistical tests for v is relatively lower than that for t and b. The minimum K-S statistics achieved among the pairs of MIET and vt that passed the K-S test for v under different MIETs for all cases result in equal vt values of 3 mm for both Hangzhou and Jinan. This implies that the threshold value vt may have a greater effect on the GOF test compared to MIET.

3.2.3. Optimal MIET, vt and Rainfall Event Characterization

After passing the Poisson test and K-S tests, 5 and 13 acceptable pairs of MIET and vt for Hangzhou and Jinan are determined, respectively. The results of the corresponding Rr of these acceptable pairs of MIET and vt calculated using Equation (9) for the two cities are shown in Table 7. It is observed in Table 7 that the minimum values of Rr for Hangzhou and Jinan are 8.84% and 8.97%, respectively, with the corresponding pairs of MIET and vt are (12 h-3 mm) and (10 h-3 mm), respectively. Therefore, the optimal MIETs determined are 12 h for Hangzhou and 10 h for Jinan whereas the optimal vt values are 3 mm for both Hangzhou and Jinan. With the selected optimal pair of MIET and vt, the CDFs obtained from KDE and the theoretical exponential CDFs for v, t and b are plotted as shown in Figure 5. The excellent agreements between the two CDFs for each rainfall characteristic are observed from Figure 5, which further demonstrates the validity of the selected optimal results. The rainfall event characterization can be finally obtained by calculating the mean values of the three event characteristics with the optimal pairs of MIET and vt for Hangzhou and Jinan. The rainfall event characterization results are: ⟨v⟩ = 25.19 mm, ⟨t⟩ = 23.67 h, ⟨b⟩ = 103.53 h for Hangzhou and ⟨v⟩ = 23.74 mm, ⟨t⟩ = 13.05 h, ⟨b⟩ = 154.12 h for Jinan; the corresponding exponential distribution parameters are ζ = 0.0397 mm−1, λ = 0.0422 h−1, and ψ = 0.00966 h−1 for Hangzhou and ζ = 0.0421 mm−1, λ = 0.0766 h−1, and ψ = 0.00649 h−1 for Jinan.
It is found that there is a paucity of literature on the rainfall event separation based on historical hourly rainfall data in China. Ref. [21] demonstrated that the rainfall event characteristics at Guangzhou, China follow exponential distributions with a MIET of 12 h when using the histogram analysis. Ref. [54] found that the MIET of 10 h is appropriate for most of 18 stations in the eastern monsoon region of China when adopting the exponential distribution assumption for the inter-event time. The optimal MIET values determined for Hangzhou and Jinan in this study are close to the above-mentioned findings, demonstrating that the results are reasonable. It is also worth noting that the appropriateness and accuracy of the distribution parameters of the three rainfall event characteristics obtained based on the optimal MIET and event volume threshold should be further verified in the hydrologic analysis and design of stormwater control facilities in future.

4. Summary and Conclusions

This study proposed a kernel density estimation (KDE) approach to estimating the probability density functions (PDFs) of three rainfall event characteristics including rainfall event volume, event duration, and inter-event time. The KDE-based approach associated with the Poisson and Kolmogorov–Smirnov (K-S) statistical tests were further performed to determine the optimal pair of minimum inter-event time (MIET) and rainfall event volume threshold (vt), which are two key parameters for rainfall event separation and characterization. A detailed standardized procedure was also provided for rainfall event separation and characterization at any specific site where the exponential distribution is suitable for characterizing the rainfall event statistics. Taking two climatically different cities, Hangzhou and Jinan of China, for a demonstration example, the validation and application of the proposed KDE-based approach were investigated for rainfall event separation and characterization. The results show that the optimal MIETs determined are 12 h for Hangzhou and 10 h for Jinan while the optimal vt values are 3 mm for both Hangzhou and Jinan. The corresponding distribution parameters of three rainfall event characteristics for two cities are obtained as well.
The proposed KDE-based approach can be used for the exponential test of the rainfall event characteristics and as a method to partition hourly rainfall time series into consecutive events. As an alternative to the traditional PDF estimation approach using histograms, the proposed method can achieve favorable GOF test results and obtain the optimal MIET and event volume threshold while overcoming the shortcomings of histogram approach. The KDE-based approach to rainfall event separation and characterization can form the model derivation basis for the analytical probabilistic models of urban drainage/stormwater control facilities.

Author Contributions

Conceptualization, J.W. (Jun Wang); methodology, J.W. (Jun Wang); validation, S.C. and Y.L.; formal analysis, Y.D.; investigation, J.W. (Jiachang Wang); data curation, Y.D.; writing—original draft preparation, Y.D.; writing—review and editing, S.C., J.W. (Jun Wang) and A.R.; supervision, J.W. (Jun Wang) and S.C.; funding acquisition: J.W. (Jun Wang). All authors have read and agreed to the published version of the manuscript.

Funding

This study is funded by the National Natural Science Foundation of China (Grant No. 52109025), the Natural Science Foundation of Shandong Province (Grant No. ZR2021QE001).

Data Availability Statement

The data sets supporting the results of this article will be available from the corresponding author upon reasonable request.

Acknowledgments

The corresponding author Jun Wang acknowledges the Future Plan for Young Talent Program of Shandong University, and the Fundamental Research Funds of Shandong University. The useful comments and suggestions from the anonymous reviewers are much appreciated.

Conflicts of Interest

The authors declare no conflict of interest.

References

  1. Restrepo, P.; Eagleson, P. Identification of Independent Rainstorms. J. Hydrol. 1982, 55, 303–319. [Google Scholar] [CrossRef]
  2. Dunkerley, D. Identifying Individual Rain Events from Pluviograph Records: A Review with Analysis of Data from an Australian Dryland Site. Hydrol. Process. 2008, 22, 5024–5036. [Google Scholar] [CrossRef]
  3. Adams, B.J.; Papa, F. Urban Stormwater Management Planning with Analytical Probabilistic Models, 1st ed.; Wiley: New York, NY, USA, 2000. [Google Scholar]
  4. Joo, J.; Lee, J.; Kim, J.; Jun, H.; Jo, D.J. Inter-Event Time Definition Setting Procedure for Urban Drainage Systems. Water 2013, 6, 45–58. [Google Scholar] [CrossRef]
  5. Lee, E.H.; Kim, J. Development of New Inter-Event Time Definition Technique in Urban Areas. KSCE J. Civ. Eng. 2018, 22, 3764–3771. [Google Scholar] [CrossRef]
  6. Guo, Y.; Adams, B. Hydrologic Analysis of Urban Catchments with Event-Based Probabilistic Models: 1. Runoff Volume. Water Resour. Res. 1998, 34, 3421–3432. [Google Scholar] [CrossRef]
  7. Carbone, M.; Turco, M.; Brunetti, G.; Piro, P. Minimum Inter-Event Time to Identify Independent Rainfall Events in Urban Catchment Scale. Adv. Mater. Res. 2014, 1073, 1630–1633. [Google Scholar] [CrossRef]
  8. Balistrocchi, M.; Grossi, G.; Bacchi, B. An Analytical Probabilistic Model of the Quality Efficiency of a Sewer Tank. Water Resour. Res. 2009, 45, W12420. [Google Scholar] [CrossRef]
  9. Wang, J.; Guo, Y. Proper Sizing of Infiltration Trenches Using Closed-Form Analytical Equations. Water Resour. Manag. 2020, 34, 3809–3821. [Google Scholar] [CrossRef]
  10. Lucas, W. Design of Integrated Bioinfiltration-Detention Urban Retrofits With Design Storm and Continuous Simulation Methods. J. Hydrol. Eng. 2010, 15, 486–498. [Google Scholar] [CrossRef]
  11. Zhang, S.; Guo, Y. SWMM Simulation of the Storm Water Volume Control Performance of Permeable Pavement Systems. J. Hydrol. Eng. 2014, 20, 06014010. [Google Scholar] [CrossRef]
  12. Quader, A.; Guo, Y. Peak Discharge Estimation Using Analytical Probabilistic and Design Storm Approaches. J. Hydrol. Eng. 2006, 11, 46–54. [Google Scholar] [CrossRef]
  13. Chahar, B.; Graillot, D.; Gaur, S. Storm-Water Management through Infiltration Trenches. J. Irrig. Drain. Eng. 2012, 138, 274–281. [Google Scholar] [CrossRef]
  14. Raimondi, A.; Becciu, G. Performance of Green Roofs for Rainwater Control. Water Resour. Manag. 2021, 34, 99–111. [Google Scholar] [CrossRef]
  15. Chen, J.; Adams, B. A Framework for Urban Storm Water Modeling and Control Analysis with Analytical Models. Water Resour. Res. 2006, 42, W06419. [Google Scholar] [CrossRef]
  16. Wang, J.; Guo, Y. An Analytical Stochastic Approach for Evaluating the Performance of Combined Sewer Overflow Tanks. Water Resour. Res. 2018, 54, 3357–3375. [Google Scholar] [CrossRef]
  17. Guo, R.; Guo, Y.; Wang, J. Stormwater Capture and Antecedent Moisture Characteristics of Permeable Pavements. Hydrol. Process. 2018, 32, 2708–2720. [Google Scholar] [CrossRef]
  18. Wang, J.; Guo, Y. Stochastic Analysis of Storm Water Quality Control Detention Ponds. J. Hydrol. 2019, 571, 573–584. [Google Scholar] [CrossRef]
  19. U.S.EPA. Methodology for Analysis of Detention Basins for Control of Urban Runoff Quality; EPA: Washington, DC, USA, 1986; Volume 440, pp. 5–87. [Google Scholar]
  20. Shamsudin, S.; Dan’azumi, S.; Aris, A.; Yusop, Z. Optimum Combination of Pond Volume and Outlet Capacity of a Stormwater Detention Pond Using Particle Swarm Optimization. Urban Water J. 2013, 11, 127–136. [Google Scholar] [CrossRef]
  21. Zeng, J.; Huang, G.; Mai, Y.; Chen, W. Optimizing the Cost-Effectiveness of Low Impact Development (LID) Practices Using an Analytical Probabilistic Approach. Urban Water J. 2020, 17, 136–143. [Google Scholar] [CrossRef]
  22. Hassini, S.; Guo, Y. Exponentiality Test Procedures for Large Samples of Rainfall Event Characteristics. J. Hydrol. Eng. 2016, 21, 04016003. [Google Scholar] [CrossRef]
  23. Nojumuddin, N.; Yusof, F.; Yusop, Z. Determination of Minimum Inter-Event Time for Storm Characterization in Johor, Malaysia. J. Flood Risk Manag. 2016, 11, S687–S699. [Google Scholar] [CrossRef]
  24. Nix, S.J. Urban Stormwater Modeling and Simulation, 1st ed.; CRC Press: Boca Raton, FL, USA, 1994. [Google Scholar]
  25. Balistrocchi, M.; Grossi, G.; Bacchi, B. Deriving a Practical Analytical-Probabilistic Method to Size Flood Routing Reservoirs. Adv. Water Resour. 2013, 62, 37–46. [Google Scholar] [CrossRef]
  26. Bacchi, B.; Balistrocchi, M.; Grossi, G. Proposal of a Semi-Probabilistic Approach for Storage Facility Design. Urban Water J. 2008, 5, 195–208. [Google Scholar] [CrossRef]
  27. Guo, Y.; Baetz, B. Sizing of Rainwater Storage Units for Green Building Applications. J. Hydrol. Eng. 2007, 12, 197–205. [Google Scholar] [CrossRef]
  28. Rajagopalan, B.; Lall, U.; Tarboton, D. Evaluation of Kernel Density Estimation Methods for Daily Precipitation Resampling. Stoch. Hydrol. Hydraul. 1997, 11, 523–547. [Google Scholar] [CrossRef]
  29. Pavlides, A.; Agou, V.D.; Hristopulos, D.T. Non-parametric Kernel-based Estimation and Simulation of Precipitation Amount. J. Hydrol. 2022, 612, 127988. [Google Scholar] [CrossRef]
  30. Cacoullos, T. Estimation of a Multivariate Density. Ann. Inst. Stat. Math. 1966, 18, 179–189. [Google Scholar] [CrossRef]
  31. Devroye, L. The Equivalence of Weak, Strong and Complete Convergence in L1 for Kernel Density Estimates. Ann. Stat. 1983, 11, 896–904. [Google Scholar] [CrossRef]
  32. Mosthaf, T.; Bárdossy, A. Regionalizing Nonparametric Models of Precipitation Amounts on Different Temporal Scales. Hydrol. Earth Syst. Sci. 2017, 21, 2463–2481. [Google Scholar] [CrossRef]
  33. Wang, S.; Wang, S.; Wang, D. Combined Probability Density Model for Medium Term Load Forecasting Based on Quantile Regression and Kernel Density Estimation. Energy Procedia 2019, 158, 6446–6451. [Google Scholar] [CrossRef]
  34. Wu, Z.; Bhattacharya, B.; Xie, P.; Zevenbergen, C. Improving Flash Flood Forecasting Using a Frequentist Approach to Identify Rainfall Thresholds for Flash Flood Occurrence. Stoch. Environ. Res. Risk Assess. 2022, 37, 429–440. [Google Scholar] [CrossRef]
  35. Jiang, S.; Wang, M.; Ren, J.; Liu, Y.; Zhou, L.; Cui, H.; Xu, C.-Y. An Integrated Approach for Identification and Quantification of Ecological Drought in Rivers from an Ecological Streamflow Perspective. Ecol. Indic. 2022, 143, 109410. [Google Scholar] [CrossRef]
  36. Kim, J.S.; Jain, S.; Lee, J.H.; Chen, H.; Park, S.Y. Quantitative Vulnerability Assessment of Water Quality to Extreme Drought in a Changing Climate. Ecol. Indic. 2019, 103, 688–697. [Google Scholar] [CrossRef]
  37. Eagleson, P. Dynamics of Flood Frequency. Water Resour. Res. 1972, 8, 878–898. [Google Scholar] [CrossRef]
  38. Segarra, R. Reliability-Based Design of Urban Stormwater Detention Facilities with Random Carryover Storage. J. Water Resour. Plan. Manag. 2020, 146, 04019076. [Google Scholar] [CrossRef]
  39. Parzen, E. On the Estimation of Probability Density Functions and Mode. Ann. Math. Stat. 1962, 33, 1065–1076. [Google Scholar] [CrossRef]
  40. Botev, Z.; Grotowski, J.; Kroese, D. Kernel Density Estimation via Diffusion. Ann. Stat. 2010, 38, 2916–2957. [Google Scholar] [CrossRef]
  41. Marron, J.S.; Nolan, D. Canonical Kernels for Density Estimation. Stat. Probab. Lett. 1988, 7, 195–199. [Google Scholar] [CrossRef]
  42. Silverman, B.W. Density Estimation for Statistics and Data Analysis, 1st ed.; Routledge: New York, NY, USA, 1998. [Google Scholar]
  43. Schuster, E. Incorporating Support Constraints into Nonparametric Estimators of Densities. Commun. Stat.-Theory Methods 1985, 14, 1123–1136. [Google Scholar] [CrossRef]
  44. Jones, M. Simple Boundary Correction for Kernel Density Estimation. Stat. Comput. 1993, 3, 135–146. [Google Scholar] [CrossRef]
  45. Sauer, T. Numerical Analysis, 2nd ed.; Pearson: Boston, MA, USA, 2011. [Google Scholar]
  46. Darkwah, K.; Nortey, E.; Lotsi, A. Estimation of the Gini Coefficient for the Lognormal Distribution of Income Using the Lorenz Curve. SpringerPlus 2016, 5, 1196. [Google Scholar] [CrossRef]
  47. Zhang, S.; Karunamuni, R. Deconvolution Boundary Kernel Method in Nonparametric Density Estimation. J. Stat. Plan. Inference 2009, 139, 2269–2283. [Google Scholar] [CrossRef]
  48. Cunnane, C. A Note on the Poisson Assumption in Partial Duration Series Models. Water Resour. Res. 1979, 15, 489–494. [Google Scholar] [CrossRef]
  49. Cruise, J.; Arora, K. A Hydroclimatic Application Strategy for the Poisson Partial Duration Model. J. Am. Water Resour. Assoc. 2007, 26, 431–442. [Google Scholar] [CrossRef]
  50. Evans, D.; Drew, J.; Leemis, L. The Distribution of the Kolmogorov–Smirnov, Cramer–von Mises, and Anderson–Darling Test Statistics for Exponential Populations with Estimated Parameters. Commun. Stat.-Simulat. Comput. 2008, 37, 1396–1421. [Google Scholar] [CrossRef]
  51. Wang, J.; Zhang, S.; Guo, Y. Analyzing the Impact of Impervious Area Disconnection on Urban Runoff Control Using an Analytical Probabilistic Model. Water Resour. Manag. 2019, 33, 1753–1768. [Google Scholar] [CrossRef]
  52. Zhou, J.; Gu, B.; Schlesinger, W.; Ju, X. Significant Accumulation of Nitrate in Chinese Semi-Humid Croplands. Sci. Rep. 2016, 6, 25088. [Google Scholar] [CrossRef] [PubMed]
  53. Wang, S.; Zhang, Q.; Yue, P.; Wang, J. Effects of Evapotranspiration and Precipitation on Dryness/Wetness Changes in China. Theor. Appl. Climatol. 2020, 142, 1027–1038. [Google Scholar] [CrossRef]
  54. Wang, W.; Yin, S.; Xie, Y.; Nearing, M.A. Minimum Inter-event Times for Rainfall in the Eastern Monsoon Region of China. Trans. ASABE 2019, 62, 9–18. [Google Scholar] [CrossRef]
Figure 1. Flow chart of the methodology.
Water 15 00580 g001
Figure 2. Location map of the two case study areas.
Water 15 00580 g002
Figure 3. Comparison of the KDE-based PDFs and theoretical exponential PDFs of rainfall event volume v, rainfall event duration t, rainfall inter-event time b: (ac). Hangzhou (MIET = 12 h, vt = 3 mm); (df). Jinan (MIET = 10 h, vt = 3 mm).
Water 15 00580 g003
Figure 4. (a) The KDE-based PDFs for rainfall event volume v with different MIETs and fixed vt = 2 mm at Jinan; (b) the theoretical exponential PDFs of rainfall event volume v with different MIETs and fixed vt = 2 mm at Jinan.
Water 15 00580 g004
Figure 5. Comparison of CDF of KDE and theoretical exponential CDF of rainfall event volume v, rainfall event duration t, rainfall inter-event time b for the optimal MIET and rainfall event volume threshold: (ac) Hangzhou (MIET = 12 h, vt = 3 mm); (df) Jinan (MIET = 10 h, vt = 3 mm).
Water 15 00580 g005
Table 1. Geographic and climatic information of the rain gauge stations for two case study areas.
StationStation NumberLatitude LongitudeRange of
Years
Range of
Months
Average Annual
Precipitation (mm)
Climate Condition
Jinan54,823N36°60′E117°00′1959–2015May.–Oct.688.5Semi-humid
Hangzhou58,457N30°23′E120°17′1955–2015Apr.–Oct.1510.0Humid
Note: the average annual precipitation is obtained from China Statistical Yearbook (2007–2016). Humid climate area is defined based on the annual precipitation > 800 mm while semi-humid area is usually associated with the annual precipitation ranging from 400 to 800 mm [52,53].
Table 2. Total number of rainfall events with different pairs of MIET and vt for Jinan and Hangzhou.
Hangzhou Jinan
MIET (h) 681012 MIET (h) 681012
vt (mm) vt (mm)
0576951324628417202567240822902180
1385435253234295511860179717441692
2327630362807259021606156215211490
3289326952517233331453141913901360
4260224442301214741326130112761248
5236422392129200051227120711891164
Table 3. Rainfall event characteristics with different pairs of MIET and vt for Jinan and Hangzhou.
HangzhouJinan
MIET (h)-vt (mm)v⟩ (mm)t⟩ (h)b⟩ (h)v⟩ (mm)t⟩ (h)b⟩ (h)
6-010.488.4844.6613.217.4887.18
6-115.4911.6466.7018.079.49117.23
6-217.9512.8878.6920.6910.32135.80
6-320.0013.8588.6022.6110.84148.47
6-421.8414.7198.9224.4311.28161.50
6-523.5815.45109.5126.0411.66174.30
8-011.7810.3449.4114.088.4092.51
8-116.9614.0371.6318.7310.45120.71
8-219.4515.5083.3321.3111.35138.90
8-321.6016.6893.3223.2111.93151.20
8-423.4517.67103.3524.9912.40163.71
8-525.1918.56113.4126.5912.83176.23
10-013.0612.3953.8714.819.2796.85
10-118.5116.7176.7519.3111.42123.74
10-221.1018.4388.4621.9212.44141.87
10-323.2419.8398.0423.7413.05154.12
10-425.0920.98107.6725.5513.51166.07
10-526.7621.93116.8927.0913.97177.97
12-014.4914.8958.6215.5610.26101.22
12-120.2920.0382.2719.9112.51126.82
12-222.9422.0393.9022.4113.56144.14
12-325.1923.67103.5324.3114.23156.64
12-427.0625.01112.9126.1814.73169.17
12-528.7226.12121.7327.7415.26180.88
Table 4. Results of Poisson Tests for Hangzhou and Jinan—Annual Number of Rainfall Events.
HangzhouJinan
MIET (h)-vt (mm)Critical Value of rp Ranges (α = 0.10)Resulting rpDecisionCritical Value of rp Ranges (α = 0.10)Resulting rpDecision
6-00.72–1.321.54Reject0.71–1.331.25Accept
6-10.72–1.321.25Accept0.71–1.330.86Accept
6-20.72–1.321.29Accept0.71–1.330.97Accept
6-30.72–1.321.25Accept0.71–1.331.12Accept
6-40.72–1.321.22Accept0.71–1.331.08Accept
6-50.72–1.321.16Accept0.71–1.331.21Accept
8-00.72–1.321.44Reject0.71–1.331.01Accept
8-10.72–1.321.15Accept0.71–1.330.83Accept
8-20.72–1.321.13Accept0.71–1.330.95Accept
8-30.72–1.321.17Accept0.71–1.331.09Accept
8-40.72–1.321.11Accept0.71–1.331.06Accept
8-50.72–1.321.07Accept0.71–1.331.16Accept
10-00.72–1.321.29Accept0.71–1.330.93Accept
10-10.72–1.321.01Accept0.71–1.330.79Accept
10-20.72–1.320.94Accept0.71–1.330.93Accept
10-30.72–1.320.98Accept0.71–1.331.02Accept
10-40.72–1.320.98Accept0.71–1.330.98Accept
10-50.72–1.320.90Accept0.71–1.331.10Accept
12-00.72–1.321.15Accept0.71–1.330.87Accept
12-10.72–1.320.82Accept0.71–1.330.76Accept
12-20.72–1.320.73Accept0.71–1.330.84Accept
12-30.72–1.320.75Accept0.71–1.330.93Accept
12-40.72–1.320.74Accept0.71–1.330.86Accept
12-50.72–1.320.70Reject0.71–1.330.95Accept
Table 5. Results of K-S statistical tests for Hangzhou.
Rainfall Event Volume vRainfall Event Duration tRainfall Inter-Event Time b
MIET (h)- vt (mm)K-S StatisticCritical Value
(α = 0.10)
K-S StatisticCritical Value
(α = 0.10)
K-S StatisticCritical Value
(α = 0.10)
6-00.2130.0660.1070.1020.1550.209
6-10.0980.0660.0440.1020.0960.188
6-20.0690.0660.0330.1020.0780.188
6-3 a0.0580.0660.0310.1020.0730.174
6-40.0810.0660.0330.1010.0640.174
6-50.1080.0660.0320.1020.0540.174
8-00.2100.0660.1320.1000.1240.209
8-10.0990.0660.0520.1000.0690.188
8-20.0710.0660.0330.1000.0630.186
8-3 a0.0580.0660.0190.0990.0560.176
8-40.0690.0660.0160.0990.0480.174
8-50.0930.0660.0170.0980.0400.174
10-00.2020.0590.1430.0860.0870.209
10-10.0970.0590.0550.0860.0550.188
10-20.0680.0590.0330.0850.0470.186
10-3 a0.0560.0590.0170.0850.0400.174
10-40.0600.0590.0130.0850.0310.174
10-50.0840.0590.0170.0850.0260.174
12-00.1980.0590.1510.0860.0760.209
12-10.0920.0590.0620.0850.0370.188
12-20.0630.0590.0380.0850.0270.186
12-3 a0.0510.0590.0210.0840.0210.174
12-4 a0.0550.0590.0200.0840.0200.174
12-50.0790.0590.0260.0840.0170.174
Note: a The pair of MIET and vt with acceptable K-S test results hypothesizing that the three rainfall event characteristics (v, t, b) follow the exponential distribution.
Table 6. Results of K-S tests for Jinan.
Rainfall Event Volume vRainfall Event Duration tRainfall Inter-Event Time b
MIET (h)- vt (mm)KS StatisticCritical Value (α = 0.10)KS StatisticCritical Value (α = 0.10)KS StatisticCritical Value (α = 0.10)
6-00.1790.0710.0490.1250.0560.188
6-10.0890.0710.0420.1240.0250.171
6-2 a0.0610.0710.0520.1230.0290.169
6-3 a0.0510.0710.0550.1230.0260.169
6-4 a0.0580.0710.0550.1230.0280.151
6-50.0790.0710.0590.1230.0260.150
8-00.1680.0710.0470.1190.0390.188
8-10.0870.0710.0320.1180.0180.171
8-2 a0.0610.0710.0430.1180.0270.169
8-3 a0.0510.0710.0490.1170.0250.169
8-4 a0.0540.0710.0520.1170.0260.155
8-50.0750.0710.0550.1170.0230.150
10-00.1600.0710.0510.1180.0300.188
10-10.0840.0710.0240.1180.0150.171
10-2 a0.0600.0710.0370.1170.0250.169
10-3 a0.0490.0710.0440.1170.0230.169
10-4 a0.0520.0710.0490.1170.0240.155
10-50.0710.0710.0530.1170.0210.150
12-00.1540.0710.0580.1060.0220.188
12-10.0860.0710.0160.1050.0240.171
12-2 a0.0620.0710.0280.1050.0220.169
12-3 a0.0500.0710.0350.1050.0220.169
12-4 a0.0480.0710.0410.1040.0230.155
12-5 a0.0670.0710.0470.1040.0200.150
Note: a The pair of MIET and vt with acceptable K-S test results hypothesizing that the three rainfall event characteristics (v, t, b) follow the exponential distribution.
Table 7. The Rr results for Hangzhou and Jinan.
HangzhouJinan
MIET (h)-vt (mm) Rr (%)MIET (h)-vt (mm) Rr (%)
12-38.8410-38.97
10-39.678-39.08
6-39.776-39.20
8-310.1912-39.29
12-432.546-211.88
8-212.09
10-212.13
12-212.75
12-427.35
10-429.21
8-430.04
6-431.24
12-534.68
Disclaimer/Publisher’s Note: The statements, opinions and data contained in all publications are solely those of the individual author(s) and contributor(s) and not of MDPI and/or the editor(s). MDPI and/or the editor(s) disclaim responsibility for any injury to people or property resulting from any ideas, methods, instructions or products referred to in the content.

