Contamination and Risk Assessment of Potentially Toxic Elements in Coastal Sediments of the Area between Al-Jubail and Al-Khafji, Arabian Gulf, Saudi Arabia
Abstract
:1. Introduction
2. Materials and Methods
2.1. Study Area and Sampling
2.2. Analytical and Assessment Methods
3. Results and Discussion
3.1. Distribution of PTEs
3.2. Contamination and Risk Assessment of PTEs
3.3. Potential Sources of PTEs
4. Conclusions
Supplementary Materials
Author Contributions
Funding
Data Availability Statement
Acknowledgments
Conflicts of Interest
References
- Bellas, J.; Hylland, K.; Burgeot, T. Editorial: New challenges in marine pollution monitoring. Front. Mar. Sci. 2020, 6, 820. [Google Scholar] [CrossRef]
- Di Cesare, A.; Pjevac, P.; Eckert, E.; Curkov, N.; Sparica, M.M.; Corno, G.; Orlicm, S. The role of the metal contamination in shaping microbial communities in heavily polluted marine sediments. Environ. Pollut 2020, 265, 114823. [Google Scholar] [CrossRef] [PubMed]
- Alfaifi, H.J.; El-Sorogy, A.S.; Qaysi, S.; Kahal, A.; Almadani, S.; Alshehri, F.; Zaidi, F.K. Evaluation of heavy metal contamination and groundwater quality along the Red Sea coast, southern Saudi Arabia. Mar. Pollut. Mar. Pollut. Bull. 2021, 163, 111975. [Google Scholar] [CrossRef]
- Kahal, A.; El-Sorogy, A.S.; Qaysi, S.; Almadani, S.; Kassem, O.M.; Al-Dossari, A. Contamination and ecological risk assessment of the Red Sea coastal sediments, southwest Saudi Arabia. Mar. Pollut. Bull. 2020, 154, 111125. [Google Scholar] [CrossRef] [PubMed]
- Nour, H.E.; El-Sorogy, A.S. Heavy metals contamination in seawater, sediments and seashells of the Gulf of Suez, Egypt. Environ. Earth Sci. 2020, 79, 274. [Google Scholar] [CrossRef]
- Mondal, P.; Reicheltbrushett, A.J.; Jonathan, M.P.; Sujitha, S.B.; Sarkar, S.K. Pollution evaluation of total and acid-leachable trace elements in surface sediments of Hooghly River Estuary and Sundarban Mangrove Wetland (India). Environ. Sci. Pollut. Res. 2017, 25, 5681–5699. [Google Scholar] [CrossRef]
- Petranich, E.; Croce, S.; Crosera, M.; Pavoni, E.; Faganeli, J.; Adami, G.; Covelli, S. Mobility of metal(loid)s at the sediment-water interface in two tourist port areas of the Gulf of Trieste (northern Adriatic Sea). Environ. Sci. Pollut. Res. 2018, 25, 26887–26902. [Google Scholar] [CrossRef]
- Valdés, J.; Tapia, J.S. Spatial monitoring of metals and As in coastal sediments of northern Chile: An evaluation of background values for the analysis of local environmental conditions. Mar. Pollut. Bull. 2019, 145, 624–640. [Google Scholar] [CrossRef]
- Harikrishnan, N.; Ravisankar, R.; Chandrasekaran, A.; Suresh Gandhi, M.; Kanagasabapathy, K.V.; Prasad, M.V.R.; Satapathy, K.K. Assessment of heavy metal contamination in marine sediments of East coast of Tamil Nadu affected by different pollution sources. Mar. Pollut. Bull. 2017, 121, 418–424. [Google Scholar] [CrossRef]
- Alharbi, T.; El-Sorogy, A. Assessment of seawater pollution of the Al-Khafji coastal area, Arabian Gulf, Saudi Arabia. Environ. Monit. Assess. 2019, 191, 383. [Google Scholar] [CrossRef]
- Trifuoggi, M.; Donadio, C.; Mangoni, O.; Ferrara, L.; Bolinesi, F.; Nastro, R.; Stanislao, C.; Toscanesi, M.; Di Natale, G.; Arienzo, M. Distribution and enrichment of trace metals in surface marine sediments in the Gulf of Pozzuoli and off the coast of the brownfield metallurgical site of Ilva of Bagnoli (Campania, Italy). Mar. Pollut. Bull. 2017, 124, 502–511. [Google Scholar] [CrossRef] [PubMed]
- Al-Kahtany, K.; El-Sorogy, A.S. Contamination and health risk assessment of surface sediments along Ras Abu Ali Island, Saudi Arabia. J. King Saud Univ. Sci. 2023, 35, 102509. [Google Scholar] [CrossRef]
- Al-Kahtany, K.; El-Sorogy, A.S. Heavy metal contamination of surface seawaters in Abu Ali Island, Saudi Arabia. Arab. J. Geosci. 2022, 15, 1662. [Google Scholar] [CrossRef]
- El-Sorogy, A.S.; Alharbi, T.; Almadani, S.; Al-Hashim, M. Molluscan assemblage as pollution indicators in Al-Khobar coastal plain, Arabian Gulf, Saudi Arabia. J. Afr. Earth Sci. 2019, 158, 103564. Available online: http://www.ncbi.nlm.nih.gov/pubmed/103564 (accessed on 20 July 2022). [CrossRef]
- El-Sorogy, A.S.; Demircan, H.; Alharbi, T. Gastrochaenolites ichnofacies from intertidal seashells, Al-Khobar coastline, Saudi Arabia. J. Afr. Earth Sci. 2020, 171, 103943. [Google Scholar] [CrossRef]
- Alharbi, T.; Alfaifi, H.; Almadani, S.A.; El-Sorogy, A. Spatial distribution and metal contamination in the coastal sediments of Al-Khafji area, Arabian Gulf, Saudi Arabia. Environ. Monit. Assess. 2017, 189, 634. [Google Scholar] [CrossRef]
- Alharbi, T.; Alfaifi, H.; El-Sorogy, A. Metal pollution in Al-Khobar seawater, Arabian Gulf, Saudi Arabia. Mar. Pollut. Bull. 2017, 119, 407–415. [Google Scholar] [CrossRef]
- Alharbi, T.; El-Sorogy, A.S. Assessment of metal contamination in coastal sediments of Al-Khobar area, Arabian Gulf, Saudi Arabia. J. Afr. Earth Sci. 2017, 129, 458–468. [Google Scholar] [CrossRef]
- El-Sorogy, A.; Youssef, M.; Al-Kahtany, K. Integrated assessment of the Tarut Island coast, Arabian Gulf, Saudi Arabia. Environ. Earth Sci. 2016, 75, 1336. [Google Scholar] [CrossRef]
- Al-Kahtany, K.; Nour, H.E.; Giacobbe, S.; Alharbi, T.; El-Sorogya, A.S. Heavy metal pollution in surface sediments and human health assessment in southern Al-Khobar coast, Saudi Arabia. Mar. Pollut. Bull. 2023, 187, 114508. [Google Scholar] [CrossRef]
- Al-Hashim, M.H.; El-Sorogy, A.S.; Al Qaisi, S.; Alharbi, T. Contamination and ecological risk of heavy metals in Al-Uqair coastal sediments, Saudi Arabia. Mar. Pollut. Bull. 2021, 171, 112748. [Google Scholar] [CrossRef] [PubMed]
- Al-Hashim, M.H.; El-Sorogy, A.S.; Alshehri, F.; Qaisi, S. Environmental Assessment of Surface Seawater in Al-Uqair Coastline, Eastern Saudi Arabia. Water 2022, 14, 3423. [Google Scholar] [CrossRef]
- Alharbi, T.; Al-Kahtany, K.; Nour, H.E.; Giacobbe, S.; El-Sorogy, A.S. Contamination and health risk assessment of arsenic and chromium in coastal sediments of Al-Khobar area, Arabian Gulf, Saudi Arabia. Mar. Pollut. Bull. 2022, 185, 114255. [Google Scholar] [CrossRef] [PubMed]
- El-Sorogy, A.S.; Alharbi, T.; Richiano, S. Bioerosion structures in high-salinity marine environments: A case study from the Al–Khafji coastline, Saudi Arabia. Estuar. Coast. Shelf Sci. 2018, 204, 264–272. [Google Scholar] [CrossRef]
- El-Sorogy, A.S.; Demircan, H.; Al-Kahtany, K. Taphonomic signatures on modern molluscs and corals from Red Sea coast, southern Saudi Arabia. Palaeoworld 2021, 31, 365–381. [Google Scholar] [CrossRef]
- Demircan, H.; EL-Sorogy, A.S.; Alharbi, T. Bioerosional structures from the Late Pleistocene coral reef, Red Sea coast, northwest Saudi Arabia. Turk. J. Earth Sci. 2021, 30, 22–37. [Google Scholar] [CrossRef]
- El-Sorogy, A.S.; Youssef, M. Assessment of heavy metal contamination in intertidal gastropod and bivalve shells from central Arabian Gulf coastline, Saudi Arabia. J. Afr. Earth Sci. 2015, 111, 41–53. [Google Scholar] [CrossRef]
- Manousi, N.; Zachariadis, G.A. Development and Application of an ICP-AES Method for the Determination of Nutrient and Toxic Elements in Savory Snack Products after Autoclave Dissolution. Separations 2020, 7, 66. [Google Scholar] [CrossRef]
- Boevski, I.; Daskalova, N. A method for determination of toxic and heavy metals in suspended matter from natural waters by inductively coupled plasma atomic emission spectrometry (ICP-AES). Part, I. Determination of toxic and heavy metals in surface river water samples. J. Univ. Chem. Technol. Metall. 2007, 42, 419–426. [Google Scholar]
- Christodoulou, E.A.; Samanidou, V.F. Multiresidue HPLC analysis of ten quinolones in milk after solid phase extraction: Validation according to the European Union Decision 2002/657/EC. J. Sep. Sci. 2007, 30, 2421–2429. [Google Scholar] [CrossRef]
- Papadoyannis, I.N.; Samanidou, V.F. Validation of HPLC Instrumentation. J. Liq. Chrom. Relat. Tech. 2004, 27, 753–783. [Google Scholar] [CrossRef]
- Kowalska, J.B.; Mazurek, R.; Gasiorek, M.; Zaleski, T. Pollution indices as useful tools for the comprehensive evaluation of the degree of soil contamination—A review. Environ. Geochem. Health 2018, 40, 2395–2420. [Google Scholar] [CrossRef]
- Long, E.R.; MacDonald, D.D.; Smith, S.L.; Calder, F.D. Incidence of adverse biological effects within ranges of chemical concentrations in marine and estuarine sediments. Environ. Manag. 1995, 19, 81–97. [Google Scholar] [CrossRef]
- Crane, J.; MacDonald, D. Applications of numerical sediment quality targets for assessing sediment quality conditions in a US Great Lakes area of concern. Environ. Manag. 2003, 32, 128–140. [Google Scholar] [CrossRef]
- Hakanson, L. An ecological risk index for aquatic pollution control. A sedimentological approach. Water Res. 1980, 14, 975–1001. [Google Scholar] [CrossRef]
- Bhuiyan, M.; Islam, M.A.; Dampare, S.B.; Parvez, L.; Suzuki, S. Evaluation of hazardous metal pollution in irrigation and drinking water systems in the vicinity of a coal mine area of northwestern Bangladesh. J. Hazard. Mater. 2010, 0179, 1065–1077. [Google Scholar] [CrossRef] [PubMed]
- Turekian, K.K.; Wedepohl, K.H. Distribution of the elements in some major units of the earth’s crust. Geol. Soc. Amer. 1961, 72, 175–192. [Google Scholar] [CrossRef]
- Taylor, S.R. Abundance of chemical elements in the continental crust: A new table. Geoch. Cosmoch. Acta 1964, 28, 1273–1285. [Google Scholar] [CrossRef]
- Nour, H.N.; Alshehri, F.; Sahour, H.; El-Sorogy, A.S.; Tawfik, M. Assessment of heavy metal contamination and health risk in the coastal sediments of Suez Bay, Gulf of Suez, Egypt. J. Afr. Earth Sci. 2022, 195, 104663. [Google Scholar] [CrossRef]
- EL-Sorogy, A.S.; Tawfik, M.; Almadani, S.A.; Attiah, A. Assessment of toxic metals in coastal sediments of the Rosetta area, Mediterranean Sea, Egypt. Environ. Earth Sci. 2016, 75, 398. [Google Scholar] [CrossRef]
- Nour, H.; El-Sorogy, A.S. Distribution and enrichment of heavy metals in Sabratha coastal sediments, Mediterranean Sea, Libya. J. Afr. Earth Sci. 2017, 134, 222–229. [Google Scholar] [CrossRef]
- Aghadadashi, V.; Neyestani, M.R.; Mehdinia, A.; Riyahi Bakhtiari, A.; Molaei, S.; Farhangi, M.; Esmaili, M.; Rezai Marnani, H.; Gerivani, H. Spatial distribution and vertical profile of heavy metals in marine sediments around Iran’s special economic energy zone; arsenic as an enriched contaminant. Mar. Pollut. Bull. 2019, 138, 437–450. [Google Scholar] [CrossRef] [PubMed]
- Birch, G.F. Determination of sediment metal background concentrations and enrichment in marine environments—A critical review. Sci. Total Environ. 2017, 580, 813–831. [Google Scholar] [CrossRef] [PubMed]
- Birch, G.F. A scheme for assessing human impacts on coastal aquatic environments using sediments. In Wollongong University Papers in Center for Maritime Policy; Woodcoffe, C.D., Furness, R.A., Eds.; Coastal GIS: Wollongong, Australia, 2003; Volume 14. [Google Scholar]
- Essien, J.; Antai, S.; Olajire, A. Distribution, seasonal variations and ecotoxicological significance of heavy metals in sediments of Cross River Estuary mangrove swamp. Water Air Soil Pollut. 2009, 197, 91–105. [Google Scholar] [CrossRef]
- Larrose, A.; Coynel, A.; Schäfer, J.; Blanc, G.; Massé, L.; Maneux, E. Assessing the current state of the Gironde Estuary by mapping priority contaminant distribution and risk potential in surface sediment. App. Geochem. 2010, 25, 1912–1923. [Google Scholar] [CrossRef]
- Rabee, A.M.; Al-Fatlawy, Y.F.; Nameer, M. Using Pollution Load Index (PLI) and geoaccumulation index (I-Geo) for the assessment of heavy metals pollution in Tigris river sediment in Baghdad Region. Al-Nahrain J. Sci. 2011, 14, 108–114. [Google Scholar] [CrossRef]
- Hossain, M.S.; Ahmed, M.K.; Liyana, E.; Hossain, M.S.; Jolly, Y.N.; Kabir, M.J.; Akter, S.; Rahman, M.S. A case study on metal contamination in water and sediment near a coal thermal power plant on the Eastern Coast of Bangladesh. Environments 2021, 8, 108. [Google Scholar] [CrossRef]
- Javed, J.; Ahmad, N.; Mashiatullah, A. Heavy metals contamination and ecological risk assessment in surface sediments of Namal Lake, Pakistan. Pol. J. Environ. Stud. 2018, 27, 675–688. [Google Scholar] [CrossRef]
- Hao, J.; Ren, J.; Tao, L.; Fang, H.; Gao, S.; Chen, Y. Pollution evaluation and sources identification of heavy metals in surface sediments from upstream of Yellow River. Pol. J. Env. Stud. 2021, 30, 1161–1169. [Google Scholar] [CrossRef]
- Hardaway, C.J.; Sneddon, J.; Sneddon, E.J.; Kiran, B.; Lambert, B.J.; McCray, T.C.; Bowser, D.Q.; Douvris, C. Study of selected metal concentrations in sediments by inductively coupled plasma-optical emission spectrometry from a metropolitan and more pristine bayou in Southwest Louisiana, United States. Microchem. J. 2016, 127, 213–219. [Google Scholar] [CrossRef]
- Ogwueleka, T.C. Use of multivariate statistical techniques for the evaluation of temporal and spatial variations in water quality of the Kaduna River, Nigeria. Environ. Monit. Assess. 2015, 187, 137. [Google Scholar] [CrossRef] [PubMed]
- Jahan, S.; Strezov, V. Comparison of pollution indices for the assessment of heavy metals in the sediments of seaports of NSW, Australia. Mar. Pollut. Bull. 2018, 128, 295–306. [Google Scholar] [CrossRef] [PubMed]
- Dou, Y.G.; Li, J.; Zhao, J.T.; Hu, B.Q.; Yang, S.Y. Distribution, enrichment and source of heavy metals in surface sediments of the eastern Beibu Bay, South China Sea. Mar. Pollut. Bull. 2013, 67, 137–145. [Google Scholar] [CrossRef] [PubMed]

| EF | EF < 1 | no enrichment |
| EF < 3 | minor enrichment | |
| EF = 3–5 | moderate enrichment | |
| EF = 5–10 | moderately severe enrichment | |
| EF = 10–25 | severe enrichment | |
| EF = 25–50 | very severe enrichment | |
| EF > 50 | extremely severe enrichment | |
| CF | CF < 1 | low contamination |
| 1 ≤ CF <3 | moderate contamination | |
| 3 ≤ CF < 6 | considerable contamination | |
| CF ≥ 6 | very high contamination | |
| PLI | PLI < 1 | unpolluted |
| PLI > 1 | polluted | |
| m-ERMQ | m-ERMQ < 0.1 | 9% probability of toxicity |
| 0.1 ≤ m-ERMQ < 0.5 | 21% probability of toxicity | |
| 0.5 ≤ m-ERMQ < 1.5 | 49% probability of toxicity | |
| 1.5 ≤ m-ERM-Q | 76% probability of toxicity |
| Location and References | As | Cr | Cu | Ni | Pb | Zn | Hg | |
|---|---|---|---|---|---|---|---|---|
| Present study | Minimum | 2.00 | 3.00 | 1.00 | 2.00 | 1.50 | 2.00 | 0.50 |
| Maximum | 4.00 | 20.0 | 5.00 | 32.0 | 5.00 | 14.0 | 1.00 | |
| Average | 2.38 | 8.68 | 2.44 | 11.76 | 2.57 | 6.18 | 0.76 | |
| Earth’s crust [37] | 13.0 | 90.0 | 45.0 | 68.0 | 20.0 | 95.0 | 0.40 | |
| Continental crust [38] | 1.80 | 100 | 55 | 75.0 | 12.50 | 70.0 | 0.08 | |
| Suez Bay, Gulf of Suez, Egypt [39] | 8.98 | 1.66 | 5.58 | 2.78 | 3.96 | 0.27 | ||
| Rosetta, Mediterranean Sea, Egypt [40] | 298 | 0.18 | 24.57 | 481 | 385 | 183 | ||
| Ras Abu Ali Island, Saudi Arabia [41] | 2.47 | 7.86 | 4.14 | 13.0 | 3.50 | 6.89 | ||
| Indices and Background References | Pb | Zn | Ni | Cu | Cr | As | Hg | |
|---|---|---|---|---|---|---|---|---|
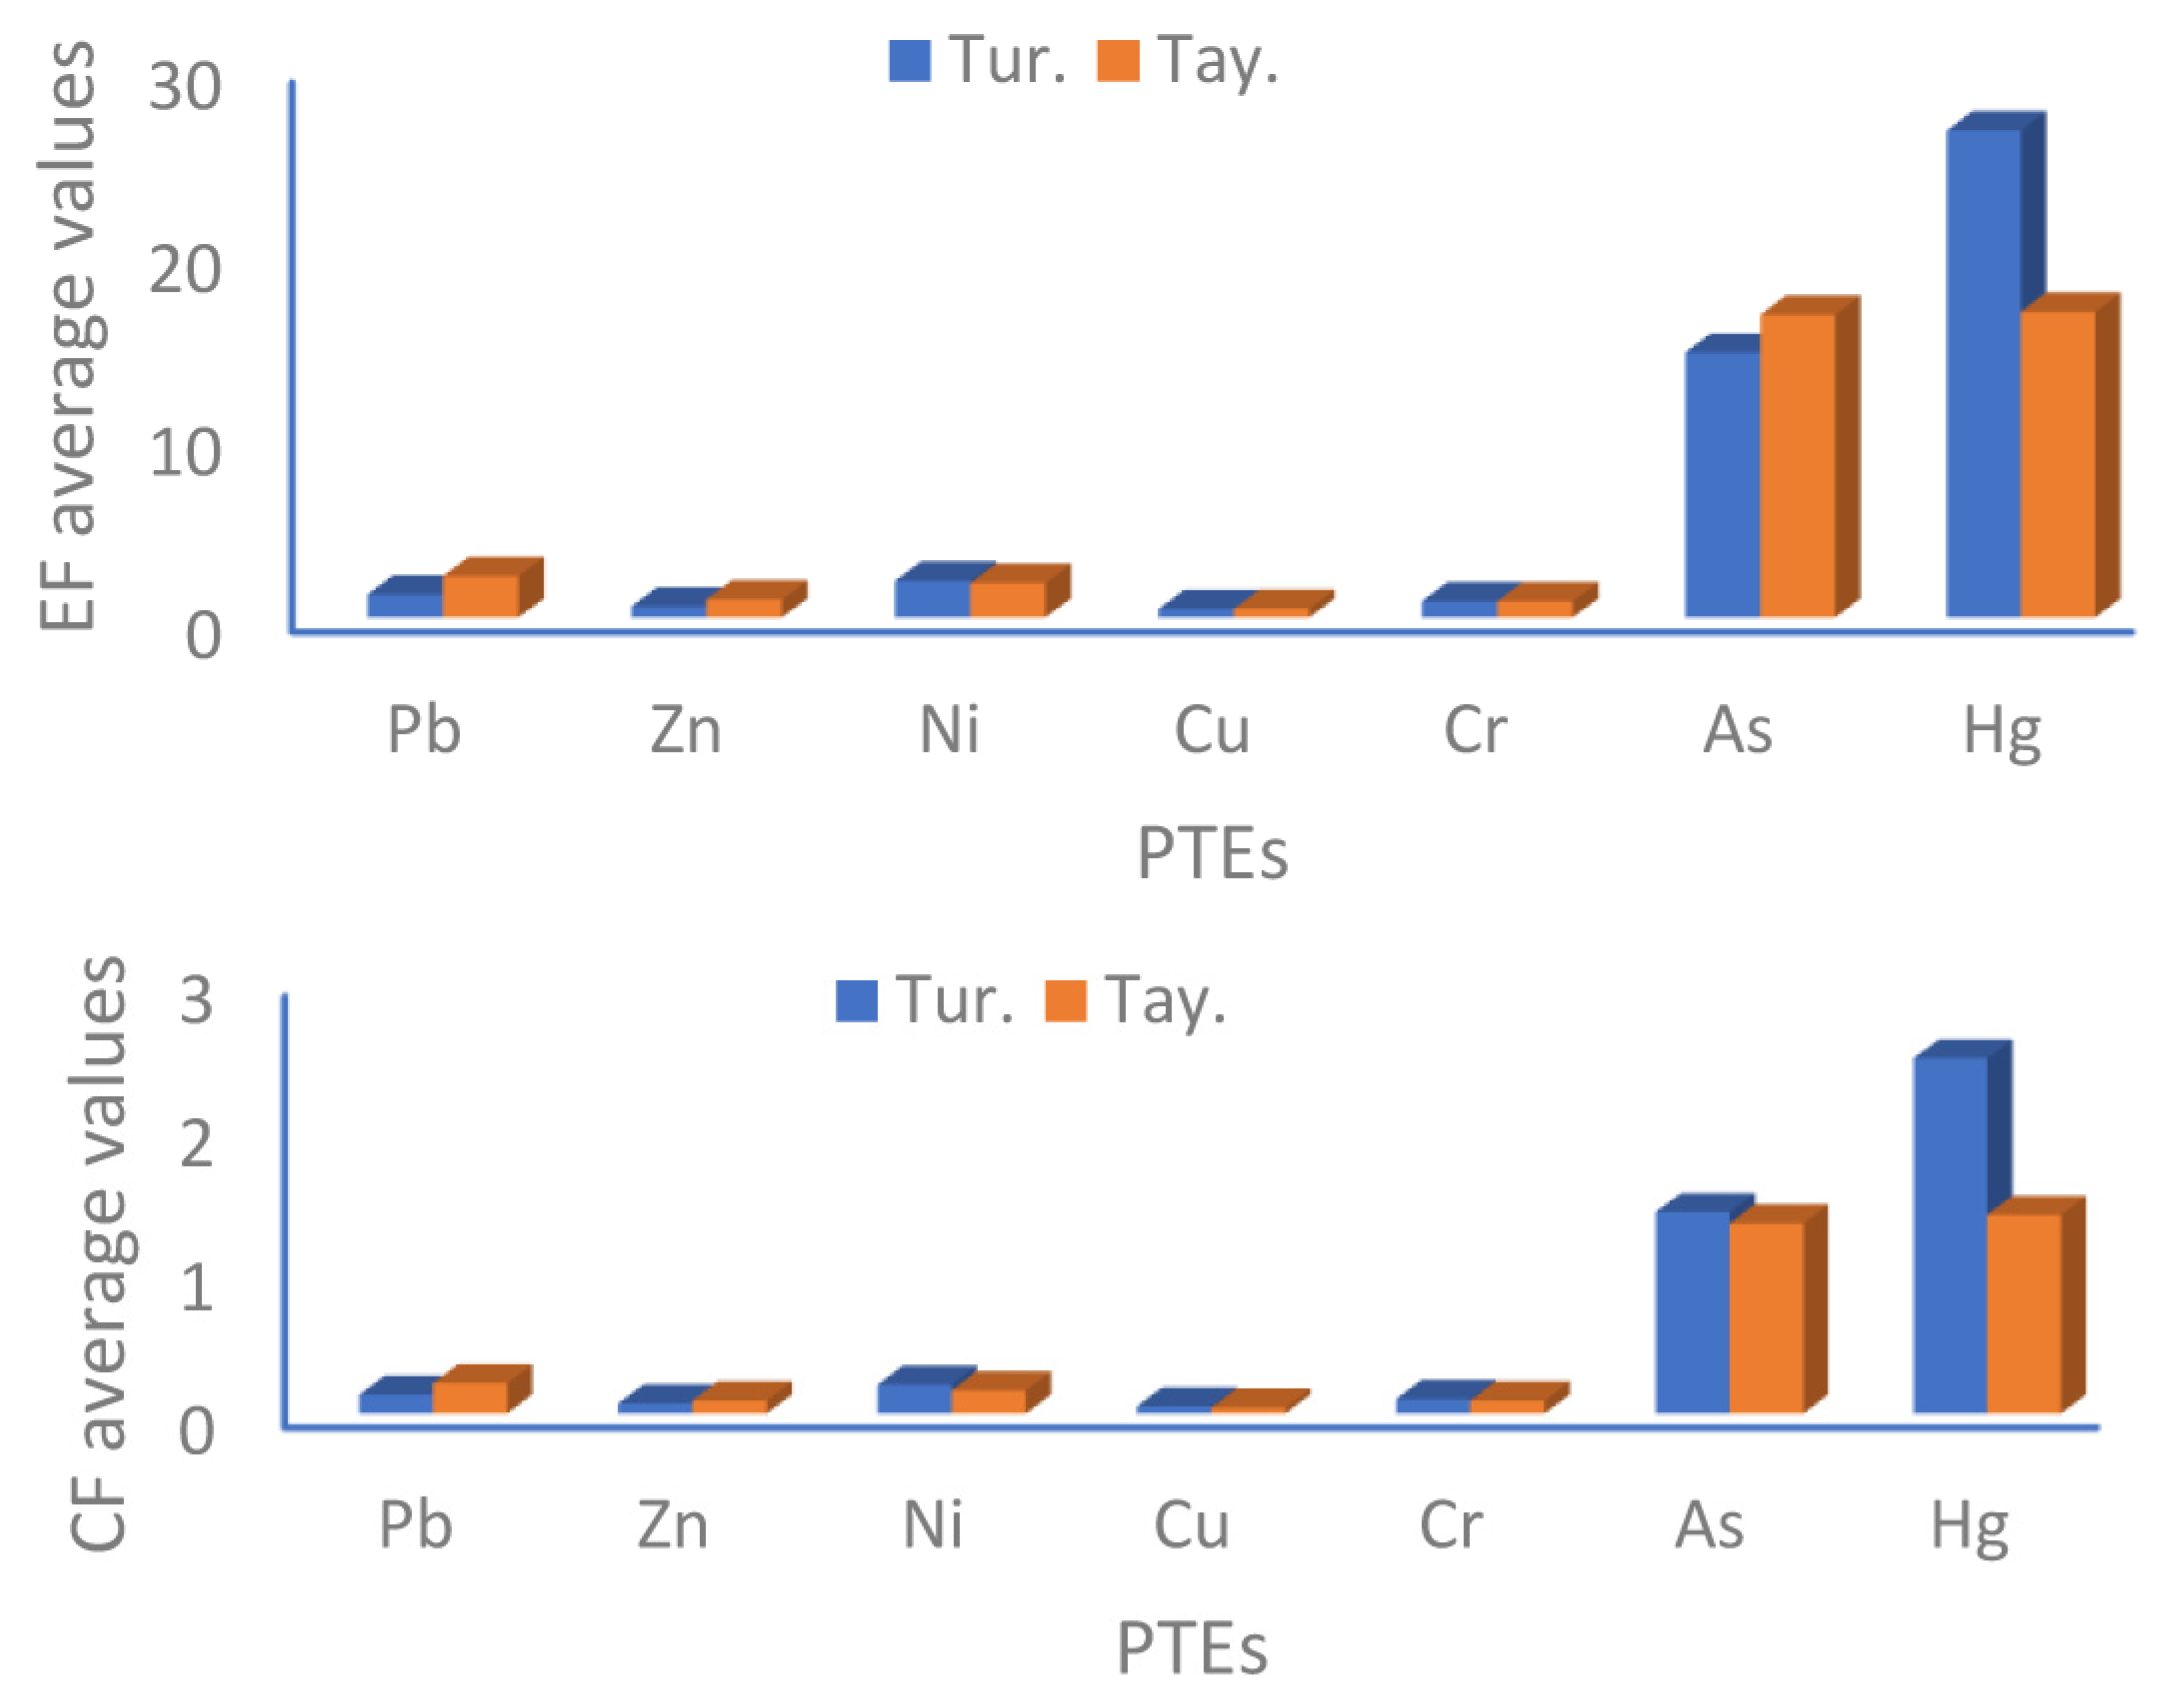
| EF | Turekian and Wedepohl [37] | 1.27 | 0.61 | 2.01 | 0.47 | 0.90 | 14.50 | 21.40 |
| Taylor [38] | 2.27 | 0.99 | 1.89 | 0.48 | 0.90 | 16.58 | 16.73 | |
| CF | Turekian and Wedepohl [37] | 0.13 | 0.07 | 0.20 | 0.05 | 0.10 | 1.40 | 2.47 |
| Taylor [38] | 0.21 | 0.09 | 0.16 | 0.04 | 0.09 | 1.32 | 1.38 | |
| Metal | Mean Concentration | Sediment Quality Guideline * | % of Samples within Ranges of the Sediment Quality Guideline | |||
|---|---|---|---|---|---|---|
| ERL | ERM | <ERL | >ERL and <ERM | >ERM | ||
| Cu | 2.44 | 34 | 270 | 100 | 0 | 0 |
| Ni | 11.76 | 20.9 | 51.6 | 87.5 | 12.5 | 0 |
| Pb | 2.57 | 46.7 | 218 | 100 | 0 | 0 |
| Zn | 6.18 | 150 | 410 | 100 | 0 | 0 |
| As | 2.38 | 8.2 | 70 | 100 | 0 | 0 |
| Cr | 8.68 | 81 | 370 | 100 | 0 | 0 |
| Hg | 0.766 | 0.15 | 0.71 | 0 | 47% | 53% |
| As | Cr | Cu | Ni | Pb | Zn | Hg | |
|---|---|---|---|---|---|---|---|
| As | 1 | ||||||
| Cr | 0.495 ** | 1 | |||||
| Cu | 0.520 ** | 0.879 ** | 1 | ||||
| Ni | 0.556 ** | 0.817 ** | 0.731 ** | 1 | |||
| Pb | 0.363 * | 0.550 ** | 0.551 ** | 0.571 ** | 1 | ||
| Zn | 0.580 ** | 0.790 ** | 0.897 ** | 0.757 ** | 0.680 ** | 1 | |
| Hg | −0.050 | 0.063 | 0.059 | 0.278 | 0.094 | 0.140 | 1 |
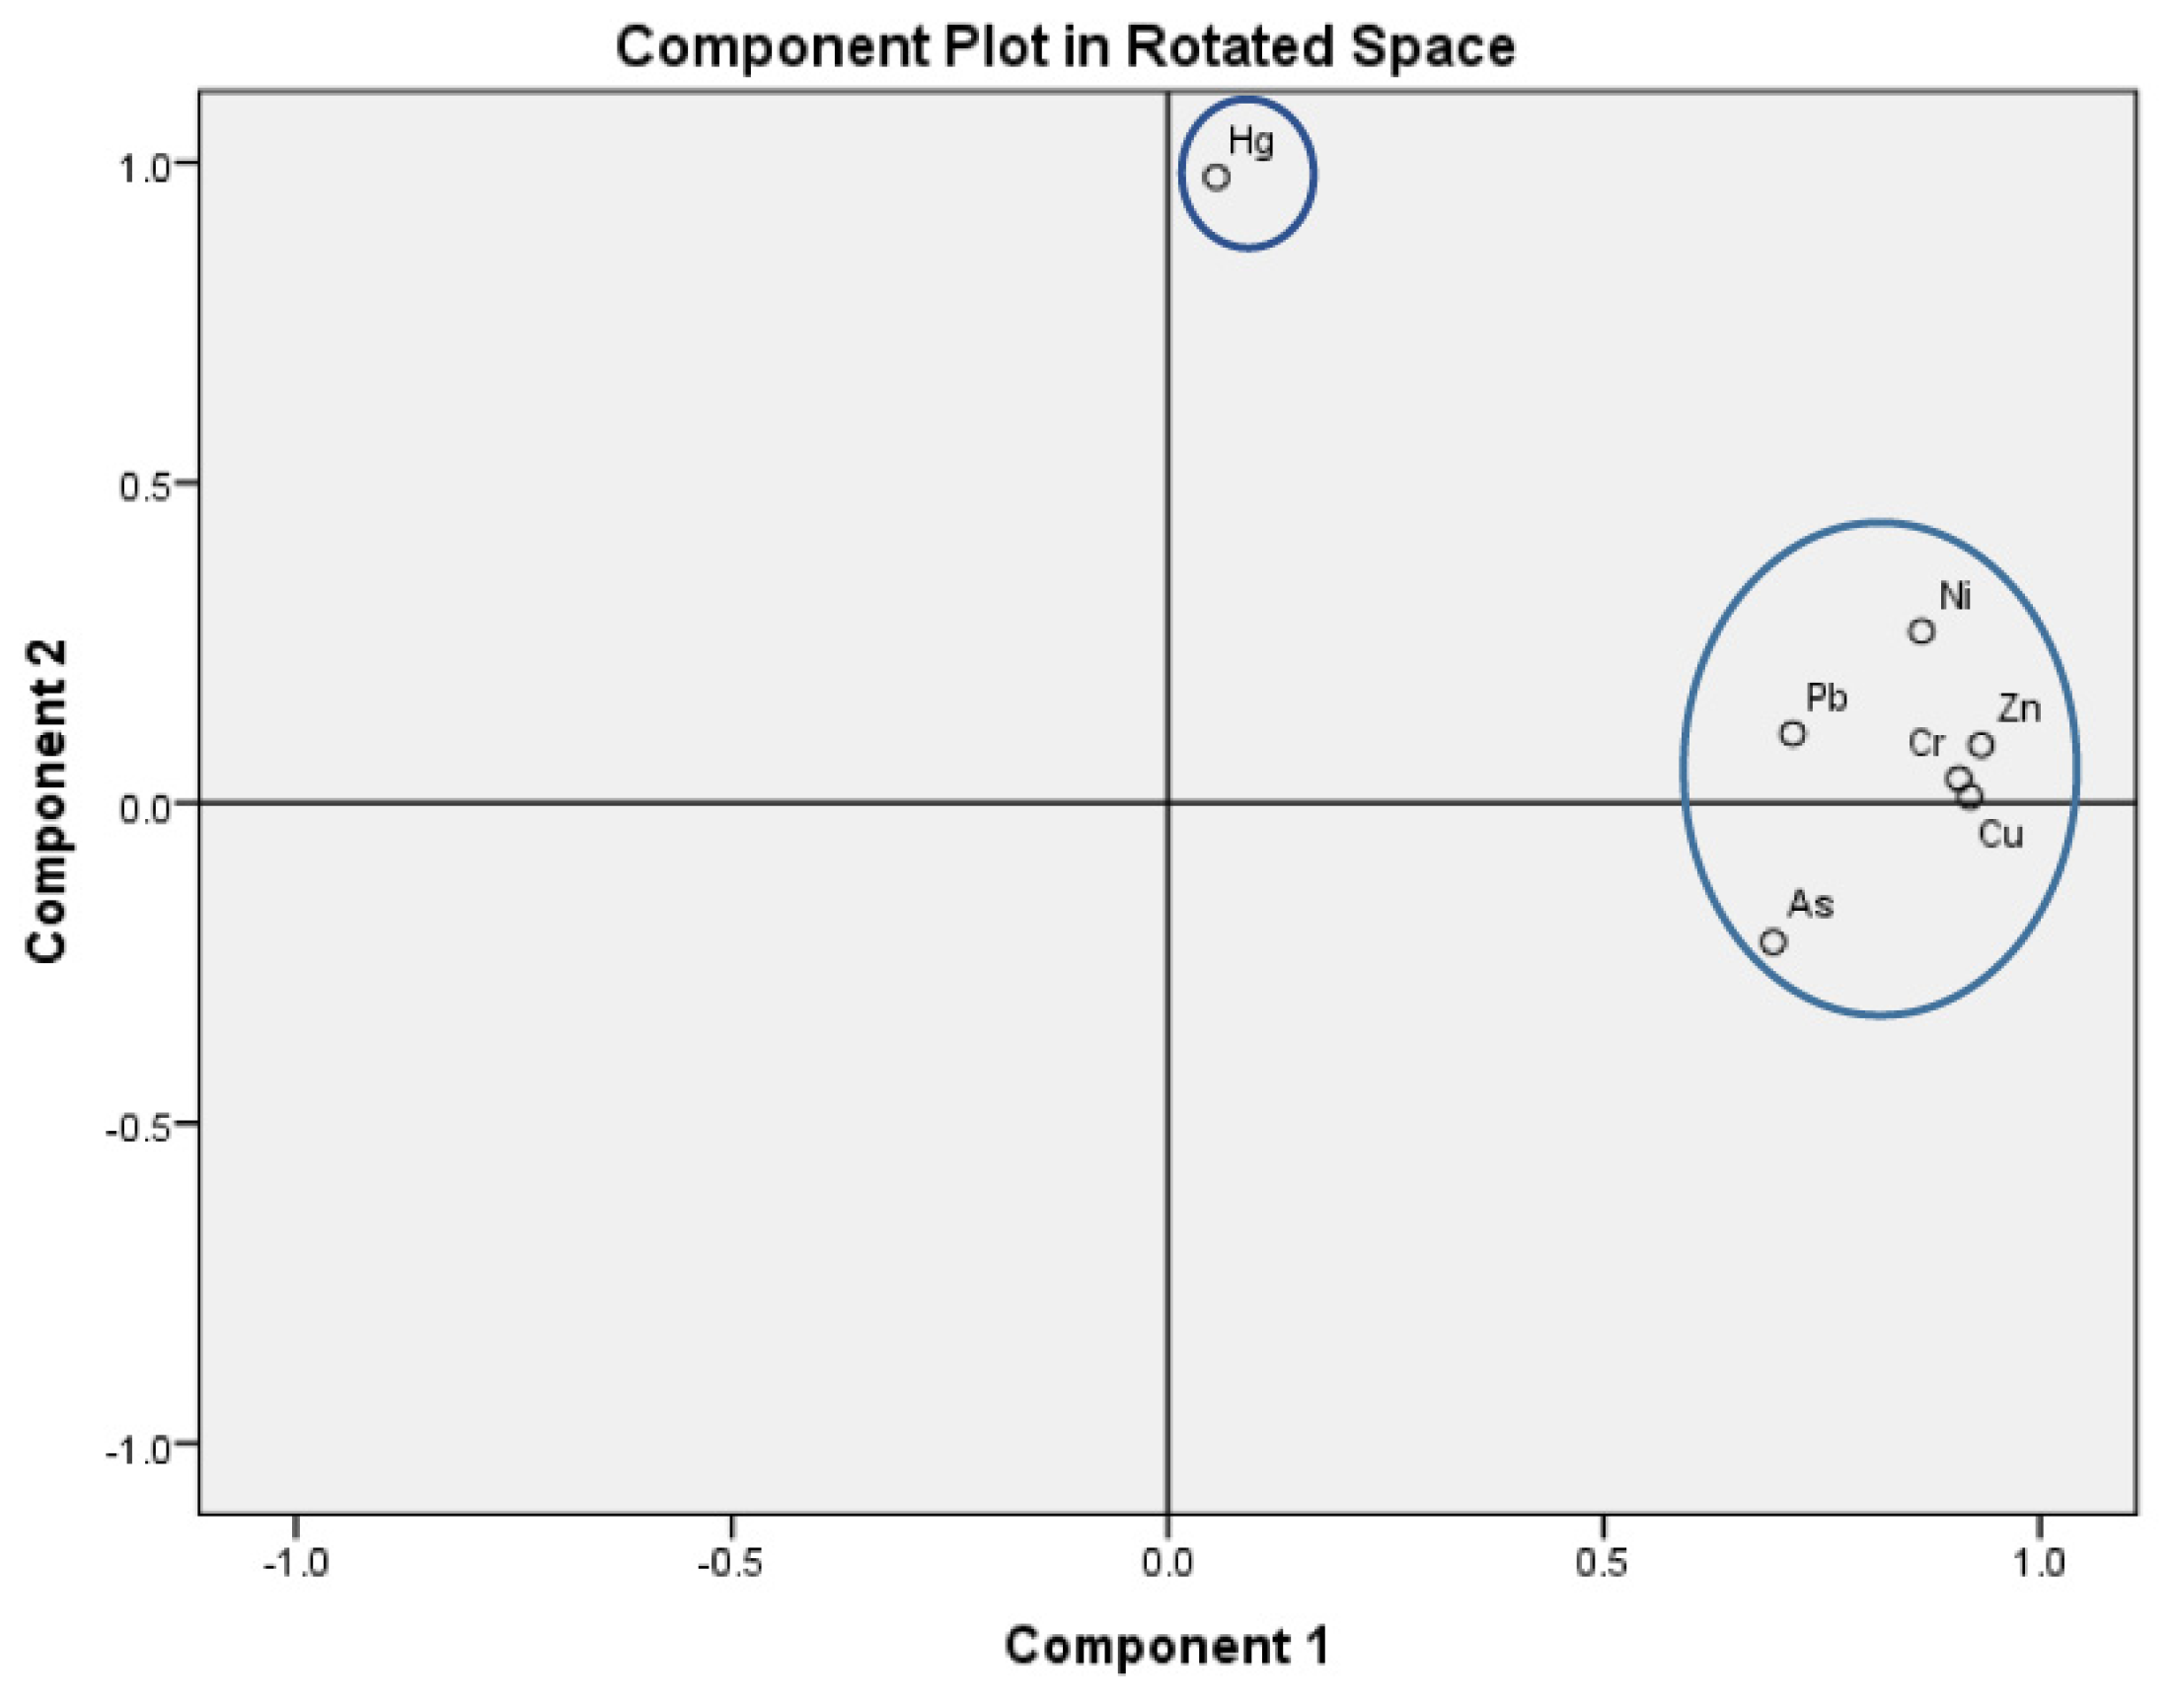
| Component | ||
|---|---|---|
| 1 | 2 | |
| As | 0.668 | −0.289 |
| Cr | 0.906 | −0.058 |
| Cu | 0.916 | −0.087 |
| Ni | 0.888 | 0.176 |
| Pb | 0.724 | 0.032 |
| Zn | 0.937 | −0.008 |
| Hg | 0.158 | 0.966 |
| % of Variance | 61.72 | 15.12 |
| Cumulative % | 61.72 | 76.84 |
Disclaimer/Publisher’s Note: The statements, opinions and data contained in all publications are solely those of the individual author(s) and contributor(s) and not of MDPI and/or the editor(s). MDPI and/or the editor(s) disclaim responsibility for any injury to people or property resulting from any ideas, methods, instructions or products referred to in the content. |
© 2023 by the authors. Licensee MDPI, Basel, Switzerland. This article is an open access article distributed under the terms and conditions of the Creative Commons Attribution (CC BY) license (https://creativecommons.org/licenses/by/4.0/).
Share and Cite
Alzahrani, H.; El-Sorogy, A.S.; Qaysi, S.; Alshehri, F. Contamination and Risk Assessment of Potentially Toxic Elements in Coastal Sediments of the Area between Al-Jubail and Al-Khafji, Arabian Gulf, Saudi Arabia. Water 2023, 15, 573. https://doi.org/10.3390/w15030573
Alzahrani H, El-Sorogy AS, Qaysi S, Alshehri F. Contamination and Risk Assessment of Potentially Toxic Elements in Coastal Sediments of the Area between Al-Jubail and Al-Khafji, Arabian Gulf, Saudi Arabia. Water. 2023; 15(3):573. https://doi.org/10.3390/w15030573
Chicago/Turabian StyleAlzahrani, Hassan, Abdelbaset S. El-Sorogy, Saleh Qaysi, and Fahad Alshehri. 2023. "Contamination and Risk Assessment of Potentially Toxic Elements in Coastal Sediments of the Area between Al-Jubail and Al-Khafji, Arabian Gulf, Saudi Arabia" Water 15, no. 3: 573. https://doi.org/10.3390/w15030573
APA StyleAlzahrani, H., El-Sorogy, A. S., Qaysi, S., & Alshehri, F. (2023). Contamination and Risk Assessment of Potentially Toxic Elements in Coastal Sediments of the Area between Al-Jubail and Al-Khafji, Arabian Gulf, Saudi Arabia. Water, 15(3), 573. https://doi.org/10.3390/w15030573


