Article

Water Harvesting in the Garmian Region (Kurdistan, Iraq) Using GIS and Remote Sensing

by
Shvan F. Aziz
1,*,
Kawa Z. Abdulrahman
1,
Salahaldin S. Ali
2 and
Moses Karakouzian
3,*
1
Department of Water Resources Engineering, University of Sulaimani, Sulaymaniyah 00964, Iraq
2
Civil Engineering Department, Komar University of Science and Technology, Sulaymaniyah 00964, Iraq
3
Civil and Environmental Engineering and Construction, College of Engineering, University of Nevada, 4505 Maryland Parkway, Las Vegas, NV 89154, USA
*
Authors to whom correspondence should be addressed.
Water 2023, 15(3), 507; https://doi.org/10.3390/w15030507
Submission received: 11 December 2022 / Revised: 11 January 2023 / Accepted: 24 January 2023 / Published: 27 January 2023
(This article belongs to the Section Hydrogeology)

Abstract

:
Rainwater harvesting (RWH) is one of the essential alternative sources of water that may be used. However, finding potential RWH locations on a broad scale has always been challenging, requiring further research. The effectiveness of RWH structures depends on their design and the selection of suitable sites. This study aimed to select potential sites for rainwater harvesting in the Garmian region of Kurdistan-Iraq, using GIS and Remote Sensing (RS) techniques. Two multicriteria analysis (MCA) techniques: the analytical hierarchal process (AHP) and Fuzzy analytical hierarchal process (FAHP) were used for comparison purposes to identify potential RWH sites. A suitability map of potential RWH systems was then generated following the weighted linear combination (WLC) and the Fuzzy Gamma methods. The outcomes showed that, unlike most recent studies, which relied on the minimum and maximum local rainfall values, a minimum agreed-upon rainfall depth should be used as a benchmark when classifying rainfall to obtain realistic results. The findings also showed that 9.7%, 43.4%, 33.6%, and 13.3% of the sites have very high, high, moderate, and low suitability for rainwater harvesting, respectively, depending on the suitability map produced by the WLC method. However, the outcome of the Fuzzy Gamma technique appeared more realistic and revealed that 10.6%, 15.6%, 26.6%, 21.9%, and 25.3% of the sites have very high, high, moderate, low, and very low appropriateness for rainwater harvesting, respectively. The methods adopted in this study can be helpful for researchers in the field of RWH to achieve reliable results. Also, this study’s findings can assist in well-organized water resource management planning to ensure sustainable water development in the Garmian region.

1. Introduction

Life cannot exist without water. By the middle of the twenty-first century, water shortages are predicted to be widespread due to possible climate change and present usage patterns [1]. Due to the exponential growth in the population over the past few decades, the demand for water has increased dramatically. The Food and Agriculture Organization (FAO) reports that the global water demand is growing twice as quickly as the global population [2]. Drought conditions have impacted many countries in the Middle East recently (e.g., Iraq, Iran, Syria, and Turkey) [3]. Insufficient water storage and the lack of irrigation water negatively impact agriculture production. In addition, increased industrial and domestic water use has exaggerated the drought conditions [4]. According to several studies, Iraq is anticipated to face additional difficulties as the country’s water deficit crisis worsens with time [5,6]. RWH is a promising water conservation technique, and it can deliver accessible, inexpensive, and safe water for drinking, residential usage, and agricultural purposes [7]. RWH techniques have been recognized as an efficient alternative water supply for the agriculture sector to deal with water scarcity, lowering the reliance on groundwater in arid and semi-arid regions [8,9,10].
RWH refers to any methods for gathering and storing runoff water for home and agricultural uses [11]. It is an age-old strategy that is still employed to keep rainfall in reserve. Planning and creating techniques for gathering, storing, and utilizing rain for agricultural purposes has been a priority for many nations [12].
An RWH site’s suitability is determined by several factors, including biophysical (rainfall, slope, soil type, drainage network, and land use) and socioeconomic conditions [13,14]. The FAO established six criteria to identify RWH locations: hydrology, climate, topography, soils, socio-economics, and agronomy [15].
GIS and RS data have had significant roles in managing and planning water resources. RS data and GIS are essential to maximizing water availability and land productivity [16]. RS is an economically valuable tool for locating potential RWH locations because it frequently covers vast, difficult-to-reach areas. GIS and RS can solve the missing data problems for finding viable RWH sites [17]. The accuracy of the results obtained from RS and GIS techniques depends on the quality (i.e., temporal, spectral, and spatial resolution) and data availability. Satellite-based RS data offer trustworthy baseline characteristics such as soil type, land use/cover, geomorphology, lineaments, etc. [18]. These thematic layers are often combined using the GIS approach [19].
Moreover, several site selection techniques or methodologies are available, and some of the literature has used GIS and RS data with different decision-making analyses [9,20]. In this context, GIS and RS data are used [16,19,21,22,23], Multi-Criteria Analysis (MCA) integrated with GIS [24,25,26], AHP with GIS [27,28,29,30,31], and Weighted Linear Combination (WLC) and Boolean techniques were also used [7,32,33]. Several factors, including the available data, the opinions of experts, and the study area’s ecology, have been considered in locating RWH sites [15]. Mbilinyi et al. [24] utilized rainfall, soil texture, slope, soil depth, land use/land cover, and drainage as input data for finding suitable RWH sites. Khashei et al. [34] used AHP and FAHP multicriteria decision-making to determine suitable zones for drinking water in the Birjand aquifer in Iran. The study demonstrated that the map of FAHP is much closer to reality than the AHP.
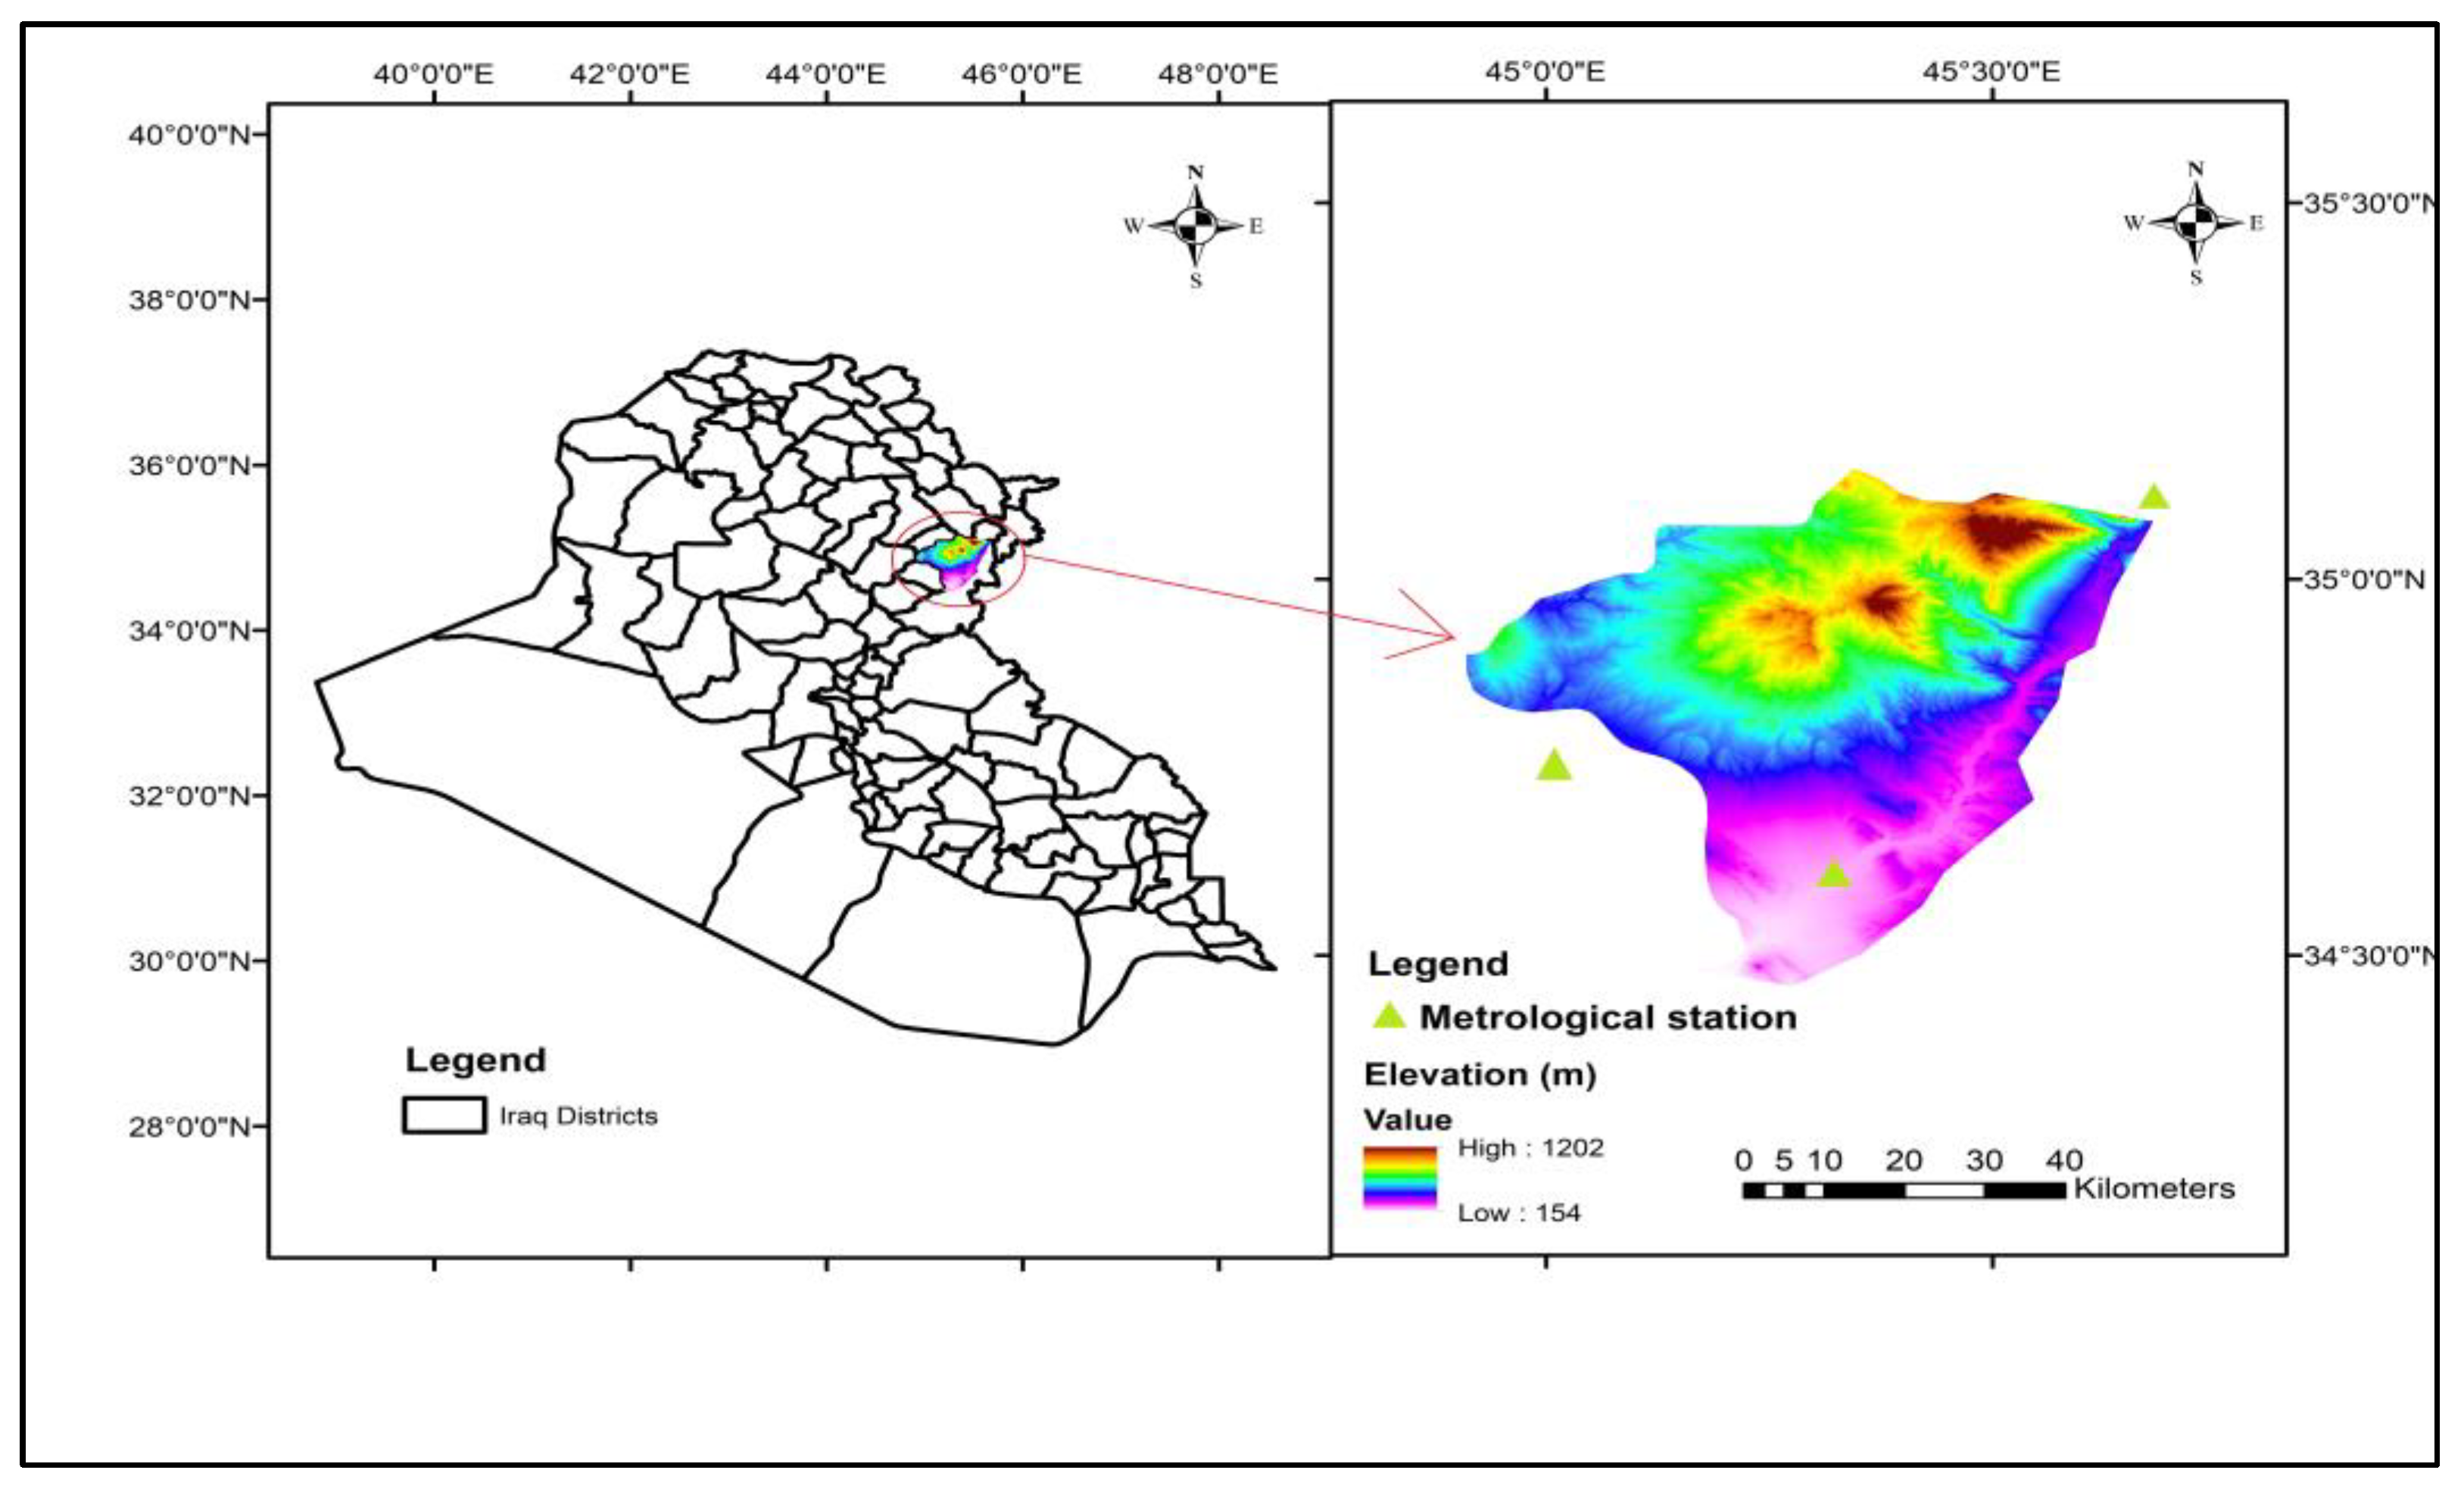
Numerous recent droughts have hit the study area. As a result, the Kurdistan Regional Government (KRG) decided to adopt RWH techniques there because many agricultural lands failed to produce crops because of insufficient rainfall throughout the growing season. Most of the villagers in the area also raise animals, which has presented difficulties for them due to a water shortage, notably in the summer of 2022. Evaluating RWH potential and selecting appropriate RWH sites is a time and labor-intensive task for water resource managers and planners when applied to large scales. The site selection process for RWH structures has been made simpler and quicker using GIS and RS technologies, which have reduced the number of recommended sites and allowed the selection of only the best sites.
To the authors’ knowledge, there is no surface RWH study in the Garmian region. The present study aims at identifying appropriate sites for RWH in the Garmian region by integrating MCA, GIS, and RS. For comparison, two MCA methods are utilized to find possible RWH sites: AHP and FAHP. The WLC and fuzzy gamma approaches are then used to create a prospective RWH suitability map. The novelty of this study is that, in contrast to most past research in the field of RWH, which has depended on the lowest and maximum local rainfall values, a new approach for rainfall classification is suggested to develop representative suitability maps [7,8,35,36,37]. This study will be helpful for decision-makers in constructing dams and ponds in the region.

2. Materials and Methods

2.1. Study Area

The area of interest is within the Garmian region, which is located south of the Sulaymaniyah governorate, Iraq, as shown in Figure 1. Kalar is the administrative center of the Garmian region. It is located between the coordinates 34°33′0″ N and 35°9′0″ N, and 44°54′0″ E and 45°35′0″ E. The Garmian Region has a hot and dry climate [38]. The temperature rarely drops below 0°. According to the Köppen-Geiger climate classification system, the Garmian region has a semi-arid climate. Figure 2 illustrates the average historical temperature map of Iraq. According to the directory of Meteorology and Seismology of Sulaymaniyah, 326 mm of rainfall on average yearly (in Kalar) over the last 20 years (2001–2020). Figure 3 shows the annual rainfall depth recorded at the Kalar, Kifre, and Darbandikhan meteorological stations. Around 217,086 people are living in the study area [39]. The main water resources in the region are the Sirwan and Awa Spi rivers [4].

2.2. Methodology

Proper site selection for RWH areas can be divided into five steps as follows:
Data collection.
Selection of a set of criteria.
Classification of suitability and weight of each criterion.
Deciding to use an MCA process to overlay the thematic maps and GIS analysis to produce a suitability map.
Selection of the most suitable sites for RWH.

2.2.1. Data Collection

In this study, the required data were collected from freely available remote sensing archives and the directory of Meteorology and Seismology of Sulaymaniyah as follows:
Rainfall: The daily rainfall data for 20 years (2001–2020) were gathered from the meteorological stations in Kalar and Darbandikhan and the directory of agriculture and water resources in Kifre.
Topography: the Digital Elevation Model (DEM) was obtained using the United States Geological Survey (USGS) data (https://earthexplorer.usgs.gov (accessed on 15 September 2021)). The DEM’s resolution is 30   m   × 30   m . The format of the data is raster data with WGS-84 datum.
A Landsat 8 OLI/TIRS C1 level -1 satellite image, with a 30 m × 30 m spatial resolution, was acquired in March 2021 from the USGS (https://earthexplorer.usgs.gov (accessed on 20 December 2021)). The land use and land cover map (LULC) was obtained by conducting a supervised classification analysis using the image classification tool in the ArcMap 10.4.1 software.
Soil data: The Harmonized World Soil Database was used to create the area’s soil map (HWSD). The HWSD is a raster database that contains more than 15,000 different soil mapping units and combines information at a 1:5,000,000 scale with regional and national updates of soil data from throughout the world (SOTER, ESD, WISE, and Soil Map of China). World Soil Map by FAO and UNESCO (FAO, 1971–1981).

2.2.2. Selection of Thematic Layers and Preparation of Maps

Based on the literature, expert opinion, and data availability, five criteria were utilized to determine probable RWH sites: climate, hydrology, topography, agronomy, and soil types. These criteria included rainfall, slope, land use/cover, soil texture, and drainage density.

Rainfall Map

Rainfall plays a vital role in water harvesting. The rainfall map of the area under study was prepared using daily rainfall data from the Kalar, Darbandikhan, and Kifre stations, which have average annual rainfall of about 326 mm and 623 mm, and 295 mm, respectively. Figure 4 illustrates how annual rainfall in Iraq varies by region, ranging from 50 mm in the southwest to 1200 mm in the northeast. Depending on the region’s topography and geographic location, each area has distinct meteorological features and levels of rainfall [40,41].
The annual rainfall data were imported into an Excel file and uploaded to ArcMap 10.4.1 to construct the study area’s rainfall map. Figure 5 illustrates how spatial analyst tools were utilized to distribute rainfall across the entire region using a Kriging interpolation. Kriging is based on known data points’ distance and geographic orientation when estimating values in unknown areas [4]. Some literature has preferred the Kriging method for interpolation [42,43,44].
Some literature used runoff depth as a representative climate factor in finding suitable sites for RWH. The actual runoff map for the entire region, however, appears to be challenging to calculate because GIS is unable to take time series data, such as daily rainfall for the watershed, and there are various curve numbers depending on the soil type, land use/cover, and antecedent moisture content of the area [4,30].

Slope Map

A basin’s topography heavily influences the runoff and infiltration [36]. The catchment’s slope impacts how rapidly water will flow following a rainfall event. Constructing RWH structures in areas having steep slopes is barely considered cost-effective, due to the extensive amount of earthwork needed [32]. For a high RWH potential, a catchment’s slope should be as mild as possible. Areas of steep slopes (i.e., slopes higher than 5%) produce more erosion, which may reduce the useful life of the RWH structures. Therefore, erosion control methods must be considered in locations where the catchment’s slope is steeper [36].
The DEM of the area was used to create the slope map of the study area, as demonstrated in Figure 6. The area has a slope that ranges from 0 to 62.9%. The steep terrain is found in the northeast, close to Darbandikhan city.

Land Use/Land Cover Map

Land use describes the land purpose, and its natural features are contained in its land cover. Essential data for runoff spreading can be gleaned from the LULC’s form. Vegetation cover is associated with increased absorption and infiltration rates, which result in less runoff, while bare ground and built-up areas facilitate high runoff formation [7,45]. Prinz & Singh [46] have proven that increasing vegetation density results in higher interception losses, retention rates, and infiltration rates, which lower the runoff volume. The vegetation density can be characterized by the size of the area covered by vegetation. The LULC used in this investigation was taken from a Landsat 8 satellite image provided by the National Aeronautics and Space Administration (NASA). The image was obtained on 26 March 2021; it has 11 bands and a spatial resolution of 30 m. It has the Universal Transverse Mercator (UTM) Projection coordinate system, Zone 38 North, with a World Geodetic System (WGS) 84 datum. The land use/cover map classifies the region into six classes using supervised classification. The classes were bare land (89.15%), stream (3.55%), agriculture (4.6%), forest (0.45%), urban (1.8%), and water body (0.45%), as depicted in Figure 7.

Soil Texture Map

The soil texture is an essential factor in RWH planning. Soil texture controls the infiltration characteristics of the soil. Typically, sandy soils generate less runoff than clayey soils [47]. The clay, sand, and silt percentages determine the textural class of soil. Due to clay soil’s low permeability and capacity to keep the collected water, areas with medium and fine-grained soil were often preferred for rainwater gathering [4,31,36].
The soil map was acquired from the Harmonized soil map of the world published by FAO in 2012. The soil map of the study area involves three soil textures: clay, silty clay, and loam, as shown in Figure 8. Visual observations and the judgment of local geotechnical experts have validated these results.

Drainage Density Map

Surface features and the subsurface hydrological formation are reflected in the drainage configuration. It demonstrates the surface material’s characteristics and the channel spacing’s tightness. Lower runoff results from less drainage density and vice versa [16]. Dense drainage networks have an essential role in stormwater harvesting. RWH is better suited to areas with higher drainage densities because they provide a system through which runoff can flow and be quickly trapped [4,45]. The drainage density of the Garmian Region varies from 0.03 to 5.07 km/km2, as shown in Figure 9.

2.2.3. Assigning Criteria Weight by AHP

The Analytic Hierarchy Process (AHP) is employed to assign the criteria weights. This method was first suggested by Saaty [48]. A matrix containing pairwise comparisons is used to calculate the weights for each criterion. Pairwise comparisons determine the relative weights of two factors when evaluating the suitability of a particular purpose. Two factors are compared and valued using a continuous scale of 9-points, as illustrated in Table 1 [49]. Thematic maps are integrated by using the WLC method to develop the RWH map for the Garmian Region.

2.2.4. Assigning Criteria Weight by FAHP

As a comparison, FAHP was also used in this study to estimate the weight of the criteria. The fuzzy-AHP approach employs fuzzy numbers rather than weight values to get the most accurate and realistic results. The criterion weight in this research is evaluated using the geometric mean approach. Buckley [50] proposed the fuzzy geometric mean method to apply hierarchical analysis where participants used fuzzy ratios rather than exact ratios. The priorities of the criteria in the hierarchy are calculated using fuzzy’s triangular scales, which reflect the relative importance of various criteria. The criteria or alternatives are compared using the linguistic terms as depicted in Table 2 [51].
The steps of calculation of Criteria weight are described below:
Designing pairwise comparison matrices between criteria.
Aggregating the preferences of all evaluators by using the geometric mean.
Converting the value of the geometric mean to the relative weight of fuzzy by its multiplication with the total of reverse fuzzy geometric means in increasing order.
Calculating the averaged fuzzy weight by averaging the fuzzy numbers for each criterion.
Fuzzy geometric mean ( r i ) is calculated by Equation (1)
r i = a i 1 ¯ r i = ( a i 1 a i 2 a i n ) 1 / n

2.2.5. Fuzzy Membership and Fuzzy Overlay

The user can assess the suitability of a place using fuzzy membership. Depending on the likelihood that the input data will be a member of a certain set, it reclassifies the data into a range from 0 to 1. For places that are definitely not a part of a set, a value of zero is assigned, and for areas that are definitely a part of a set, a value of one is given. In this study, the Fuzzy Linear Membership (FLM) is employed to standardize all the criteria layers [52]. The Fuzzy Membership tool in ArcGIS is utilized to classify the layers by changing the crisp value to a fuzzy number. Minimum and maximum values are assigned 1 and 5 for the FLM in ArcGIS, respectively.
The last step is applying fuzzy logic to the criteria layers in the fuzzy overlay. A fuzzy gamma overlay is used in this study to generate a suitability map for RWH from the standardized layers from Fuzzy Membership and FAHP weights of criteria [53].

2.3. Classification of the Thematic Maps

According to their eligibility for RWH, the thematic maps for the Garmian Region have been categorized. The rainfall map of the area was divided into five classes rated from 1 to 5, from the area with the least rainfall to the area with the highest rainfall, as depicted in Figure 10a.
In this study, the slope of the study area was classified into five classes, as shown in Figure 10b. The slope of 19% of the area is 0–2%, and the slope of 37% is 2–5%, which are classified as classes 5 and 4, respectively. So from a slope perspective, more than half of the study area has a high suitability class for RWH.
There are three different soil textures in the study area, clay, silty clay, and loam, which range from highly suitable for RWH to moderately suitable, as shown in Figure 10c.
The area’s LULC was classified into five classes, with bare land, classified as a highly suitable area, and urban and water bodies as very low suitable areas, as shown in Figure 10d.
The drainage density of the area was also classified into five classes, with dense drainage ranked as 5, and the area with the least drainage ranked as 1, Figure 10e. Table 3 illustrates the classification of the layers depending on their suitability for RWH.

2.4. A New Proposed Rainfall Classification (NPRC)

All of the recent academic research [4,22,36,52] assigned grades of 1 to the minimum rainfall and 5 to the maximum rainfall in a study area; doing so will produce an inaccurate final suitability map. In some research, rainfall depths between 300 and 500 mm have been classified as having low suitability [12,35,37], but in others, the same range has been ranked as having moderate to good suitability [30,33]. So, there should be a guideline for assigning grades to the rainfall depth of an area. In this study, we suggest using the findings of Prinz [54] as a guideline for rainfall classification.
Prinz [54] presented the annual precipitation ranges for various RWH forms based on field surveys and a literature review. He showed that the minimum rainfall depths for large and micro catchment RWH in summer rainfall areas are 150 mm and 200 mm, respectively. Accordingly, in this study, rainfall rates of 125 to 225 mm per year are considered nonideal (level 1), 226 to 325 mm per year are only slightly suitable (level 2), 326 to 425 mm per year are reasonably good (level 3), 426 to 525 mm per year are highly suitable (level 4), and more than 525 mm per year is ideal (level 5).

3. Results and Discussion

3.1. Selection of Multi-Criteria

WLC was used to compute the sum of the weighted criteria. To carry out the WLC, an AHP was employed, known as a pairwise comparison. AHP is an MCA method executed within Arc-GIS, defining the criteria weights. The weight of each criterion is determined using a matrix of pairwise comparisons. To make sure that the comparison of the criteria is acceptable, the consistency ratio should be less than 10% [49]. The pairwise matrix for the five layers used in this study is illustrated in Table 4.
The precision of the pairwise comparison was evaluated by calculating the Consistency Ratio (CR). The consistency ratio was used to calculate the relative weight of each criterion. The Consistency Index (CI) to Random Index (RI) Ratio is known as the Consistency Ratio [30]. A consistency ratio lower than 10% indicates that the comparison between the factors was considered acceptable [4].
CR = CI RI
where the consistency index (CI) depends on the consistency vector (ʎ) and a number of criteria (n).
CI = ʎ n n 1
The criteria weight is determined by dividing each cell in the matrix by its column summed value in Table 4. Table 5 shows the generated weight of the criteria.
The consistency ratio is calculated using the following procedure.
The consistency indices are determined from Equation (3), which equals 0.2125.
According to Hameed [4], the random index corresponding to the five criteria is 1.12 (see Table 6).
The Consistency Ratio is determined from Equation (2), which equals 1.89%.
From the pairwise matrix result, the rainfall is the most effective layer, and the LULC has the lowest effect, as shown in Table 7.

3.2. Weighted Linear Combination

WLC is used in this study for overlaying the thematic maps for determining the potential RWH map for the Garmian region. The WLC method for selecting potential sites for water harvesting has been widely used recently [7,30,32,36,37,47,55,56]. Implementing the WLC technique involves standardizing each criteria map, determining relative importance weights, and integrating the standardized maps following the related weights to produce a final map, as in Equation (4).
S =   Wi   ×   Xi
where
S = the suitable site.
Wi = the ith criteria weight.
Xi = the membership value of ith criteria

3.3. Potential RWH Map from AHP and WLC

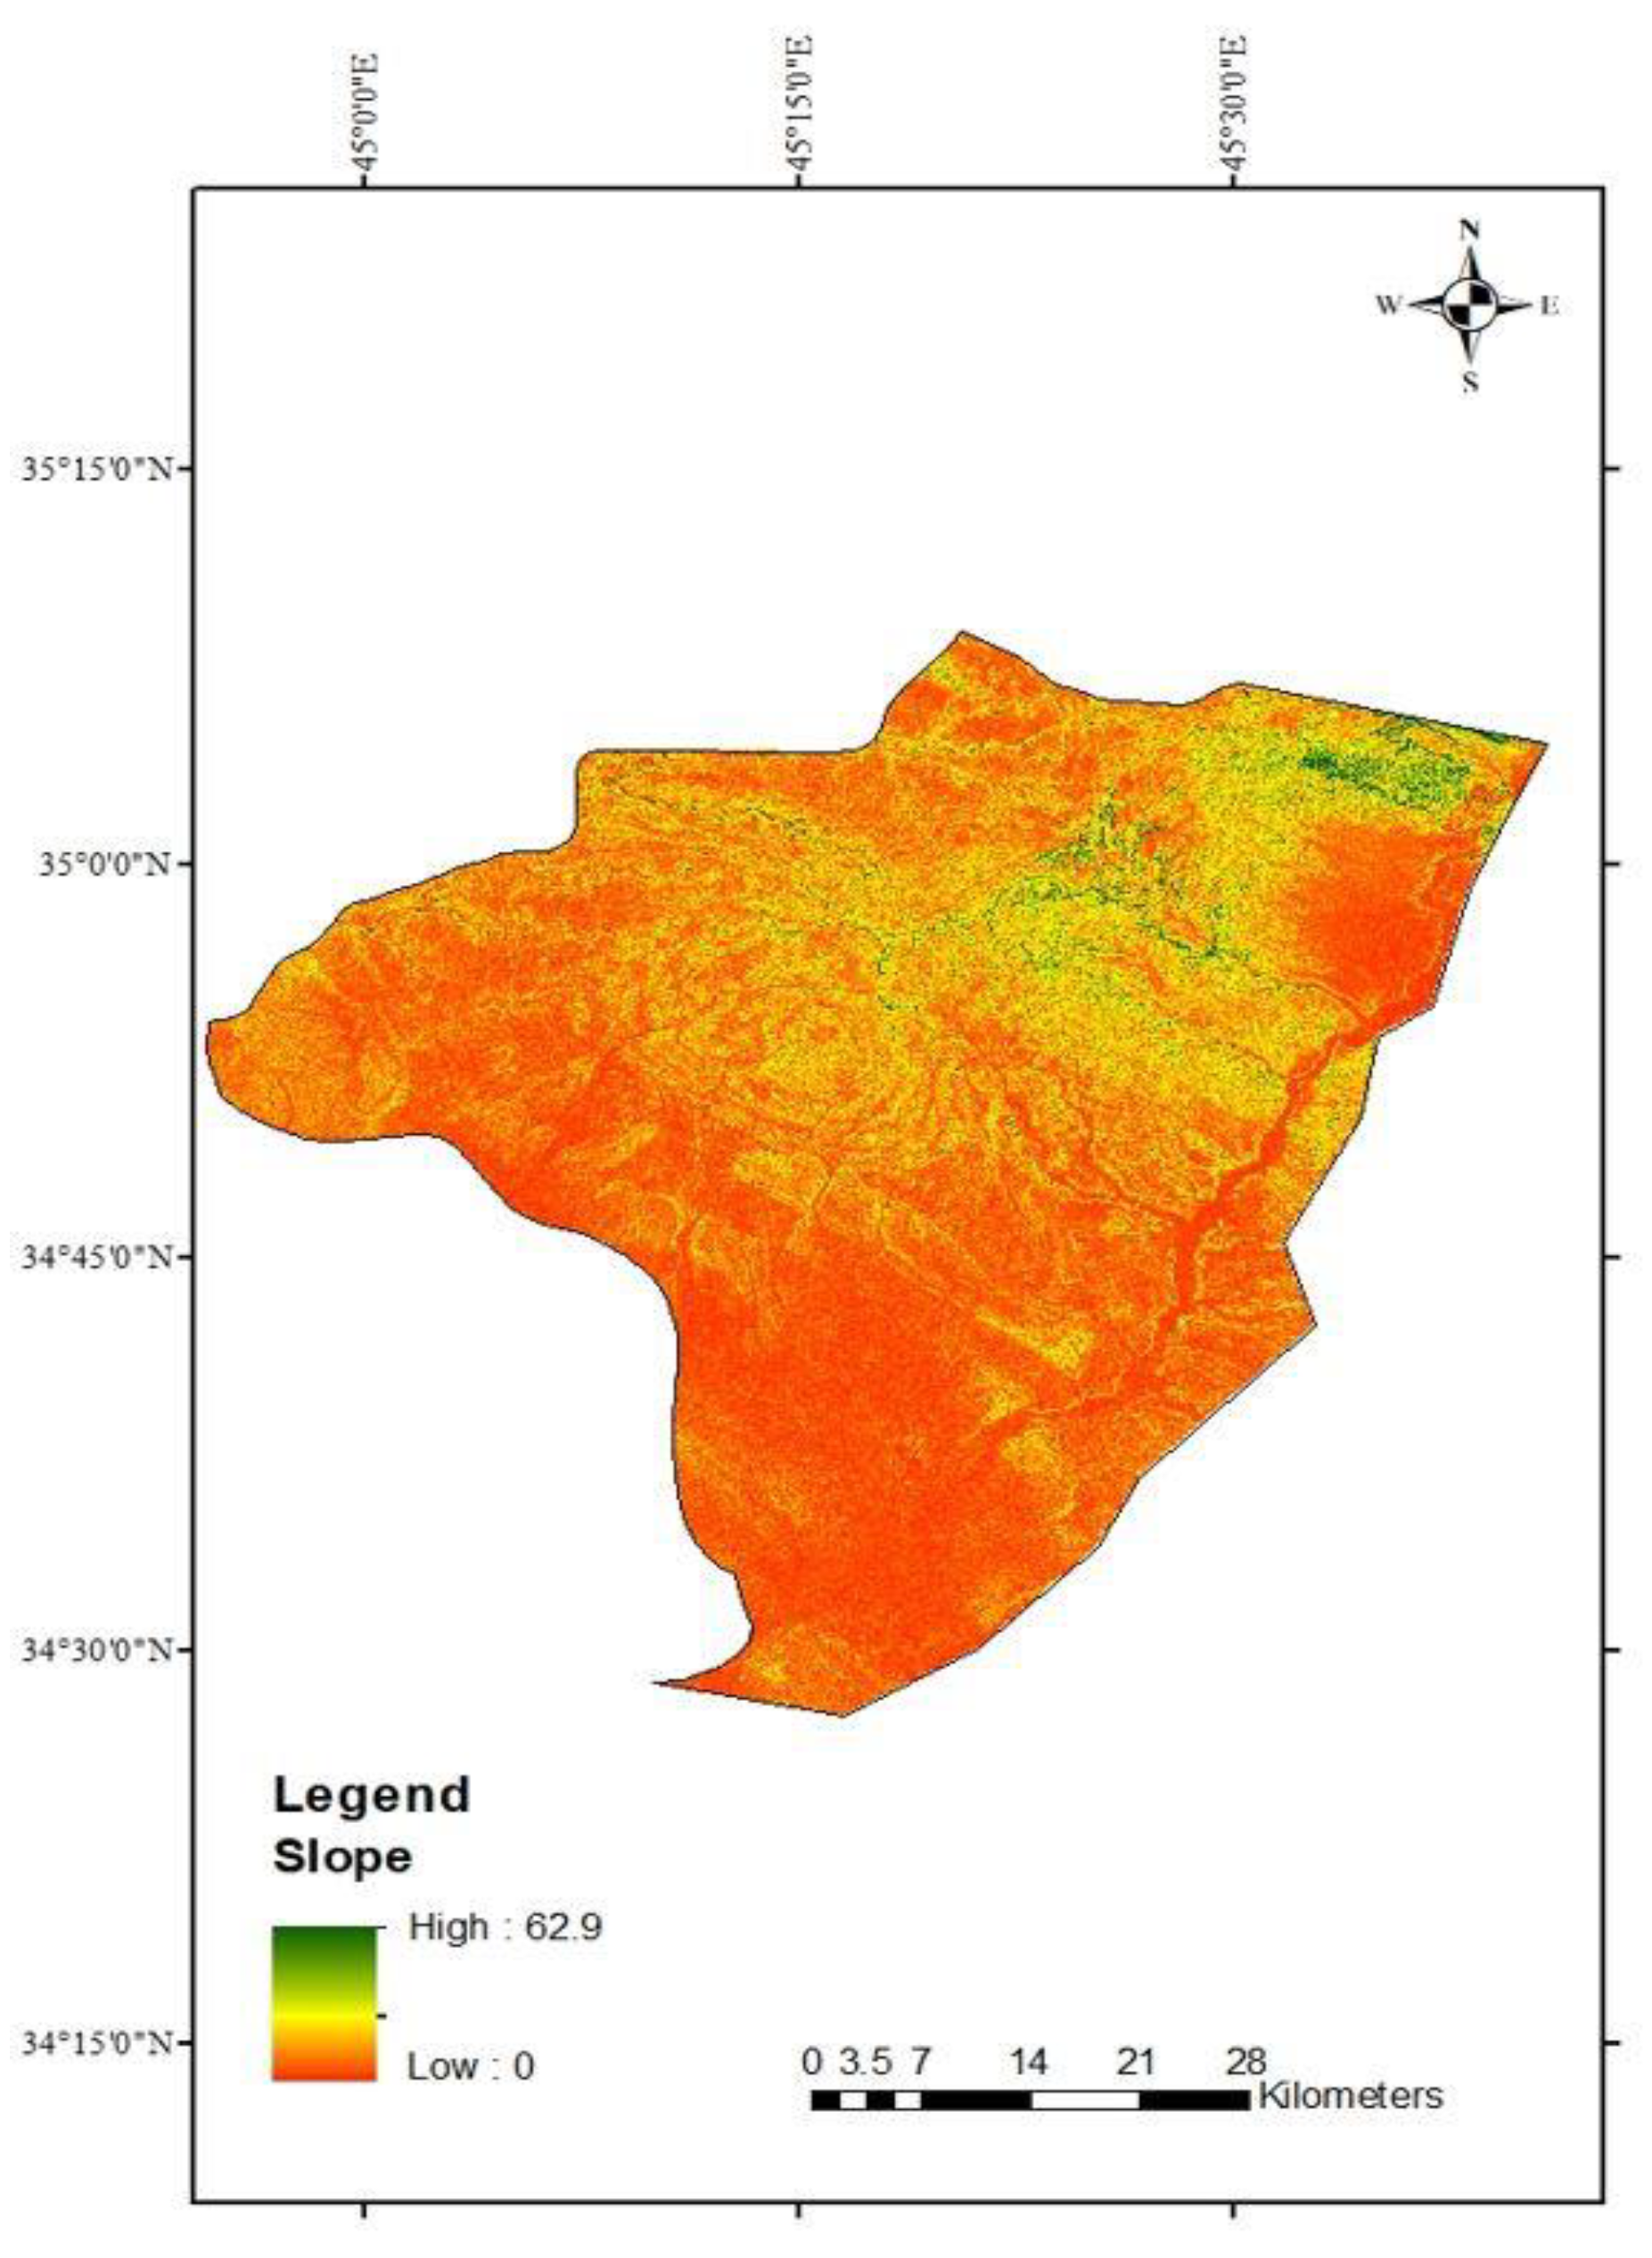
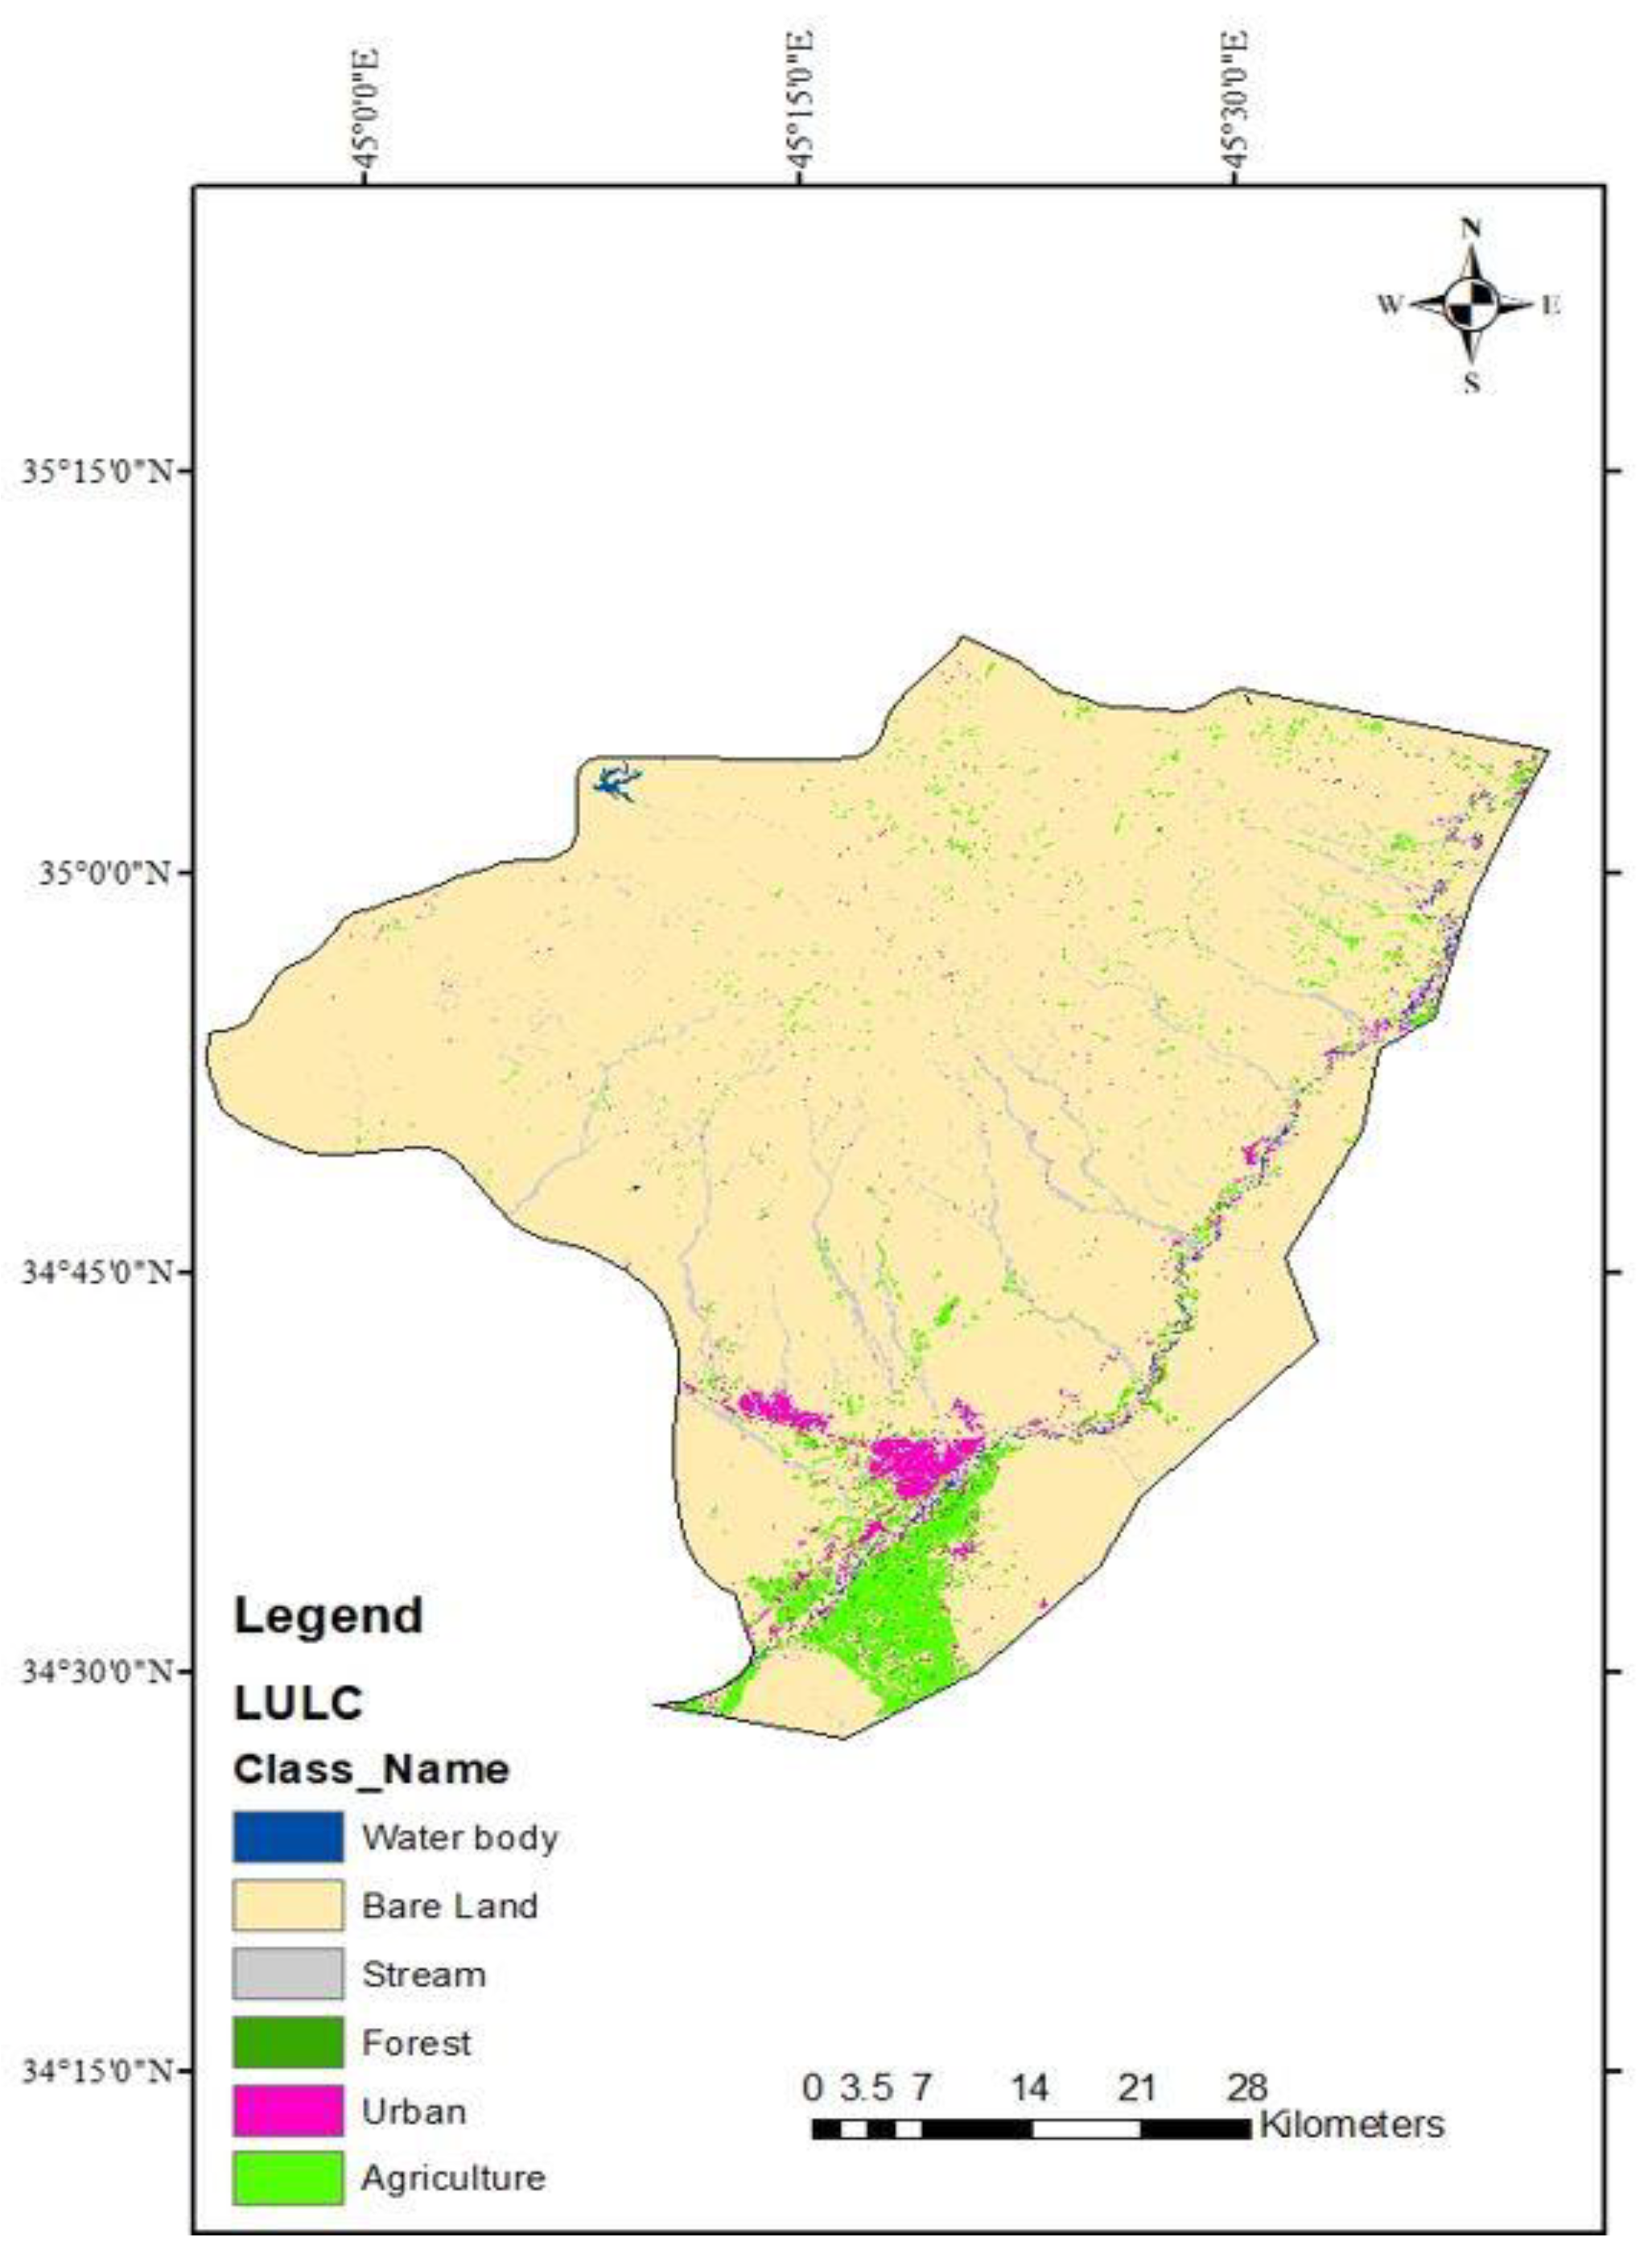
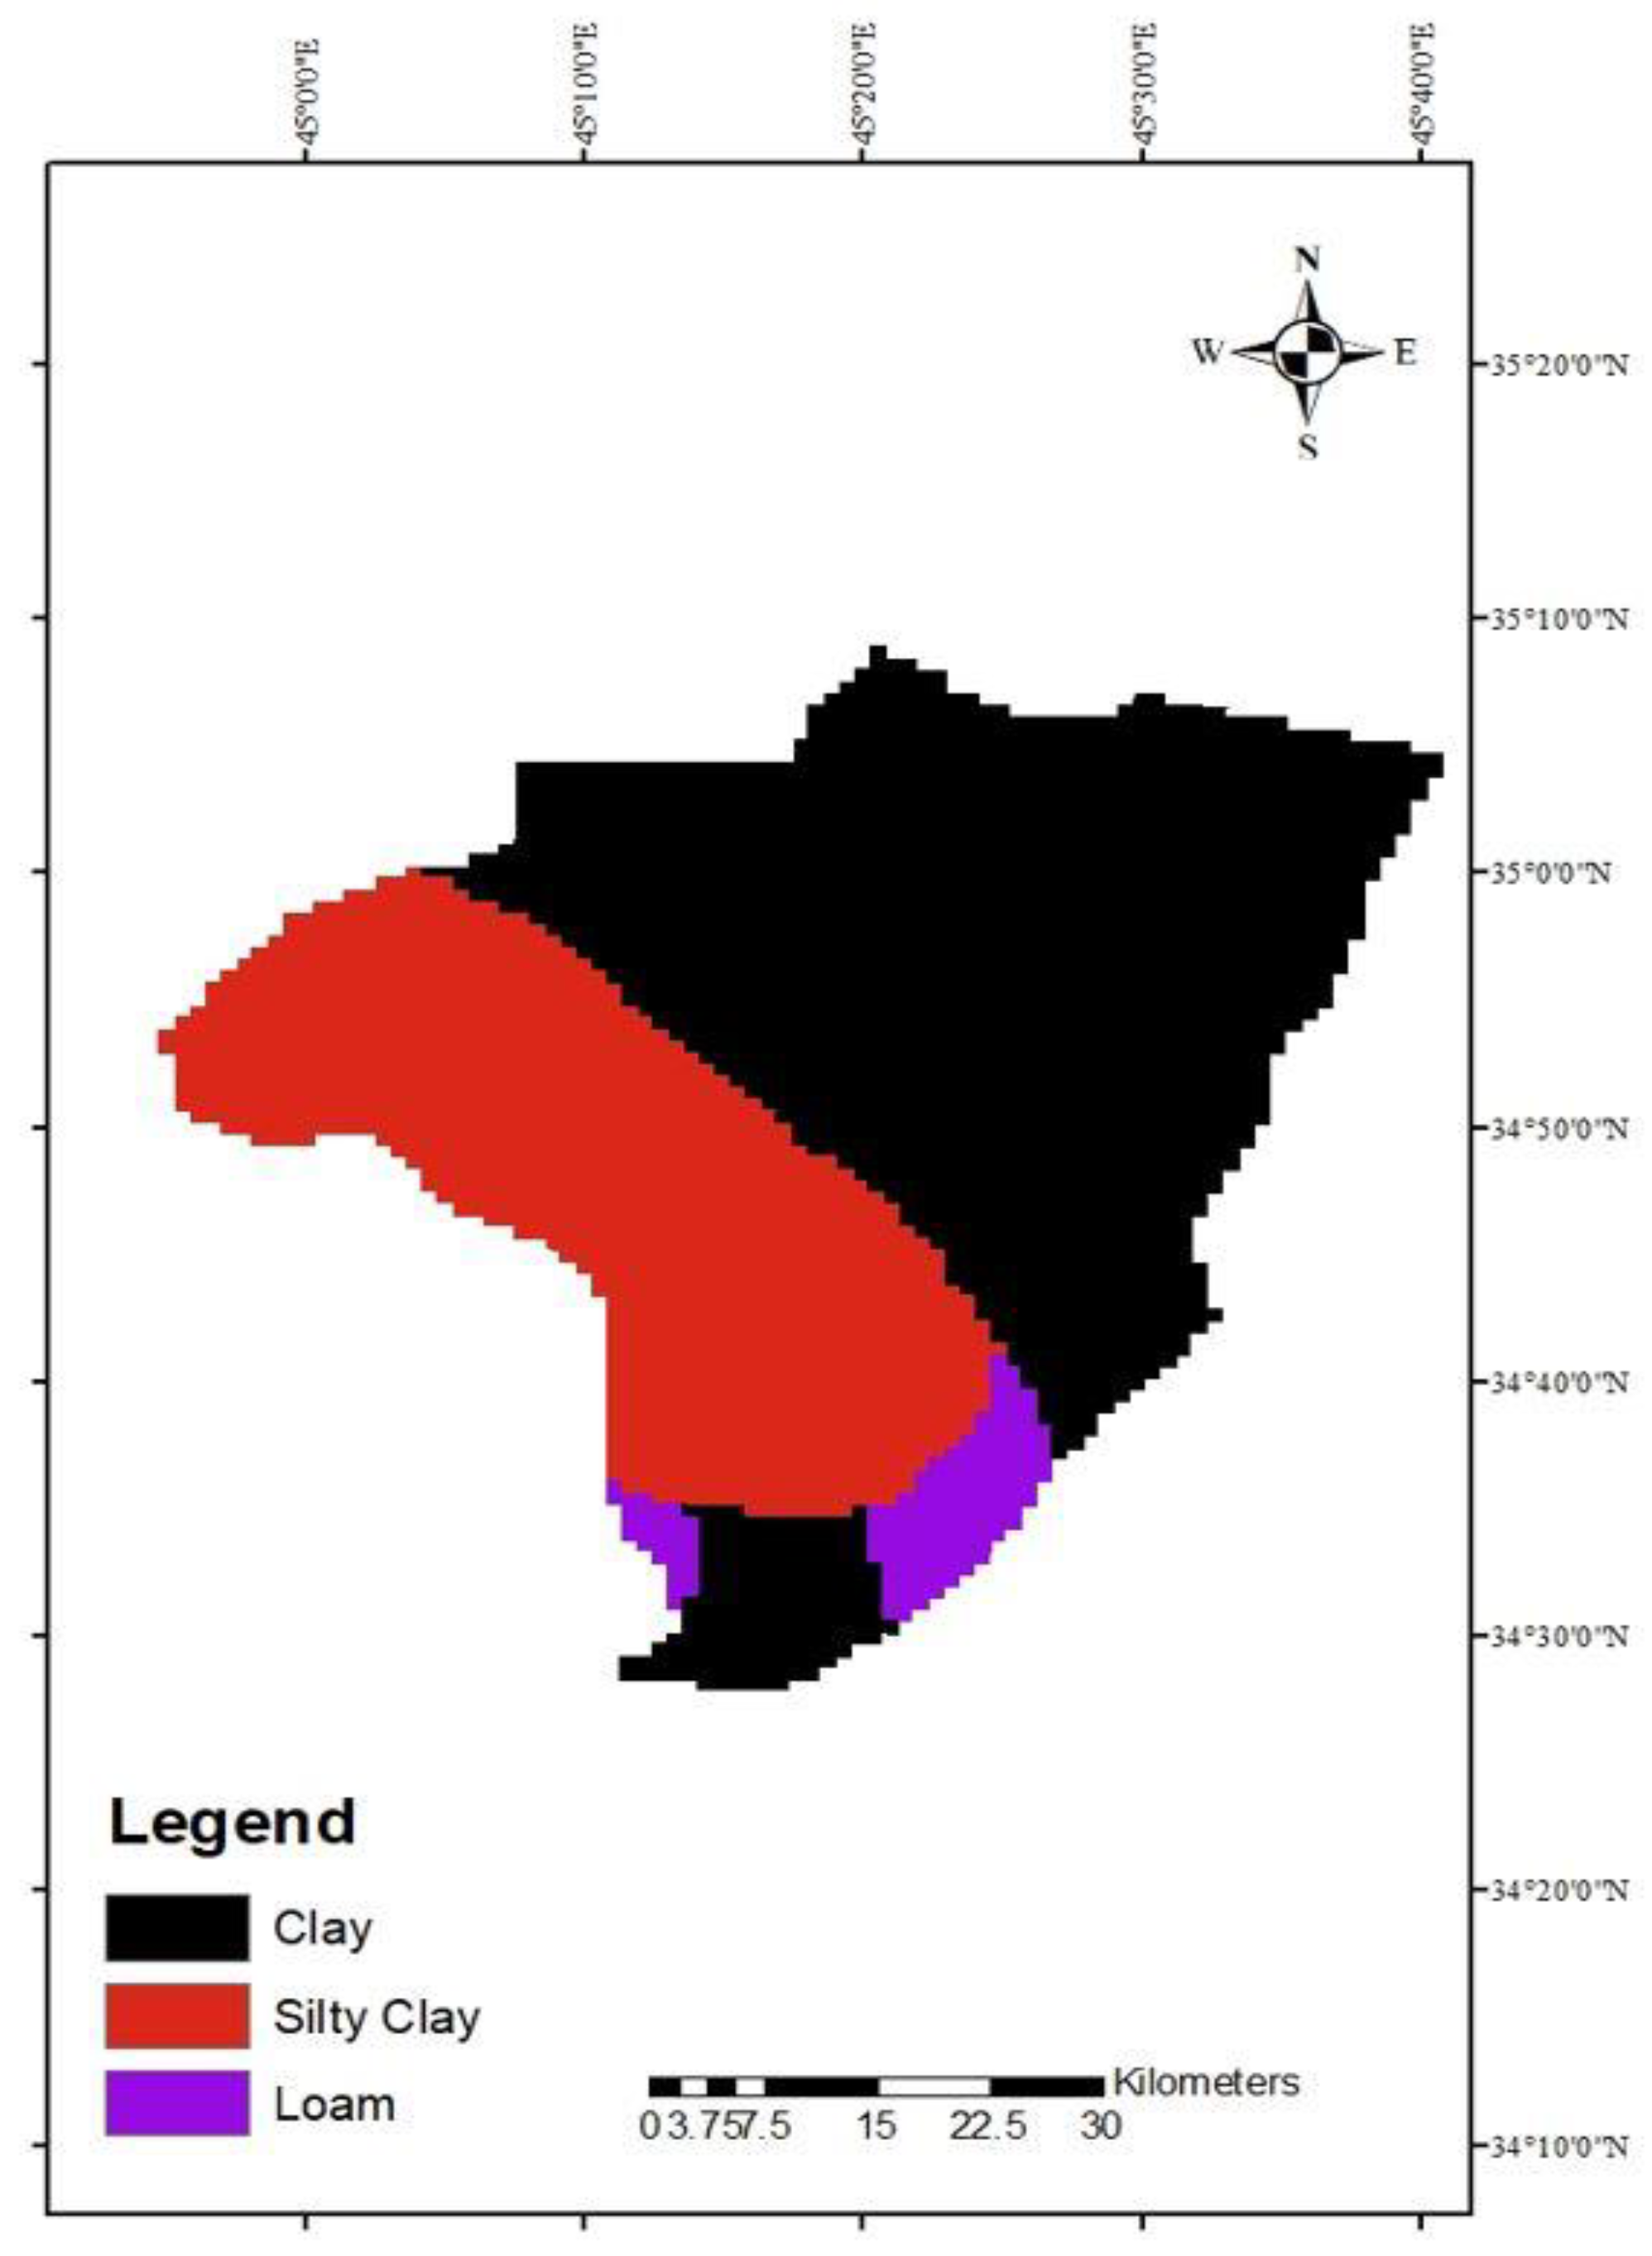
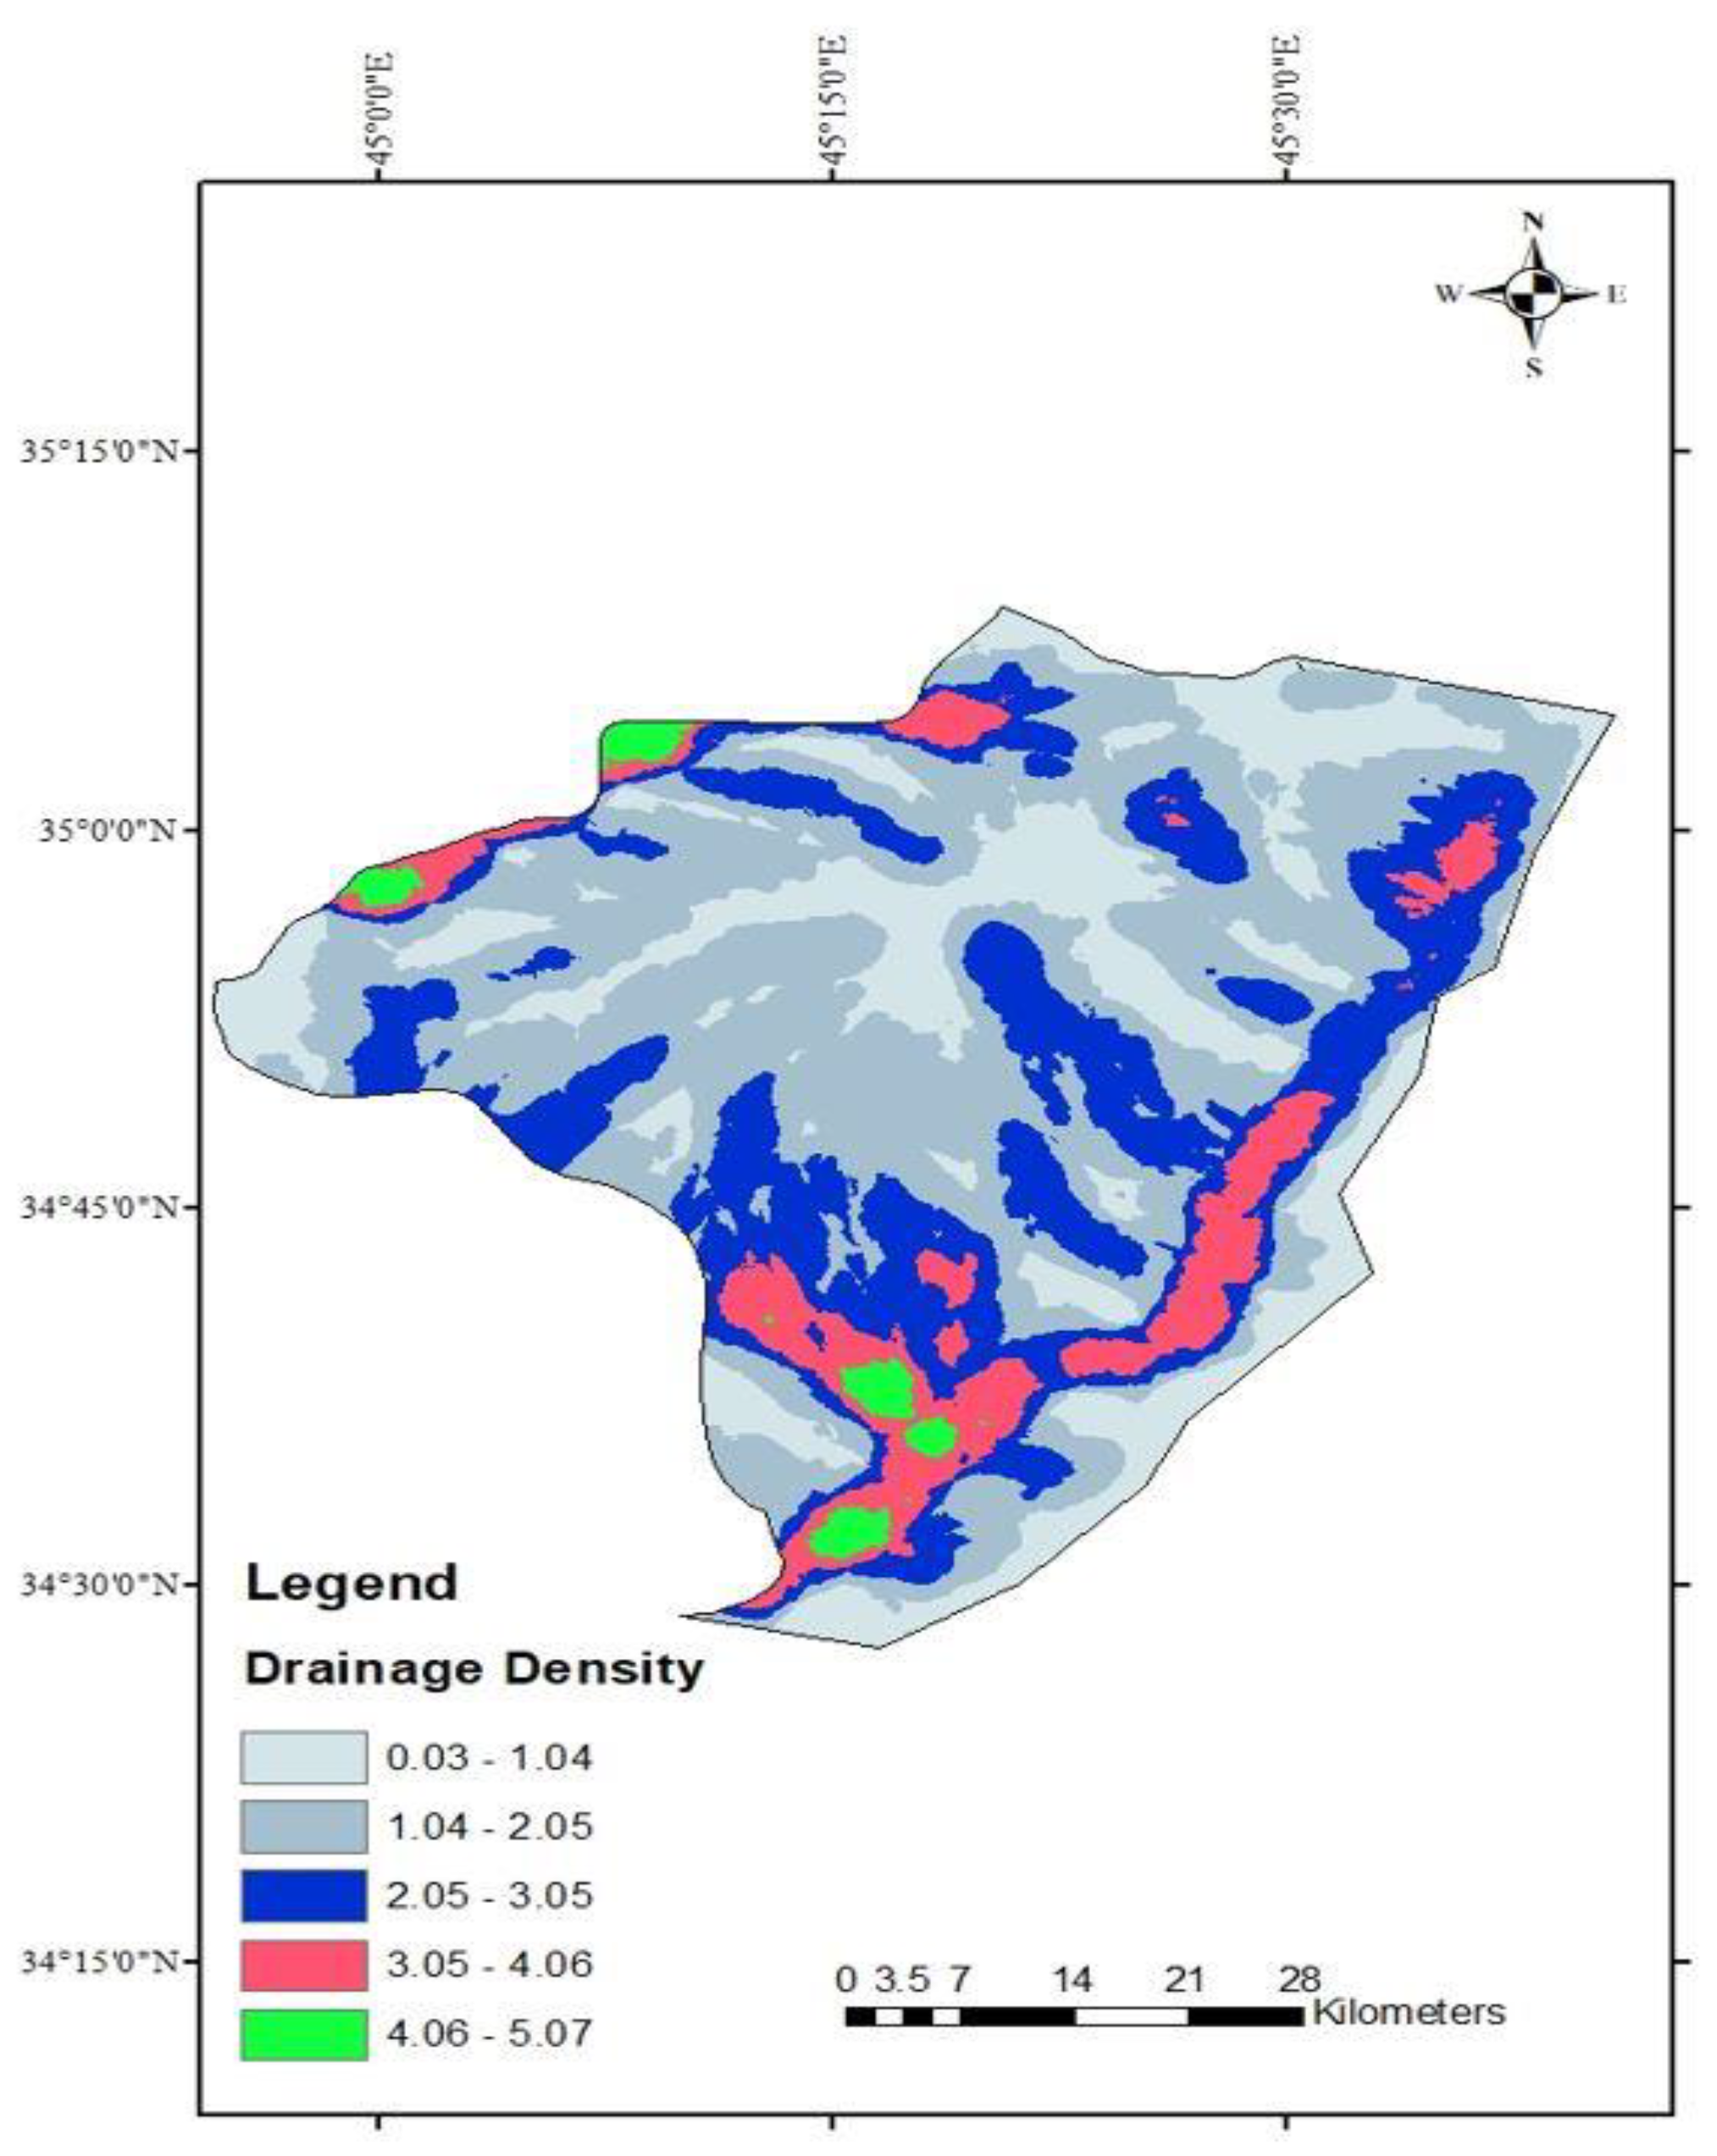
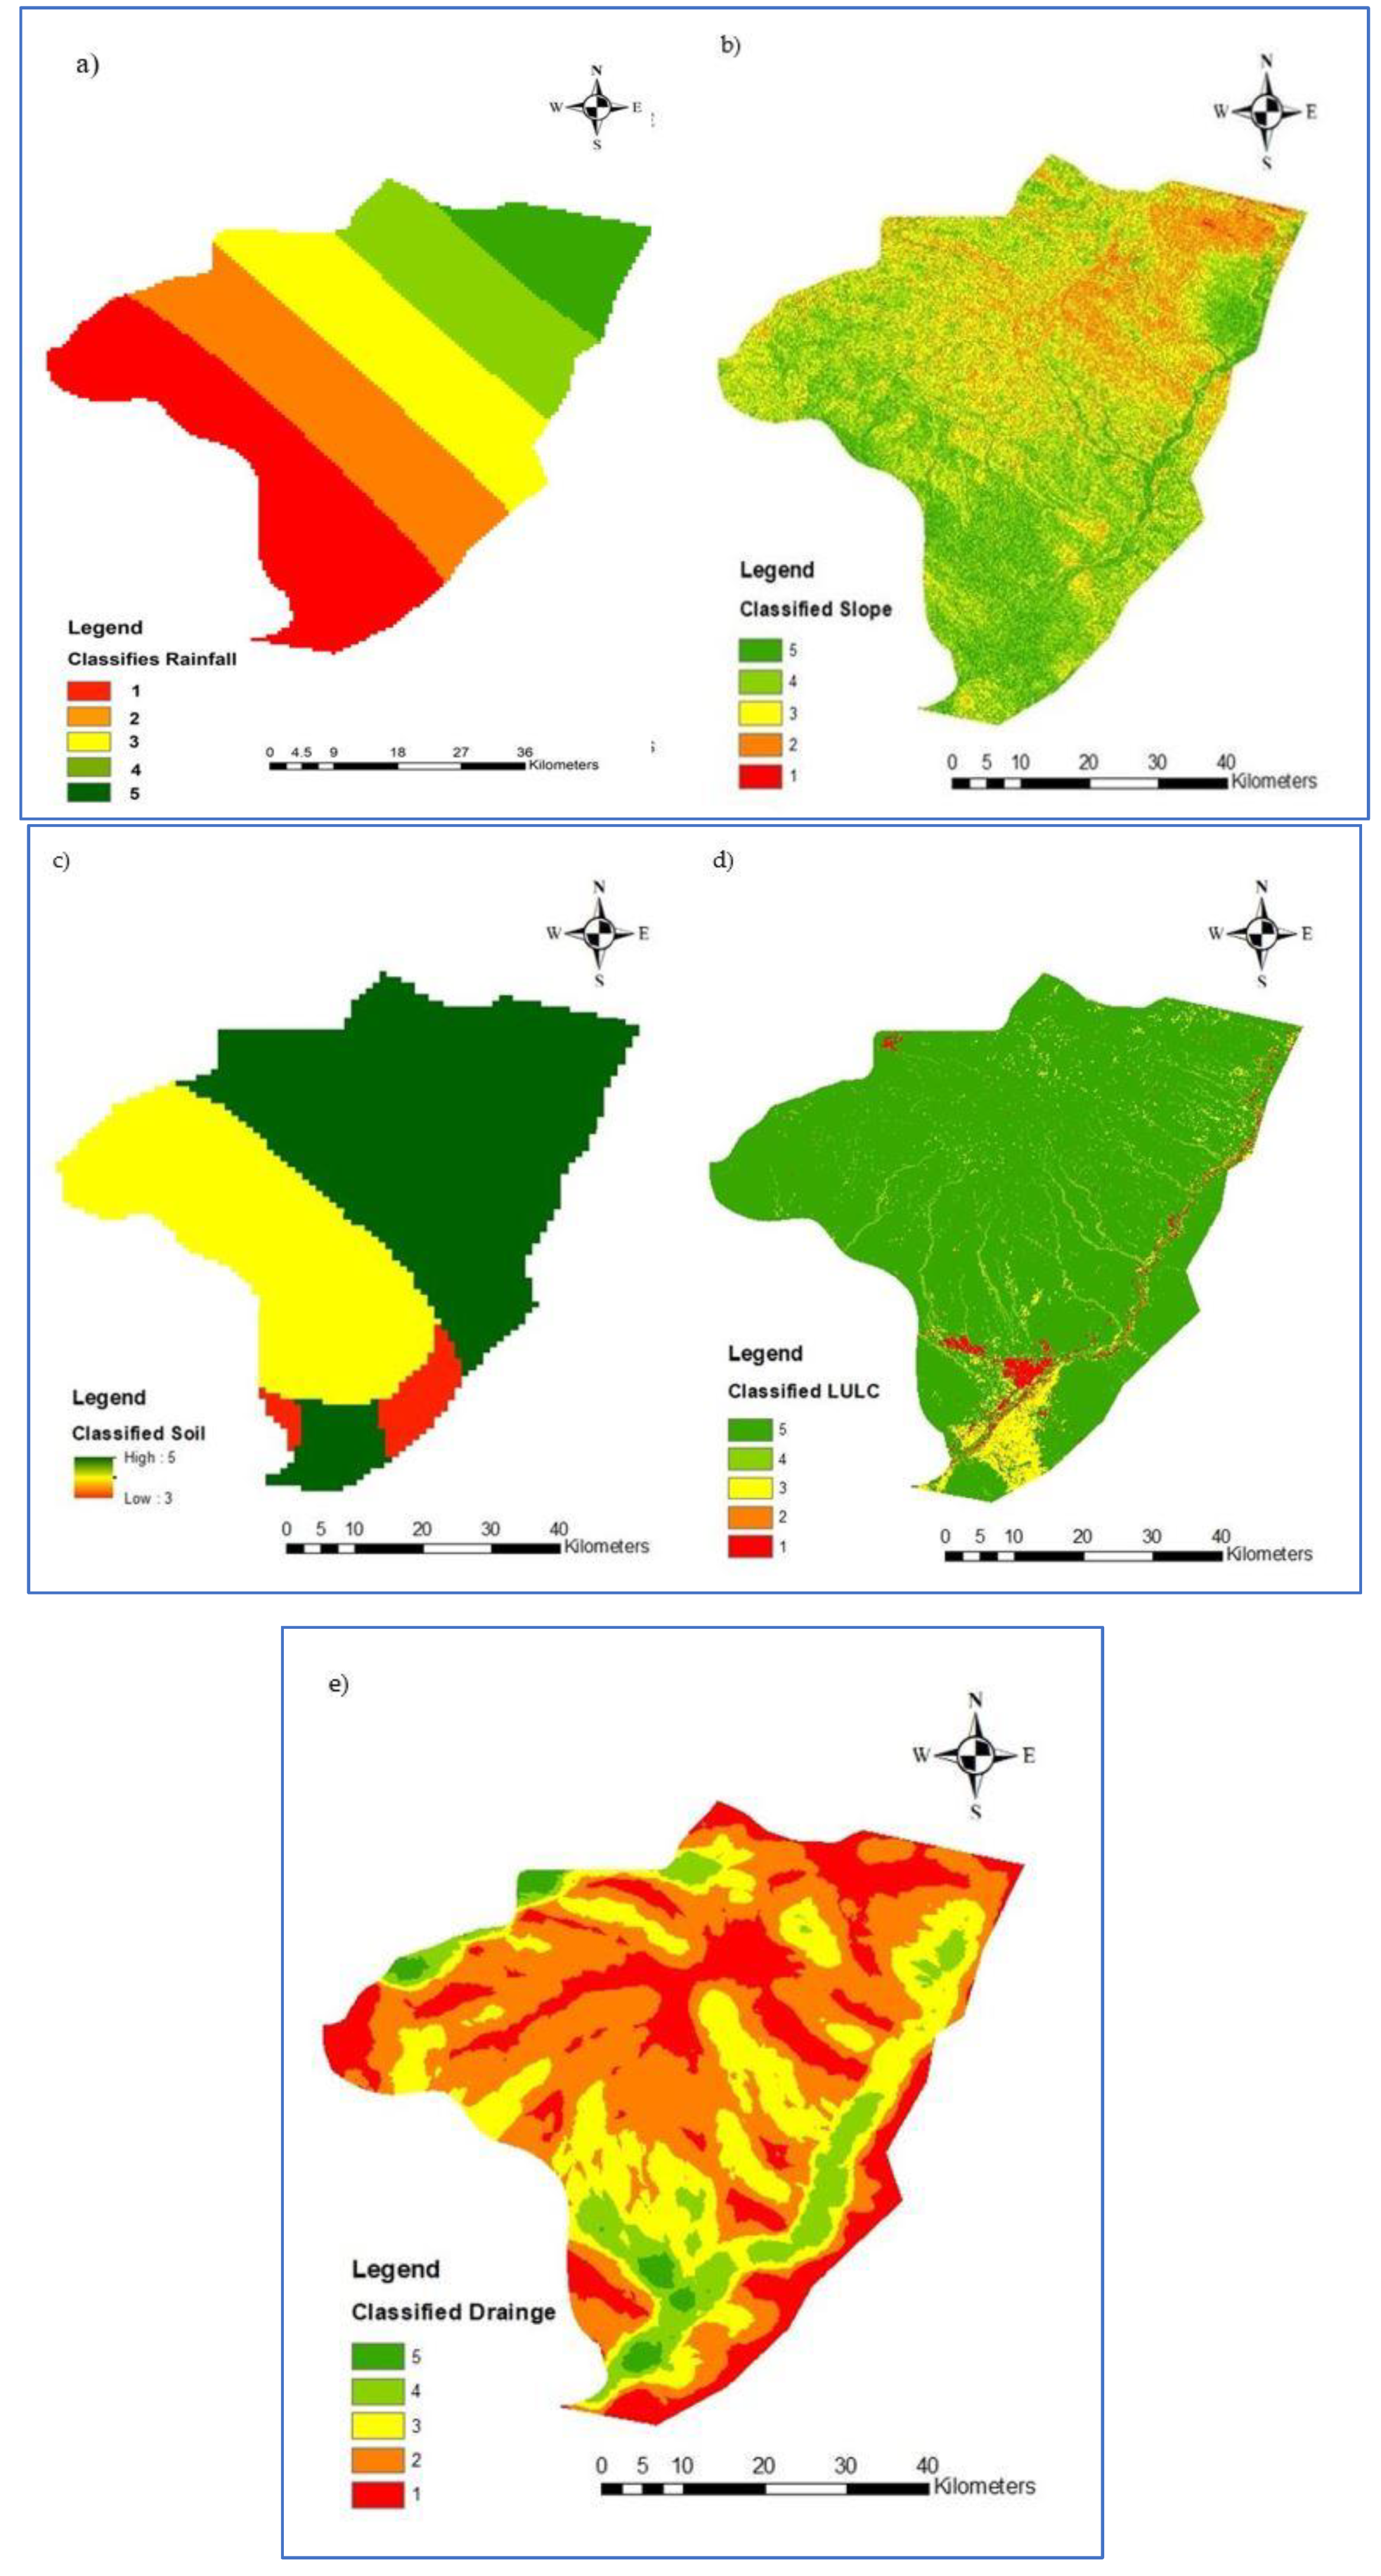
The selection of feasible sites for RWH is essential in maximizing water availability and recharge. The process of locating RWH structures relies on the watershed’s characteristics. Five thematic layers, such as soil texture, slope, drainage density, rainfall, and land use land cover, are considered to determine proper sites for RWH structures.
RWH suitability maps were determined using MCA. The five thematic layers were added (Rainfall, Slope, Soil texture, LULC, and drainage density) using the WLC method. Thematic maps were divided into five categories according to their appropriateness for water harvesting: very low, low, moderate, high, and very high.
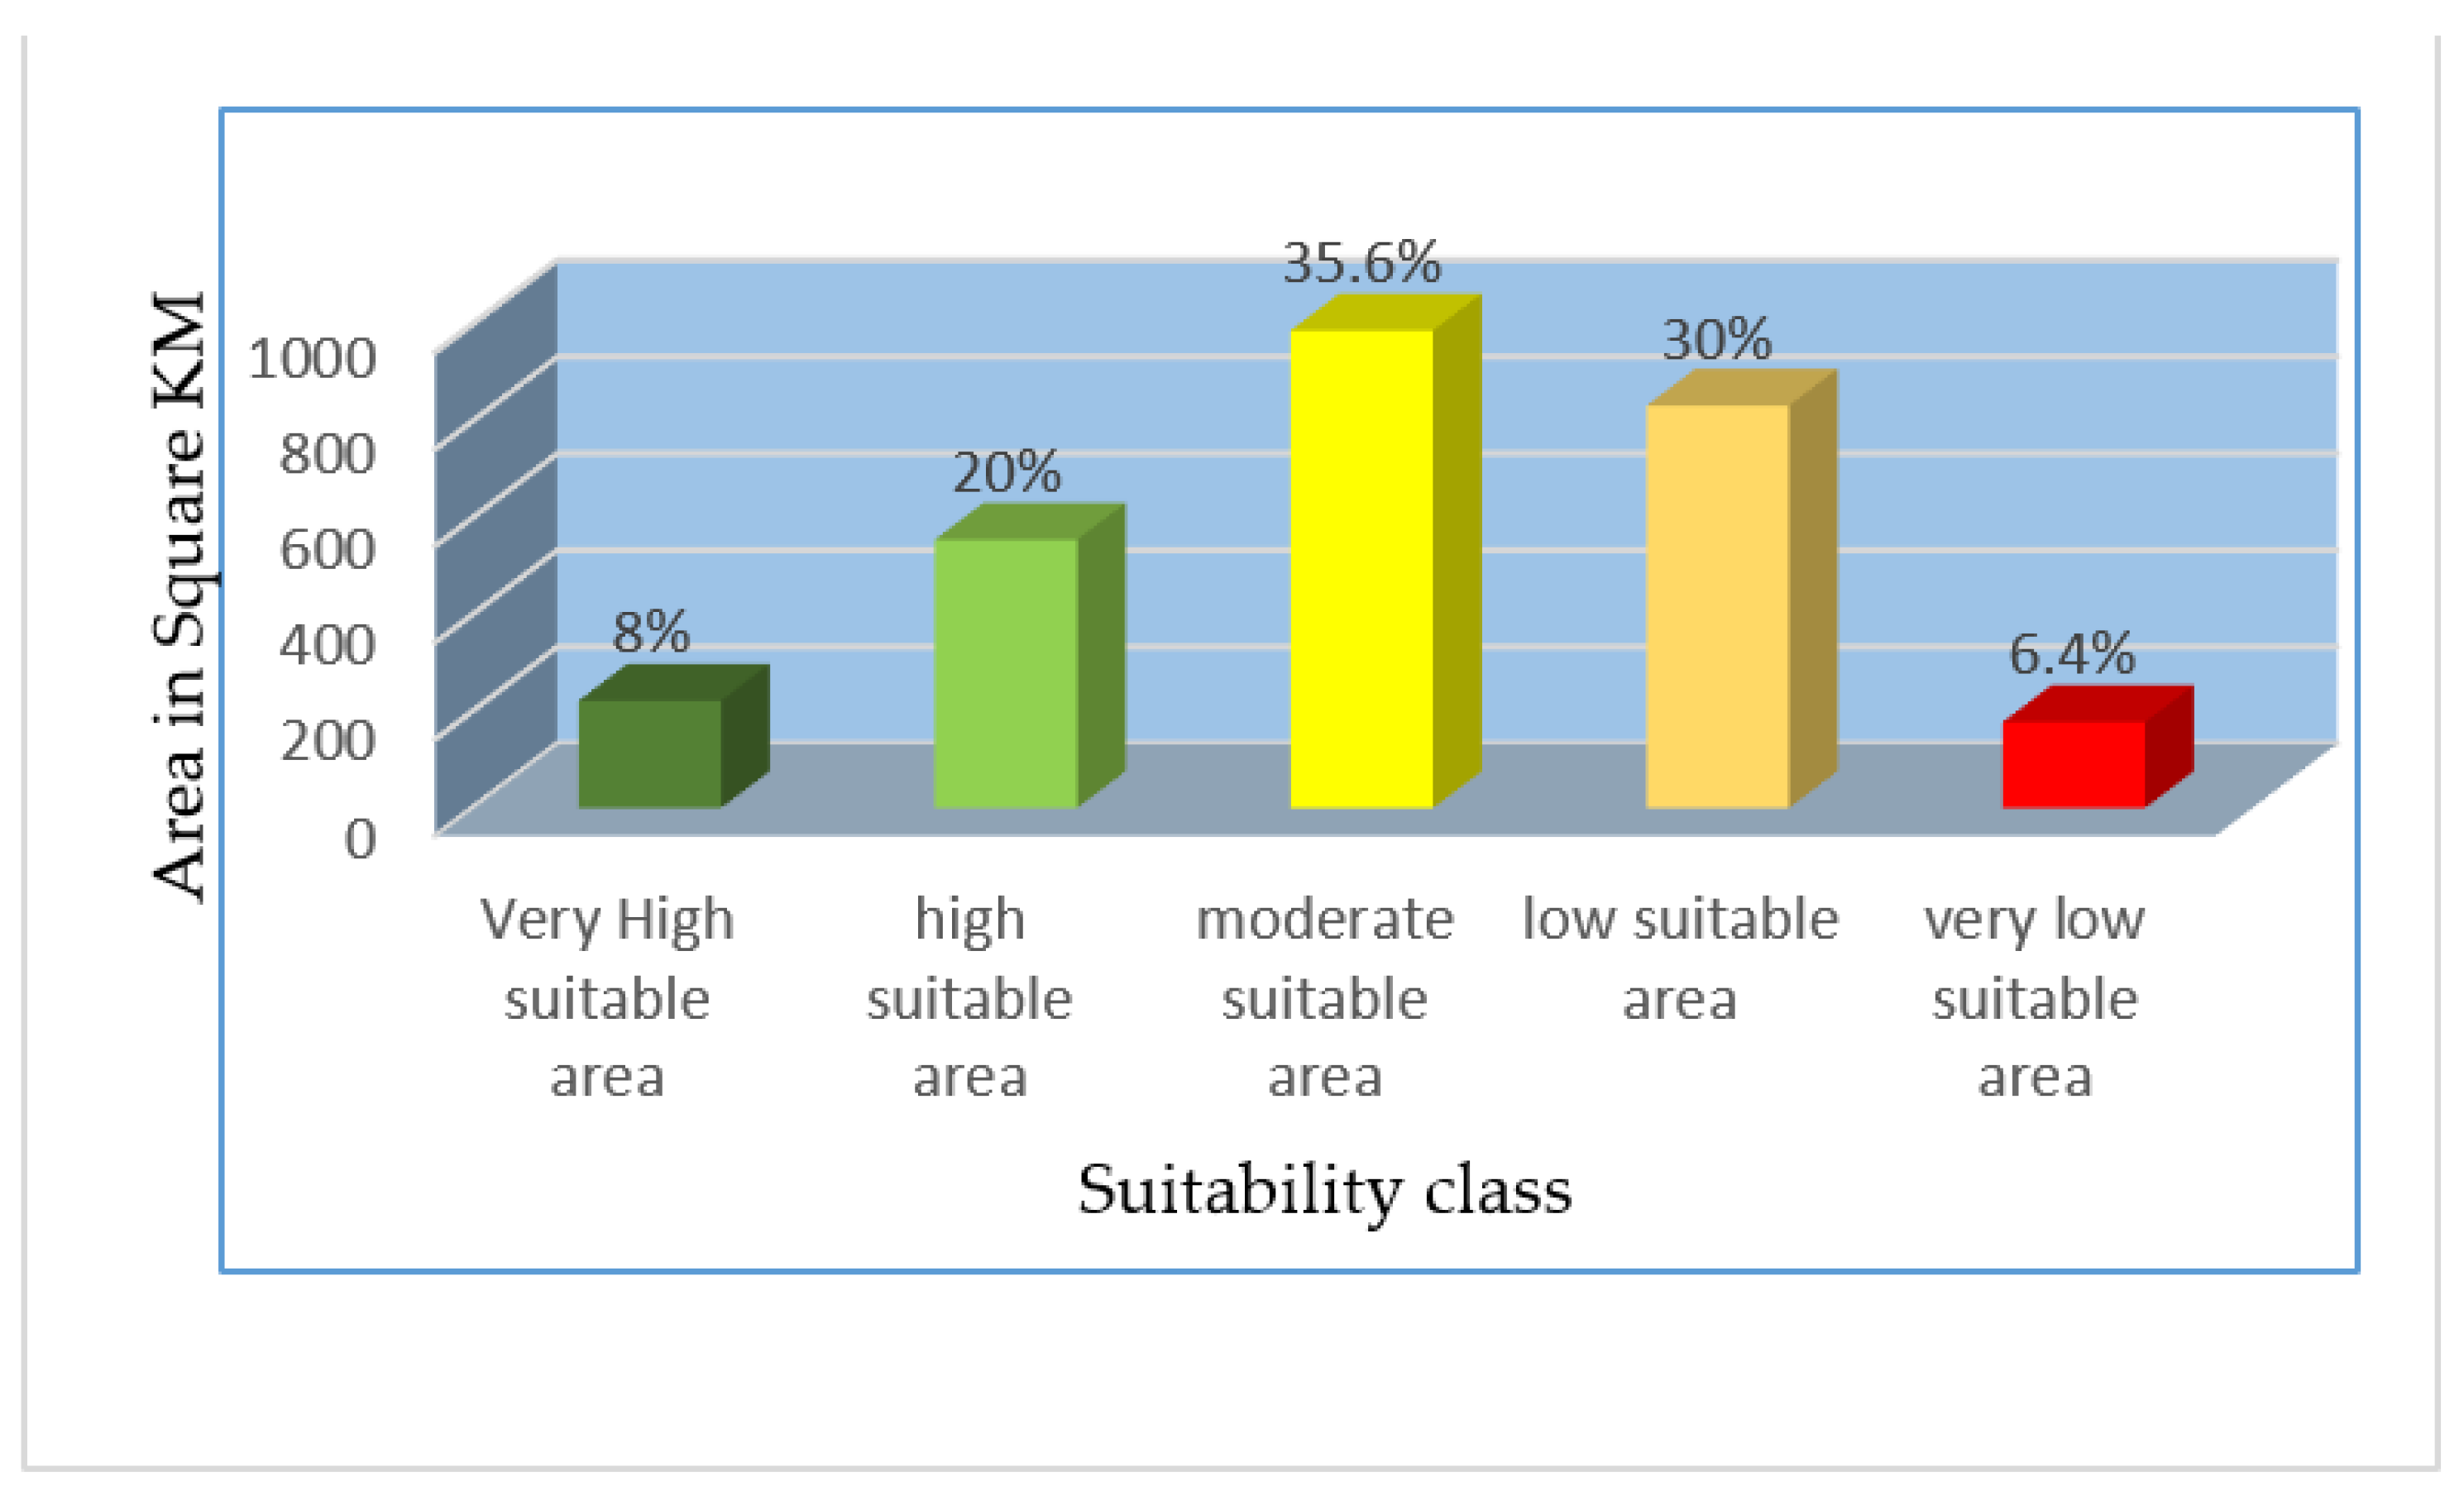
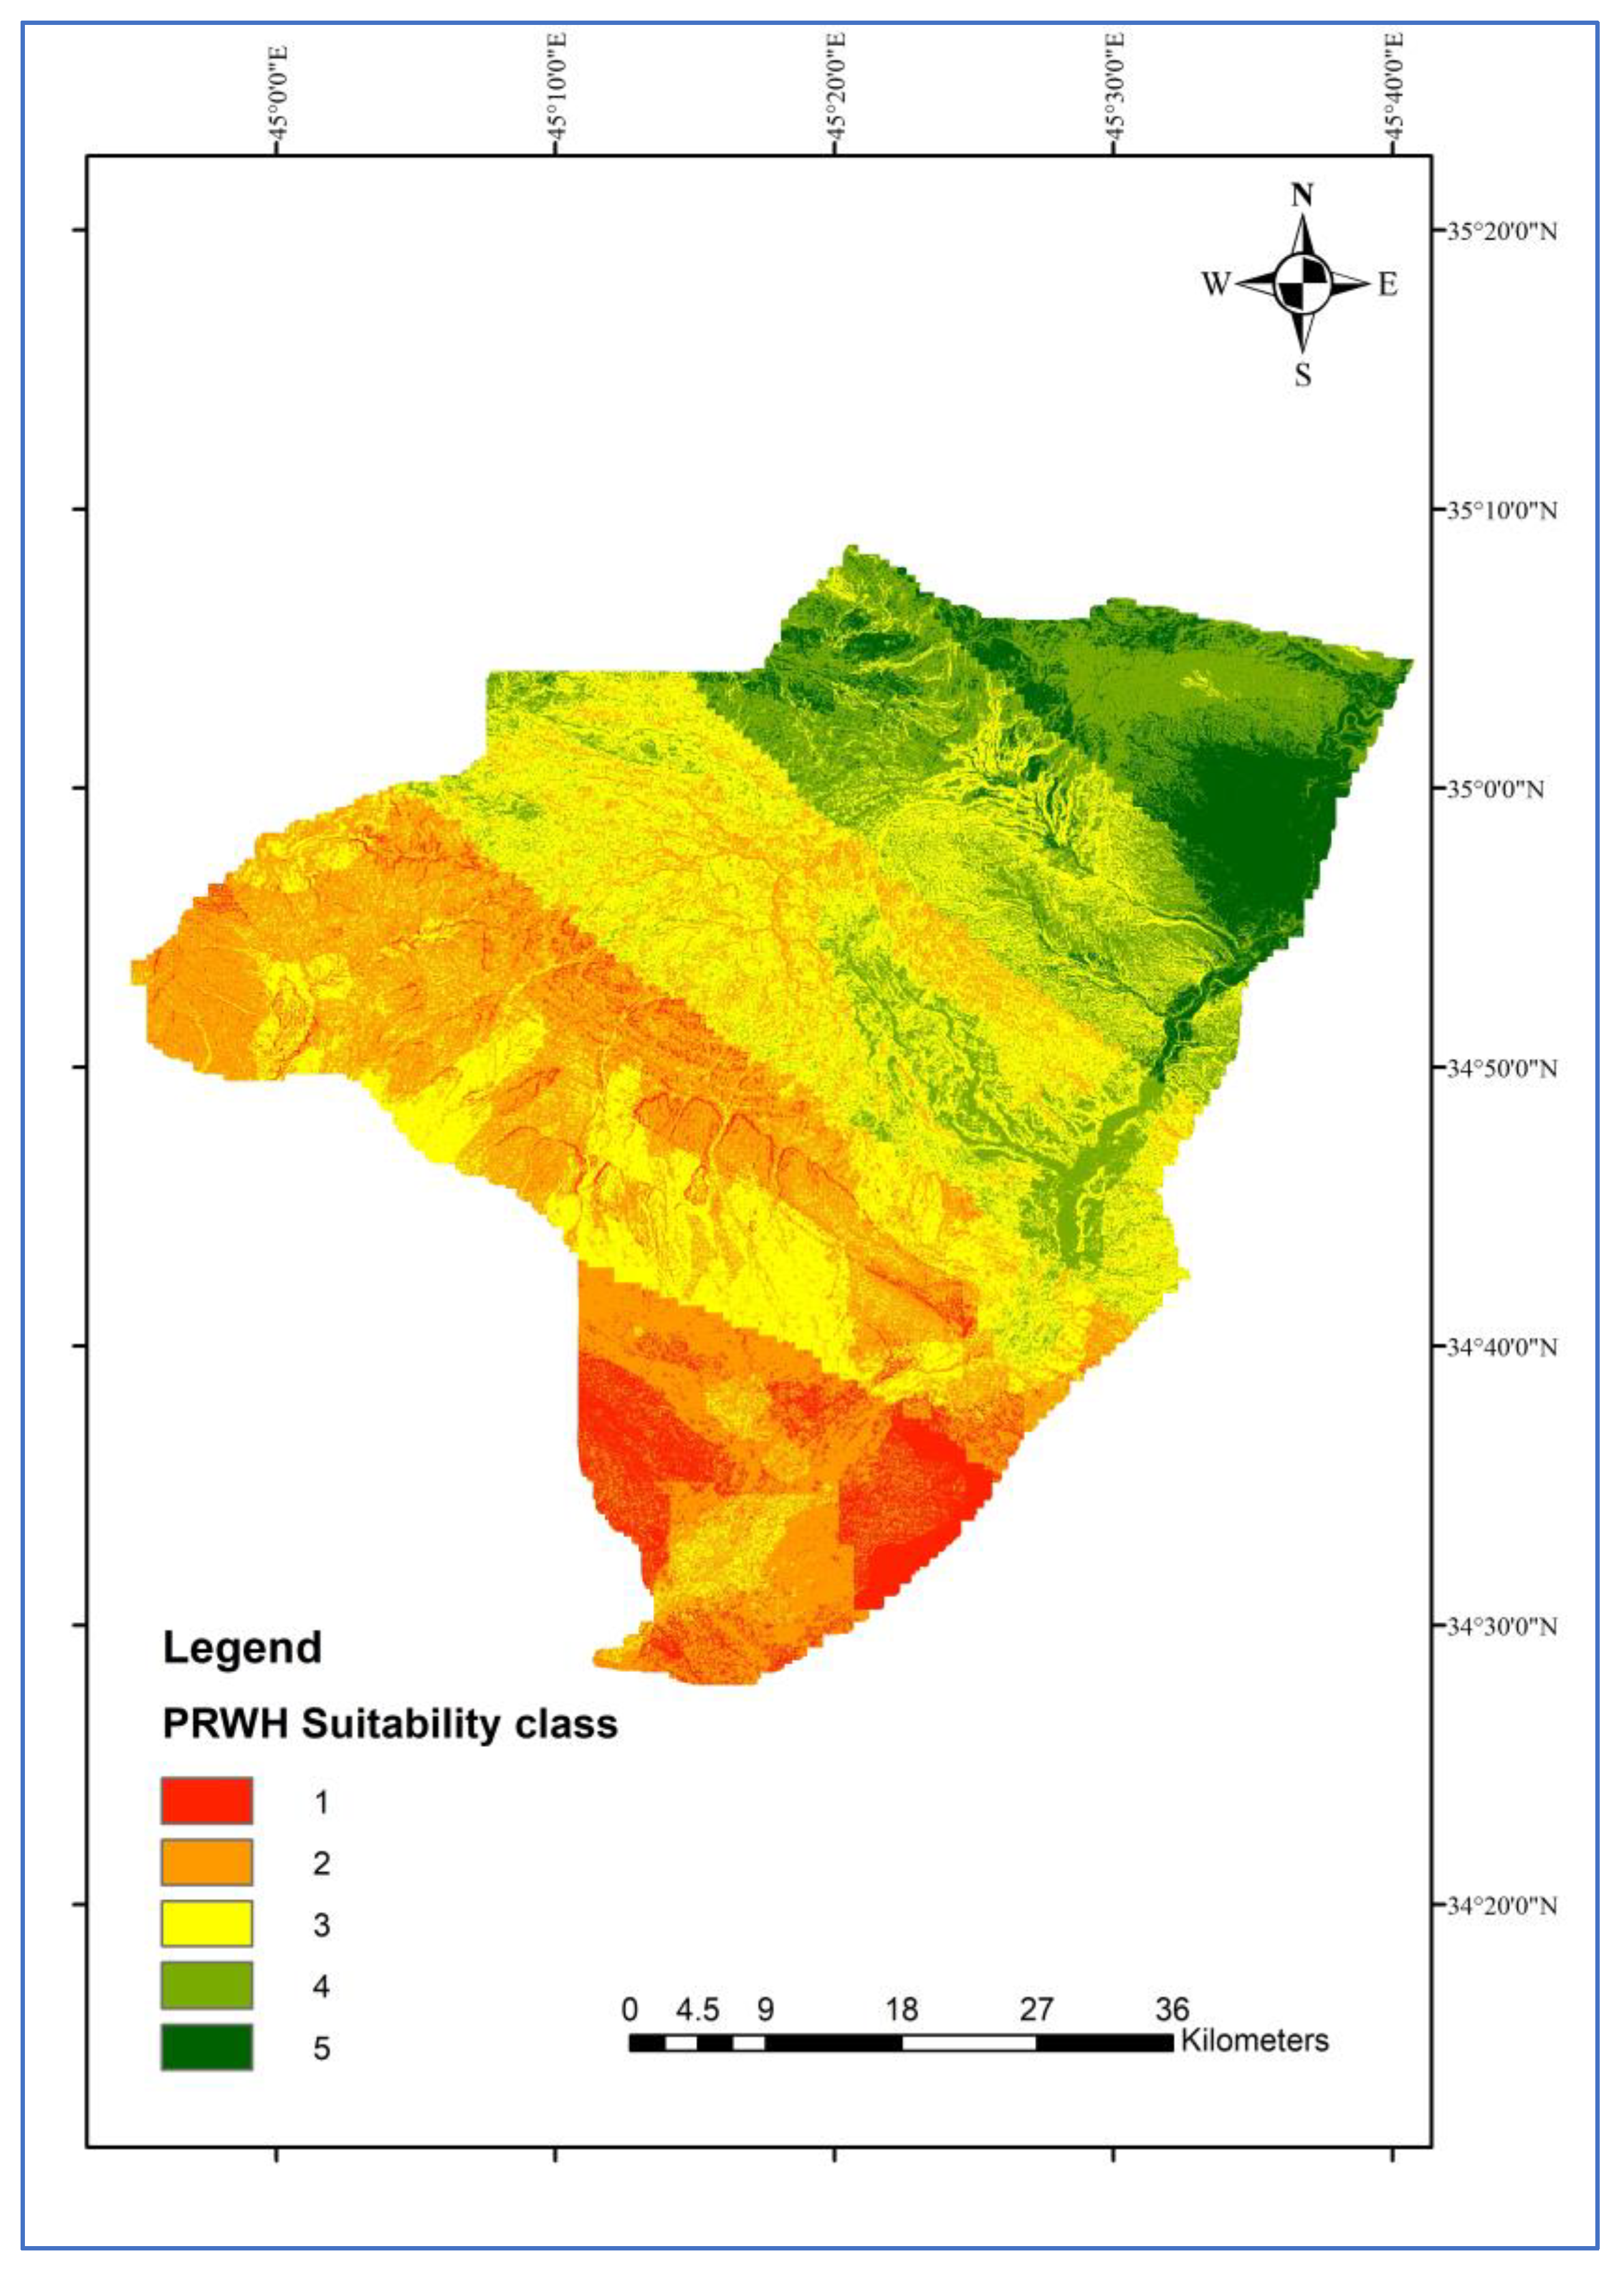
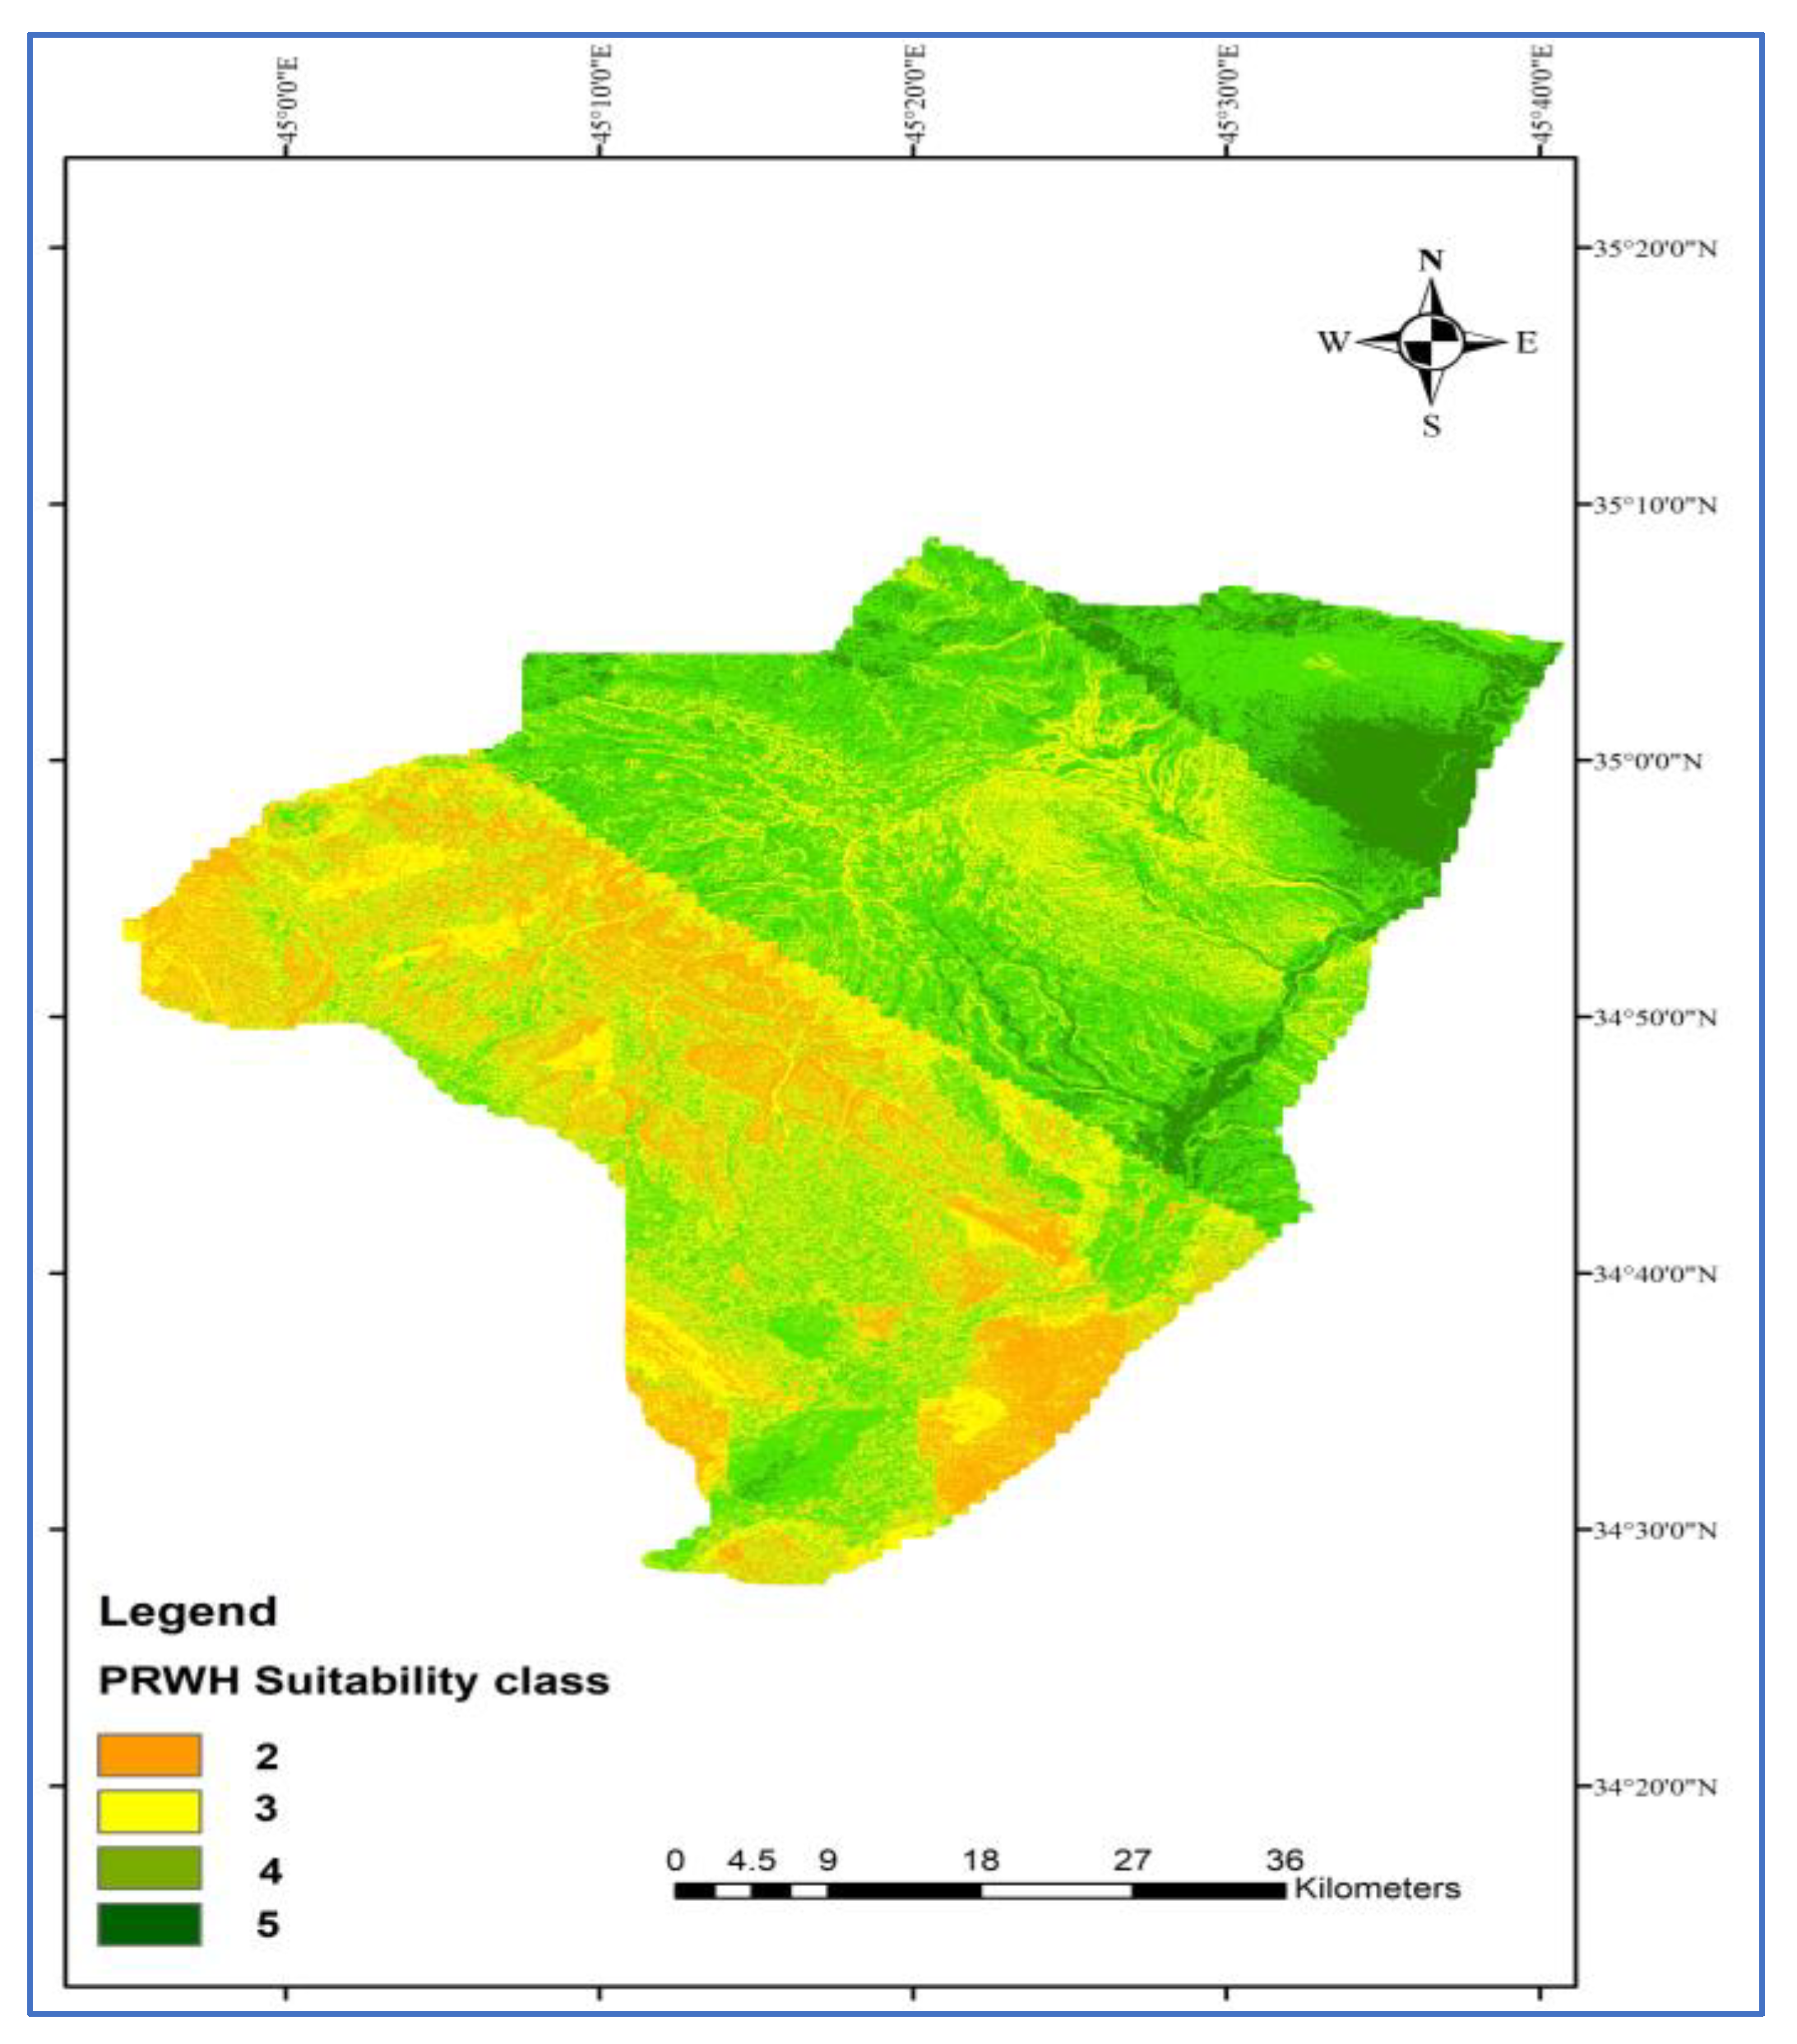
The results indicated that 8%, 20%, 35.6%, 30%, and 6.4% of the sites have very high, high, moderate, low, and very low suitability for rainwater harvesting, respectively, as shown in Figure 11. The northeast of the Garmian Region has a very high level of suitability for RWH.
The area north of Kalar city is classified as classes 3 and 2 (due to the lower rainfall class). Despite the low degree of suitability, RWH is urgently needed in that area since the effects of the drought are more severe there.
It is evident from the results that the area along the Sirwan river is identified as a very highly suitable zone for RWH, as most of the drainage networks drain into this river, and the slope and topography of the valley promote a good place for water harvesting.
The areas with low or moderate suitability could also be used for rainwater harvesting because those areas receive higher rainfall depths (i.e., 377 to 493 mm); however, the cost should be considered. Figure 12 shows the potential RWH sites.

3.4. Potential RWH Map from FAHP and Fuzzy Gamma

The weights for the criteria used to choose the harvesting locations have been assigned using the fuzzy AHP. Each number in the AHP pairwise matrix has been changed to a triangular fuzzy number to find the weight of the criteria by using the method introduced by Buckley in 1985 [50], as shown in Table 8. Each fuzzy criteria’s geometric mean value was obtained using the geometric mean method by Equation (1). The result of the geometric mean of the criteria is illustrated in Table 9.
Fuzzy AHP aids decision-makers in focusing on more crucial factors as opposed to traditional AHP. The traditional AHP technique does not allow for situations where criteria are “zero weighted”. The numerical weight of the criteria will, however, be close to zero if one criterion is assigned less weight than all of the others. [53]. Using Table 8, the geometric mean is calculated for each criterion (see Table 9).
For the above table, the summation of each column is calculated. On the other hand, the inverse of the summation row is generated and assorted from small to large inverse. The center of area (COA) method, introduced by Chou and Chang in 2008 [53], is then used to apply defuzzification, which turns the fuzzy results obtained by aggregation methods into crisp values. Because fuzzy sets include incomplete ranking, a crisp value is more understandable and more straightforward for the final comparison [57]. The weights are normalized by dividing each weight by the sum. The resulting weight of the FAHP approach is illustrated in Table 10.
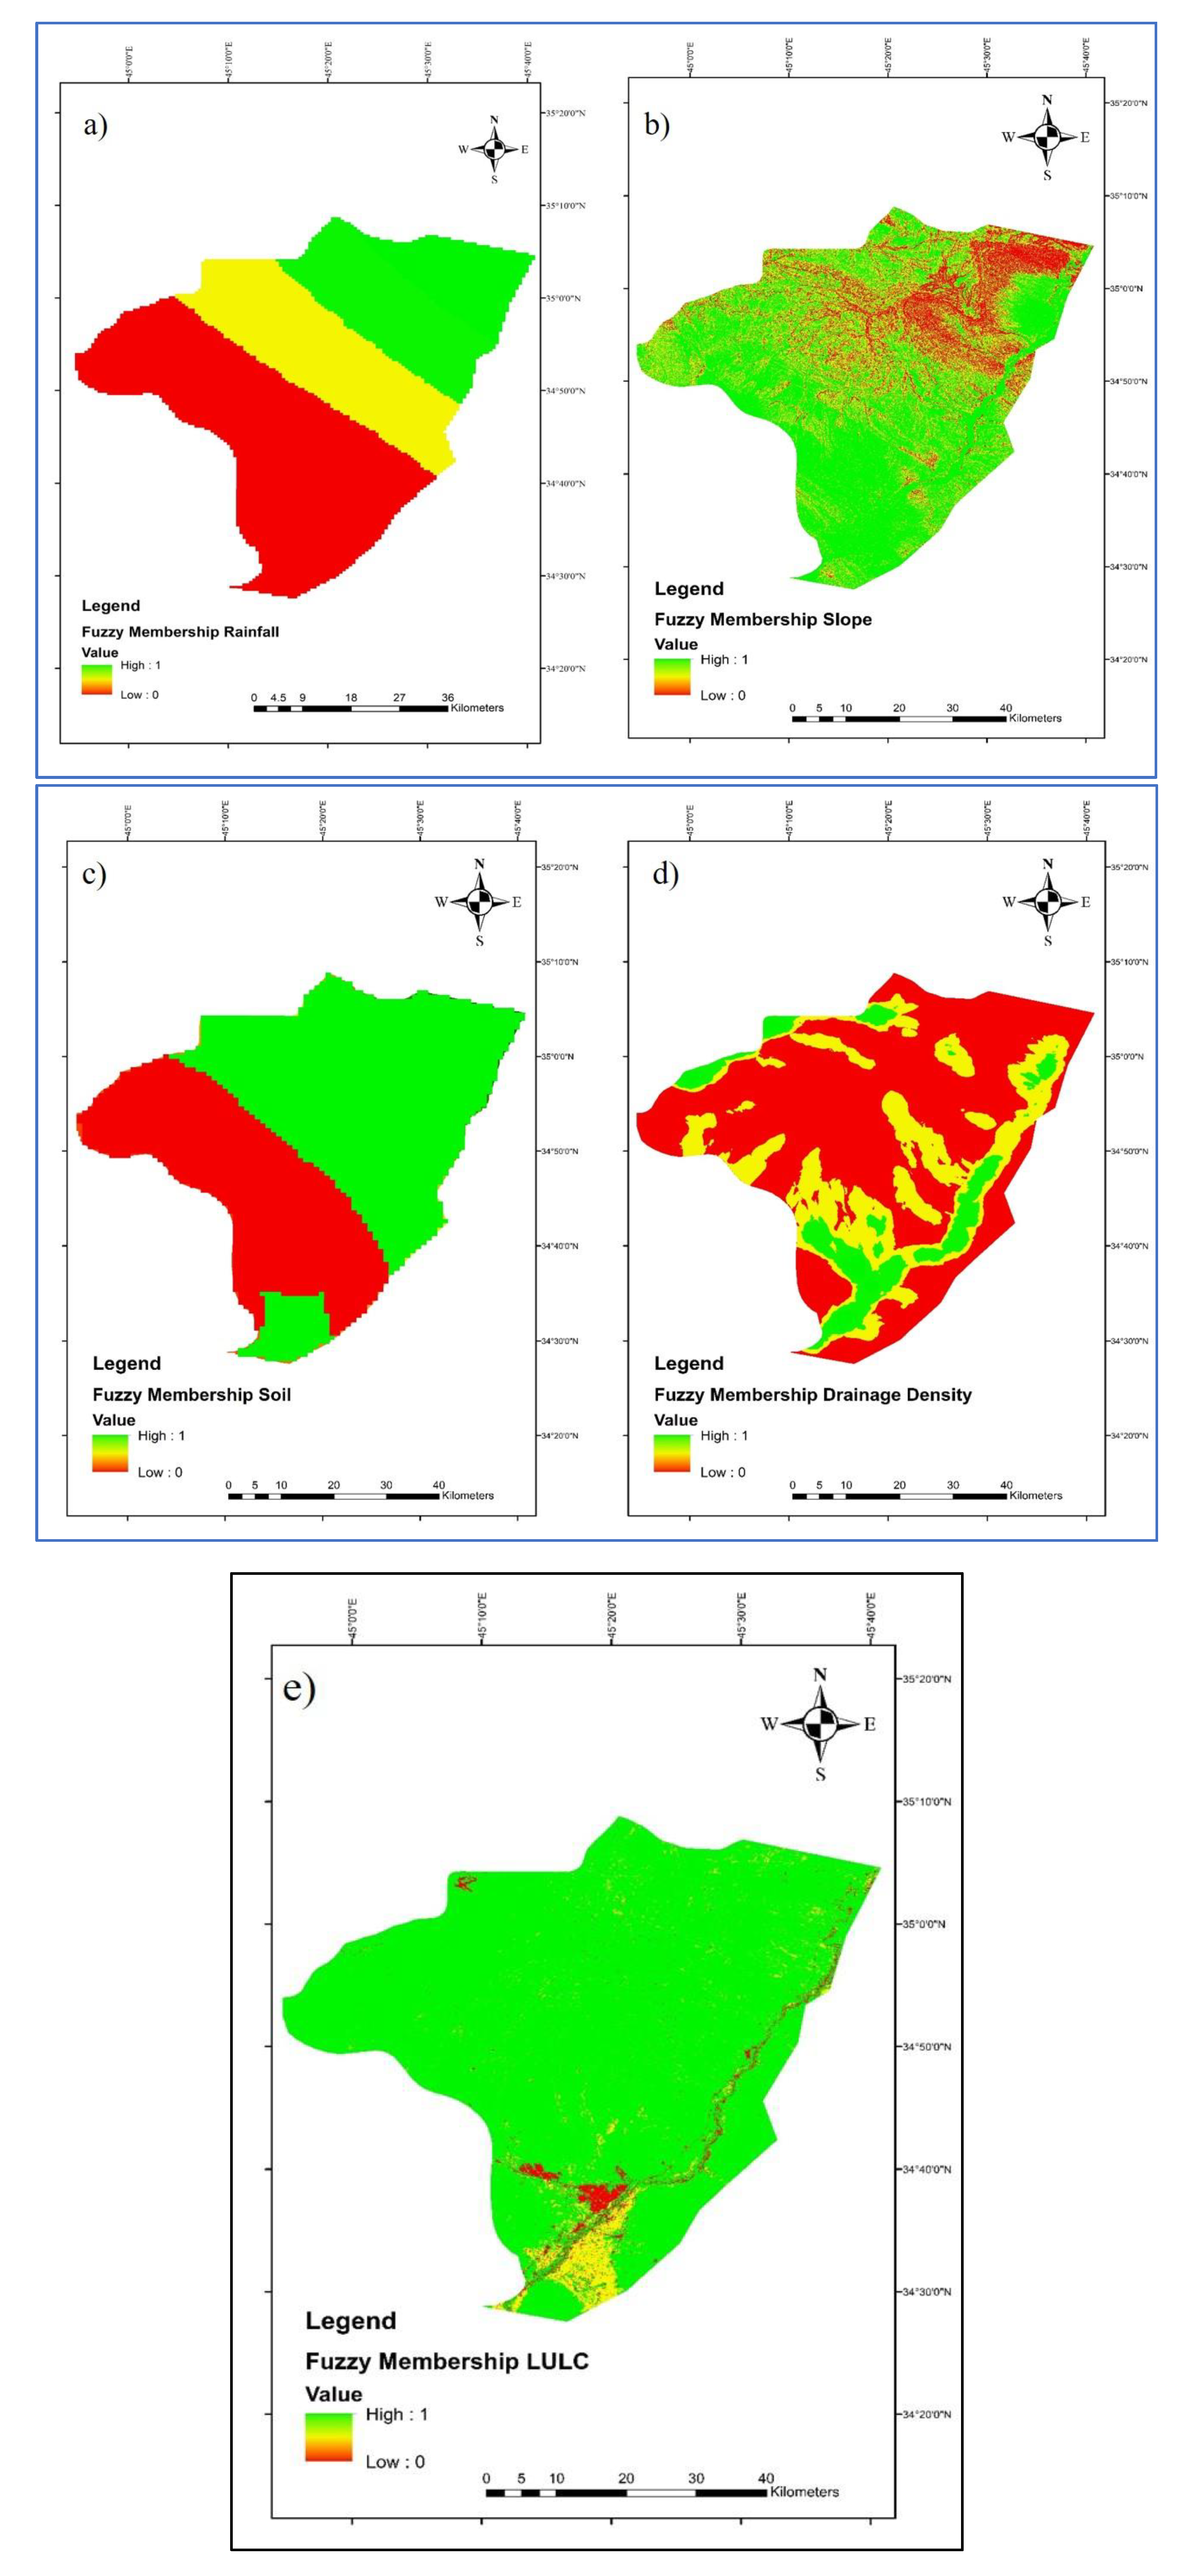
The results indicate that the weight of the rainfall criteria decreased, while the slope and soil texture weights increased. There is little difference between the AHP and fuzzy-AHP weights for the five criteria used in the study. The thematic maps are standardized by linear fuzzy membership to overlay by fuzzy gamma to generate the suitability map for RWH in the Garmian region. The fuzzified maps of the layers are presented in Figure 13a–e.
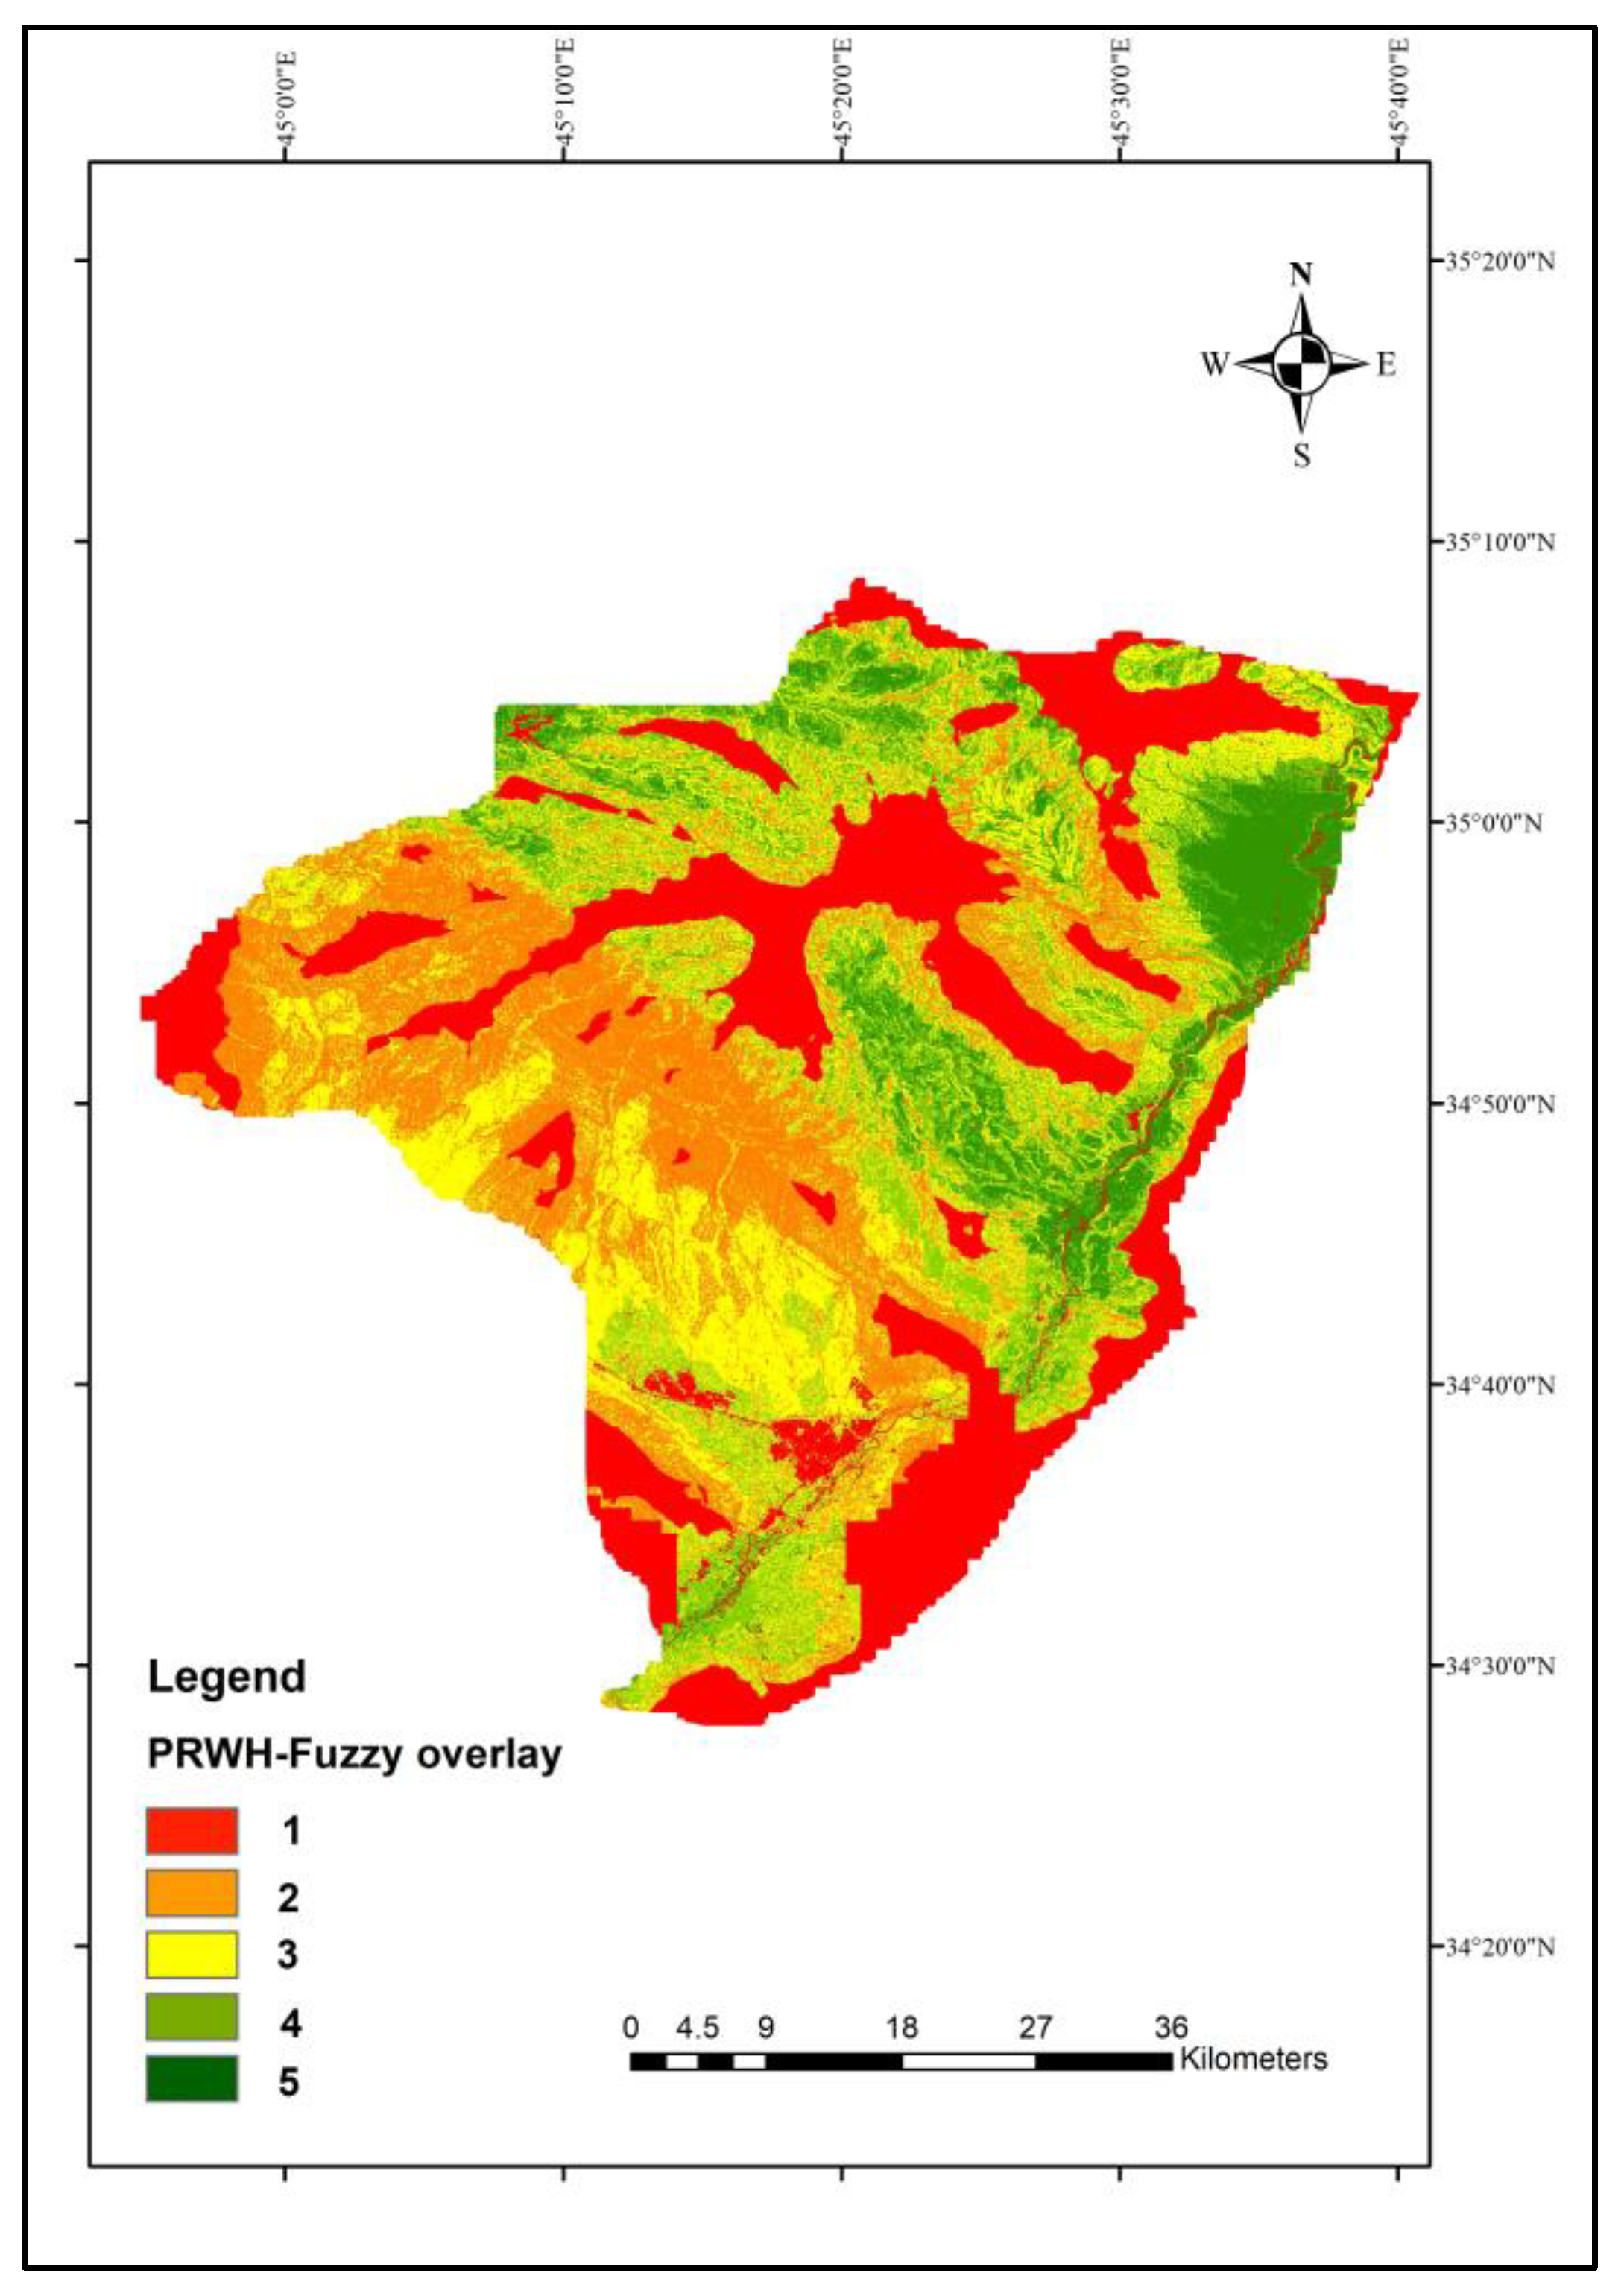
The final step is overlaying the layers by fuzzy gamma overlay. A spatial analyst tool is used in ArcGIS to overlay the layers. The potential RWH map is generated by overlaying the layers using the weights obtained from FAHP, as shown in Figure 14. The map resulting from the Fuzzy overlay has a high spatial indication of the Sirwan river, which is classed as a water body (i.e., very low suitability class); however, the area around the stream is suited with very high suitability. The area with very high suitability covers approximately 10.2% of the entire region. The area with high suitability is located in the north part of the study area and covers 18.7%, while moderate, low, and very low suitability zones constitute 24.5%, 21.3%, and 25.3%, respectively.
There were considerable variations between the suitability map produced by the AHP and FAHP techniques; particularly in classifying class 1 (see Table 11). In general; they indicated that most of the areas in the south and southwest are within class 1 (i.e., low suitability).
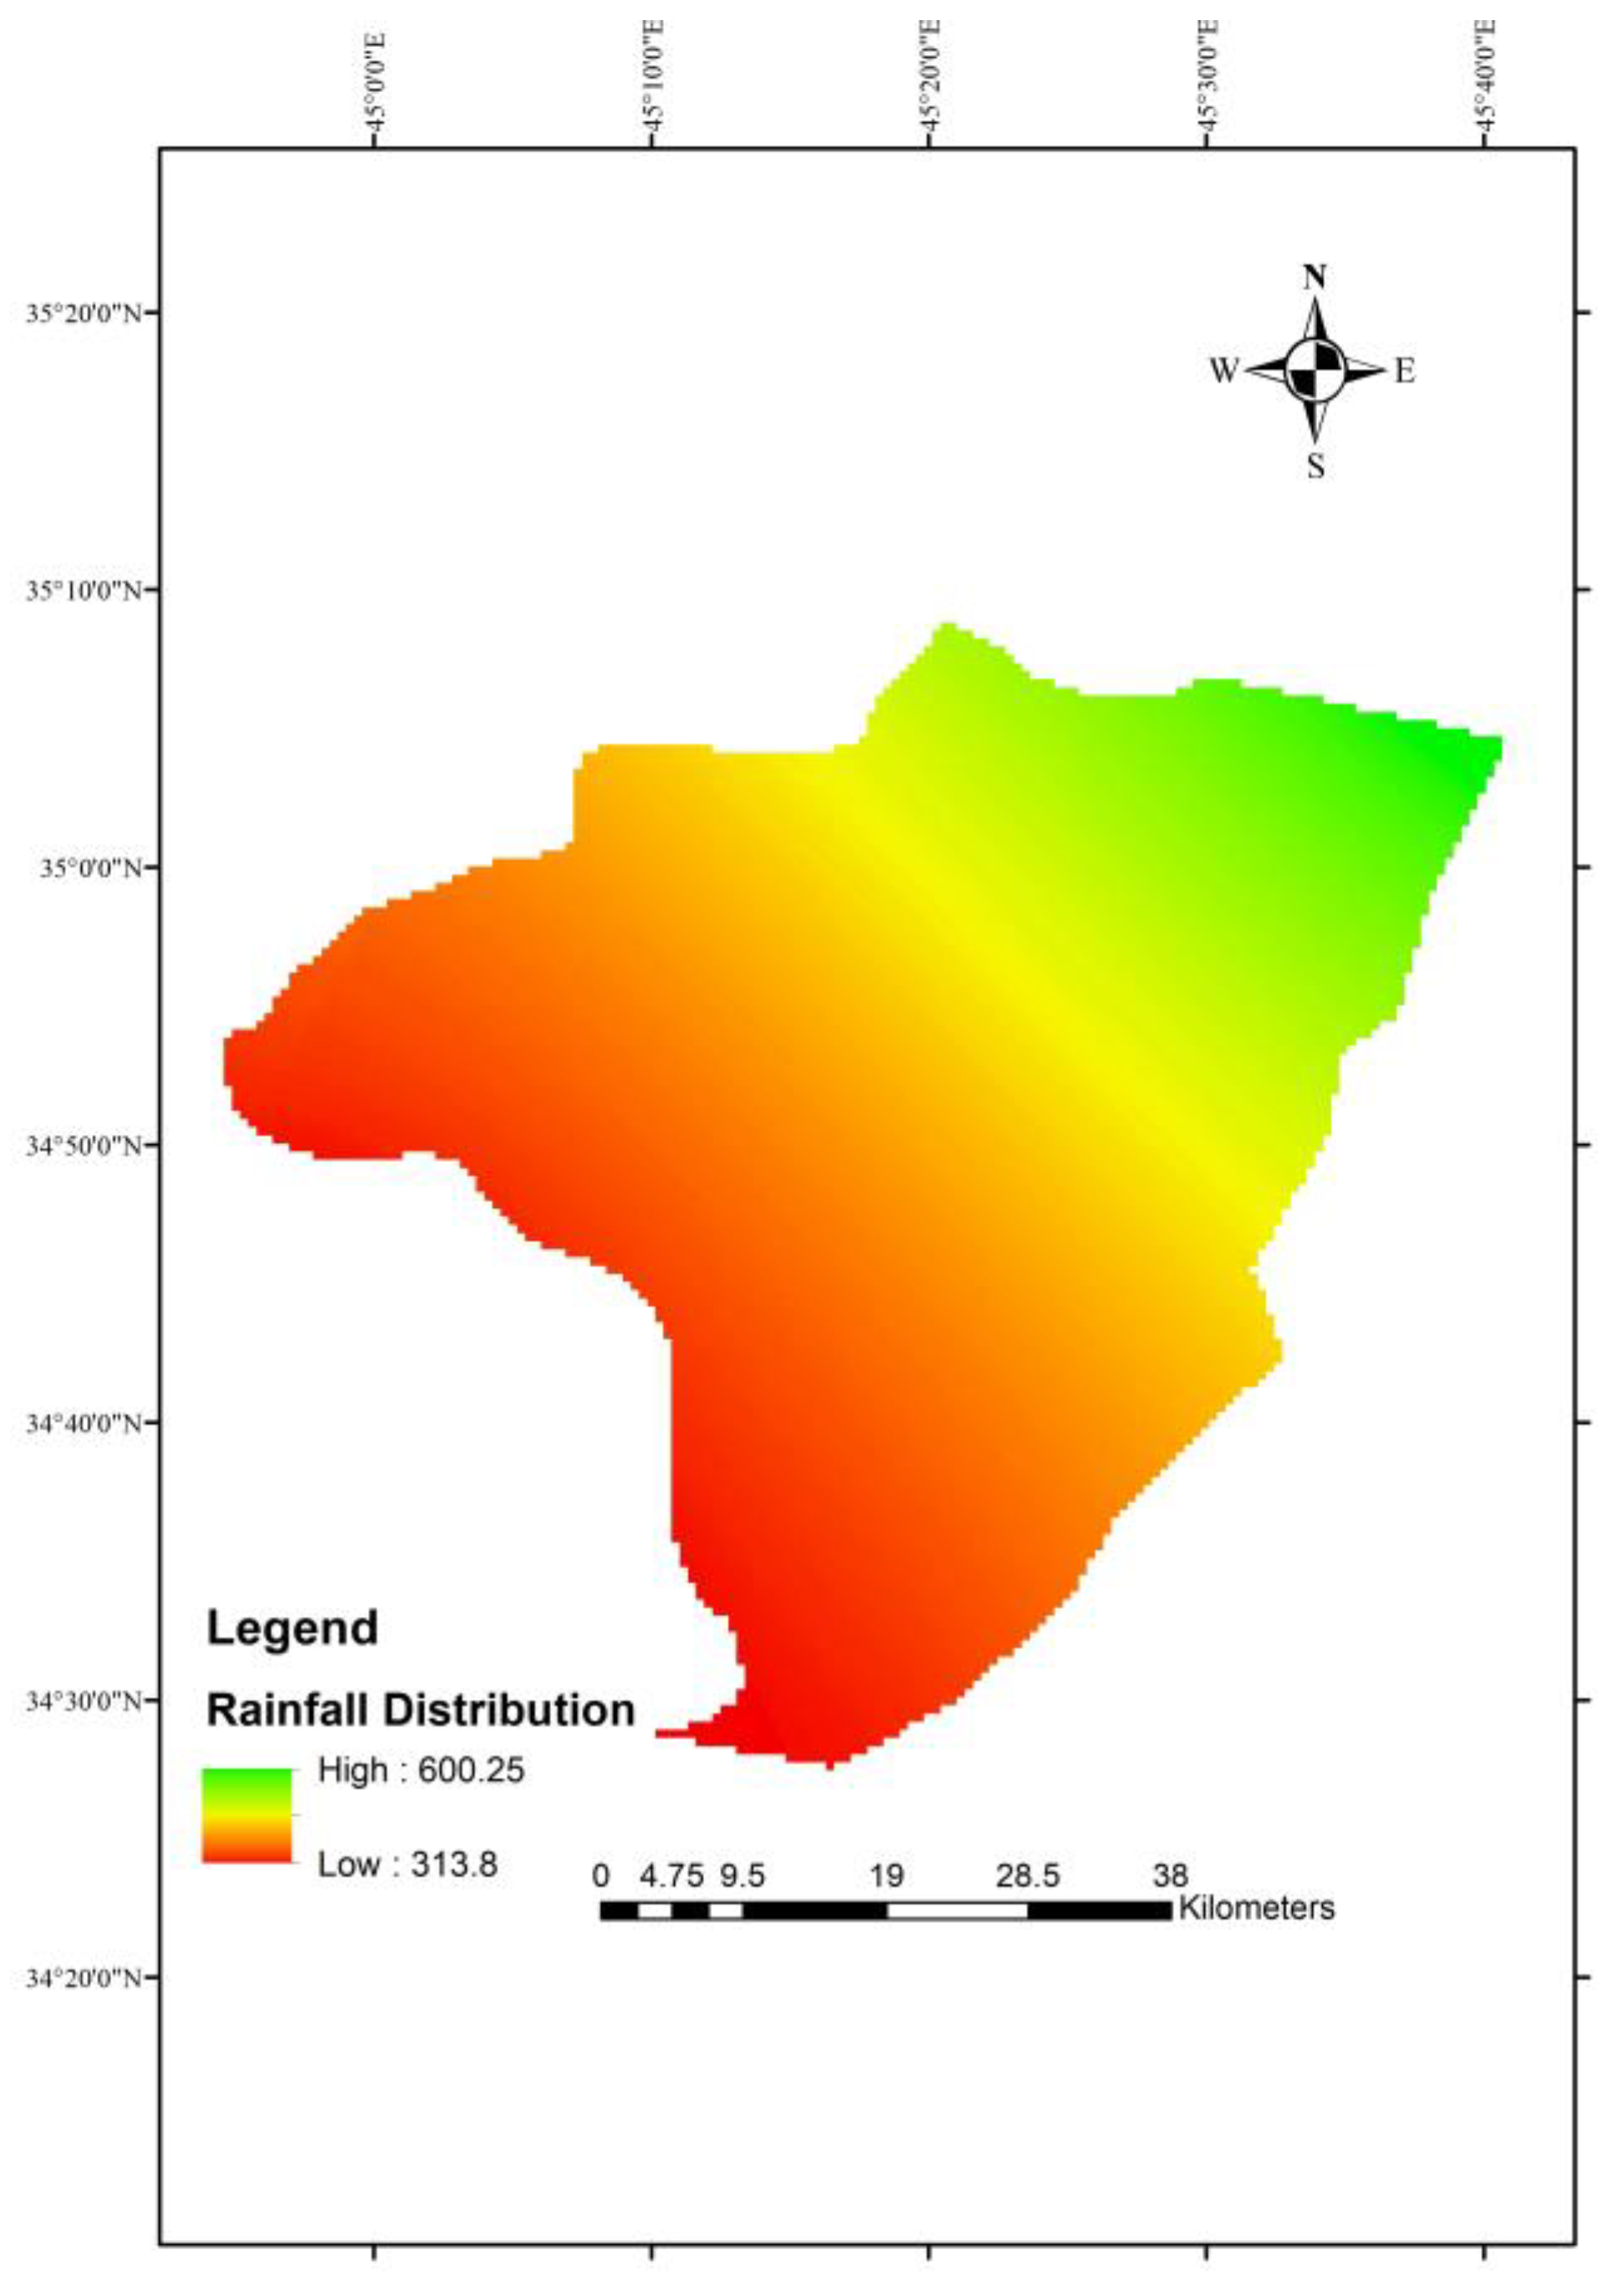
However, based on the authors’ experience with this area, such a result is unrealistic, as it indicated that most areas in the south and southwest of the Garmian Region are of low suitability. The rainfall criteria, which has a weight of about 40%, greatly affected the results. The lowest annual rainfall depth in the study area is 313.8 mm, and this value has been given grade 1 in the classification of the rainfall criteria as it is usually adopted in most of the literature.
The NPRC will be adopted to generate a new suitability map. The new classification for rainfall is illustrated in Table 12. The WLC and Fuzzy Gamma overlay is conducted to construct the new suitability map for RWH in the Garmian region, as presented in Figure 15 and Figure 16, respectively.
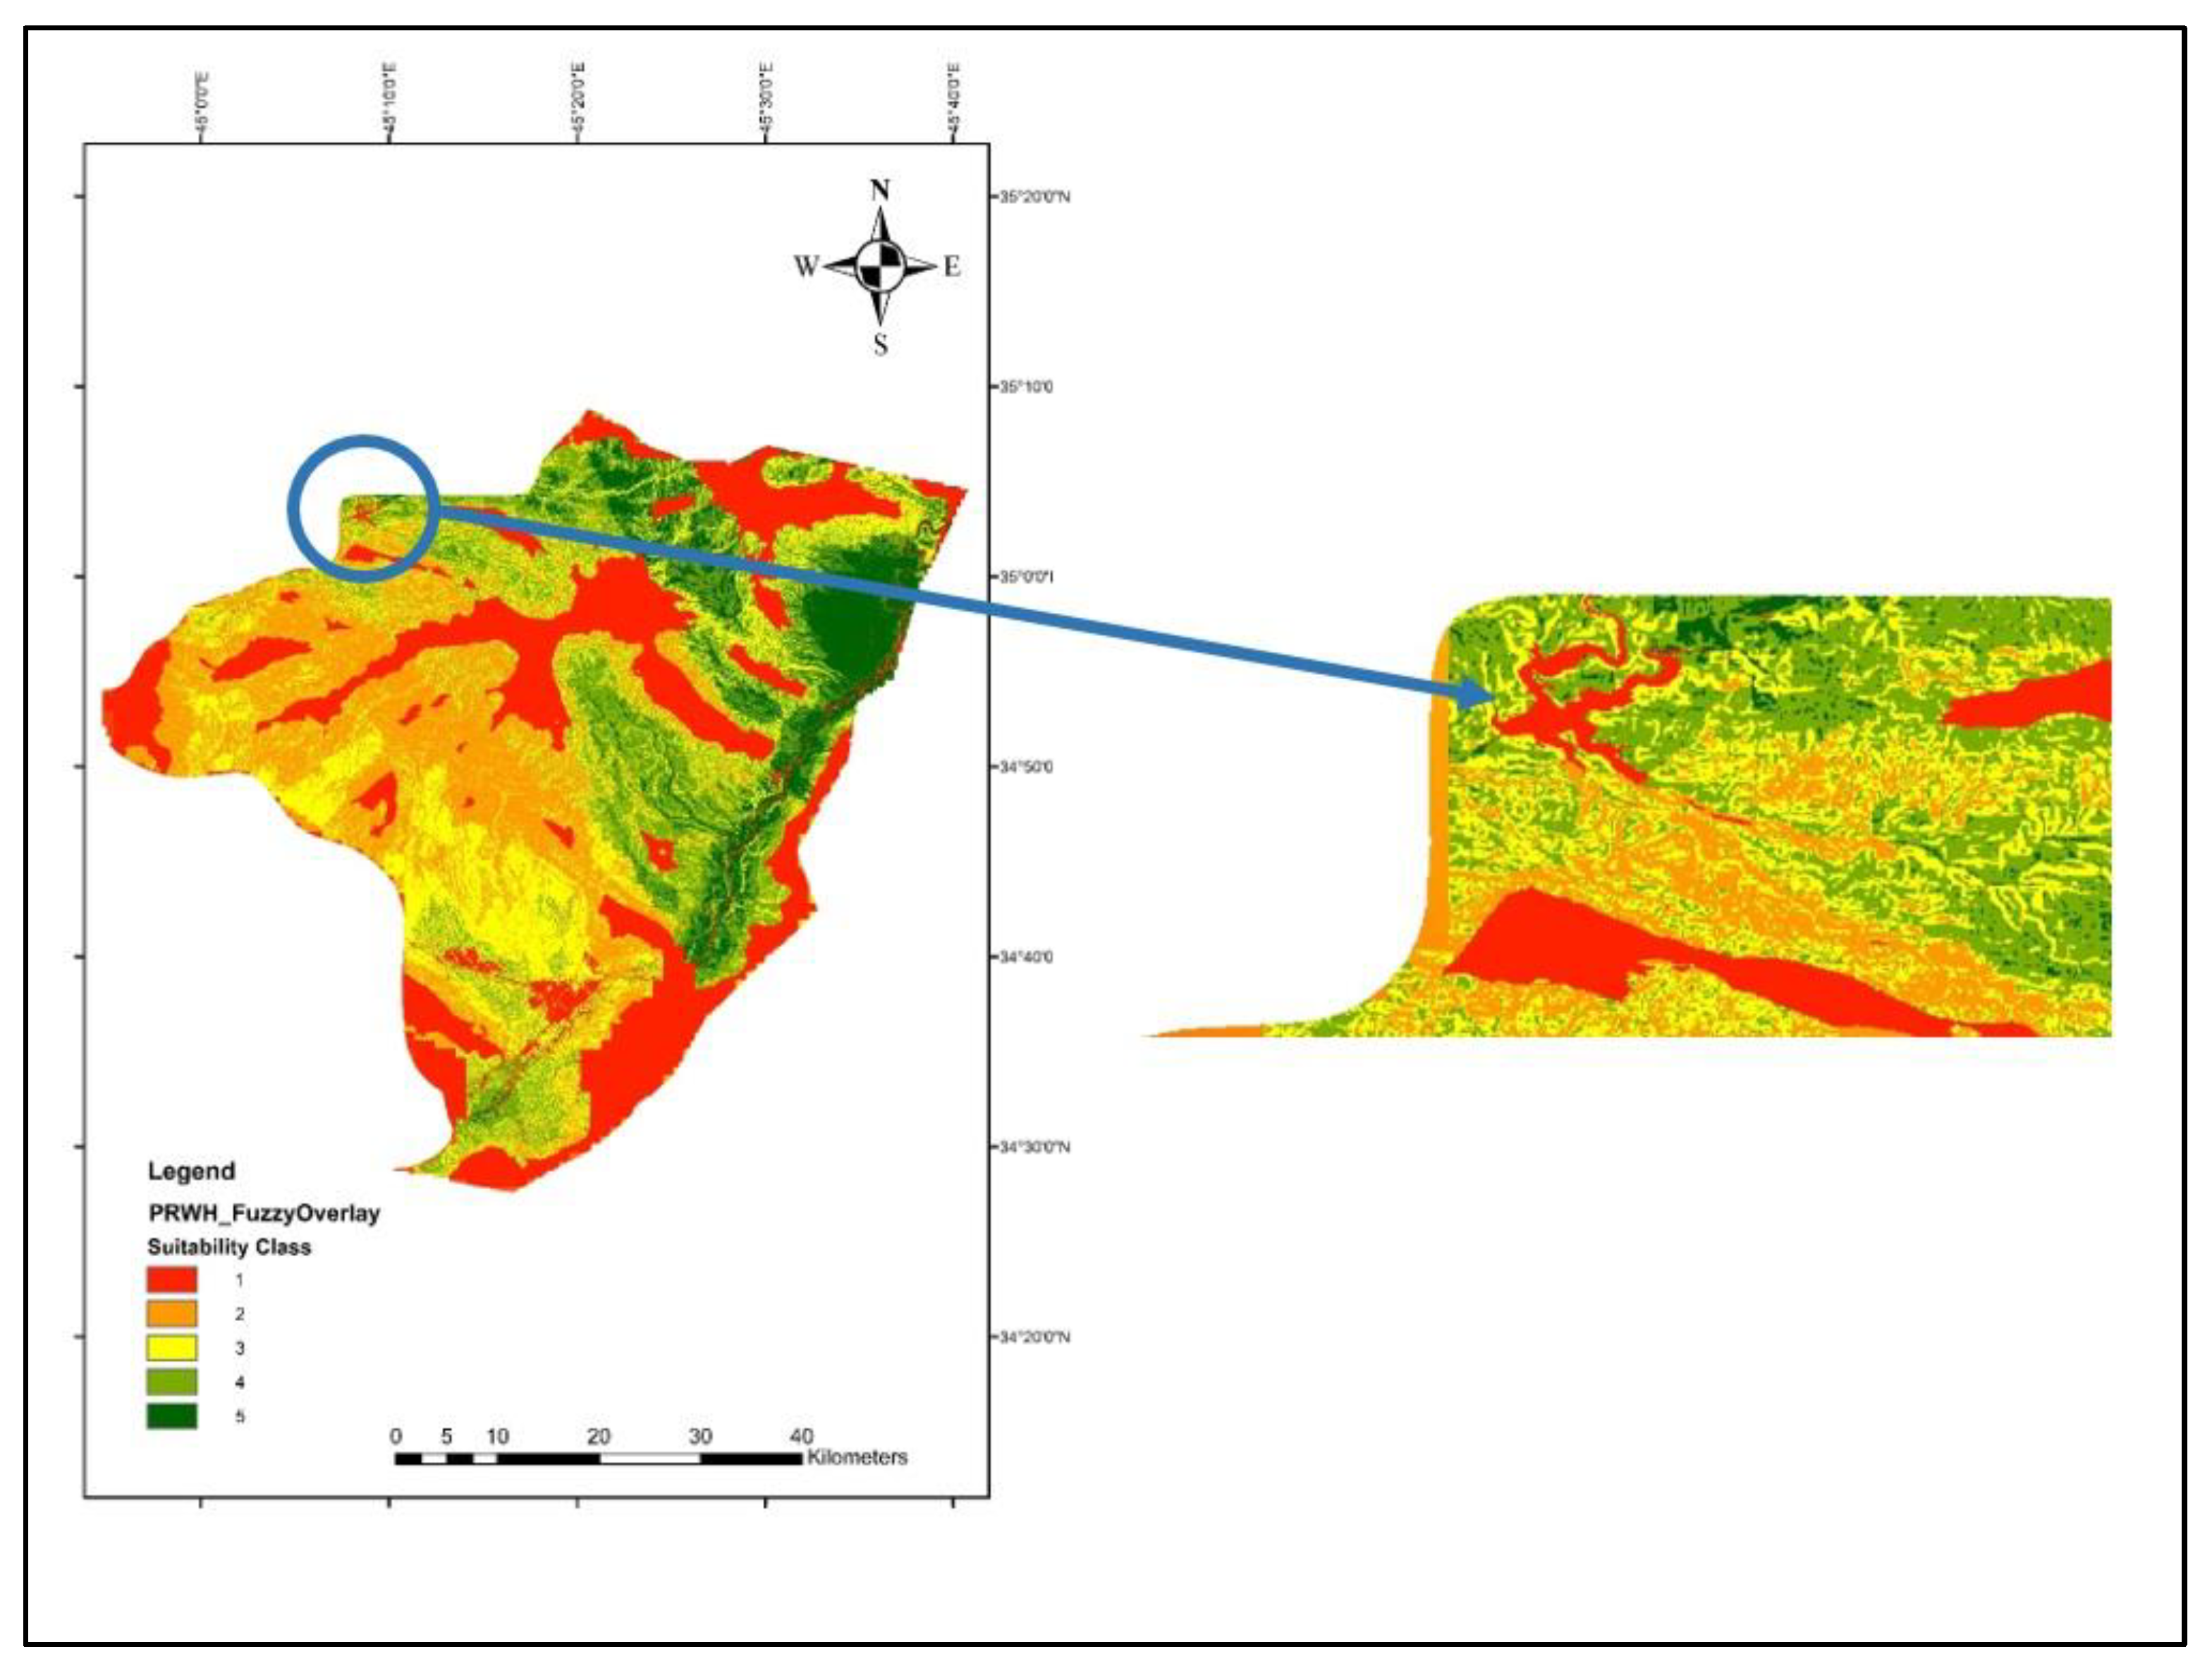
The suitability maps obtained using the new rainfall classification are significantly different and look more realistic. It is found that the classification of the criteria has a vital role in finding suitable sites for RWH. The criteria weights found by both AHP and FAHP are not much different. However, the resulting maps are very different, and the Fuzzy gamma overlay map is much more accurate than the WLC overlay. The accuracy of the two overlays may be assessed using the Awa Spi dam shown in Figure 17. Although the dam’s surrounding area has a suitability level of 4 to 5, the FAHP approach indicates the dam’s reservoir area has low suitability (water body). This result shows the superiority of the FAHP over the AHP approach.
Additionally, the FAHP-based classified locations are isolated and easily distinguishable in the suitability map. This advantage of the FAHP approach has been indicated in some literature [34,58,59].
The percentage of suitable area per class is presented in Table 13 for both MCA methods used in the study before and after changing the rainfall layer’s classification.

4. Conclusions

Recently, there have been several droughts in the Garmian region, which have affected the agriculture and wildlife industries. This study has identified potential RWH sites in the Garmian region using GIS and RS. Five factors were used: slope, rainfall, land use, land cover, soil texture, and drainage density. A suitability map of five comparable classes was created; the classes were very high, high, moderate, low, and very low. In this work, two MCA approaches were investigated for their potential to discover feasible RWH systems in the Garmian region. The following points could be drawn:
ArcGIS is a useful tool that can quickly and easily determine whether a large area is suitable for an RWH intervention.
The accuracy of the produced suitability map depends on the quality and precision of the data (i.e., the procedure adopted in the data collection, processing, and production, and the MCA approach used).
Rainfall depth and the land’s slope are crucial in finding suitable sites for RWH.
Comparing the results obtained from the AHP and the FAHP methods has shown that the FAHP method is more accurate and reasonable.
In contrast to most recent studies, which employed the minimum and maximum local values, a practical minimum rainfall depth should be used as a guide to classify rainfall.
The study area can be divided into five rainwater harvesting potential zones. When using the AHP and WLC method, 9.7%, 43.4%, 33.6%, and 13.3% of the sites have very high, high, moderate, and low appropriateness for rainwater collection, respectively. However, using FAHP and Fuzzy Gamma overlay indicates that 10.6%, 15.6%, 26.6%, 21.9%, and 25.3% of the sites have very high, high, moderate, low, and very low suitability, respectively.
The NPRC used in the study has a vital role in accurately determining the suitability percentage of the area.
The suitability map will be helpful to hydrologists, decision-makers, and planners to quickly determine areas for RWH structures. Despite the promising results, it is advised that additional work be done to improve the model and expand its utility by including other essential auxiliary variables, such as socioeconomic aspects, and integrate the model findings with field observations to precisely determine the location of the proposed structures.

Author Contributions

Conceptualization, K.Z.A. and S.F.A.; methodology, K.Z.A. and S.F.A. and S.S.A.; data curation, K.Z.A. and M.K.; writing—original draft preparation, K.Z.A., S.F.A., S.S.A. and M.K.; writing—review and editing, M.K. and K.Z.A.; supervision, M.K. and S.S.A. All authors have read and agreed to the published version of the manuscript.

Funding

This research received no external funding.

Institutional Review Board Statement

Not applicable.

Informed Consent Statement

Not applicable.

Data Availability Statement

All data supporting this study’s findings are available from the corresponding author upon reasonable request.

Acknowledgments

The authors are very grateful to Omed S. Q. Yousif for his help and support. Special thanks go to Sarkawt G. Salar for his help and encouragement.

Conflicts of Interest

The authors declare no conflict of interest.

References

  1. Jamali, I.A.; Olofsson, B.; Mörtberg, U. Locating suitable sites for the construction of subsurface dams using GIS. Environ. Earth Sci. 2013, 70, 2511–2525. [Google Scholar] [CrossRef]
  2. Wu, R.-S.; Molina, G.L.L.; Hussain, F. Optimal Sites Identification for Rainwater Harvesting in Northeastern Guatemala by Analytical Hierarchy Process. Water Resour. Manag. 2018, 32, 4139–4153. [Google Scholar] [CrossRef] [Green Version]
  3. UNDP, United Nations Development Programmer Iraq. Drought Impact Assessment, Recovery and Mitigation Framework and Regional Project Design in Kurdistan Region (KR); UNDP: Baghdad, Iraq, 2011. [Google Scholar]
  4. Hameed, H. Water Harvesting in Erbil Governorate, Kurdistan Region, Iraq: Detection of Suitable Sites Using Geographic Information System and Remote Sensing. Master’s Thesis, Lund University, Lund, Sweden, April 2013. [Google Scholar]
  5. Al-Ansari, N.A. Management of Water Resources in Iraq: Perspectives and Prognoses. Engineering 2013, 5, 667–684. [Google Scholar] [CrossRef] [Green Version]
  6. Zakaria, S.; Mustafa, Y.T.; Mohammed, D.A.; Ali, S.S.; Al-Ansari, N.; Knutsson, S. Estimation of annual harvested runoff at Sulaymaniyah Governorate, Kurdistan region of Iraq. J. Nat. Sci. 2013, 5, 1272–1283. [Google Scholar] [CrossRef] [Green Version]
  7. Hashim, H.Q.; Sayl, K.N. Detection of suitable sites for rainwater harvesting planning in an arid region using geographic information system. Appl. Geomat. 2021, 13, 235–248. [Google Scholar] [CrossRef]
  8. Aghaloo, K.; Chiu, Y.-R. Identifying Optimal Sites for a Rainwater-Harvesting Agricultural Scheme in Iran Using the Best-Worst Method and Fuzzy Logic in a GIS-Based Decision Support System. Water 2020, 12, 1913. [Google Scholar] [CrossRef]
  9. Oviedo-Ocaña, E.R.; Dominguez, I.; Ward, S.; Rivera-Sanchez, M.L.; Zaraza-Peña, J.M. Financial feasibility of end-user designed rainwater harvesting and greywater reuse systems for high water use households. Environ. Sci. Pollut. Res. 2018, 25, 19200–19216. [Google Scholar] [CrossRef] [Green Version]
  10. Musz-Pomorska, A.; Widomski, M.K.; Gołębiowska, J. Financial Sustainability of Selected Rain Water Harvesting Systems for Single-Family House under Conditions of Eastern Poland. Sustainability 2020, 12, 4853. [Google Scholar] [CrossRef]
  11. de Winnaar, G.; Jewitt, G.P.W.; Horan, M. A GIS-based approach for identifying potential runoff harvesting sites in the Thukela River basin, South Africa. Phys. Chem. Earth Parts A/B/C 2007, 32, 1058–1067. [Google Scholar] [CrossRef]
  12. Ibrahim, G.R.F.; Rasul, A.; Ali Hamid, A.; Ali, Z.F.; Dewana, A.A. Suitable Site Selection for Rainwater Harvesting and Storage Case Study Using Dohuk Governorate. Water 2019, 11, 864. [Google Scholar] [CrossRef] [Green Version]
  13. Mahmoud, S.H.; Alazba, A.A. The potential of in situ rainwater harvesting in arid regions: Developing a methodology to identify suitable areas using GIS-based decision support system. Arab. J. Geosci. 2015, 8, 5167–5179. [Google Scholar] [CrossRef]
  14. Hou, J.; Tian, J.; Xu, L.; Zhang, Z.; Chen, Z.; He, N. Selective harvesting at rational intervals promotes carbon sequestration in temperate coniferous and broad-leaved mixed forests in China. J. For. Res. 2021, 32, 1025–1033. [Google Scholar] [CrossRef]
  15. Ammar, A.; Riksen, M.; Ouessar, M.; Ritsema, C. Identification of suitable sites for rainwater harvesting structures in arid and semi-arid regions: A review. Int. Soil Water Conserv. Res. 2016, 4, 108–120. [Google Scholar] [CrossRef] [Green Version]
  16. Khudhair, M.A.; Sayl, K.N.; Darama, Y. Locating Site Selection for Rainwater Harvesting Structure using Remote Sensing and GIS. IOP Conf. Ser. Mater. Sci. Eng. 2020, 881, 012170. [Google Scholar] [CrossRef]
  17. Adham, A.; Sayl, K.N.; Abed, R.; Abdeladhim, M.A.; Wesseling, J.G.; Riksen, M.; Fleskens, L.; Karim, U.; Ritsema, C.J. A GIS-based approach for identifying potential sites for harvesting rainwater in the Western Desert of Iraq. Int. Soil Water Conserv. Res. 2018, 6, 297–304. [Google Scholar] [CrossRef]
  18. Huang, S.; Tang, L.; Hupy, J.P.; Wang, Y.; Shao, G. A commentary review on the use of normalized difference vegetation index (NDVI) in the era of popular remote sensing. J. For. Res. 2021, 32, 1–6. [Google Scholar] [CrossRef]
  19. Tiwari, K.; Goyal, R.; Sarkar, A. GIS-based Methodology for Identification of Suitable Locations for Rainwater Harvesting Structures. Water Resour. Manag. 2018, 32, 1811–1825. [Google Scholar] [CrossRef]
  20. Ghani, M.W.; Arshad, M.; Shabbir, A.; Mehmood, N.; Ahmad, I. Investigation of potential water harvesting sites at Potohar using modeling approach. Pak. J. Agric. Sci. 2013, 50, 723–729. [Google Scholar]
  21. Singh, J.P.; Singh, D.; Litoria, P.K. Selection of suitable sites for water harvesting structures in Soankhad watershed, Punjab using remote sensing and geographical information system (RS&GIS) approach—A case study. J. Indian Soc. Remote Sens. 2009, 37, 21–35. [Google Scholar] [CrossRef]
  22. Buraihi, F.H.; Mohamed Shariff, A.R. Selection of rainwater harvesting sites by using remote sensing and gis techniques: A case study of kirkuk, Iraq. J. Teknol. 2015, 76, 5955. [Google Scholar] [CrossRef] [Green Version]
  23. Al-Shamiri, A.; Ziadat, F.M. Soil-landscape modeling and land suitability evaluation: The case of rainwater harvesting in a dry rangeland environment. Int. J. Appl. Earth Obs. Geoinf. 2012, 18, 157–164. [Google Scholar] [CrossRef]
  24. Mbilinyi, B.P.; Tumbo, S.D.; Mahoo, H.F.; Mkiramwinyi, F.O. GIS-based decision support system for identifying potential sites for rainwater harvesting. Phys. Chem. Earth Parts A/B/C 2007, 32, 1074–1081. [Google Scholar] [CrossRef]
  25. Kahinda, J.M.; Lillie, E.S.B.; Taigbenu, A.E.; Taute, M.; Boroto, R.J. Developing suitability maps for rainwater harvesting in South Africa. Phys. Chem. Earth Parts A/B/C 2008, 33, 788–799. [Google Scholar] [CrossRef]
  26. Sayl, K.N.; Muhammad, N.S.; El-Shafie, A. Robust approach for optimal positioning and ranking potential rainwater harvesting structure (RWH): A case study of Iraq. Arab. J. Geosci. 2017, 10, 413. [Google Scholar] [CrossRef]
  27. Jothiprakash, V.; Sathe, M.V. Evaluation of Rainwater Harvesting Methods and Structures Using Analytical Hierarchy Process for a Large Scale Industrial Area. J. Water Resour. Protect. 2009, 1, 427–438. [Google Scholar] [CrossRef] [Green Version]
  28. Krois, J.; Schulte, A. GIS-based multi-criteria evaluation to identify potential sites for soil and water conservation techniques in the Ronquillo watershed, northern Peru. Appl. Geogr. 2014, 51, 131–142. [Google Scholar] [CrossRef]
  29. Prasad, H.C.; Bhalla, P.; Palria, S. Site Suitability Analysis of Water Harvesting Structures Using Remote Sensing and GIS—A Case Study of Pisangan Watershed, Ajmer District, Rajasthan. Int. Arch. Photogramm. Remote Sens. Spat. Inf. Sci. 2014, 8, 1471–1482. [Google Scholar] [CrossRef] [Green Version]
  30. Al-shabeeb, A.R. The Use of AHP within GIS in Selecting Potential Sites for Water Harvesting Sites in the Azraq Basin—Jordan. J. Geogr. Inform. Syst. 2016, 8, 73–88. [Google Scholar] [CrossRef] [Green Version]
  31. Sayl, K.N.; Mohammed, A.S.; Ahmed, A.D. GIS-based approach for rainwater harvesting site selection. IOP Conf. Ser. Mater. Sci. Eng. 2020, 737, 012246. [Google Scholar] [CrossRef]
  32. Al-Adamat, R.; Diabat, A.; Shatnawi, G. Combining GIS with multicriteria decision making for siting water harvesting ponds in Northern Jordan. J. Arid Environ. 2010, 74, 1471–1477. [Google Scholar] [CrossRef]
  33. Al-Adamat, R.; AlAyyash, S.; Al-Amoush, H.; Al-Meshan, O.; Rawajfih, Z.; Shdeifat, A.; Al-Harahsheh, A.; Al-Farajat, M. The Combination of Indigenous Knowledge and Geo-Informatics for Water Harvesting Siting in the Jordanian Badia. JGIS 2012, 04, 366–376. [Google Scholar] [CrossRef] [Green Version]
  34. Khashei-Siuki, A.; Keshavarz, A.; Sharifan, H. Comparison of AHP and FAHP methods in determining suitable areas for drinking water harvesting in Birjand aquifer. Iran. Groundw. Sustain. Dev. 2020, 10, 100328. [Google Scholar] [CrossRef]
  35. Aghad, M.; Manaouch, M.; Sadiki, M.; Batchi, M.; Al Karkouri, J. Identifying suitable sites for rainwater harvesting using runoff model (scs-cn), remote sensing and gis based fuzzy analytical hierarchy process (fahp) in kenitra province, New Morocco. Geogr. Techn. 2021, 16, 111–127. [Google Scholar] [CrossRef]
  36. Shadmehri Toosi, A.; Ghasemi Tousi, E.; Ghassemi, S.A.; Cheshomi, A.; Alaghmand, S. A multi-criteria decision analysis approach towards efficient rainwater harvesting. J. Hydrol. 2020, 582, 124501. [Google Scholar] [CrossRef]
  37. Haile Wondimu, G.; Shiferaw Jote, D. Selection of Rainwater Harvesting Sites by Using Remote Sensing and GIS Techniques: A Case Study of Dawa Sub Basin Southern Ethiopia. Am. J. Modern Energy 2020, 6, 84. [Google Scholar] [CrossRef]
  38. Ali, S.S.; Al-Umary, F.A.; Salar, S.G.; Al-Ansari, N.; Knutsson, S. Evaluation of Selected Site Location for Subsurface Dam Construction within Isayi Watershed Using GIS and RS Garmiyan Area, Kurdistan Region. J. Water Resour. Protect. 2014, 6, 972–987. [Google Scholar] [CrossRef] [Green Version]
  39. Guiu, R. Displaciment as Challenge and Opportunity; UK Department For International Development (DFID): London, UK, 2016. [Google Scholar]
  40. Ali, H.Z.; Al-qaraawi, S.M.; Arab, G.E. Spatial Interpolation of Rainfall in Iraq. Iraqi J. Sci. Technol. 2015, 6, 13. [Google Scholar]
  41. Hasan, H.; Thair Khayyun, M. Modelling of Groundwater Flow for the Iraqi Aquifers. Ph.D. Thesis, University of Technology, Baghdad, Iraq, 2019. [Google Scholar] [CrossRef]
  42. Mair, A.; Fares, A. Comparison of Rainfall Interpolation Methods in a Mountainous Region of a Tropical Island. J. Hydrol. Eng. 2011, 16, 371–383. [Google Scholar] [CrossRef]
  43. Shi, Y.; Li, L.; Zhang, L. Application and comparing of IDW and Kriging interpolation in spatial rainfall information. In Geoinformatics 2007: Geospatial Information Science; Chen, J., Pu, Y., Eds.; SPIE: Nanjing, China, 2007; Volume 6753, p. 67531I. [Google Scholar]
  44. Yang, R.; Xing, B. A Comparison of the Performance of Different Interpolation Methods in Replicating Rainfall Magnitudes under Different Climatic Conditions in Chongqing Province (China). Atmosphere 2021, 12, 1318. [Google Scholar] [CrossRef]
  45. Fagbohun, B.J. Integrating GIS and multi-influencing factor technique for delineation of potential groundwater recharge zones in parts of Ilesha schist belt, southwestern Nigeria. Environ. Earth Sci 2018, 77, 69. [Google Scholar] [CrossRef]
  46. Prinz, D.; Singh, A. Technological Potential for Improvements of Water Harvesting; Gutachten für die World Commission on Dams, Technical papers; Citeseer: Princeton, NJ, USA, 2020. [Google Scholar]
  47. Jha, M.K.; Chowdary, V.M.; Kulkarni, Y.; Mal, B.C. Rainwater harvesting planning using geospatial techniques and multicriteria decision analysis. Resour. Conserv. Recycl. 2014, 83, 96–111. [Google Scholar] [CrossRef]
  48. Saaty, T.L. How to make a decision: The analytic hierarchy process. Eur. J. Oper. Res. 1990, 48, 9–26. [Google Scholar] [CrossRef]
  49. Wedley, W.C. Consistency prediction for incomplete AHP matrices. Math. Comput. Model. 1993, 17, 151–161. [Google Scholar] [CrossRef]
  50. Buckley, J.J. Fuzzy hierarchical analysis. Fuzzy Sets Syst. 1985, 17, 233–247. [Google Scholar] [CrossRef]
  51. Şener, E.; Şener, Ş.; Davraz, A. Groundwater potential mapping by combining fuzzy-analytic hierarchy process and GIS in Beyşehir Lake Basin, Turkey. Arab. J. Geosci. 2018, 11, 187. [Google Scholar] [CrossRef]
  52. Alwan, I.A.; Aziz, N.A.; Hamoodi, M.N. Potential Water Harvesting Sites Identification Using Spatial Multi-Criteria Evaluation in Maysan Province, Iraq. ISPRS Int. J. Geo-Inf. 2020, 9, 235. [Google Scholar] [CrossRef] [Green Version]
  53. Chowdhury, M.; Paul, P.K. Identification of suitable sites for rainwater harvesting using fuzzy AHP and fuzzy gamma operator: A case study. Arab. J. Geosci. 2021, 14, 585. [Google Scholar] [CrossRef]
  54. Prinz, D. Water Harvesting—Past and Future. In Sustainability of Irrigated Agriculture; Pereira, L.S., Feddes, R.A., Gilley, J.R., Lesaffre, B., Eds.; Springer: Dordrecht, The Netherlands, 1996; pp. 137–168. ISBN 978-90-481-4675-8. [Google Scholar]
  55. Melville-Shreeve, P.; Ward, S.; Butler, D. Rainwater Harvesting Typologies for UK Houses: A Multi Criteria Analysis of System Configurations. Water 2016, 8, 129. [Google Scholar] [CrossRef] [Green Version]
  56. Al-Abadi, A.M.; Shahid, S.; Ghalib, H.B.; Handhal, A.M. A GIS-Based Integrated Fuzzy Logic and Analytic Hierarchy Process Model for Assessing Water-Harvesting Zones in Northeastern Maysan Governorate, Iraq. Arab. J. Sci. Eng. 2017, 42, 2487–2499. [Google Scholar] [CrossRef]
  57. Liu, Y.; Eckert, C.M.; Earl, C. A review of fuzzy AHP methods for decision-making with subjective judgements. Expert Syst. Appl. 2020, 161, 113738. [Google Scholar] [CrossRef]
  58. Mosadeghi, R.; Warnken, J.; Tomlinson, R.; Mirfenderesk, H. Comparison of Fuzzy-AHP and AHP in a spatial multi-criteria decision making model for urban land-use planning. Comput. Environ. Urban Syst. 2015, 49, 54–65. [Google Scholar] [CrossRef] [Green Version]
  59. Rajasekhar, M.; Sudarsana Raju, G.; Sreenivasulu, Y.; Siddi Raju, R. Delineation of groundwater potential zones in semi-arid region of Jilledubanderu river basin, Anantapur District, Andhra Pradesh, India using fuzzy logic, AHP and integrated fuzzy-AHP approaches. HydroResearch 2019, 2, 97–108. [Google Scholar] [CrossRef]
Figure 1. Study area.
Water 15 00507 g001
Figure 2. Average temperature historical map of Iraq (USGS).
Water 15 00507 g002
Figure 3. Rainfall amount (mm) at Kalar, Kifre, and Darbandikhan Stations (Directorate of Meteorology and Seismology of Sulaymaniyah).
Water 15 00507 g003
Figure 4. Annual rainfall map of Iraq [41].
Water 15 00507 g004
Figure 5. Rainfall map of the study area.
Water 15 00507 g005
Figure 6. Slope map of the study area.
Water 15 00507 g006
Figure 7. LULC map of the study area.
Water 15 00507 g007
Figure 8. Soil map of the study area.
Water 15 00507 g008
Figure 9. Drainage density map of study area.
Water 15 00507 g009
Figure 10. (a) Rainfall Classification. (b) Slope Classification. (c) Soil texture classification. (d) LULC Classification. (e) Drainage density classification.
Water 15 00507 g010
Figure 11. Percentage of the area with different rainwater harvesting suitability.
Water 15 00507 g011
Figure 12. Potential RWH map.
Water 15 00507 g012
Figure 13. (a) Rainfall map standardization, (b) Slope map standardization, (c) Soil texture standardization, (d) Drainage density map standardization, (e) LULC map standardization.
Water 15 00507 g013
Figure 14. Potential RWH map by FAHP and Fuzzy Gamma overlay.
Water 15 00507 g014
Figure 15. The potential RWH by AHP and WLC using the NPRC.
Water 15 00507 g015
Figure 16. The potential RWH by FAHP and Fuzzy Gamma using the NPRC.
Water 15 00507 g016
Figure 17. Awa Spi dam reservoir.
Water 15 00507 g017
Table 1. The scales of pairwise comparison [44].
Intensity of ImportanceDefinition
1Fair
3Moderate
5Strong
7Very strong
9Extreme
2, 4, 6, 8Intermediate values
Table 2. Terms used in linguistics and their related triangular fuzzy scale.
Saaty ScaleLinguistic Terms Fuzzy Triangular Number
1Equal importance(1,1,1)
3Weak importance(2,3,4)
5Fair importance(4,5,6)
7Strong importance(6,7,8)
9Absolute importance(9,9,9)
2The intermittent value (1,2,3)
4The intermittent value (3,4,5)
6The intermittent value (5,6,7)
8The intermittent value (7,8,9)
Table 3. Classification of the layers according to their degree of suitability.
Thematic Layers Class of Suitability
12345
Rainfall326.1–377.7377.7–432.2432.2–493.7493.7–558.6558.6–622.3
Slope30–62.910–305–102–50–2
Soil Texture LoamSilty ClayClay
LULCUrban/WaterForestAgricultureStreamBare Land
Drainage Density0–0.540.54–1.091.09–1.6351.635–2.182.18–2.72
Table 4. The pairwise comparison matrix.
CriteriaRainfallSlopeSoil TextureDrainage DensityLULC
Rainfall12345
Slope 0.51234
Soil Texture0.330.5123
Drainage Density0.250.330.512
LULC0.20.250.330.51
Summation2.284.086.8310.515
Table 5. Pairwise comparison matrix.
CriteriaRainfallSlopeSoil TextureDrainage DensityLULCWeight
Rainfall0.4390.490.4390.3810.3330.42
Slope 0.2190.2450.2930.2860.2670.26
Soil Texture0.1450.1230.1460.1900.2000.16
Drainage Density0.100.0810.730.0950.1330.10
LULC0.0880.0610.0480.0480.0670.06
Table 6. Average random consistency indices for different numbers of criteria [4].
Criteria Number (N)12345678
Random Consistency Index (RI)000.580.91.121.241.321.41
Table 7. Computed weights of criteria using the AHP method.
Criteria Weights
Rainfall0.42
Slope0.26
Soil Texture0.16
Drainage Density0.1
LULC0.06
Table 8. Fuzzy AHP comparison matrix.
CriteriaRainfallSlopeSoil TextureDrainage DensityLULC
Rainfall(1,1,1)(1,2,3)(2,3,4)(3,4,5)(4,5,6)
Slope (1/3,1/2,1/1)(1,1,1)(1,2,3)(2,3,4)(3,4,5)
Soil Texture(1/4,1/3,1/2)(1/3,1/2,1/1)(1,1,1)(1,2,3)(2,3,4)
Drainage Density(1/5,1/4,1/3)(1/4,1/3,1/2)(1/3,1/2,1/1)(1,1,1)(1,2,3)
LULC(1/6,1/5,1/4)(1/5,1/4,1/3)(1/4,1/3,1/2)(1/3,1/2,1/1)(1,1,1)
Table 9. The geometric mean of each criterion.
Criteria r i
Rainfall1.8882.6053.245
Slope 1.1481.6432.267
Soil Texture0.69811.431
Drainage Density0.4410.6080.870
LULC0.3080.3840.529
Summation4.4846.2418.344
Inverse 1/4.4841/6.2411/8.344
Increasing1/8.3441/6.2411/4.484
Table 10. Final weight of criteria by FAHP.
CriteriaWeight
Rainfall0.40
Slope 0.27
Soil Texture0.17
Drainage Density0.10
LULC0.06
Summation1
Table 11. Percentage of suitability class.
Suitability ClassAHP, WLC
Area %
FAHP, FGamma
Area %
16.433.7
23017
335.620.1
42021.9
587.3
Table 12. The new classification of rainfall depth.
Suitability ClassRainfall (mm)
1125–225
2226–325
3326–425
4426–525
5526–600
Table 13. Percentage of suitable areas for RWH.
Suitability ClassAHP, WLC
Using the Traditional Classification
AHP, WLC
Using the NPRC
FAHP, FGamma
Using the Traditional Classification
FAHP, FGamma
Using the NPRC
16.4---33.725.3
23013.31721.9
335.633.620.126.6
42043.421.915.6
589.77.310.6
Disclaimer/Publisher’s Note: The statements, opinions and data contained in all publications are solely those of the individual author(s) and contributor(s) and not of MDPI and/or the editor(s). MDPI and/or the editor(s) disclaim responsibility for any injury to people or property resulting from any ideas, methods, instructions or products referred to in the content.

