
Mapping Potential Water Resource Areas Using GIS-Based Frequency Ratio and Evidential Belief Function

Abstract
:1. Introduction
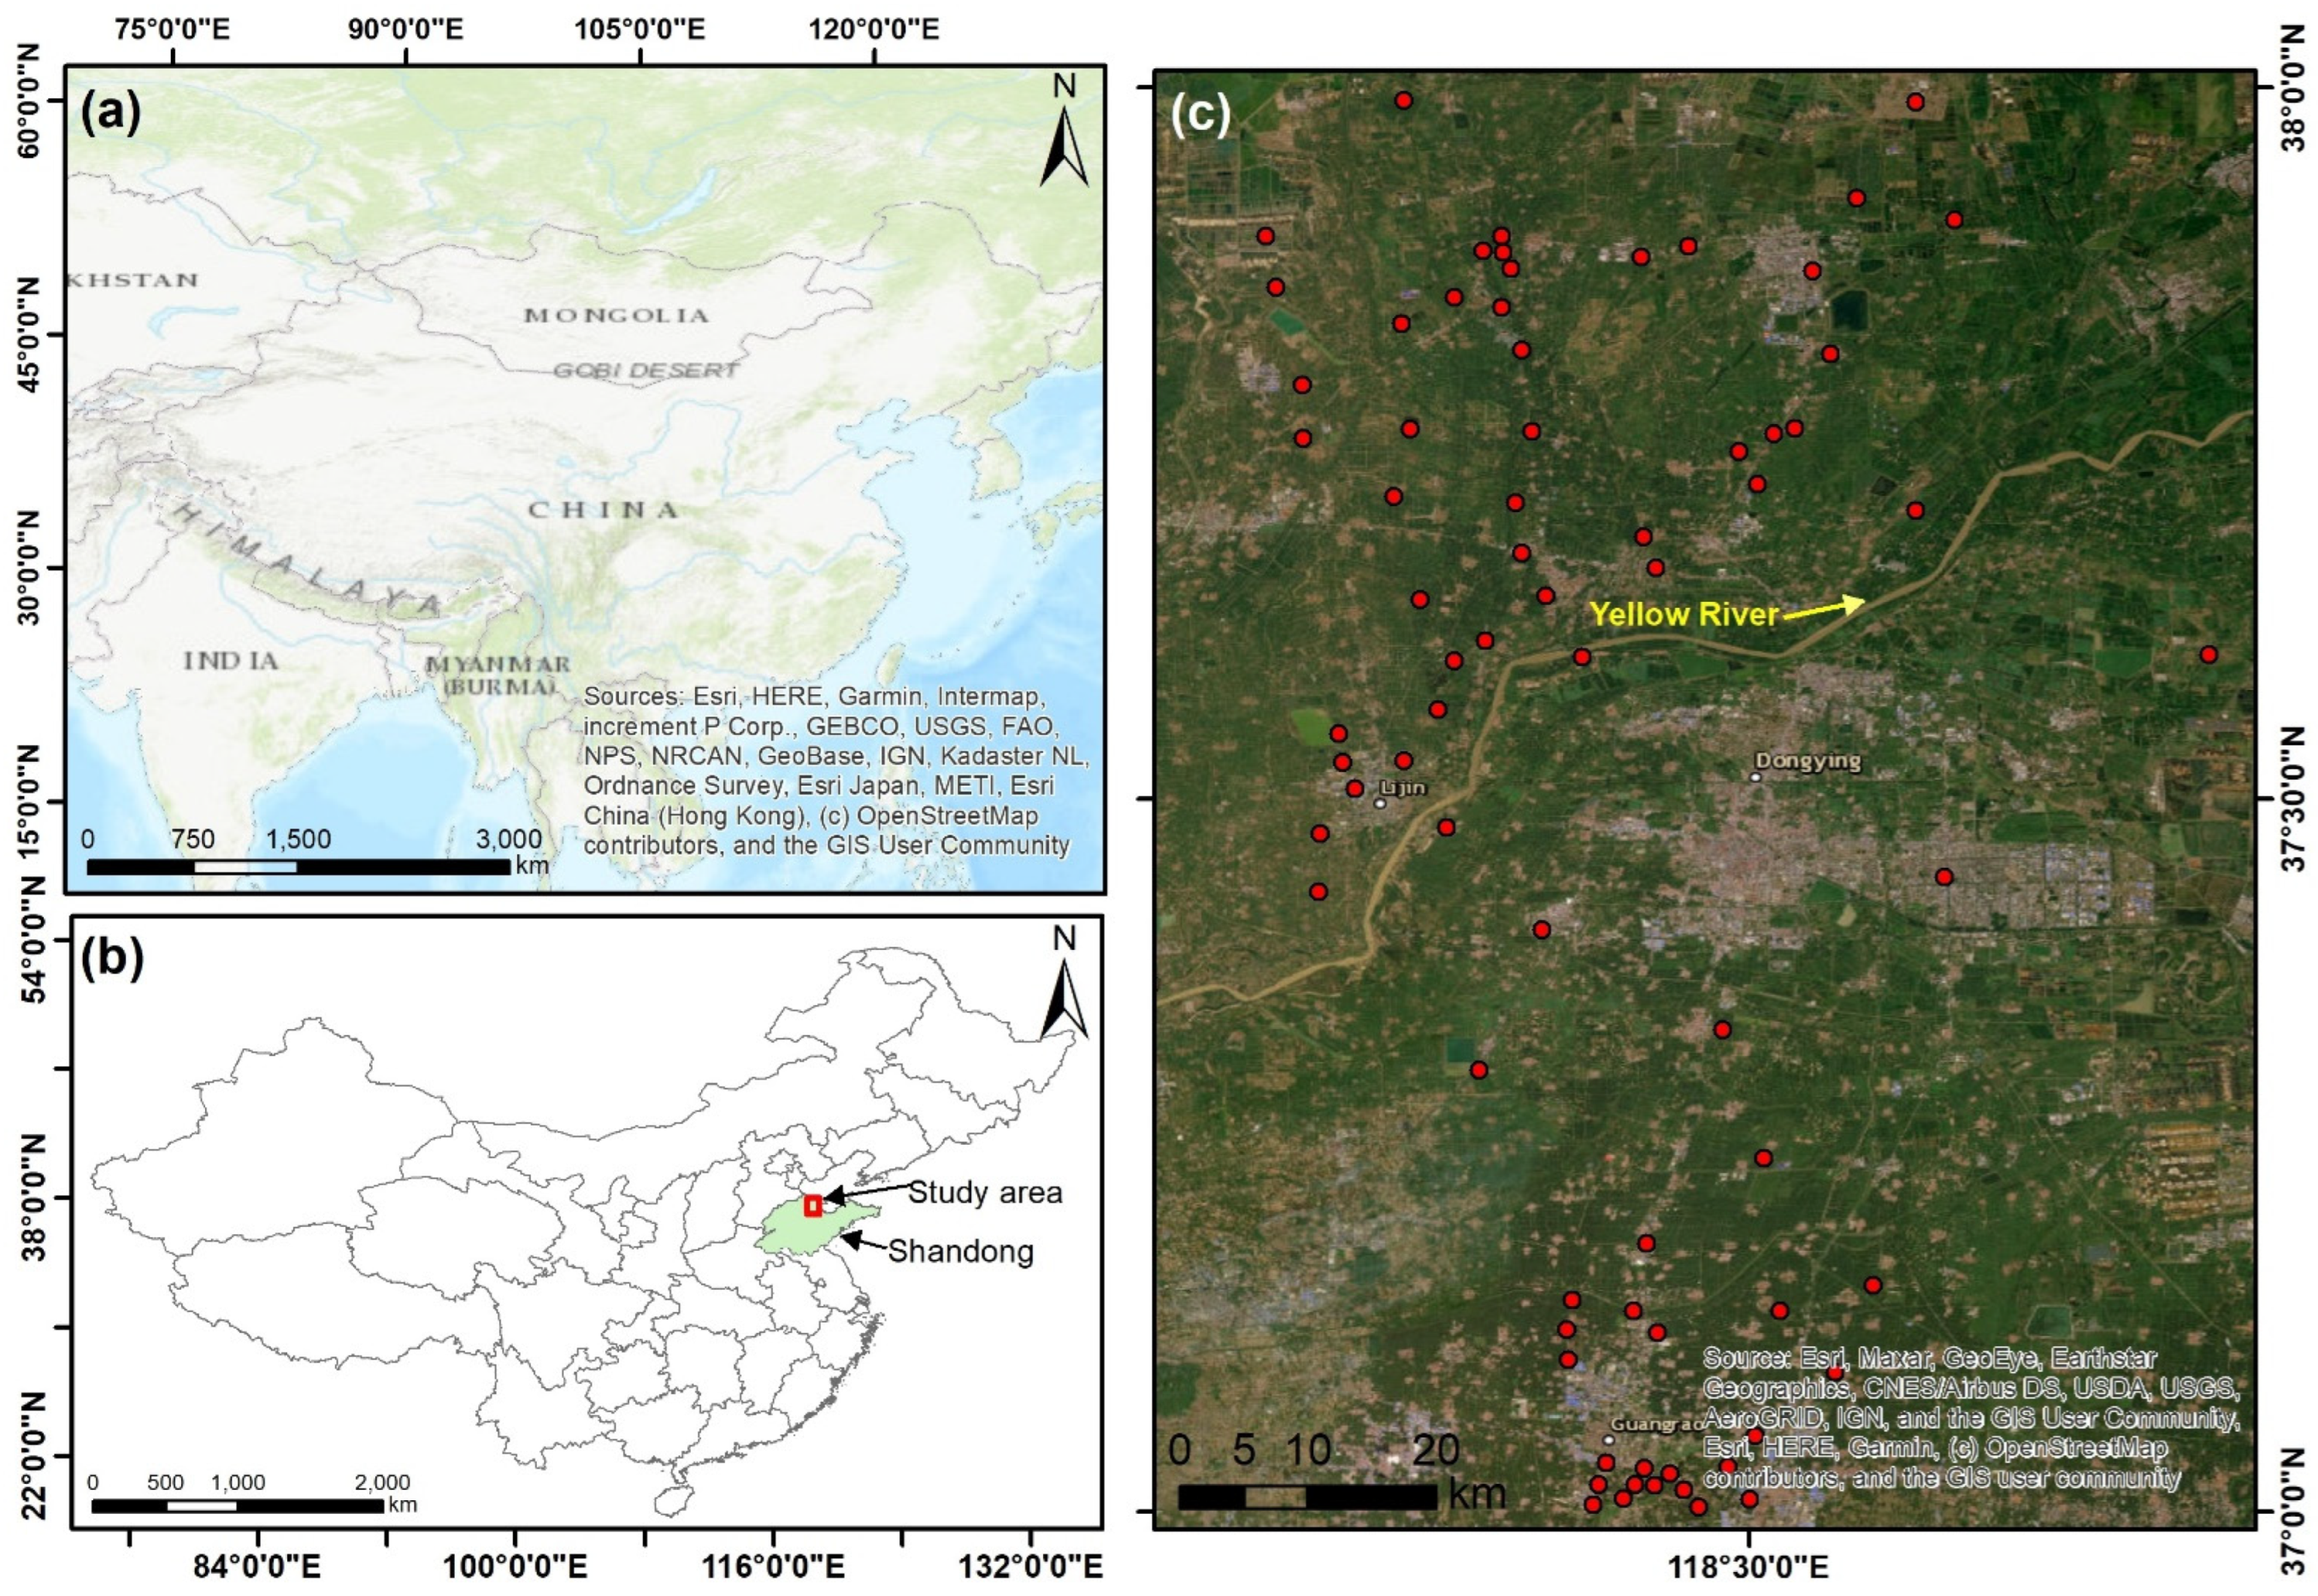
2. Study Area
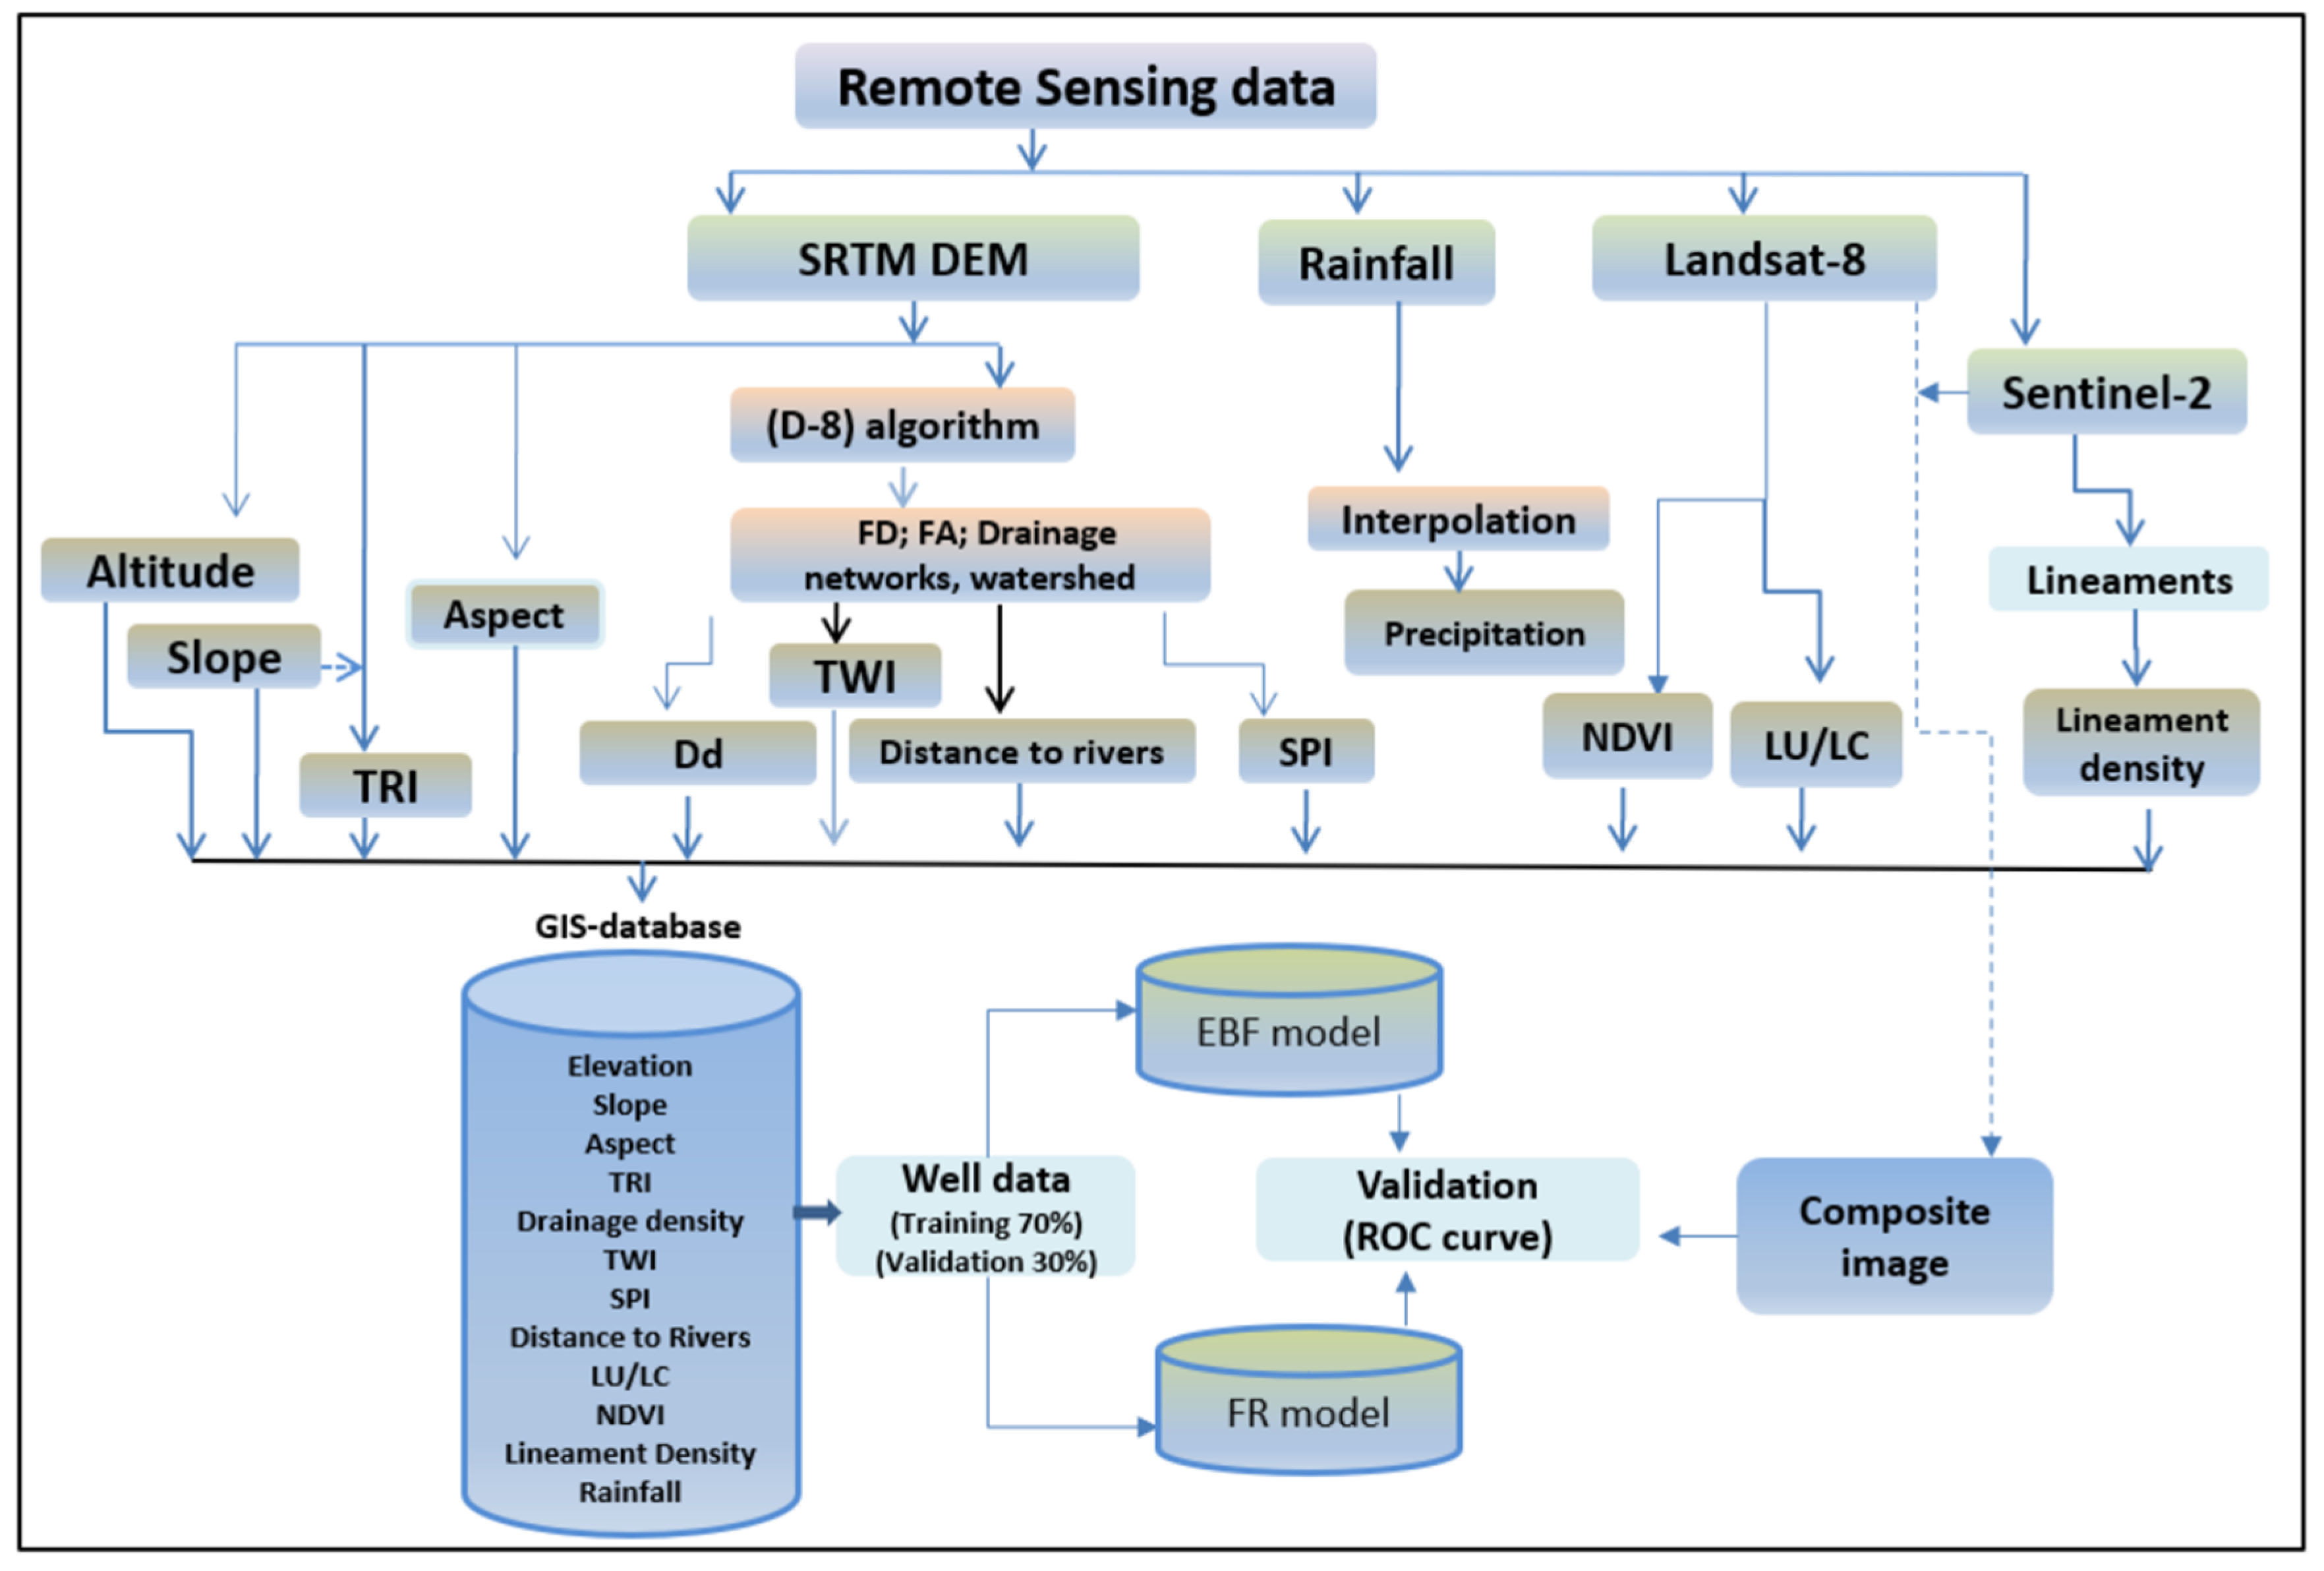
3. Data Used and Methods
4. Results
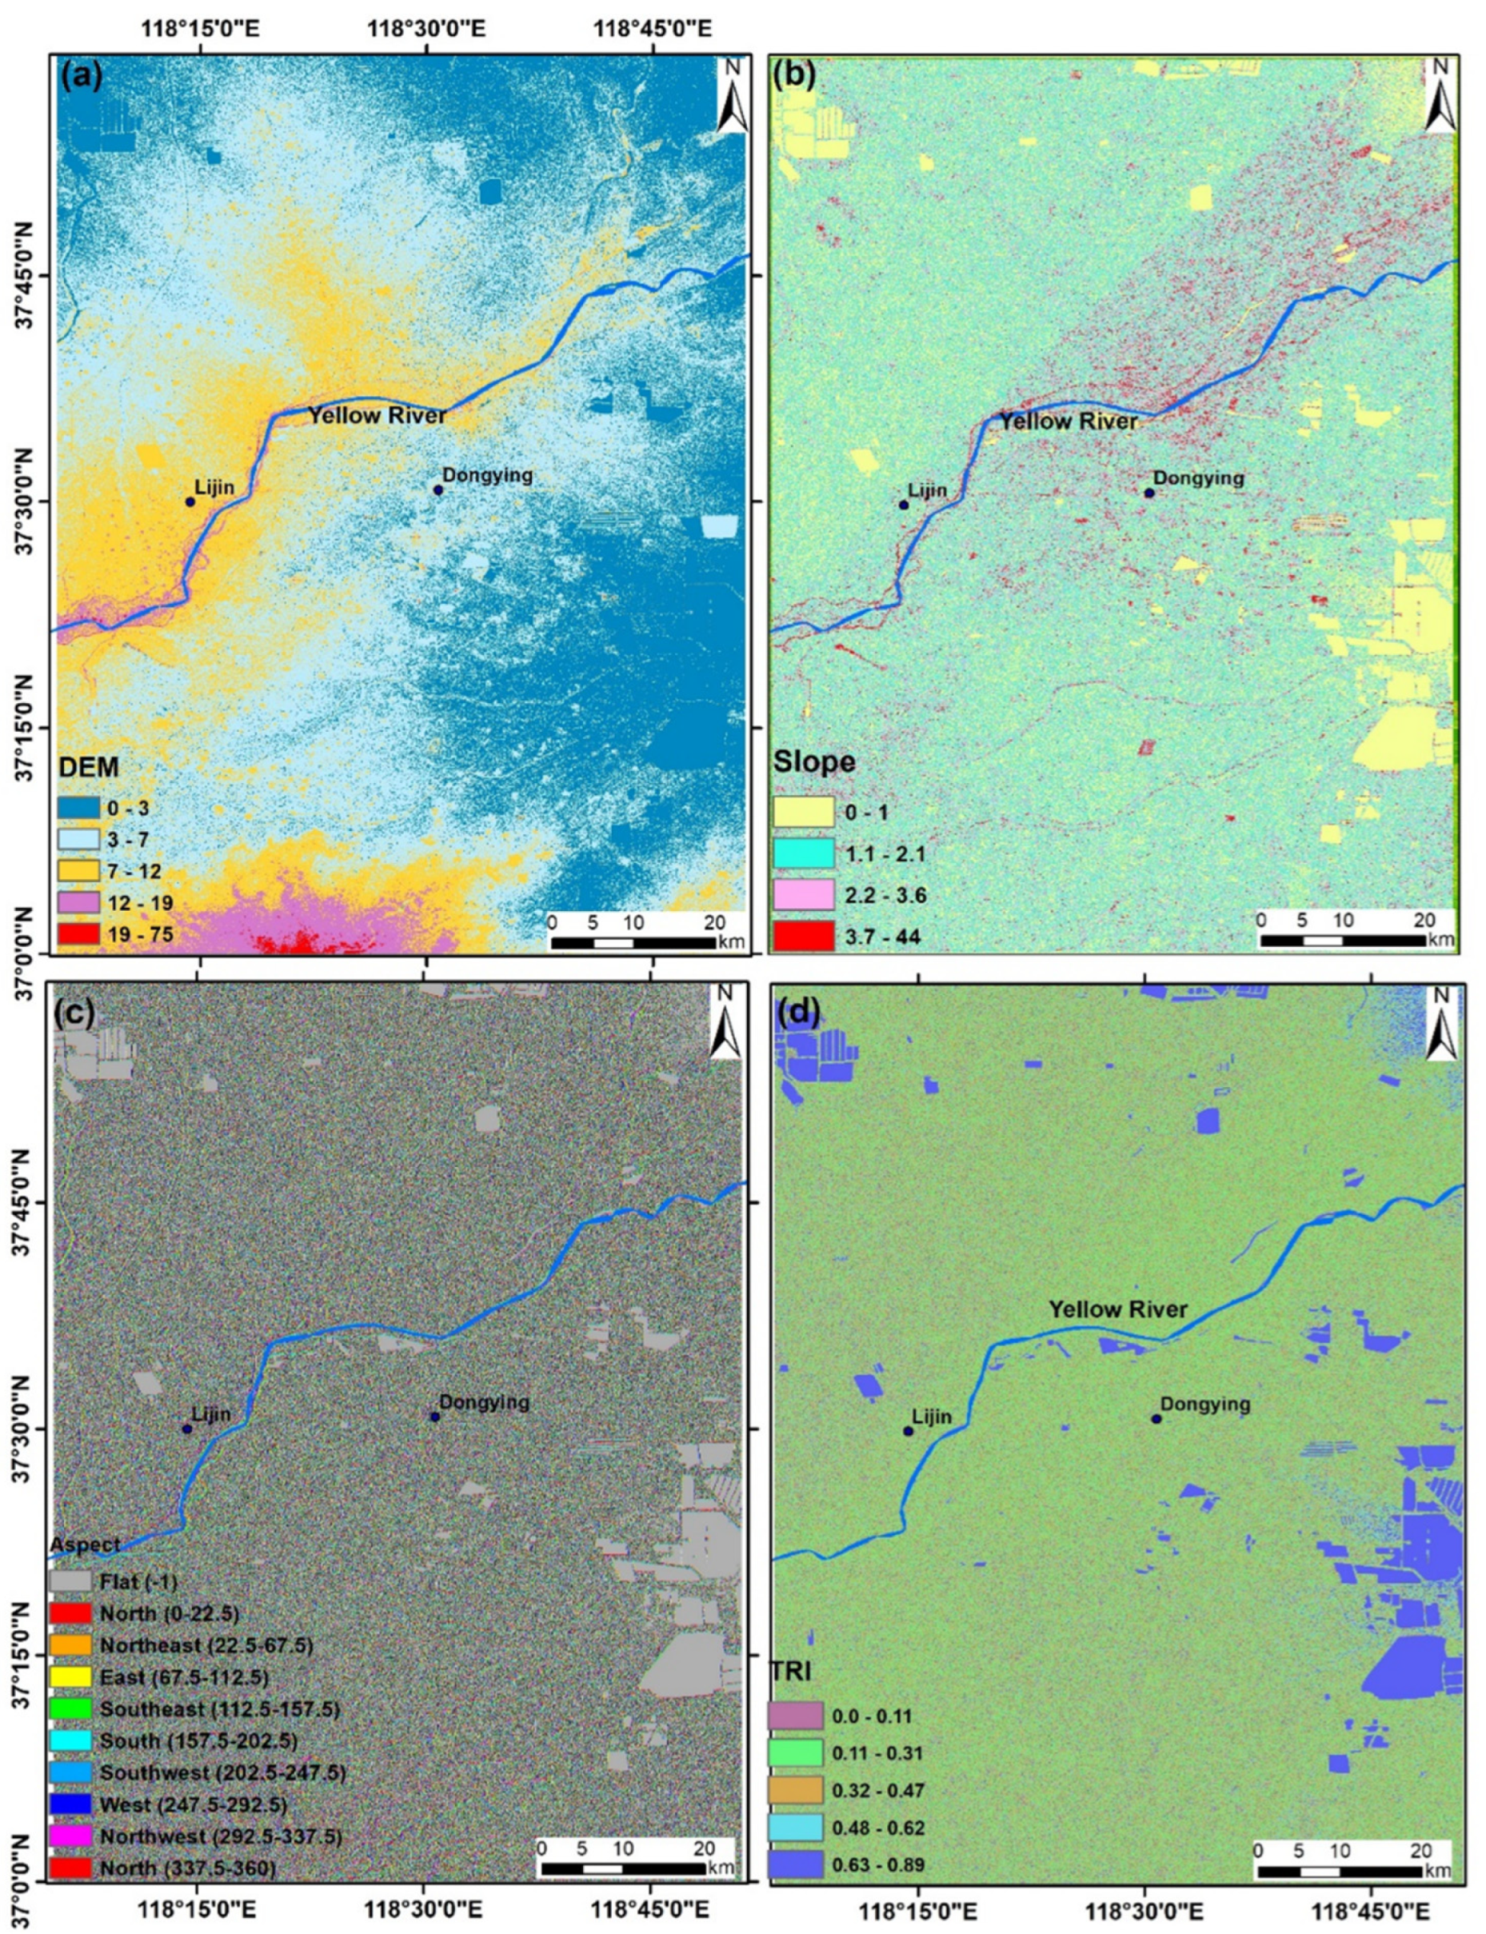
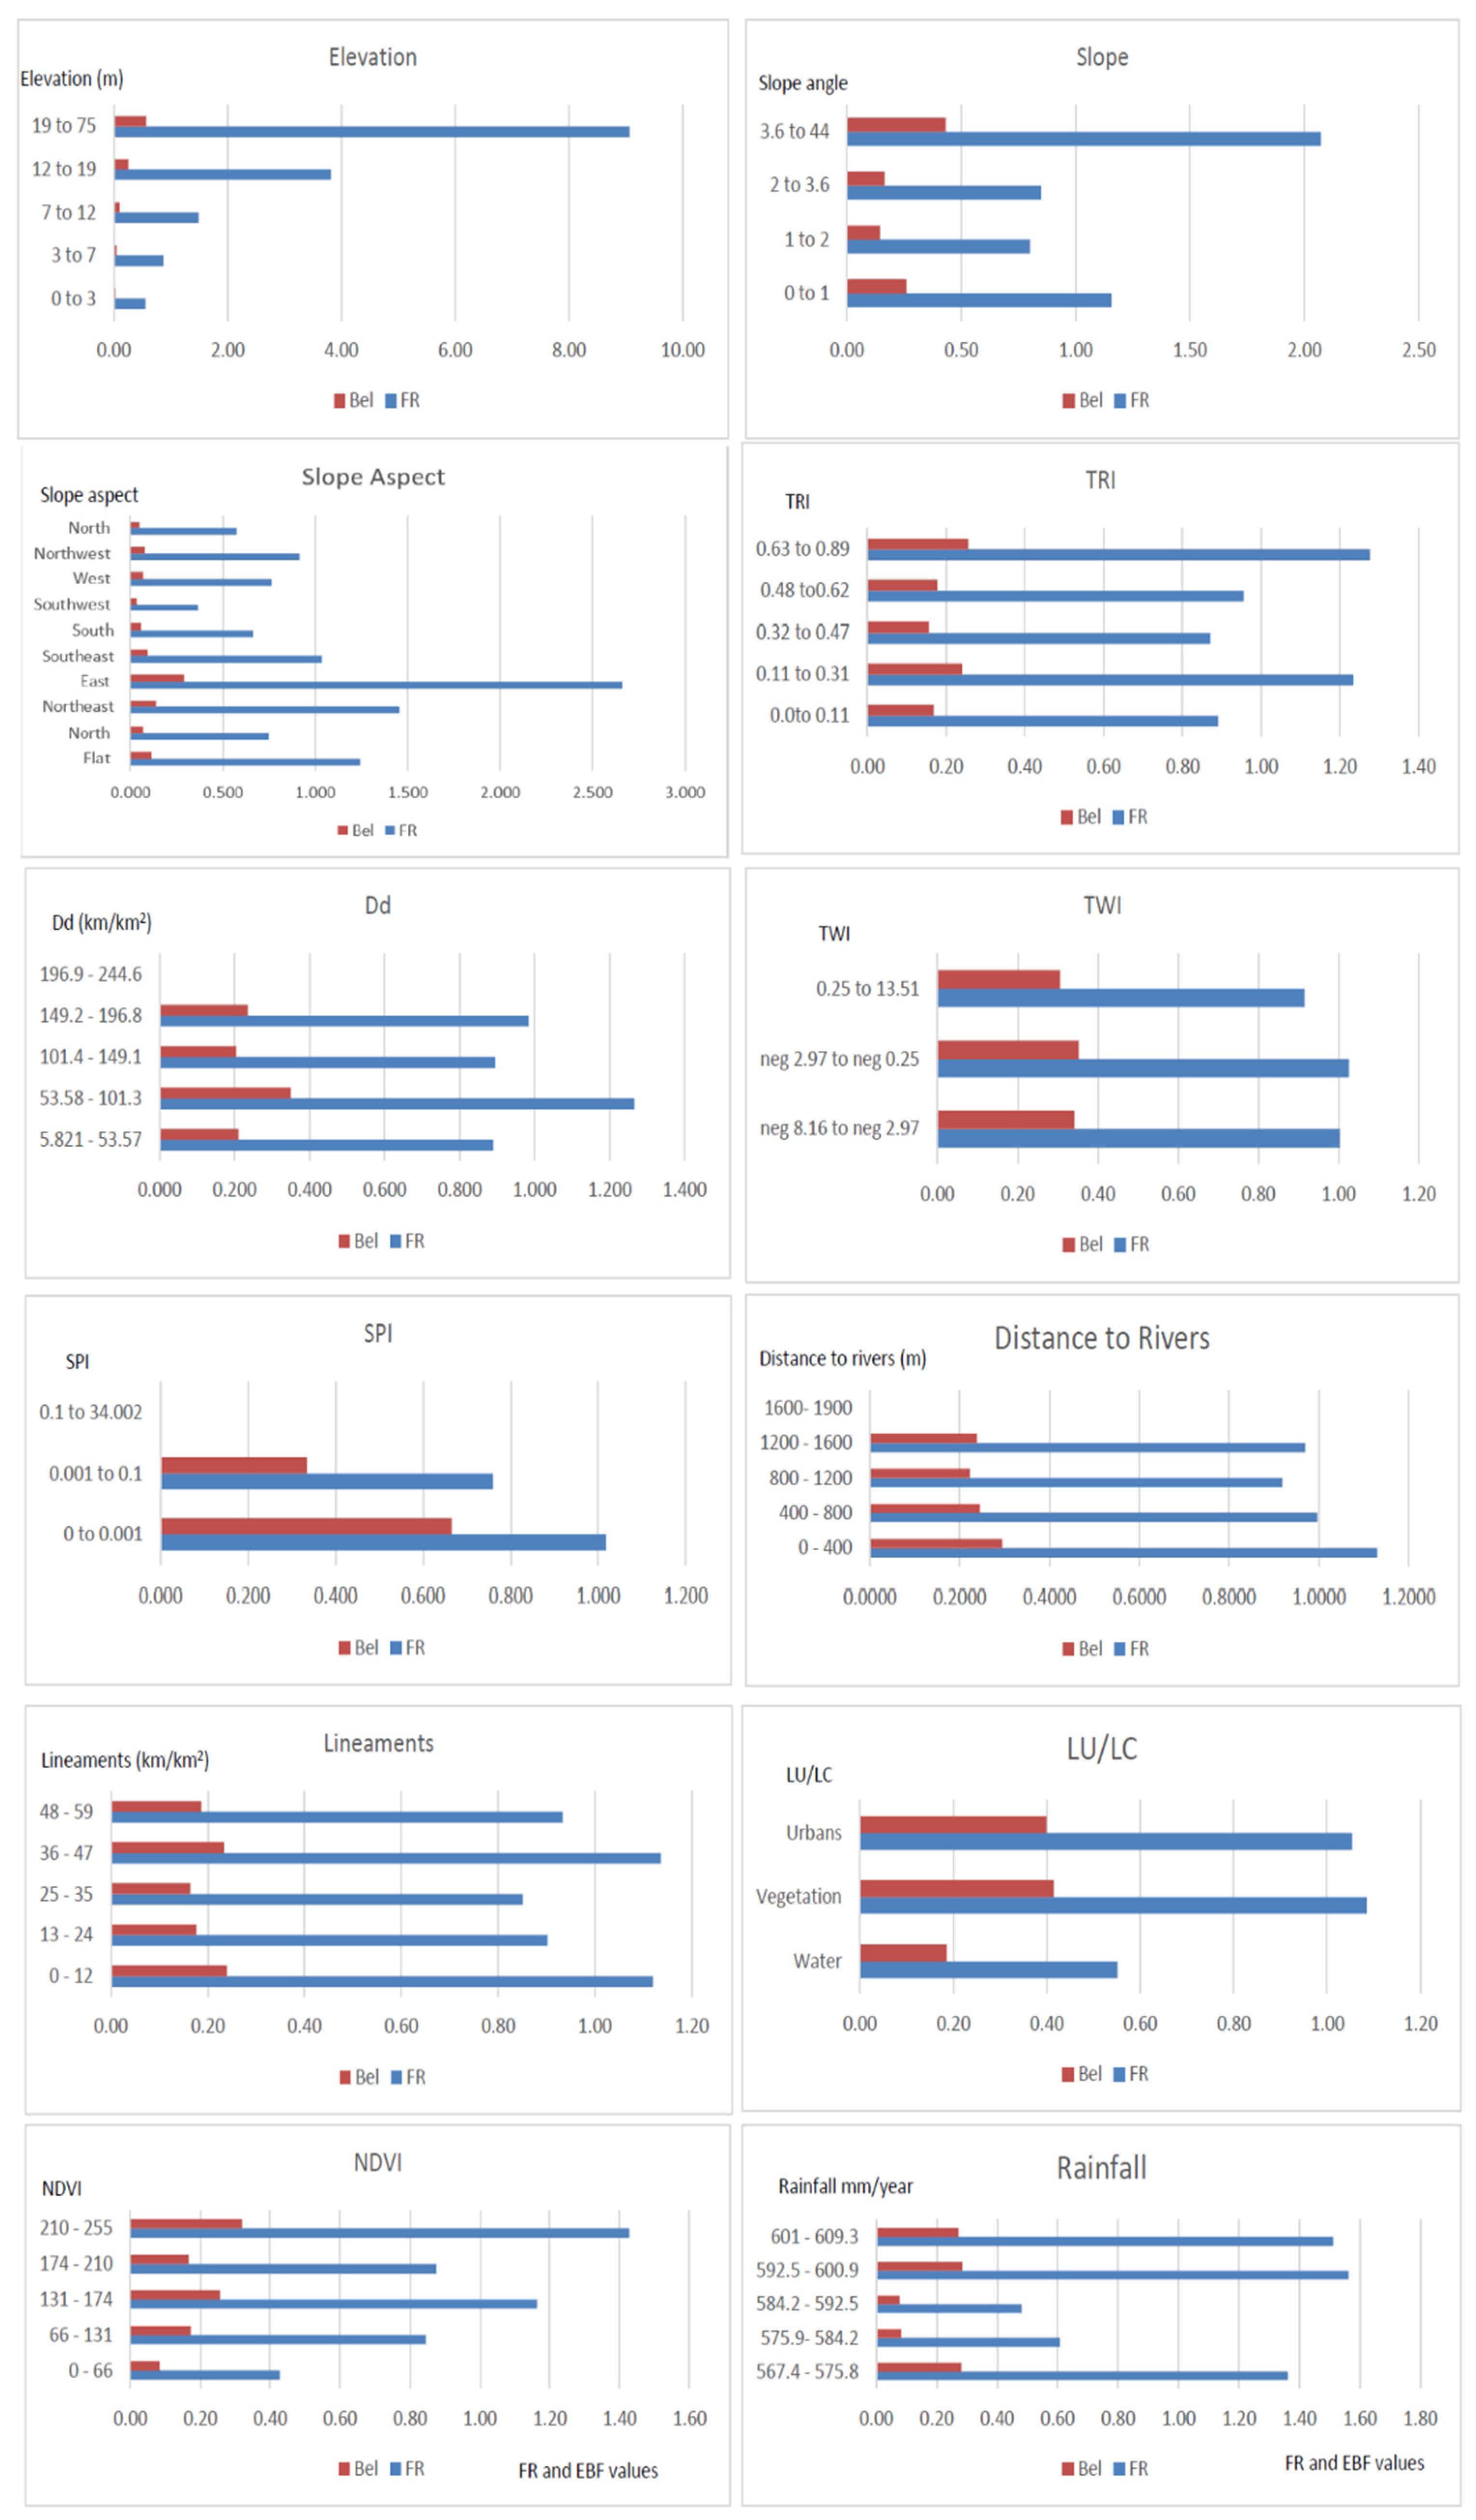
4.1. Elevation
4.2. Slope
4.3. Aspect
4.4. TRI
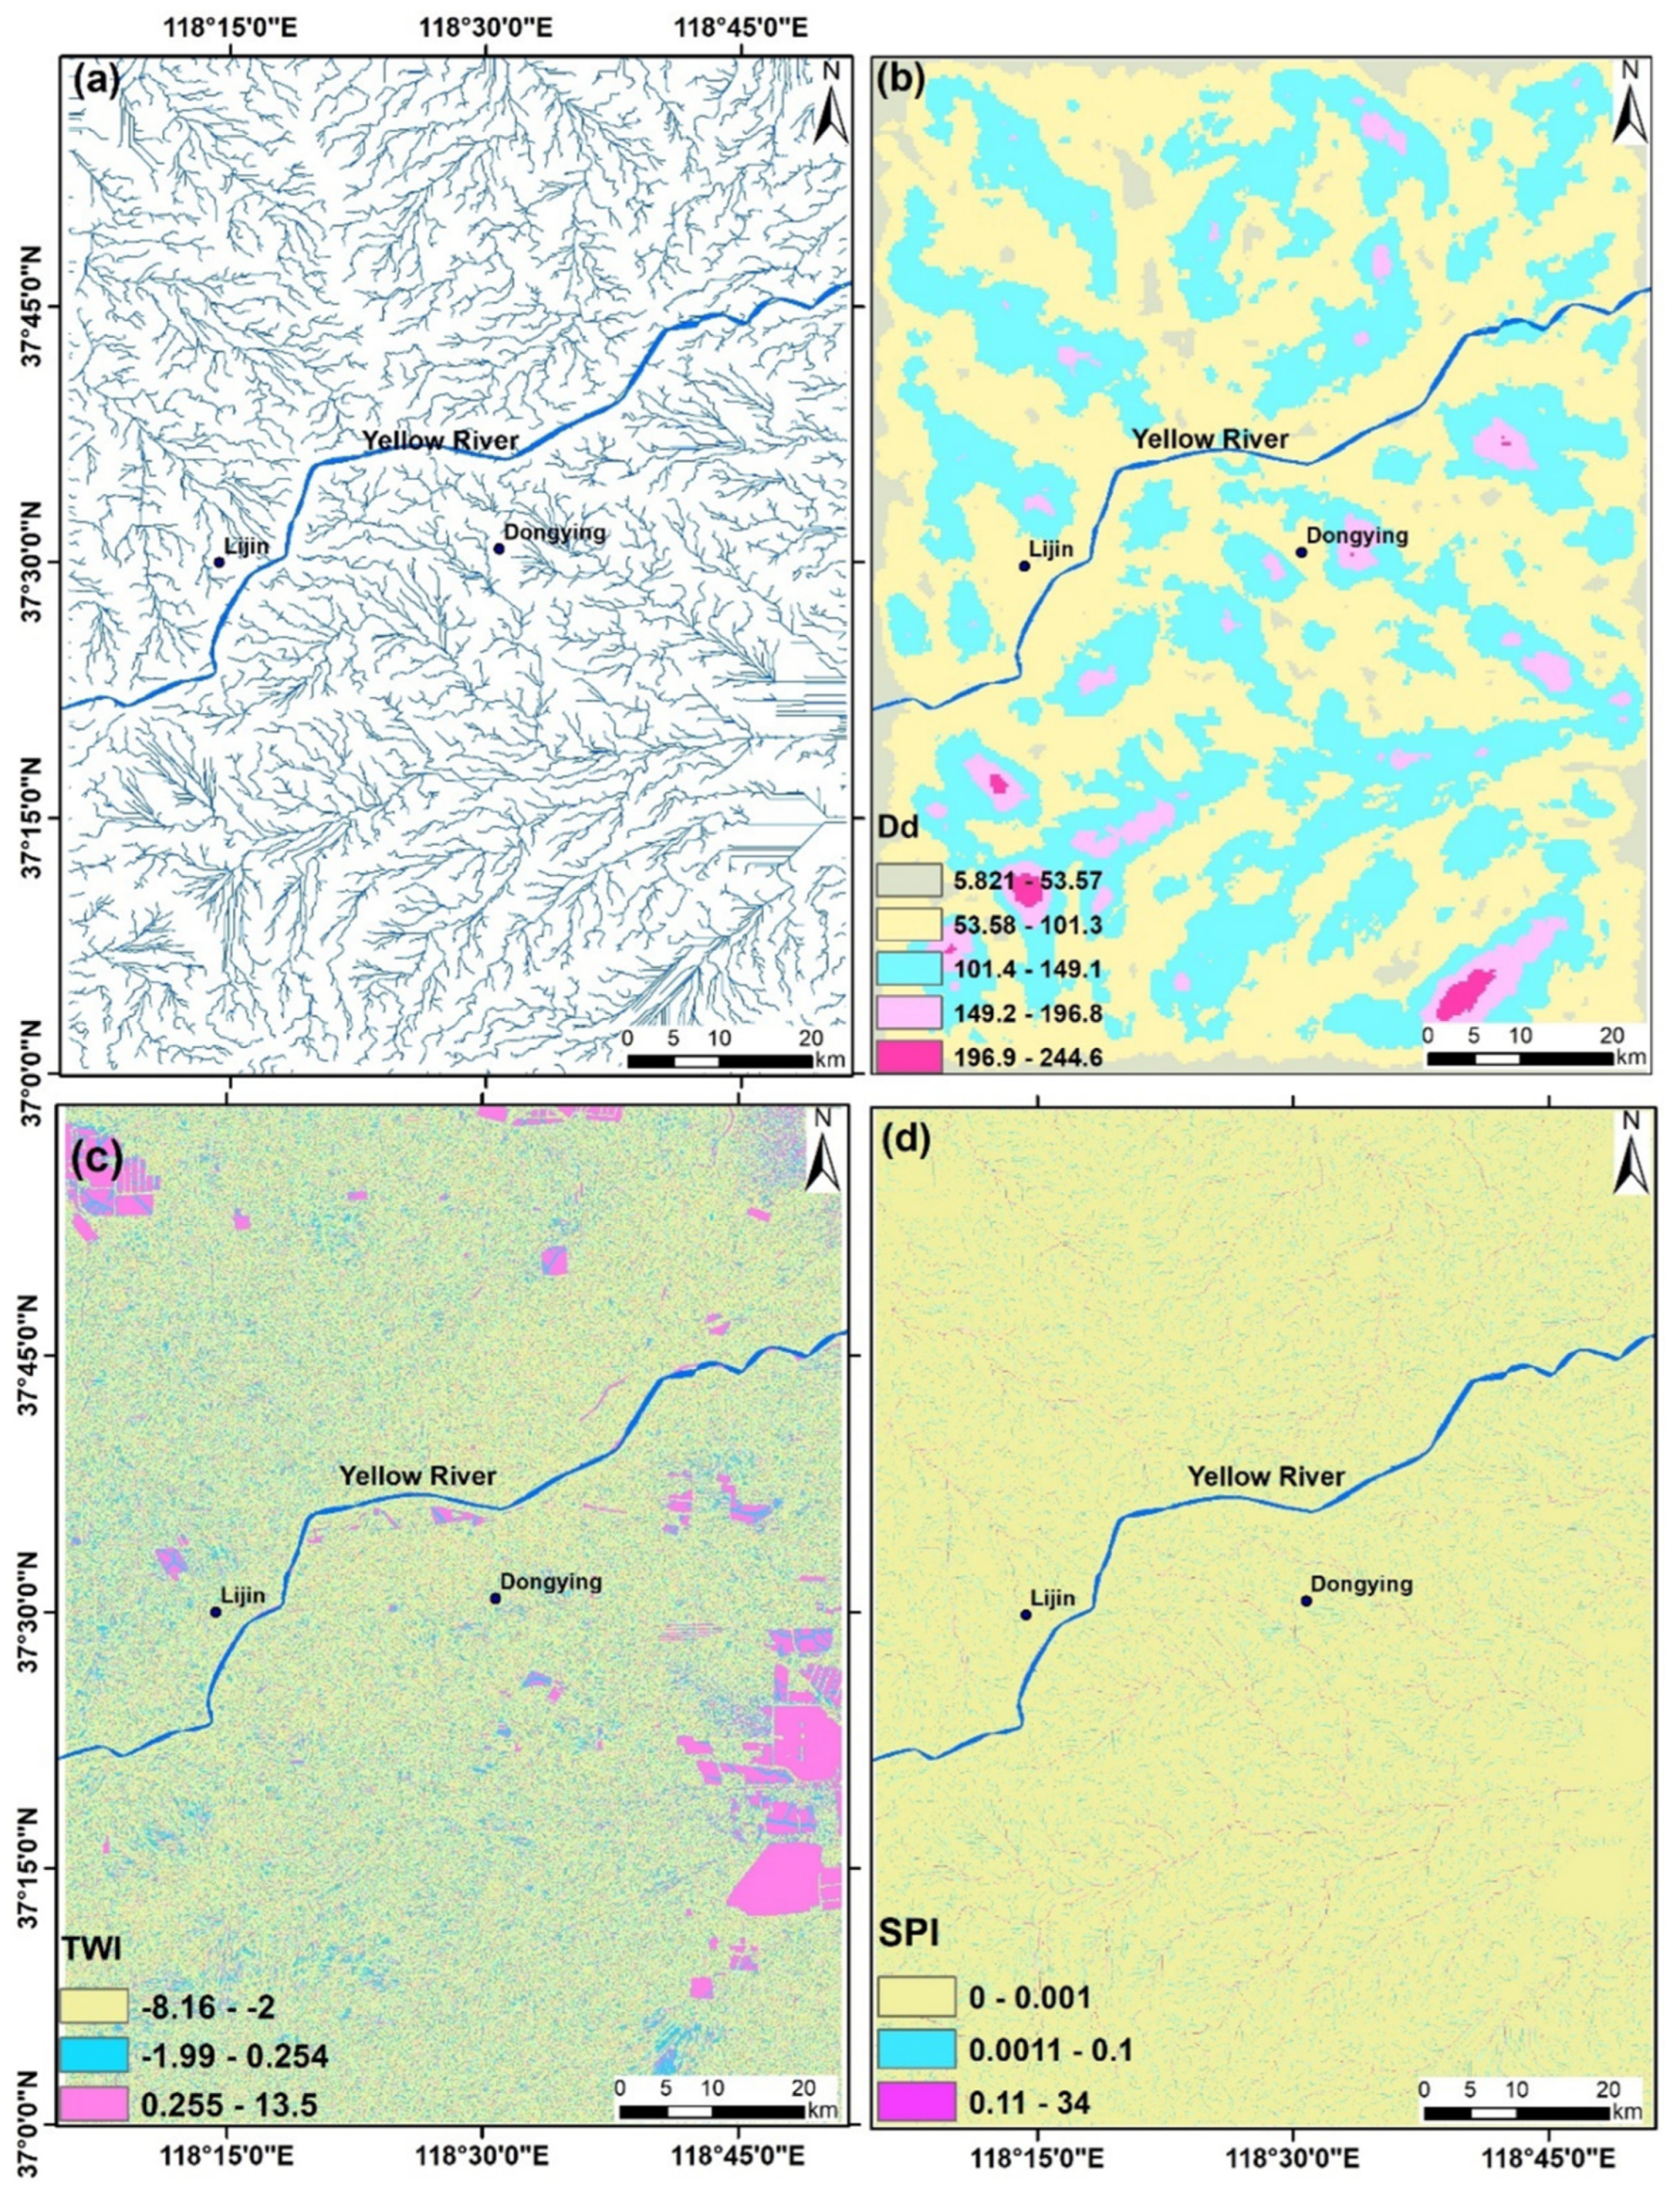
4.5. Drainage Density (Dd)
4.6. Topographic Wetness Index (TWI)
4.7. SPI
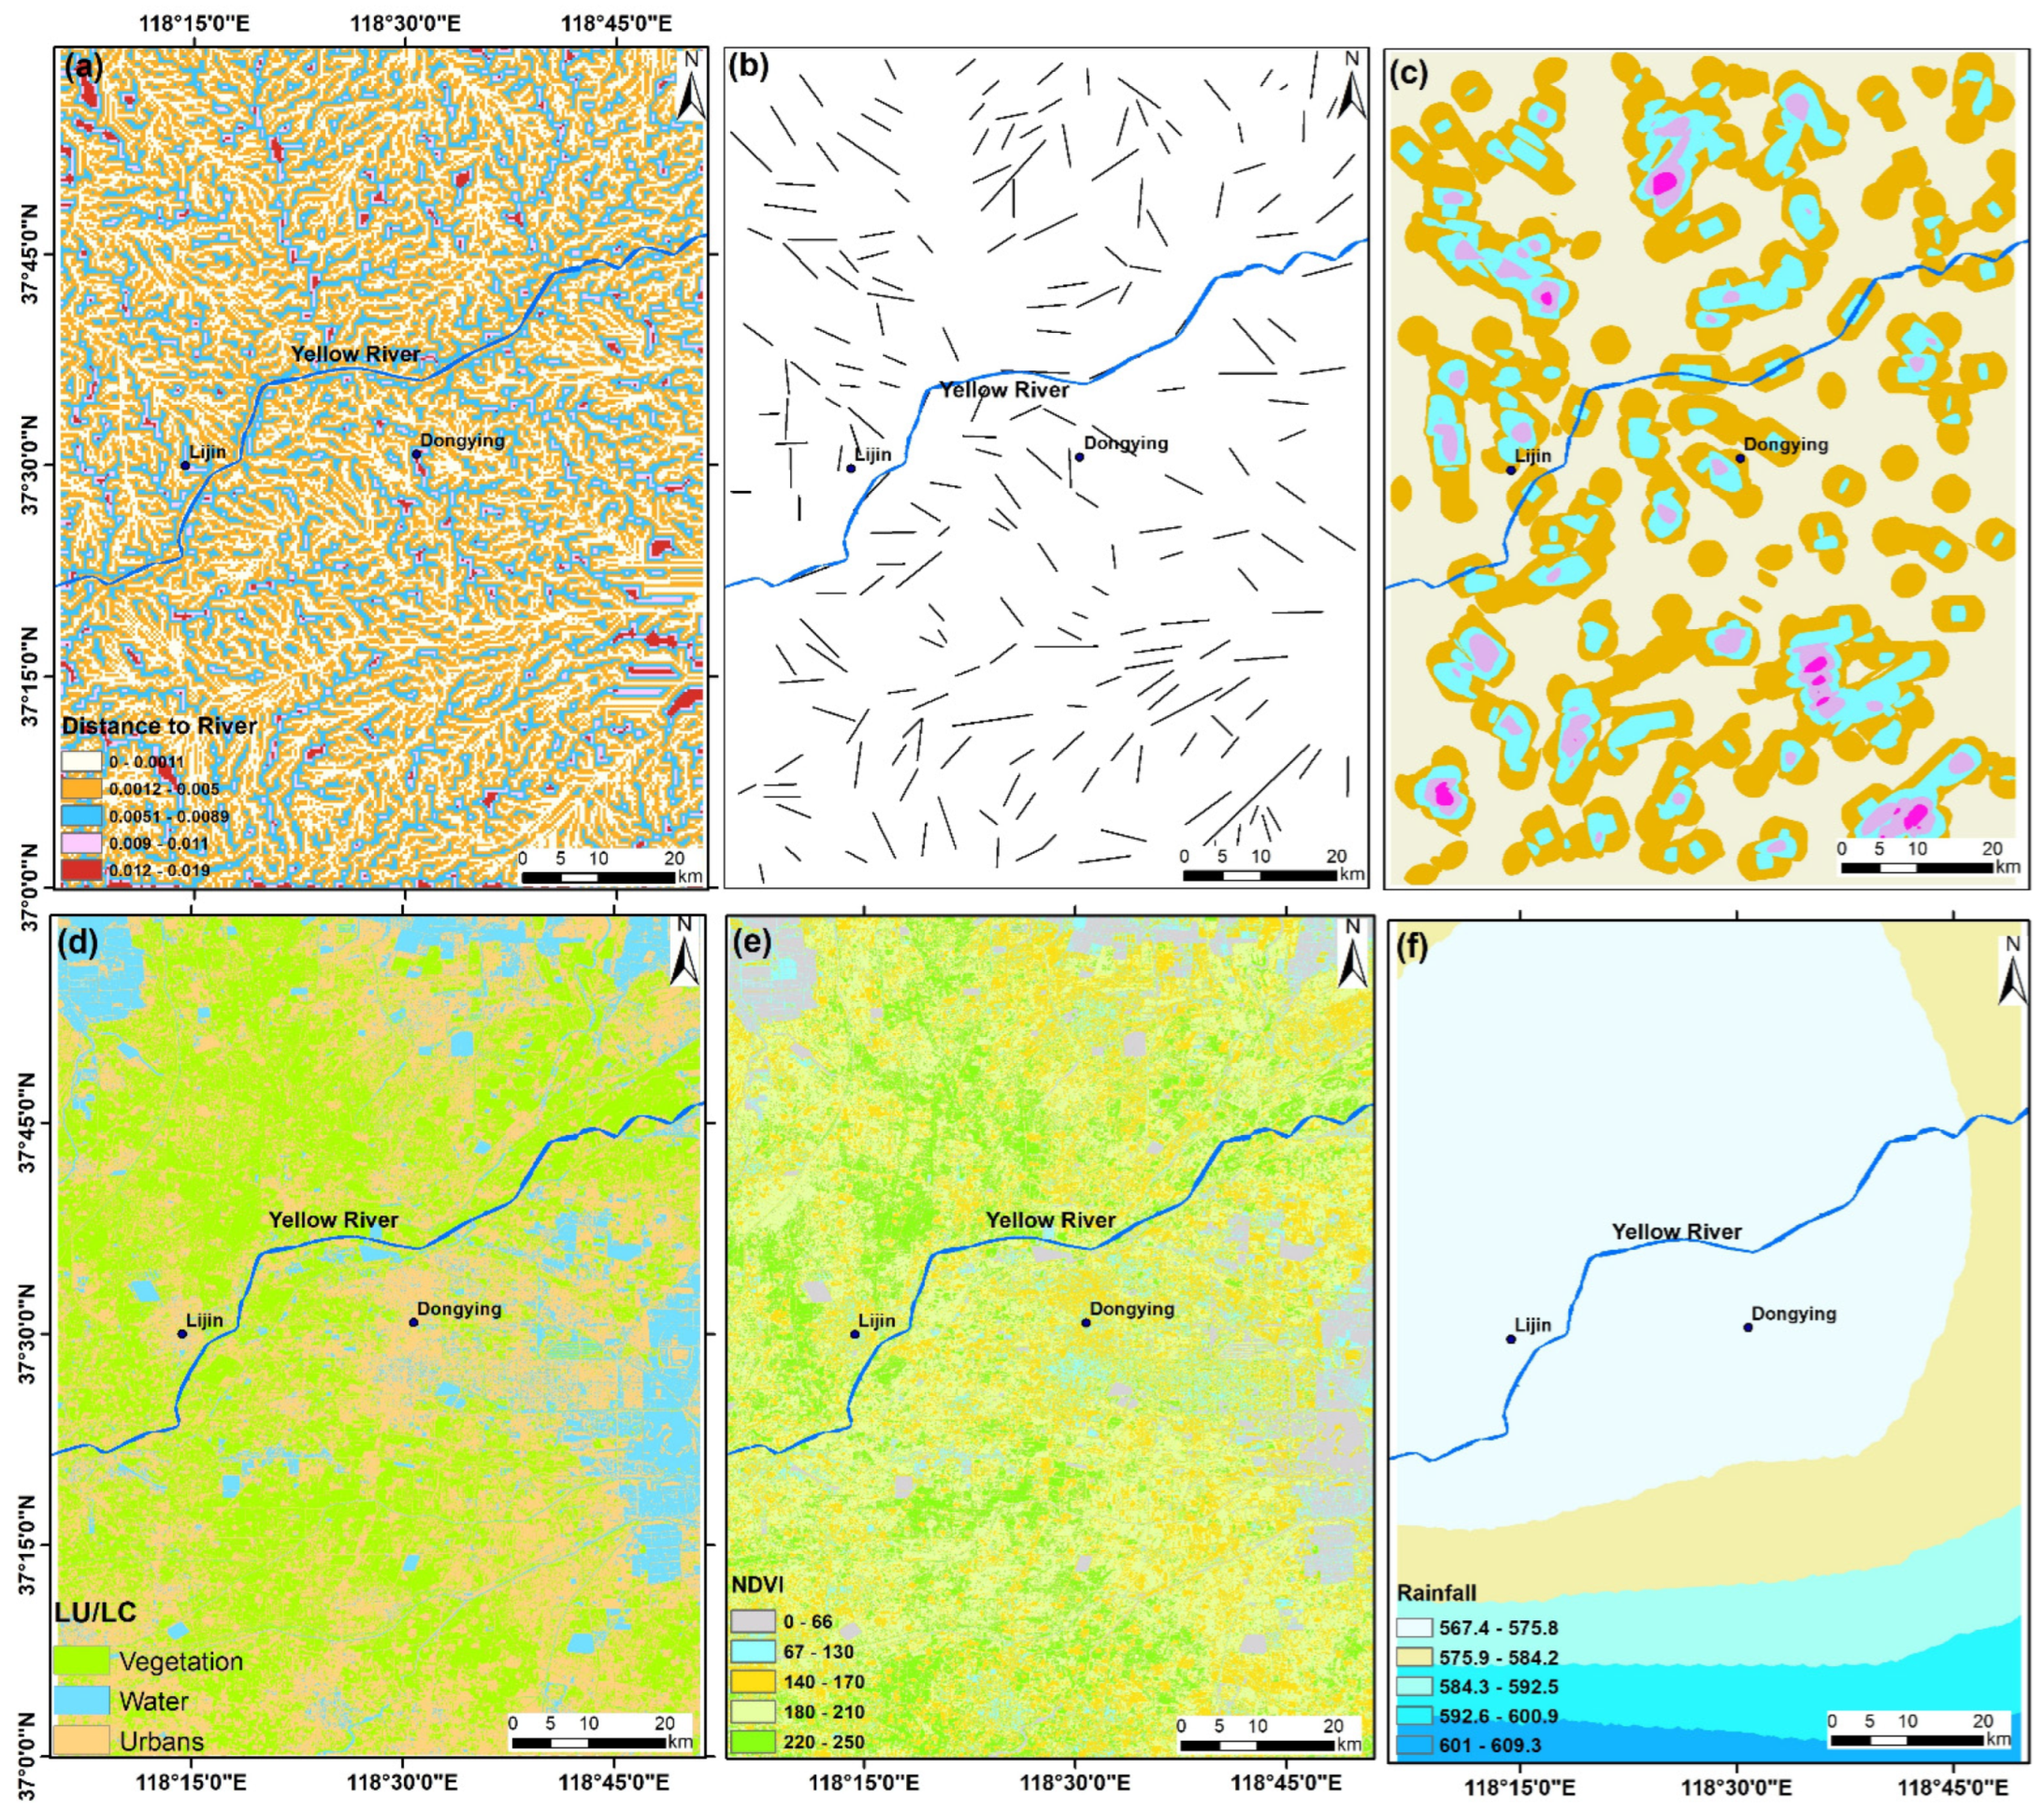
4.8. Distance to River
4.9. Lineaments
4.10. Land Use/Cover
4.11. NDVI
4.12. Rainfall
5. Results
5.1. Application of FR Model
5.2. Application of EBF Model
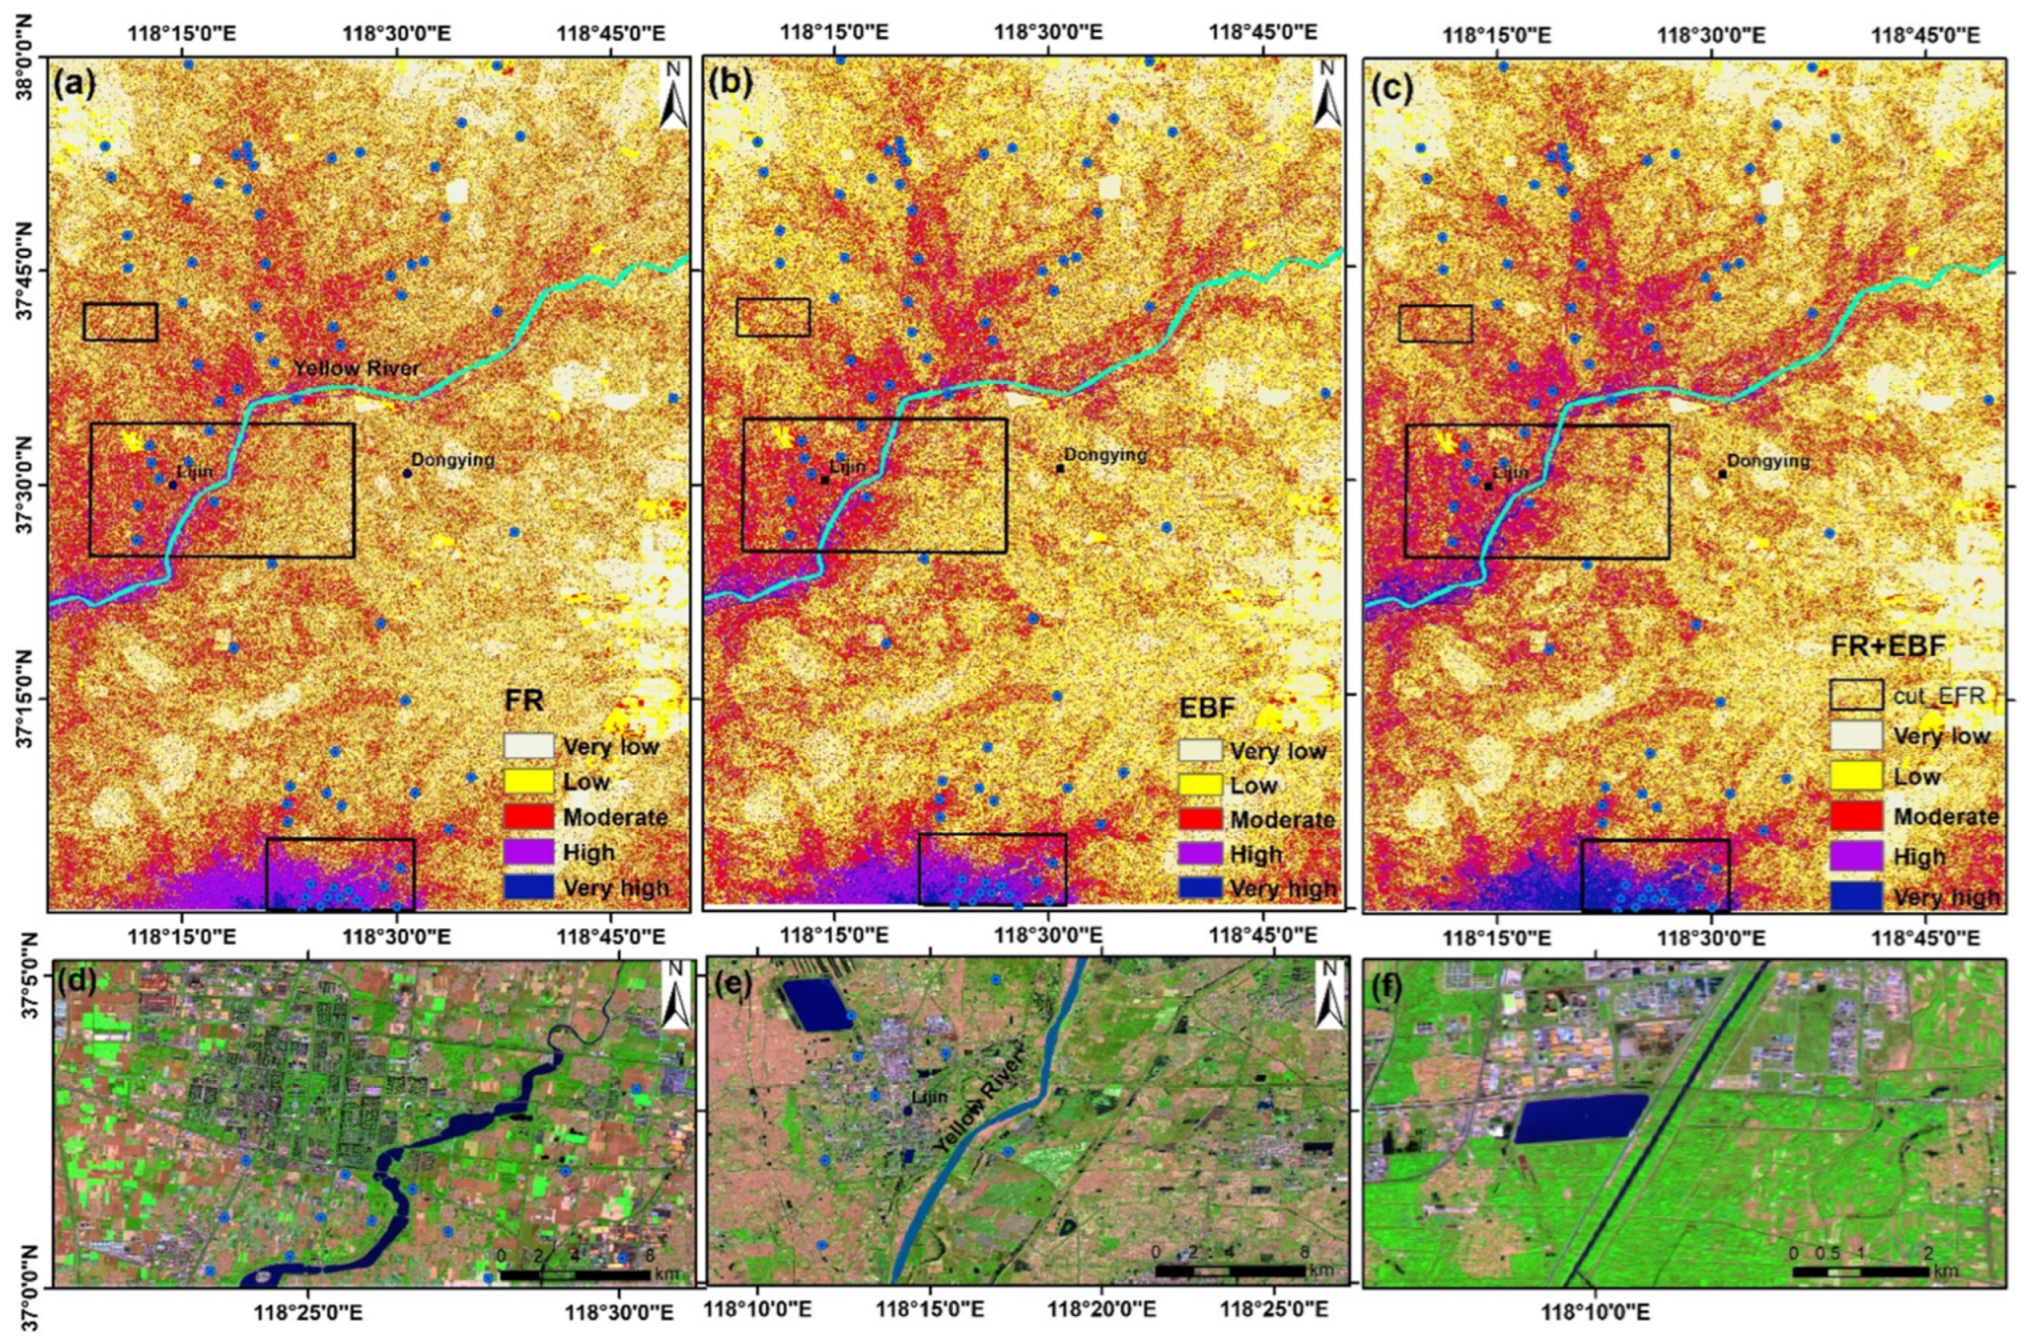
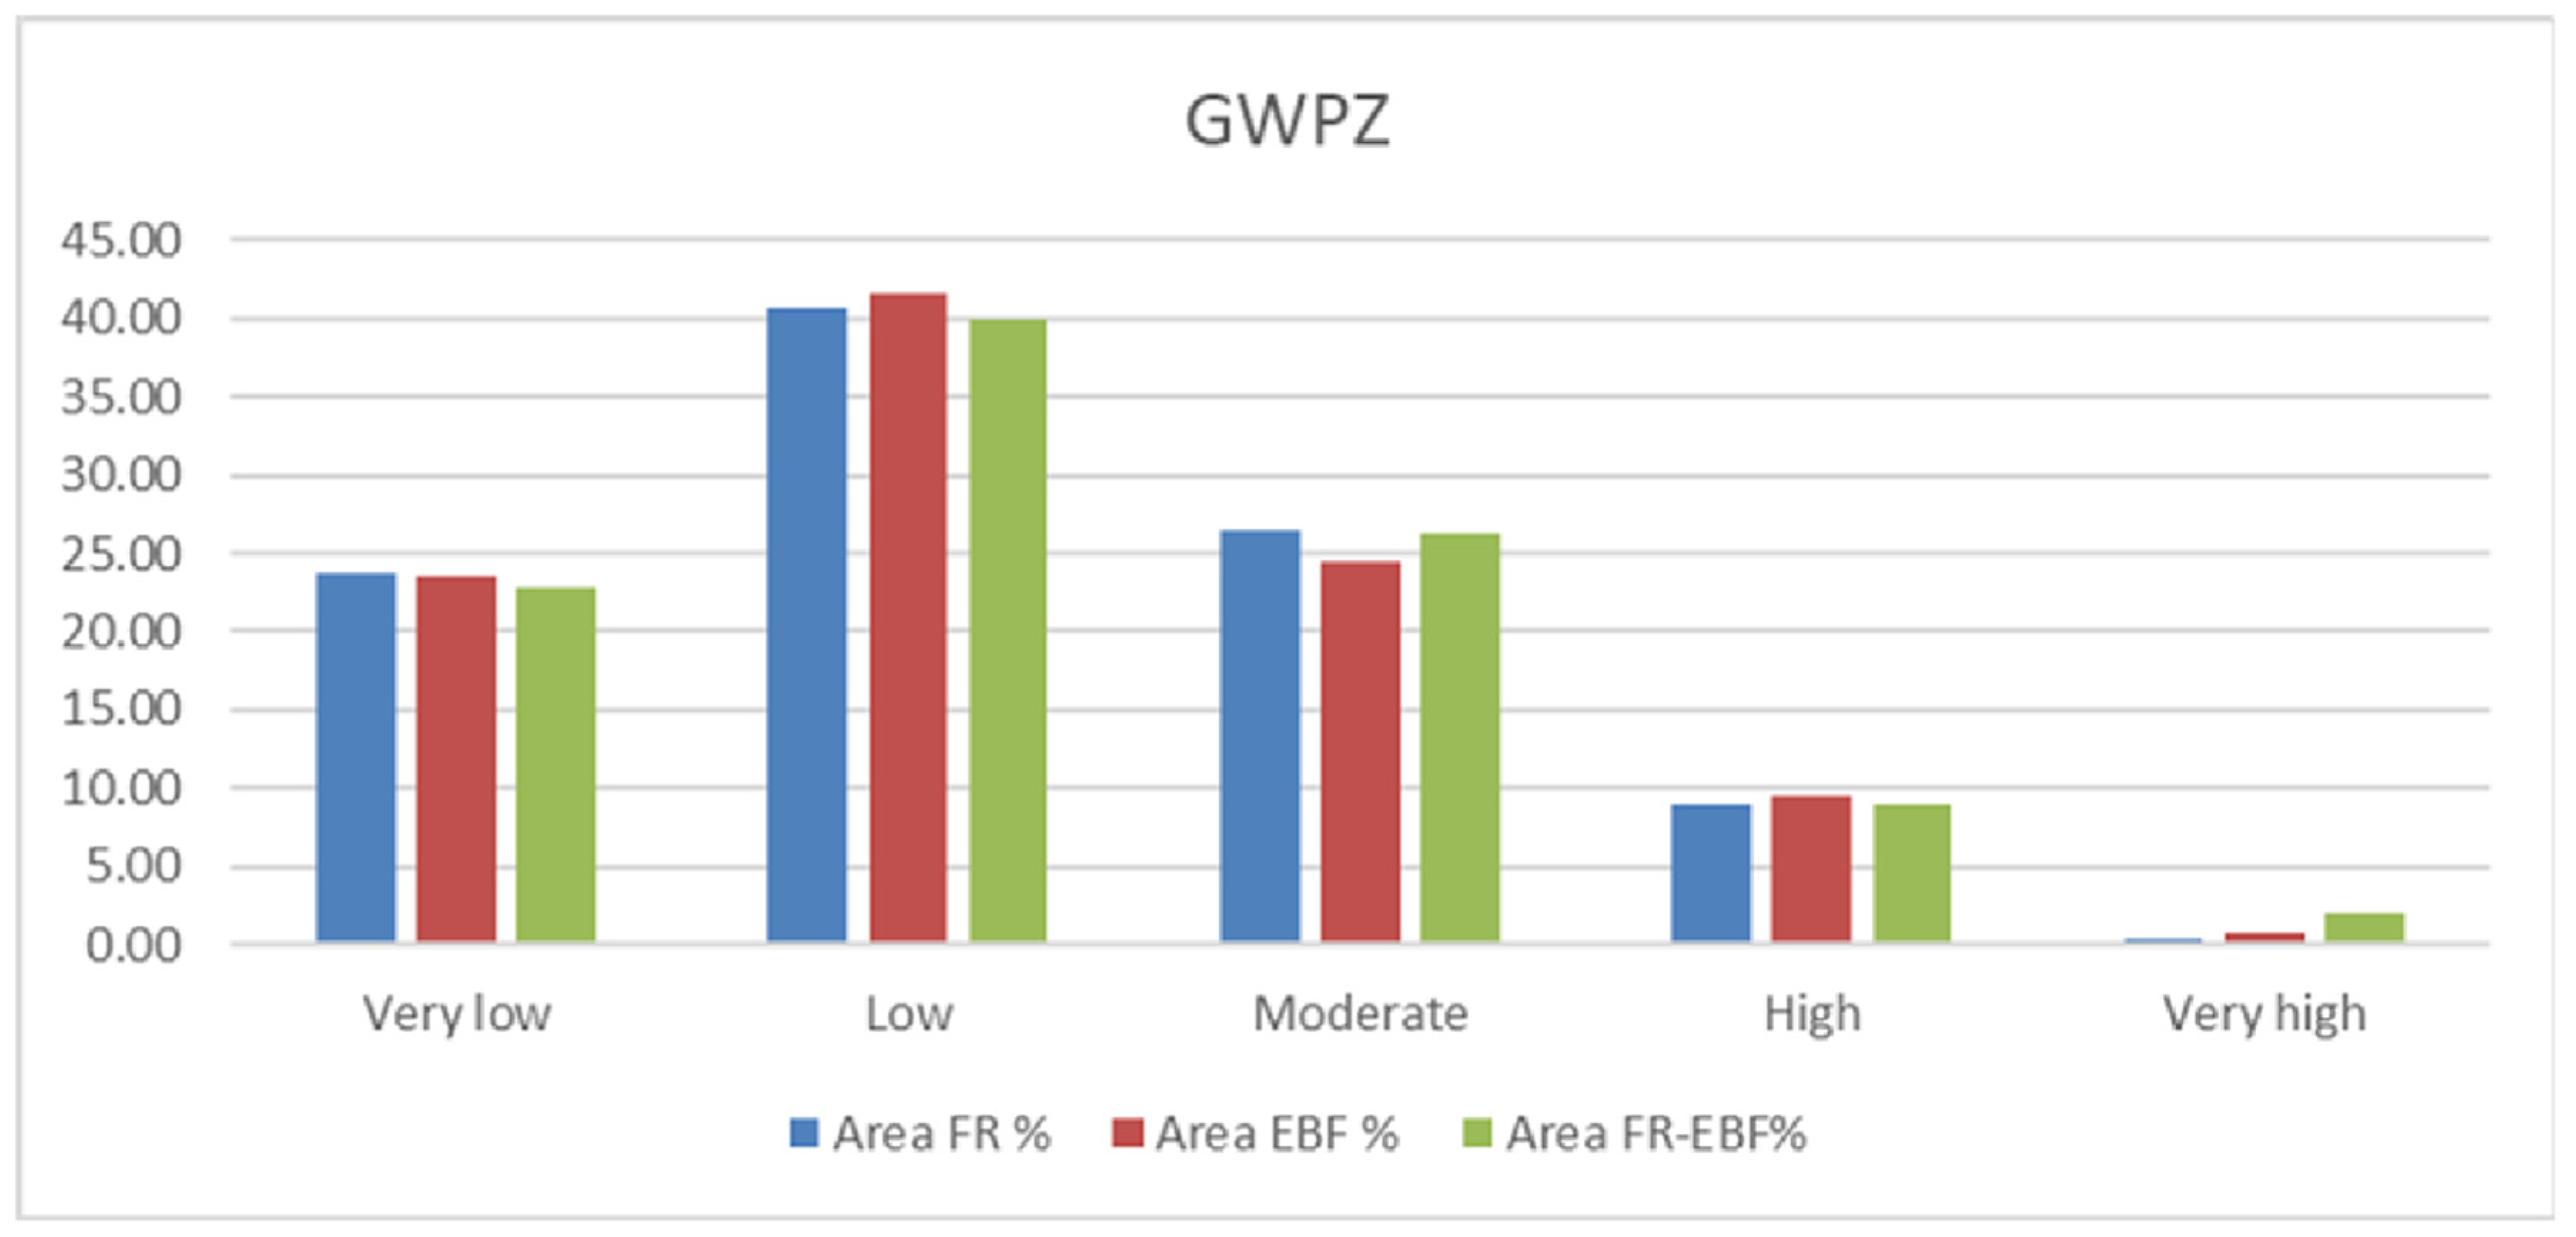
5.3. Groundwater Potential Mapping and Validation of Built Models
6. Discussion
7. Conclusions
Author Contributions
Funding
Data Availability Statement
Acknowledgments
Conflicts of Interest
References
- Owolabi, S.T.; Madi, K.; Kalumba, A.M. Comparative evaluation of Spatio-temporal attributes of precipitation and streamflow in Buffalo and Tyume Catchments, Eastern Cape, South Africa. Environ. Dev. Sustain. 2020, 23, 4236–4251. [Google Scholar] [CrossRef]
- Owolabi, S.T.; Madi, K.; Kalumba, A.M.; Alemaw, B.F. Assessment of recession flow variability and the surficial lithology impact: A case study of Buffalo River catchment, Eastern Cape, South Africa. Environ. Earth Sci. 2020, 79, 187. [Google Scholar] [CrossRef]
- Abdelkareem, M.; Al-Arifi, N. The use of remotely sensed data to reveal geologic, structural, and hydrologic features and predict potential areas of water resources in arid regions. Arab. J. Geosci. 2021, 14, 704. [Google Scholar] [CrossRef]
- Moghaddam, M.; Rezaei, H.R.; Pourghasemi, Z.S.; Pourtaghie, B.; Pradhan. A Modeling Comparison of Groundwater Potential Mapping in a Mountain Bedrock Aquifer: QUEST, GARP, and RF Models. Arab. J. Geosci. 2015, 8, 913. [Google Scholar] [CrossRef]
- Chaminé, J.M.; Carvalho, M.J.; Afonso, J.; Teixeira, L.; Freitas. On a dialogue between hard-rock aquifer mapping and hydrogeological conceptual models: Insights into groundwater exploration. Eur. Geol. 2013, 35, 25. [Google Scholar]
- Odhiambo, O.G. Water scarcity in the Arabian Peninsula and socio-economic implications. Appl. Water Sci. 2017, 7, 2479–2492. [Google Scholar] [CrossRef] [Green Version]
- Kim, J.C.; Jung, H.-S.; Lee, S. Spatial mapping of the groundwater potential of the geum river basin using ensemble models based on remote sensing images. Remote Sens. 2019, 11, 2285. [Google Scholar] [CrossRef] [Green Version]
- Lee, S.; Hyun, Y.; Lee, S.; Lee, M.-J. Groundwater Potential Mapping Using Remote Sensing and GIS-Based Machine Learning Techniques. Remote Sens. 2020, 12, 1200. [Google Scholar] [CrossRef] [Green Version]
- Hasanuzzaman, M.; Mandal, M.H.; Hasnine; Shit, P.K. Groundwater potential mapping using multi-criteria decision, bivariate statistic and machine learning algorithms: Evidence from Chota Nagpur Plateau, India. Appl. Water Sci. 2022, 12, 58. [Google Scholar] [CrossRef]
- Nguyen, P.T.; Ha, D.H.; Jaafari, A.; Nguyen, H.D.; Van Phong, T.; Al-Ansari, N.; Prakash, I.; Van Le, H.; Pham, B.T. Groundwater Potential Mapping Combining Artificial Neural Network and Real AdaBoost Ensemble Technique: The DakNong Province Case-study, Vietnam. Int. J. Environ. Res. Public Health 2020, 17, 2473. [Google Scholar] [CrossRef] [Green Version]
- Rahmati, O.; Melesse, A.M. Application of Dempster–Shafer theory, spatial analysis and remote sensing for groundwater potential and nitrate pollution analysis in the semi-arid region of Khuzestan, Iran. Sci. Total Environ. 2016, 568, 1110–1123. [Google Scholar] [CrossRef] [PubMed]
- Golkarian, A.; Naghibi, S.A.; Kalantar, B.; Pradhan, B. Groundwater potential mapping using C5.0, random forest, and multivariate adaptive regression spline models in GIS. Environ. Monit. Assess. 2018, 190, 149. [Google Scholar] [CrossRef] [PubMed]
- Barlow, P.M.; Leake, S.A. Streamflow Depletion by Wells: Understanding and Managing the Effects of Groundwater Pumping on Streamflow; US Geological Survey: Reston, VA, USA, 2012.
- Barker, J. A generalized radial flow model for hydraulic tests in fractured rock. Water Resour. Res. 1988, 24, 1796–1804. [Google Scholar] [CrossRef] [Green Version]
- Abdelkareem, M.; El-Baz, F.; Askalany, M.; Akawy, A.; Ghoneim, E. Groundwater prospect map of Egypt’s Qena Valley using data fusion. Int. J. Image Data Fusion 2012, 3, 169–189. [Google Scholar] [CrossRef]
- Elbeih, S.F. An overview of integrated remote sensing and GIS for groundwater mapping in Egypt. Ain Shams Eng. J. 2015, 6, 1–15. [Google Scholar] [CrossRef] [Green Version]
- Dušek, P.; Velísková, Y. Comparison of the MODFLOW modules for the simulation of the river type boundary condition. Pollack Period. 2017, 12, 3–13. [Google Scholar] [CrossRef]
- Zhu, Q.; Abdelkareem, M. Mapping Groundwater Potential Zones Using a Knowledge-Driven Approach and GIS Analysis. Water 2021, 13, 579. [Google Scholar] [CrossRef]
- Rahmati, O.; Naghibi, S.A.; Shahabi, H.; Bui, D.T.; Pradhan, B.; Azareh, A.; Rafiei-Sardooi, E.; Samani, A.N.; Melesse, A.M. Groundwater spring potential modelling: Comprising the capability and robustness of three different modeling approaches. J. Hydrol. 2018, 565, 248–261. [Google Scholar] [CrossRef]
- Shenga, Z.D.; Baroková, D.; Šoltész, A. Modeling of groundwater extraction from wells to control excessive water levels. Pollack Period. 2018, 13, 125–136. [Google Scholar] [CrossRef]
- Mandel, S. Groundwater Resources: Investigation and Development; Elsevier: Amsterdam, The Netherlands, 2012. [Google Scholar]
- Waikar, M.L.; Nilawar, A.P. Identification of groundwater potential zone using remote sensing and GIS technique. Int. J. Innov. Res. Sci. Eng. Technol. 2014, 3, 12163–12174. [Google Scholar]
- Thompson, S.A. Hydrology for Water Management; CRC Press: Boca Raton, FL, USA, 2017. [Google Scholar]
- Abdelkareem, M.; El-Baz, F. Analyses of optical images and radar data reveal structural features and predict groundwater accumulations in the central Eastern Desert of Egypt. Arab. J. Geosci. 2014, 8, 2653–2666. [Google Scholar] [CrossRef]
- Abdelkareem, M.; Abdalla, F. Revealing potential areas of water resources using integrated remote-sensing data and GIS-based analytical hierarchy process. Geocarto Int. 2021, 1–25. [Google Scholar] [CrossRef]
- Arulbalaji, P.; Padmalal, D.; Sreelash, K. GIS and AHP Techniques Based Delineation of Groundwater Potential Zones: A case study from Southern Western Ghats, India. Sci. Rep. 2019, 9, 2082. [Google Scholar] [CrossRef] [PubMed] [Green Version]
- Kumar, V.A.; Mondal, N.C.; Ahmed, S. Identification of Groundwater Potential Zones Using RS, GIS and AHP Techniques: A Case Study in a Part of Deccan Volcanic Province (DVP), Maharashtra, India. J. Indian Soc. Remote Sens. 2020, 48, 497–511. [Google Scholar] [CrossRef]
- Yariyan, P.; Avand, M.; Omidvar, E.; Pham, Q.B.; Linh, N.T.T.; Tiefenbacher, J.P. Optimization of statistical and machine learning hybrid models for groundwater potential mapping. Geocarto Int. 2020, 37, 3877–3911. [Google Scholar] [CrossRef]
- Sun, T.; Cheng, W.; Abdelkareem, M.; Al-Arifi, N. Mapping Prospective Areas of Water Resources and Monitoring Land Use/Land Cover Changes in an Arid Region Using Remote Sensing and GIS Techniques. Water 2022, 14, 2435. [Google Scholar] [CrossRef]
- Melese, T.; Belay, T. Groundwater Potential Zone Mapping Using Analytical Hierarchy Process and GIS in Muga Watershed, Abay Basin, Ethiopia. Glob. Chall. 2021, 6, 2100068. [Google Scholar] [CrossRef]
- Priya, U.; Iqbal, M.A.; Salam, M.A.; Alam, N.E.; Uddin, M.F.; Islam, A.R.M.T.; Sarkar, S.K.; Imran, S.I.; Rak, A.E. Sustainable Groundwater Potential Zoning with Integrating GIS, Remote Sensing, and AHP Model: A Case from North-Central Bangladesh. Sustainability 2022, 14, 5640. [Google Scholar] [CrossRef]
- Lee, S.; Hyun, Y.; Lee, M.-J. Groundwater potential mapping using data mining models of big data analysis in Goyang-si, South Korea. Sustainability 2019, 11, 1678. [Google Scholar] [CrossRef] [Green Version]
- Singh, L.K.; Jha, M.K.; Chowdary, V. Assessing the accuracy of GIS-based Multi-Criteria Decision Analysis approaches for mapping groundwater potential. Ecol. Indic. 2018, 91, 24–37. [Google Scholar] [CrossRef]
- Riad, P.; Billib, M.; Hassan, A.; Salam, M.; El Din, M. Application of the overlay weighted model and boolean logic to determine the best locations for artificial recharge of groundwater. J. Urban Environ. Eng. 2011, 5, 57–66. [Google Scholar] [CrossRef]
- Mallick, J.; Abad Khan, R.; Ahmed, M.; Alqadhi, S.D.; Alsubih, M.; Falqi, I.; Abul Hasan, M. Modeling Groundwater Potential Zone in a Semi-Arid Region of Aseer Using Fuzzy-AHP and Geoinformation Techniques. Water 2019, 11, 2656. [Google Scholar] [CrossRef]
- Muthumaniraja, C.; Anbazhagan, S.; Jothibasu, A.; Chinnamuthu, M. Remote Sensing and Fuzzy Logic Approach for Artificial Recharge Studies in Hard Rock Terrain of South India. In GIS and Geostatistical Techniques for Groundwater Science; Elsevier: Amsterdam, The Netherlands, 2019; pp. 91–112. [Google Scholar] [CrossRef]
- Shahid, S.; Nath, S.K.; Kamal, A.S.M. GIS Integration of Remote Sensing and Topographic Data Using Fuzzy Logic for Ground Water Assessment in Midnapur District, India. Geocarto Int. 2014, 17, 69–74. [Google Scholar] [CrossRef]
- Ozdemir, A. GIS-based groundwater spring potential mapping in the Sultan Mountains (Konya, Turkey) using frequency ratio, weights of evidence and logistic regression methods and their comparison. J. Hydrol. 2011, 411, 290–308. [Google Scholar] [CrossRef]
- Manap, M.A.; Nampak, H.; Pradhan, B.; Lee, S.; Sulaiman, W.N.A.; Ramli, M.F. Application of probabilistic-based frequency ratio model in groundwater potential mapping using remote sensing data and GIS. Arab. J. Geosci. 2012, 7, 711–724. [Google Scholar] [CrossRef]
- Guru, B.; Seshan, K.; Bera, S. Frequency ratio model for groundwater potential mapping and its sustainable management in cold desert, India. J. King Saud. Univ.—Sci. 2017, 29, 333–347. [Google Scholar] [CrossRef] [Green Version]
- Naghibi, S.A.; Pourghasemi, H.R.; Dixon, B. GIS-based groundwater potential mapping using boosted regression tree, classification and regression tree, and random forest machine learning models in Iran. Environ. Monit. Assess. 2015, 188, 44. [Google Scholar] [CrossRef]
- Muavhi, N.; Thamaga, K.H.; Mutoti, M.I. Mapping groundwater potential zones using relative frequency ratio, analytic hierarchy process and their hybrid models: Case of Nzhelele-Makhado area in South Africa. Geocarto Int. 2022, 37, 6311–6330. [Google Scholar] [CrossRef]
- Oh, H.-J.; Kim, Y.-S.; Choi, J.-K.; Park, E.; Lee, S. GIS mapping of regional probabilistic groundwater potential in the area of Pohang City, Korea. J. Hydrol. 2011, 399, 158–172. [Google Scholar] [CrossRef]
- Chen, W.; Li, H.; Hou, E.; Wang, S.; Wang, G.; Panahi, M.; Li, T.; Peng, T.; Guo, C.; Niu, C.; et al. GIS-based groundwater potential analysis using novel ensemble weights-of-evidence with logistic regression and functional tree models. Sci. Total. Environ. 2018, 634, 853–867. [Google Scholar] [CrossRef] [Green Version]
- Arabameri, A.; Rezaei, K.; Cerda, A.; Lombardo, L.; Rodrigo-Comino, J. GIS-based groundwater potential mapping in Shahroud plain, Iran. A comparison among statistical (bivariate and multivariate), data mining and MCDM approaches. Sci. Total. Environ. 2019, 658, 160–177. [Google Scholar] [CrossRef] [PubMed]
- Lee, S.; Song, K.-Y.; Kim, Y.; Park, I. Regional groundwater productivity potential mapping using a geographic information system (GIS) based artificial neural network model. Hydrogeol. J. 2012, 20, 1511–1527. [Google Scholar] [CrossRef]
- Corsini, A.; Cervi, F.; Ronchetti, F. Weight of evidence and artificial neural networks for potential groundwater mapping: An application to the Mt. Modino area (Northern Apennines, Italy). Geomorphology 2009, 111, 79–87. [Google Scholar] [CrossRef]
- Moghaddam, D.; Rezaei, M.; Pourghasemi, H.R.; Pourtaghi, Z.S.; Pradhan, B. Groundwater spring po-tential mapping using bivariate statistical model and GIS in the Taleghan watershed Iran. Arab. J. Geosci. 2013, 8, 913–929. [Google Scholar] [CrossRef]
- Kaliraj, S.; Chandrasekar, N.; Magesh, N.S. Idnetification of potential groundwater recharge zones in Vaigai upper basin, Tamil Nadu, using GISbased analytical hierarchical process (AHP) technique. Arab. J. Geosci. 2014, 7, 1385–1401. [Google Scholar] [CrossRef]
- Nampak, H.; Pradhan, B.; Manap, M.A. Application of GIS based data driven evidential belief function model to predict groundwater potential zonation. J. Hydrol. 2014, 513, 283–300. [Google Scholar] [CrossRef]
- Park, I.; Kim, Y.; Lee, S. Groundwater Productivity Potential Mapping Using Evidential Belief Function. Groundwater 2014, 52, 201–207. [Google Scholar] [CrossRef]
- Mogaji, K.A.; Lim, H.S.; Abdullah, K. Regional prediction of groundwater potential mapping in a multifaceted geology terrain using GIS-based Dempster–Shafer model. Arab. J. Geosci. 2015, 8, 3235–3258. [Google Scholar] [CrossRef]
- Al-Abadi, A.M. Groundwater potential mapping at northeastern Wasit and Missan governorates, Iraq using a data-driven weights of evidence technique in framework of GIS. Environ. Earth Sci. 2015, 74, 1109–1124. [Google Scholar] [CrossRef]
- Mogaji, K.A.; Omosuyi, G.O.; Adelusi, A.O.; Lim, H.S. Application of GIS-Based Evidential Belief Function Model to Regional Groundwater Recharge Potential Zones Mapping in Hardrock Geologic Terrain. Environ. Process. 2016, 3, 93–123. [Google Scholar] [CrossRef]
- Rahmati, O.; Pourghasemi, H.R.; Melesse, A.M. Application of GIS-based data driven random forest and maximum entropy models for groundwater potential mapping: A case study at Mehran Region, Iran. Catena 2016, 137, 360–372. [Google Scholar] [CrossRef]
- Pourghasemi, H.R.; Beheshtirad, M. Assessment of a data-driven evidential belief function model and GIS for groundwater potential mapping in the Koohrang Watershed, Iran. Geocarto Int. 2014, 30, 662–685. [Google Scholar] [CrossRef]
- Naghibi, S.A.; Ahmadi, K.; Daneshi, A. Application of support vector machine, random forest, and genetic algorithm optimized randomforest models in groundwater potential mapping. Water Resour. Manag. 2017, 31, 2761–2775. [Google Scholar] [CrossRef]
- Lee, S.; Hong, S.-M.; Jung, H.-S. GIS-based groundwater potential mapping using artificial neural network and support vector machine models: The case of Boryeong city in Korea. Geocarto Int. 2017, 33, 847–861. [Google Scholar] [CrossRef]
- Arnold, R.S. Groundwater Potential Mapping Using Maximum Entropy. In Water Resources Management and Sustainability; Kumar, P., Nigam, G.K., Sinha, M.K., Singh, A., Eds.; Springer: Berlin/Heidelberg, Germany, 2022. [Google Scholar]
- Zeng, Z.; Li, Y.; Lan, J.; Hamidi, A.R. Utilizing User-Generated Content and GIS for Flood Susceptibility Modeling in Mountainous Areas: A Case Study of Jian City in China. Sustainability 2021, 13, 6929. [Google Scholar] [CrossRef]
- Lin, J.; He, P.; Yang, L.; He, X.; Lu, S.; Liu, D. Predicting future urban waterlogging-prone areas by coupling the maximum entropy and FLUS model. Sustain. Cities Soc. 2022, 80, 103812. [Google Scholar] [CrossRef]
- Jaafarzadeh, M.S.; Tahmasebipour, N.; Haghizadeh, A.; Pourghasemi, H.R.; Rouhani, H. Groundwater recharge potential zonation using an ensemble of machine learning and bivariate statistical models. Sci. Rep. 2021, 11, 5587. [Google Scholar] [CrossRef] [PubMed]
- Razandi, Y.; Pourghasemi, H.R.; Neisani, N.S.; Rahmati, O. Application of analytical hierarchy process, frequency ratio, and certainty factor models for groundwater potential mapping using GIS. Earth Sci. Inform. 2015, 8, 867–883. [Google Scholar] [CrossRef]
- Arshad, A.; Zhang, Z.; Zhang, W.; Dilawar, A. Mapping favorable groundwater potential recharge zones using a GIS-based analytical hierarchical process and probability frequency ratio model: A case study from an agro-urban region of Pakistan. Geosci. Front. 2020, 11, 1805–1819. [Google Scholar] [CrossRef]
- Neshat, A.; Pradhan, B. An integrated DRASTIC model using frequency ratio and two new hybrid methods for groundwater vulnerability assessment. Nat. Hazards 2015, 76, 543–563. [Google Scholar] [CrossRef] [Green Version]
- Das, S. Comparison among influencing factor, frequency ratio, and analytical hierarchy process techniques for groundwater potential zonation in Vaitarna basin, Maharashtra, India. Groundw. Sustain. Dev. 2019, 8, 617–629. [Google Scholar] [CrossRef]
- Urqueta, H.; Jódar, J.; Herrera, C.; Wilke, H.G.; Medina, A.; Urrutia, J.; Custodio, E.; Rodríguez, J. Land surface temperature as an indicator of the unsaturated zone thickness: A remote sensing approach in the Atacama Desert. Sci. Total Environ. 2018, 612, 1234–1248. [Google Scholar] [CrossRef] [PubMed]
- Siahkamari, S.; Haghizadeh, A.; Zeinivand, H.; Tahmasebipour, N.; Rahmati, O. Spatial prediction of food-susceptible areas using frequency ratio and maximum entropy models. Geocarto Int. 2018, 33, 927–941. [Google Scholar] [CrossRef]
- Liu, G. On the geo-basis of river regulation in the lower reaches of the Yellow River. Sci. China Earth Sci. 2012, 55, 530–544. [Google Scholar] [CrossRef]
- Zhi, C.; Cao, W.; Wang, Z.; Li, Z.; Ren, Y. Genesis of As in the groundwater with extremely high salinity in the Yellow River Delta, China. Appl. Geochem. 2022, 139, 105229. [Google Scholar] [CrossRef]
- Liu, Y.; Huang, H.-J. Characterization and mechanism of regional land subsidence in the Yellow River Delta, China. Nat. Hazards 2013, 68, 687–709. [Google Scholar] [CrossRef]
- O’Callaghan, J.F.; Mark, D.M. The extraction of drainage networks from digital elevation data. Comput. Vis. Graph. Image Process. 1984, 28, 323–344. [Google Scholar] [CrossRef]
- Tehrany, M.S.; Kumar, L. The application of a Dempster–Shafer-based evidential belief function in flood susceptibility mapping and comparison with frequency ratio and logistic regression methods. Environ. Earth Sci. 2018, 77, 490. [Google Scholar] [CrossRef]
- Bui, D.T.; Pradhan, B.; Lofman, O.; Revhaug, I.; Dick, O.B. Spatial prediction of landslide hazards in Hoa Binh province (Vietnam): A comparative assessment of the efficacy of evidential belief functions and fuzzy logic models. Catena 2012, 96, 28–40. [Google Scholar]
- Pradhan, B.; Abokharima, M.H.; Jebur, M.N.; Tehrany, M.S. Land subsidence susceptibility mapping at Kinta Valley (Malaysia) using the evidential belief function model in GIS. Nat. Hazards 2014, 73, 1019–1042. [Google Scholar] [CrossRef]
- Devkota, K.C.; Regmi, A.D.; Pourghasemi, H.R.; Yoshida, K.; Pradhan, B.; Ryu, I.C.; Dhital, M.R.; Althuwaynee, O.F. Landslide susceptibility mapping using certainty factor, index of entropy and logistic regression models in GIS and their comparison at Mugling–Narayanghat road section in Nepal Himalaya. Nat. Hazards 2013, 65, 135–165. [Google Scholar] [CrossRef]
- Ahmadi, H.; Kaya, O.A.; Babadagi, E.; Savas, T.; Pekkan, E. GIS-Based Groundwater Potentiality Mapping Using AHP and FR Models in Central Antalya, Turkey. Environ. Sci. Proc. 2021, 5, 11. [Google Scholar]
- Mallick, J.; Al-Wadi, H.; Rahman, A.; Ahmed, M. Landscape dynamic characteristics using satellite data for a mountainous watershed of Abha, Kingdom of Saudi Arabia. Environ. Earth Sci. 2014, 72, 4973–4984. [Google Scholar] [CrossRef]
- Al Saud, M. Mapping potential areas for groundwater storage in Wadi Aurnah Basin, western Arabian Peninsula, using remote sensing and geographic information system techniques. Hydrogeol. J. 2018, 18, 1481–1495. [Google Scholar] [CrossRef]
- Gupta, M.; Srivastava, P.K. Integrating GIS and remote sensing for identification of groundwater potential zones in the hilly terrain of Pavagarh, Gujarat, India. Water Int. 2010, 35, 233–245. [Google Scholar] [CrossRef]
- Rawat, K.S.; Singh, S.K.; Singh, M.I.; Garg, B. Comparative evaluation of vertical accuracy of elevated points with ground control points from ASTERDEM and SRTMDEM with respect to CARTOSAT-1DEM. Remote Sens. Appl. Soc. Environ. 2018, 13, 289–297. [Google Scholar] [CrossRef]
- Jasrotia, A.S.; Bhagat, B.D.; Kumar, A.; Kumar, R. Remote sensing and GIS approach for delineation of groundwater potential and ground water quality zones of western Doon Valley, Uttarakhand, India. J. Indian Soc. Remote Sens. 2012, 41, 365–377. [Google Scholar] [CrossRef]
- Deepika, B.; Avinash, K.; Jayappa, K.S. Integration of hydrological factors and demarcation of groundwater prospect zones: Insights from remote sensing and GIS techniques. Environ. Earth Sci. 2013, 70, 1319–1338. [Google Scholar] [CrossRef]
- Fashae, O.A.; Tijani, M.N.; Talabi, A.O.; Adedeji, O.I. Delineation of groundwater potential zones in the crystalline basement terrain of SW-Nigeria: An integrated GIS and remote sensing approach. Appl. Water Sci. 2013, 4, 19–38. [Google Scholar] [CrossRef] [Green Version]
- Sikakwe, G.U.; Ntekim, E.E.U.; Obi, D.A.; George, A.M. Geohydrological study of weathered basement aquifers in Oban massif and environs southeastern Nigeria: Using remote sensing and geographic information system techniques. IOSR J. Appl. Geol. Geophys. 2015, 3, 321–990. [Google Scholar]
- Ahmad, N.; Khan, S.; Ehsan, M.; Rehman, F.U.; Al-Shuhail, A. Estimating the Total Volume of Running Water Bodies Using Geographic Information System (GIS): A Case Study of Peshawar Basin (Pakistan). Sustainability 2022, 14, 3754. [Google Scholar] [CrossRef]
- Gaur, S.; Chahar, B.; Graillot, D. Combined use of groundwater modeling and potential zone analysis for management of groundwater. Int. J. Appl. Earth Obs. Geoinf. 2011, 13, 127–139. [Google Scholar] [CrossRef]
- Kalantar, B.; Al-Najjar, H.A.H.; Pradhan, B.; Saeidi, V.; Halin, A.A.; Ueda, N.; Naghibi, S.A. Optimized Conditioning Factors Using Machine Learning Techniques for Groundwater Potential Mapping. Water 2019, 11, 1909. [Google Scholar] [CrossRef] [Green Version]
- Jaiswal, R.K.; Mukherjee, S.; Krishnamurthy, J.; Saxena, R. Role of remote sensing and GIS techniques for generation of groundwater prospect zones towards rural development-an approach. Int. J. Remote Sens. 2003, 24, 993–1008. [Google Scholar] [CrossRef]
- Prasad, R.K.; Mondal, N.C.; Banerjee, P.; Nandakumar, M.V.; Singh, V.S. Deciphering potential groundwater zone in hard rock through the application of GIS. Environ. Geol. 2007, 55, 467–475. [Google Scholar] [CrossRef]
- Manap, M.A.; Sulaiman, W.N.A.; Ramli, M.F.; Pradhan, B.; Surip, N. A knowledge-driven GIS modeling technique for groundwater potential mapping at the Upper Langat Basin, Malaysia. Arab. J. Geosci. 2013, 6, 1621–1637. [Google Scholar] [CrossRef]
- Murthy, K.S.R. Groundwater potential in a semi-arid region of Andhra Pradesh: A geographical information system approach. Int. J. Remote Sens. 2000, 21, 1867–1884. [Google Scholar] [CrossRef]
- Yeh, H.-F.; Lee, C.-H.; Hsu, K.-C.; Chang, P.-H. GIS for the assessment of the groundwater recharge potential zone. Environ. Geol. 2009, 58, 185–195. [Google Scholar] [CrossRef]
- Pinto, D.; Shrestha, S.; Babel, M.S.; Ninsawat, S. Delineation of groundwater potential zones in the Comoro watershed, Timor Leste using GIS, remote sensing and analytichierarchy process (AHP) technique. Appl. Water Sci. 2017, 7, 503–519. [Google Scholar] [CrossRef] [Green Version]
- Selvam, S.; Dar, F.A.; Magesh, N.S.; Singaraja, C.; Venkatramanan, S.; Chung, S.Y. Application of remote sensing and GIS for delineating groundwater recharge potential zones of Kovilpatti Municipality, Tamil Nadu using IF technique. Earth Sci. Inform. 2016, 9, 137–150. [Google Scholar] [CrossRef]
- Kumar, P.K.D.; Gopinath, G.; Seralathan, P. Application of remote sensing and GIS for the demarcation of groundwater potential zones of a river basin in Kerala, southwest coast of India. Int. J. Remote Sens. 2007, 28, 5583–5601. [Google Scholar] [CrossRef]
- Magesh, N.; Chandrasekar, N.; Soundranayagam, J.P. Delineation of groundwater potential zones in Theni district, Tamil Nadu, using remote sensing, GIS and MIF techniques. Geosci. Front. 2012, 3, 189–196. [Google Scholar] [CrossRef] [Green Version]
- Chowdhury, A.; Jha, M.K.; Chowdary, V.M.; Mal, B.C. Integrated remote sensing and GIS-based approach for assessing groundwater potential in West Medinipur district, West Bengal, India. Int. J. Remote Sens. 2009, 30, 231–250. [Google Scholar] [CrossRef]
- Winzeler, H.E.; Owens, P.R.; Read, Q.D.; Libohova, Z.; Ashworth, A.; Sauer, T. Topographic Wetness Index as a Proxy for Soil Moisture in a Hillslope Catena: Flow Algorithms and Map Generalization. Land 2022, 11, 2018. [Google Scholar] [CrossRef]
- Pourali, S.H.; Arrowsmith, C.; Chrisman, N.; Matkan, A.A.; Mitchell, D. Topography wetness index application in flood-risk-based land use planning. Appl. Spat. Anal. Policy 2016, 9, 39–54. [Google Scholar] [CrossRef]
- Lee, S.; Pradhan, B. Landslide hazard mapping at Selangor, Malaysia using frequency ratio and logistic regression models. Landslides 2007, 4, 33–41. [Google Scholar] [CrossRef]
- Moore, I.D.; Grayson, R.B.; Ladson, A.R. Digital terrain modelling: A review of hydrological, geomorphological, and biological applications. Hydrol. Process. 1991, 5, 3–30. [Google Scholar] [CrossRef]
- Hojati, M.; Mokarram, M. Determination of a topographic wetness index using high-resolution digital elevation models. Eur. J. Geogr. 2016, 7, 41–52. [Google Scholar]
- Neilson, B.T.; Cardenas, M.B.; O’Connor, M.T.; Rasmussen, M.T.; King, T.V.; Kling, G.W. Groundwater flow and exchange across the land surface explain carbon export patterns in continuous permafrost watersheds. Geophys. Res. Lett. 2018, 45, 7596–7605. [Google Scholar] [CrossRef] [Green Version]
- Cao, C.; Xu, P.; Wang, Y.; Chen, J.; Zheng, L.; Niu, C. Flash Flood Hazard Susceptibility Mapping Using Frequency Ratio and Statistical Index Methods in Coalmine Subsidence Areas. Sustainability 2016, 8, 948. [Google Scholar] [CrossRef] [Green Version]
- Alarifi, S.S.; Abdekareem, M.; Abdalla, F.; Alotaibi, M. Mapping Susceptible Areas to Flash Flood Hazards Using Remote Sensing and GIS Techniques in the Southwest Part of Saudi Arabia. Sustainability 2022, 14, 14145. [Google Scholar] [CrossRef]
- Benjmel, K.; Amraoui, F.; Boutaleb, S.; Ouchchen, M.; Tahiri, A.; Touab, A. Mapping of groundwater potential zones in crystalline terrain using remote sensing, GIS techniques, and multicriteria data analysis (case of the Ighremregion, western Anti-Atlas, Morocco). Water 2020, 12, 471. [Google Scholar] [CrossRef] [Green Version]
- Golkarian, A.; Rahmati, O. Use of a maximum entropy model to identify the key factors that influence groundwater availability on the Gonabad Plain, Iran. Environ. Earth Sci. 2018, 77, 369. [Google Scholar] [CrossRef]
- Abdelkareem, M.; El-Baz, F. Mode of formation of the Nile Gorge in northern Egypt: A study by DEM-SRTM data and GIS analysis. Geol. J. 2015, 51, 760–778. [Google Scholar] [CrossRef]
- Achu, A.L.; Reghunath, R.; Thomas, J. Mapping of Groundwater Recharge Potential Zones and Identification of Suitable Site Specific Recharge Mechanisms in a Tropical River Basin. J. Earth Syst. Environ. 2020, 4, 131–145. [Google Scholar] [CrossRef]
- Hung, L.Q.; Batelaan, O.; de Smedt, F. Lineament extraction and analysis, comparison of LANDSAT ETM and ASTER imagery. Case study: Suoimuoi tropical karst catchment, Vietnam. Proc. SPIE 2005, 5983, 59830–59831. [Google Scholar]
- Assatse, W.T.; Nouck, P.N.; Tabod, C.T.; Akame, J.M.; Biringanine, G.N. Hydrogeological activity of lineaments in Yaoundé Cameroon region using remote sensing and GIS techniques. Egypt. J. Remote Sens. Space Sci. 2016, 19, 49–60. [Google Scholar] [CrossRef] [Green Version]
- Pradhan, B. Groundwater potential zonation for basaltic watersheds using satellite remote sensing data and GIS techniques. Cent. Eur. J. Geosci. 2009, 1, 120–129. [Google Scholar] [CrossRef]
- Abdelkareem, M.; El-Baz, F. Remote sensing of Paleodrainage systems west of the Nile River, Egypt. J. Geocarto Int. 2017, 32, 541–555. [Google Scholar] [CrossRef]
- Dawood, F.; Akhtar, M.M.; Ehsan, M. Evaluating urbanization impact on stressed aquifer of Quetta Valley, Pakistan. Desalination Water Treat. 2021, 222, 103–113. [Google Scholar] [CrossRef]
- Hussein, A.-A.; Govindu, V.; Nigusse, A.G.M. Evaluation of groundwater potential using geospatial techniques. Appl. Water Sci. 2016, 7, 2447–2461. [Google Scholar] [CrossRef] [Green Version]
- Kumar, P.; Herath, S.; Avtar, R.; Takeuchi, K. Mapping of groundwater potential zones in Killinochi area, Sri Lanka, using GIS and remote sensing techniques. Sustain. Water Resour. Manag. 2016, 2, 419–430. [Google Scholar] [CrossRef] [Green Version]
- Sajjad, H.; Iqbal, M.; Bhat, F.A. Integrating geospatial and geophysical information for deciphering groundwater potential zones in Dudhganga catchment, Kashmir Valley, India. Am. J. Water Resour. 2014, 2, 18–24. [Google Scholar] [CrossRef]
- Fenta, A.A.; Kifle, A.; Gebreyohannes, T.; Hailu, G. Spatial analysis of groundwater potential using remote sensing and GIS-based multi criteria evaluation in Raya Valley, northern Ethiopia. Hydrogeol. J. 2014, 23, 195–206. [Google Scholar] [CrossRef]
- Gee, G.W.; Wierenga, P.J.; Andraski, B.; Young, M.H.; Fayer, M.J.; Rockhold, M.L. Variations in Water Balance and Recharge Potential at Three Western Desert Sites. Soil Sci. Soc. Am. J. 1994, 58, 63–72. [Google Scholar] [CrossRef]
- Prych, E.A. Using Chloride and Chlorine-36 as Soil-Water Tracers to Estimate Deep Percolation at Selected Locations on the US Department of Energy Hanford Site, Washington; US Geological Survey: Reston, VA, USA, 1998; Volume 2481.
- Senthilkumar, M.; Gnanasundar, D.; Arumugam, R. Identifying groundwater recharge zones using remote sensing & GIS techniques in Amaravathi aquifer system, Tamil Nadu, South India. Sustain. Environ. Res. 2019, 29, 15. [Google Scholar] [CrossRef]
- Singh, S.K.; Zeddies, M.; Shankar, U.; Griffiths, G.A. Potential groundwater recharge zones within New Zealand. Geosci. Front. 2019, 10, 1065–1072. [Google Scholar] [CrossRef]
- Abdekareem, M.; Al-Arifi, N.; Abdalla, F.; Mansour, A.; El-Baz, F. Fusion of Remote Sensing Data Using GIS-Based AHP-Weighted Overlay Techniques for Groundwater Sustainability in Arid Regions. Sustainability 2022, 14, 7871. [Google Scholar] [CrossRef]
- Adiat, K.A.N.; Nawawi, M.N.M.; Abdullah, K. Assessing th e accuracy of GIS-based elementary multi criteria de-cision analysis as a spatial prediction tool—A case of predicting potential zones of sustainable groundwater re-sources. J. Hydrol. 2012, 440, 75–89. [Google Scholar] [CrossRef]
- Janizadeh, S.; Avand, M.; Jaafari, A.; Van Phong, T.; Bayat, M.; Ahmadisharaf, E.; Prakash, I.; Pham, B.T.; Lee, S. Prediction Success of Machine Learning Methods for Flash Flood Susceptibility Mapping in the Tafresh Watershed, Iran. Sustainability 2019, 11, 5426. [Google Scholar] [CrossRef] [Green Version]
- Lee, S.; Pradhan, B. Probabilistic landslide hazards and risk mapping on Penang Island, Malaysia. J. Earth Syst. Sci. 2006, 115, 661–672. [Google Scholar] [CrossRef] [Green Version]
- Dempster, A.P. Upper and lower probabilities induced by a multivalued mapping. In Classic Works of the Dempster–Shafer Theory of Belief Functions; Springer: Berlin/Heidelberg, Germany, 2008; pp. 57–72. [Google Scholar]
- Shafer, G. A Mathematical Theory of Evidence; Princeton University Press: Princeton, NJ, USA, 1976. [Google Scholar]
- Dempster, A.P. New approaches for reasoning towards posterior distributions based on sample data. Ann. Math. Statist. 1966, 37, 355–374. [Google Scholar] [CrossRef]
- Tehrany, M.S.; Pradhan, B.; Jebur, M.N. Flood susceptibility mapping using a novel ensemble weights-of-evidence and support vector machine models in GIS. J. Hydrol. 2014, 512, 332–343. [Google Scholar] [CrossRef]
- Carranza, E.J.M.; Hale, M. Evidential belief functions for datadriven geologically constrained mapping of gold potential, Baguio district, Philippines. Ore Geol. Rev. 2003, 22, 117–132. [Google Scholar] [CrossRef]
- Hong, Y.; Abdelkareem, M. Integration of remote sensing and a GIS-based method for revealing prone areas to flood hazards and predicting optimum areas of groundwater resources. Arab. J. Geosci. 2022, 15, 114. [Google Scholar] [CrossRef]
- Zhang, Z.; Yang, F.; Chen, H.; Wu, Y.; Li, T.; Li, W.; Wang, Q.; Liu, P. GIS-based landslide susceptibility analysis using frequency ratio and evidential belief function models. Environ. Earth Sci. 2016, 75, 948. [Google Scholar] [CrossRef]
- Zhao, M.M.; Wang, S.-M.; Chen, Y.-P.; Wu, J.-H.; Xue, L.-G.; Fan, T.T. Pollution status of the Yellow River tributaries in middle and lower reaches. Sci. Total. Environ. 2020, 722, 137861. [Google Scholar] [CrossRef]
- Yellow River Conservancy Commission, Yellow River Water Resources Bulletin, 2017. Yellow River Conservancy Commission of MWR, China. Available online: http://www.yrcc.gov.cn/other/hhgb/ (accessed on 1 December 2022).


| No | Type of Data | Source | Date | Resolution |
|---|---|---|---|---|
| 1 | Landsat-8 OLI | USGS | 30 December 2021 | bands 2, 3, 4, 5, 6, and 7 (30 m) |
| 2 | Sentinel-1 | ESA/Copernicus | 18 October 2022 | bands 2, 3, 4, 8, (“10” m, 11, and 12 (“20” m) |
| 3 | SRTM DEM | USGS | 11–22 February 2000 | C-band (30 m) |
| 4 | Climatic Research Unit data | crudata.uea.ac.uk | 1 January 2011–1 January 2020 | 0.5 degrees in latitude and longitudes |
| Topography | No. Pixels in Domain | Domain % | No. Wells | No. Wells % | FR | N (Cij∩D)/N (Cij) | N (D) −N (Cij∩D) | N (T) −N (Cij) | N (D) −N (Cij∩D)/N (T) −N (Cij) | WcijD | Bel |
|---|---|---|---|---|---|---|---|---|---|---|---|
| 0 to 3 | 2,883,463 | 0.29345745 | 9 | 0.164 | 0.558 | 0.0000031 | 46 | 6,942,367 | 6.62598 × 10⁻⁶ | 0.471 | 0.029 |
| 3 to 7 | 4,720,324 | 0.48039952 | 23 | 0.418 | 0.870 | 0.0000049 | 32 | 5,105,506 | 6.26774 × 10⁻⁶ | 0.777 | 0.048 |
| 7 to 12 | 1,921,284 | 0.19553402 | 16 | 0.291 | 1.488 | 0.0000083 | 39 | 7,904,546 | 4.93387 × 10⁻⁶ | 1.688 | 0.104 |
| 12 to 19 | 281,047 | 0.02860288 | 6 | 0.109 | 3.814 | 0.0000213 | 49 | 9,544,783 | 5.13369 × 10⁻⁶ | 4.159 | 0.255 |
| 19 to 75 | 19,712 | 0.00200614 | 1 | 0.018 | 9.063 | 0.0000507 | 54 | 9,806,118 | 5.50677 × 10⁻⁶ | 9.212 | 0.565 |
| Slope | |||||||||||
| 0 to 1 | 4,010,495 | 0.40868454 | 26 | 0.473 | 1.157 | 0.0000065 | 29 | 5,802,685 | 4.99769 × 10⁻⁶ | 1.297 | 0.260 |
| 1 to 2 | 3,568,474 | 0.36364094 | 16 | 0.291 | 0.800 | 0.0000045 | 39 | 6,244,706 | 6.24529 × 10⁻⁶ | 0.718 | 0.144 |
| 2 to 3.6 | 1,889,910 | 0.19258895 | 9 | 0.164 | 0.850 | 0.0000048 | 46 | 7,923,270 | 5.80568 × 10⁻⁶ | 0.820 | 0.164 |
| 3.6 to 44 | 344,301 | 0.03508557 | 4 | 0.073 | 2.073 | 0.0000116 | 51 | 9,468,879 | 5.38607 × 10⁻⁶ | 2.157 | 0.432 |
| Slope ASPECT | |||||||||||
| Flat | 860,817 | 0.08772049 | 6 | 0.109 | 1.244 | 0.0000070 | 49 | 8,952,363 | 5.47342 × 10⁻⁶ | 1.273 | 0.117 |
| North | 950,349 | 0.09684414 | 4 | 0.073 | 0.751 | 0.0000042 | 51 | 8,862,831 | 5.75437 × 10⁻⁶ | 0.731 | 0.067 |
| Northeast | 857,199 | 0.08735181 | 7 | 0.127 | 1.457 | 0.0000082 | 48 | 8,955,981 | 5.35955 × 10⁻⁶ | 1.524 | 0.140 |
| East | 872,576 | 0.08891878 | 13 | 0.236 | 2.658 | 0.0000149 | 42 | 8,940,604 | 4.69767 × 10⁻⁶ | 3.171 | 0.291 |
| Southeast | 1,032,724 | 0.10523847 | 6 | 0.109 | 1.037 | 0.0000058 | 49 | 8,780,456 | 5.58058 × 10⁻⁶ | 1.041 | 0.095 |
| South | 808,454 | 0.08238451 | 3 | 0.055 | 0.662 | 0.0000037 | 52 | 9,004,726 | 5.77475 × 10⁻⁶ | 0.643 | 0.059 |
| Southwest | 972,047 | 0.09905525 | 2 | 0.036 | 0.367 | 0.0000021 | 53 | 8,841,133 | 5.99471 × 10⁻⁶ | 0.343 | 0.031 |
| West | 931,399 | 0.09491307 | 4 | 0.073 | 0.766 | 0.0000043 | 51 | 8,881,781 | 5.74209 × 10⁻⁶ | 0.748 | 0.069 |
| Northwest | 972,718 | 0.09912363 | 5 | 0.091 | 0.917 | 0.0000051 | 50 | 8,840,462 | 5.65581 × 10⁻⁶ | 0.909 | 0.083 |
| North | 1,554,897 | 0.15844986 | 5 | 0.091 | 0.574 | 0.0000032 | 50 | 8,258,283 | 6.05453 × 10⁻⁶ | 0.531 | 0.049 |
| Terrain Roughness Index (TRI) | |||||||||||
| 0.0 to 0.11 | 602,302 | 0.06124132 | 3 | 0.055 | 0.891 | 0.0000050 | 52 | 9,232,594 | 5.63222 × 10⁻⁶ | 0.884 | 0.169 |
| 0.11 to 0.31 | 869,074 | 0.08836636 | 6 | 0.109 | 1.235 | 0.0000069 | 49 | 8,965,822 | 5.4652 × 10⁻⁶ | 1.263 | 0.241 |
| 0.32 to 0.47 | 3,078,693 | 0.31303768 | 15 | 0.273 | 0.871 | 0.0000049 | 40 | 6,756,203 | 5.92049 × 10⁻⁶ | 0.823 | 0.157 |
| 0.48 to0.62 | 3,743,124 | 0.3805962 | 20 | 0.364 | 0.955 | 0.0000053 | 35 | 6,091,772 | 5.74545 × 10⁻⁶ | 0.930 | 0.177 |
| 0.63 to 0.89 | 1,541,703 | 0.15675844 | 11 | 0.200 | 1.276 | 0.0000071 | 44 | 8,293,193 | 5.30556 × 10⁻⁶ | 1.345 | 0.256 |
| Drainage Density | |||||||||||
| 5.821–53.57 | 10,128 | 0.12264619 | 6 | 0.109 | 0.889 | 0.0005924 | 49 | 72,451 | 0.000676319 | 0.876 | 0.210 |
| 53.58–101.3 | 27,266 | 0.3301808 | 23 | 0.418 | 1.267 | 0.0008435 | 32 | 55,313 | 0.000578526 | 1.458 | 0.350 |
| 101.4–149.1 | 26,864 | 0.32531273 | 16 | 0.291 | 0.894 | 0.0005956 | 39 | 55,715 | 0.000699991 | 0.851 | 0.204 |
| 149.2–196.8 | 15,257 | 0.18475642 | 10 | 0.182 | 0.984 | 0.0006554 | 45 | 67,322 | 0.000668429 | 0.981 | 0.235 |
| 196.9–244.6 | 3064 | 0.03710386 | 0 | 0.000 | 0.000 | 0.0000000 | 55 | 79,515 | 0.000691693 | 0.000 | 0.000 |
| TWI | |||||||||||
| −8.16 to −2.97 | 5,514,106 | 0.56190817 | 31 | 0.564 | 1.003 | 0.0000056 | 24 | 4,299,074 | 5.5826 × 10⁻⁶ | 1.007 | 0.341 |
| −2.97 to −0.25 | 3,128,986 | 0.31885546 | 18 | 0.327 | 1.026 | 0.0000058 | 37 | 6,684,194 | 5.53545 × 10⁻⁶ | 1.039 | 0.352 |
| 0.25 to 13.51 | 1,170,088 | 0.11923637 | 6 | 0.109 | 0.915 | 0.0000051 | 49 | 8,643,092 | 5.66927 × 10⁻⁶ | 0.904 | 0.307 |
| SPI | |||||||||||
| 0 to 0.001 | 9,290,340 | 0.94672063 | 53 | 0.964 | 1.018 | 0.0000057 | 2 | 522,840 | 3.82526 × 10⁻⁶ | 1.491 | 0.665 |
| 0.001 to 0.1 | 469,594 | 0.0478534 | 2 | 0.036 | 0.760 | 0.0000043 | 53 | 9,343,586 | 5.67234 × 10⁻⁶ | 0.751 | 0.335 |
| 0.1 to 34.002 | 53,246 | 0.00542597 | 0 | 0.000 | 0.000 | 0.0000000 | 55 | 9,759,934 | 5.63528 × 10⁻⁶ | 0.000 | 0.000 |
| Dist to Rivers | |||||||||||
| 0–400 | 23,750 | 0.28963768 | 18 | 0.327 | 1.130 | 0.0007579 | 37 | 58,249 | 0.000635204 | 1.193 | 0.294 |
| 400–800 | 28,423 | 0.34662618 | 19 | 0.345 | 0.997 | 0.0006685 | 36 | 53,576 | 0.000671943 | 0.995 | 0.246 |
| 800–1200 | 17,855 | 0.21774656 | 11 | 0.200 | 0.918 | 0.0006161 | 44 | 64,144 | 0.000685957 | 0.898 | 0.222 |
| 1200–1600 | 10,759 | 0.13120892 | 7 | 0.127 | 0.970 | 0.0006506 | 48 | 71,240 | 0.000673779 | 0.966 | 0.238 |
| 1600–1900 | 1212 | 0.01478067 | 0 | 0.000 | 0.000 | 0.0000000 | 55 | 80,787 | 0.000680803 | 0.000 | 0.000 |
| Lineaments | |||||||||||
| 0–12 | 3,273,187 | 0.34086999 | 21 | 0.382 | 1.120 | 0.0000064 | 34 | 6,329,263 | 5.37187 × 10⁻⁶ | 1.194 | 0.240 |
| 13–24 | 2,128,686 | 0.22168155 | 11 | 0.200 | 0.902 | 0.0000052 | 44 | 7,473,764 | 5.88726 × 10⁻⁶ | 0.878 | 0.176 |
| 25–35 | 2,256,503 | 0.23499242 | 11 | 0.200 | 0.851 | 0.0000049 | 44 | 7,345,947 | 5.9897 × 10⁻⁶ | 0.814 | 0.163 |
| 36–47 | 1,382,833 | 0.14400835 | 9 | 0.164 | 1.136 | 0.0000065 | 46 | 8,219,617 | 5.59637 × 10⁻⁶ | 1.163 | 0.234 |
| 48–59 | 561,241 | 0.05844769 | 3 | 0.055 | 0.933 | 0.0000053 | 52 | 9,041,209 | 5.75144 × 10⁻⁶ | 0.929 | 0.187 |
| Land cover | |||||||||||
| Water | 1,090,317 | 0.13192203 | 4 | 0.073 | 0.551 | 0.0000037 | 51 | 7,174,542 | 7.10847 × 10⁻⁶ | 0.516 | 0.186 |
| Vegetation | 3,325,930 | 0.40241824 | 24 | 0.436 | 1.084 | 0.0000072 | 31 | 4,938,929 | 6.27666 × 10⁻⁶ | 1.150 | 0.415 |
| Urbans | 3,848,612 | 0.46565973 | 27 | 0.491 | 1.054 | 0.0000070 | 28 | 4,416,247 | 6.34023 × 10⁻⁶ | 1.107 | 0.399 |
| NDVI | |||||||||||
| 0–66 | 729,152 | 0.08520368 | 2 | 0.036 | 0.427 | 0.0000027 | 53 | 7,828,600 | 6.77005 × 10⁻⁶ | 0.405 | 0.084 |
| 66–131 | 736,815 | 0.08609913 | 4 | 0.073 | 0.845 | 0.0000054 | 51 | 7,820,937 | 6.52096 × 10⁻⁶ | 0.833 | 0.172 |
| 131–174 | 2,407,709 | 0.2813483 | 18 | 0.327 | 1.163 | 0.0000075 | 37 | 6,150,043 | 6.01622 × 10⁻⁶ | 1.243 | 0.257 |
| 174–210 | 3,376,062 | 0.39450337 | 19 | 0.345 | 0.876 | 0.0000056 | 36 | 5,181,690 | 6.94754 × 10⁻⁶ | 0.810 | 0.167 |
| 210–255 | 1,308,014 | 0.15284551 | 12 | 0.218 | 1.427 | 0.0000092 | 43 | 7,249,738 | 5.93125 × 10⁻⁶ | 1.547 | 0.320 |
| Rainfall | |||||||||||
| 567.4–575.8 | 2,944,227 | 0.32047756 | 24 | 0.436 | 1.362 | 0.0000082 | 31 | 6,242,772 | 4.96574 × 10⁻⁶ | 1.642 | 0.282 |
| 575.9–584.2 | 3,573,148 | 0.38893528 | 13 | 0.236 | 0.608 | 0.0000036 | 42 | 5,613,851 | 7.4815 × 10⁻⁶ | 0.486 | 0.083 |
| 584.2–592.5 | 1,041,162 | 0.11332994 | 3 | 0.055 | 0.481 | 0.0000029 | 52 | 8,145,837 | 6.38363 × 10⁻⁶ | 0.451 | 0.077 |
| 592.5–600.9 | 855,039 | 0.09307054 | 8 | 0.145 | 1.563 | 0.0000094 | 47 | 8,331,960 | 5.64093 × 10⁻⁶ | 1.659 | 0.285 |
| 601–609.3 | 773,423 | 0.08418669 | 7 | 0.127 | 1.512 | 0.0000091 | 48 | 8,413,576 | 5.70507 × 10⁻⁶ | 1.586 | 0.272 |
| GWPZ | Area FR % | Area EBF % | Area EBF + FR % |
|---|---|---|---|
| Very low | 23.67 | 23.60 | 22.89 |
| Low | 40.60 | 41.62 | 39.94 |
| Moderate | 26.44 | 24.44 | 26.22 |
| High | 8.90 | 9.57 | 8.98 |
| Very high | 0.39 | 0.78 | 1.97 |
Disclaimer/Publisher’s Note: The statements, opinions and data contained in all publications are solely those of the individual author(s) and contributor(s) and not of MDPI and/or the editor(s). MDPI and/or the editor(s) disclaim responsibility for any injury to people or property resulting from any ideas, methods, instructions or products referred to in the content. |
© 2023 by the authors. Licensee MDPI, Basel, Switzerland. This article is an open access article distributed under the terms and conditions of the Creative Commons Attribution (CC BY) license (https://creativecommons.org/licenses/by/4.0/).
Share and Cite
Li, Y.; Abdelkareem, M.; Al-Arifi, N. Mapping Potential Water Resource Areas Using GIS-Based Frequency Ratio and Evidential Belief Function. Water 2023, 15, 480. https://doi.org/10.3390/w15030480
Li Y, Abdelkareem M, Al-Arifi N. Mapping Potential Water Resource Areas Using GIS-Based Frequency Ratio and Evidential Belief Function. Water. 2023; 15(3):480. https://doi.org/10.3390/w15030480
Chicago/Turabian StyleLi, Yang, Mohamed Abdelkareem, and Nasir Al-Arifi. 2023. "Mapping Potential Water Resource Areas Using GIS-Based Frequency Ratio and Evidential Belief Function" Water 15, no. 3: 480. https://doi.org/10.3390/w15030480