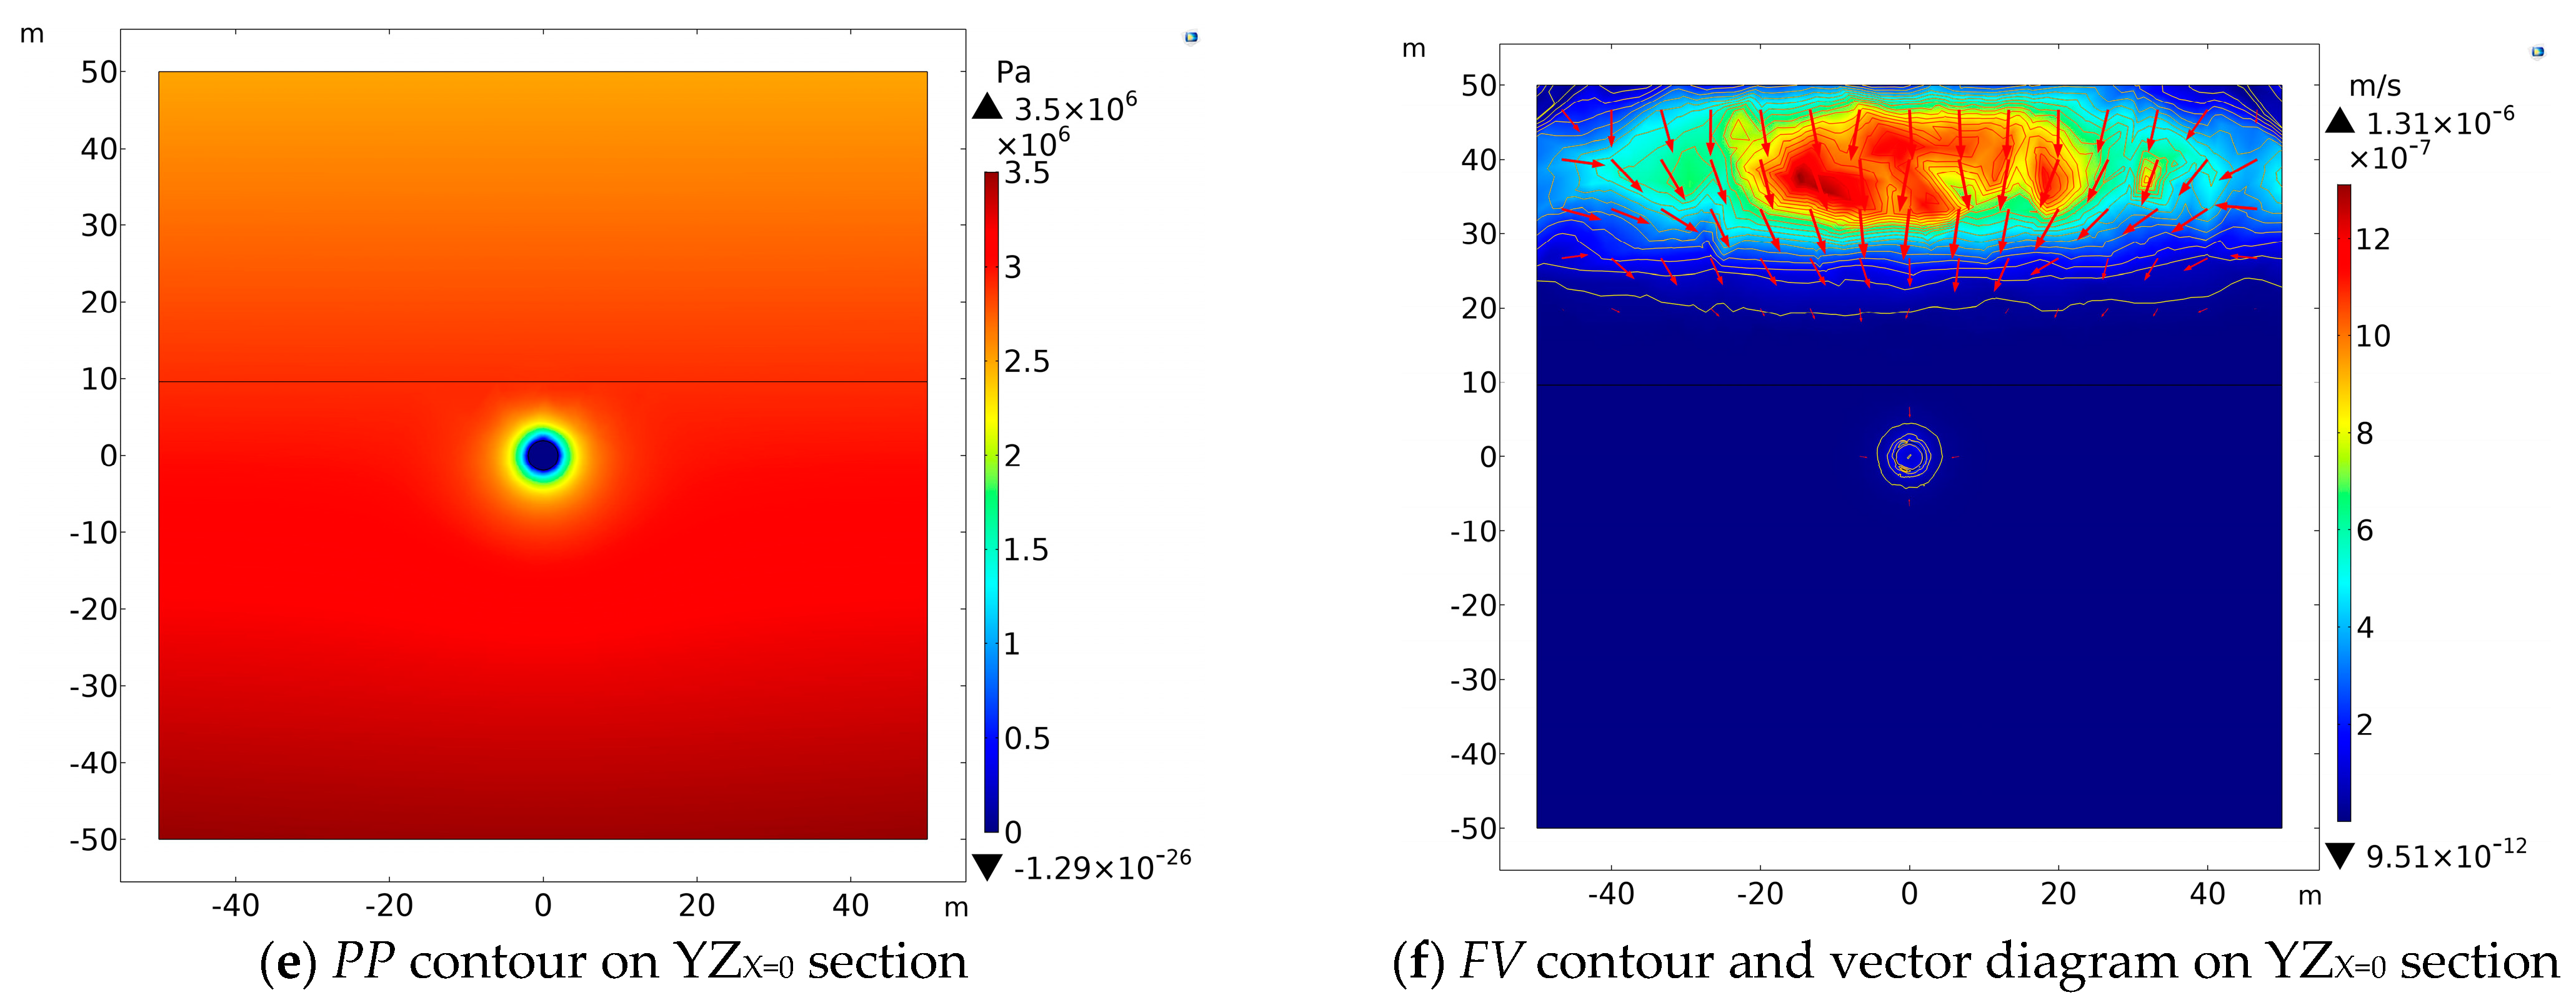
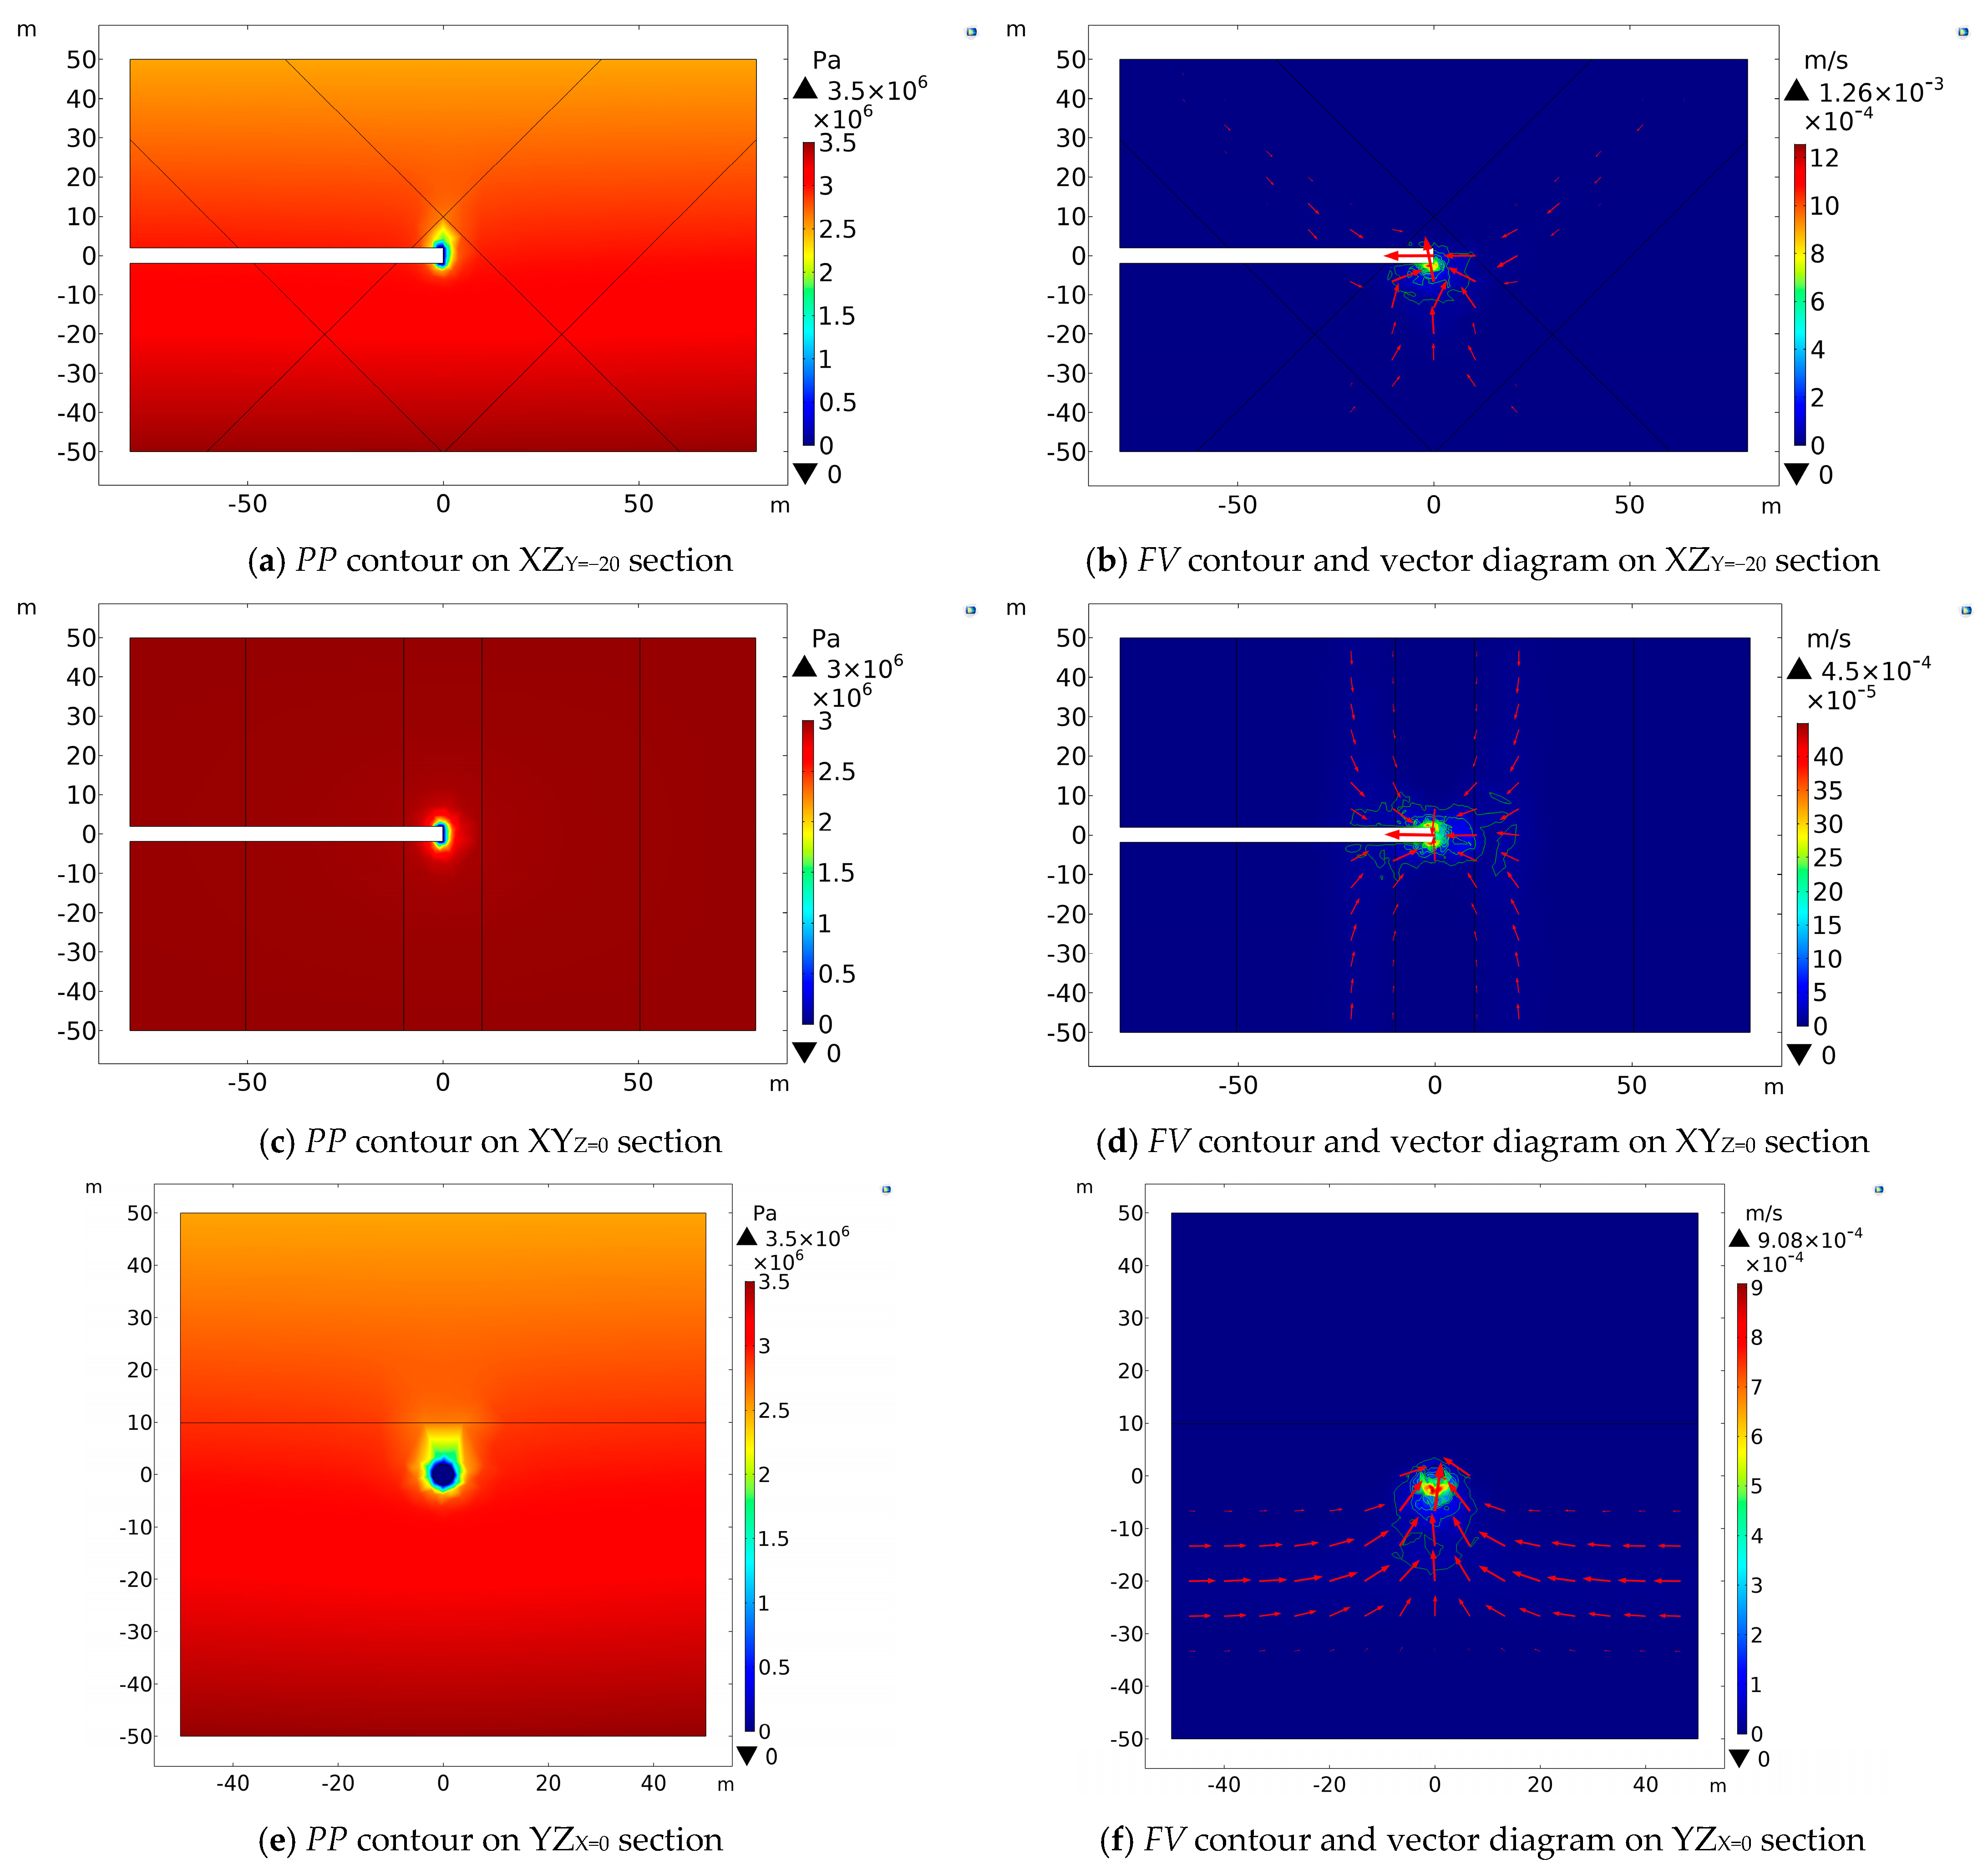
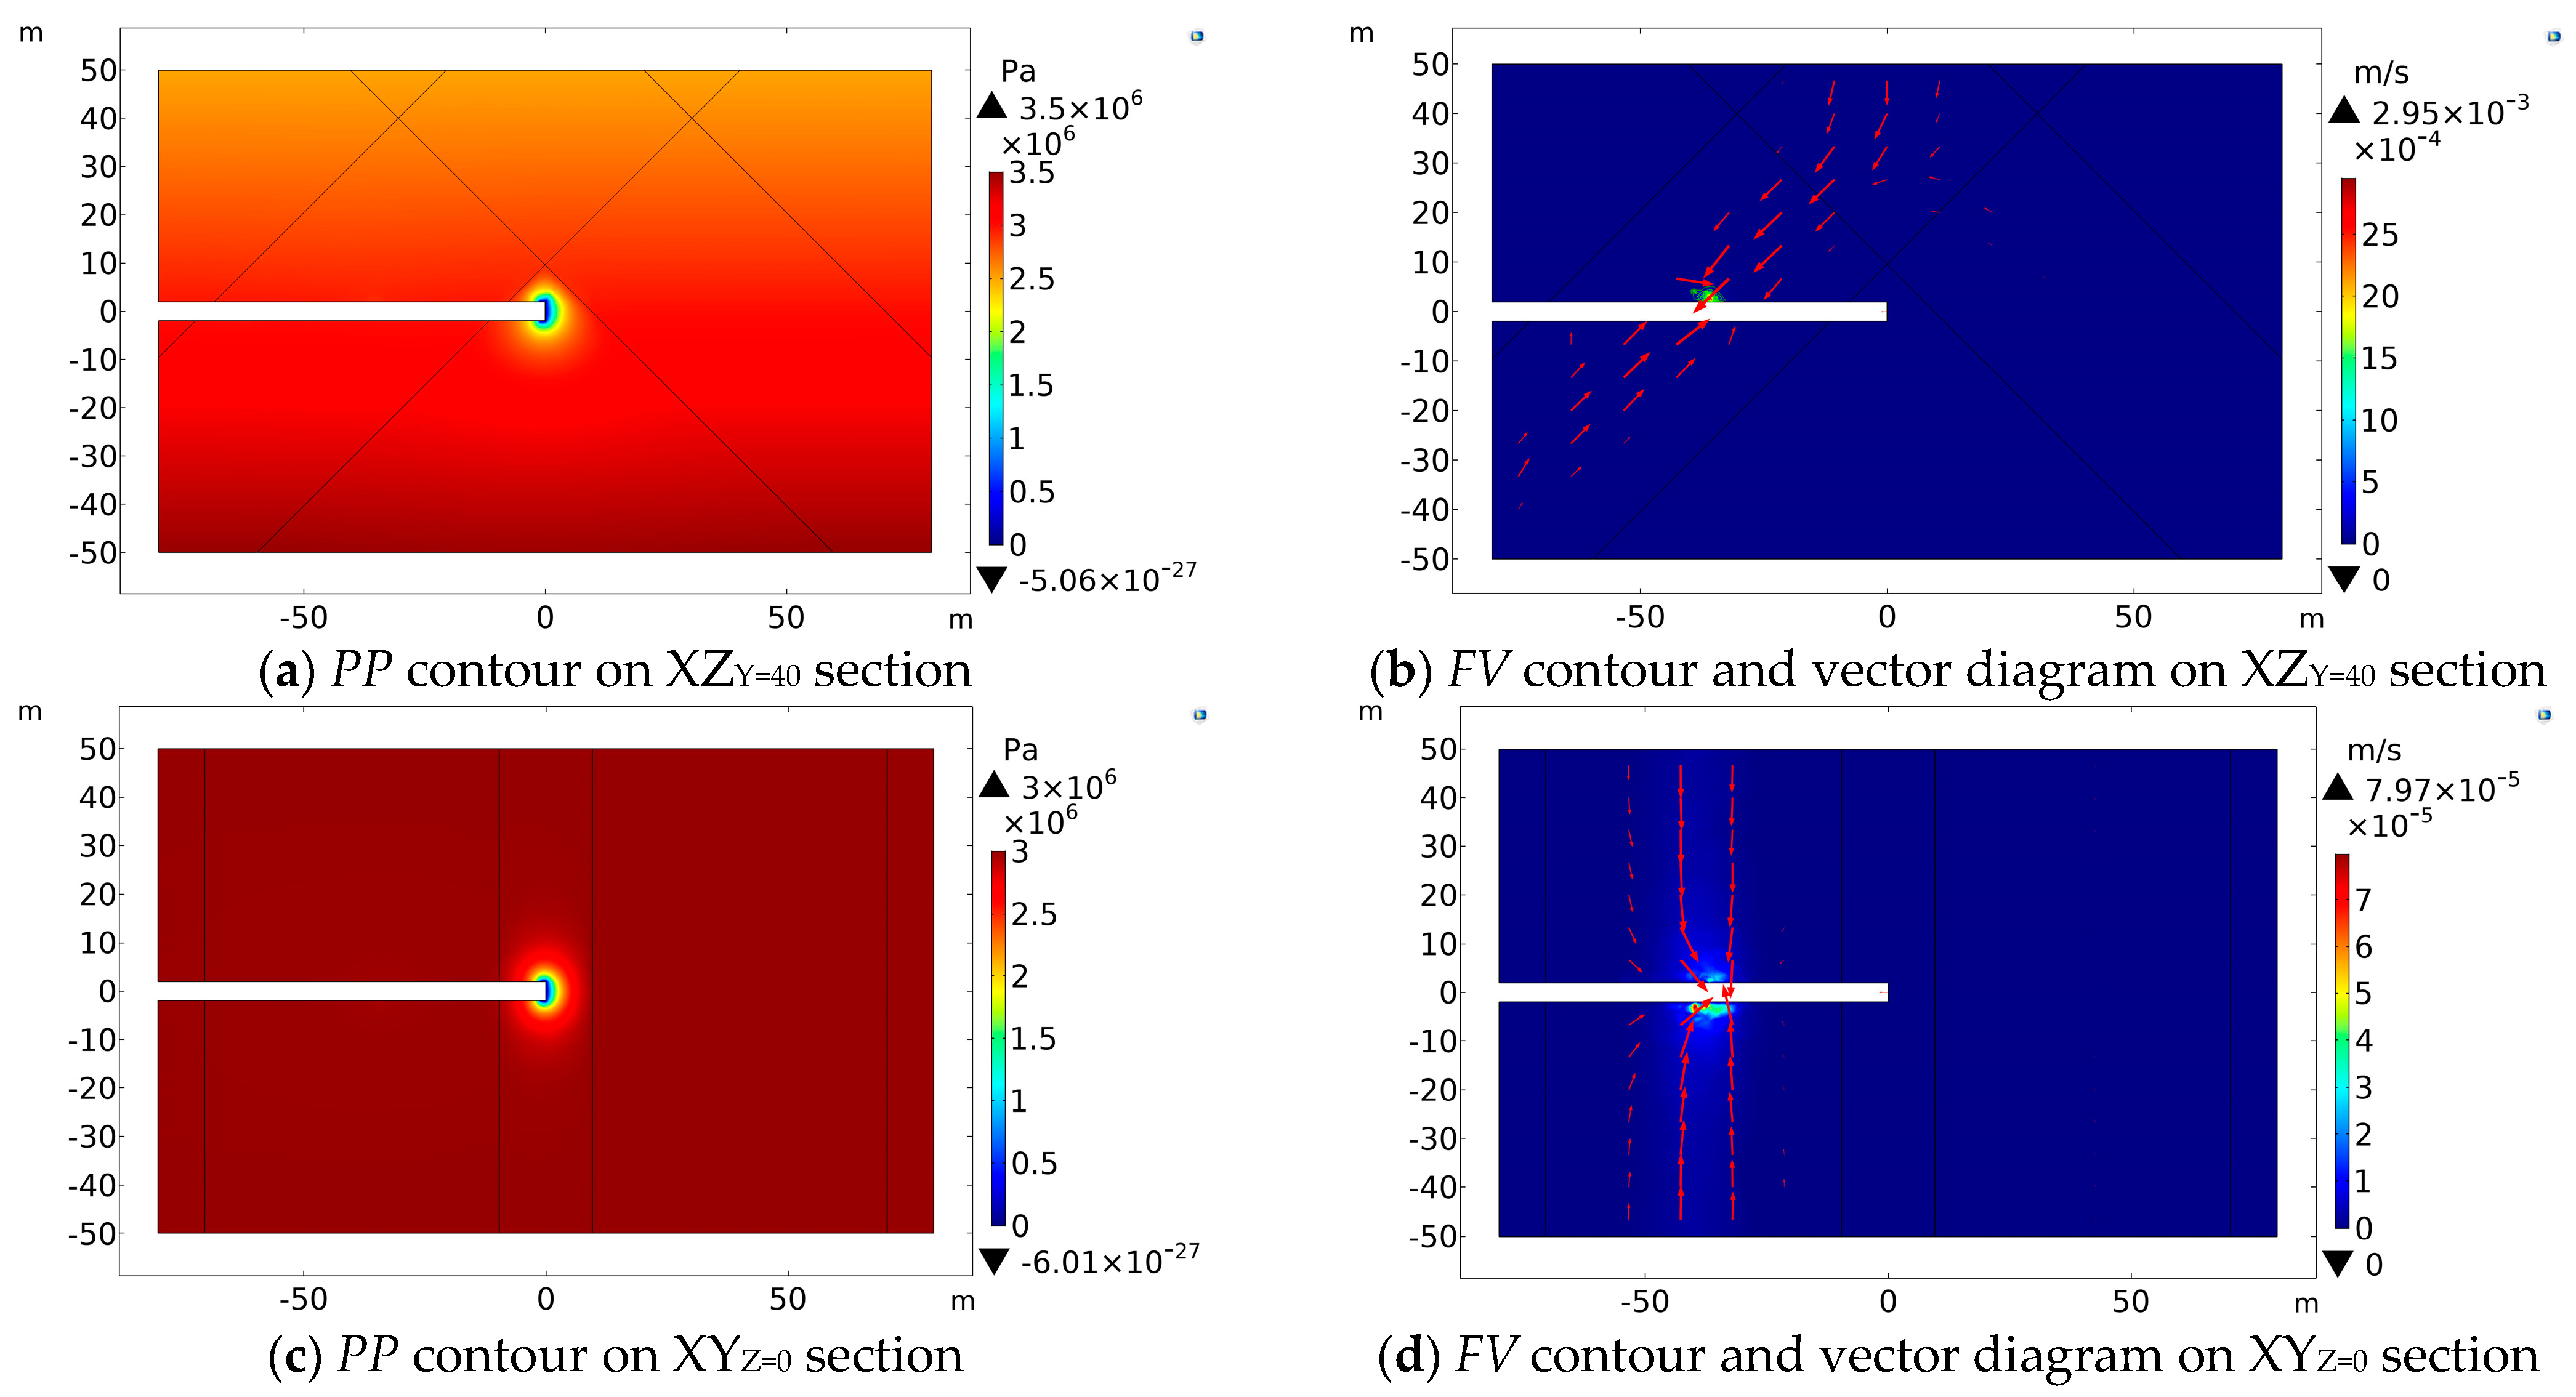
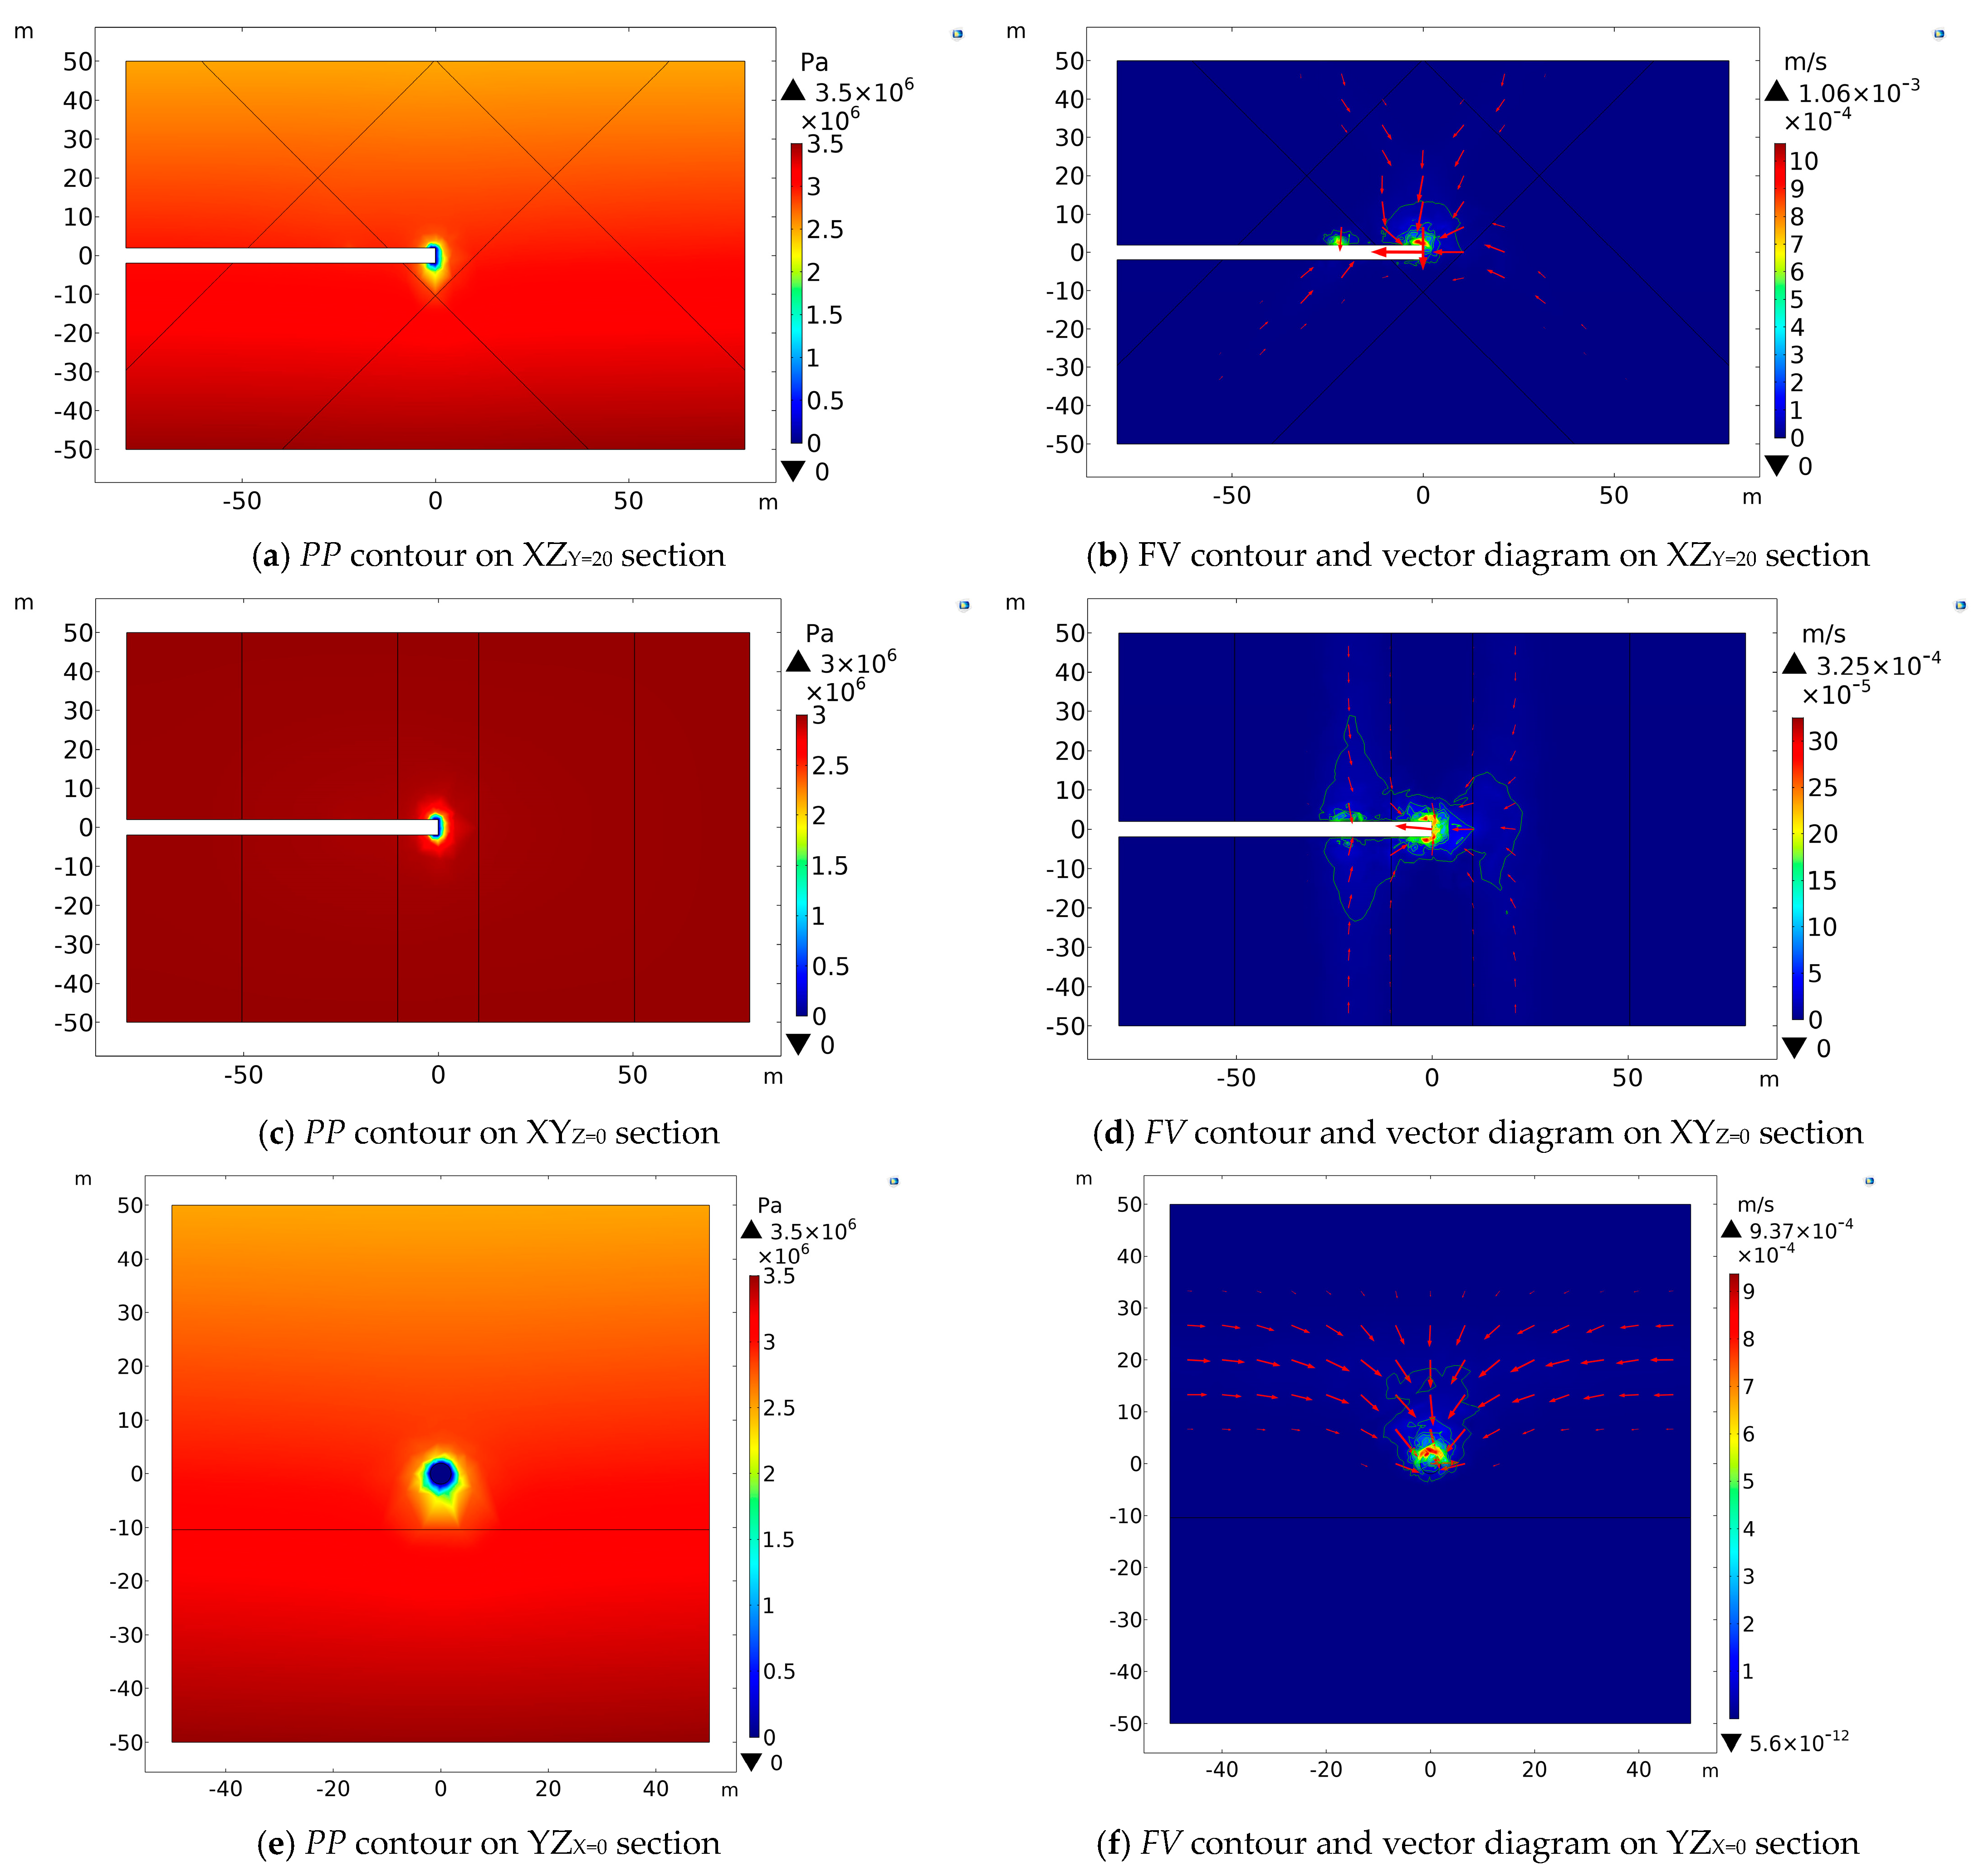
3.1. Tunnel Is 40 m Beneath the Center of the Two Intersecting Faults
Figure 2 reveals
PP contours and
FV contours on various sections (XZ
Y = 40, XY
Z = 0, YZ
X = 0) while the tunnel is excavated to 40 m beneath these two intersecting faults (Y = 40).
The
PP contours in
Figure 2a,c,e show that a low-pressure region appears at the excavation face and on the tunnel wall within 1.0 m rearwards and the
PP increases outward with the increases in distance. On the cross-section of XZ
Y = 0,
PP contours are distributed elliptically symmetrically along the
x-axis, and the ellipse’s major axis is parallel to the
z-axis. In the vertical downward direction, the
PP value gradually increases with the burial depth of the tunnel in a circular or semicircular distribution nearby the tunnel face, as can be seen in the cross-section of YZ
X = 0. The
FV contours reveal that the groundwater flow direction is from the fault intersection zone and the damage zone to the tunnel excavation face, and the FV value is small with a maximum of 2.95 × 10
−3 m/s. The
FV contours are symmetrically distributed with respect to the
x-axis on the cross section of XZY = 40 and the
y-axis on the cross section of YZ
X = 0. While the tunnel excavation face arrived at 40 m directly below the overlapped intersection center, the
PP near the excavation face and the tunnel wall about 1 m behind dissipated, forming a low-pressure zone. Therefore, groundwater is more likely to seep into the vicinity of the tunnel face. The permeability of the fault core zone and fault damage zone is much bigger than that of the host rock zone on either side, so the direction of the groundwater seepage is from the fault intersection zone and damage zone to the tunnel.
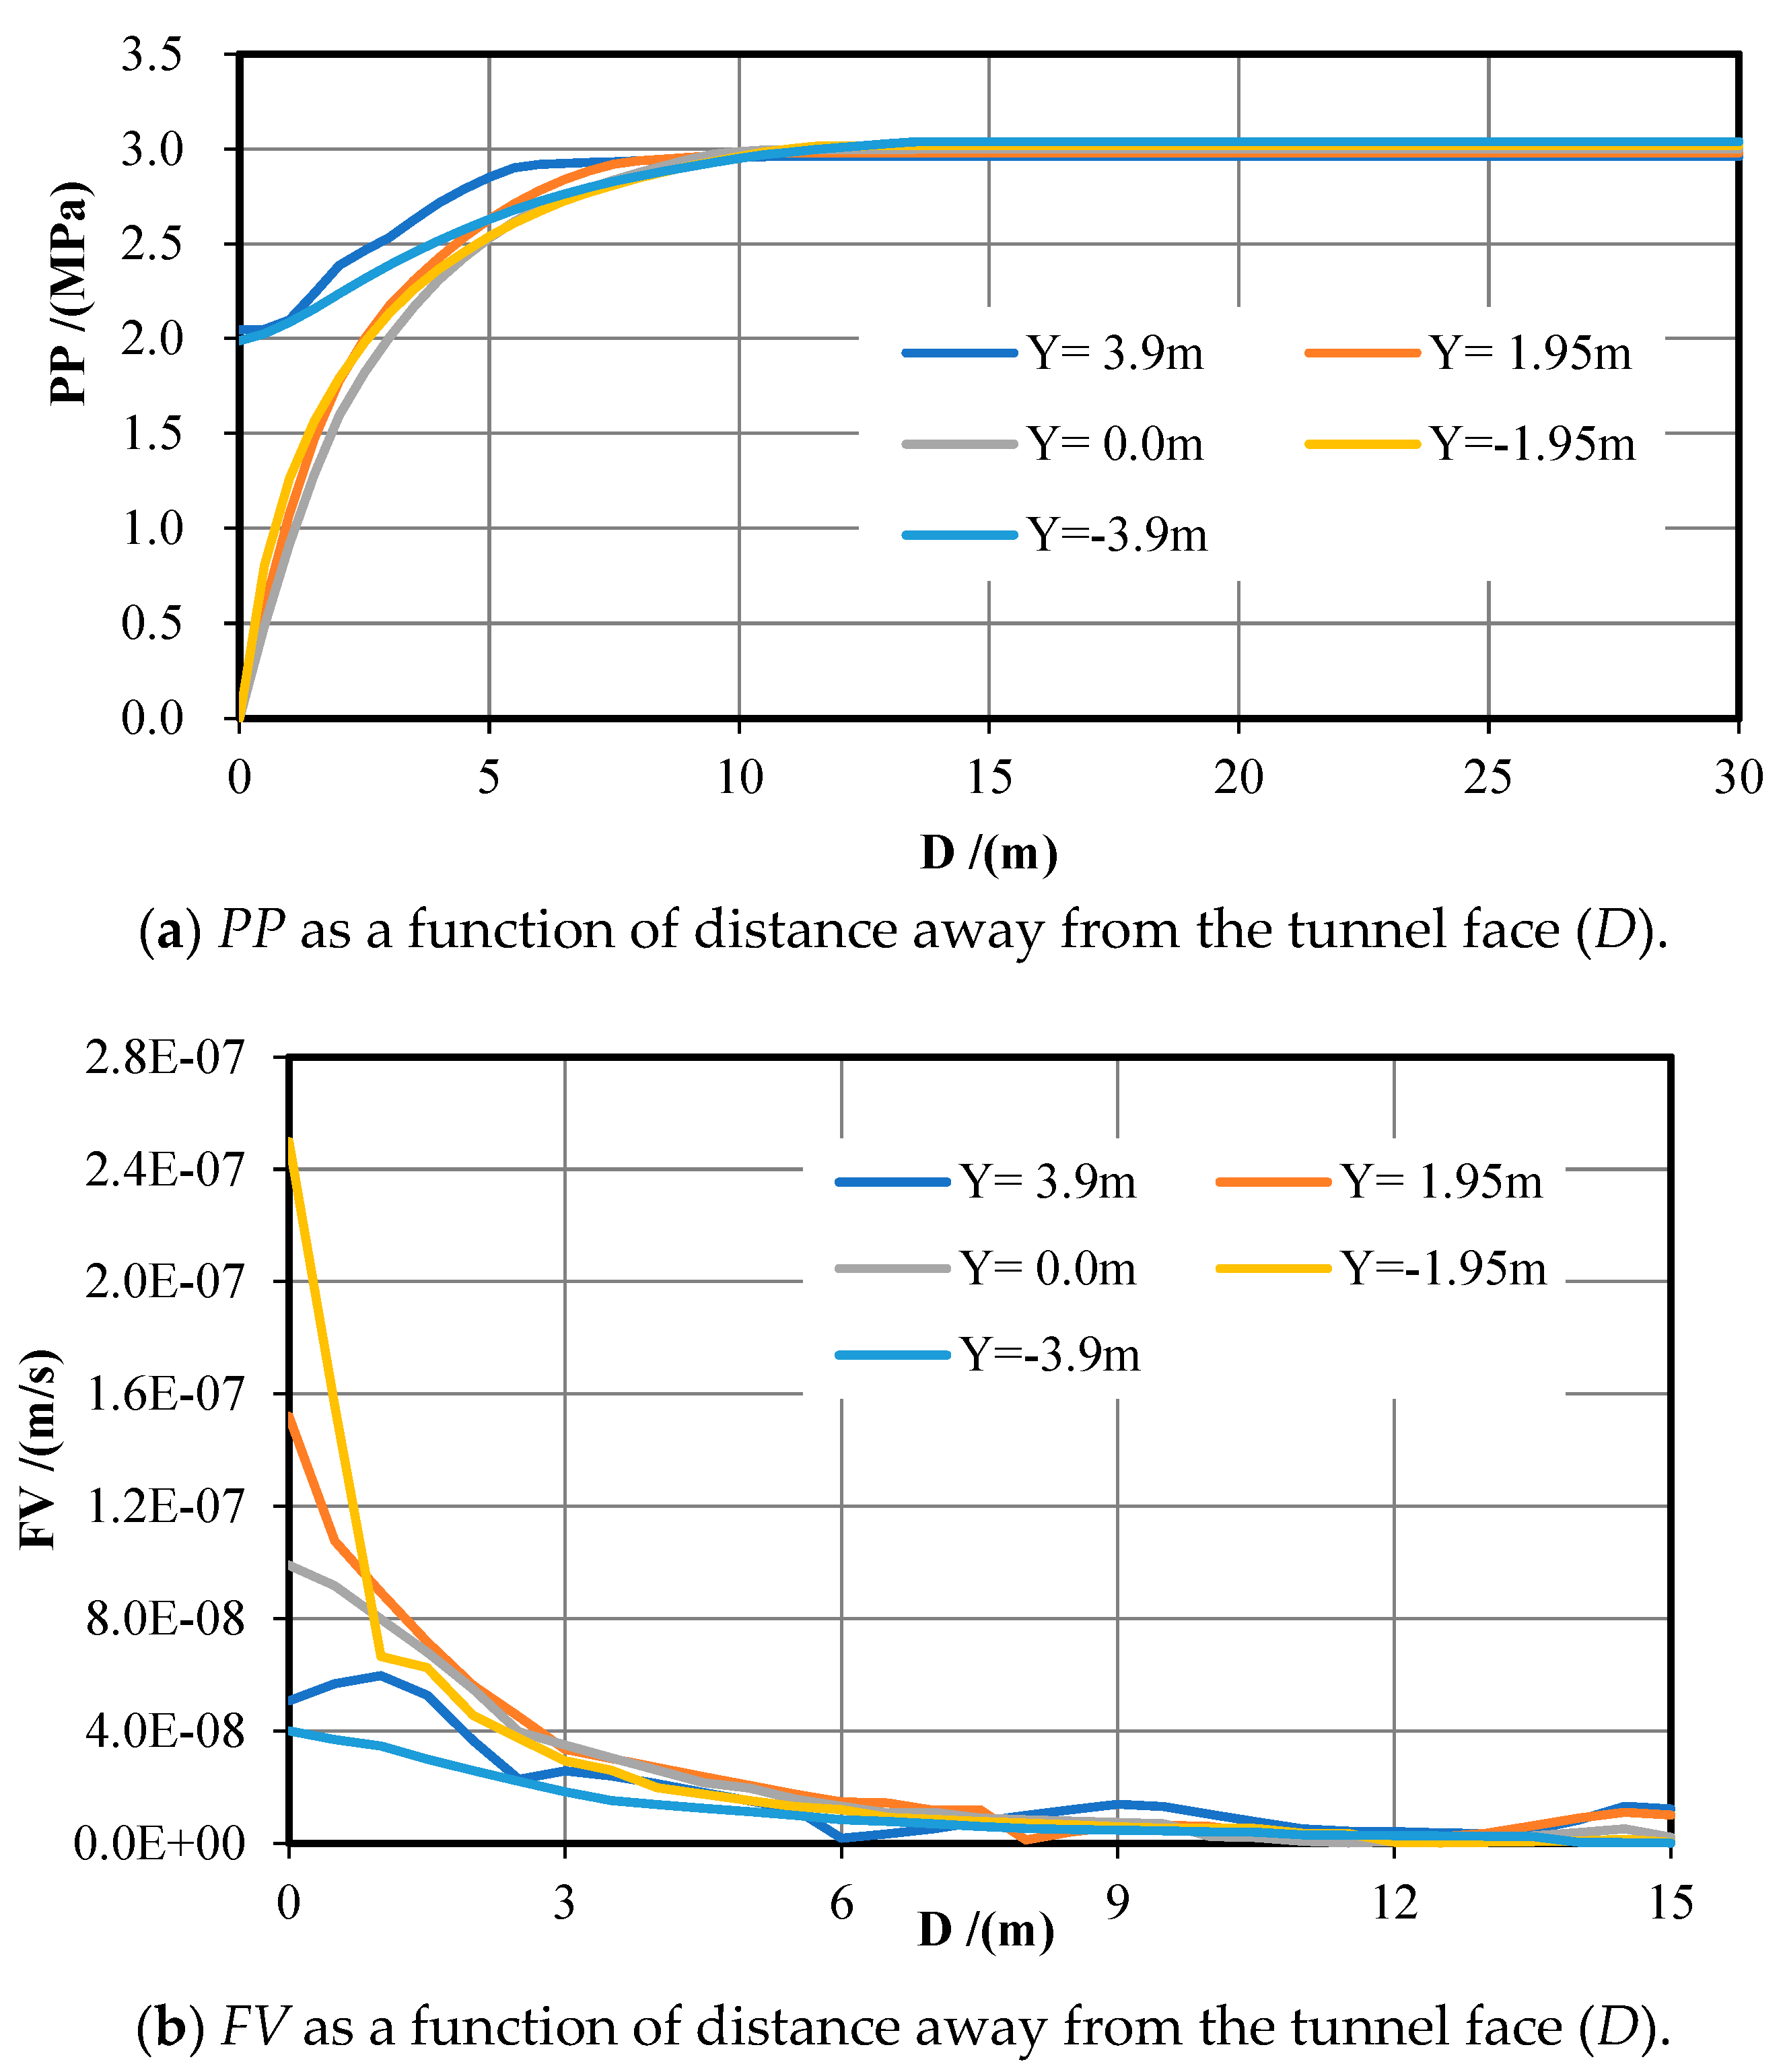
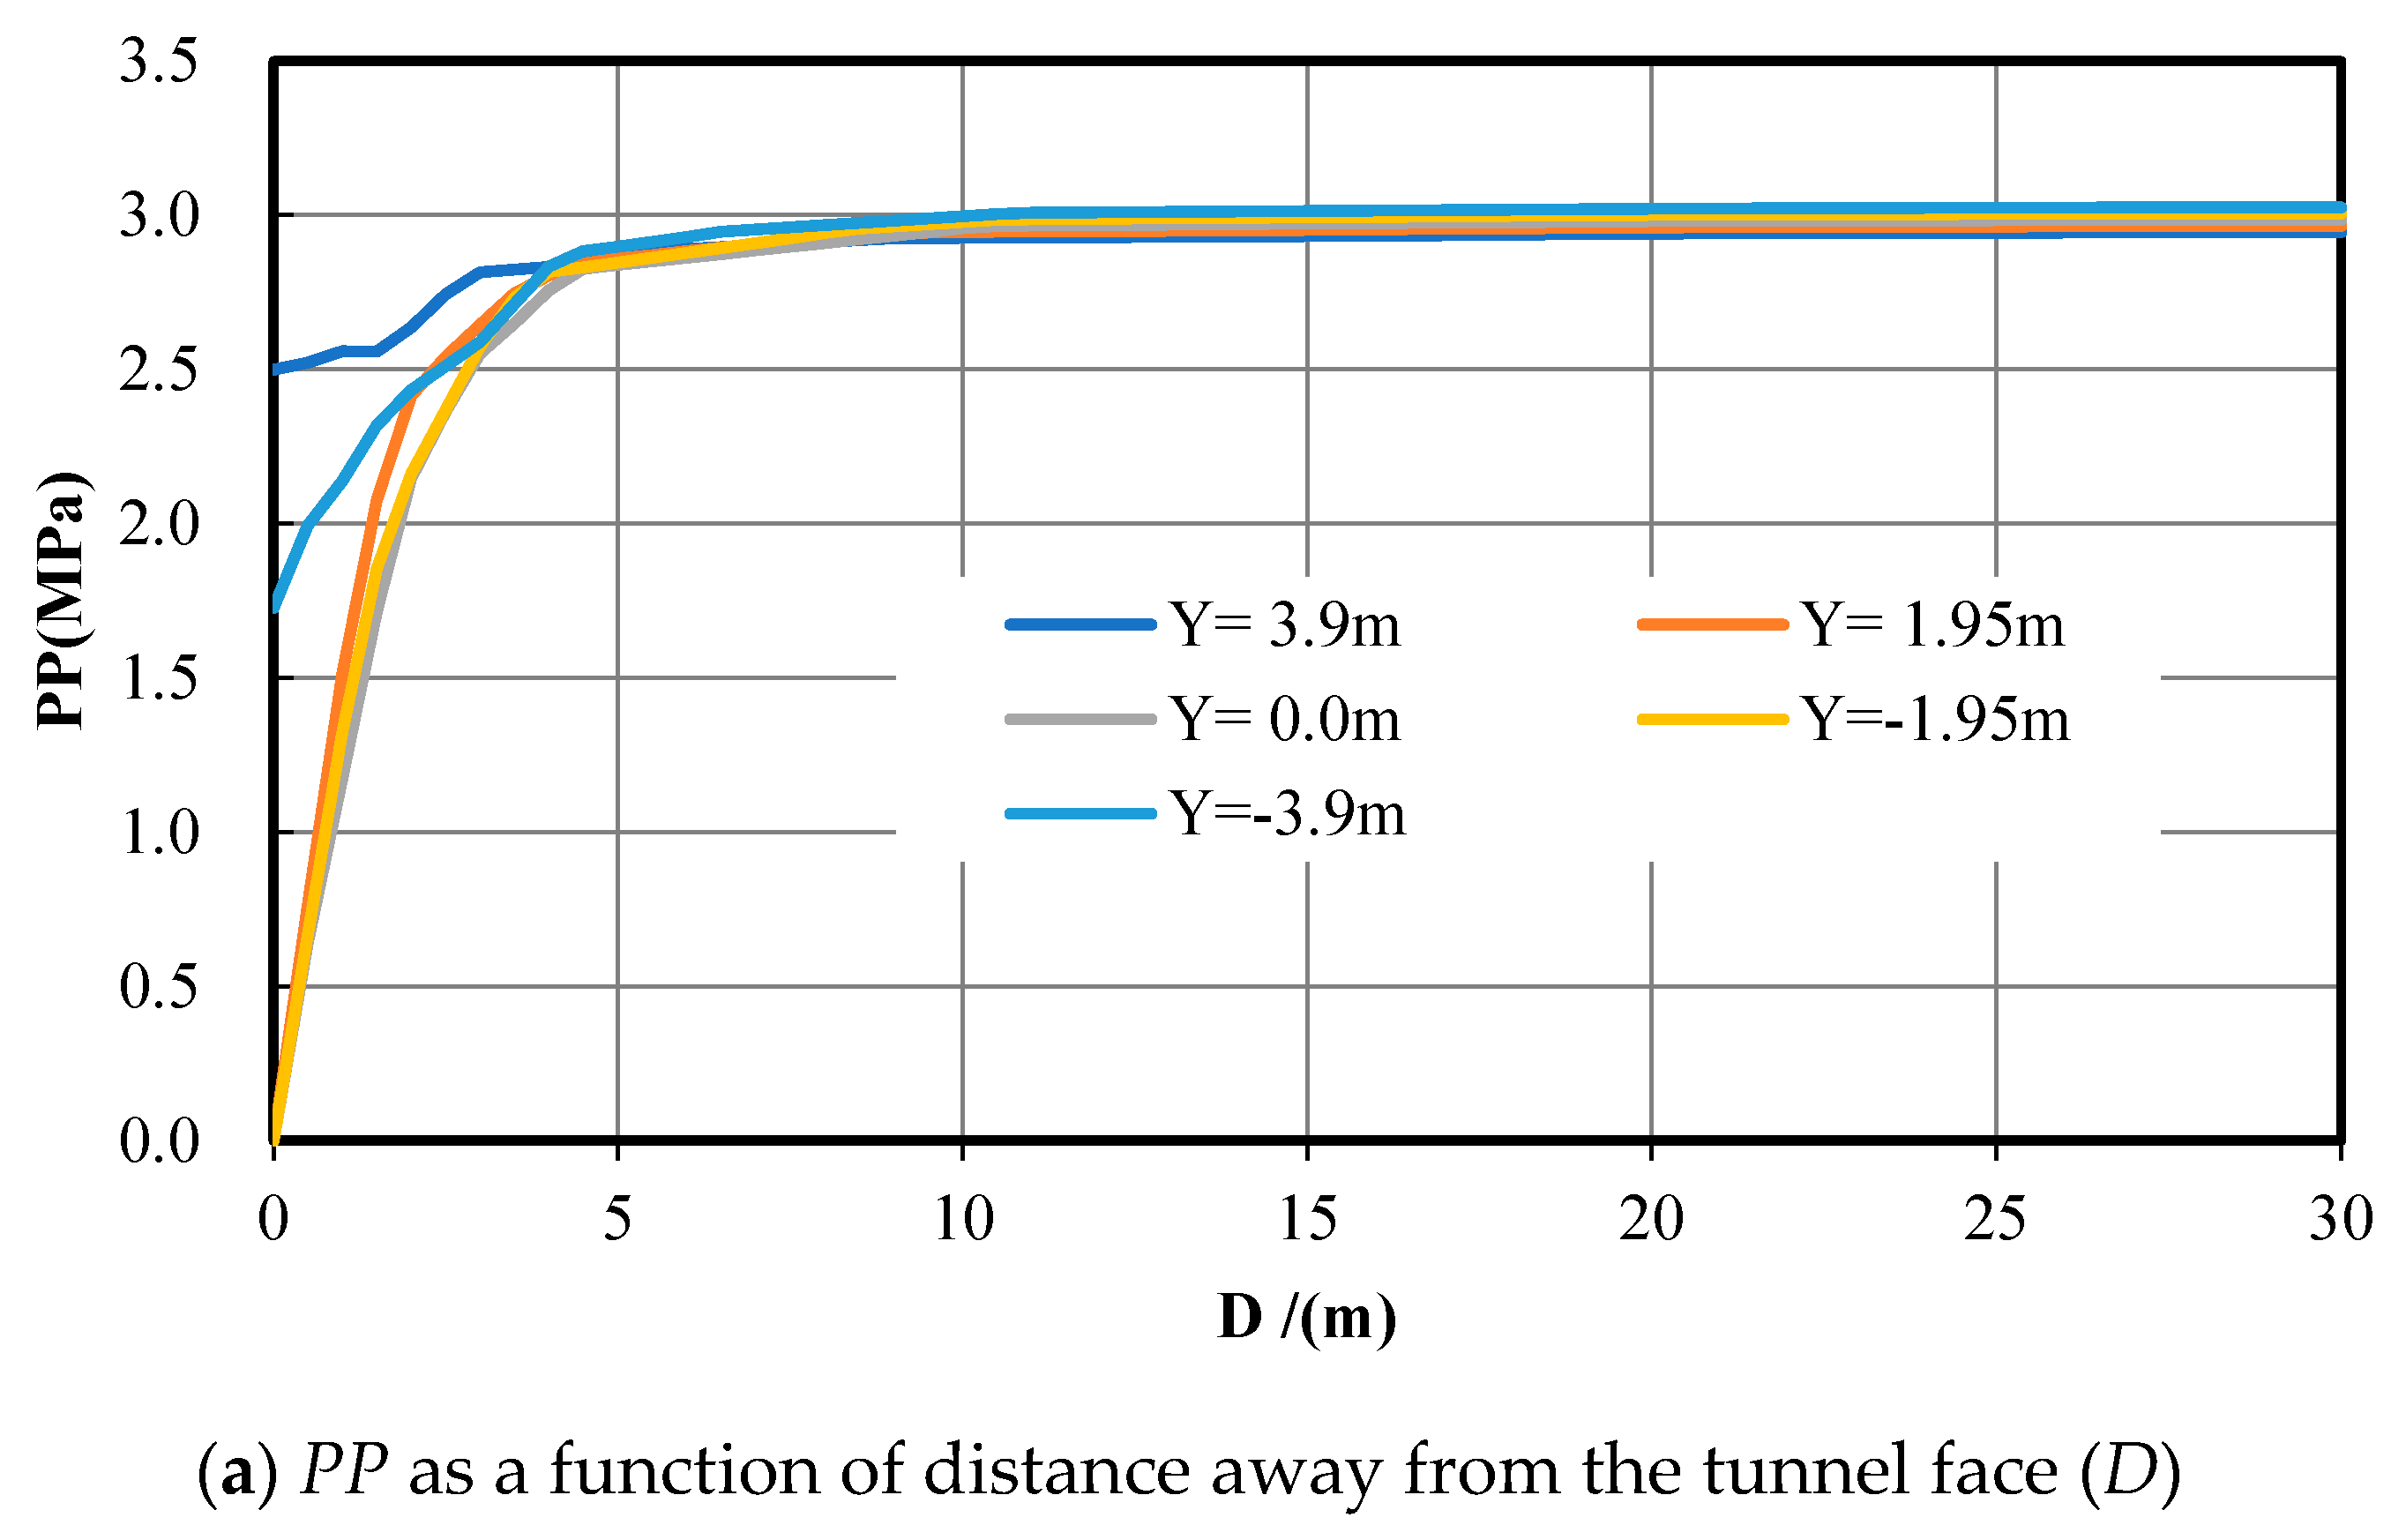
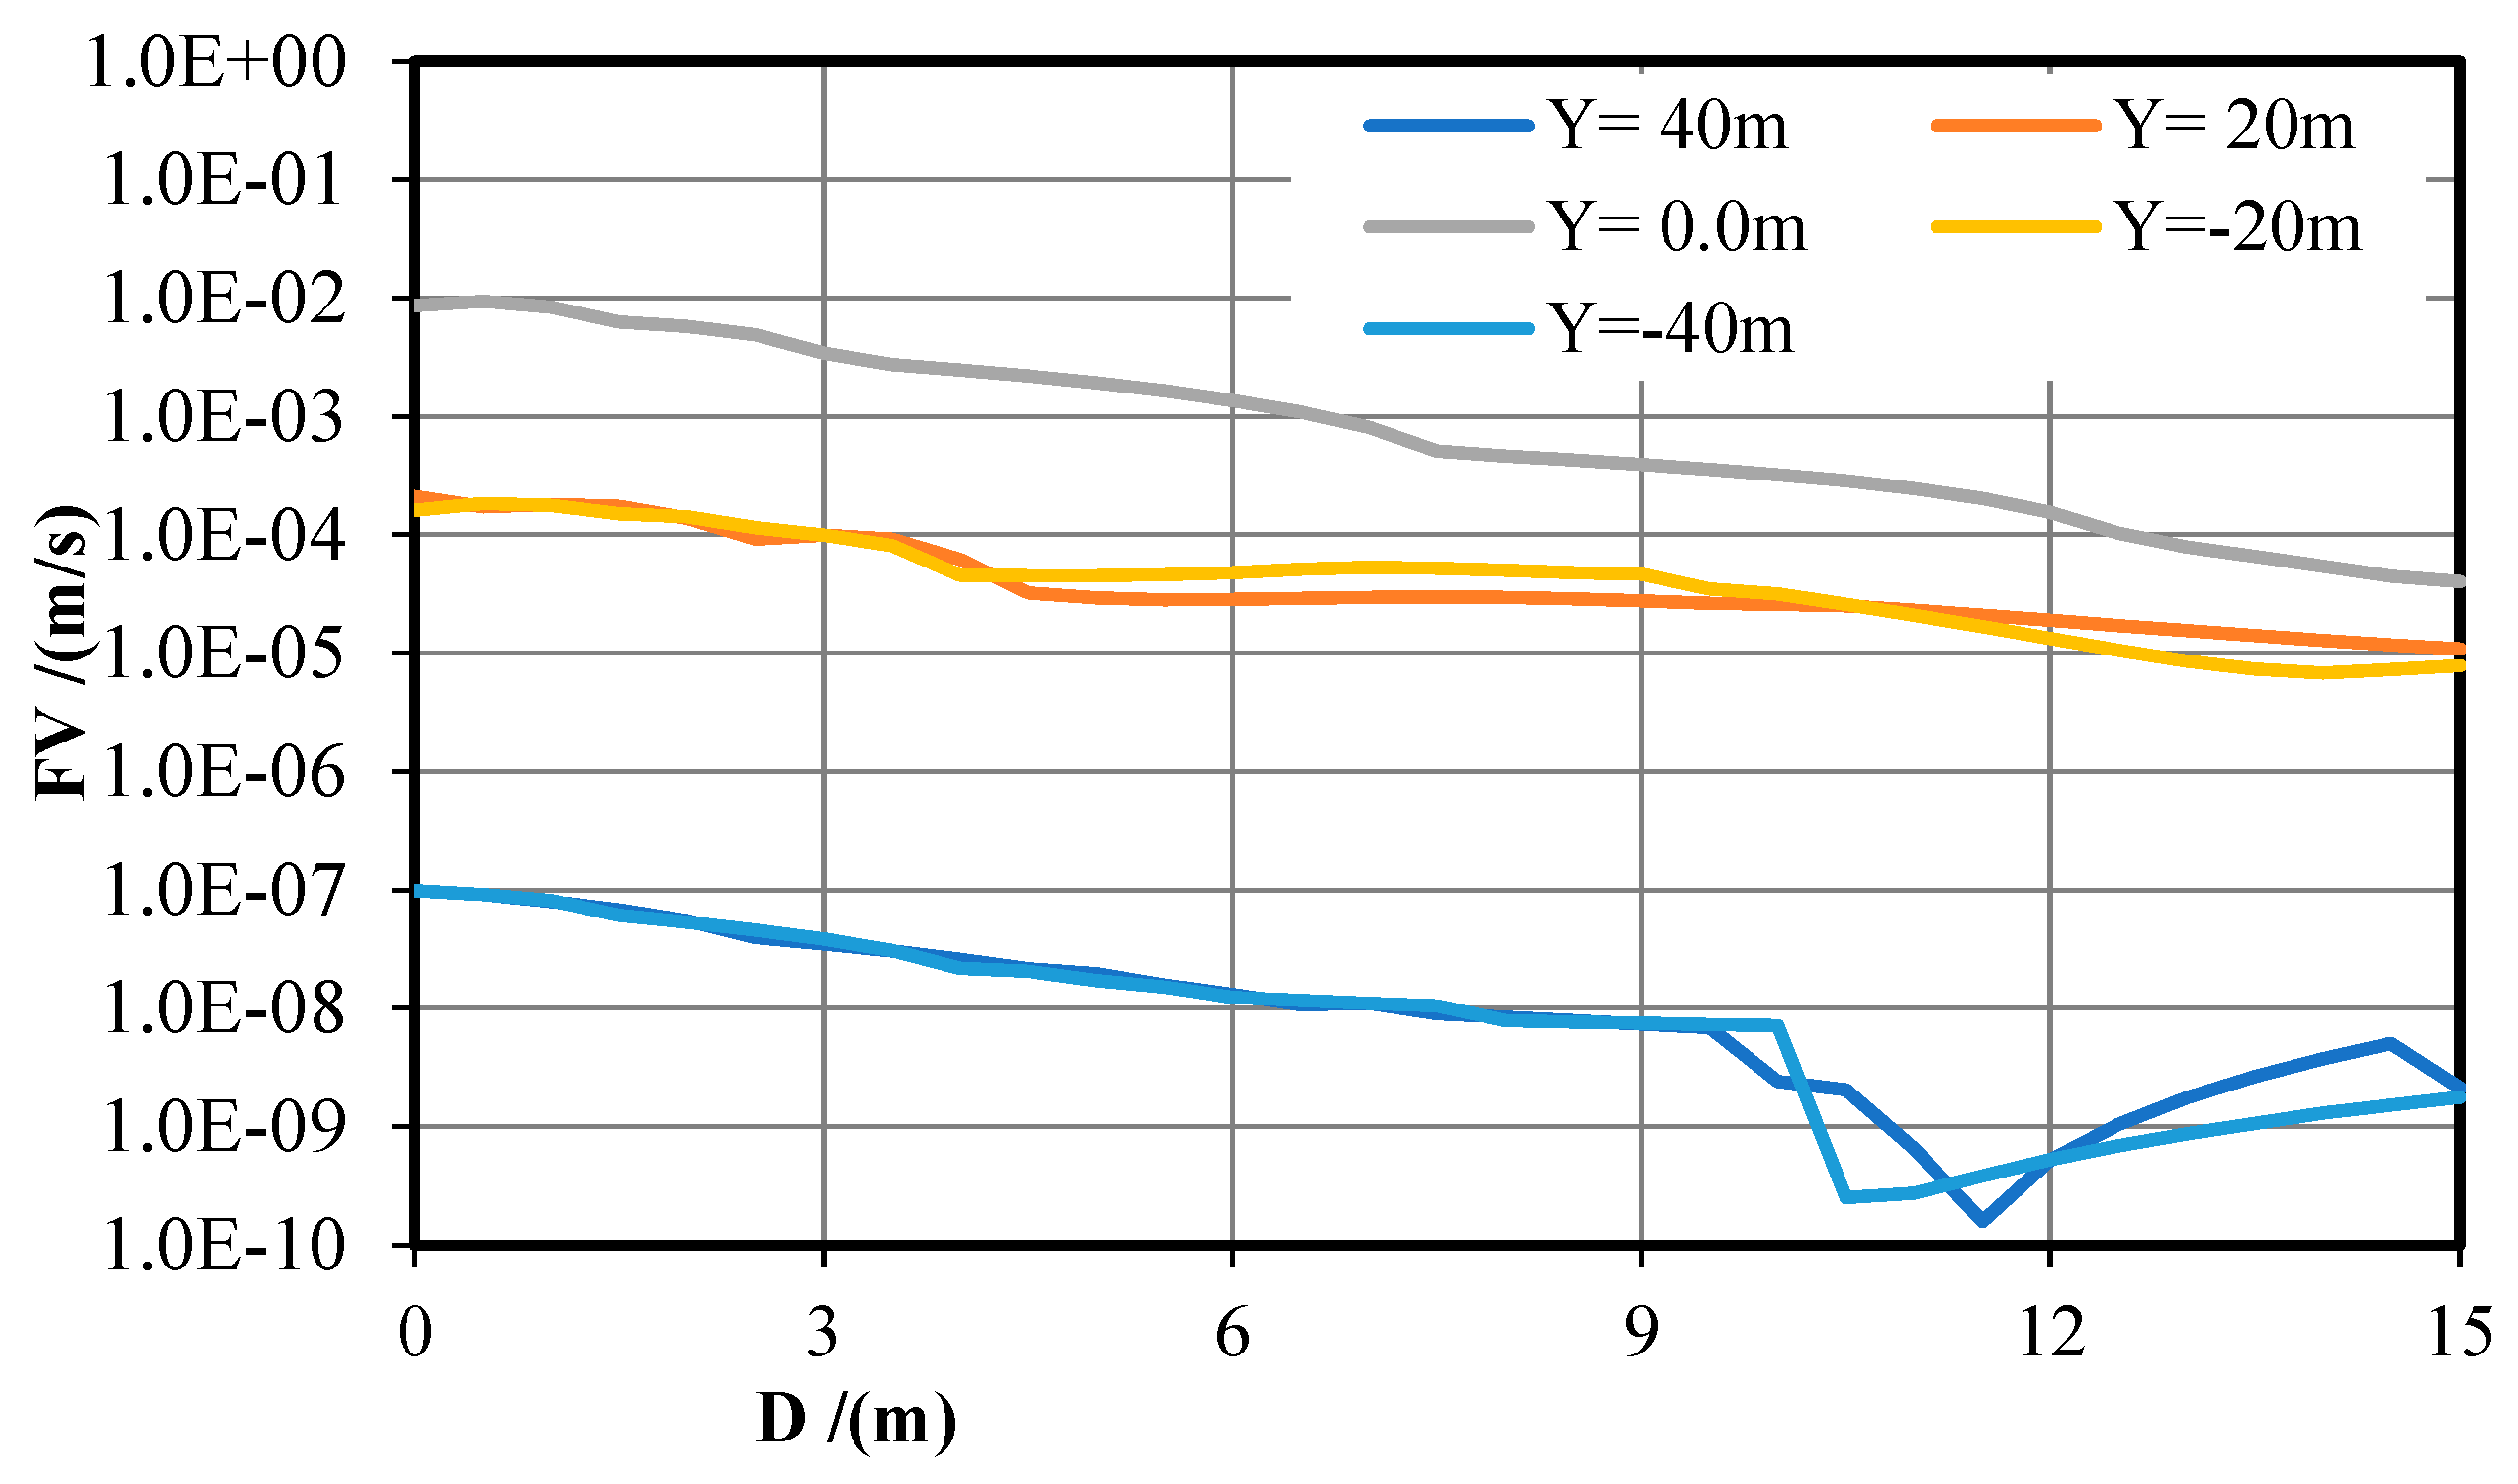
Five measuring lines were placed 50 m in front of the excavation face to monitor and explore the variation law of
PP and
FV as listed in
Table 2 and
Figure 3.
The
PP variation law on each measuring line about 30–50 m in front of the excavation face is relatively stable and approaches a maximum of 3.0 MPa. Therefore, we analyzed pore pressure within 30 m in front of the excavation face, and the results are shown in
Figure 3a. Flow velocity does not change significantly in the 15–50 m range and is close to zero.
Figure 3b shows flow velocity curves 15 m in front of the working face.
When Y = 3.9 m, the PP value is 2.05 MPa at the excavation face and improves quickly within 5 m ahead, then keeps increasing slowly deep into the formation, and stabilizes at approximately 3 MPa. When Y = −3.9 m, the PP value is 1.99 MPa at the excavation face and improves gradually within 10 m ahead and eventually stabilizes at about 3 MPa. When Y = 1.95 m, 0, and −1.95 m, the PP value at the excavation face is 0 and improves quickly within 5 m ahead and finally stabilizes at about 3 MPa. Within 5 m ahead of the excavation face, the values of PP on sections of Y = ±3.9 m are significantly bigger than that on sections of Y = ±1.95 m and 0. In summary, when the tunnel excavation face arrives at 40 m directly below the fault intersection center, PP in the short distance ahead improves quickly, and after that it grows tardily. Along the y-axis, PP in the range of −1.95 m ≤ Y≤1.95 m is significantly low near the tunnel excavation face and decreases with an increasing Y away from the excavation face.
As shown in
Figure 3b, on the Y = −3.9 m and Y = −3.9 m sections,
FV varies insignificantly near the tunnel excavation face. The maximum value of
FV at
D = 1 m and
D = 0 is 5.97 × 10
−8 m/s and 4.01 × 10
−8 m/s each. On sections of Y = 1.95 m, 0, −1.95 m, FV declines quickly and slowly within 3 m ahead of the excavation face. The maximum value of
FV is 1.52 × 10
−7 m/s, 9.91 × 10
−8 m/s, and 2.50 × 10
−7 m/s, respectively. The velocity magnitude order near the tunnel face is
UY = −1.95 >
UY = 1.95 >
UY = 0. Overall, the
FV peak occurs at the lower part of the excavation face. The value of
FV is higher over a small distance in front of the excavation face but then falls off rapidly, after which it changes smoothly in the host rock.
FV near the excavation face is apparently higher than that outside away from the excavation face, and it increases with increasing Y.
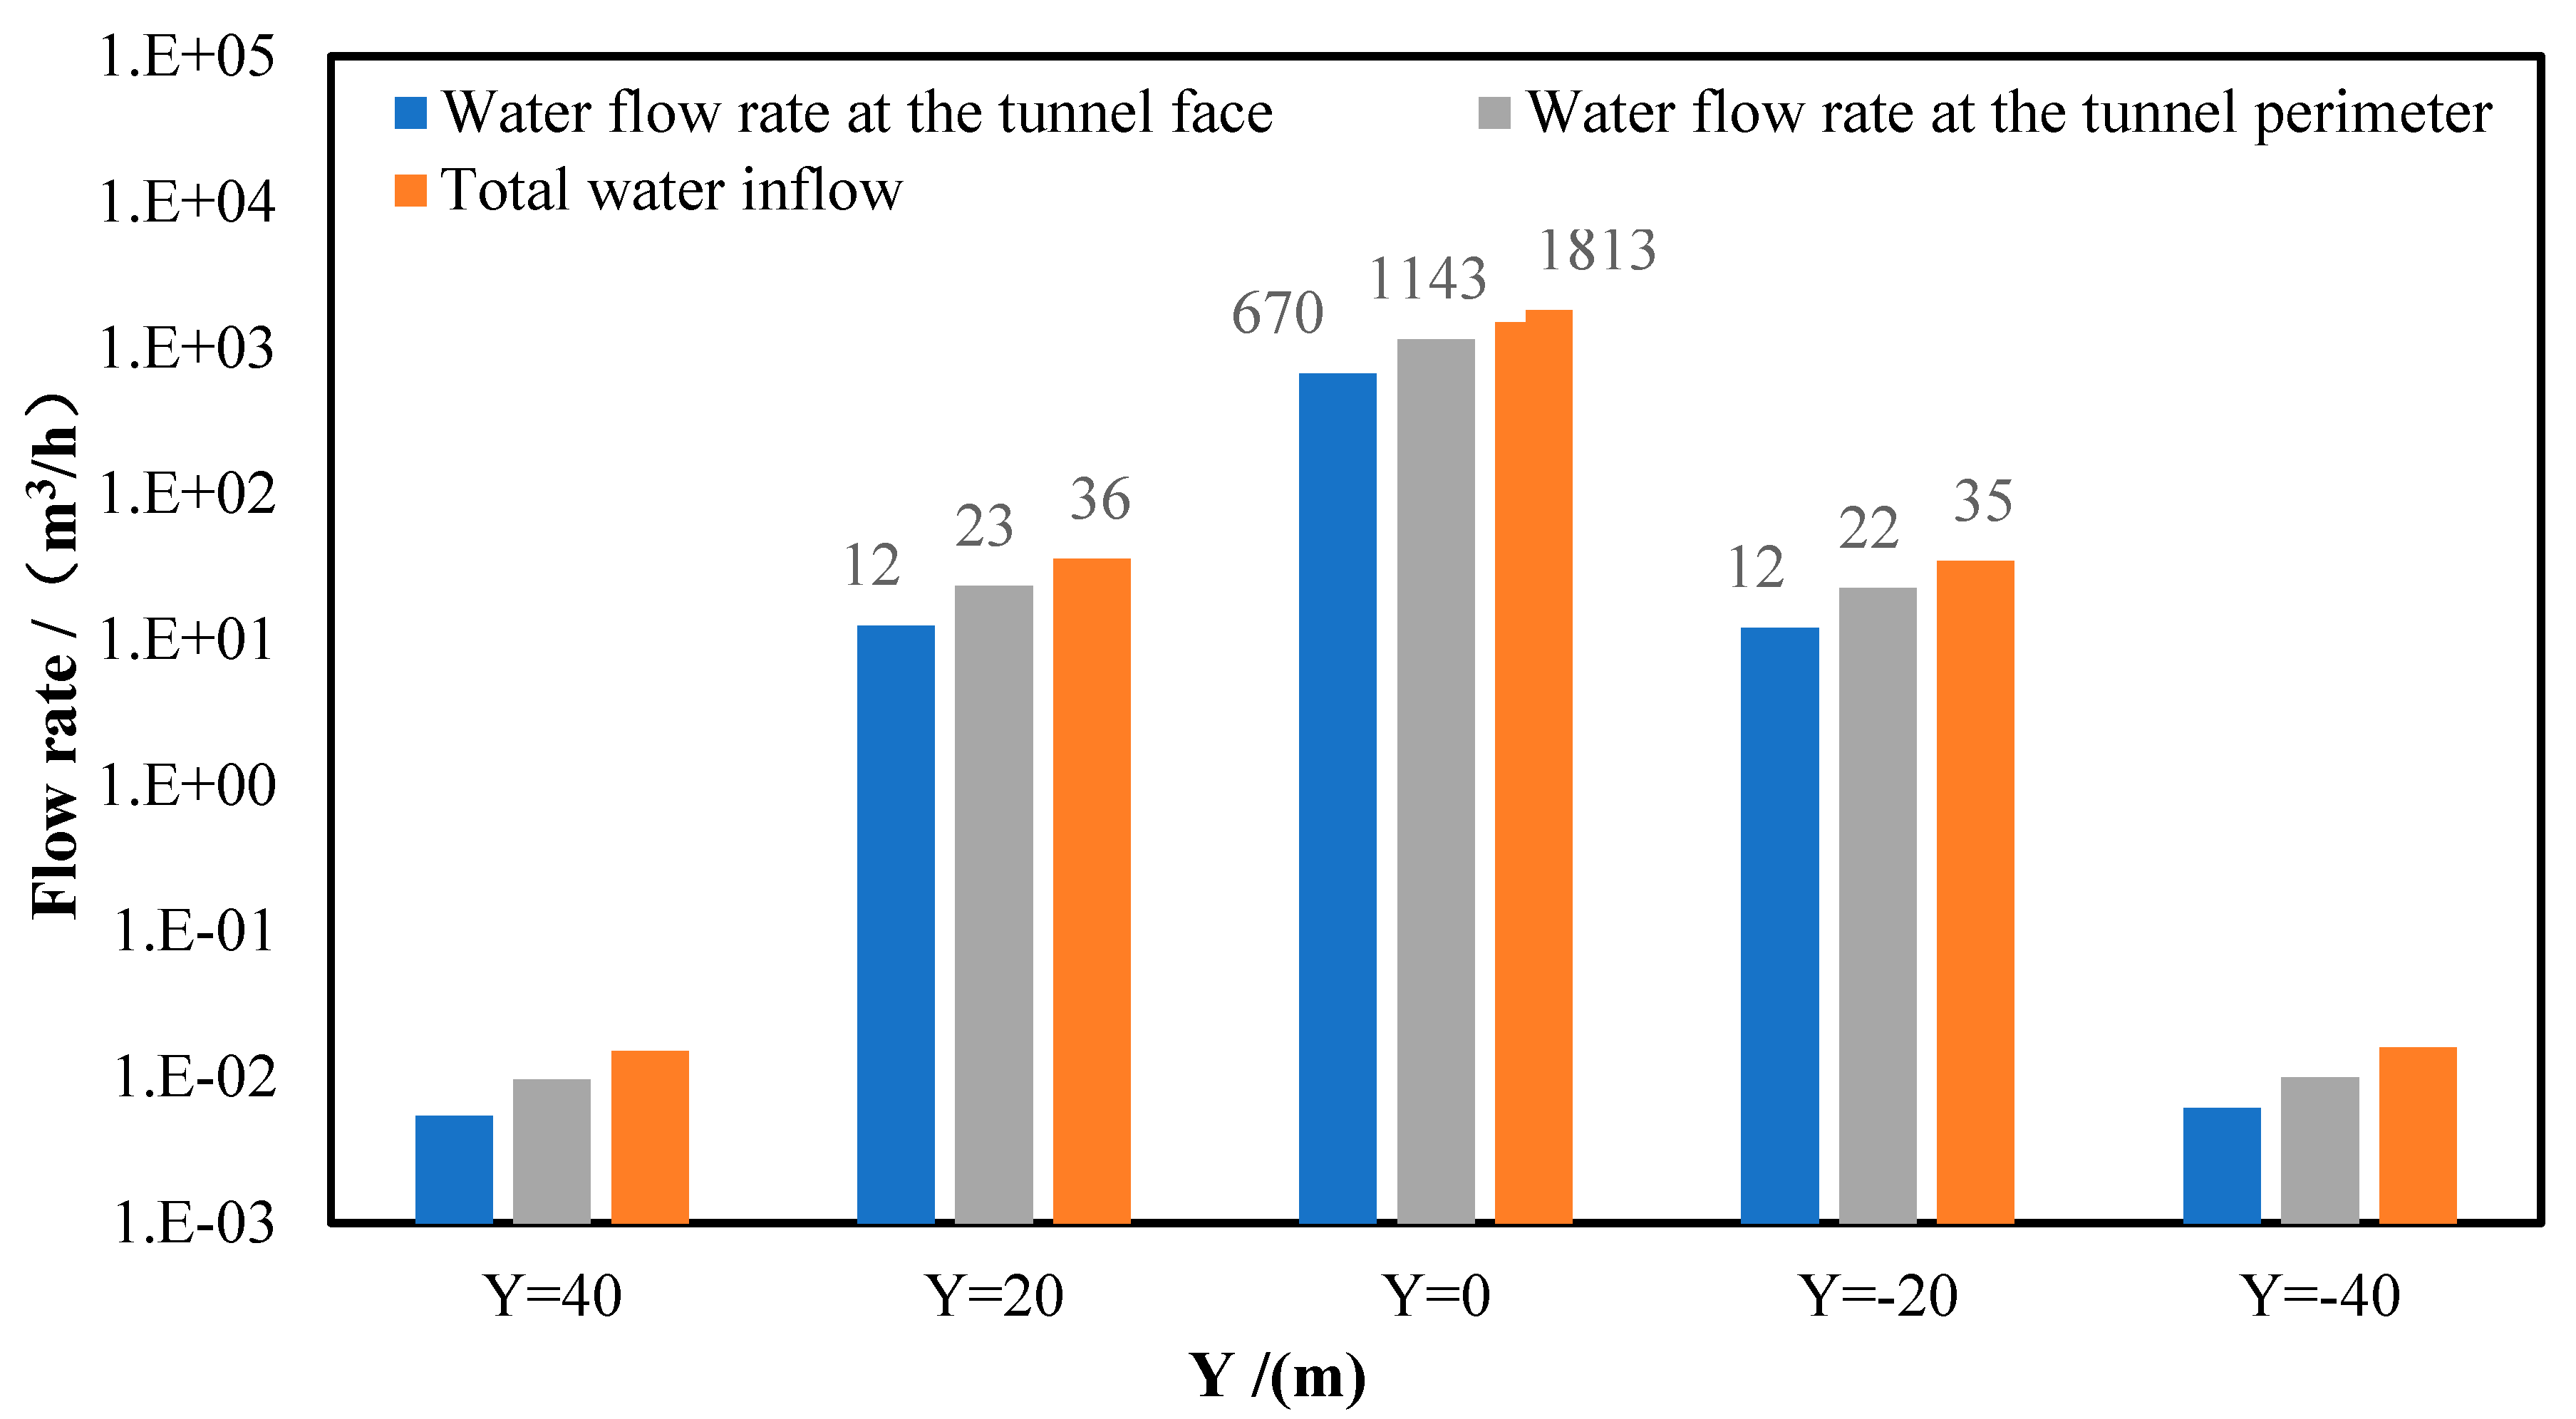
In terms of water inflow, we acquire the groundwater inflow rate of 0.0054 m3/h at the excavation face and the total groundwater inflow rate of 0.015 m3/h by integrating the FV over the area.
3.2. Tunnel Is 20 m Beneath the Center of Cross Faults
When the tunnel is excavated to 20 m beneath these two intersecting fault centers (Y = 20 m), the contours of
PP and
FV on various sections (XZ
Y = 20, XY
Z = 0, YZ
X = 0) are shown in
Figure 4.
The
PP contours in
Figure 4a,c,e show that a low-pressure region appears at the excavation face and the tunnel wall within 1.0 m rearwards. Specifically,
PP value is zero at the excavation face, which then increases with the distance away from the excavation face
D. On the XZ
Y = 20 section, the
PP contours are symmetrically circular along with the
x-axis. The pore pressure distributes semi-circularly near the excavation face on the vertical section and gradually increases with the increase in the tunnel burial depth. From the
FV contours, we find that water flows to the tunnel from the intersection zone and the damage zone of faults above the tunnel. As the fault intersection center is closer to the tunnel, the water flow velocity increases, with a maximum of 1.25 × 10
−3 m/s. On the XZ
Y = 20 section, the
FV contour appears approximately symmetrically distributed for the
x-axis. Water flows along the fault into the tunnel excavation face. On the YZ
X = 0 section, the
FV contour is symmetrically distributed for the
y-axis. The value of
FV above the tunnel vault is expressively more significant than below the tunnel floor.
In summary, since the fault’s intersection center is closer to the tunnel face, it has a more pronounced influence on the distribution of pore pressure in the tunnel-surrounding rock. The pore pressure dissipates faster along the intersection of the faults than perpendicular to the intersection direction. Therefore, the pore pressure distribution changes from elliptical to circular on the horizontal section near the excavation face. The groundwater flows to the tunnel from the overlapped intersection zone and the damage zone of faults above the tunnel, and the value of
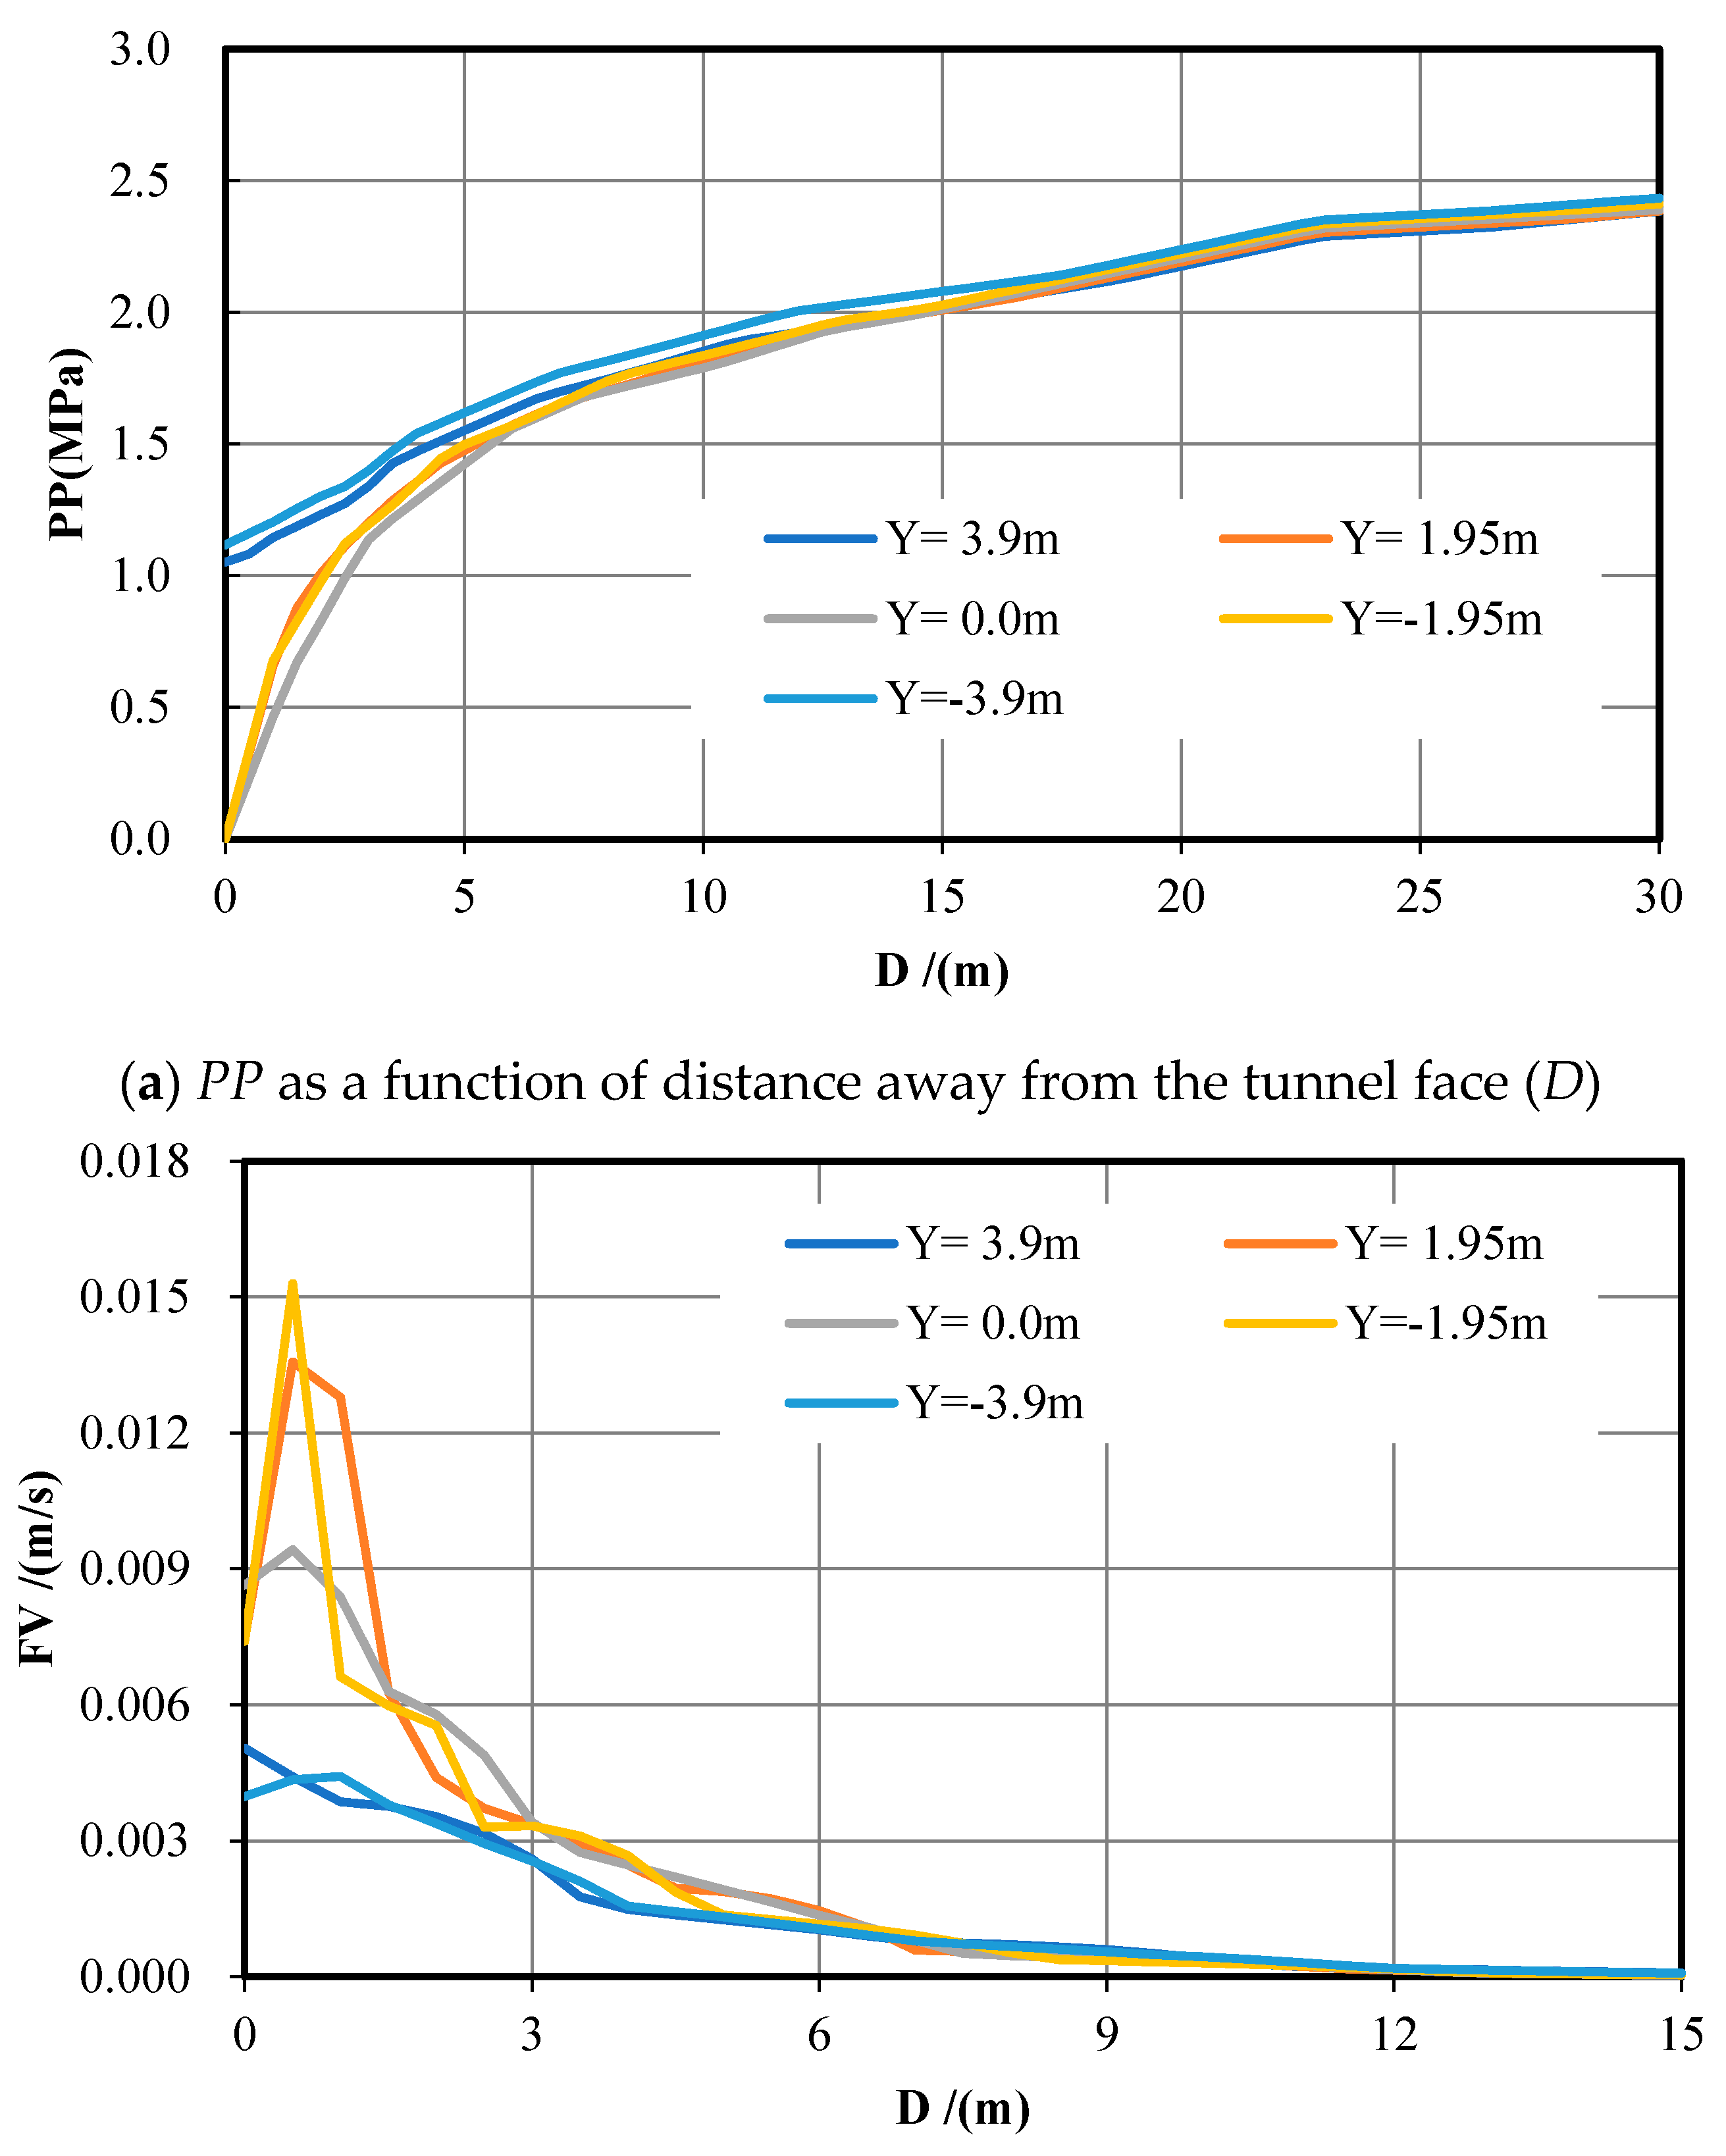
FV increases exponentially. The water velocity above the tunnel vault is expressively bigger than below the tunnel floor. Five survey lines are selected within 50 m in front of the tunnel excavation face.
Table 2 lists the locations of the survey lines. The curves of
PP and
FV are shown in
Figure 5.
Figure 5a shows that, on the Y = 3.9 m section, the PP value at the tunnel face is 2.50 MPa, which then gradually increases within 10 m in front of the excavation face and eventually stabilizes at 3.0 MPa. On the Y = −3.9 m section, the value of
PP at the excavation face is 1.73 MPa, which then gradually increases within 5 m in front and eventually stabilizes at 3 MPa. On the Y = ±1.95 m and Y = 0 section, the value of
PP at the excavation face is 0, which increases rapidly within 5 m in front, then eventually stabilizes at 3 MPa. The value of
PP on the Y = ±3.9 m section is apparently more significant than that on the Y = ±1.95 m and 0 sections within 5 m in front of the excavation face.
Figure 5b reveals that, on the Y = 3.9 m and 1.95 m sections, the maximum value of
FV at
D = 1 m is 2.57 × 10
−4 m/s and 6.60 × 10
−4 m/s, respectively. Flow velocities gradually decrease within 1 <
D ≤ 9 m range of the excavation face until reaching zero as
D > 9 m. When Y = 0, the maximum value of
FV occurs at the excavation face, which is 2.12 × 10
−4 m/s. Flow velocity is gradually reduced within 0 <
D ≤ 9 m range of the excavation face until zero at
D > 9 m. When Y = −3.9 m and −1.95 m, the velocities are low and overall change little.
In terms of water inflow, we acquire the water inflow rate of 12.45 m3/h at the excavation face and the total water inflow rate of 35.67 m3/h by integrating the FV over the area.
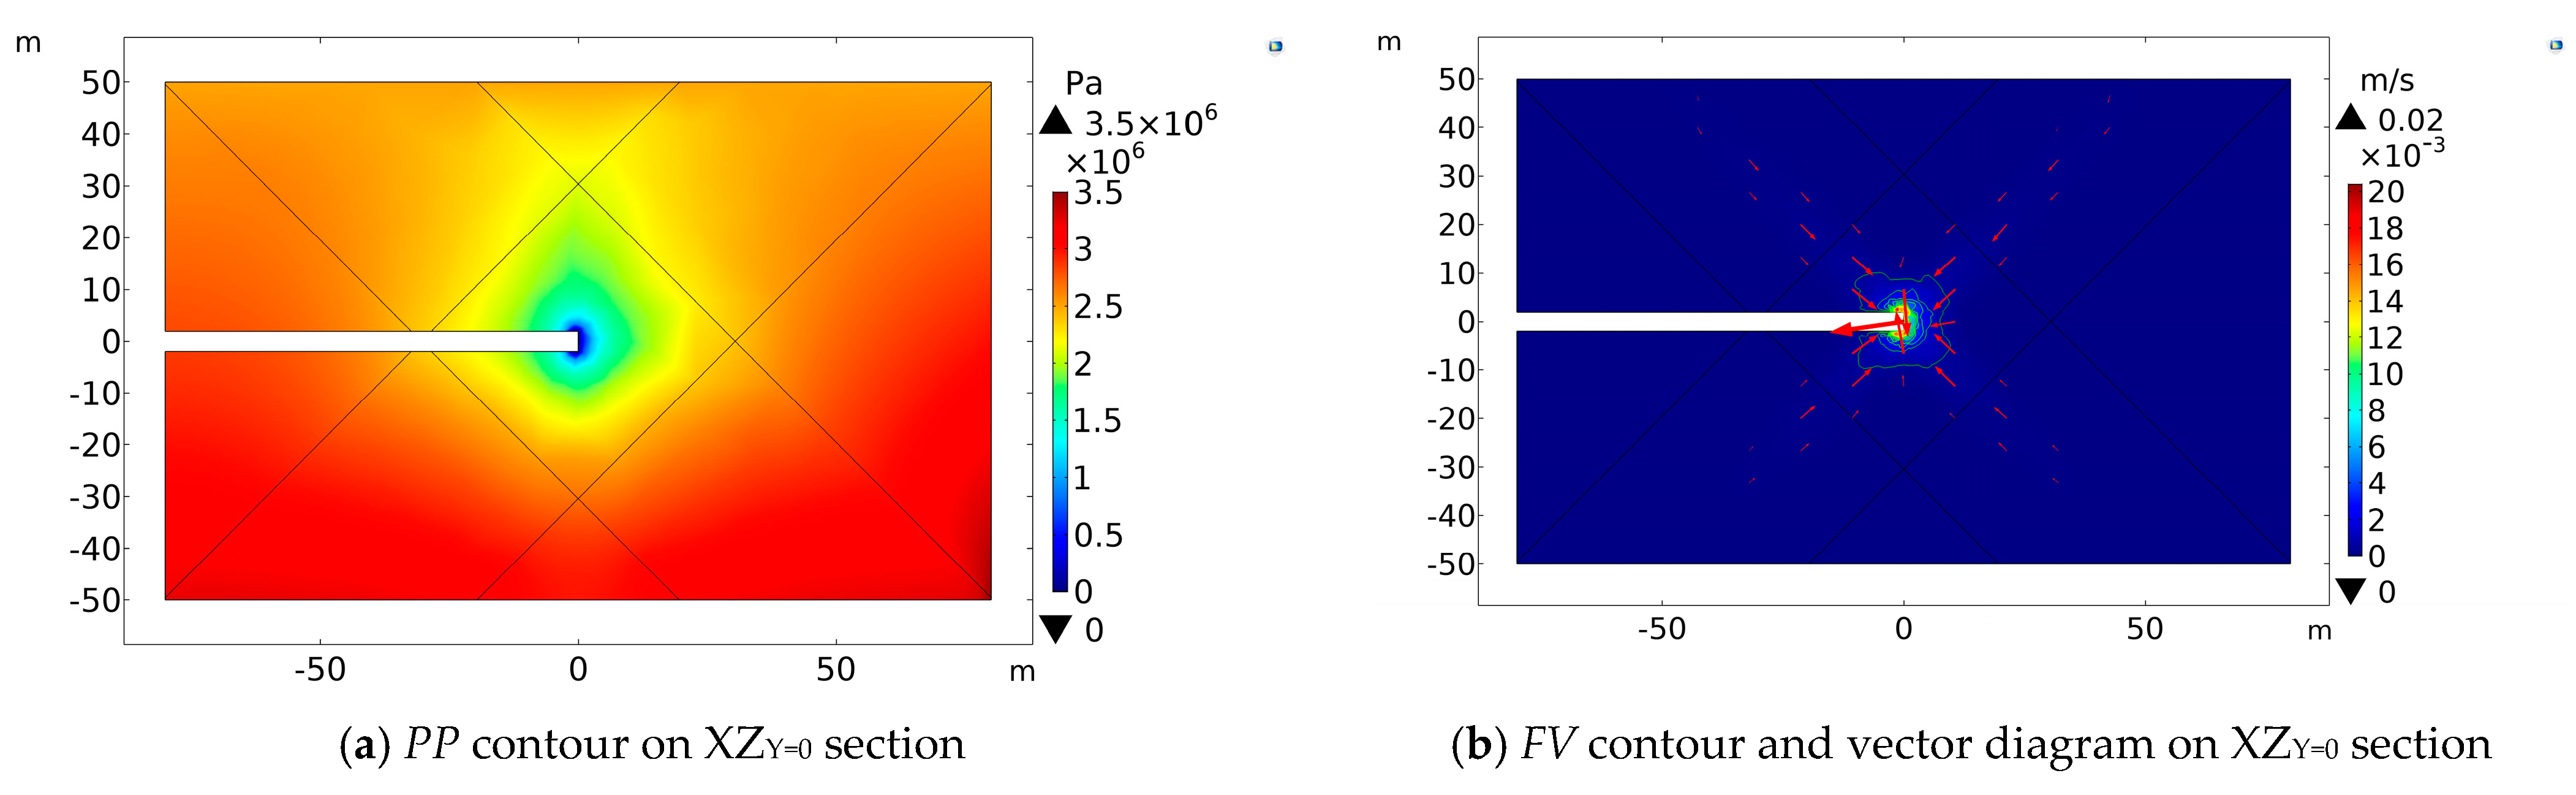
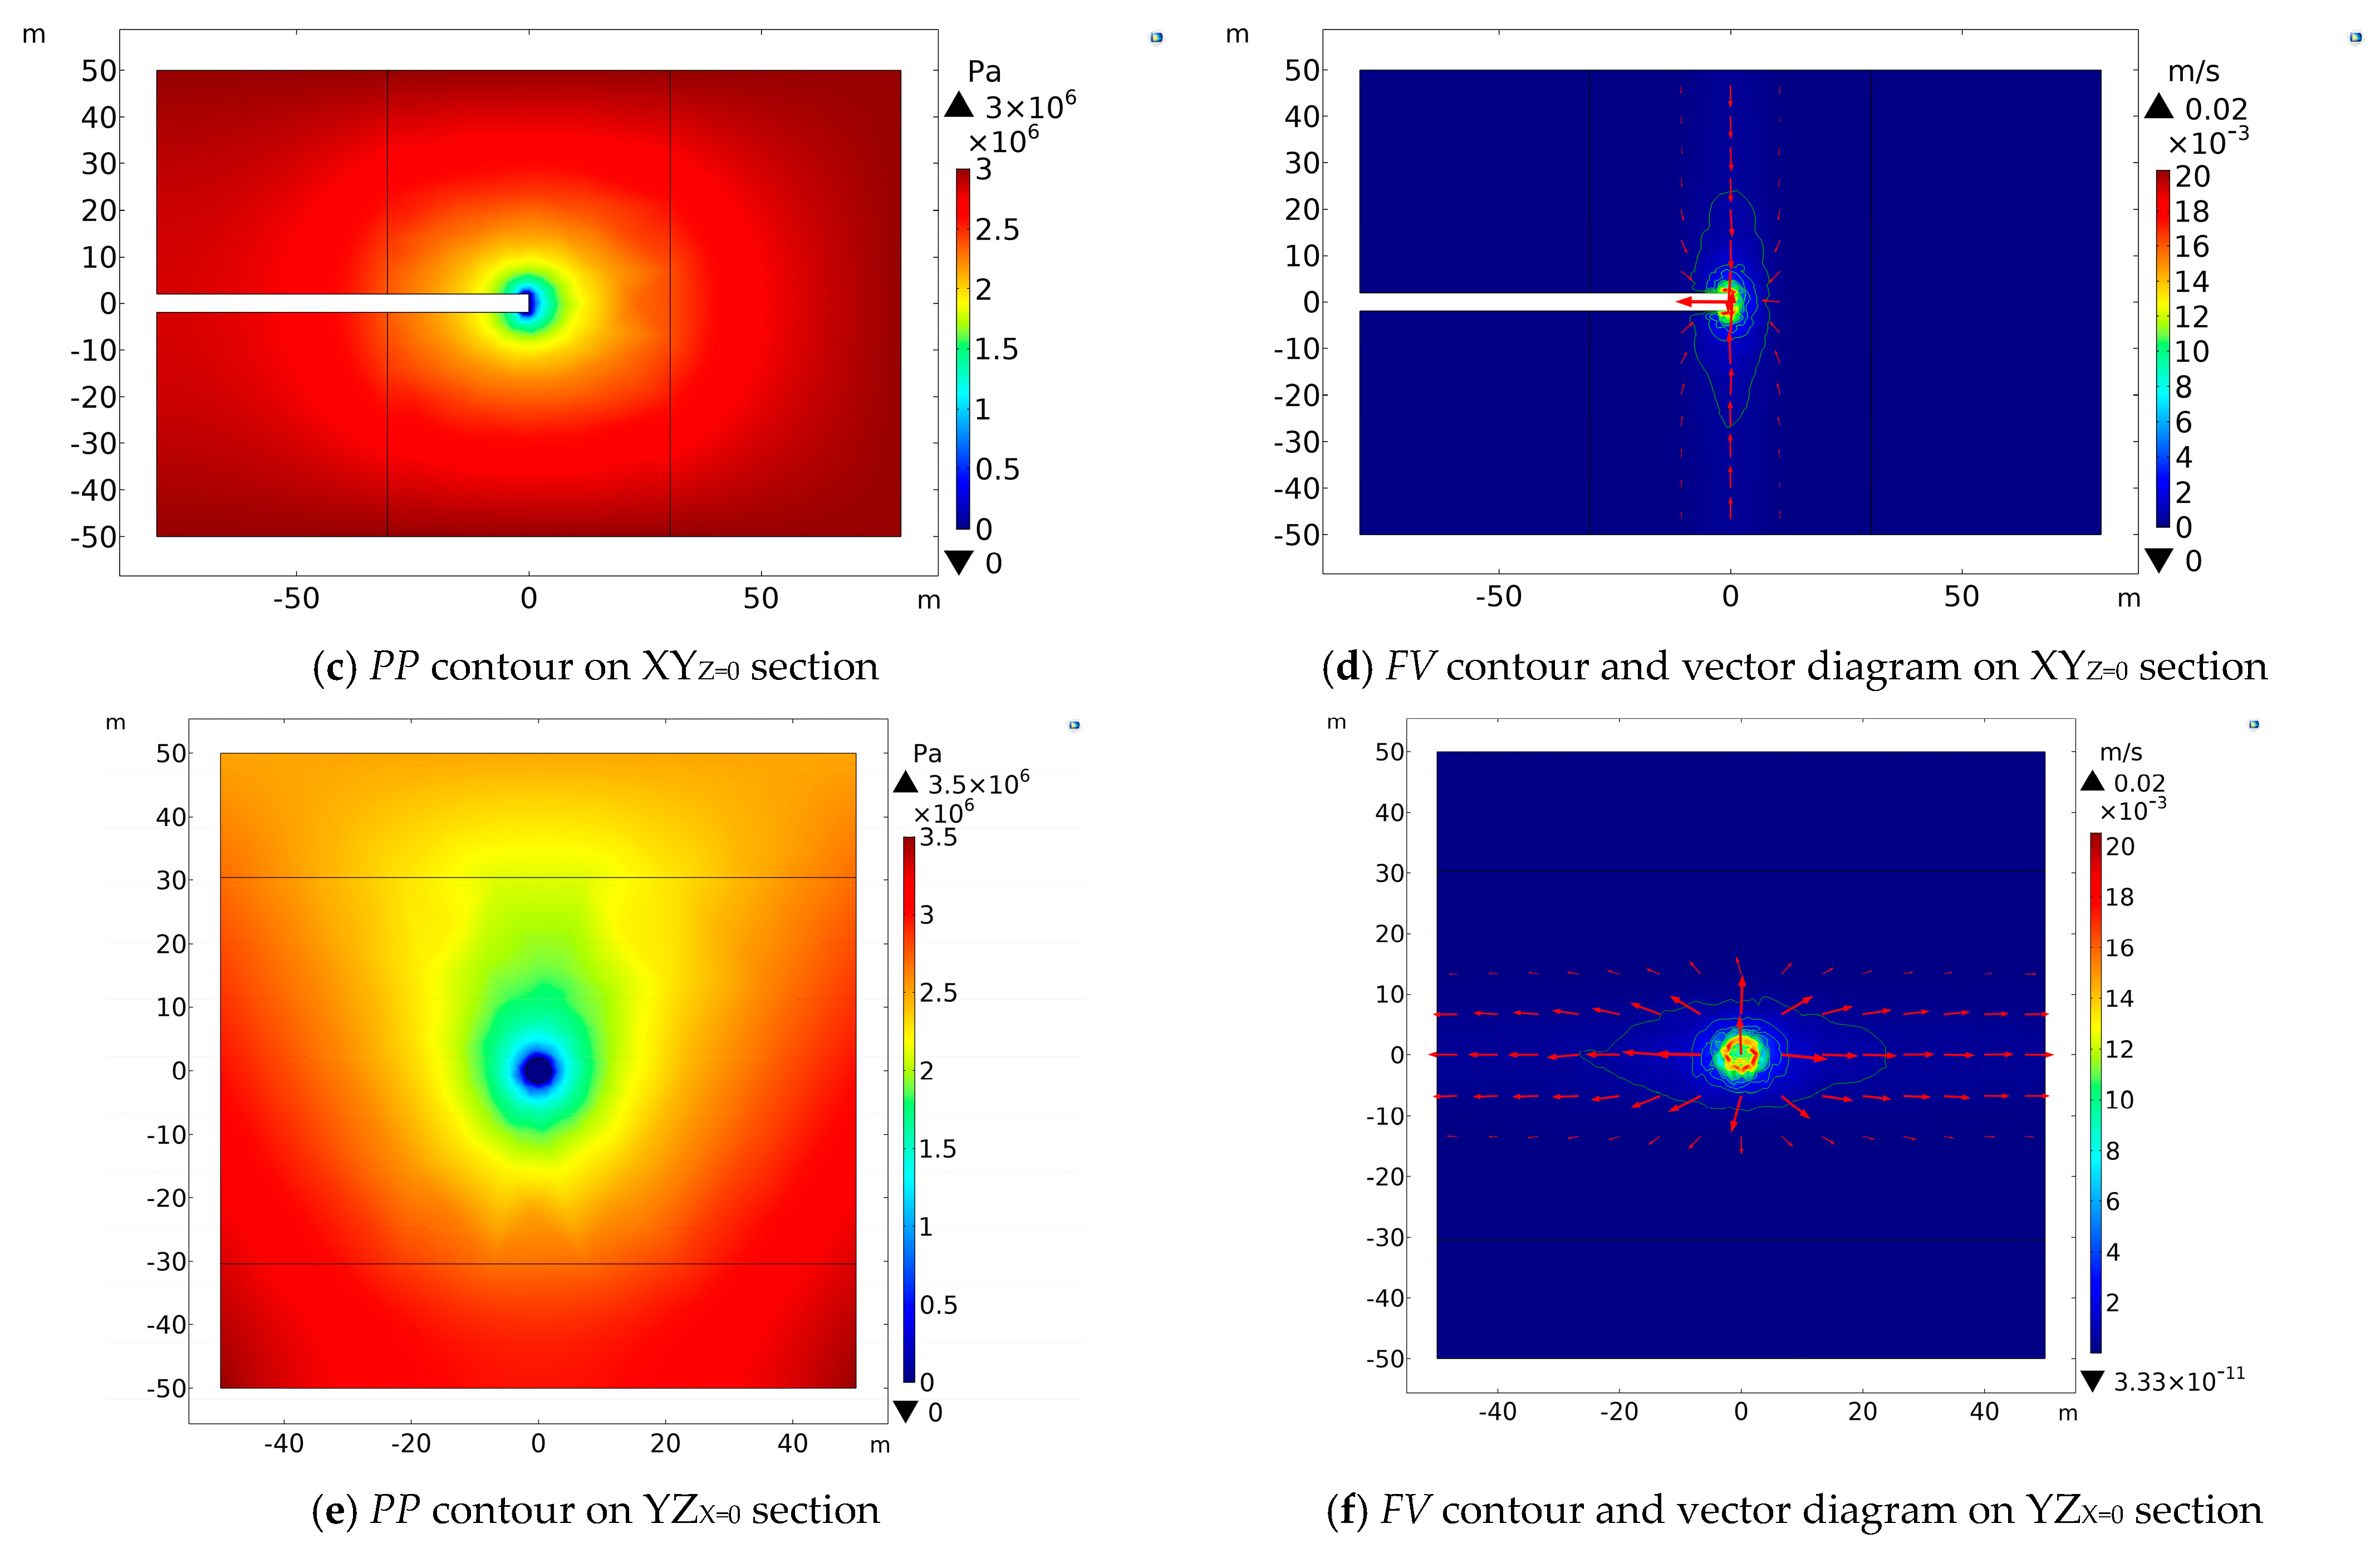
3.3. Tunnel Is at the Center of the Fault Intersection
Figure 6 reveals
PP contours and
FV contours on various sections (XZ
Y = 0, XY
Z = 0, YZ
X = 0) while the tunnel excavation face is in the center of the two intersecting faults (Y = 0).
The
PP contours in
Figure 2a,c,e show that a low-pressure region appears at the excavation face and the tunnel wall within 1.0 m rearwards and
PP increases outward as the distance increases. Specifically, the value of
PP is 0 at the excavation face and quickly increases outward as the distance increases. On the XZ
Y = 0 section,
PP contour appears elliptical symmetrically for the
x-axis, with the ellipse’s major axis along with the
z-axis. On the vertical profile, the
PP contour distributes in a funnel shape. The
FV contours in
Figure 2b,d,f show that groundwater flows mainly from the overlapped intersection zone and the damage zone of faults to the tunnel. The
FV value is increased with a maximum magnitude of 0.0205 m/s. On the XZ
Y = 0 section, the
FV contour is symmetrically distributed along the
x-axis. Groundwater flows from both sides of the tunnel to the inside along the fault intersection.
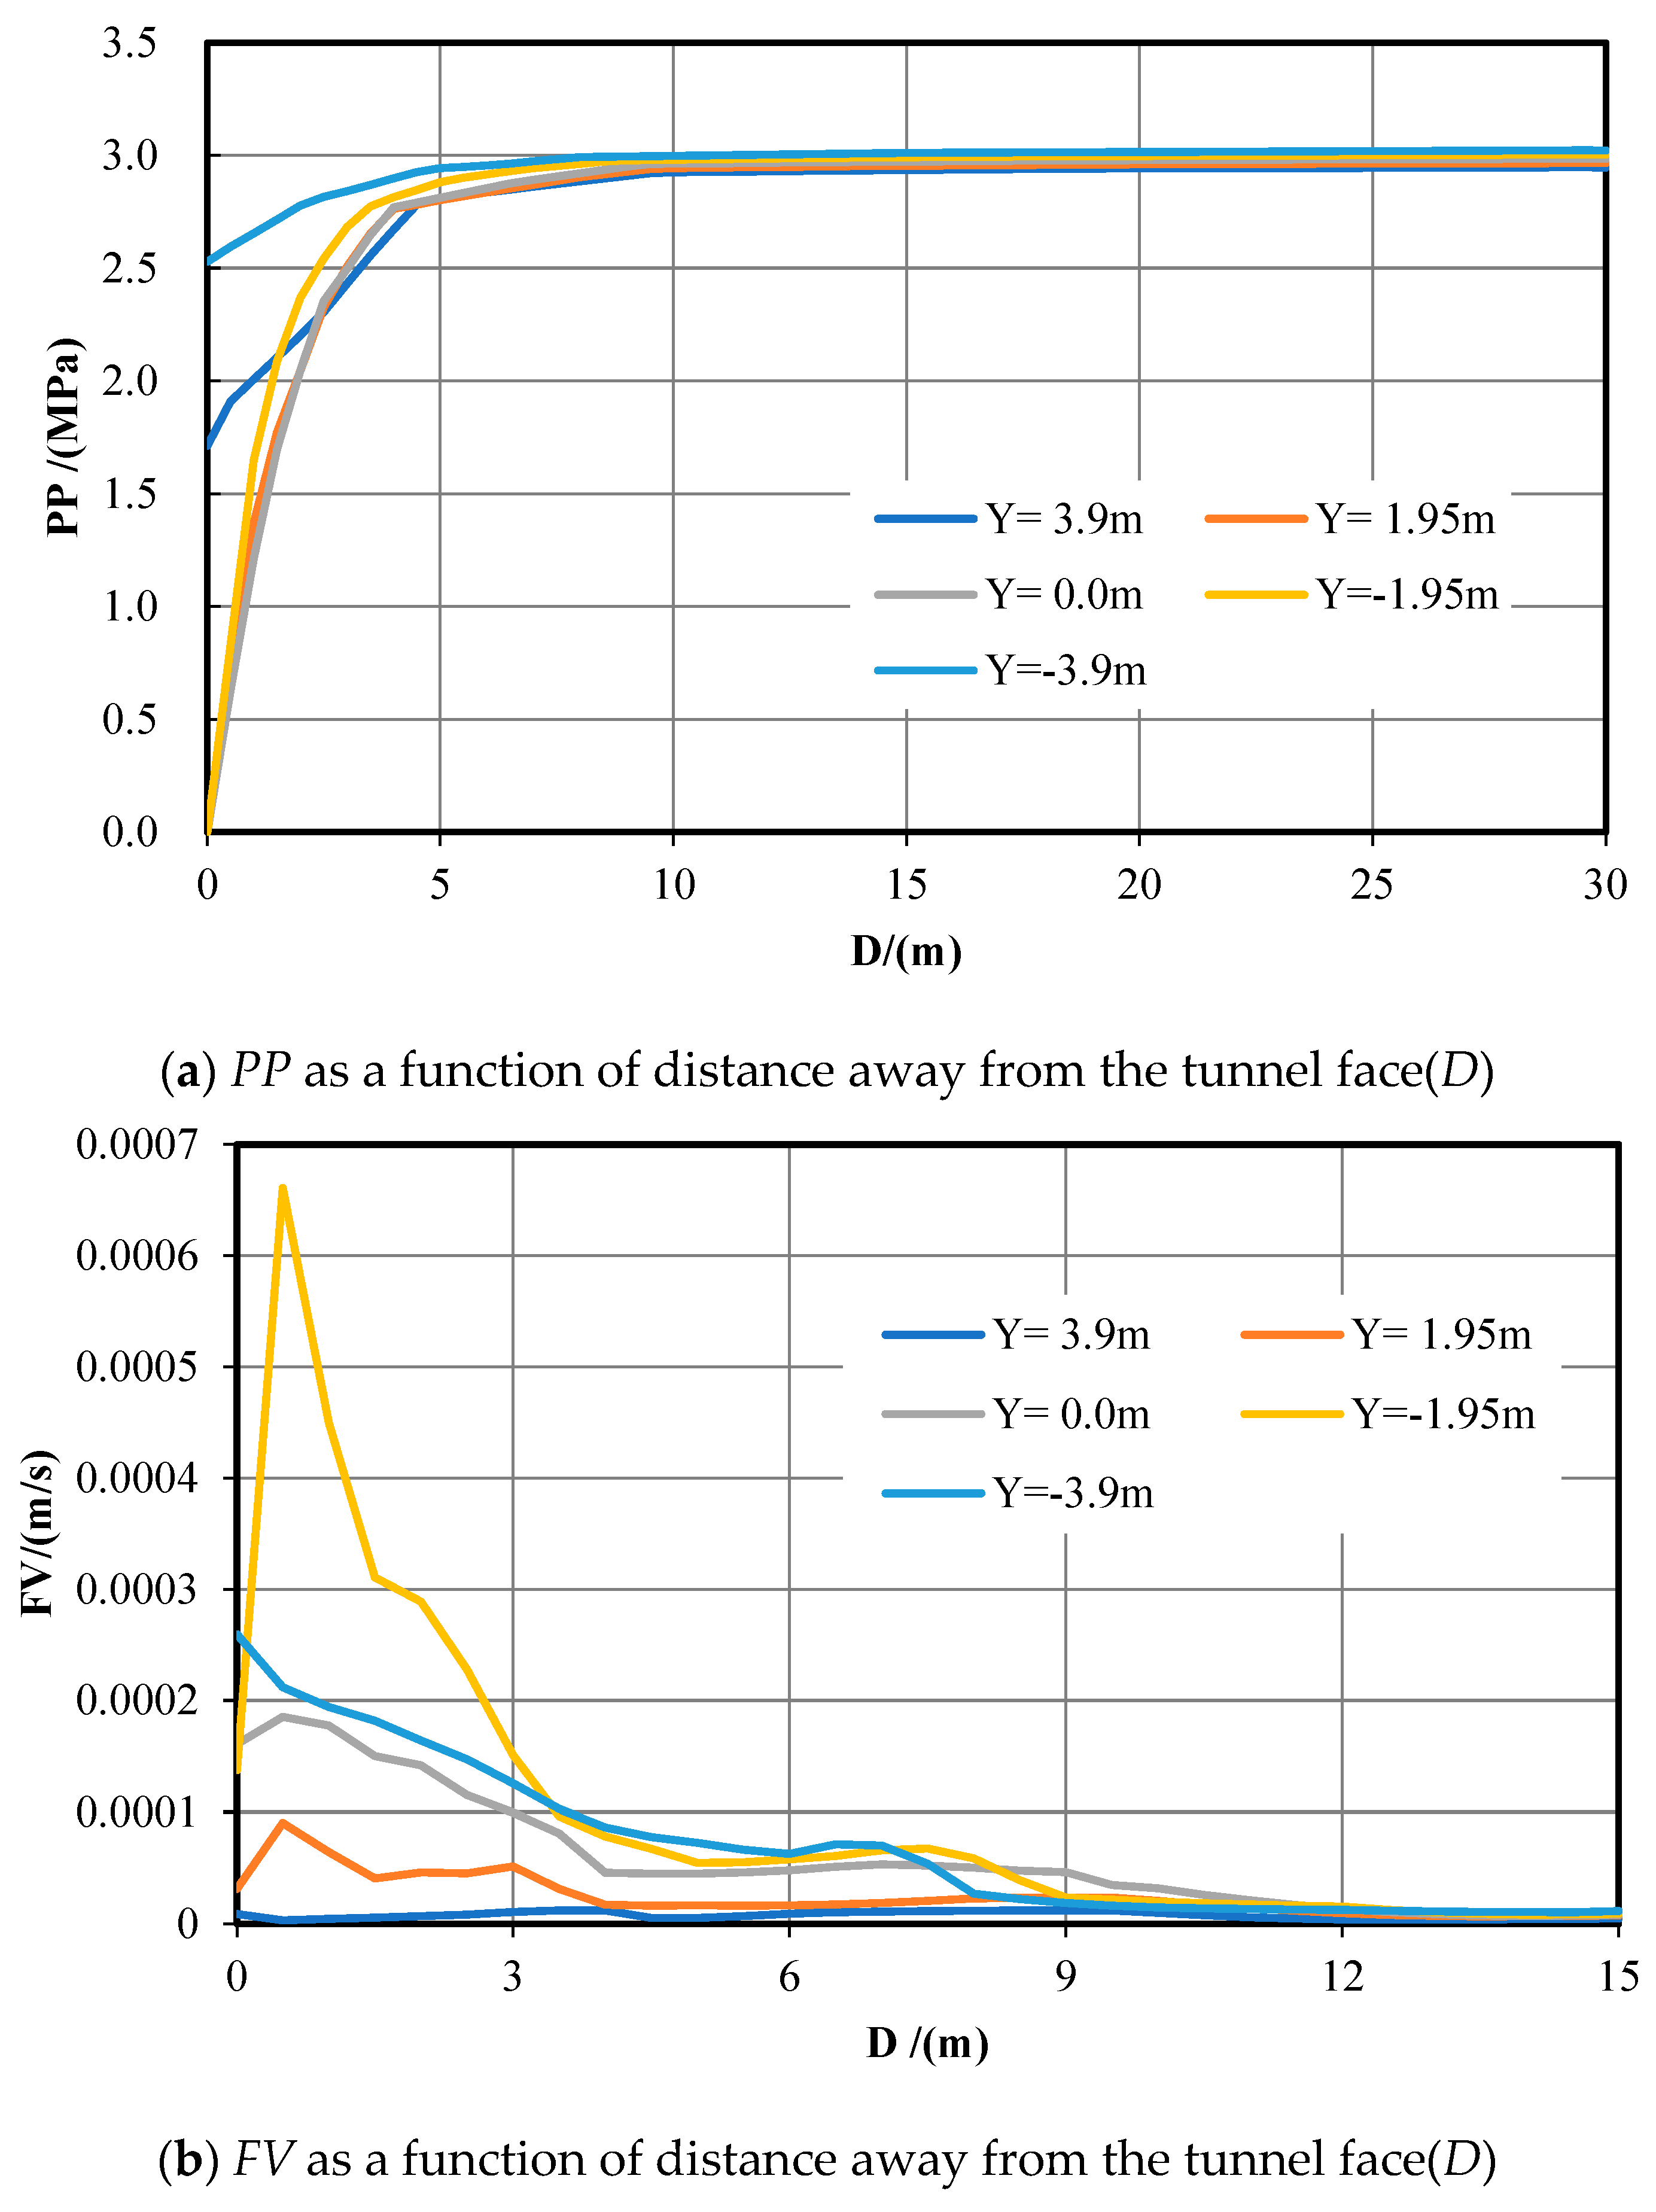
Five measuring lines were placed 50 m in front of the excavation face to monitor and explore the variation law of
PP and
FV as listed in
Table 2 and
Figure 7.
On the Y = 3.9 m and Y = −3.9 m sections, it can be seen in
Figure 7(a) that the values of
PP at the excavation face are 1.12 MPa and 1.05 MPa, respectively. They increase rapidly with the increase in
D within 5 m ahead, then increase slowly and eventually stabilize at 3.0 MPa. When Y = ±1.95 and Y = 0, the
PP value at the excavation face is 0 and increases quickly within 5 m ahead and finally stabilizes at about 3 MPa. Within 5 m ahead of the excavation face, the values of
PP on sections of Y = ±3.9 m are significantly bigger than that on sections of Y = ±1.95 m and 0, and the
PP value on the section of Y = −3.9 m is larger than on the section of Y = 3.95 m.
Figure 7b shows that, on the Y = 1.95 m, 0, and −1.95 m sections, the maximum values of
FV appear at
D = 1 m, which are 0.014 m/s, 0.009 m/s, and 0.015 m/s, respectively. Then, it decreases rapidly within 9 m ahead of the excavation face until reaching zero. When Y = 3.9 m and Y = −3.9 m, the maximum value of
FV is 0.005 m/s and 0.004 m/s, respectively. Then, it decreases slowly within 9 m ahead of the tunnel face until reaching zero. The value of
FV at the tunnel vault or floor is bigger than that at the tunnel face center. Near the excavation face, the
FV order is
UY = 1.95 =
UY = −1.95 >
UY = 0 >
UY = 3.9 =
UY = −3.9.
In terms of water inflow, we acquire the water inflow rate of 670.37 m3/h at the excavation face and the total water inflow rate of 1813.16 m3/h by integrating the FV over the area.
3.4. Tunnel Is 20 m above the Center of the Two Intersecting Faults
Figure 8 reveals
PP and
FV contours on various sections (XZ
Y = −20, XY
Z = 0, YZ
X = 0) while the tunnel is excavated to 20 m above the two intersecting faults (Y = −20).
As shown in the PP contours, a low-pressure region is seen at the excavation face and the tunnel wall within 1.0 m rearwards and increases. Specifically, the value of PP is 0 at the excavation face and then quickly increases with the increasing of D. On the cross-section of XZY = 0, the PP contours are distributed elliptically symmetrically along the x-axis, and the ellipse’s major axis is parallel to the z-axis. On the vertical downward section, pore pressure gradually increases with the burial depth and is displayed in a funnel-shape near the excavation face. As shown in the FV contours, groundwater mainly flows from the overlapped intersection zone and the damage zone of the faults to the tunnel, with a maximum value of 1.26 × 10⁻³ m/s. The FV contour appears symmetrically with respect to the x-axis on the section of XZY = 0 and the y-axis on the section of YZX = 0. The value of FV underneath the tunnel floor is expressively bigger than that above the tunnel vault.
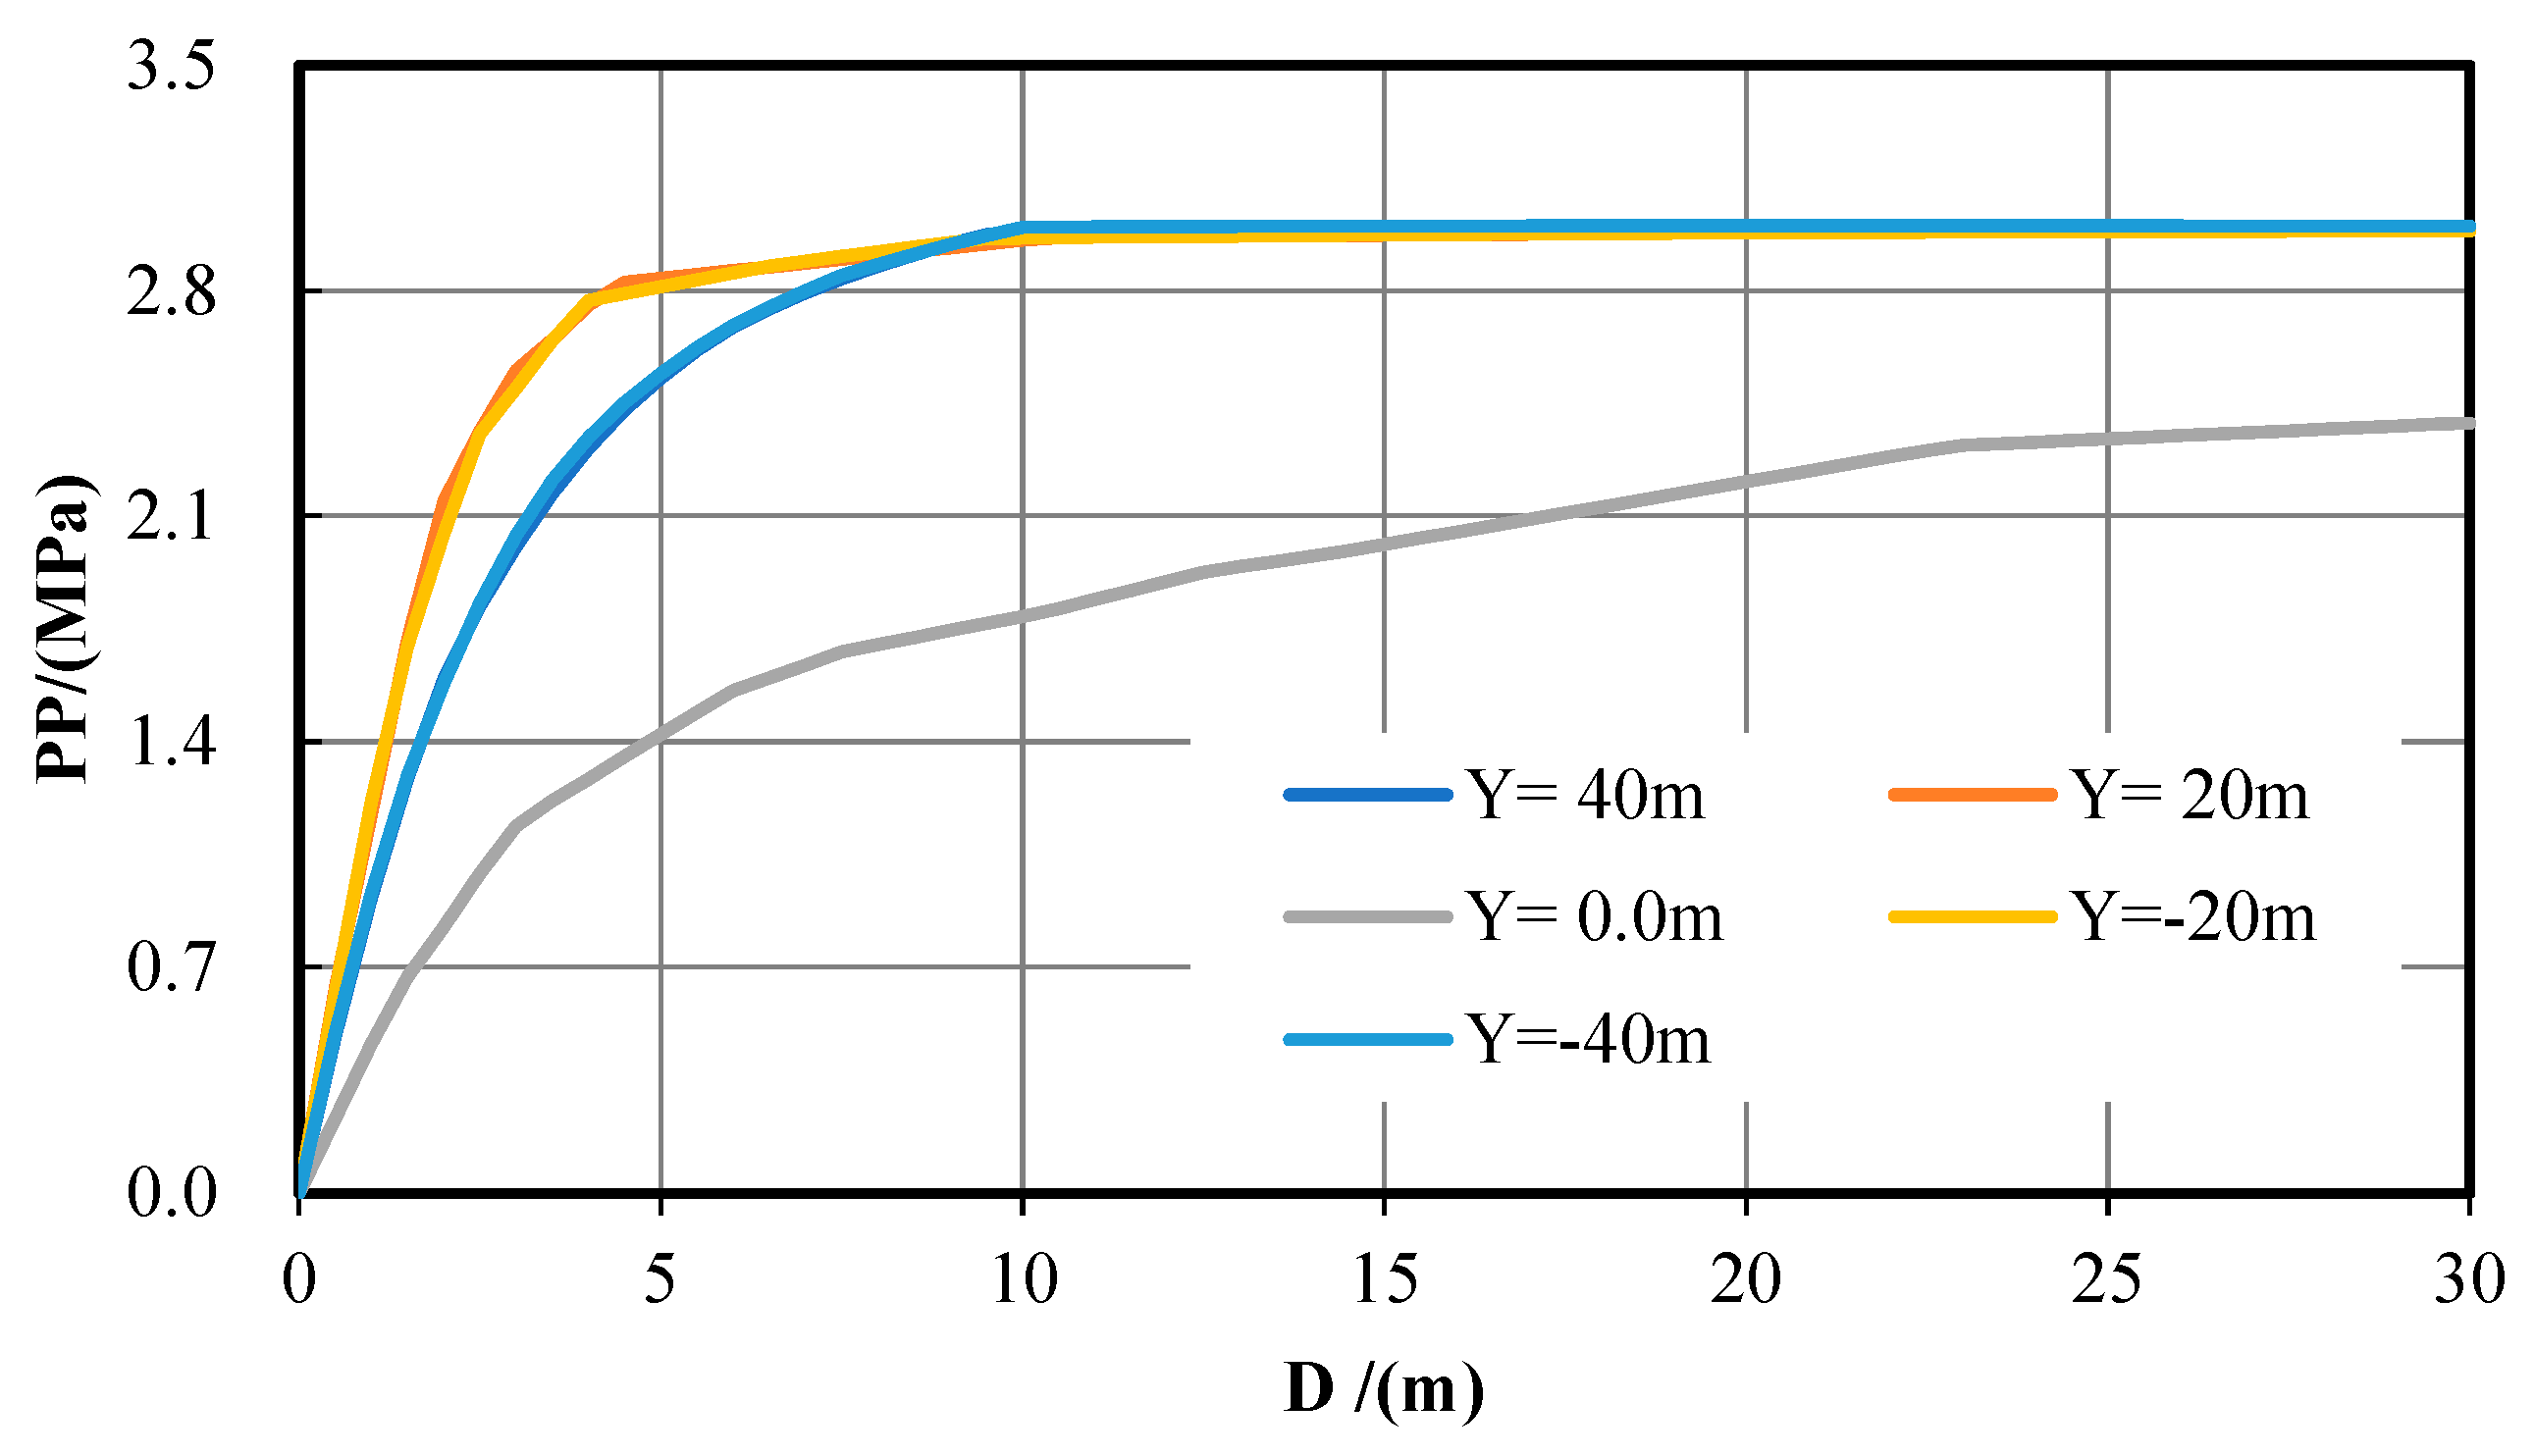
Five measuring lines were selected 50 m in front of the excavation face to monitor and explore the variation law of
PP and
FV as listed in
Table 2 and
Figure 9.
Figure 9a shows that, on the Y = 3.9 m section, the value of PP at the excavation face is about 2.53 MPa, and then gradually grows with the increase in D within 10 m ahead and eventually stabilizes at 3 MPa. On the Y = −3.9 m section, the value of
PP at the excavation face is 1.71 MPa, and gradually grows within 5 m ahead and eventually stabilizes at 3 MPa. On the sections of Y = 1.95 m, 0, and −1.95 m,
PP at the excavation face is 0 and increases rapidly within 5 m ahead, then it grows tardily and stabilizes at the maximum value of 3 MPa finally in the 5 m~15 m range. The
PP value on sections of Y = ±3.9 m is significantly bigger than that on sections of Y = ±1.95 m and 0 within 5 m ahead.
As shown in
Figure 9b, on the section of Y = 3.9 m, the value of
FV is about 0. When on the sections of Y = 1.95 m, 0, −1.95 m, and −3.9 m, the maximum value of
FV is 9.06 × 10
−5 m/s, 1.85 × 10
−4 m/s, 6.62 × 10
−4 m/s, and 2.60 × 10
−4 m/s, respectively. Flow velocities are gradually reduced within a 9 m range of the excavation face until reaching zero. In the range of 0~5 m of the host rock zone, the flow velocities below the tunnel floor are bigger than that at the tunnel vault and above, and the flow velocities at the tunnel vault or floor are bigger than that at the tunnel face and the surrounding areas. The magnitude order of the velocities is
UY = −1.95 >
UY = −3.9 >
UY = 0 >
UY = 1.95 >
UY = 3.9.
In terms of water inflow, we acquire the water inflow rate of 12.04 m3/h at the excavation face and the total water inflow rate of 34.51 m3/h by integrating the FV over the area.
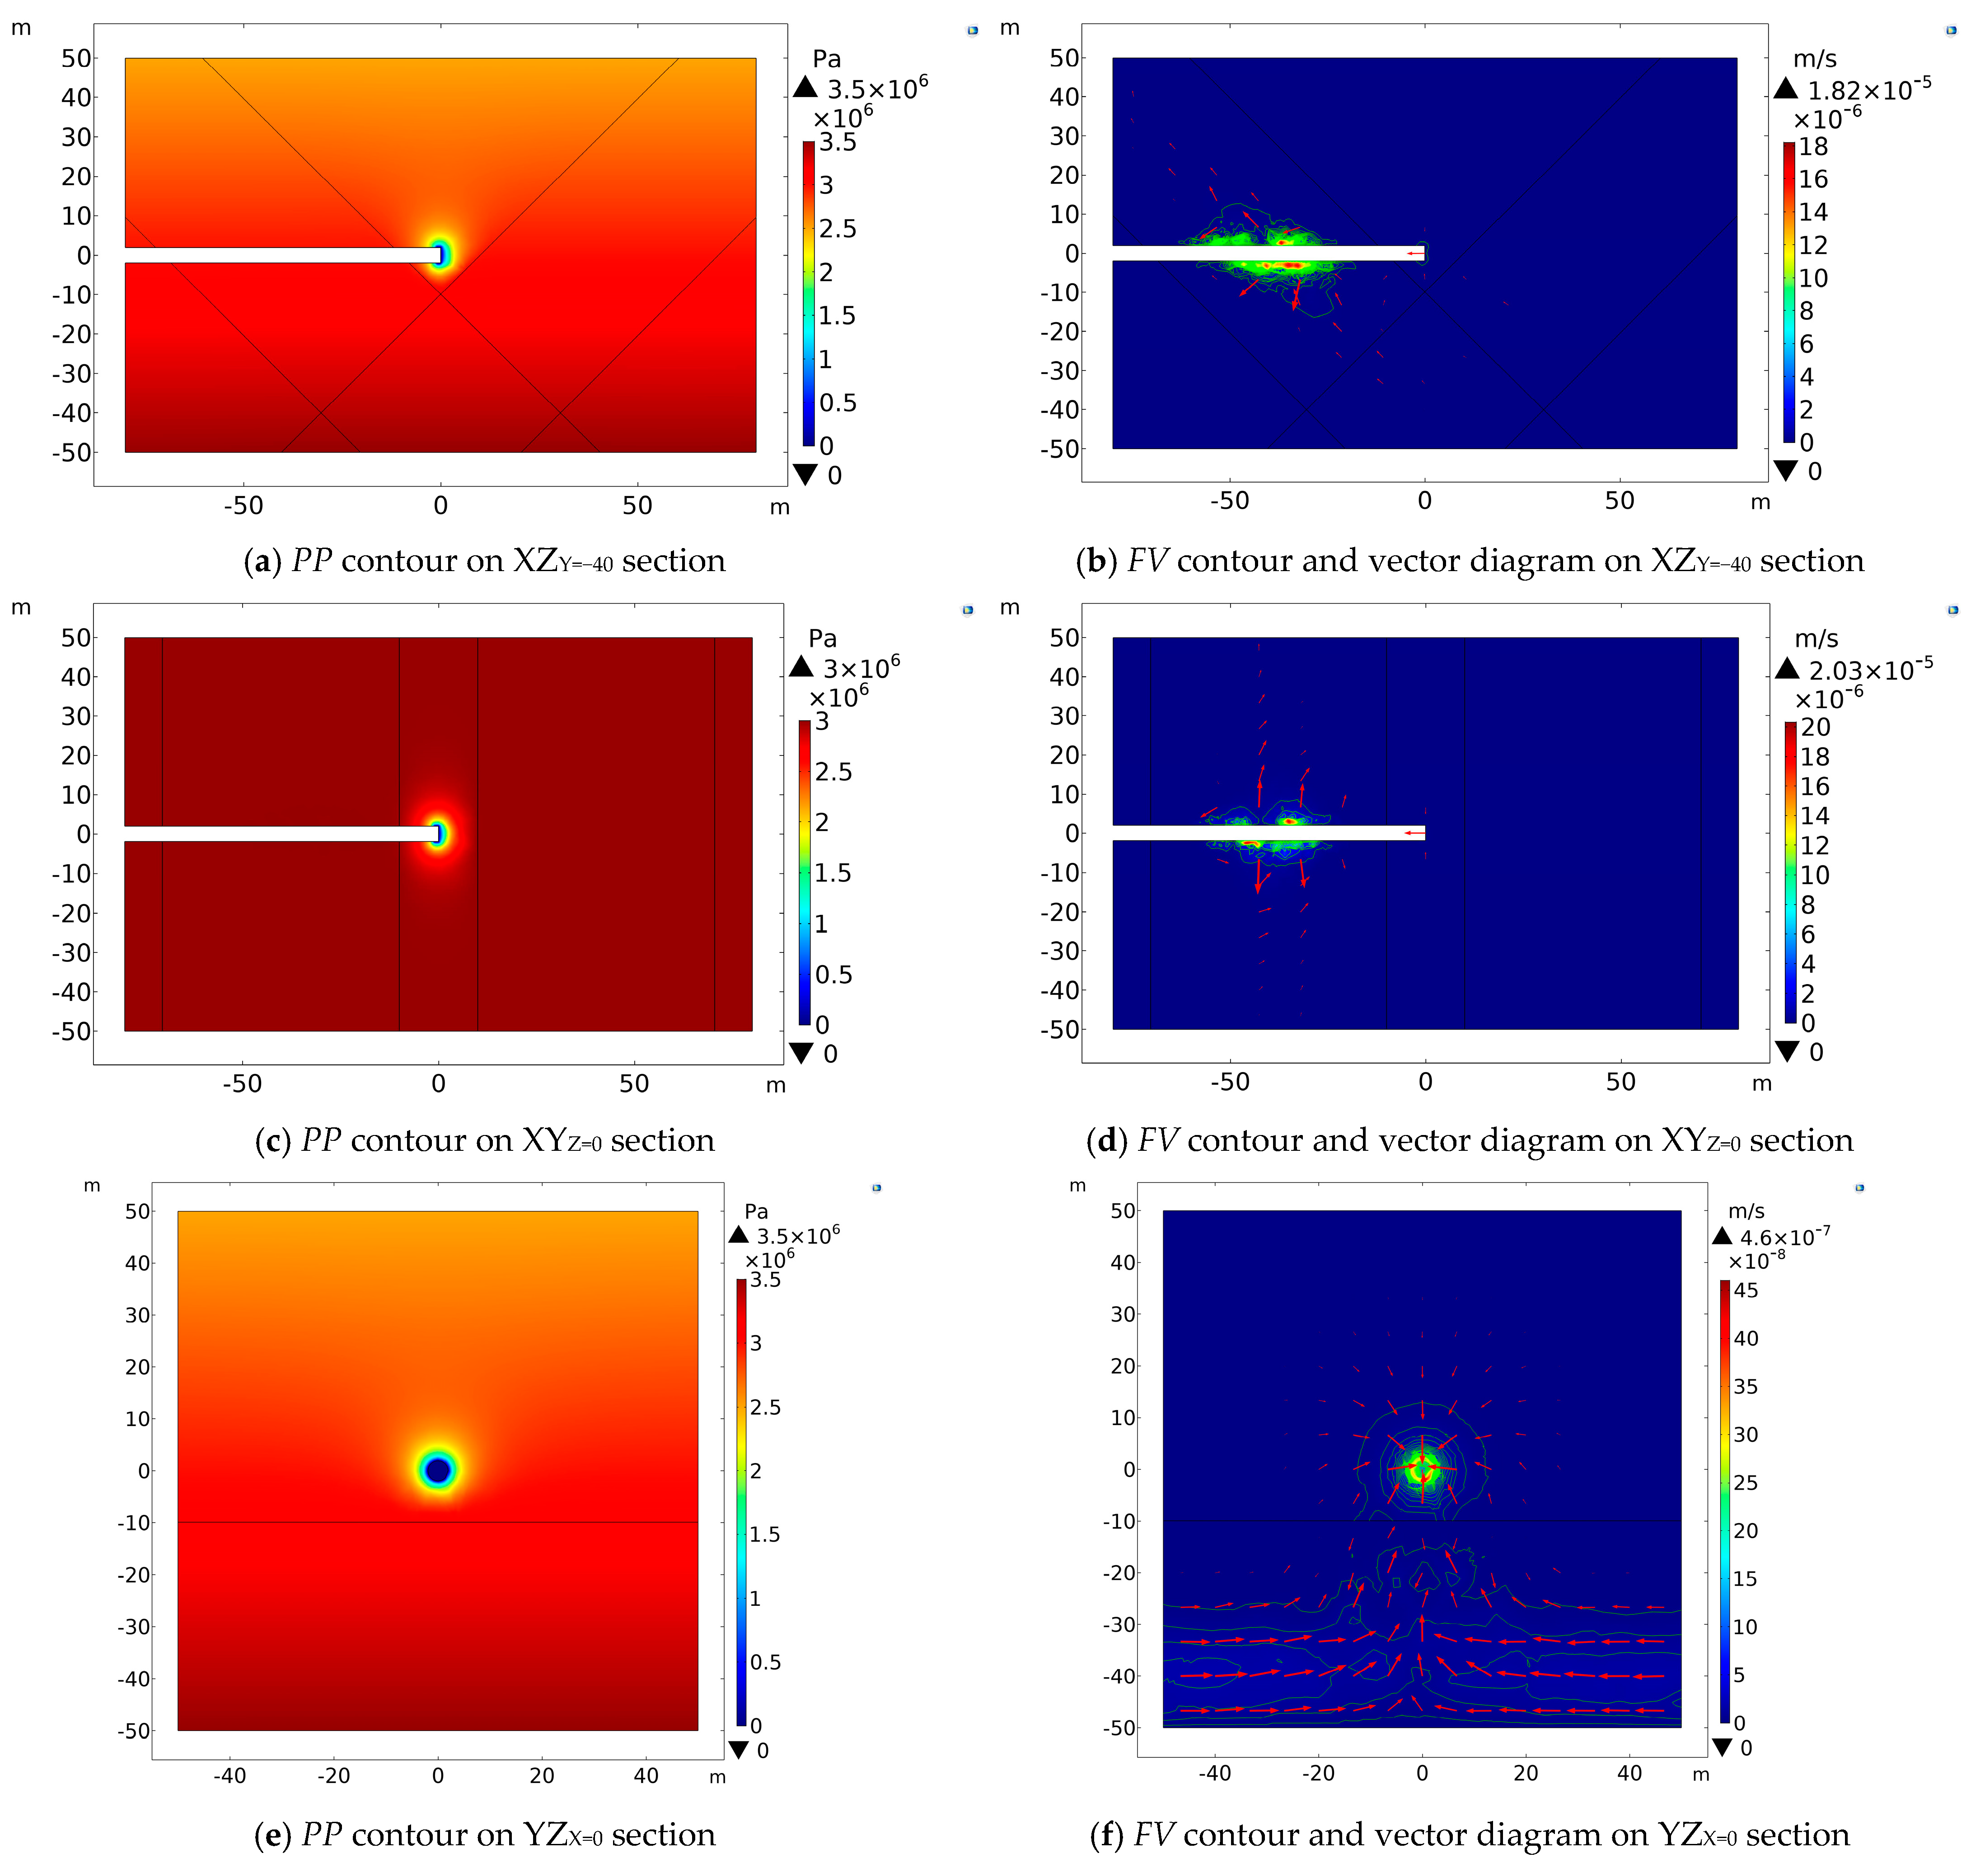
3.5. Tunnel Is 40 m above the Center of the Two Intersecting Faults
Figure 10 reveals
PP contours and
FV contours on various sections (XZ
Y = −40, XY
Z = 0, YZ
X = 0) while the tunnel is excavated to 40 m above these two intersecting faults (Y = −40).
The
PP contours in
Figure 10a,c,e all show a low-pressure region near the excavation face. Specifically, the value of
PP is 0 at the excavation face and quickly increases outward with the increase in
D. On the XZ
Y = −40 section, the
PP contours are symmetrically elliptical with respect to the
x-axis, and the central axis is parallel to the
z-axis. On the YZ
X = 0 section, pore pressure increases with the burial depth and is presented in a funnel shape near the excavation face. The
FV contours reveal that groundwater mainly flows from the overlapped intersection zone and the damage zone of faults to the tunnel with a small
FV and the maximum value is just about 2.03 × 10
−5 m/s. Five measuring lines were placed 50 m in front of the excavation face to monitor and explore the variation law of
PP and
FV as listed in
Table 2 and
Figure 11.
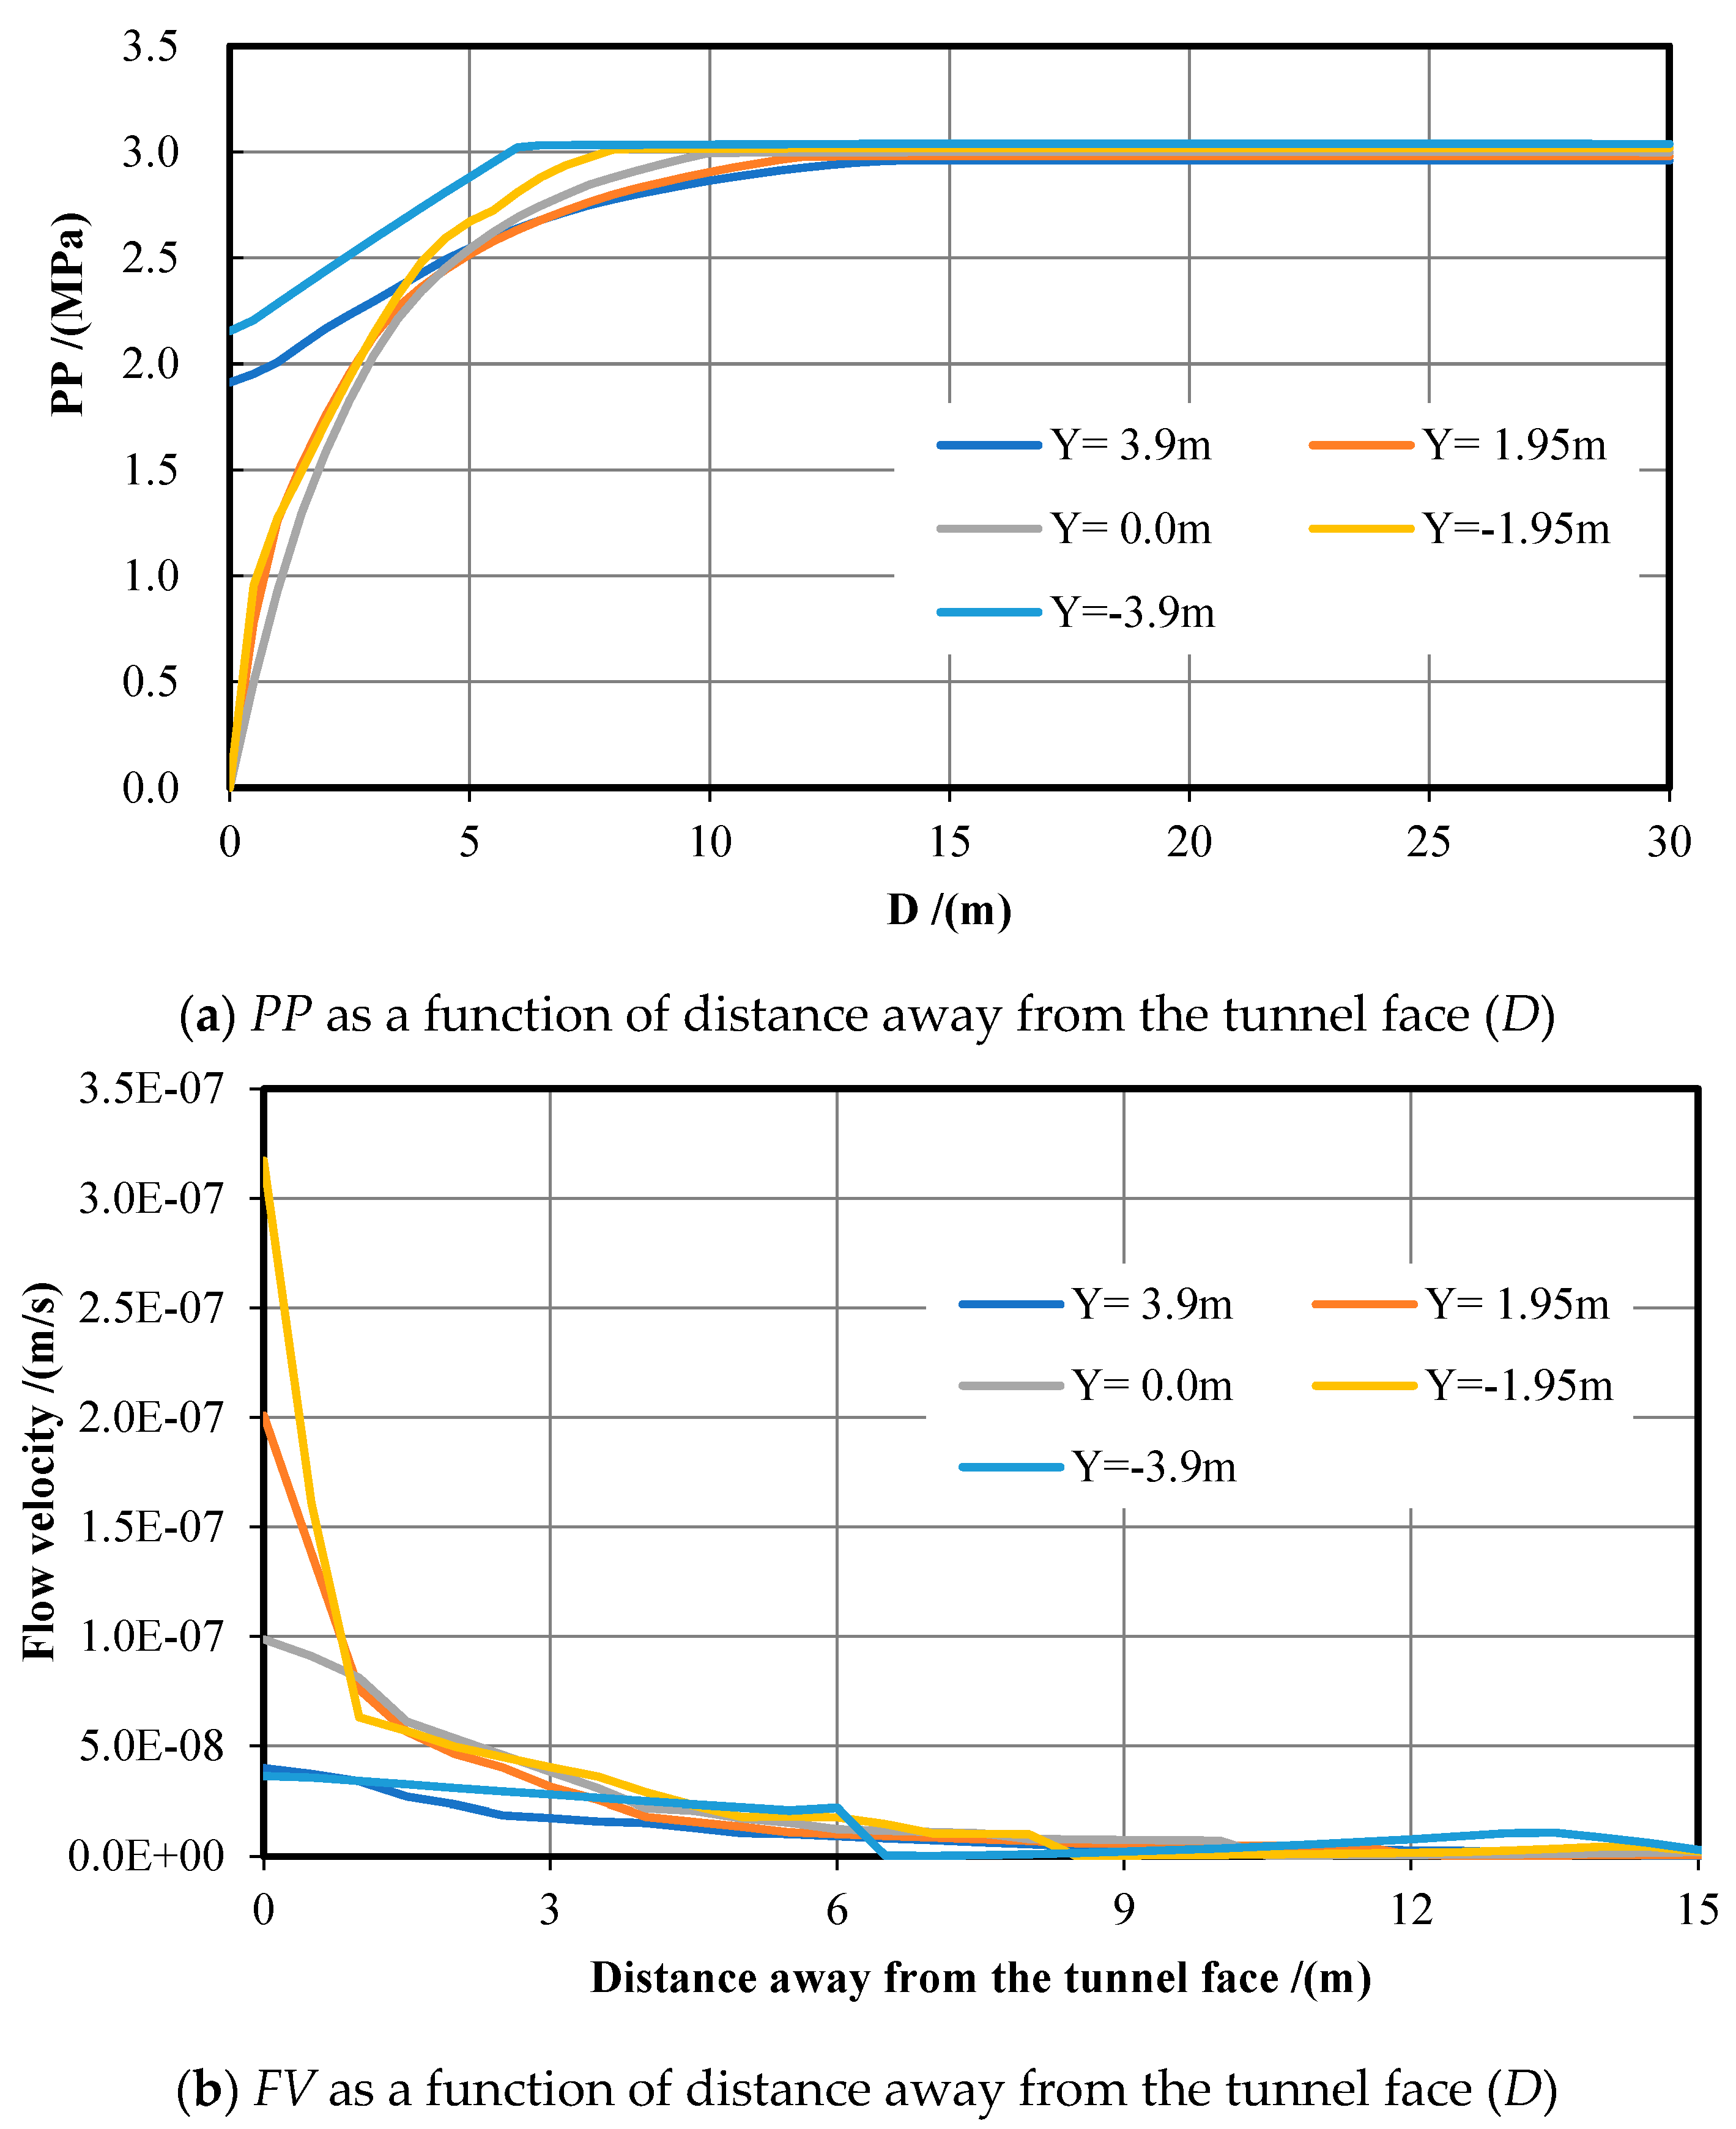
Figure 11a shows that, on the sections of Y = 3.9 m and Y = −3.9 m, the values of PP increase gradually from 1.91 MPa to 2.15 MPa at the excavation face within 15 m and 6 m on the two sections, respectively, and finally stabilize approximately at 3 MPa. On the sections of Y = 1.95 m, 0, and −1.95 m, the value of
PP at the excavation face is 0, it increases rapidly first in the range of 5 m~15 m and then slowly afterwards, and finally stabilizes at 3 MPa. Within 5 m ahead, the
PP value on the Y = ±3.9 m section is significantly bigger than on the sections of Y = ±1.95 m and Y = 0.
Figure 11b shows that, on the sections of Y = 3.9 m and Y = −3.9 m,
FV decreases rapidly from the maximum value of 4.00 × 10
−8 m/s and 3.64 × 10
−8 m/s. On the section of Y = 0,
FV decreases slowly from the maximum value of 9.88 × 10
−8 m/s until it approaches 0. Within 9 m in front of the excavation face,
FV decreases gradually first and then slowly until it approaches zero. In 0~3 m of the host rock zone,
FV at and below the tunnel floor is much higher than that at the tunnel vault and above, and
FV at the tunnel vault or floor is bigger than that at the tunnel face and the surrounding areas. Their magnitudes are in the order of
UY = −1.95 >
UY = 1.95 >
UY = 0 >
UY = −3.9 >
UY = 3.9.
In terms of water inflow, we acquire the inflow rate of 0.0061 m3/h at the excavation face and the total inflow rate of 0.016 m3/h by integrating the FV over the area.


