

Projected Water Scarcity and Hydrological Extremes in the Yellow River Basin in the 21st Century under SSP-RCP Scenarios

Abstract
:1. Introduction
2. Materials and Methods
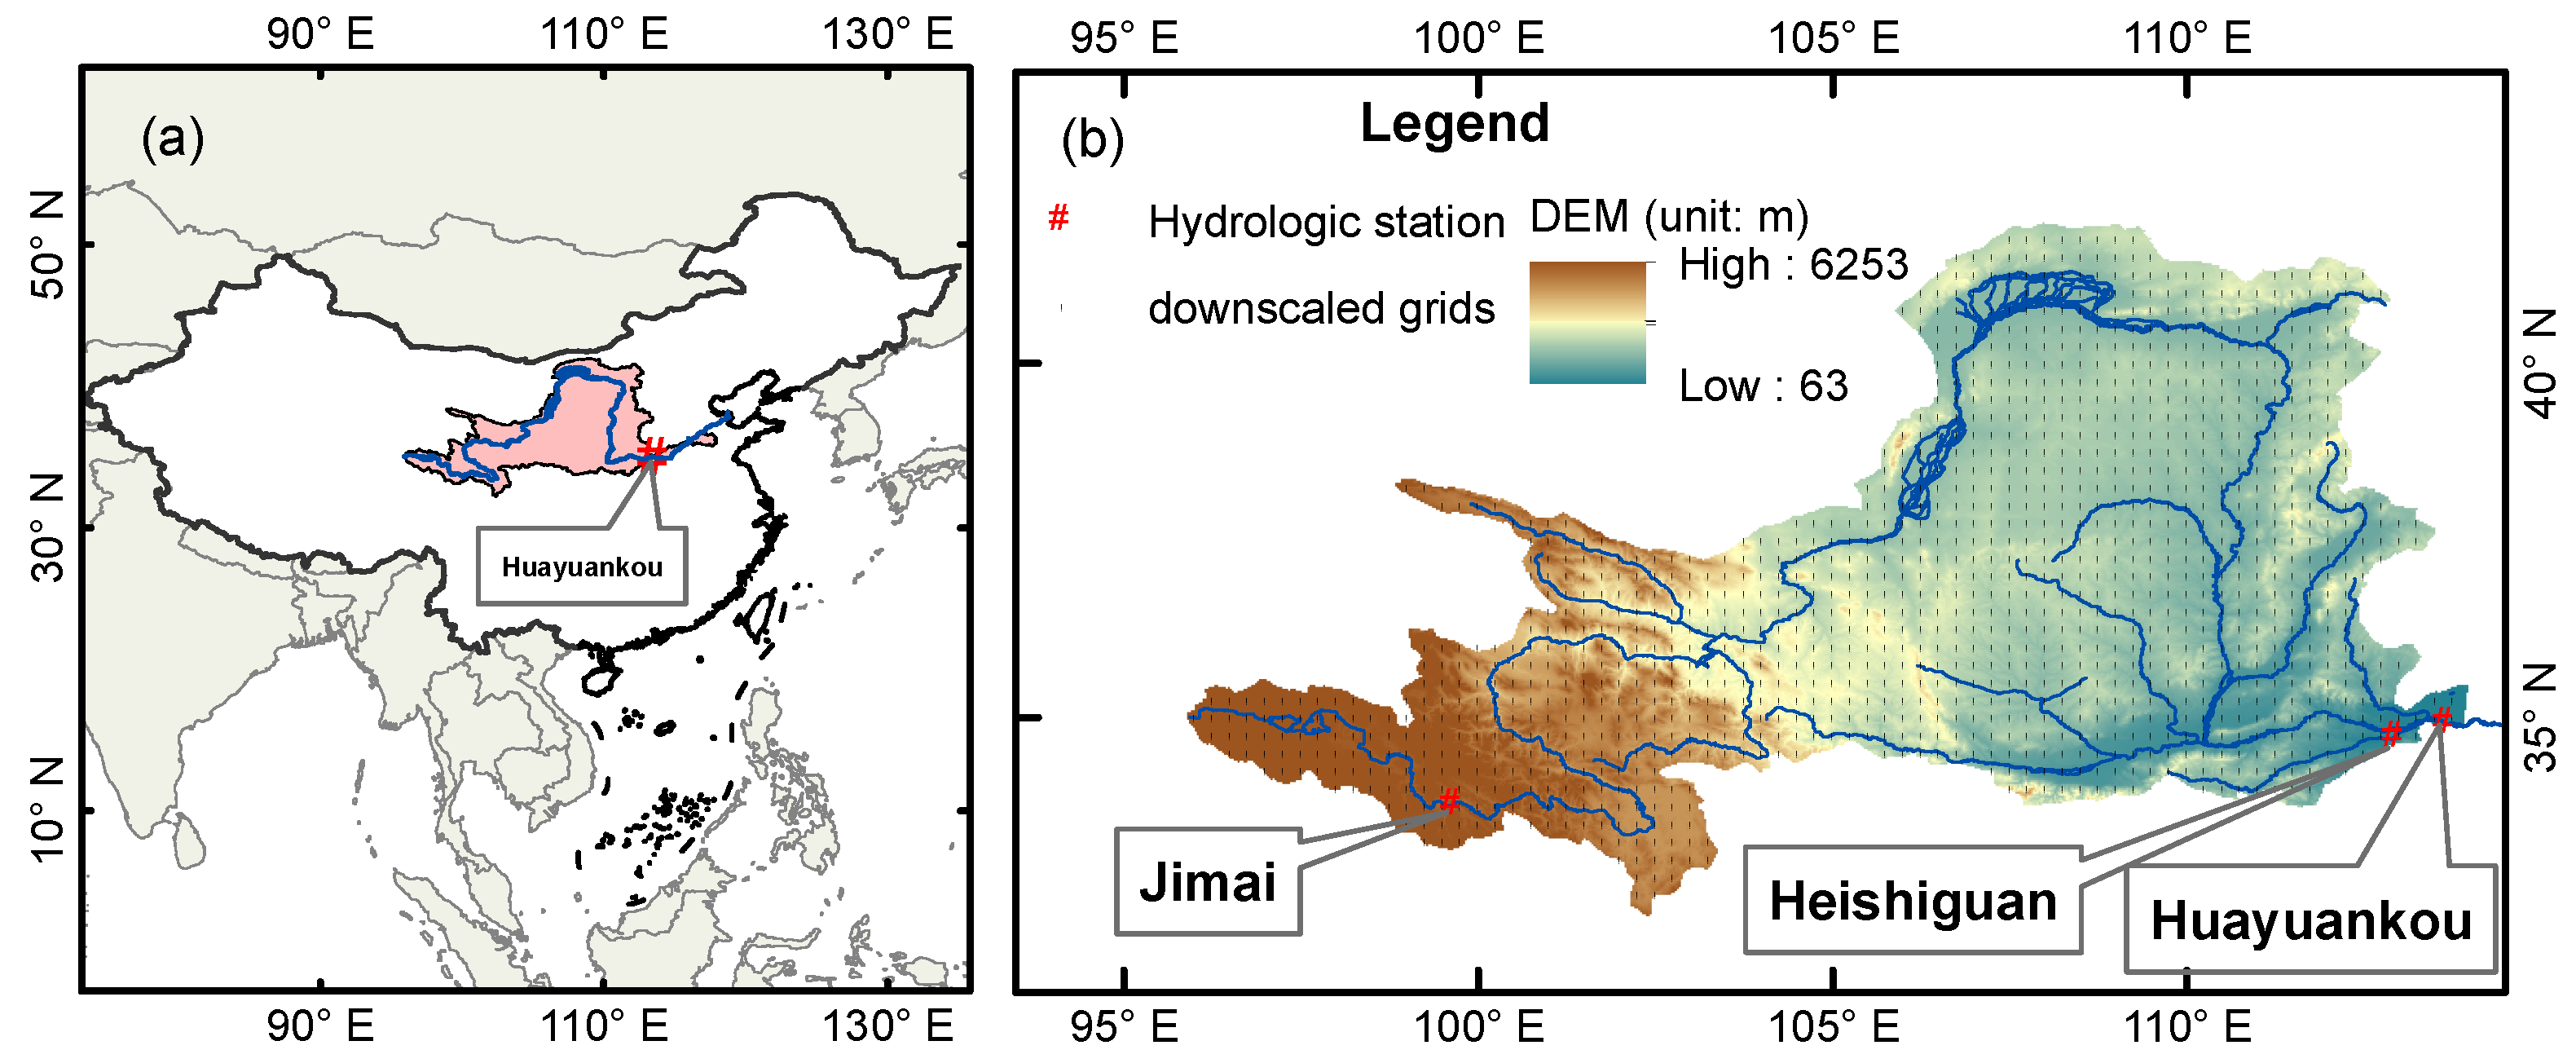
2.1. Study Region
2.2. Datasets
2.3. Hydrological Model
2.4. Projection of Hydrological Variables
3. Results
3.1. Performance Assessment of HBV-D
3.2. Changes in Water Scarcity
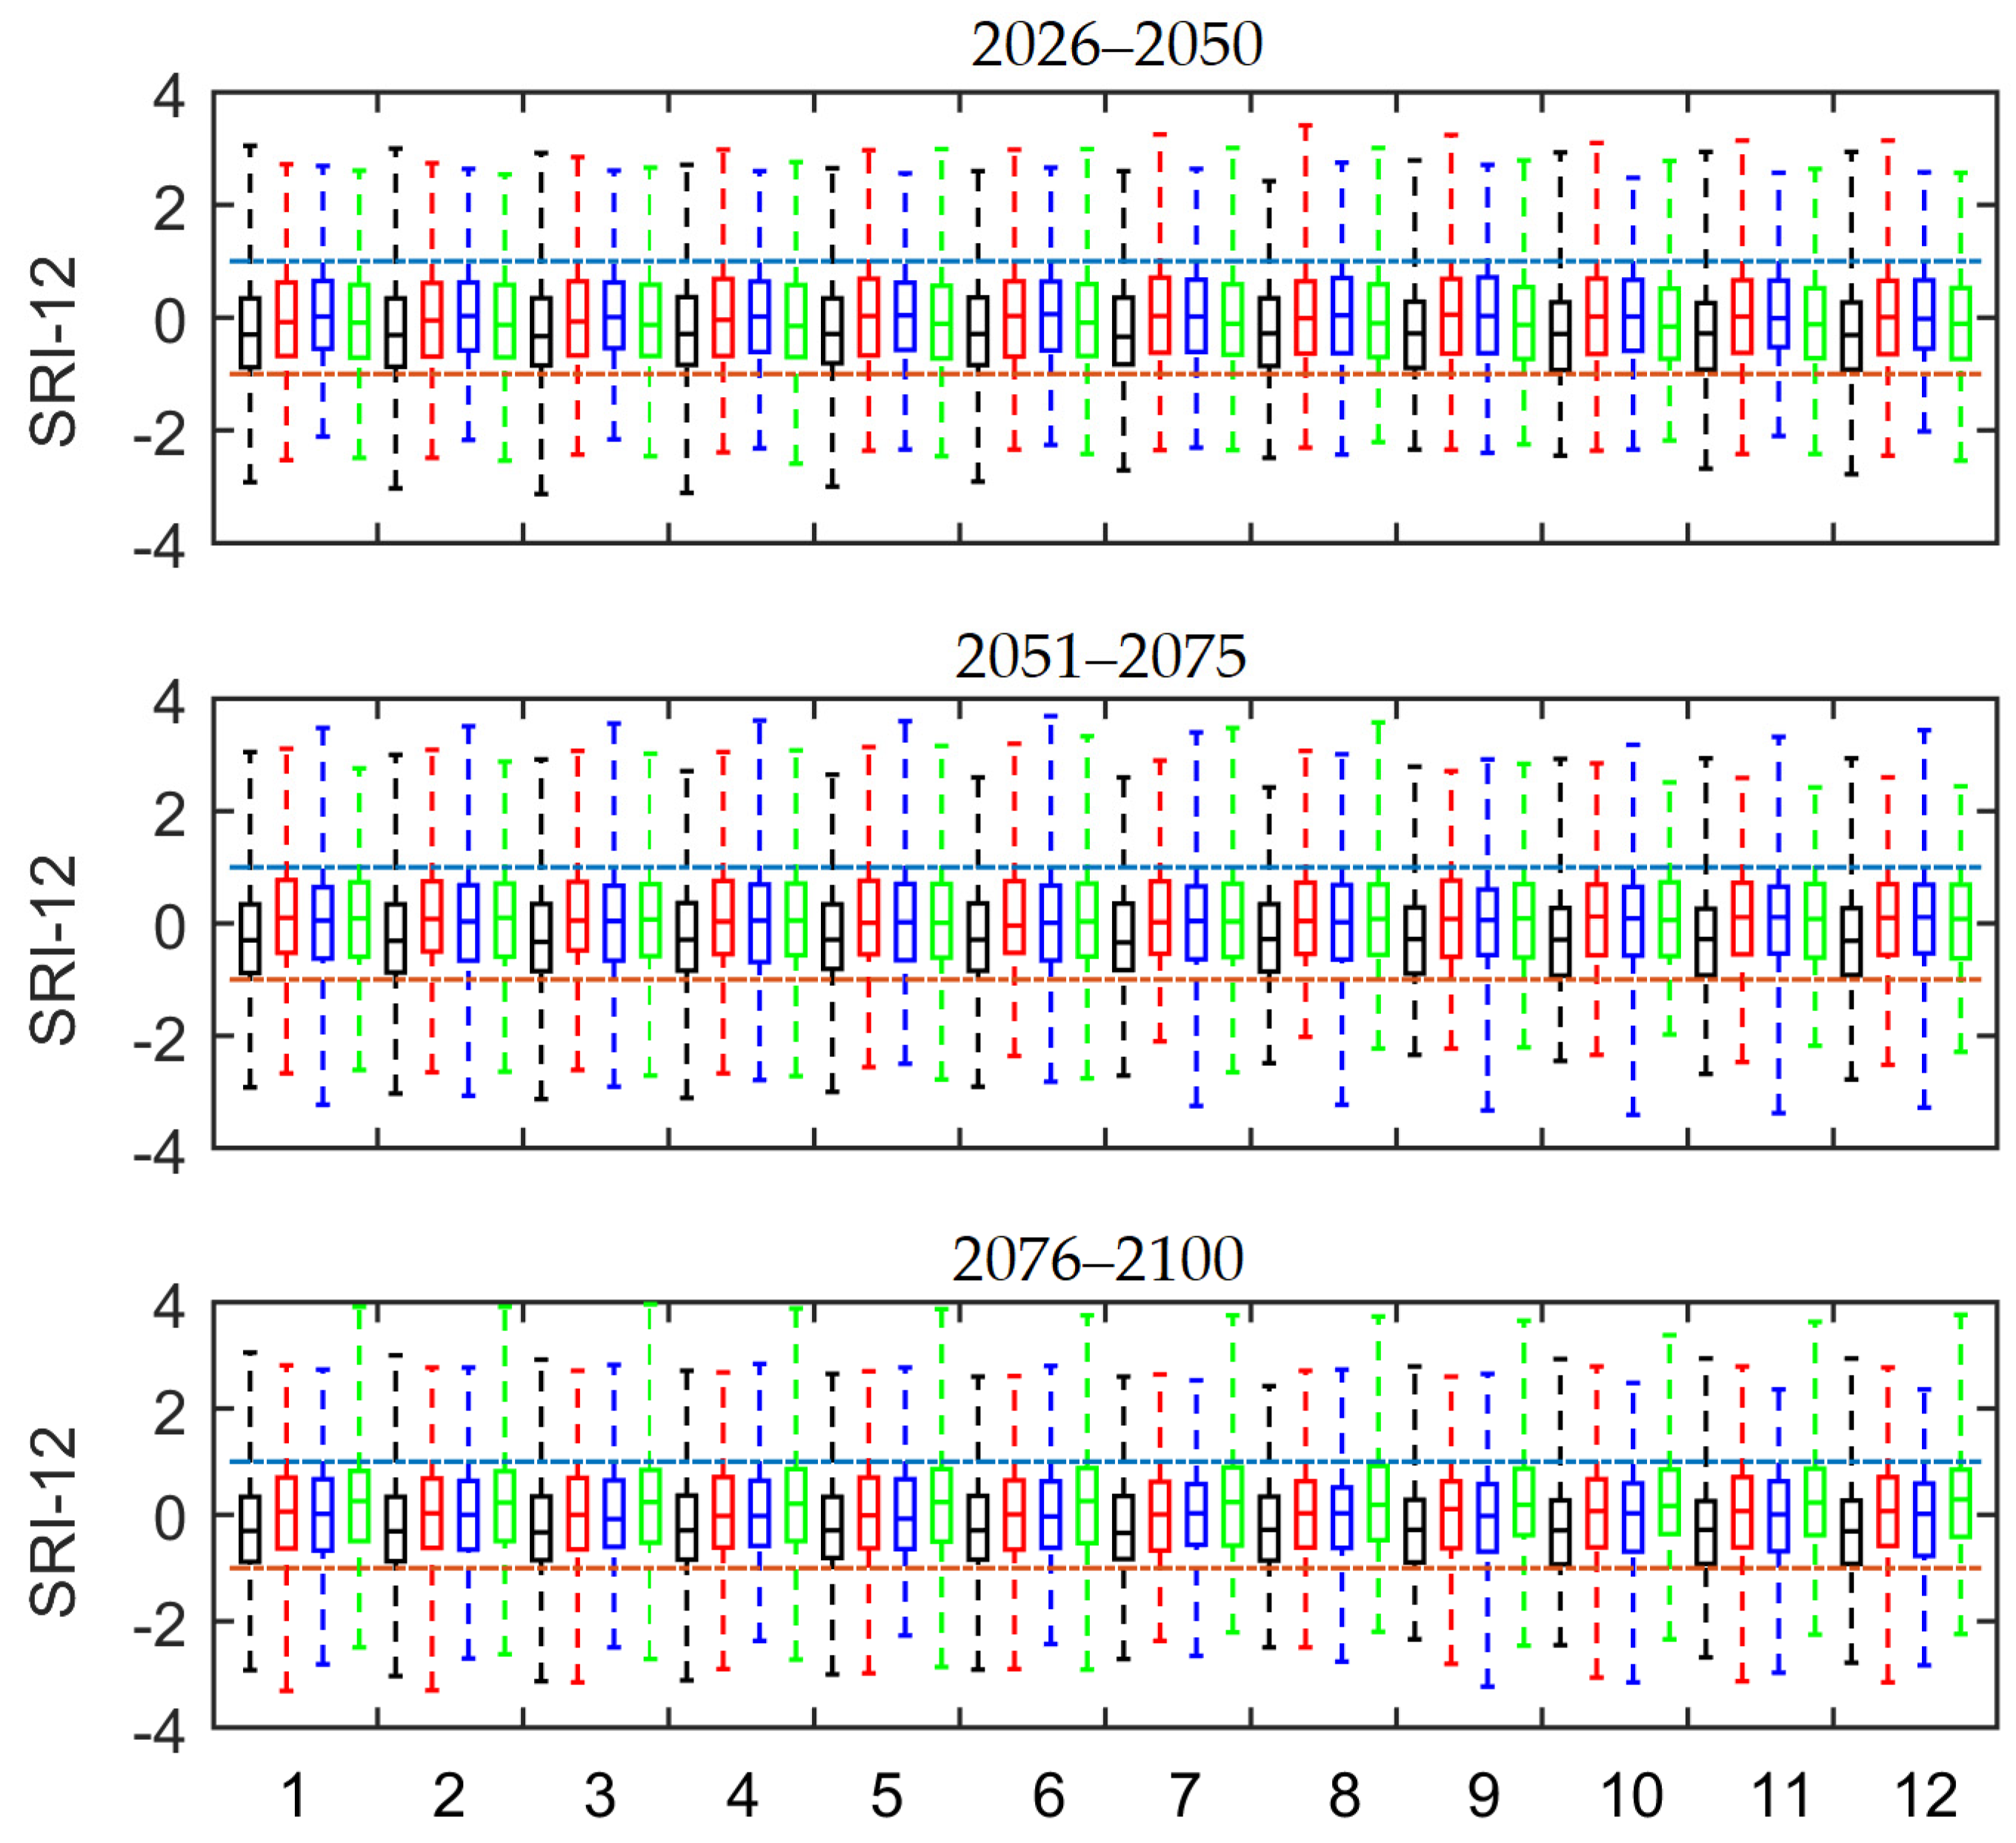
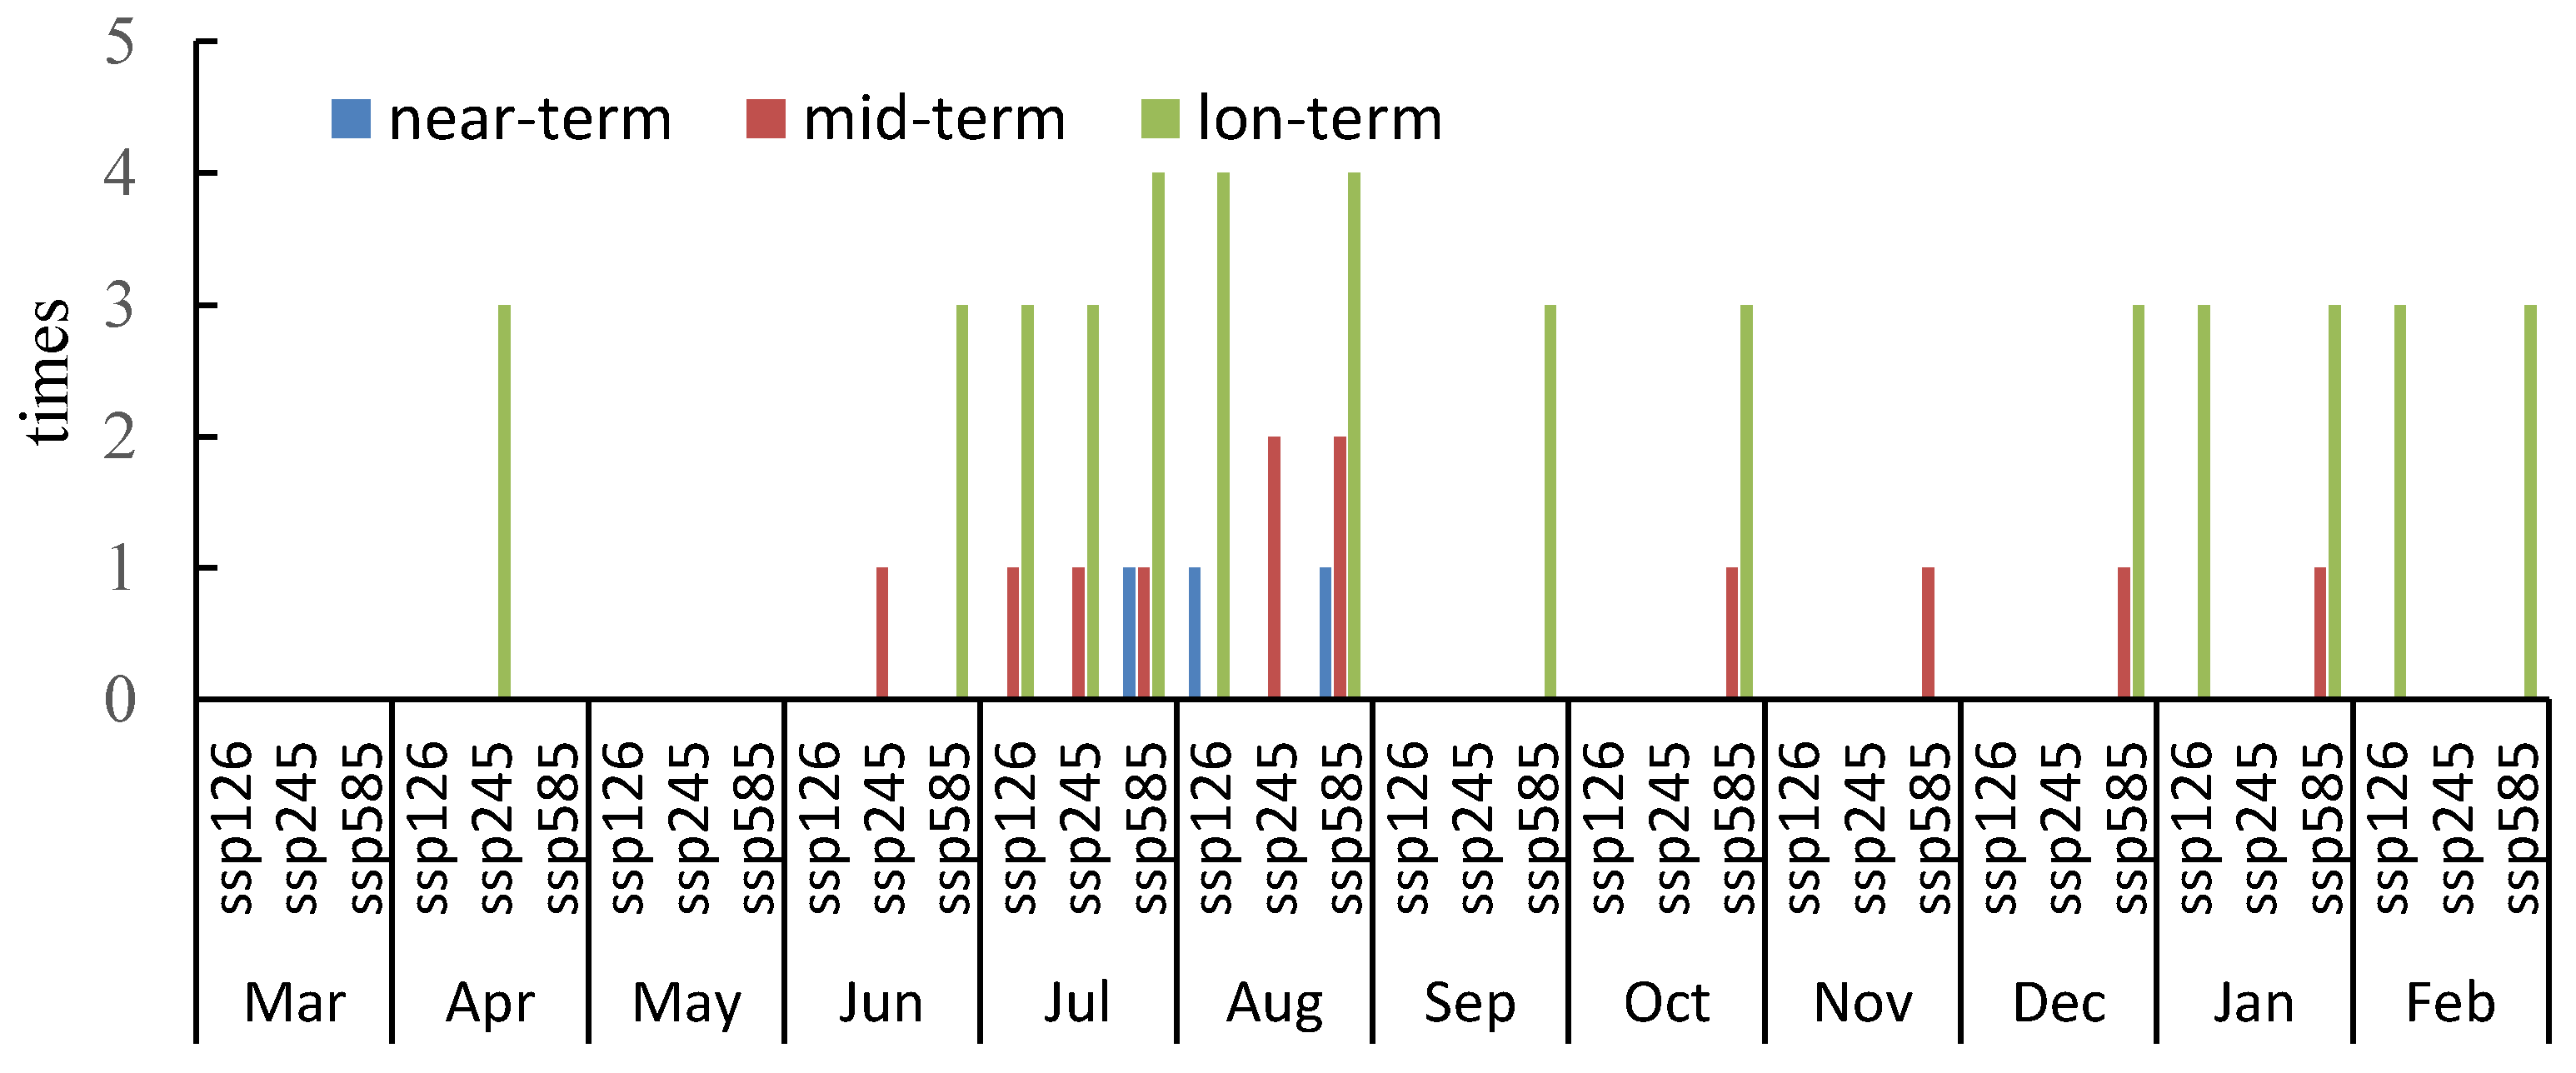
3.3. Changes in Hydrological Droughts
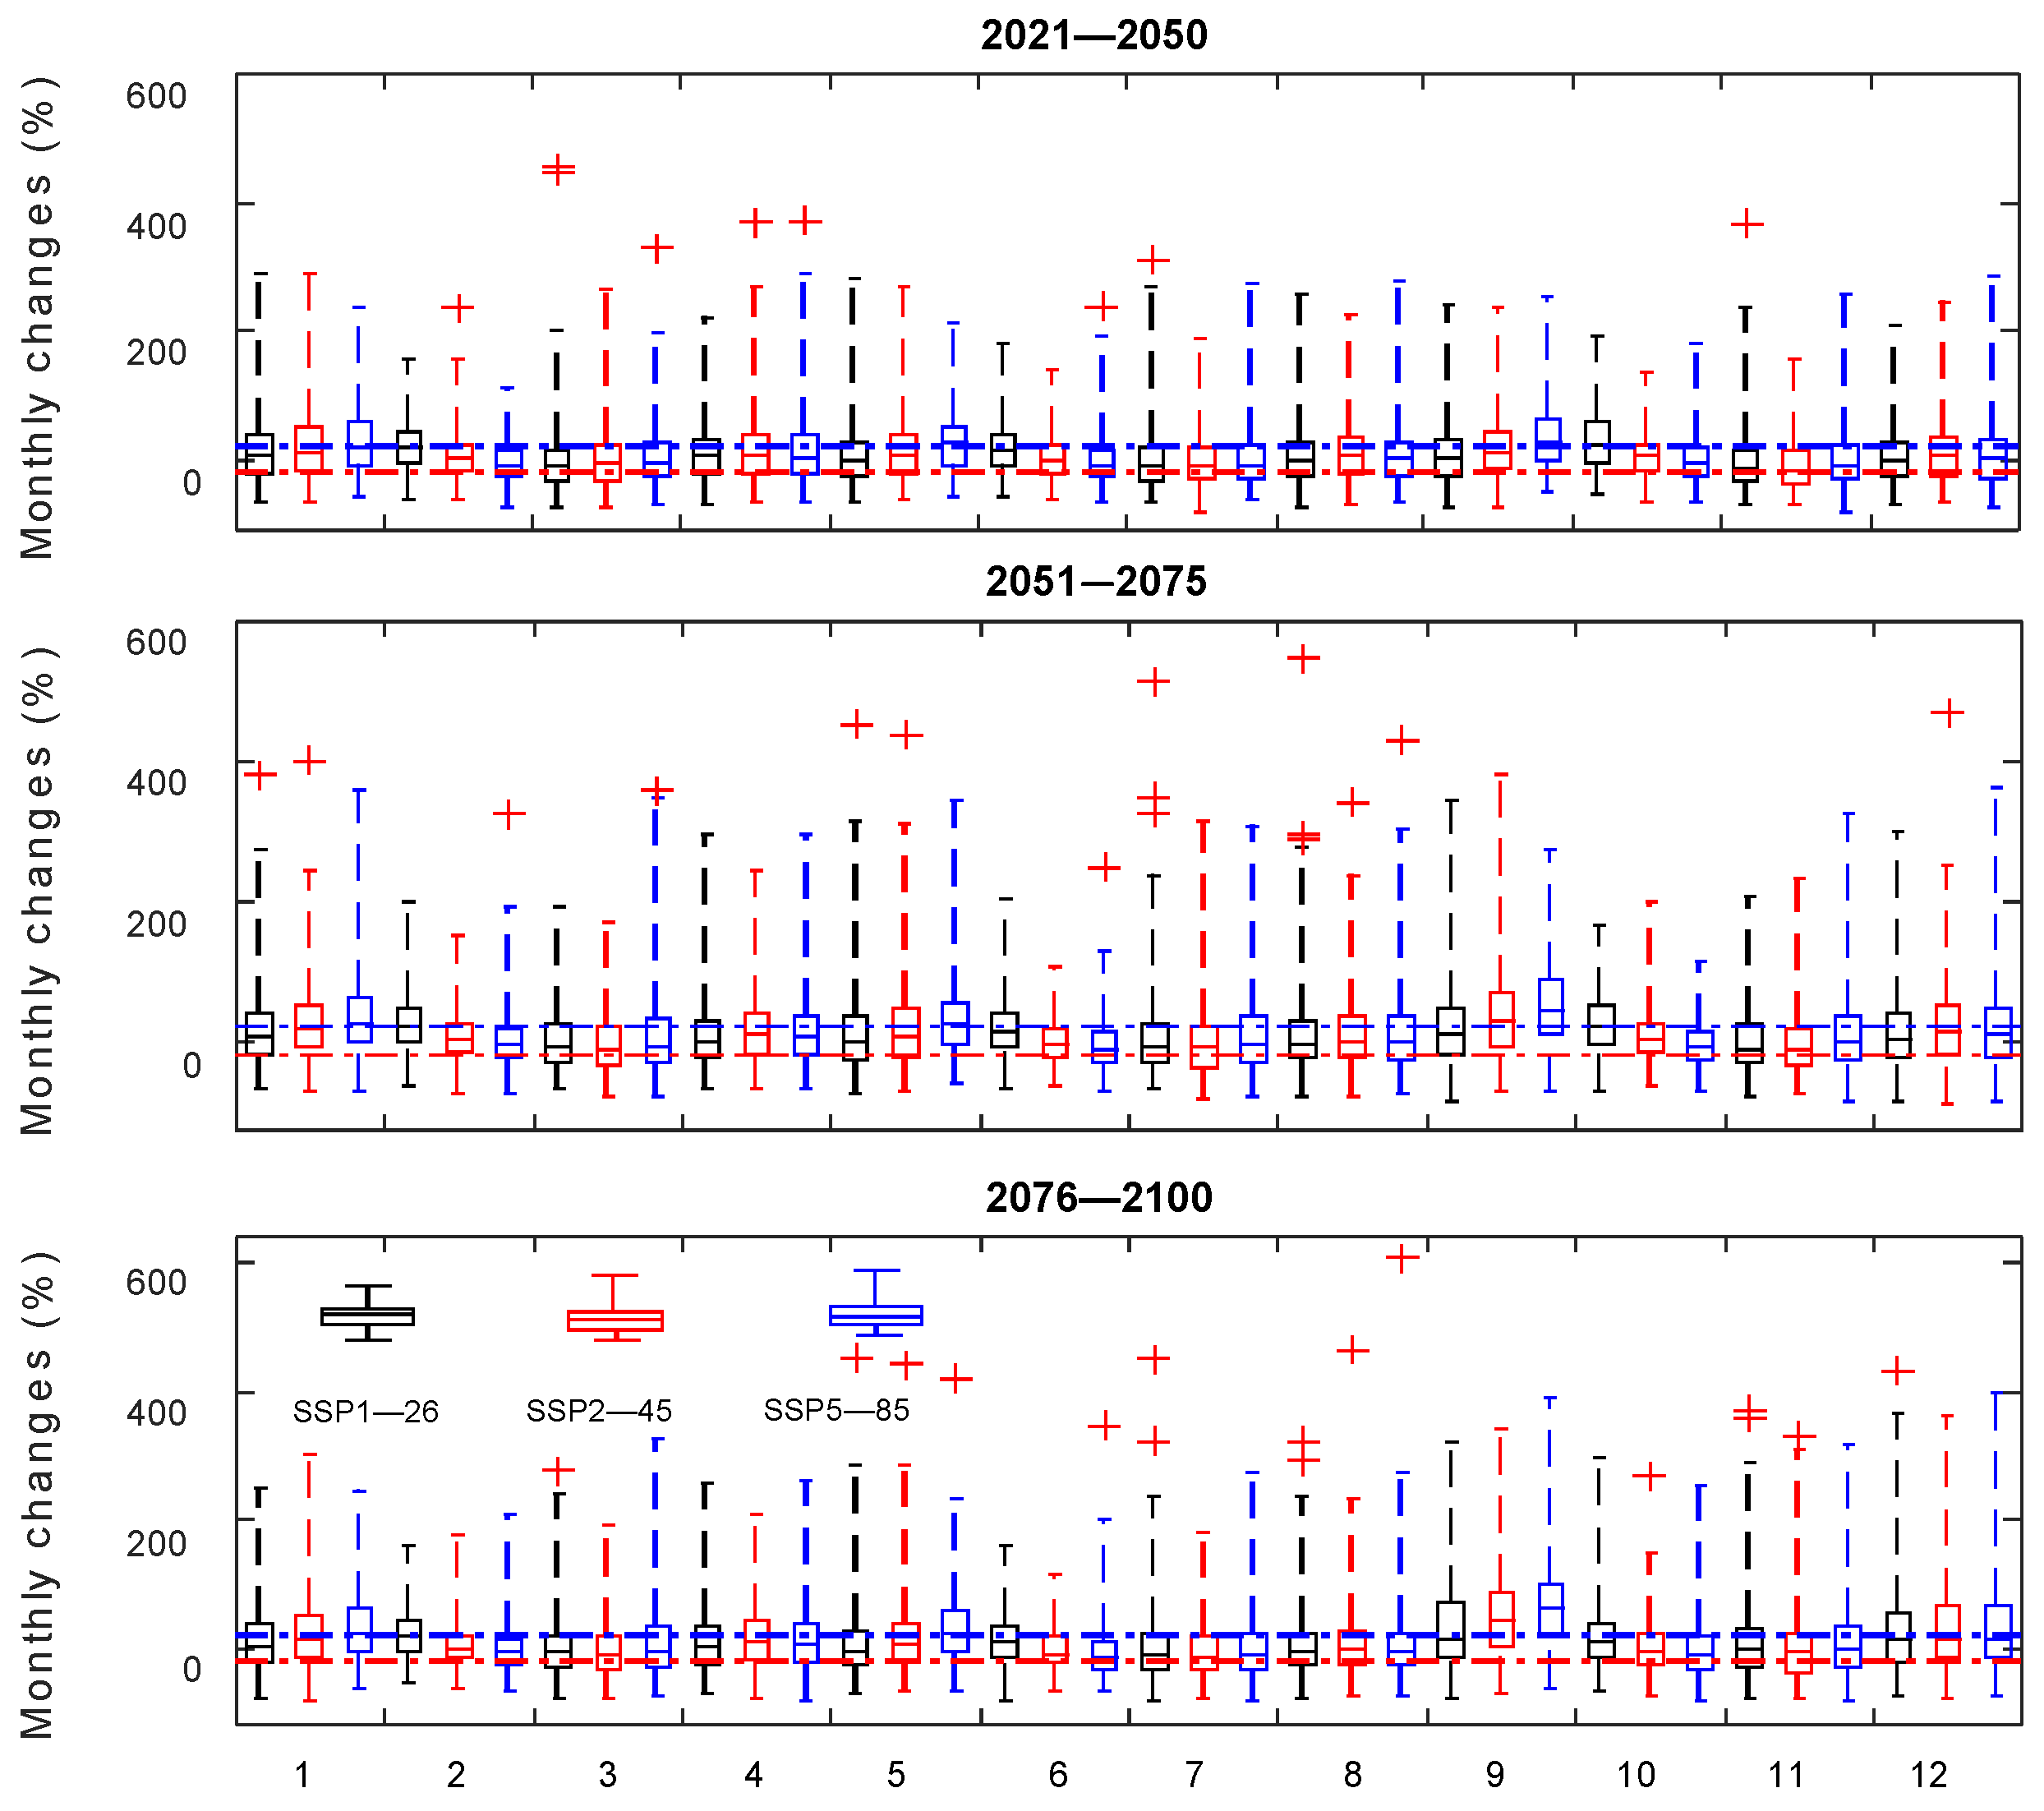
3.4. Changes in Floods
4. Discussion
5. Conclusions
Author Contributions
Funding
Institutional Review Board Statement
Informed Consent Statement
Data Availability Statement
Acknowledgments
Conflicts of Interest
References
- He, A.; Gong, K.; Zhang, Z.; Dong, W.; Feng, H.; Yu, Q.; He, J. What is the past, present, and future of scientific research on the Yellow River Basin? —A bibliometric analysis. Agric. Water Manag. 2022, 262, 107404. [Google Scholar] [CrossRef]
- Liu, L.; Jiang, T.; Xu, H.; Wang, Y. Potential Threats from Variations of Hydrological Parameters to the Yellow River and Pearl River Basins in China over the Next 30 Years. Water 2018, 10, 883. [Google Scholar] [CrossRef]
- Wang, G.; Qiao, C.; Liu, M.; Du, M.; Ye, T.; Wang, J. The future water resources regime of the Yellow River basin in the context of climate change. Hydro-Sci. Eng. 2020, 2, 1–8. (In Chinese) [Google Scholar]
- Ma, M.; Ren, L.; Singh, V.; Yuan, F.; Chen, L.; Yang, X.; Liu, Y. Hydrologic model-based Palmer indices for drought characterization in the Yellow River basin, China. Stoch. Environ. Res. Risk Assess. 2016, 30, 1401–1420. [Google Scholar] [CrossRef]
- Wang, Y.; Wang, S.; Zhao, W.; Liu, Y. The increasing contribution of potential evapotranspiration to severe droughts in the Yellow River basin. J. Hydrol. 2022, 605, 127310. [Google Scholar] [CrossRef]
- Li, Y.; Jia, C.; Hu, Z.; Sun, J. Refined spatiotemporal analysis of drought characteristics under different characteristic variable matchings: A case study of the middle reaches of the Yellow River basin, China. Environ. Sci. Pollut. Res. 2022, 29, 60440–60458. [Google Scholar] [CrossRef]
- Huang, T.; Lin, Q.; Wu, Z.; Wang, Y. Spatial and Temporal Characteristics of Drought in the Yellow River Basin and Their Correlation with ENSO. Yellow River 2021, 43, 52–58. (In Chinese) [Google Scholar]
- Liu, Y.; Xue, W. Temporal and spatial evolution of agricultural drought and its natural recovery period in the Yellow River Basin. Agric. Res. Arid. Areas 2022, 40, 213–221. (In Chinese) [Google Scholar]
- Ji, G. Geographical Calculation of Runoff Change and Drought and Flood Disasters Dynamics in the Yellow River Basin under Future Climate Change. Ph.D. Thesis, East China Normal University, Shanghai, China, 2020. (In Chinese). [Google Scholar]
- Zhang, L.; Zheng, W.; Yang, X.; Wang, Y.; Zhang, M.; Yu, X. Temporal-spatial characteristics of drought in source region of Yellow River based on CMIP5 multi-mode ensemble and PDSI. Water Resour. Prot. 2019, 35, 95–99. (In Chinese) [Google Scholar]
- Fan, X.; Shi, C.; Shao, W.; Zhou, Y. The suspended sediment dynamics in the Inner-Mongolia reaches of the upper Yellow River. Catena 2013, 109, 72–82. [Google Scholar] [CrossRef]
- Ran, Q.; Zong, X.; Ye, S.; Gao, J.; Hong, Y. Dominant mechanism for annual maximum flood and sediment events generation in the Yellow River basin. Catena 2020, 187, 104376. [Google Scholar] [CrossRef]
- Ding, Y.; Jiang, C.; Zhou, Z.; Gao, T.; Wang, S.; Zhang, X.; Cai, H.; Shi, H. Evaluation of precipitation and its time series components in CMIP6 over the Yellow River Basin. Clim. Dyn. 2022. [Google Scholar] [CrossRef]
- Ahmadi, B.; Ahmadalipour, A.; Moradkhani, H. Hydrological drought persistence and recovery over the CONUS: A multi-stage framework considering water quantity and quality. Water Res. 2019, 150, 97–110. [Google Scholar] [CrossRef] [PubMed]
- He, Z.; Liang, H.; Yang, C.; Huang, F.; Zeng, X. Temporal–spatial evolution of the hydrologic drought characteristics of the karst drainage basins in South China. Int. J. Appl. Earth Obs. Geoinf. 2018, 64, 22–30. [Google Scholar] [CrossRef]
- Shukla, S.; Wood, A. Use of a standardized runoff index for characterizing hydrologic drought. Geophys. Res. Lett. 2008, 35, L02405. [Google Scholar] [CrossRef]
- Nalbantis, I. Evaluation of a Hydrological Drought Index. Eur. Water 2008, 23, 67–77. [Google Scholar]
- Nalbantis, I.; Tsakiris, G. Assessment of hydrological drought revisited. Water Resources. Manag. 2009, 23, 881–897. [Google Scholar] [CrossRef]
- Ahmadalipour, A.; Moradkhani, H.; Demirel, M. A comparative assessment of projected meteorological and hydrological droughts: Elucidating the role of temperature. J. Hydrol. 2017, 553, 785–797. [Google Scholar] [CrossRef]
- Li, Y.; Chang, J.; Fan, J.; Yu, B. Agricultural drought evolution characteristics and driving mechanisms in the Yellow River Basin under climate and land use changes. Trans. Chin. Soc. Agric. Eng. 2021, 37, 84–93. (In Chinese) [Google Scholar]
- Ren, L.; Shen, H.; Yuan, F.; Zhao, X.; Yang, X.; Zheng, P. Hydrological drought characteristics in the Weihe catchment in a changing environment. Adv. Water Sci. 2016, 27, 492–500. (In Chinese) [Google Scholar]
- Wang, L.; Huang, S.; Huang, Q.; Fang, W.; Li, K.; Zhang, Y. Drought multivariable probability characteristics based on a multivariate standardized drought index in the Yellow River basin. J. Nat. Disasters 2019, 28, 70–80. (In Chinese) [Google Scholar] [CrossRef]
- Ma, M.; Cheng, Y.; Cui, H.; Zang, H.; Wang, Z. Multivariate characteristics of streamflow drought at Tangnaihai station of the Yellow River. J. North China Univ. Water Resour. Electr. Power (Nat. Sci. Ed.) 2020, 41, 1–9. (In Chinese) [Google Scholar]
- Yang, T.; Xi, Y.; Liu, W. Application of Drought Frequency Analysis Method Based on Copula in Tangnaihai Watershed. Shanaxi Water Resour. 2020, 6, 15–18, 28. (In Chinese) [Google Scholar]
- Villarini, G.; Smith, J.A.; Serinaldi, F.; Bales, J.; Bates, P.; Krajewski, W. Flood frequency analysis for nonstationary annual peak records in an urban drainage basin. Adv. Water Resour. 2009, 32, 1255–1266. [Google Scholar] [CrossRef]
- Liu, L.; Jiang, T.; Xu, J.; Zhai, J.; Luo, Y. Responses of hydrological processes to climate change in the Zhujiang River Basin in the 21st century. Adv. Clim. Chang. Res. 2012, 3, 84–91. [Google Scholar] [CrossRef]
- Eingrüber, N.; Korres, W. Climate change simulation and trend analysis of extreme precipitation and floods in the mesoscale Rur catchment in western Germany until 2099 using Statistical Downscaling Model (SDSM) and the Soil & Water Assessment Tool (SWAT model). Sci. Total Environ. 2022, 838, 155775. [Google Scholar] [CrossRef] [PubMed]
- Hirabayashi, Y.; Mahendran, R.; Koirala, S.; Konoshima, L.; Yamazaki, D.; Watanabe, S.; Kim, H.; Kanae, S. Global flood risk under climate change. Nat. Clim. Chang. 2013, 3, 816–821. [Google Scholar] [CrossRef]
- Dankers, R.; Arnell, N.W.; Clark, D.B.; Falloon, P.D.; Fekete, B.M.; Gosling, S.N.; Heinke, J.; Kim, H.; Masaki, Y.; Satoh, Y.; et al. First look at changes in flood hazard in the inter-sectoral impact model intercomparison project ensemble. Prac. Natl. Acad. Sci. USA 2014, 111, 3257–3261. [Google Scholar] [CrossRef] [PubMed]
- Kundzewicz, Z.; Su, B.; Wang, Y.; Wang, G.; Wang, G.; Huang, J.; Jiang, T. Flood risk in a range of spatial perspectives –from global to local scales. Nat. Hazards Earth Syst. Sci. 2019, 19, 1319–1328. [Google Scholar] [CrossRef]
- Peng, H.; Zheng, Y.; Shang, H. Analysis on Flood-variation Characteristics in Tangnaihe River and Its Upstream of the Yellow River. J. North China Univ. Water Resour. Electr. Power (Nat. Sci. Ed.) 2014, 35, 18–20. (In Chinese) [Google Scholar]
- Zhang, J.; Liu, J.; Wang, Z.; Li, C. Analysis of Rainfall-Flood-Sediment Characteristics of the No.1 Flood in 2017 in the Yellow River. Yellow River 2017, 39, 14–17. (In Chinese) [Google Scholar]
- Gao, X.; Li, J.; Sun, C. Flood Analysis of Ningxia Section of the Yellow River in 2018. Ningxia J. Agric. For. Sci. Technol. 2020, 61, 35–37. (In Chinese) [Google Scholar]
- Bai, P.; Liu, X.; Liang, K.; Liu, C. Investigation of changes in the annual maximum flood in the Yellow River basin, China. Quat. Int. 2016, 392, 168–177. [Google Scholar] [CrossRef]
- Zhao, Y.; Cao, W.; Hu, C.; Wang, Y.; Wang, Z.; Zhang, X.; Zhu, B.; Cheng, C.; Yin, X.; Liu, B.; et al. Analysis of changes in characteristics of flood and sediment yield in typical basins of the Yellow River under extreme rainfall events. Catena 2019, 177, 31–40. [Google Scholar] [CrossRef]
- Wen, Y. Study on Future Extreme Climate Change in the Yellow River Basin and its Impact on Mid-Stream Flood Events. Master’s Thesis, Zhengzhou University, Zhengzhou, China, 2020. (In Chinese). [Google Scholar]
- Miao, C.; Duan, Q.; Sun, Q.; Huang, Y.; Kong, D.; Yang, T.; Ye, A.; Di, Z.; Gong, W. Assessment of CMIP5 climate models and projected temperature changes over Northern Eurasia. Environ. Res. Lett. 2014, 9, 055007. [Google Scholar] [CrossRef]
- Zhang, Y.; Cheng Yang, T.; Jin, X.; Jia, Z.; Shen, J.; Wu, X. Assessment of climate change impacts on the hydro-wind-solar energy supply system. Renew. Sustain. Energy Rev. 2022, 162, 112480. [Google Scholar] [CrossRef]
- Wei, X.; Cai, B.; Cao, B. Construction and achievements of flood control, drought relief and disaster systems in the Yellow River Basin. China Flood Drought Manag. 2019, 29, 43–53. (In Chinese) [Google Scholar]
- Liu, L.; Wei, L.; Xu, Y.; Xin, X.; Xiao, C. Projection of climate change impacts on ecological flow in the Yellow River basin. Adv. Water Sci. 2021, 32, 824–833. (In Chinese) [Google Scholar]
- Wei, L.; Liu, L.; Jing, C.; Wu, Y.; Xin, X.; Yang, B.; Tang, H.; Li, Y.; Wang, Y.; Zhang, T.; et al. Simulation and projection of climate extremes in China by a set of statistical downscaled data. Int. J. Environ. Res. Public Health 2022, 19, 6398. [Google Scholar] [CrossRef]
- Jiang, T.; Su, B.; Wang, Y.; Wang, G.; Luo, Y.; Zhai, J.; Huang, J.; Jing, C.; Gao, M.; Lin, Q.; et al. Gridded datasets for population and economy under Shared Socioeconomic Pathways for 2020-2100. Clim. Chang. Res. 2022, 18, 381–383. (In Chinese) [Google Scholar]
- Samir, K.; Lutz, W. The human core of the shared socioeconomic pathways: Population scenarios by age, sex and level of education for all countries to 2100. Glob. Environ. Chang. 2017, 42, 181–192. [Google Scholar]
- Huang, J.; Qin, D.; Jiang, T.; Wang, Y.; Feng, Z.; Zhai, J.; Cao, L.; Chao, Q.; Xu, X.; Wang, G.; et al. Effect of fertility policy changes on the population structure and economy of China: From the perspective of the shared socioeconomic pathways. Earth’s Future 2019, 7, 250–265. [Google Scholar] [CrossRef]
- Jiang, T.; Zhao, J.; Jing, C.; Cao, L.; Wang, Y.; Sun, H.; Wang, A.; Huang, J.; Su, B.; Wang, R. National and provincial population projected to 2100 under the shared socioeconomic pathways in China. Clim. Chang. Res. 2017, 13, 128–137. [Google Scholar]
- Jiang, T.; Su, B.; Huang, J.; Zhai, J.; Xia, J.; Wang, Y.; Sun, H.; Luo, Y.; Zhang, L.; Wang, G.; et al. Each 0.5 °C of warming increases annual flood losses in China by more than US $60 billion. Bull. Am. Meteorol. Soc. 2020, 101, E1464–E1474. [Google Scholar] [CrossRef]
- Su, B.; Huang, J.; Fischer, T.; Wang, Y.; Kundzewicz, W.; Zhai, J.; Sun, H.; Wang, A.; Zeng, X.; Wang, G.; et al. Drought losses in China might double betwwen the 1.5 °C and 2 °C wariming. Proc. Natl. Acad. Sci. USA 2018, 115, 10600–10605. [Google Scholar] [CrossRef] [PubMed]
- Wang, Y.; Wang, A.; Zhai, J.; Tao, T.; Jiang, T.; Su, B.; Yang, J.; Wang, G.; Liu, Q.; Gao, C.; et al. Tens of thousands additional deaths annually in cities of China betwwen 1.5°C and 2.0 °C warming. Nat. Commun. 2019, 10, 3376. [Google Scholar] [CrossRef] [PubMed]
- Xu, Z.X. Hydrological Models; Science Press: Beijing, China, 2009. [Google Scholar]
- Krysanova, V.; Bronstert, A.; Müller-Wohlferl, D.I. Modelling river discharge for large drainage basins: From lumped to distributed approach. Hydrol. Sci. J. 1999, 44, 313–331. [Google Scholar] [CrossRef]
- Zhao, H.; Zhang, Y.; Wang, Z.; Mao, Y.; An, W. Threshold of precipitation for Qinhe River Flood based on HBV model. Res. Soil Water Conserv. 2015, 22, 74–78. (In Chinese) [Google Scholar]
- Zhang, T.; Zhao, Q.; Shi, X.; Ma, Z. Application of HBV model on estimating critical rainfall of flood disaster in Longwu River. J. China Agric. Univ. 2017, 22, 69–75. (In Chinese) [Google Scholar]
- Wang, X.; Yang, T.; Wang, B.; Li, H.; Hao, X. Scenarios forecasting of runoff extreme values in source region of Yellow River Basin on multiple hydrological models. Water Resour. Power 2012, 30, 27–30. (In Chinese) [Google Scholar]
- Liu, L.; Xu, H.; Wang, Y.; Jiang, T. Impacts of 1.5 and 2 °C global warming on water availability and extreme hydrological events in Yiluo and Beijiang River catchments in China. Clim. Chang. 2017, 145, 145–158. [Google Scholar] [CrossRef]
- Liu, L.; Xiao, C.; Du, L.; Zhang, P.; Wang, G. Extended-Range Runoff Forecasting Using a One-Way Coupled Climate–Hydrological Model: Case Studies of the Yiluo and Beijiang Rivers in China. Water 2019, 11, 1150. [Google Scholar] [CrossRef]
- Doherty, J.; Johnston, J. Methodologies for calibration and predictive analysis of a watershed model. J. Am. Water Resour. Assoc. 2003, 9, 251–265. [Google Scholar] [CrossRef]
- Bahremand, A.; Smedt, F. Distributed Hydrological Modeling and Sensitivity Analysis in Torysa Watershed, Slovakia. Water Resour. Manag. 2008, 22, 393–408. [Google Scholar] [CrossRef]
- Falkenmark, M.; Lundquist, J.; Widstrand, C. Macro-scale Water Scarcity Requires Micro-scale Approaches: Aspects of Vulnerability in Semi-arid Development. Nat. Resour. Forum 1989, 13, 258–267. [Google Scholar] [CrossRef]
- Schewe, J.; Heinke, J.; Gerten, D.; Haddeland, I.; Arnell, N.; Clark, D.; Dankers, R.; Eisner, S.; Fekete, B.; Colόn-González, F.; et al. Multimodel assessment of water scarcity under climate change. Proc. Natl. Acad. Sci. USA 2014, 111, 3245–3250. [Google Scholar] [CrossRef] [PubMed]
- Falkenmark, M. Water scarcity and population growth: A spiralling risk. Ecodeision 1992, 21, 498–502. [Google Scholar]
- Wu, J.; Chen, X.; Yao, H.; Gao, L.; Chen, Y.; Liu, M. Non-linear relationship of hydrological drought responding to meteorological drought and impact of a large reservoir. J. Hydrol. 2017, 551, 405–507. [Google Scholar] [CrossRef]
- Garcia, P.; Nicolas, A.; Velazuez, M. Combined use of relative drought indices to analyze climate change impact on meteorological and hydrological droughts in a Mediterranean basin. J. Hydrol. 2017, 554, 292–305. [Google Scholar] [CrossRef]
- Oloruntade, A.; Mohammad, T.; Ghazali, A.; Wayayok, A. Analysis of meteorological and hydrological droughts in the Niger-South Basin, Nigeria. Glob. Planet. Chang. 2017, 155, 225–233. [Google Scholar] [CrossRef]
- Svoboda, M.D.; Fuchs, B.A. Handbook of Drought Indicators and Indices (M. Svoboda and B.A. Fuchs); Integrated Drought Management Programme (IDMP), Integrated Drought Management Tools and Guidelines Series 2; World Meteorological Organization: Geneva, Switzerland, 2016. [Google Scholar]
- Mercadeo, V.; Perez, G.; Solomatine, D.; Lanen, H. Spatio-temporal analysis of hydrological drought at catchment scale using a spatially-distributed hydrological model. Procedia Eng. 2016, 154, 738–744. [Google Scholar] [CrossRef]
- Davison, A.C. Modeling excesses over high thresholds, with an application. In Statistical Extremes and Applications; Tiago de Oliveira, J., Ed.; Riedel: Dordrecht, The Netherlands, 1984; pp. 461–482. [Google Scholar]
- Kay, A.; Davies, H.; Bell, V.; Jones, R. Comparison of uncertainty sources for climate change impacts: Flood frequency in England. Clim. Chang. 2009, 92, 41–63. [Google Scholar] [CrossRef]
- Moriasi, D.; Arnold, G.; Kuijk, M.; Bingner, R.; Harmel, R.; Veith, T. Model evaluation guidelines for systematic quantification of accuracy in watershed simulations. Trans. ASABE 2007, 50, 885–900. [Google Scholar]
- Gosling, S.; Taylor, R.; Arnell, N.; Todd, M. A comparative analysis of projected impacts of climate change on river runoff from global and catchment-scale hydrological models. Hydrol. Earth Syst. Sci. 2011, 15, 279–294. [Google Scholar] [CrossRef]
- Liu, L.; Fischer, T.; Jiang, T.; Luo, Y. Comparison of uncertainties in projected flood frequency of the Zhujiang River, South China. Quat. Int. 2013, 304, 51–61. [Google Scholar] [CrossRef]
- Vetter, T.; Reinhardt, J.; Flörke, M.; Griensven, A.; Hattermann, F.; Huang, S.; Koch, H.; Pechlivanidis, I.; Plötner, S.; Seidou, O.; et al. Evaluation of sources of uncertainty in projected hydrological changes under climate change in 21 large-scale river basins. Clim. Chang. 2015, 141, 419–433. [Google Scholar] [CrossRef]
- Vetter, T.; Huang, S.; Aick, V.; Yang, T.; Wang, X.; Krysanova, V.; Hattermann, F. Muti-model climate impact assessment and intercomparison for three large scale river basins on three continents. Earth Syst. Dyn. 2015, 6, 17–43. [Google Scholar] [CrossRef]
- Hattermann, F.F.; Vetter, T.; Breuer, L.; Su, B.; Daggupati, P.; Donnelly, C.; Fekete, B.; Flörker, F.; Gosling, S.; Hoffmann, P.; et al. Sources of uncertainty in hydrological climate impact assessment: A cross-scale study. Environ. Res. Lett. 2018, 13, 015006. [Google Scholar] [CrossRef]
- Joseph, J.; Ghosh, S.; Pathak, A.; Sahai, A. Hydrologic impacts of climate change: Comparisons between hydrological parameter uncertainty and climate model uncertainty. J. Hydrol. 2018, 566, 1–22. [Google Scholar] [CrossRef]
- Wang, Y.; Xu, H.; Li, Y.; Liu, Y.; Hu, Z.; Xiao, C.; Yang, T. Climate Change Impacts on Runoff in the Fujiang River Basin Based on CMIP6 and SWAT Model. Water 2022, 14, 3614. [Google Scholar] [CrossRef]
- Smith, C.; Nicholls, Z.R.J.; Armour, K.; Collins, W.; Forster, P.; Meinshausen, M.; Palmer, M.D.; Watanabe, M. The Earth’s Energy Budget, Climate Feedbacks, and Climate Sensitivity Supplementary Material. In Climate Change 2021: The Physical Science Basis; Contribution of Working Group I to the Sixth Assessment Report of the Intergovernmental Panel on Climate Change; Masson-Delmotte, V., Zhai, P., Pirani, A., Connors, S.L., Péan, C., Berger, S., Caud, N., Chen, Y., Goldfarb, L., Gomis, M.I., Eds.; Cambridge University Press: Cambridge, UK; New York, NY, USA, 2021; Available online: https://www.ipcc.ch/ (accessed on 20 September 2022).
- Xin, X.; Wu, T.; Zhang, J.; Yao, J.; Fang, Y. Comparison of CMIP6 and CMIP5 simulations of precipitation in China and the East Asian summer monsoon. Int J. Clim. 2020, 40, 6423–6440. [Google Scholar] [CrossRef]
- Wei, L.; Xin, X.; Li, Q.; Wu, Y.; Tang, H.; Li, Y.; Yang, B. Simulation and projection of climate extremes in China by multiple Coupled Model Intercomparison Project Phase 6 models. Int. J. Clim. 2022, 43, 219–239. [Google Scholar] [CrossRef]


| ID | Model Name | Affiliated Country and Research Unit | Atmos. Lat/Lon Grid (°) |
|---|---|---|---|
| 1 | ACCESS-CM2 | Commonwealth Scientific and Industrial Research Organisation, and Australian Research Council of Excellence for Climate System Science (Australia) | 1.2° × 1.8° |
| 2 | ACCESS-ESM-1–5 | Commonwealth Scientific and Industrial Research Organisation(Australia) | 1.2° × 1.8° |
| 3 | BCC-CSM2-MR | Beijing Climate Center, China Meteorological Administration (China) | 1.1° × 1.1° |
| 4 | CanESM5 | Canadian Centre for Climate Modelling and Analysis (Canada) | 2.8 × 2.8 |
| 5 | CNRM-CM6–1 | Centre National de Recherches Météorologiques, Centre Européen de Recherche et de Formation Avancée en Calcul Scientifique (France) | 1.4 × 1.4 |
| 6 | CNRM-ESM2–1 | Centre National de Recherches Météorologiques, Centre Européen de Recherche et de Formation Avancée en Calcul Scientifique (France) | 1.4 × 1.4 |
| 7 | HadGEM3-GC31-LL | Met Office Hadley Centre (United Kingdom) | 1.3 × 1.9 |
| 8 | INM-CM4–8 | Institute for Numerical Mathematics, Russian Academy of Science (Russia) | 1.5 × 2.0 |
| 9 | INM-CM5–0 | Institute for Numerical Mathematics, Russian Academy of Science (Russia) | 1.5 × 1.5 |
| 10 | IPSL-CM6A-LR | Institut Pierre Simon Laplace (France) | 1.3 × 2.5 |
| 11 | MIROC6 | Japan Agency for Marine-Earth Science and Technology, Atmosphere and Ocean Research Institute (The University of Tokyo), National Institute for Environmental Studies, and RIKEN Center for Computational Science (Japan) | 1.4 × 1.4 |
| 12 | MPI-ESM1–2-HR | Max Planck Institute for Meteorology (Germany) | 0.9 × 0.9 |
| 13 | MRI-ESM2–0 | Meteorological Research Institute (Japan) | 1.1 × 1.1 |
| SRI Values | Classifications |
|---|---|
| SRI ≥ 2.0 | Extremely wet |
| 1.5 ≤ SRI < 2.0 | Very wet |
| 1.0 ≤ SRI < 1.5 | Moderately wet |
| −1.0 ≤ SRI < 1.0 | Near normal |
| −1.5 ≤ SRI < -1.0 | Moderately dry |
| −2.0 ≤ SRI < -1.5 | Severely dry |
| SRI < −2.0 | Extreme dry |
| Station | Period | Ens | R2 | PBIAS(%) |
|---|---|---|---|---|
| Huayuankou | Calibration (1952–1990) | 0.74 | 0.86 | 3.9 |
| Verification (1991–2012) | 0.71 | 0.86 | 5.3 | |
| Jimai | Verification (1959–1997) | 0.55 | 0.78 | 22 |
| Heishiguan | Verification (1970–2000) | 0.72 | 0.88 | 18 |
| Period | Per Capita Annual Runoff: Median [min, max] (m3) | ||
|---|---|---|---|
| SSP1–2.6 | SSP2–4.5 | SSP5–8.5 | |
| 2026–2050 | 541 [373, 746] | 511 [345, 826] | 524 [399, 861] |
| 2051–2075 | 607 [450, 1098] | 528 [359, 1102] | 641 [394, 1028] |
| 2076–2100 | 788 [478, 1318] | 583 [428, 1112] | 828 [552, 1999] |
| Month | Scenario | Moderately Dry | Severely Dry | Extreme Dry | ||||||
|---|---|---|---|---|---|---|---|---|---|---|
| Near-Term | Mid-Term | Long-Term | Near-Term | Mid-Term | Long-Term | Near-Term | Mid-Term | Long-Term | ||
| 6 | ssp126 | −14 | −19 | −17 | −1 | −8 | −7 | −4 | −4 | −28 |
| ssp245 | −26 | −21 | −12 | −8 | −1 | 1 | −6 | 0 | -10 | |
| ssp585 | −14 | −21 | −5 | −12 | −3 | −2 | −4 | −4 | −5 | |
| 7 | ssp126 | 5 | 3 | −8 | 0 | −4 | 3 | 6 | −1 | −3 |
| ssp245 | 0 | −1 | 13 | 1 | −2 | 4 | 0 | 7 | 22 | |
| ssp585 | 1 | −5 | 5 | −2 | 4 | 4 | 3 | 4 | 13 | |
| 8 | ssp126 | −5 | 7 | 7 | 6 | −1 | −2 | 6 | 0 | 6 |
| ssp245 | 4 | 6 | 5 | −3 | 0 | 7 | 1 | 3 | 17 | |
| ssp585 | 10 | 7 | −1 | 3 | 3 | −2 | 4 | 3 | 0 | |
| 9 | ssp126 | 0 | 6 | −8 | 7 | 8 | 2 | −2 | −2 | −9 |
| ssp245 | −2 | −6 | −4 | 6 | 7 | 10 | −2 | 4 | 7 | |
| ssp585 | 8 | 3 | −8 | 10 | 10 | 4 | 0 | −5 | −2 | |
| 10 | ssp126 | −6 | −1 | −9 | 2 | 3 | −4 | −2 | −1 | −17 |
| ssp245 | −3 | −5 | −1 | −7 | 3 | −3 | −3 | 4 | −2 | |
| ssp585 | 13 | −1 | −1 | −4 | −6 | 2 | 3 | −4 | 6 | |
| 11 | ssp126 | −2 | −4 | −4 | 0 | −2 | −10 | −5 | −4 | −20 |
| ssp245 | −4 | −6 | −7 | −4 | −1 | −6 | −8 | 2 | −12 | |
| ssp585 | −8 | −4 | −11 | 4 | −4 | −7 | −3 | −7 | −22 | |
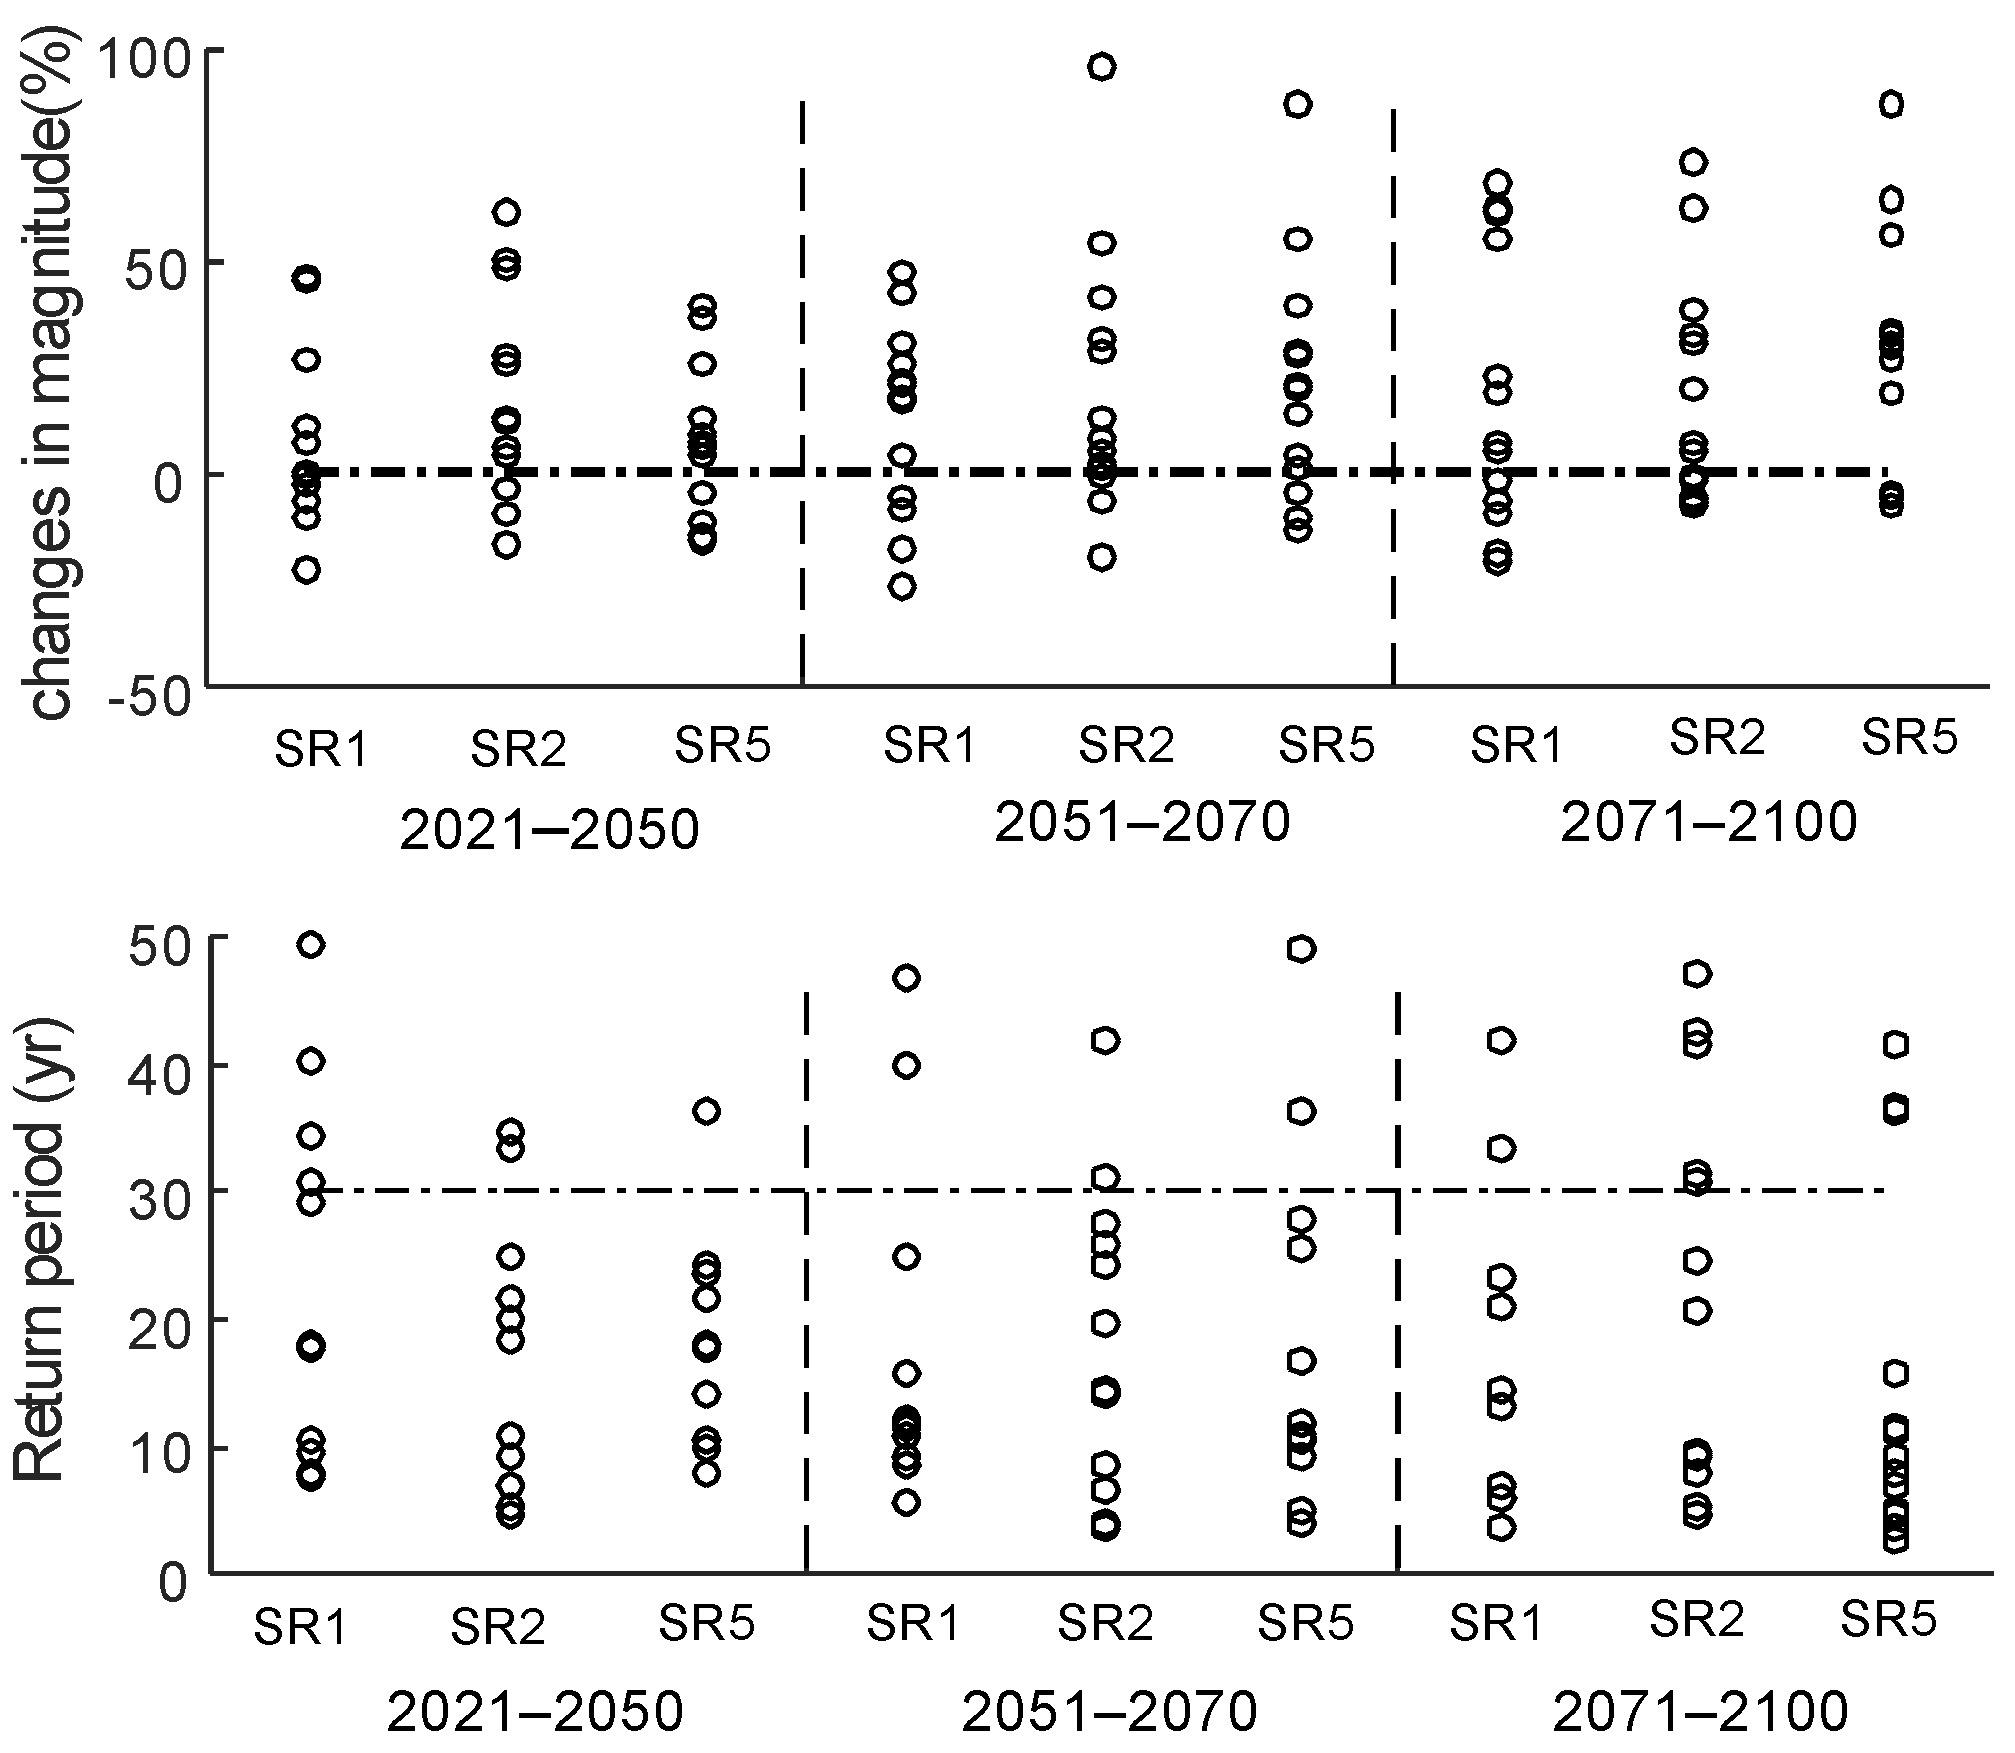
| Period | Change in Magnitude of 1-in-30-Year Floods (%) Median [min, max] | Return Period of 1-in-30-Year Floods Median [min, max] | ||||
|---|---|---|---|---|---|---|
| SSP1–2.6 | SSP2–4.5 | SSP5–8.5 | SSP1–2.6 | SSP2–4.5 | SSP5–8.5 | |
| 2026–2050 | 7.5 [−21.7, 46.8] | 11.8 [−15.8, 61.5] | 7.5 [−15.1, 40.1] | 18.1 [7.5, 49.4] | 20.0 [4.8, 87.0] | 21.8 [8.2, 99.0] |
| 2051–2075 | 16.8 [−25.6, 47.5] | 8.5 [−19.1, 95.8] | 19.6 [−13.3, 86.7] | 12.1 [5.6, 213.7] | 19.7 [3.7, 155.8] | 12.0 [4.1, 75.7] |
| 2076–2100 | 7.1 [−20.0, 68.4] | 7.4 [−7.5, 73.1] | 30.4 [−7.8, 107.3] | 21.1 [3.7, 183.9] | 20.9 [4.8, 47.2] | 9.3 [2.8, 41.5] |
Disclaimer/Publisher’s Note: The statements, opinions and data contained in all publications are solely those of the individual author(s) and contributor(s) and not of MDPI and/or the editor(s). MDPI and/or the editor(s) disclaim responsibility for any injury to people or property resulting from any ideas, methods, instructions or products referred to in the content. |
© 2023 by the authors. Licensee MDPI, Basel, Switzerland. This article is an open access article distributed under the terms and conditions of the Creative Commons Attribution (CC BY) license (https://creativecommons.org/licenses/by/4.0/).
Share and Cite
Liu, L.; Xiao, C.; Liu, Y. Projected Water Scarcity and Hydrological Extremes in the Yellow River Basin in the 21st Century under SSP-RCP Scenarios. Water 2023, 15, 446. https://doi.org/10.3390/w15030446
Liu L, Xiao C, Liu Y. Projected Water Scarcity and Hydrological Extremes in the Yellow River Basin in the 21st Century under SSP-RCP Scenarios. Water. 2023; 15(3):446. https://doi.org/10.3390/w15030446
Chicago/Turabian StyleLiu, Lyuliu, Chan Xiao, and Yihua Liu. 2023. "Projected Water Scarcity and Hydrological Extremes in the Yellow River Basin in the 21st Century under SSP-RCP Scenarios" Water 15, no. 3: 446. https://doi.org/10.3390/w15030446