
Deformation Field Analysis of Small-Scale Model Experiment on Overtopping Failure of Embankment Dams

Abstract
:1. Introduction
2. Experimental Setup and Test Procedure
2.1. Model Similarity Problems
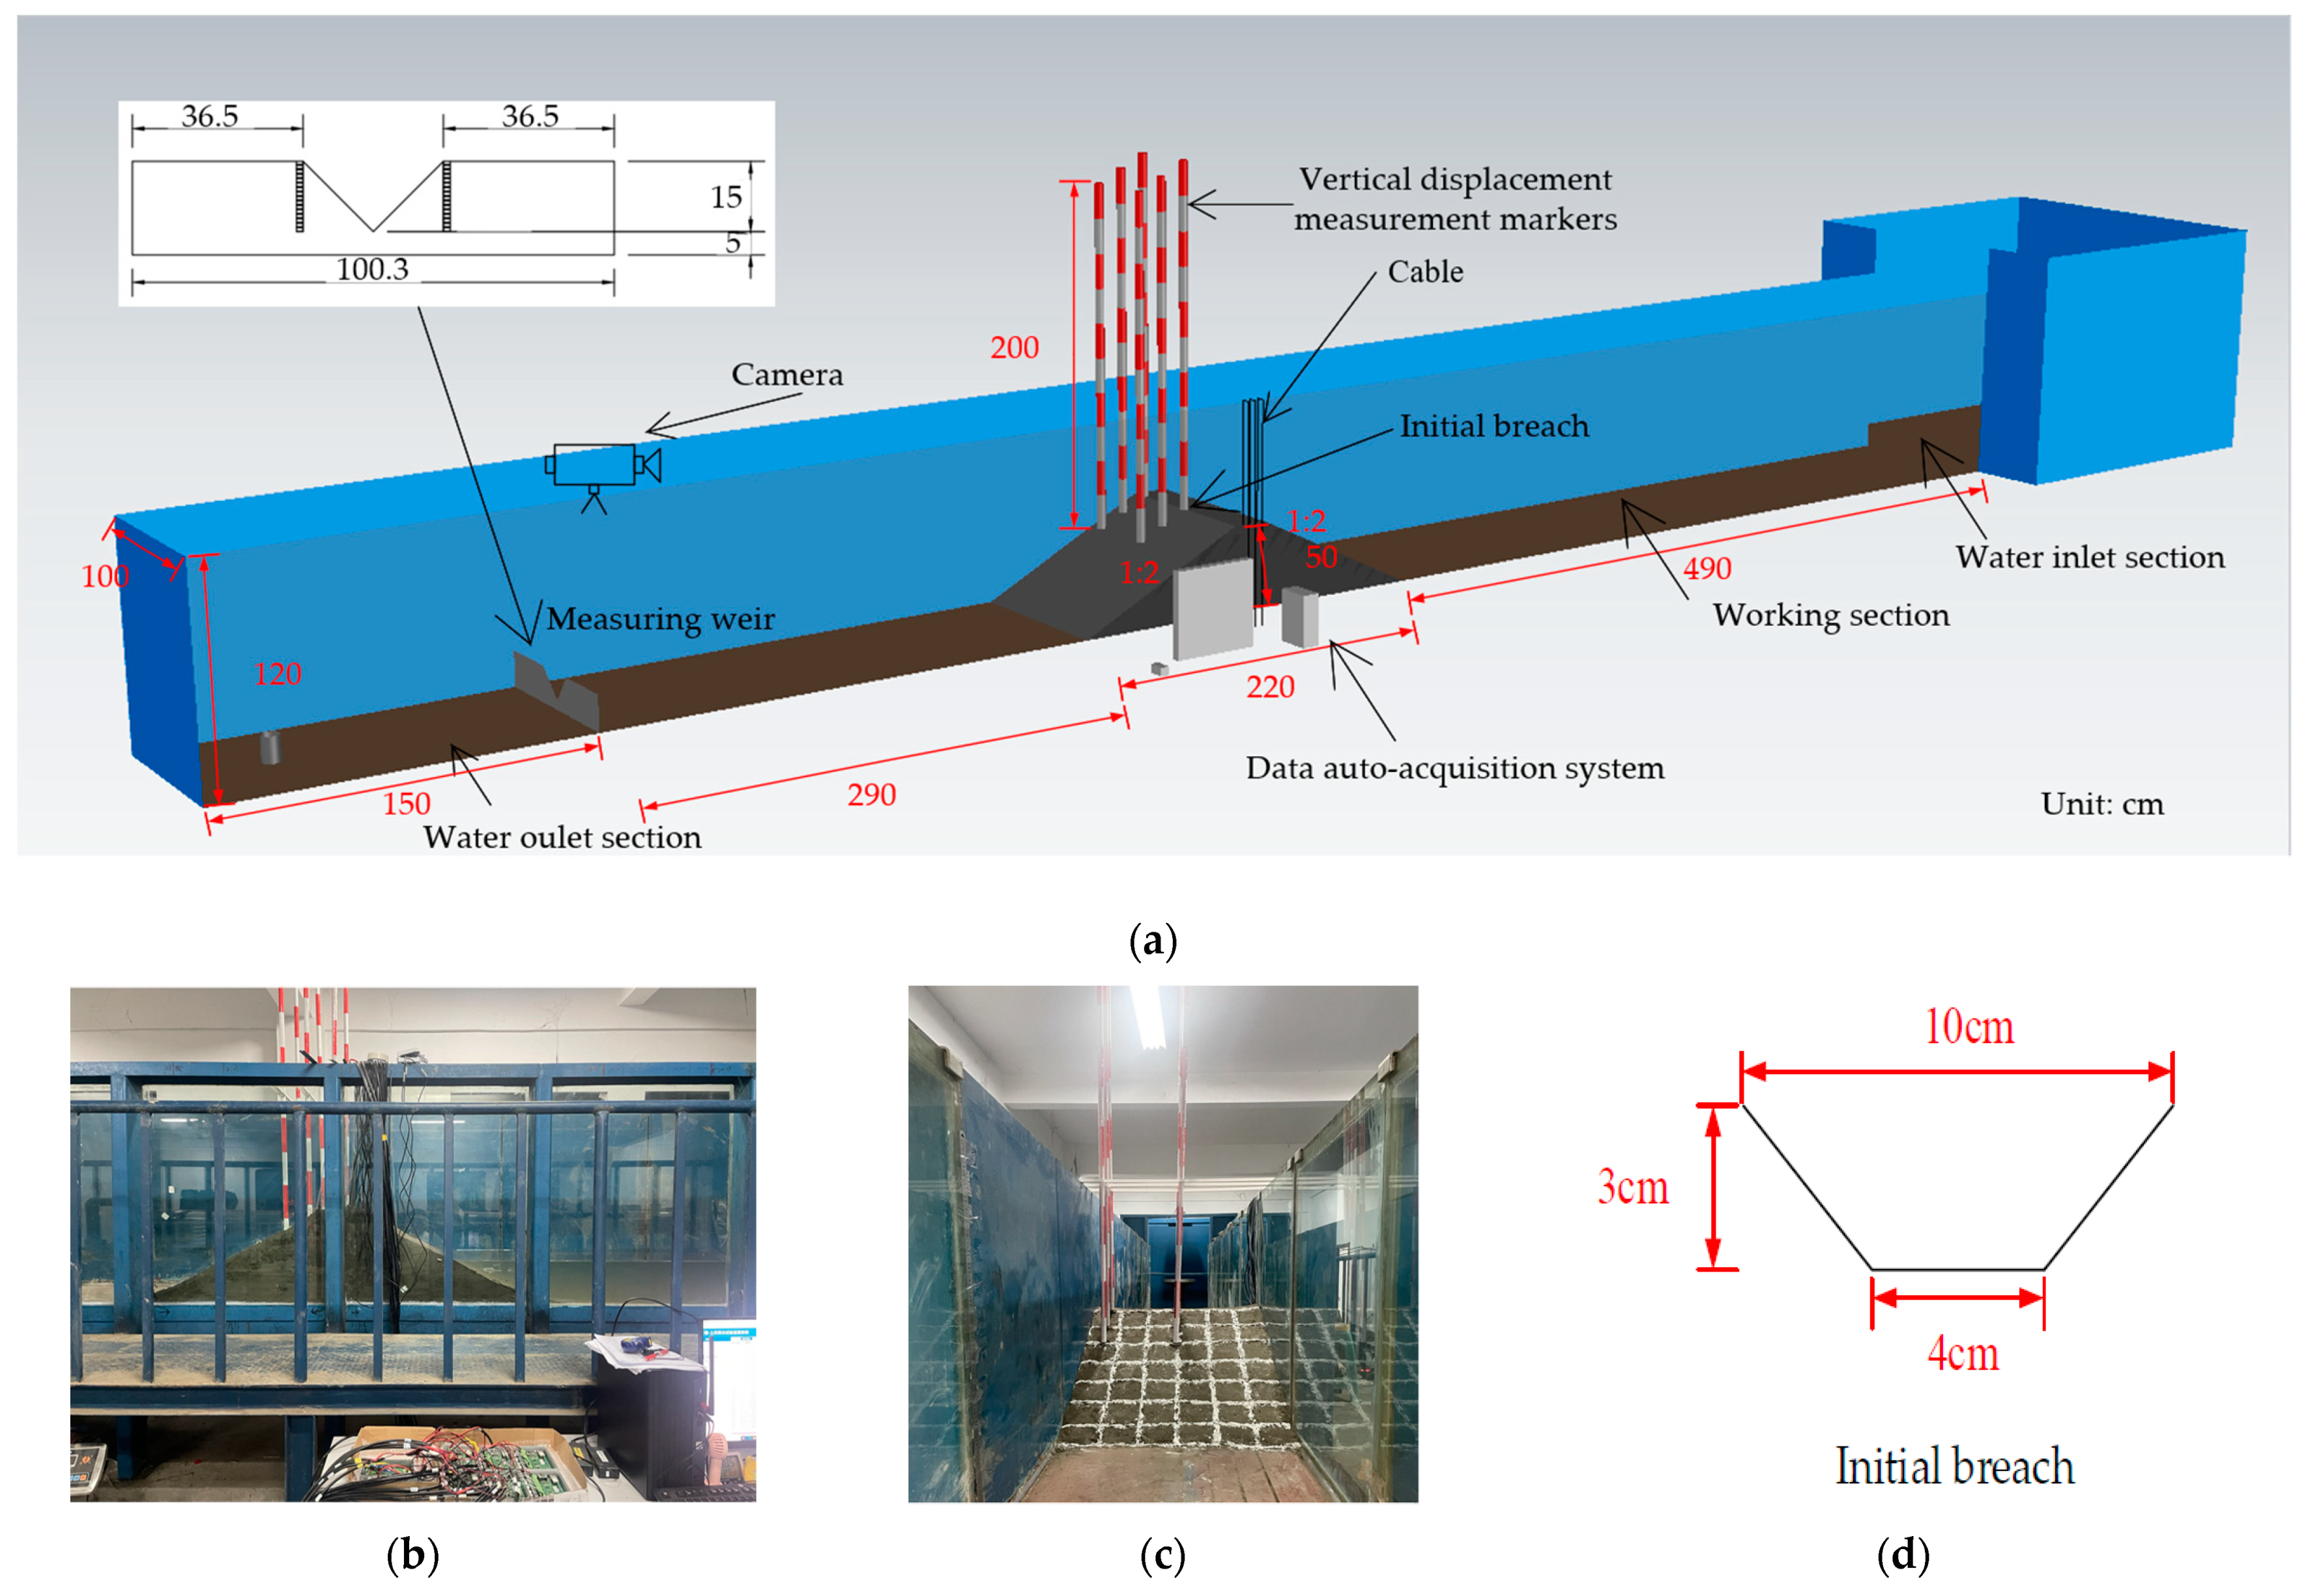
2.2. Model Design
2.3. Dam Materials and Dam Filling Process
2.4. Measurement Items and Techniques
2.4.1. Measurement Items
- (1)
- Environmental variables: The environmental variables monitored include upstream and downstream water levels and air temperatures. Upstream and downstream water levels are monitored dynamically in real time through water level gauges in the water inlet section of the flume, in conjunction with manual calibration of the water scale.
- (2)
- Deformation: Deformation monitoring includes surface deformation and internal deformation monitoring. The positive and negative signs of displacement changes are specified as follows: vertical displacement downward is positive, horizontal displacement to the left bank and downstream is positive, and vice versa is negative.
- (3)
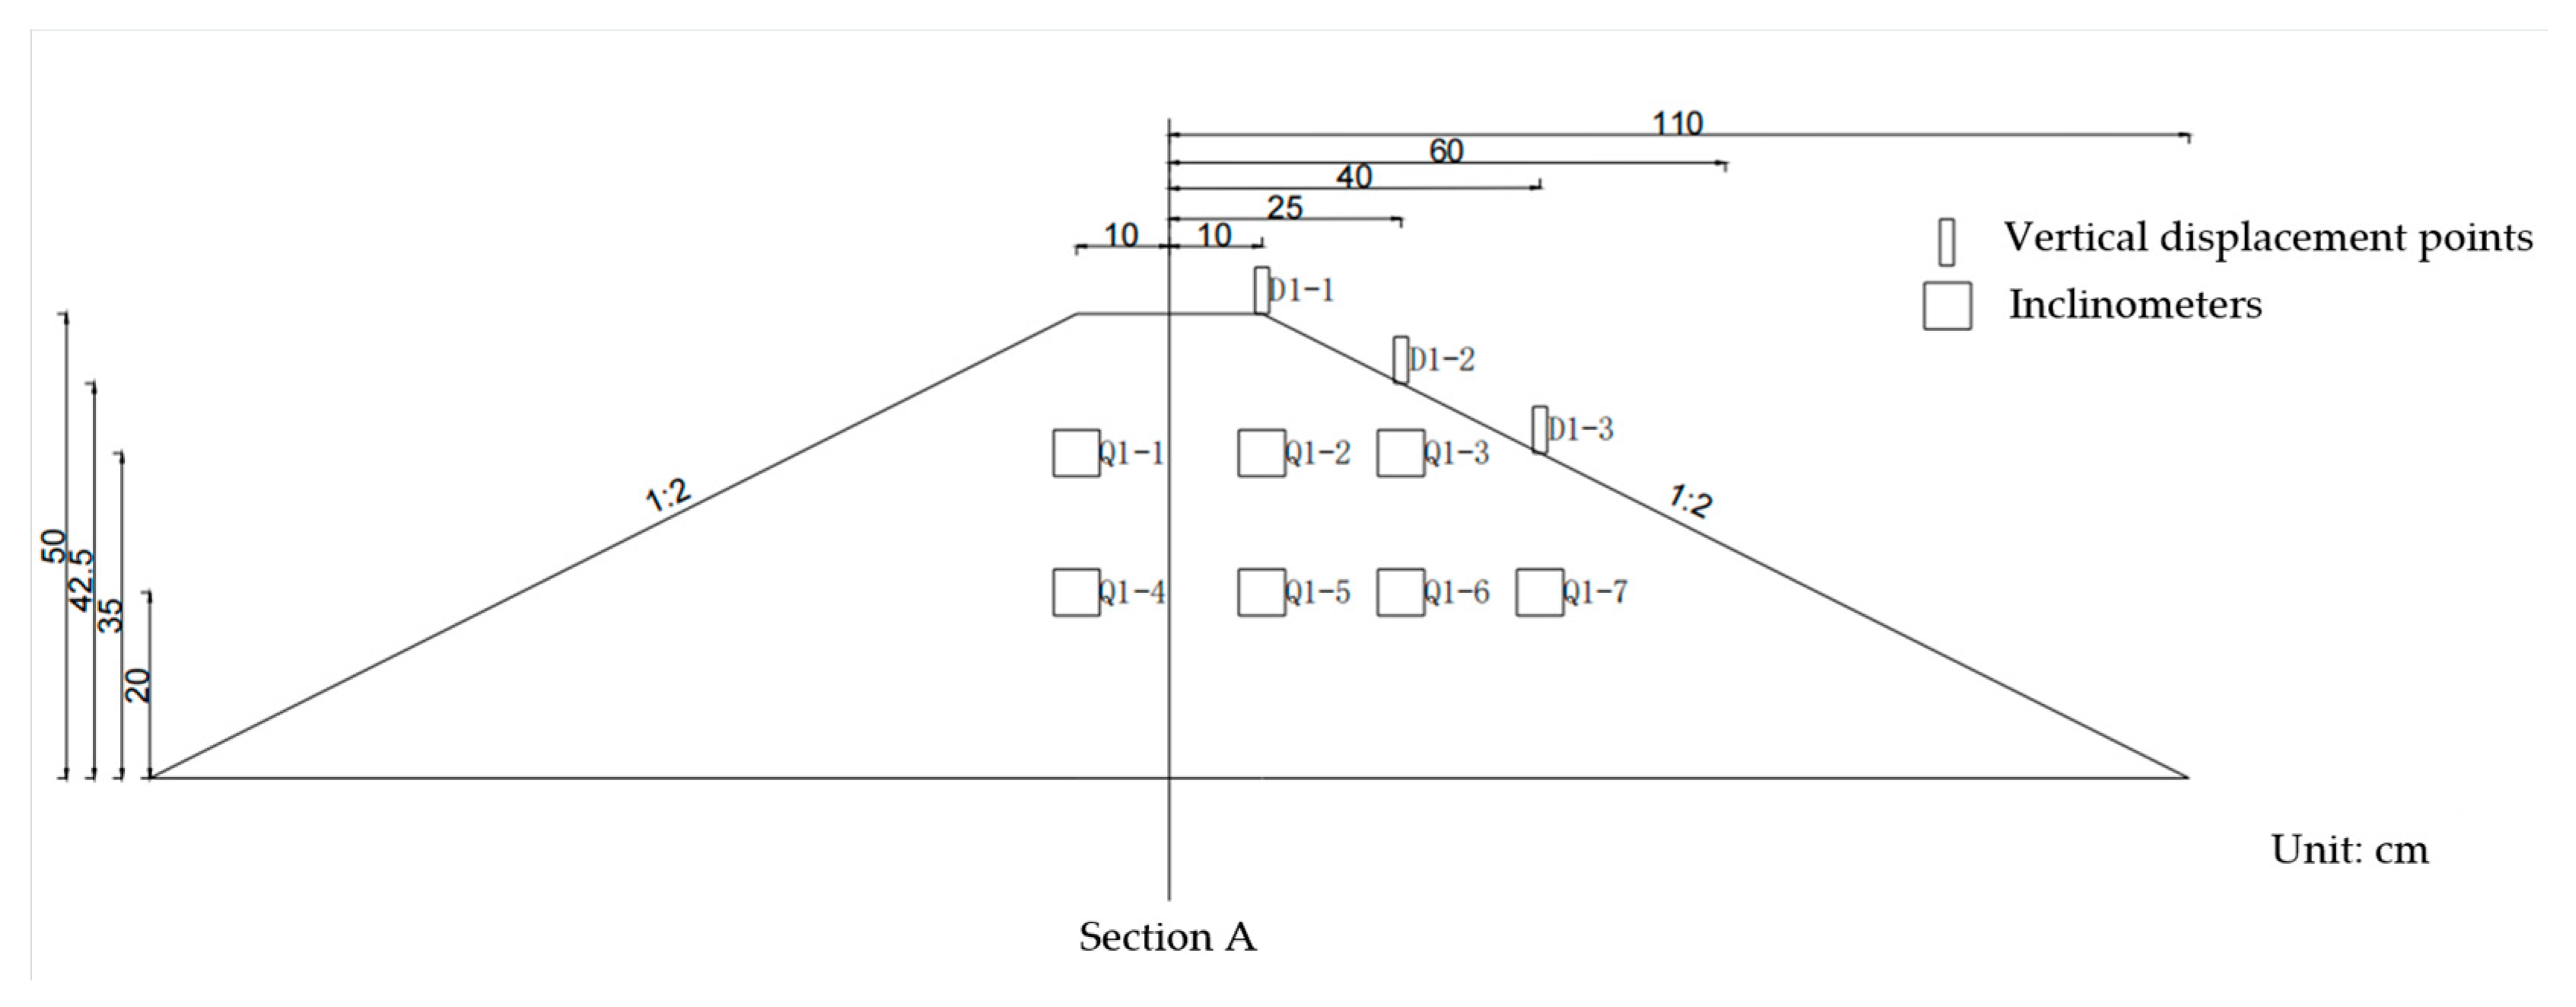
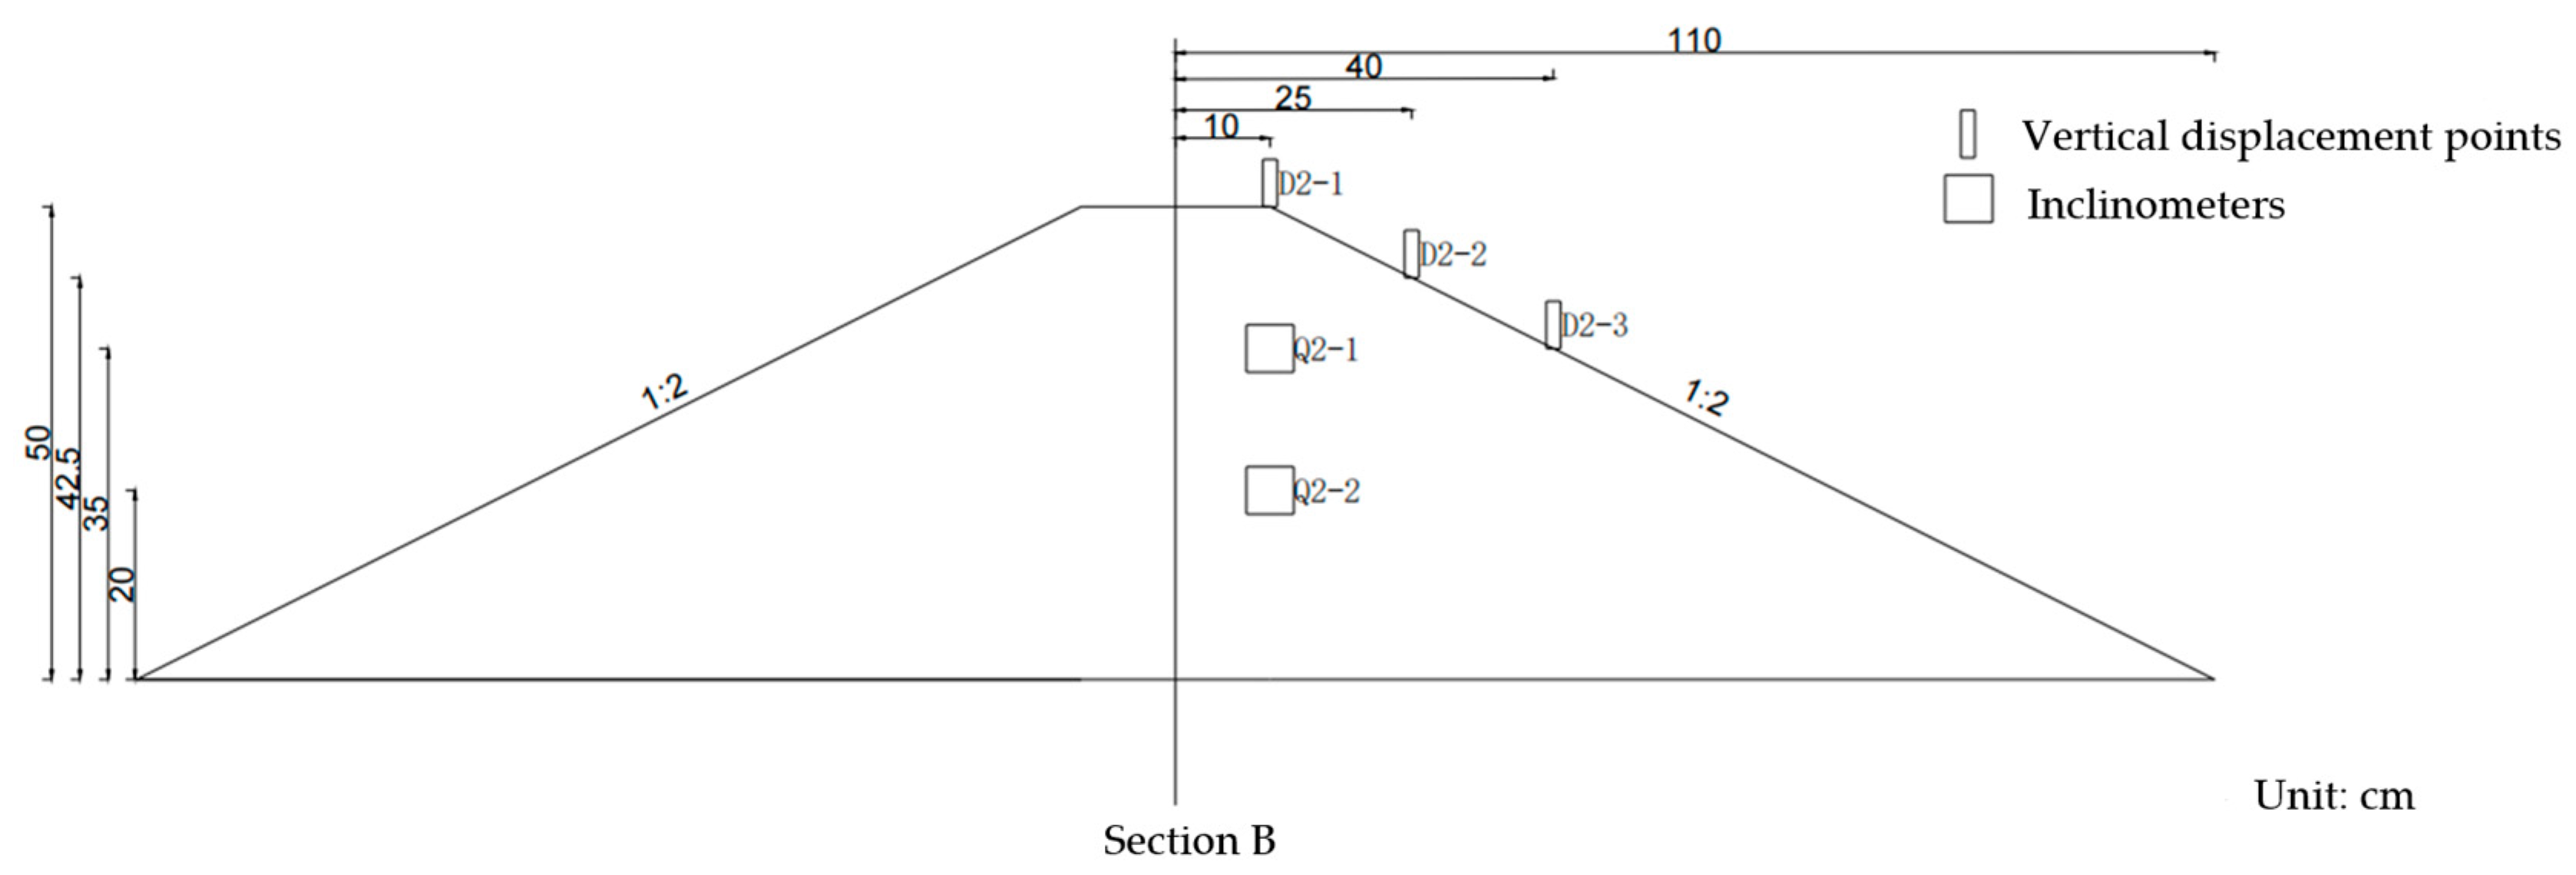
- Surface deformation: Two surface deformation monitoring sections are set up in the dam body, respectively, in the center section of the dam (section A) and the corresponding position 40 cm to the right of the center section (section B). Three measurement points are arranged in each section, and a measurement rod is used to measure the vertical displacement of the measurement points [28,29]. The measuring rod is divided into red and white bars (or marking scales). Due to the deformation of the surface of the dam body, and under the action of self-weight, readings are taken through the bar (scale) on the rod in order to measure the displacement.
- (4)
- Internal deformation: Two internal deformation monitoring sections are set up in the dam body, respectively, in the center section of the dam (section A) and the corresponding position 40 cm to the right of the center section (section B). Among them, in section A, one inclinometer is set at each elevation of 35 cm and 20 cm above the dam foundation at axis distances of −10 cm, 10 cm, and 25 cm, respectively, and one inclinometer is set at an elevation of 20 cm above the dam foundation at an axis distance of 40 cm; in section B, one inclinometer is set at each elevation of 35 cm and 20 cm above the dam foundation at an axis distance of 10 cm. A total of nine inclinometers are used.
2.4.2. Measurement Techniques
2.5. Test Procedure
3. Data Analysis
3.1. Surface Deformation
- (1)
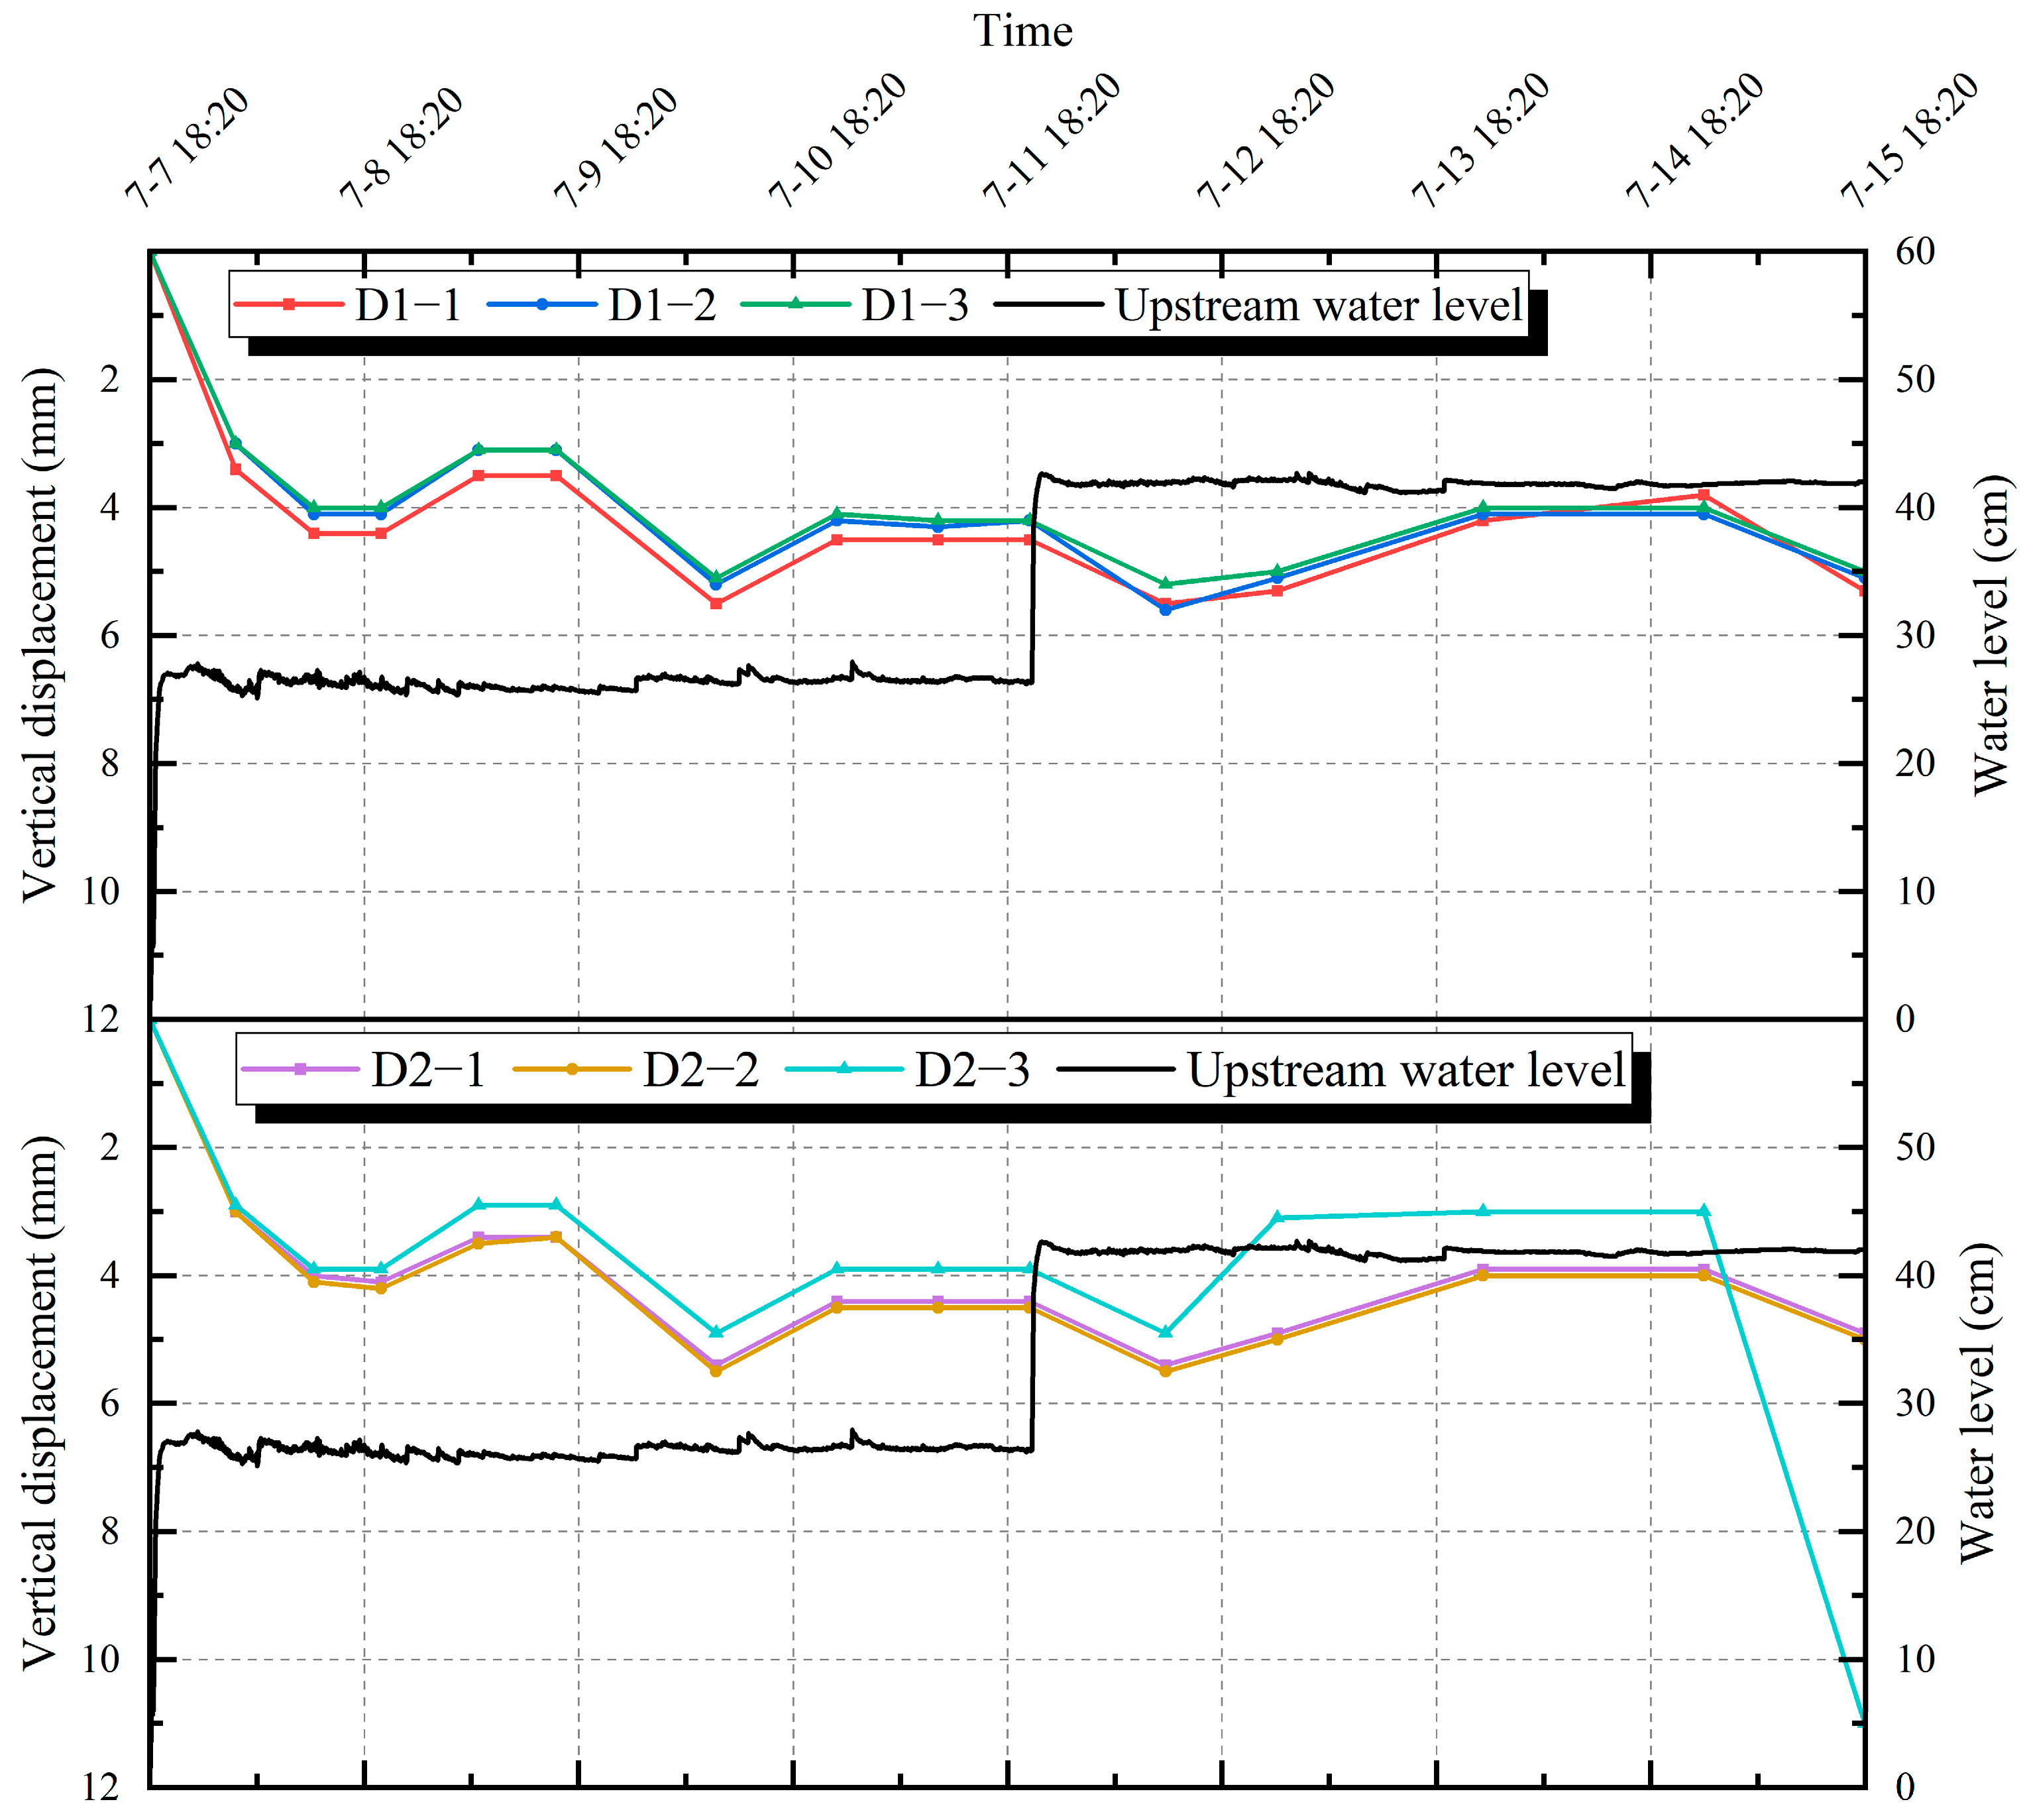
- The dam body generally showed vertical downward displacement. The cumulative vertical displacements before the breaching period in section A (the center section of the dam), i.e., the D1-1, D1-2, and D1-3 measuring points, were 5.3 mm, 5.1 mm, and 5 mm, respectively, while the cumulative vertical displacements in section B (40 cm to the right of the center section of the dam), i.e., the D2-1, D2-2, and D2-3 measuring points, were 4.9 mm, 5 mm, and 11 mm, respectively.
- (2)
- The vertical displacement of the dam crest had the maximum amplitude of change; the closer to the downstream side of the measurement point, the smaller the amplitude of change. The measurement points with the same axis distance, the vertical displacement of section A was generally more significant than the displacement of the measurement point of section B.
- (3)
- Nevertheless, the most considerable change in vertical displacement occurred at measurement point D2-3 in section B. According to the analysis, with the increase in the saturation line of the dam body, the soil of the downstream slope was saturated and the height of escape point increased, resulting in longitudinal cracks in the soil of the downstream slope and slight slippage to the downstream side, which led to the considerable vertical displacement measurement value of the D2-3 measurement point.
- (4)
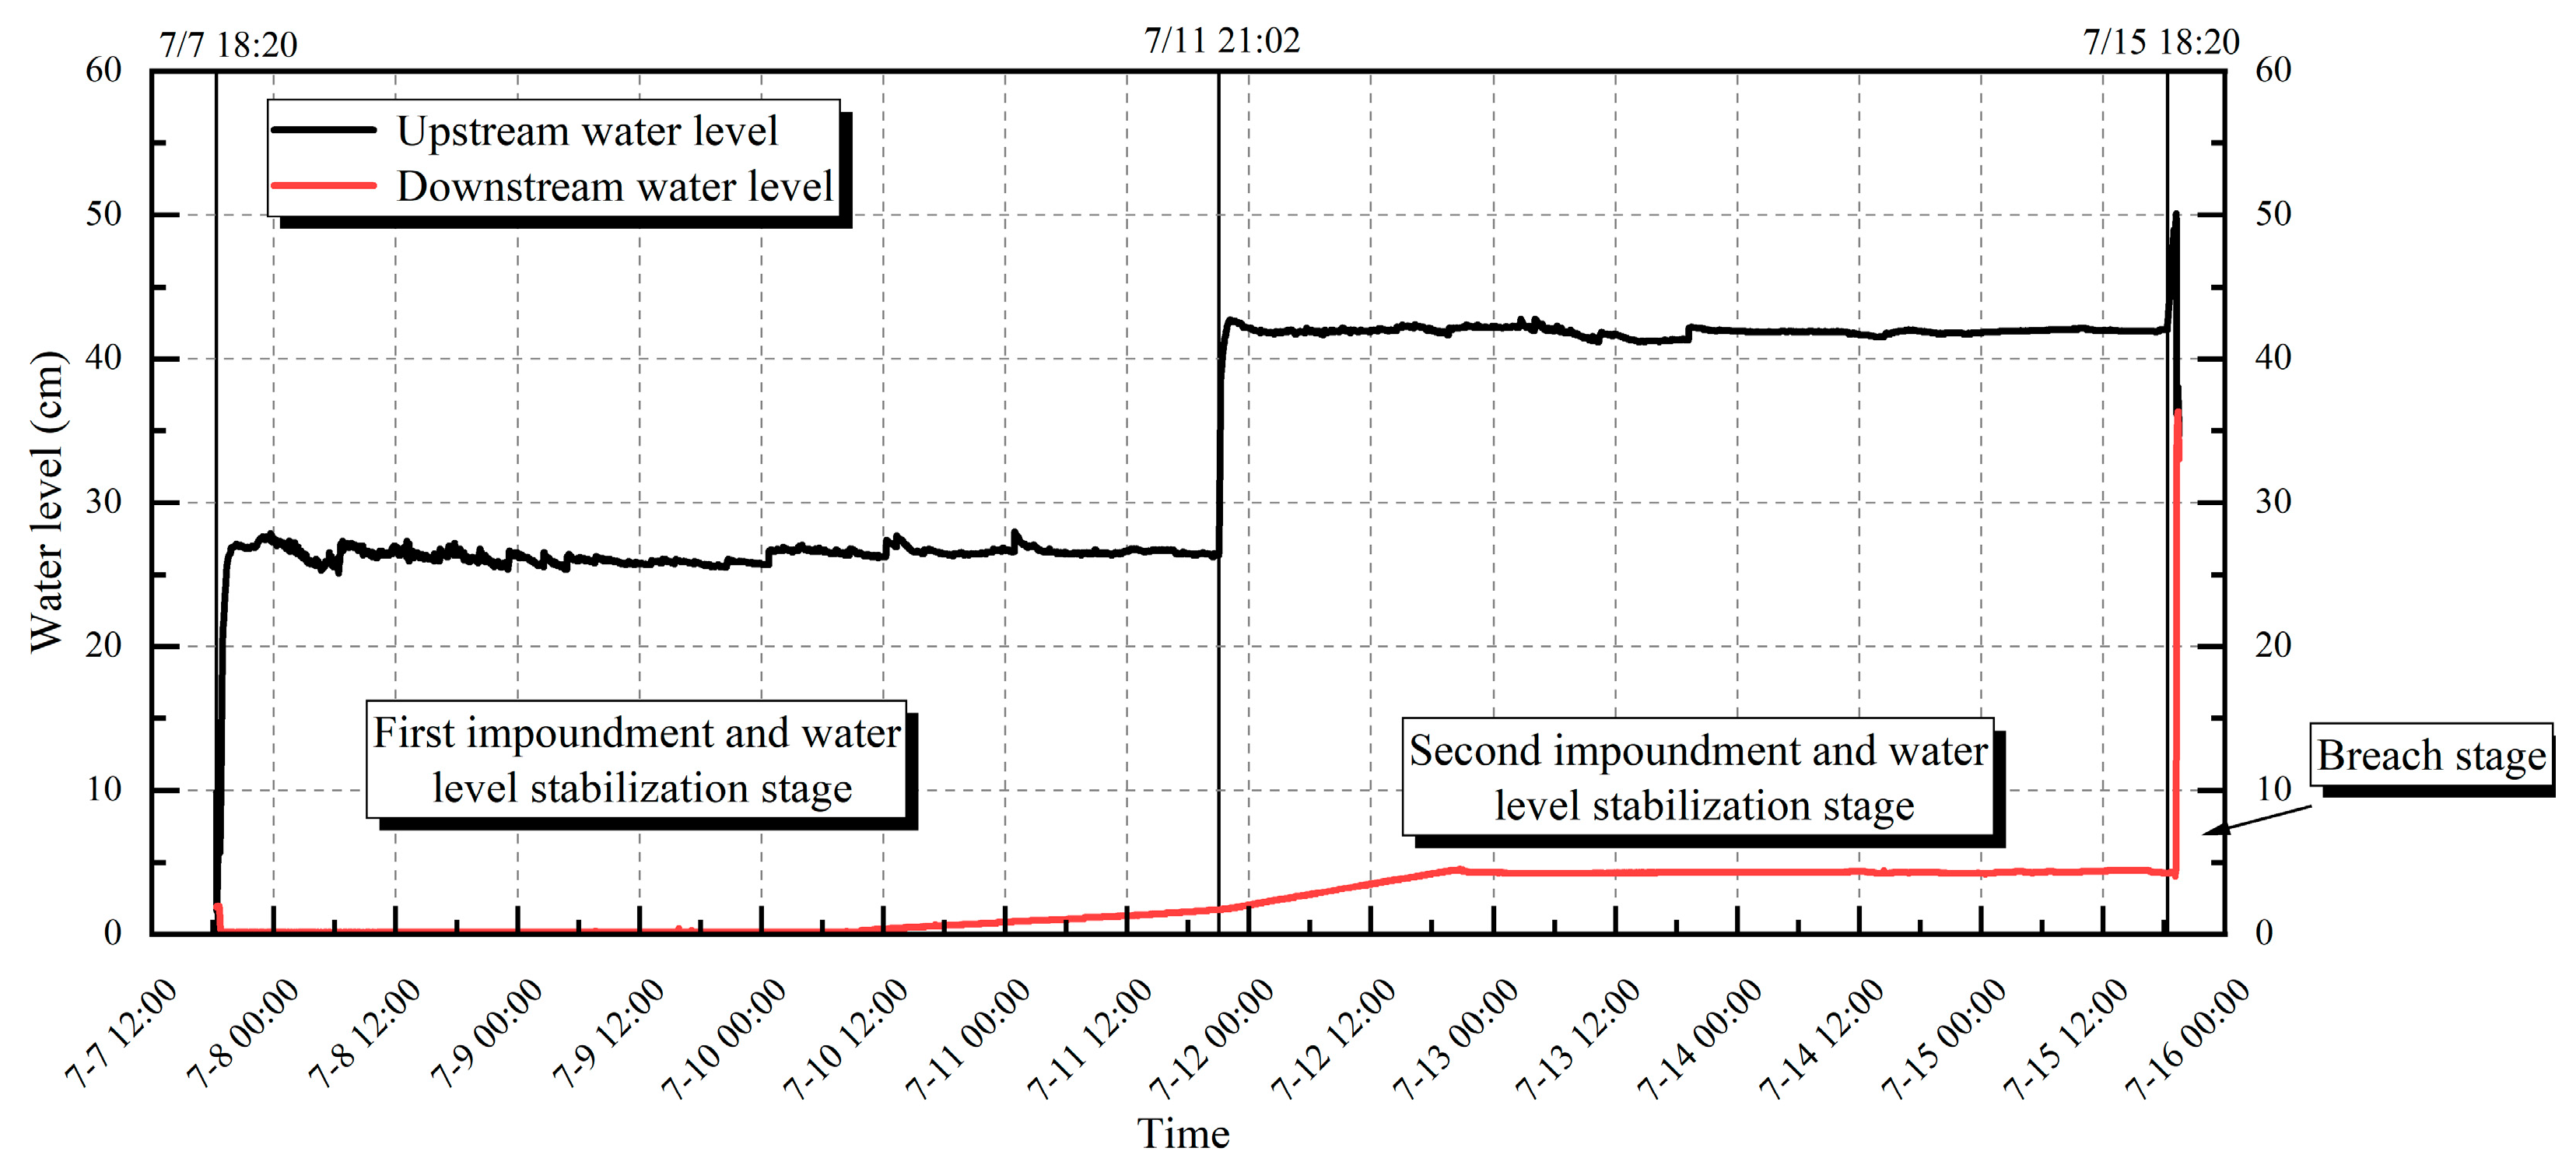
- The vertical displacement of the dam body was well correlated with the impoundment process and had a certain lag. During the two impoundments and water level stabilization processes, the vertical displacement of the dam body showed a pattern of gradual increase and tended to stabilize.
- (5)
- Combined with the whole impoundment process, the rate of change in vertical displacement during the first impoundment and water level stabilization was fast and in the rapid development stage, while the amount of change during the second impoundment and water level stabilization was not significant.
3.2. Analysis of Internal Deformation during the Impoundment Stage
3.2.1. Left and Right Bank Horizontal Displacement (L&R HD)
- (1)
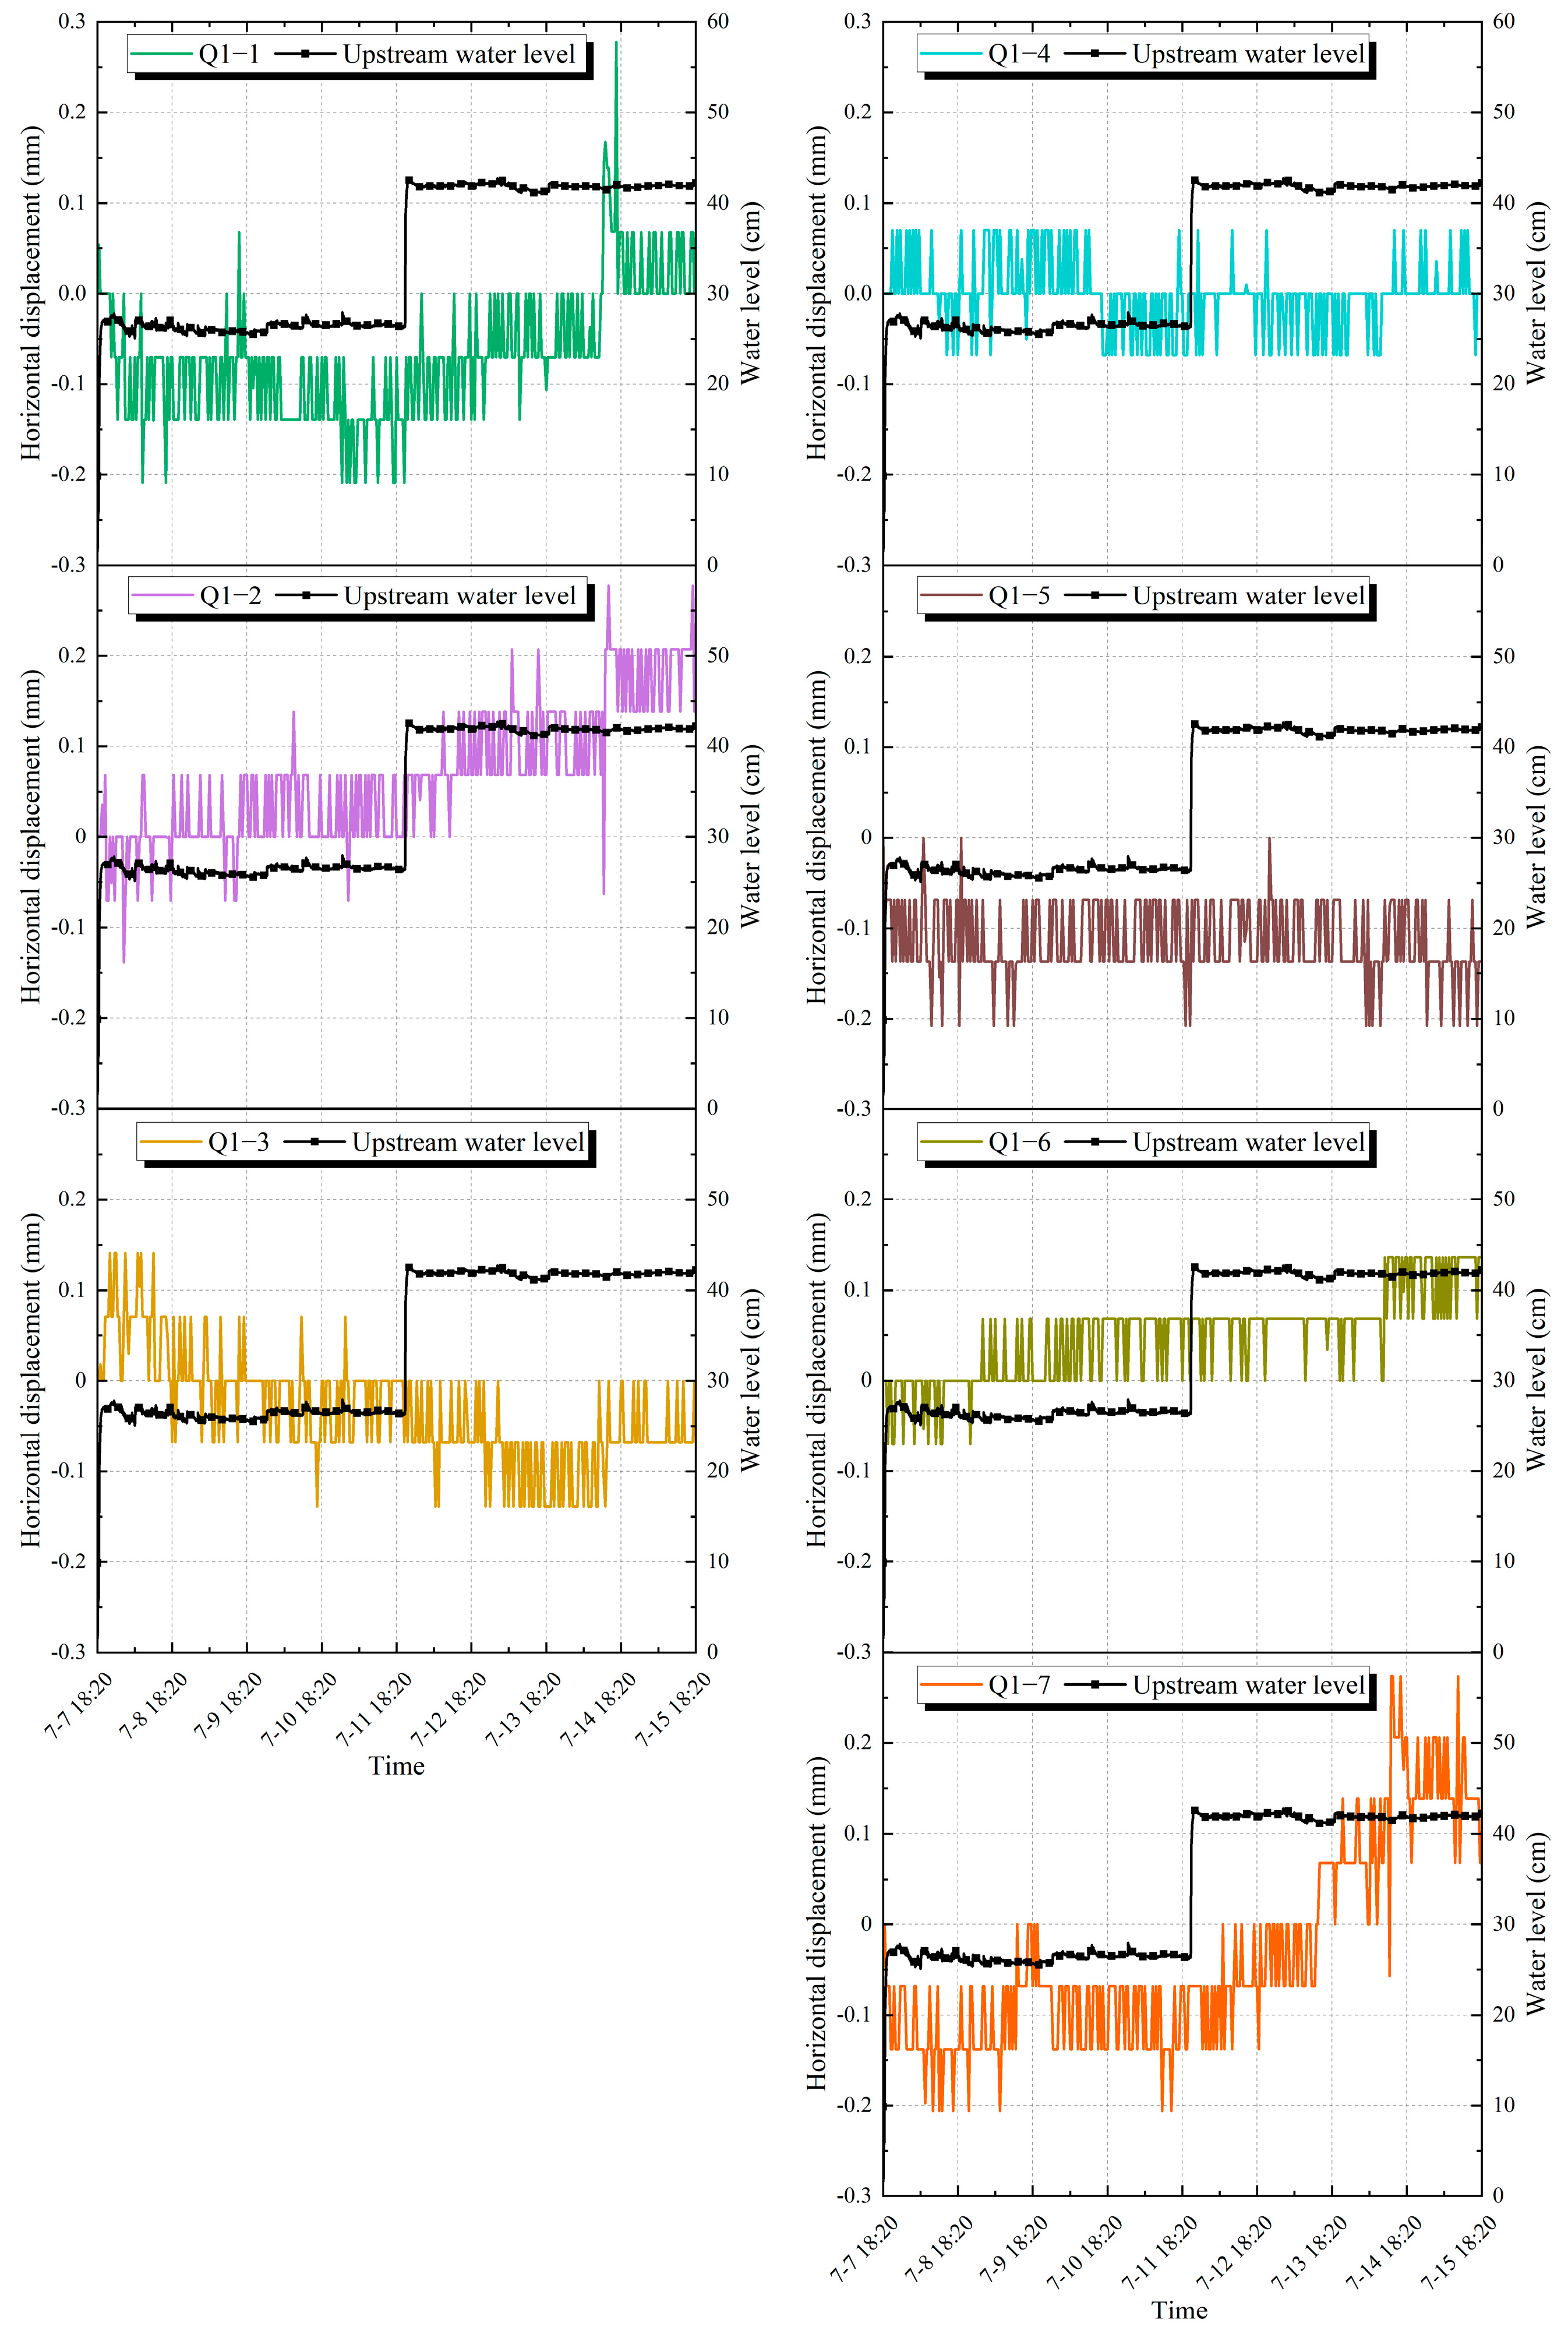
- The horizontal displacement of the two sections’ left and right banks shows a general deformation trend to the left bank, and the displacement of section B is more significant than that of section A. In the water impoundment and water level stabilization stage, the dam body is subject to seepage pressure and soil wetting; the deformation gradually increases, and the L&R HD tends to tilt to the left bank. As the water level of the upstream reservoir increases, the measured value of the measuring point gradually increases, and the rate of change is faster in the second impoundment period compared with the first impoundment period. Comparing the measuring points with the same elevation and the same axis distance in two different sections, such as measuring point Q2-1 with 35 cm elevation in section B and measuring point Q1-2 in section A, it is found that the measured value of the measuring point in section B has an enormous variation, which indicates that the horizontal displacement of the right bank of the dam body changes more than the location of the middle of the dam.
- (2)
- Displacements at the measurement points near the dam crest and the dam toe are relatively more substantial. A comparative analysis of the most extensive displacement changes between the two sections in the storage stage found that the 35 cm elevation downstream side of the dam crest measurement points (Q1-2 and Q2-2) and the 20 cm elevation near the dam toe measurement point (Q1-7) measured larger value changes, so we should focus on the change in horizontal displacement on the left and right banks in this area.
- (3)
- The higher the elevation and the larger the axis distance of section A, the relatively more significant the L&R HD is. The upstream and downstream displacements near the dam crest show almost the same trend (e.g., measurement points Q1-1 and Q1-2 at 35 cm elevation). For the measuring points with the same axis distance, the increase in measured value of the points with higher elevation is greater than that of the points with lower elevation (e.g., measurement points Q1-2 at 35 cm elevation and Q1-5 at 20 cm elevation, as well as Q1-3 at 35 cm elevation and Q1-6 at 20 cm elevation), which means that the higher the elevation of the points, the higher the influence of the dam settlement and seepage pressure, resulting in more remarkable changes in the left and right banks’ horizontal displacements. For the measuring points with the same elevation, the larger the axis distance, i.e., the measurement points far away from the dam crest, the more significant the change in the measured value is (e.g., measurement points Q1-4, Q1-5, Q1-6, and Q1-7 at 20 cm elevation), which is inferred to be due to the wetting of the downstream dam material because of the lack of drainage facilities in the dam body.
- (4)
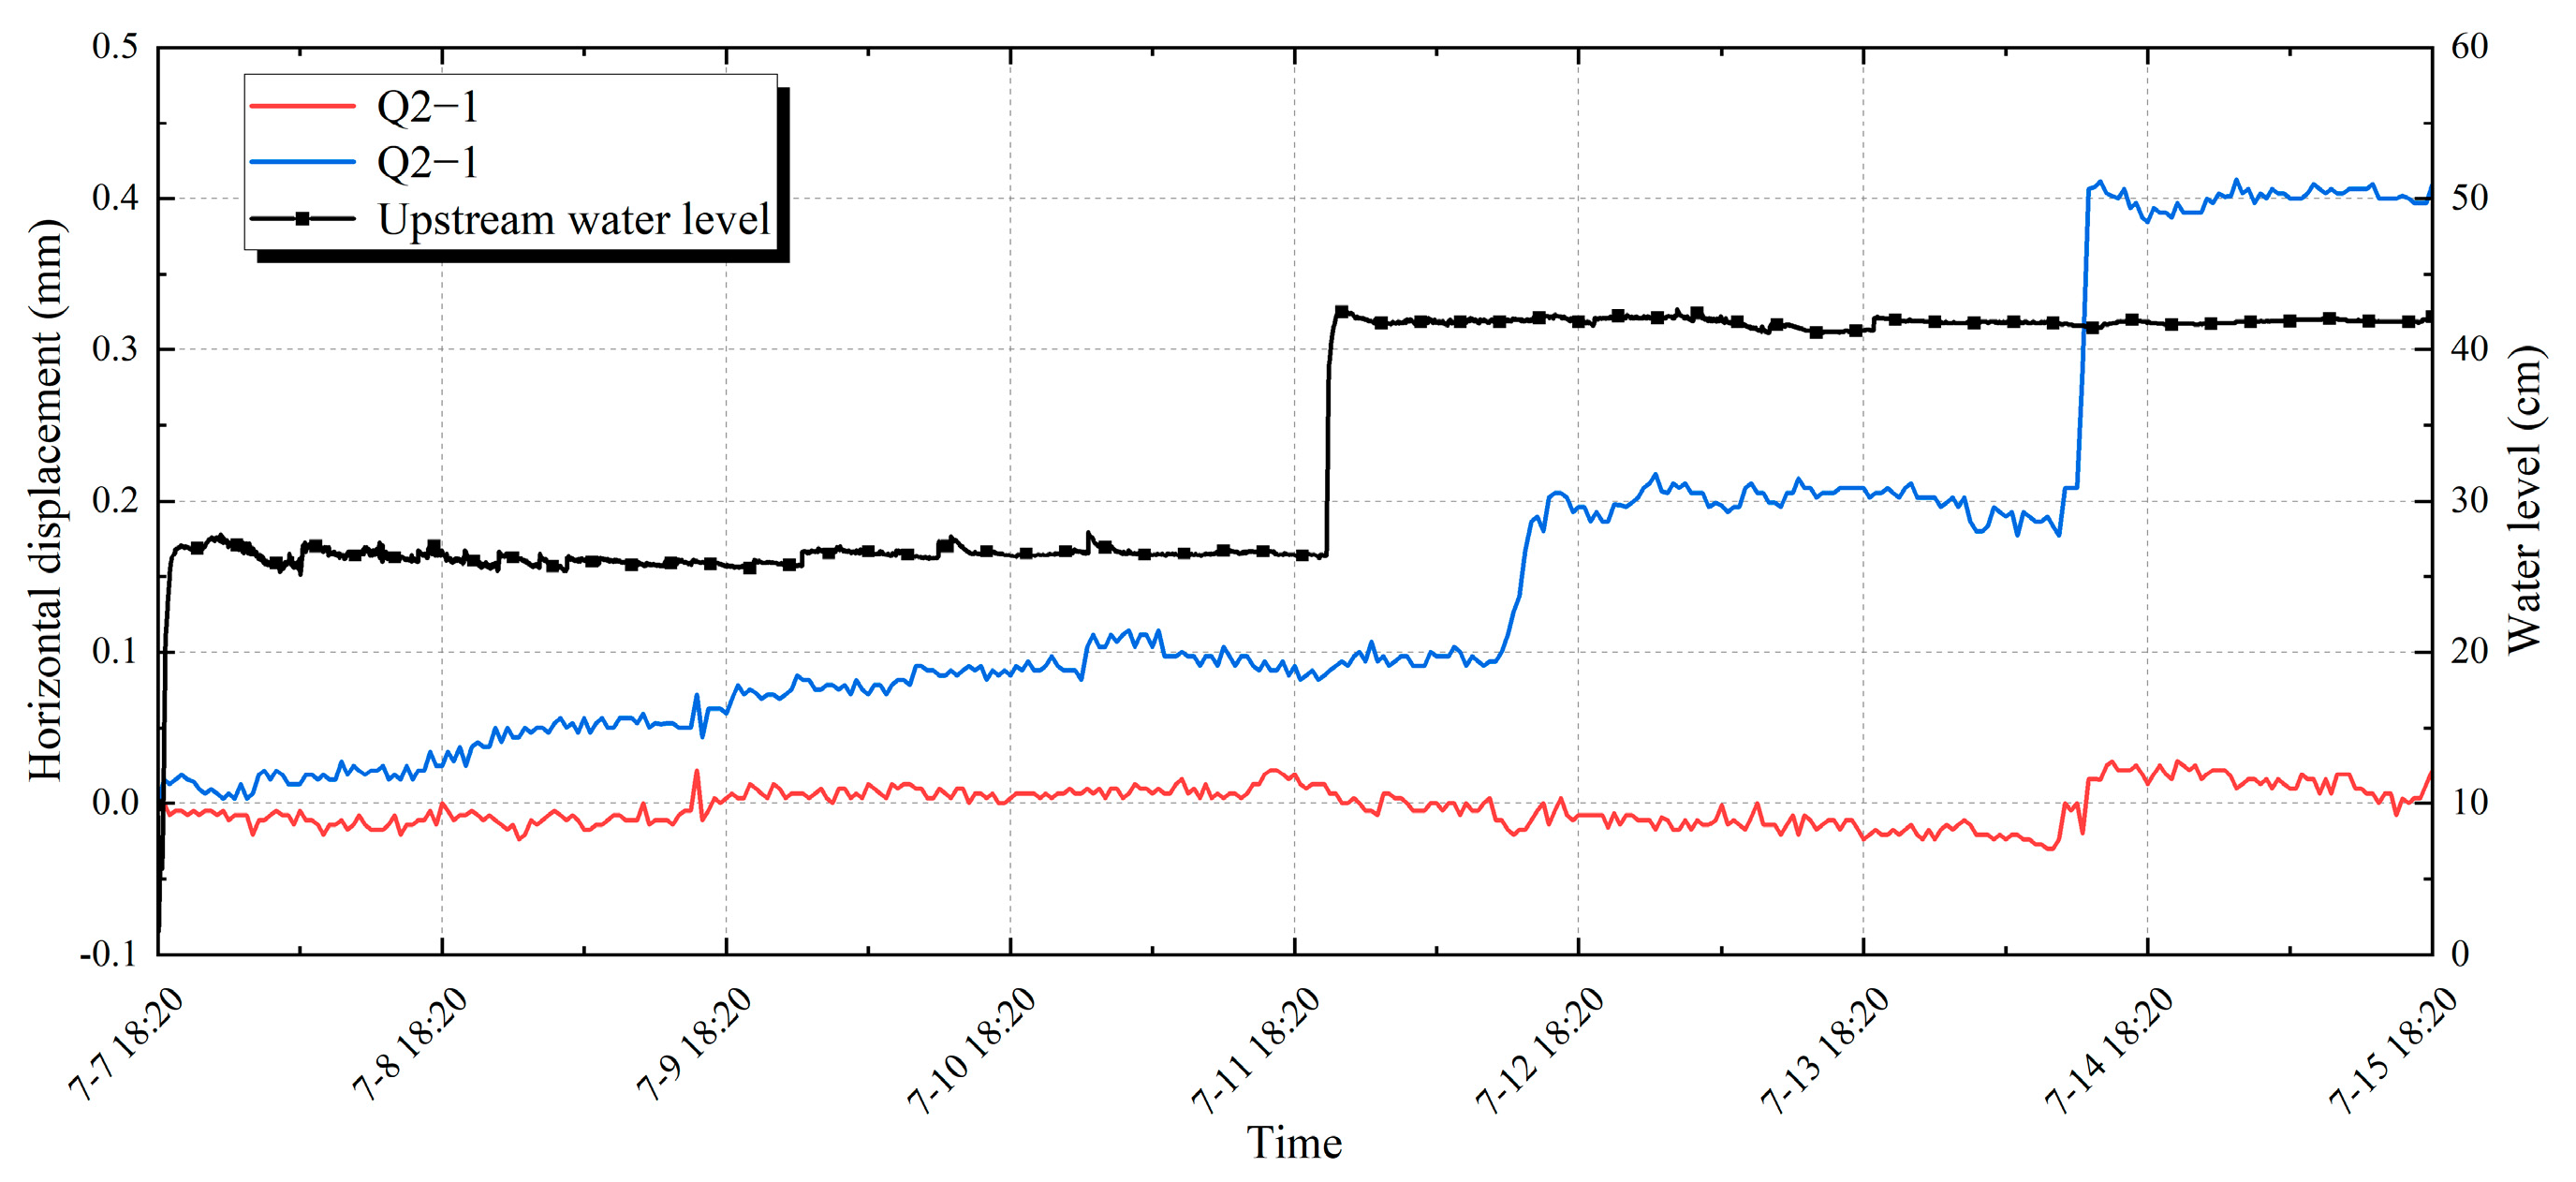
- For the measurement points in section B, the measured values of the two measurement points show almost the same elevation pattern, and there are three rapid elevation phases, respectively. After the first impoundment, by the action of seepage pressure, the measured values of Q2-1 (35 cm elevation) and Q2-2 (20 cm elevation) began to increase rapidly and slowed down after the first impoundment for about 48 h. After the second impoundment, the measured values of the two points began to increase rapidly and gradually slowed down after the first impoundment for about 1 h 10 min. With the upstream reservoir water level increasing, the seepage pressure of the dam body increases. A minor slippage was observed on the downstream slope of the dam, and the soil in the dam body was redistributed by force, which led to a third rapid increase in the measured values and the gradual formation of a stable phase of elevation after the rise. The same pattern is shown across section A measurement points at different elevations but with the same axis distance.
3.2.2. Upstream and Downstream Horizontal Displacement (U&D HD)
- (1)
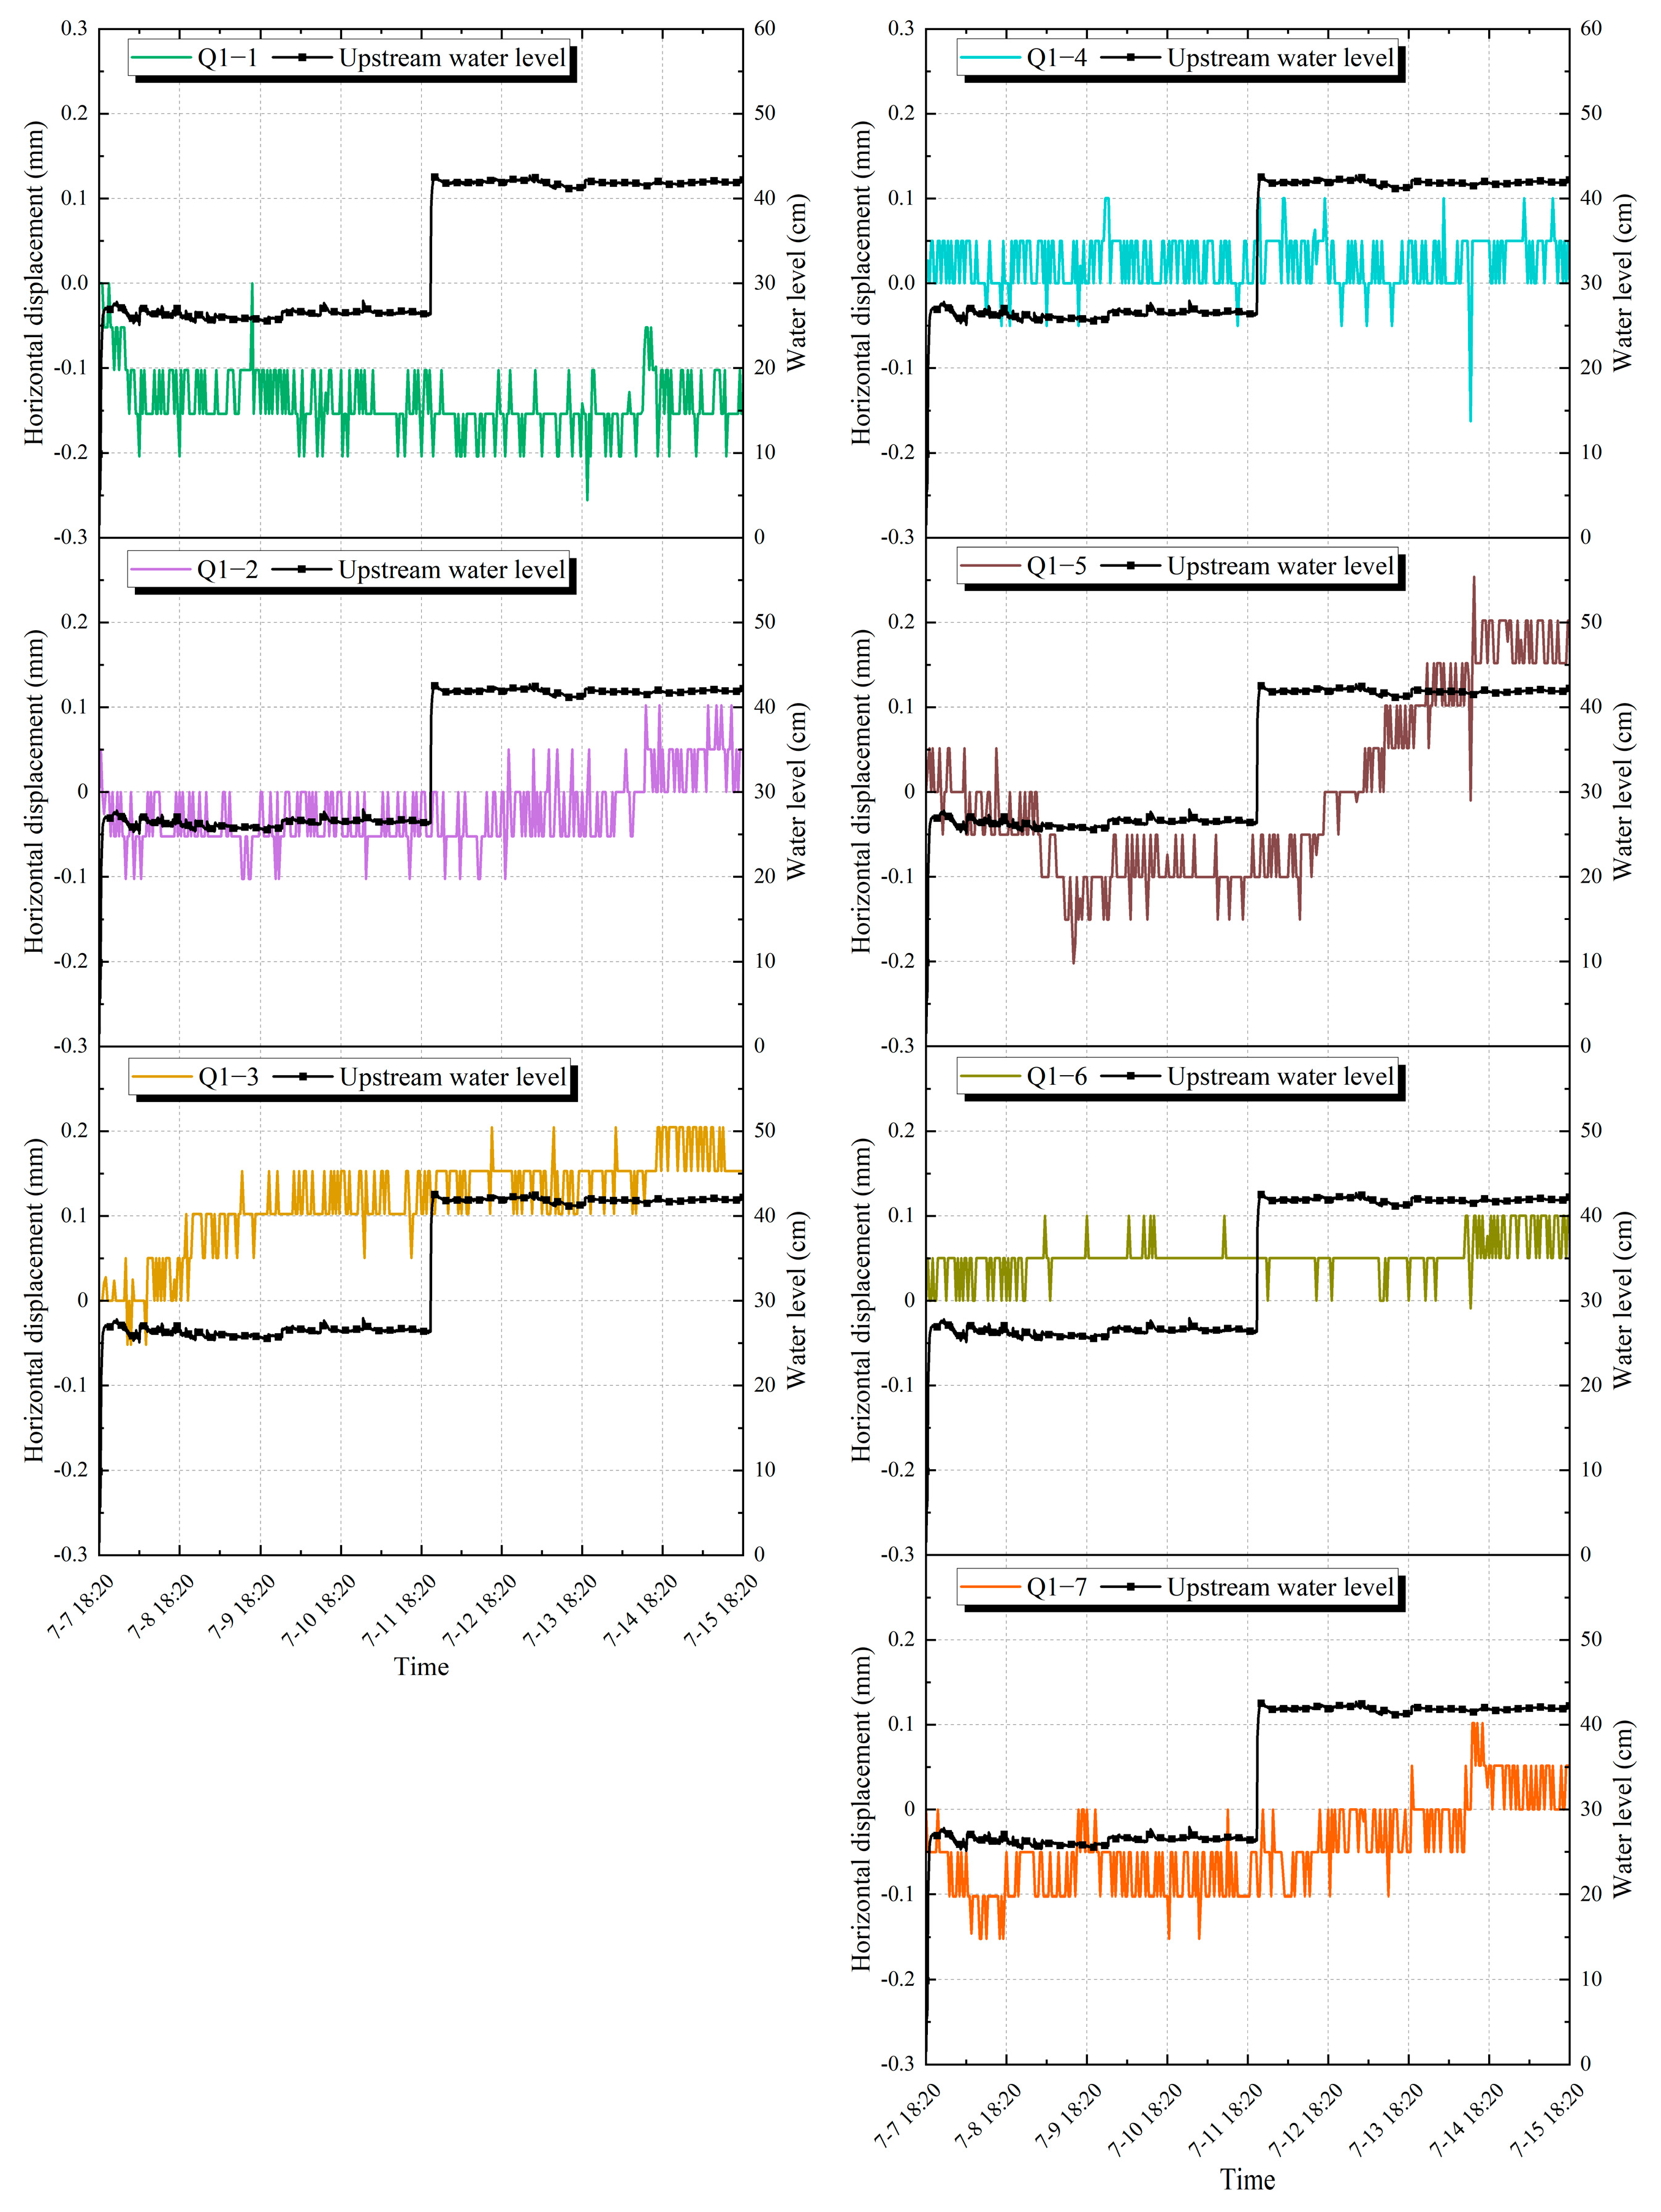
- The magnitude of change in U&D HD is more significant in the later stages than in the earlier stages. The deformation of the dam body is gradually increased by seepage pressure and soil wetting during impoundment and water level stabilization, and the U&D HD generally shows an inclination to the downstream side. Compared with the first impoundment and water level stabilization period, the displacement change rate is faster in the second impoundment and water level stabilization period.
- (2)
- The displacement of the right dam section to the downstream side is greater than that of the middle section, and the displacement of the measurement points near the downstream dam slope location is relatively significant. While comparing the measuring points with the same elevation and axis distance in two different sections, it is found that the variation in the measured value of the measuring point of section B is more prominent (e.g., measurement points Q2-2 at 20 cm elevation in section B and Q1-5 at 20 cm elevation in section A), which indicates that the variation in U&D HD in the right dam section is more considerable than that of the middle position of the dam. In the comparative analysis of the displacement of the water impoundment stage at the most prominent points of the two sections, we found that the measurement points (Q1-5 and Q2-1) at 20 cm elevation downstream of the dam crest measured the most significant variation, so we should focus on the changes on U&D HD on the downstream side of the dam crest.
- (3)
- For each measurement point in section A, the U&D HD exhibits an overall trend of tilting upstream first. With the gradual stabilization of the saturation line of the dam body, upstream tilting changed to a downstream tilting trend. For measuring points at the same elevation, the smaller the axis distance is, i.e., the closer the measuring point is to the dam crest, the more significant the change in the measured value is (e.g., measurement points Q1-5 and Q1-7 at 20 cm elevation). For measuring points with the same axis distance, the lower the elevation, the larger the amplitude of change in the measured value (e.g., measurement points Q1-2 at 35 cm elevation and Q1-5 at 20 cm elevation).
- (4)
- For the measurement points in section B, the whole change rule of the two measurement points is the same; the overall change amplitude at the 35 cm elevation measurement point Q2-1 is smaller than the 20 cm elevation measurement point Q2-2, which indicates that, for measurement points at the same axis distance but different elevation, the lower the elevation, the more extensive the amplitude of the value of the change is, which is the same rule as the one shown in the measurements of section A. The measured value of point Q2-2 starts to increase 6 h 27 min after the first impoundment, reaches its peak value after 71 h 30 min, and then gradually stabilizes; it starts to increase rapidly after 12 h 50 min from the second impoundment, reaches its peak value after 6 h 30 min, and then gradually stabilizes. With the slight slippage on the downstream dam slope, the measured values of the two points appear to increase rapidly for a short period of time and then gradually stabilize. The measured value of the 20 cm elevation Q2-2 point in section B has a higher correlation with the upstream reservoir level, with some lag. Relative to the first impoundment and water level stabilization period, the rate of displacement change is faster during the second impoundment and water level stabilization period.
3.3. Analysis of Internal Deformation during the Breach Stage
3.3.1. Left and Right Bank Horizontal Displacement (L&R HD)
- (1)
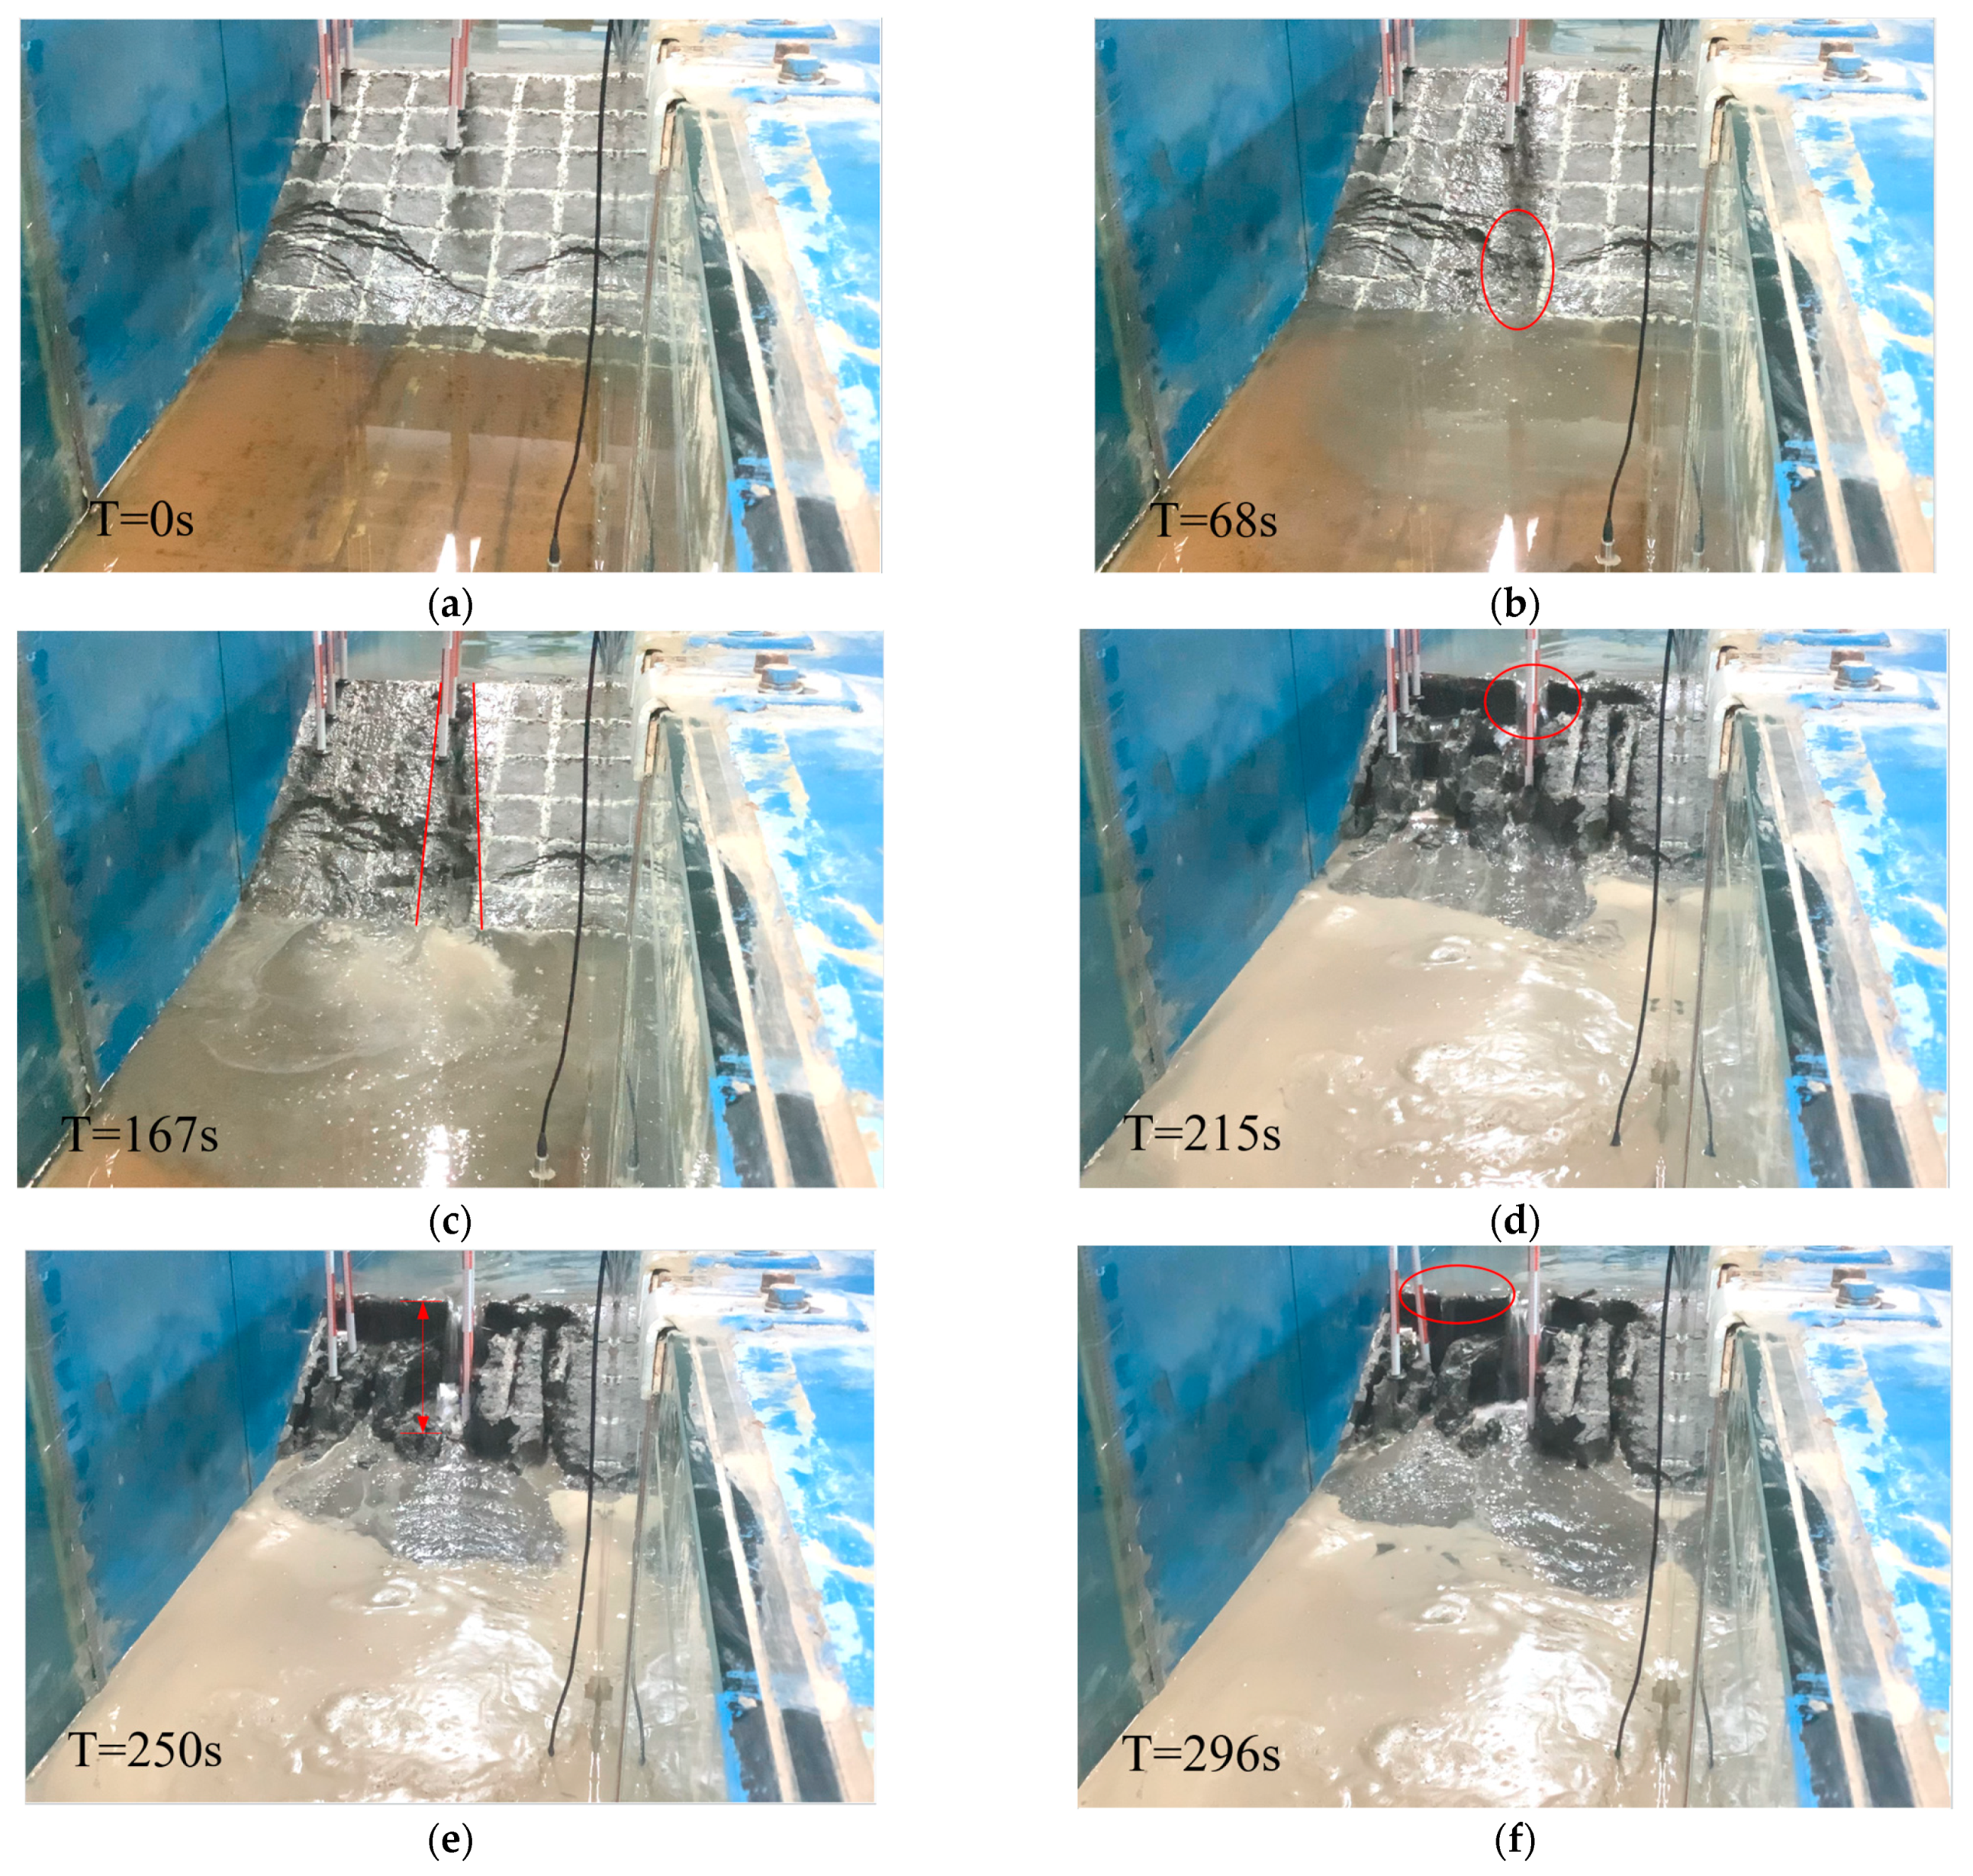
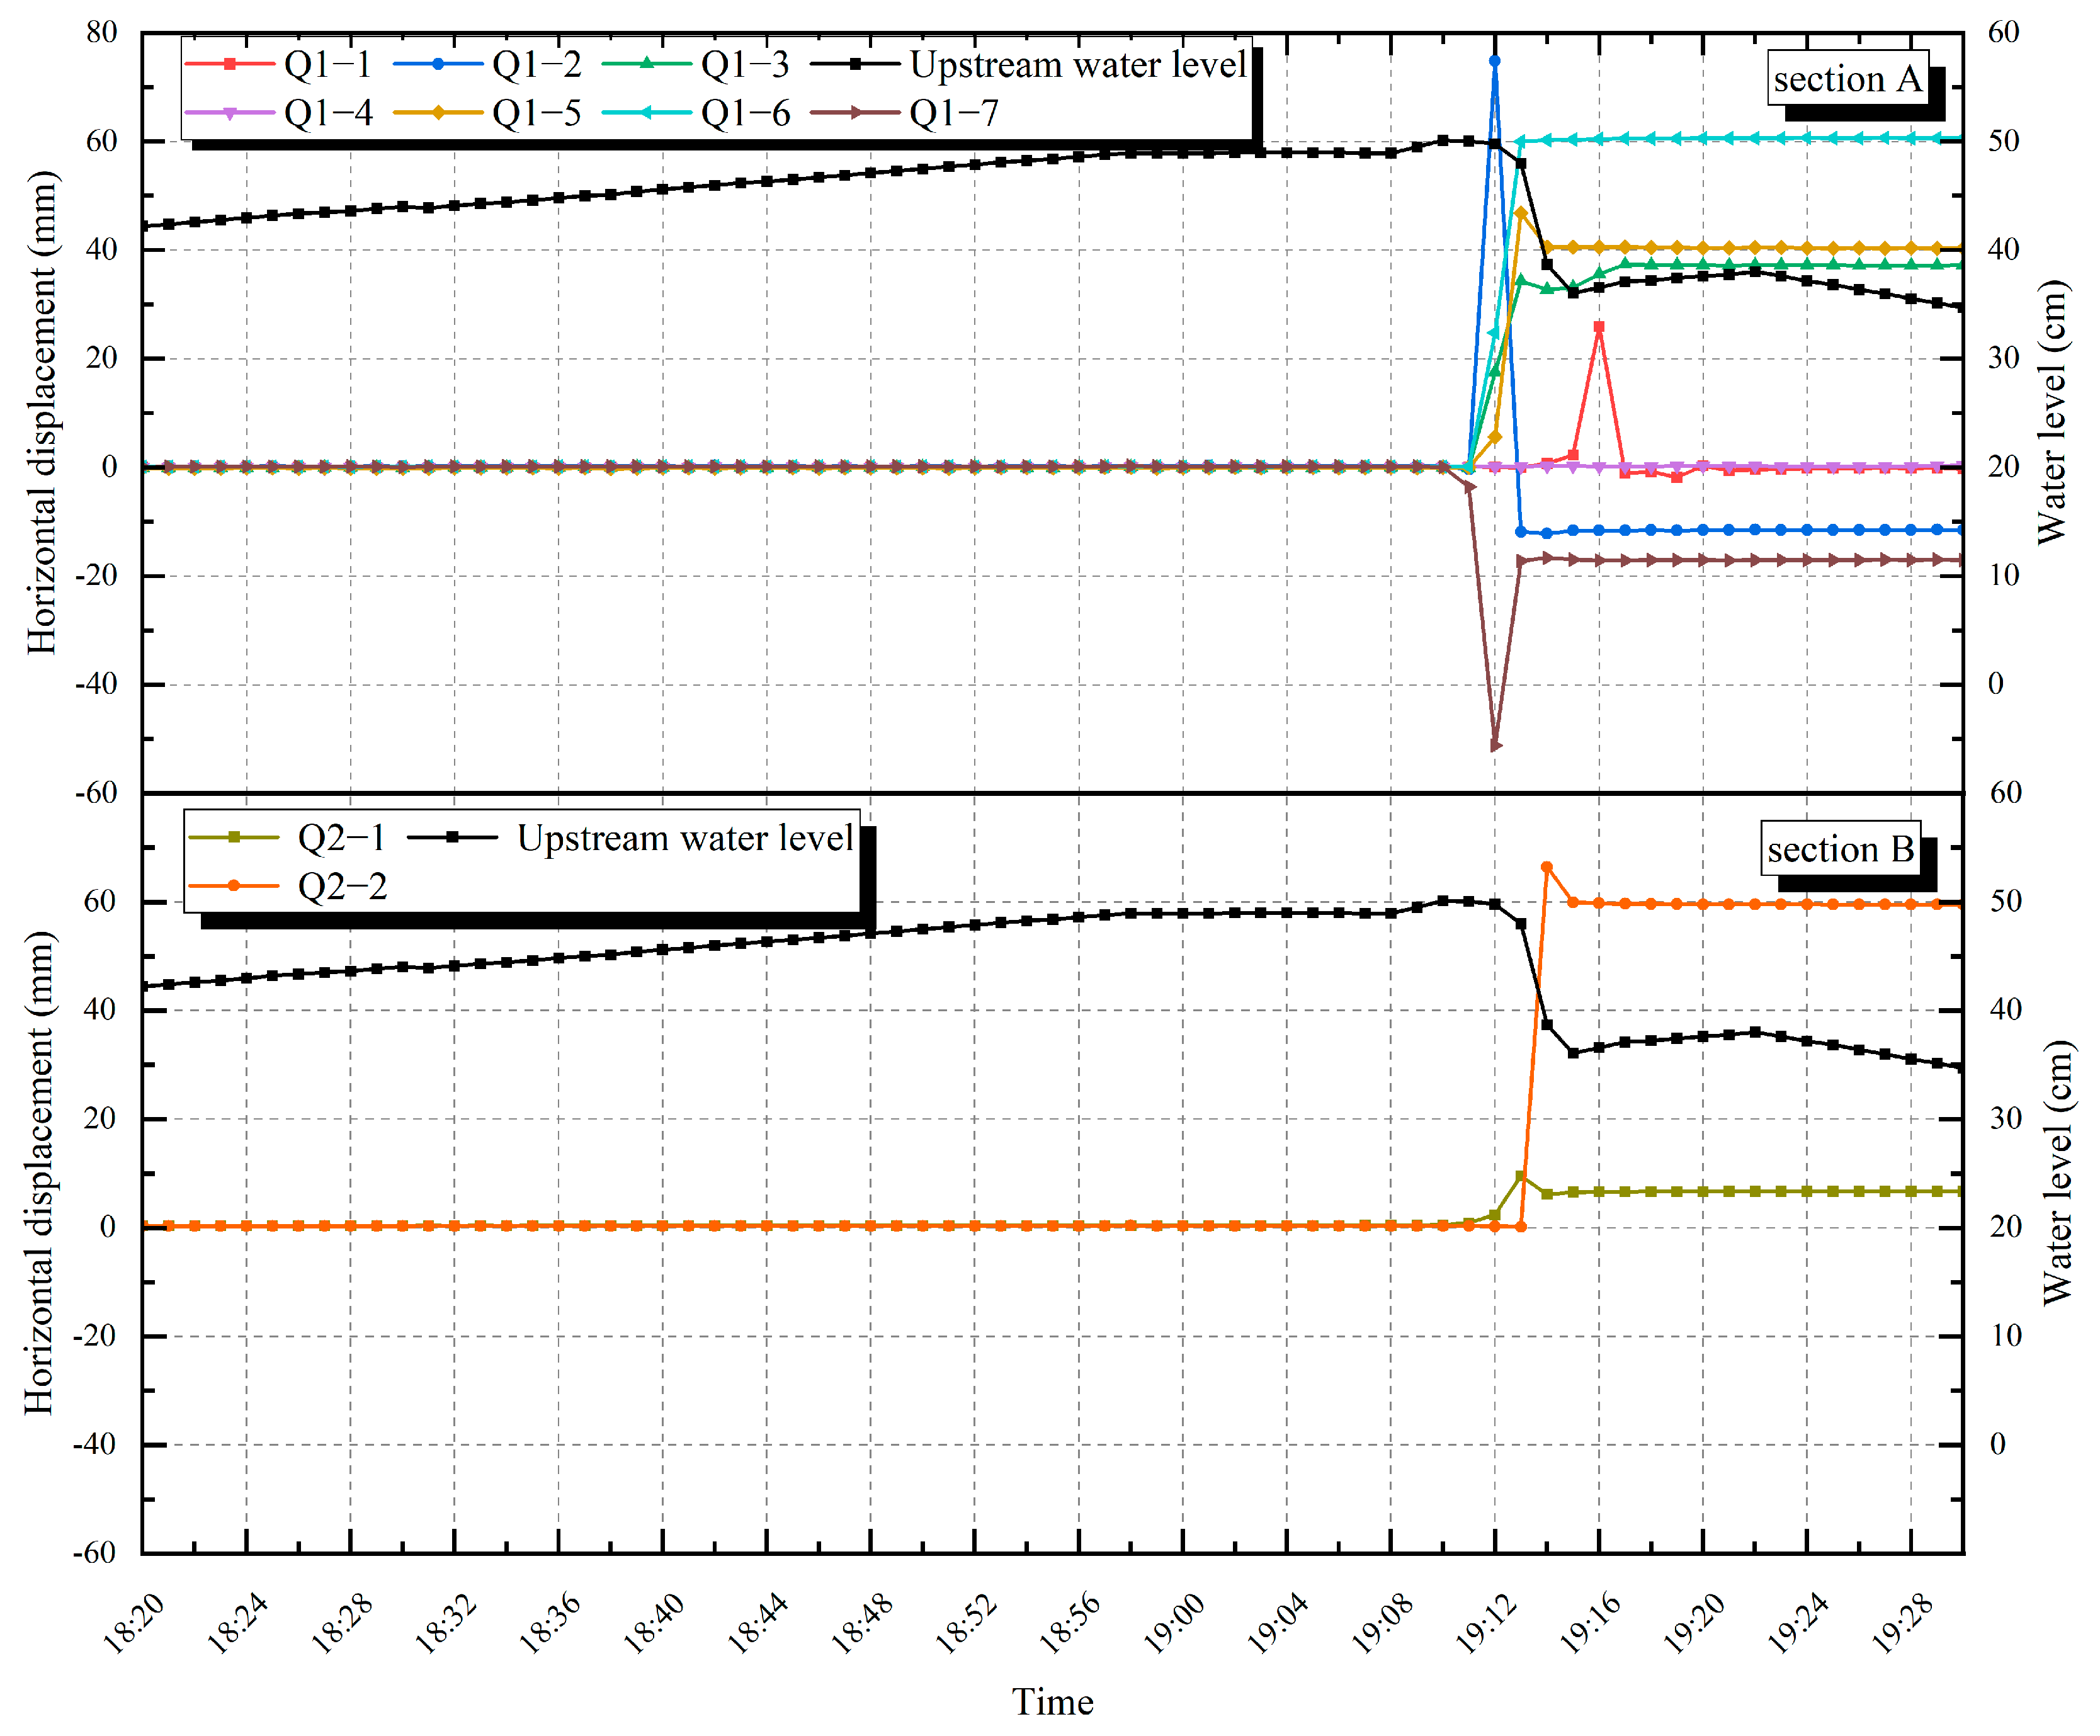
- The reservoir water overtopped the dam at 19:08:30. It began to erode the downstream slope of the dam; the erosion process was slow and gradual, and the upstream reservoir water level was still in the stage of slow elevation. With the gradual increase in overtopping erosion capacity, “multilevel headcut” erosion was formed after 68 s and gradually developed from the dam toe to the upstream side of the dam crest. The measurement point Q1-7 on the downstream side of the 20 cm elevation at the center section of the breach (section A) first started to change slowly to the right bank at 19:10.
- (2)
- With the “multilevel headcut” continuing to erode back toward the dam and developing upstream, the “multilevel headcut” gradually merged into a larger “headcut”. Within 215 s after the breach formed, a “waterfall-like water flow” emerged at this point, signifying the dam body erosion damage had progressed to the dam crest. At the center section of the breach (the downstream side of the dam crest and downstream side measurement points Q1-2 and Q1-3 at 35 cm elevation and the downstream side measurement points Q1-6 and Q1-7 at 20 cm elevation), the measurement values for above measurement point suddenly changed at 19:12.
- (3)
- Subsequently, the erosion capacity of the “waterfall-like water flow” became more vigorous. The water flow continuously eroded the dam body at the water tongue fall point. The water flow drop increased, and the scouring capability further increased while continuously eroding the bottom. The measured values of Q1-5 at the downstream side of the dam crest at 20 cm elevation in the center section of the breach and Q2-1 at the downstream side of the dam crest at 35 cm elevation in section B suddenly changed at 19:13.
- (4)
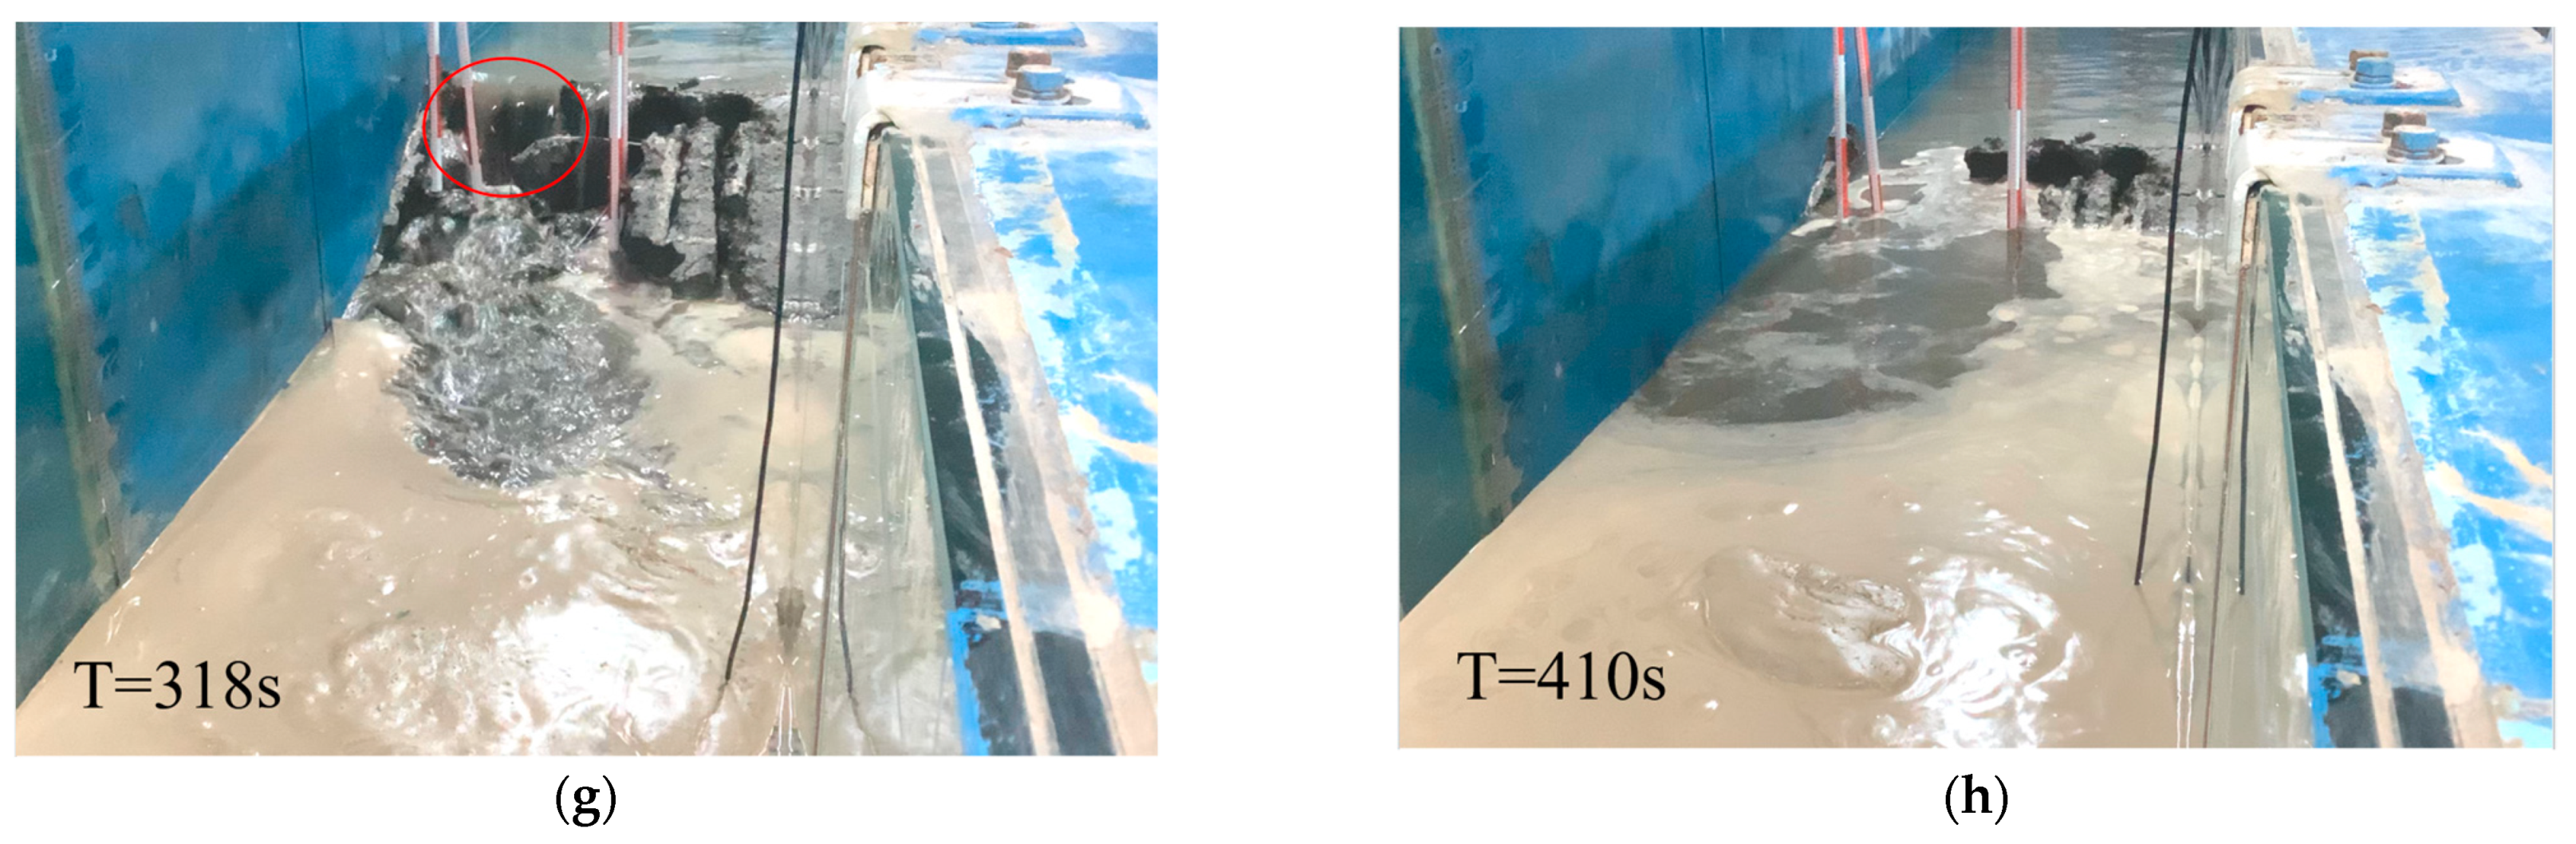
- With the rapid erosion of the dam body by the “waterfall-like water flow”, after 296 s of upstream reservoir water overflowing over the dam crest, the right bank of the dam crest soil body collapsed due to gravitational instability, resulting in the formation of a new breach whose width increased rapidly. At this moment, the failure and collapse processes of the dam body were very intense, the water erosion ability was potent, the flow and flow velocity of the breach increased rapidly, and the water level of the upstream reservoir decreased rapidly. The dam body formed a structural collapse after 410 s, resulting in the upstream and downstream reservoirs being connected. The measurement value of Q2-2 at the downstream side of the dam crest at 20 cm elevation in section B suddenly changed at 19:14, and the measurement value of Q1-1 at the upstream side of the dam crest at 35 cm elevation at the center section of the breach suddenly changed at 19:16.
- (5)
- As shown in Table 5, the sudden change in measuring point Q1-2 on the downstream side of the dam crest at 35 cm elevation in section A was the most considerable, with an amplitude of 79.2 mm. Before the structural collapse of the dam body occurred, embankment dam failure mainly occurred on the downstream side of the dam body. The dam crest’s downstream side and the dam body’s downstream side in section A have considerable overall variation. When combined with the breaching process, it can be seen that the initial breaching mainly occurred in section A. Compared with the same location of measuring points in section A, the sudden change time of the measuring points in section B took place later, and the amount of sudden change was smaller (e.g., measuring point Q2-1 at the downstream side of the dam crest at the 35 cm elevation). Due to the formation of a new breach on the right bank of the dam body, the amount of sudden change on the downstream side of the dam crest measuring point Q2-2 at 20 cm elevation in section B was 66.26 mm, which is more extensive than that of the original breach center section at the same location. From the beginning to the end of the overtopping breach of the earth dam, there was no sudden change in the measurement point on the upstream side of the dam crest at the 20 cm elevation in section A.
3.3.2. Upstream and Downstream Horizontal Displacement (U&D HD)
3.3.3. Warning Signs of Deformation Analysis
- (1)
- The overall direction of the dam overtopping breach sudden change is toward the left bank and downstream, consistent with the changing trend of the water impoundment stage.
- (2)
- After the overtopping failure started, the closer to the downstream slope of the dam, the earlier the sudden change appeared, such as the 20 cm elevation Q1-7 measuring point in section A.
- (3)
- The higher the measuring point, the earlier the sudden change time, such as the 35 cm elevation Q1-2 and 20 cm elevation Q1-5 measuring points in section A.
- (4)
- That is, the time sequence of the sudden change in the measured value of each measurement point is from the downstream side to the upstream side and from the higher position to the lower position of the dam elevation, which is in accordance with the fundamental process of overtopping and breaching of embankment dams [30,31,32].
- (5)
- As the erosion capacity of water flow in section A (the center section of the breach) is more significant than that in section B, the time of sudden change in the measurement point in section B is slightly later than that in the center section of the breach.
- (6)
- Before the dam body’s structural collapse occurred, the measurement point on the upstream side had not caused any sudden changes.
4. Conclusions
- (1)
- During the impoundment stage, with the elevation of the water level, the overall horizontal displacement inside the dam changed in the direction of the left bank and downstream side. The rate of displacement deformation was more rapid in the second impoundment and water level stabilization period compared to the first impoundment and water level stabilization period. The deformation was strongly correlated with the upstream reservoir level, with a certain lag. The internal horizontal displacement and left and right bank displacement variations at the downstream side of the dam crest were generally large, so we should focus on this area.
- (2)
- The failure process can be divided into four stages: the downstream dam slope erosion gully formation and development stage; the downstream dam slope “multilevel headcut” erosion stage; the breach “waterfall-like water flow” erosion stage; and the upstream side of the dam body rapid collapse stage. The time sequence of the sudden change in the horizontal displacement at each measurement point is from the downstream side to the upstream side and from the higher elevation of the dam body to the lower elevation, which is consistent with the basic process of overtopping and breaching of embankment dams. The downstream side of the dam crest and the downstream side of the dam body within the measurement point of the left and right banks of the horizontal displacement of the overall sudden change are large, and the downstream and upstream horizontal displacement within the measurement point of the downstream side of the dam crest has a large amount of sudden change. Before the dam body suffered structural collapse, no sudden change had occurred at the measuring point on the upstream side of the dam center section.
- (3)
- Due to the lack of seepage control facilities at the dam, during the stabilization process of the upstream reservoir water level at 42 cm, longitudinal cracks emerged and the height of escape point increased within the 0~0.3 m elevation range of the dam slope surface on the right dam section. As the upstream reservoir water level increased, the cracks slightly increased further to the downstream measurement of the slip, resulting in a decrease in soil compactness on the right side. At the stage of impoundment, the internal horizontal displacement of the right bank of the dam body was larger than that of the middle of the dam body. Meanwhile, the right bank of the dam body was in contact with the rigid boundary of the flume, which was a weak contact zone, and the right bank of the dam body experienced structural collapse during the final overtopping failure.
- (4)
- When an embankment dam encounters overtopping risks, attention should be focused on the thinner sections of the dam body, such as the contact point between the dam body and the two sides of the mountain, as well as locations with higher seepage pressure. This should be combined with real-time variation in monitoring data so that immediate emergency treatment measures can be taken.
Author Contributions
Funding
Data Availability Statement
Acknowledgments
Conflicts of Interest
References
- ASCE/EWRI Task Committee on Dam/Levee Breaching. Earthen Embankment Breaching. J. Hydraul. Eng. 2011, 137, 1549–1564. [Google Scholar] [CrossRef]
- De Neale, S.; Baecher, G.; Stewart, K.; Smith, E.; Watson, D. Current State-of-Practice in Dam Safety Risk Assessment; Oak Ridge National Lab. (ORNL): Oak Ridge, TN, USA, 2019. [Google Scholar]
- Ministry of Water Resources, People’s Republic of China. 2019 Statistic Bulletin on China Water Activities; China Water and Power Press: Beijing, China, 2020; p. 8. (In Chinese)
- Ebi, K.L.; Vanos, J.; Baldwin, J.W.; Bell, J.E.; Hondula, D.M.; Errett, N.A.; Hayes, K.; Reid, C.E.; Saha, S.; Spector, J.; et al. Extreme Weather and Climate Change: Population Health and Health System Implications. Annu. Rev. Public Health 2021, 42, 293–315. [Google Scholar] [CrossRef] [PubMed]
- Liu, W.; Carling, P.A.; Hu, K.; Wang, H.; Zhou, Z.; Zhou, L.; Liu, D.; Lai, Z.; Zhang, X. Outburst Floods in China: A Review. Earth-Sci. Rev. 2019, 197, 102895. [Google Scholar] [CrossRef]
- Ru, N.H.; Niu, Y.G. Embankment Dam Incidents and Safety of Large Dams; China Waterpower: Beijing, China, 2001. (In Chinese) [Google Scholar]
- Dam Safety Management Center of the Ministry of Water Resources, People’s Republic of China. Dam Breach Register Book of the National Reservoirs; Dam Safety Management Center of the Ministry of Water Resources, People’s Republic of China: Nanjing, China, 2021. (In Chinese)
- Zhang, L.; Peng, M.; Chang, D.; Xu, Y. Dam Failure Mechanisms and Risk Assessment; John Wiley & Sons: Hoboken, NJ, USA, 2017; ISBN 9781118558546. [Google Scholar]
- Zhang, J.; Li, Y.; Xuan, G.; Wang, X.; Li, J. Overtopping Breaching of Cohesive Homogeneous Earth Dam with Different Cohesive Strength. Sci. China Ser. E Technol. Sci. 2009, 52, 3024–3029. [Google Scholar] [CrossRef]
- Li, Y.; Wang, X.; Xuan, G.; Li, J.; Wang, X. Similarity criteria of homogeneous embankment failure due to overtopping flow. Chin. J. Hydrodyn. 2010, 25, 270–276. (In Chinese) [Google Scholar]
- Coleman, S.E.; Andrews, D.P.; Webby, M.G. Overtopping Breaching of Noncohesive Homogeneous Embankments. J. Hydraul. Eng. 2002, 128, 829–838. [Google Scholar] [CrossRef]
- Dupont, E.; Dewals, B.; Archambeau, P.; Sébastien, E.; Pirotton, M. Experimental and Numerical Study of the Breaching of an Embankment Dam. In Proceedings of the 32nd IAHR Biennial Congress, Madrid, Spain, 1–6 July 2007; Volume 1, pp. 339–348. [Google Scholar]
- Morris, M.W.; Hassan, M.; Vaskinn, K.A. Breach Formation Technical Report (WP2), IMPACT Project Reports, European Commission, FP5 Research Pragramme. Contract No. EVG1-CT-2001-00037, Oxford, UK. 2005.
- Morris, M.W.; Hassan, M.; Kortenhaus, A.; Geisenhainer, G.; Visser, P.J.; Zhu, Y. Modelling Breach Initiation and Growth; CRC Press eBooks: Boca Raton, FL, USA, 2008; pp. 581–591. [Google Scholar]
- Hanson, G.J.; Cook, K.R.; Hunt, S.L. Physical Modeling of Overtopping Erosion and Breach Formation of Cohesive Embankments. Trans. ASAE 2005, 48, 1783–1794. [Google Scholar] [CrossRef]
- Hanson, G.J.; Temple, D.M.; Hunt, S.L.; Tejral, R.D. Development and Characterization of Soil Material Parameters for Embankment Breach. Appl. Eng. Agric. 2011, 27, 587–595. [Google Scholar] [CrossRef]
- Morris, M.W.; Galland, J.C. CADAM: Dambreak Modelling Guidelines and Best Practice; HR Wallingford Ltd.: Munich, Germany, 1998. [Google Scholar]
- Morris, M.W.; Hassan, M. IMPACT, Investigation of Extreme Flood Processes and Uncertainty, Final Technical Rep. IMPACT, EVG1-CT-2001-00037. 2005.
- Morris, M.W.; Hassan, M.; Vaskinn, K.A. Conclusions and Recommendations from the IMPACT Project WP2: Breach Formation, HR Wallingford, UK, 2005, 1–21.
- Dhiman, S.; Charan Patra, K. Experimental Study of Embankment Breach Based on Its Construction Parameters. Nat. Hazards Earth Syst. Sci. Discuss. 2017, 1–26. [Google Scholar] [CrossRef]
- Amaral, S.; Caldeira, L.; Viseu, T.; Ferreira, R.M.L. Designing Experiments to Study Dam Breach Hydraulic Phenomena. J. Hydraul. Eng. 2020, 146, 04020014. [Google Scholar] [CrossRef]
- Verma, D.; Berwal, P.; Gupta, N.; Alfaisal, F.M.; Khan, M.A.; Alam, S.; Qadri, J. Experimental Investigation of Breach Mechanism for Overtopped Cohesive and Non-Cohesive Embankments. Water 2023, 15, 3030. [Google Scholar] [CrossRef]
- Dhiman, S.; Patra, K.C. Experimental Study of Embankment Breach Based on Its Soil Properties. ISH J. Hydraul. Eng. 2018, 26, 247–257. [Google Scholar] [CrossRef]
- Kouzehgar, K.; Hassanzadeh, Y.; Eslamian, S.; Yousefzadeh Fard, M.; Babaeian Amini, A. Physical Modeling into Outflow Hydrographs and Breach Characteristics of Homogeneous Earthfill Dams Failure due to Overtopping. J. Mt. Sci. 2021, 18, 462–481. [Google Scholar] [CrossRef]
- Pickert, G.; Weitbrecht, V.; Bieberstein, A. Breaching of Overtopped River Embankments Controlled by Apparent Cohesion. J. Hydraul. Res. 2011, 49, 143–156. [Google Scholar] [CrossRef]
- Bereta, G.; Hui, P.; Kai, H.; Guang, L.; Kefan, P.; Zhao, Y.Z. Experimental Study of Cohesive Embankment Dam Breach Formation due to Overtopping. Period. Polytech. Civ. Eng. 2020, 64, 198–211. [Google Scholar] [CrossRef]
- SL274-2020; Design Code for Rolled Earth-Rock Fill Dams. Ministry of Water Resources of the People’s Republic of China: Beijing, China, 2020.
- Elalfy, E.; Tabrizi, A.A.; Chaudhry, M.H. Numerical and Experimental Modeling of Levee Breach Including Slumping Failure of Breach Sides. J. Hydraul. Eng. 2018, 144, 04017066. [Google Scholar] [CrossRef]
- Li, Y.; Qiu, W.; Chen, Z.; Wen, L.; Lin, W. Experimental Study on the Process of Overtopping Breach of Concrete-Faced Sand-Gravel Dam. Eur. J. Environ. Civ. Eng. 2021, 26, 6334–6353. [Google Scholar] [CrossRef]
- Rifai, I.; Erpicum, S.; Archambeau, P.; Violeau, D.; Pirotton, M.; El Kadi Abderrezzak, K.; Dewals, B. Overtopping Induced Failure of Noncohesive, Homogeneous Fluvial Dikes. Water Resour. Res. 2017, 53, 3373–3386. [Google Scholar] [CrossRef]
- Zhong, Q.; Wang, L.; Chen, S.; Chen, Z.; Shan, Y.; Zhang, Q.; Ren, Q.; Mei, S.; Jiang, J.; Hu, L.; et al. Breaches of Embankment and Landslide Dams—State of the Art Review. Earth-Sci. Rev. 2021, 216, 103597. [Google Scholar] [CrossRef]
- Schmitz, V.; Erpicum, S.; El kadi Abderrezzak, K.; Rifai, I.; Archambeau, P.; Pirotton, M.; Dewals, B. Overtopping-Induced Failure of Non–Cohesive Homogeneous Fluvial Dikes: Effect of Dike Geometry on Breach Discharge and Widening. Water Resour. Res. 2021, 57, e2021WR029660. [Google Scholar] [CrossRef]


| Soil Classification | Fine-Grained Soil Content (%) | Median Size (mm) | Maximum Dry Density (g/cm3) | Minimum Dry Density (g/cm3) | Hydraulic Conductivity (cm/s) | Water Content (%) | Cohesion (kPa) | Internal Friction Angle (°) |
|---|---|---|---|---|---|---|---|---|
| SF (fine-grained sand) | 10.4 | 0.176 | 1.59 | 1.21 | 6.63 × 10⁻⁴ | 15 | 14 | 34.1 |
| Number | Measurement Items | Sensors | Model | Measurement Parameters | Measuring Accuracy | Measuring Range |
|---|---|---|---|---|---|---|
| 1 | Environmental variables | Hydrological gauge | SCYG319 | Upstream and downstream water level | ±1.02 cm | 0~102 cm |
| 2 | Digital thermo-hygrometer | 608-H1 | Temperature and humidity | ±0.5 °C ±3%RH | 0~+50 °C 10~95%RH | |
| 3 | Deformation | Level instrument | AT-B2 | Surface vertical displacements | ±15′ | 0.7 mm/km |
| 4 | Inclinometer | CYY-QJ | Inclination angle | ±0.2° | ±45° |
| Stage | Filling Stage | First Impoundment Stage | First Water Level Stabilization Stage | Second Impoundment Stage | Second Water Level Stabilization Stage | Breach Stage | ||||||
|---|---|---|---|---|---|---|---|---|---|---|---|---|
| Starting Time | Ending Time | Starting Time | Ending Time | Starting Time | Ending Time | Starting Time | Ending Time | Starting Time | Ending Time | Starting Time | Ending Time | |
| Time | 6-28 9:00 | 6-28 18:00 | 7-7 18:20 | 7-7 19:23 | 7-7 19:23 | 7-11 21:02 | 7-11 21:02 | 7-11 21:30 | 7-11 21:30 | 7-15 18:20 | 7-15 18:20 | 7-15 19:18 |
| Reservoir level (cm) | / | / | 0 | 26 | 26 | 26 | 26 | 42 | 42 | 42 | 42 | 37 |
| Duration | 9 h 00 min | 1 h 03 min | 97 h 39 min | 0 h 28 min | 92 h 50 min | 0 h 58 min | ||||||
| Measuring Points | First Impoundment Stage | First Water Level Stage | Second Impoundment Stage | Second Water Level Stage |
|---|---|---|---|---|
| D1-1 | 3.4 | 4.5 | 5.5 | 5.3 |
| D1-2 | 3 | 4.2 | 5.6 | 5.1 |
| D1-3 | 3 | 4.2 | 5.2 | 5 |
| D2-1 | 3 | 4.4 | 5.4 | 4.9 |
| D2-2 | 3 | 4.5 | 5.5 | 5 |
| D2-3 | 2.9 | 3.9 | 4.9 | 11 |
| Measuring Points | Time of Sudden Change (hh:mm) | Before the Sudden Change (mm) | After the Sudden Change (mm) | Amount of Sudden Change (mm) |
|---|---|---|---|---|
| Q1-1 | 19:12 | 2.29 | 25.97 | 23.68 |
| Q1-2 | 19:12 | −0.35 | 74.85 | 75.20 |
| Q1-3 | 19:12 | −0.07 | 17.54 | 17.61 |
| Q1-4 | No sudden change | |||
| Q1-5 | 19:13 | 5.67 | 46.86 | 41.19 |
| Q1-6 | 19:12 | 0.21 | 24.84 | 24.63 |
| Q1-7 | 19:12 | −3.58 | −51.21 | −47.63 |
| Q2-1 | 19:13 | 2.41 | 9.53 | 7.12 |
| Q2-2 | 19:14 | 0.19 | 66.45 | 66.26 |
| Measuring Points | Time of Sudden Change (hh:mm) | Before the Sudden Change (mm) | After the Sudden Change (mm) | Amount of Sudden Change (mm) |
|---|---|---|---|---|
| Q1-1 | 19:16 | −1.12 | 23.77 | 24.89 |
| Q1-2 | 19:12 | −0.26 | 14.72 | 14.98 |
| Q1-3 | 19:12 | −0.10 | 25.45 | 25.55 |
| Q1-4 | No sudden change | |||
| Q1-5 | 19:12 | 0.15 | −34.98 | −35.13 |
| Q1-6 | 19:12 | 0.05 | 5.79 | 5.74 |
| Q1-7 | 19:12 | 0.51 | 10.07 | 9.56 |
| Q2-1 | 19:12 | −1.15 | −12.52 | −11.37 |
| Q2-2 | 19:14 | 0.31 | 20.92 | 20.61 |
Disclaimer/Publisher’s Note: The statements, opinions and data contained in all publications are solely those of the individual author(s) and contributor(s) and not of MDPI and/or the editor(s). MDPI and/or the editor(s) disclaim responsibility for any injury to people or property resulting from any ideas, methods, instructions or products referred to in the content. |
© 2023 by the authors. Licensee MDPI, Basel, Switzerland. This article is an open access article distributed under the terms and conditions of the Creative Commons Attribution (CC BY) license (https://creativecommons.org/licenses/by/4.0/).
Share and Cite
Lu, Q.; Gu, Y.; Wang, S.; Liu, X.; Wang, H. Deformation Field Analysis of Small-Scale Model Experiment on Overtopping Failure of Embankment Dams. Water 2023, 15, 4309. https://doi.org/10.3390/w15244309
Lu Q, Gu Y, Wang S, Liu X, Wang H. Deformation Field Analysis of Small-Scale Model Experiment on Overtopping Failure of Embankment Dams. Water. 2023; 15(24):4309. https://doi.org/10.3390/w15244309
Chicago/Turabian StyleLu, Qiang, Yanchang Gu, Shijun Wang, Xiandong Liu, and Hong Wang. 2023. "Deformation Field Analysis of Small-Scale Model Experiment on Overtopping Failure of Embankment Dams" Water 15, no. 24: 4309. https://doi.org/10.3390/w15244309
APA StyleLu, Q., Gu, Y., Wang, S., Liu, X., & Wang, H. (2023). Deformation Field Analysis of Small-Scale Model Experiment on Overtopping Failure of Embankment Dams. Water, 15(24), 4309. https://doi.org/10.3390/w15244309