Article

Leakage Risk Assessment of Urban Water Distribution Network Based on Unascertained Measure Theory and Game Theory Weighting Method

1
College of Environmental Science and Engineering, Tongji University, Shanghai 200092, China
2
Wuxi Water Group Co., Ltd., Wuxi 214031, China
*
Author to whom correspondence should be addressed.
Water 2023, 15(24), 4294; https://doi.org/10.3390/w15244294
Submission received: 14 November 2023 / Revised: 8 December 2023 / Accepted: 14 December 2023 / Published: 16 December 2023
(This article belongs to the Special Issue Diagnosis and Risk Assessment of Water Engineering Systems)

Abstract

:
Assessing the risk of water leakage within urban water distribution networks (UWDN) is crucial prior to implementing any control measures. Conducting a risk assessment facilitates the development of effective water leakage management plans. By comprehensively analyzing the probability and loss factors that contribute to the risk of leakage in UWDN, this paper presents an evaluation index system for pipeline leakage risk. This index system utilized both quantitative and qualitative data on influencing factors derived from an actual pipeline network. In order to determine the precise level of pipeline leakage risk, an index theory-based pipeline leakage risk evaluation model was established. This model consisted of a single-index measure function and a multi-index comprehensive measure vector. The combined weight of evaluation indices through game theory was used to determine the weight of each index, thereby minimizing the negative effects of a single weight determination method. A risk assessment model that evaluated the leakage risk of specific pipelines was constructed based on actual data from the water distribution network in a certain area of China. The analysis showed that the risk of pipeline leakage in this area was mainly classified as a third-level risk, which is consistent with the actual evaluation results obtained from field visits.

1. Introduction

A reliable city water supply is imperative for urban areas, given its direct impact on both social stability and economic growth. Water distribution systems (WDS) form a crucial aspect of urban infrastructure. Currently, water companies are confronted with a significant challenge regarding water leakage in urban water distribution networks (UWDN), largely due to planning and design issues, pipeline materials, and construction quality [1]. The significant leakage rate leads to substantial economic losses and negative social impacts. The Chinese government has issued a decree stipulating that the leak rate must be lowered to less than 9.0% by 2025 [2]. Nonetheless, the average rate as of 2021 was 15.06% [3]. Therefore, it is imperative for the water authorities to expeditiously commence identifying and managing leaks to decrease their frequency and promptly bring the leak rate within the specified tolerance level.
A reliable water supply is vital for any city. Therefore, it is essential to conduct thorough assessments of the risk levels in specific regions to effectively manage pipeline leakage. Based on these evaluations, researchers have implemented statistical methods and data mining techniques to analyze historical records of pipeline damage. Additionally, a range of macroscopic non-mechanical models has been utilized to identify precise patterns of pipeline leaks. For instance, De Silva et al. [4] proposed a pipeline failure probability model that connected the potential distribution of damage levels in individual pipelines with the probability of the entire pipeline. Hassan Al-Barqawi and Tarek Zayed [5] introduced a model that assessed the condition of a water body by integrating the analytic hierarchy process (AHP) and an artificial neural network (ANN). Additionally, Zheng [6] developed a time index model that predicted future pipeline ruptures. Kutyłowska [7] created a model using the K-nearest neighbor algorithm to predict the failure rate of UWDN. Meanwhile, Zhang [8] constructed a model that employed the BP neural network algorithm and random forest algorithm to assess pipeline health. These methodologies have yielded valuable insights into pipeline leakage behavior and are expected to contribute significantly to the understanding and prevention of UWDN leakage.
Current risk assessment models have limitations, as they do not consider the interplay between leakage probability and leakage loss when determining overall leakage risk [9]. Fayaz et al. [10] incorporated only four inputs, namely depth, length, height, and age, in their proposed risk assessment method, which resulted in an incomplete understanding of the associated risks. Furthermore, these models often fail to consider a comprehensive range of evaluation indices, resulting in an incomplete risk assessment. For example, Zhang et al. [11] took soil-related factors into account when selecting evaluation indexes, but they only focused on soil pH as an index. In reality, soil particle properties also have a significant impact on the risk of leakage. Thirdly, numerous existing models tend to disregard the uncertainty intrinsic in accessible information, creating an obstacle in effectively balancing objective and subjective indices during the process of risk assessment evaluation.
To enhance the risk assessment model’s effectiveness, this study examined a specific area situated in the middle and lower Yangtze River of China, which was used as a case study. Its purpose was to address previously unexplored concerns related to assessing leakage risk in UWDN.
(1)
How to incorporate the correlation between leakage probability and leakage loss to provide a more comprehensive understanding of leakage risk?
(2)
How to select a comprehensive range of evaluation indices that cover different forms of leakage threats to guarantee a more all-inclusive risk assessment?
(3)
How to efficiently manage uncertain data? Techniques including using probabilistic approaches or sensitivity analysis may be employed to conduct a more precise assessment.
(4)
How to develop a systematic approach to weigh the subjective and objective indices, taking into consideration their relative importance in overall risk assessment?
This research tackled the mentioned concerns, and its value is emphasized by various essential factors. Firstly, it thoroughly examined the factors that may cause a leak as evaluation indices, covering both the factors affecting the likelihood of leakage and those determining the leakage loss. Secondly, the researchers included the theory of unascertained measures in the risk assessment model to address uncertainties in the data. This is a crucial factor in achieving a more precise evaluation. The researchers employed the game theory combination weighting method to determine the weight of each evaluation index. This method effectively integrates subjective and objective information, capitalizing on the strengths of various weight systems. As a result, the risk assessment model can incorporate diverse perspectives and factors that may influence the assessment, resulting in a more practical and well-rounded model. As the statistical data in this study mainly came from maintenance records related to leakages and the GIS system data in the case area, this research holds both reliability and practical value. Its applicability can be extended beyond the case area, as the research method can serve as theoretical support with the feasibility of full-scale implementation in other regions where data is available. Finally, this study has the potential to provide significant insights and practical solutions for reducing the risk of water leakage within urban water distribution networks (UWDN). The outcomes have the potential to be useful for water companies in making informed decisions and applying efficient strategies to improve the overall effectiveness of UWDNs, ultimately leading to reduced losses.
This paper is structured as follows: Section 2 presents the related literature, while Section 3 elaborates on the proposed unascertained measure theory model. In Section 4, real data from the water supply network in a specific area of the middle and lower reaches of the Yangtze River in China are used to evaluate the leakage risk of the water supply network through the presentation of results and discussion of the case study. Lastly, Section 5 provides a concluding statement.

2. Literature Review

The International Water Association (IWA) has suggested four fundamental strategies for decreasing and managing leakage: active control of leakage, management of pressure control, pipeline and asset management, and maintenance and update, along with prompt, high-quality repair [12]. Actively controlling leakage is crucial for driving down overall levels of leakage and is currently extensively adopted in leak detection. These methods include externally based techniques, such as acoustic emission methods and fiber optic sensing methods, as well as internally based techniques, such as statistical analysis and balancing methods [13].
Destructive testing methods have the potential to cause harm to pipelines, such as the use of closed-circuit television (CCTV) cameras for internal pipe inspection, which must move through the pipe [14]. In contrast, non-destructive testing has limited scalability. For instance, in order to avoid damage to the pipeline, sensors can only be situated at convenient access points to the pipe, such as fire hydrants or valves. The positioning of sensors far away from the sound source may affect the amplitude of the signals [15]. Additionally, expanding the detection range requires substantial investment in new equipment. Furthermore, outdated subterranean systems lead to many spills that can go undetected, with leak detection teams from water companies often only acting after receiving reports from citizens [16]. Statistical prediction methods, specifically the corresponding development of pipeline leakage risk models, provide a versatile solution for most UWDN. These models have become the standard practice in design, operation, risk management, assessment, and maintenance. They enable an evaluation of the overall pipeline network leakage level before initiating detection efforts [17]. When used in conjunction detection, they greatly improve leak detection effectiveness and reduce the associated costs.
Currently, two primary types of pipeline leakage risk models exist: micro and macro. The differentiating factor is whether the model is mechanistic or non-mechanistic.
This literature examines various approaches utilizing micro models and macro models to propose pipeline leakage risk assessment models, aiming to support ongoing research.

2.1. Past Studies on Micro Models

Micro models, based on the underlying damage mechanisms of the pipeline, aim to reveal the physical processes that affect the structural integrity of the pipeline. These models primarily depend on the material properties of the pipeline to calculate the interactions between the internal and external environments and to determine whether the pipeline can develop leaks under specific conditions. This method often requires precise control experiments.
For instance, Rajani B. and Zhan C. [18] researched the impact of frost heaving loads on water pipes during winter, a time known for a high frequency of burst pipes caused by frozen soil loads. Rajani B. et al. [19] proposed a model to analyze the interaction between pipes and soil, describing how the water pipe interface responds to changes in internal pressure and temperature. This model indicated that suboptimal pipes increase the likelihood of water main ruptures. Additionally, Zhao et al. [20] selected radial corrosion rate and corrosion defect depth as the primary parameters for their study and applied an enhanced first-order second-moment method to predict the remaining lifespan of corroded pipelines. Shen [21] conducted a thorough investigation into the interaction between buried pipes and soil, as well as the transverse and longitudinal stress characteristics of pipe culvert structures. Shen’s study analyzed stress patterns in buried pipe culverts under traffic loads using the finite element analysis method. In a related study, Tim A. Jur et al. [22] investigated the corrosion mechanism of graphite in gray cast iron pipes and recommended a method to minimize corrosion potential during the installation of new ductile iron pipelines. These methods involve treating both the outer and inner surfaces of the pipes to prolong their lifespan.
Although micro models offer valuable insights into water pipeline failure origins, their ability to predict failures on vast pipe networks is significantly limited due to several key factors [23]. One such factor is the substantial amount of physical data that micro models require to maintain their modeling and predictive capabilities. Obtaining this data necessitates the use of expensive equipment and staff. Secondly, micro models often struggle to accurately account for the complex interplay of various influencing factors in the analysis. This limitation restricts their practicality in predicting failures within extensive pipe networks.
Physical models are well-suited for detecting issues within a limited scale of pipelines. However, they are not effective in predicting failures in extensive pipeline networks. On the other hand, macro models are equipped to evaluate the likelihood of leakage in extensive pipeline networks.

2.2. Past Studies on Macro Models

Macro models, based on historical damage records of pipelines, are used to analyze the correlation between pipeline damage and factors such as pipeline attributes, environmental conditions, and operational management. Researchers construct multiple models using limited data to capture the patterns of pipeline leakages. The models are expanded to provide a comprehensive analysis of the overall levels of leakage in pipeline networks, serving as a basis for assessing the risks associated with pipeline leakage.
Non-mechanistic models used for this purpose include statistical models, probability models, fuzzy logic models, artificial neural network models, and more. For instance, J. Diaz-Ortiz et al. [24] devised a methodology to calibrate a WDS utilizing genetic algorithms coupled with the finite element method GA-FEMH, with water leaks as the primary element. Shridhar Yamijala et al. [25] conducted a comparative study involving time-linear, time-exponential, and generalized linear models (GLM) to estimate the risk of pipeline rupture in the Texas water distribution system. In a related study, Wang et al. [26] used Bayesian theory to select evaluation indicators, such as pipe age, pipe diameter, internal anti-corrosion measures, and external pipeline conditions. The indicators were used to classify gray cast iron pipes into three grades, enabling the efficient determination of their operational status. Furthermore, Fayaz et al. [10] proposed a cohesive hierarchical fuzzy inference system (CHFIS) model for assessing the risk index of water supply pipelines (WSPLs). Kizilöz [27] created an artificial neural network algorithm to forecast leakage rates in district metered areas (DMAs) by utilizing parameters like average pressure, mean pipe age, and diameter. Wang et al. [28] employed a range of techniques to assess the effects of different elements on leakage. Through the fuzzy analytic hierarchy process, the weight of each factor was determined, and the gray correlation analysis method was employed to calculate its influence on leakage.
Macro models, owing to their efficiency, require fewer resources and are suitable methods for risk assessments in extensive networks. Furthermore, the speedy progress of information technology has enabled water companies to gather substantial maintenance record data on their water pipeline systems, which enables the creation of sophisticated non-mechanistic models.
However, current macro models often have limitations, as they define leakage risk only in terms of probability, while disregarding the potential consequences of leakage or uncertain information during the assessments. Therefore, there are limitations in the assessment of leakage risks using existing models. Statistical and fuzzy logic-based models rely on subjective judgments, while probability based on neural network algorithms encounters difficulties in incorporating subjective factors.
This study proposes a novel approach to address this issue, integrating unascertained measure theory with a combination weighting method to establish a comprehensive model for assessing leakage risks.

3. Research Methodology

3.1. Evaluation Index System of Pipeline Leakage Risk

The assessment area is divided into five levels based on the attributes of pipeline leakage risk, reflecting different degrees of pipeline leakage risk. Water departments can set leak risk assessment standards and formulate hierarchical leakage control strategies based on the varying degrees of leakage risk.
This study divided risk assessment into two primary aspects: the probability of leakage occurrence and the potential loss that may arise. To conduct this assessment, a set of 14 evaluation indexes, such as the diameter and age of pipelines, was selected to quantify the evaluation process.
After determining the risk level and corresponding evaluation indexes for the evaluation space, researchers utilized geographic information data from specific regions of the pipeline network system, along with authentic maintenance records and extensive literature. This data was used to classify the evaluation indexes of the index layer, taking into account the risk levels within the evaluation space. This classification was performed either qualitatively or quantitatively. A comprehensive system for assessing the risk of pipeline leakage is provided in Table 1 and Figure 1. The damage ratio was determined using a quantitative classification method that took into account the maintenance records of the affected area. The damage ratio for each pipeline diameter was calculated by taking the ratio of the number of leakage accidents to the percentage of pipe length. The resulting damage ratio value was then classified into five ranges, ranging from low to high.
When evaluating the diameter index of a specific pipeline, obtaining its corresponding damage ratio value is a straightforward task. This methodology offers a comprehensive and practical way to assess the vulnerability of various pipeline sizes and to develop tailored strategies for efficiently mitigating leakage risks. Implementing this technique leads to a more accurate categorization of risk levels, instead of solely relying on the absolute value of the pipeline diameter for segmentation. The approach integrates the present performance of the pipeline in each region, increasing its suitability across the country and the globe.

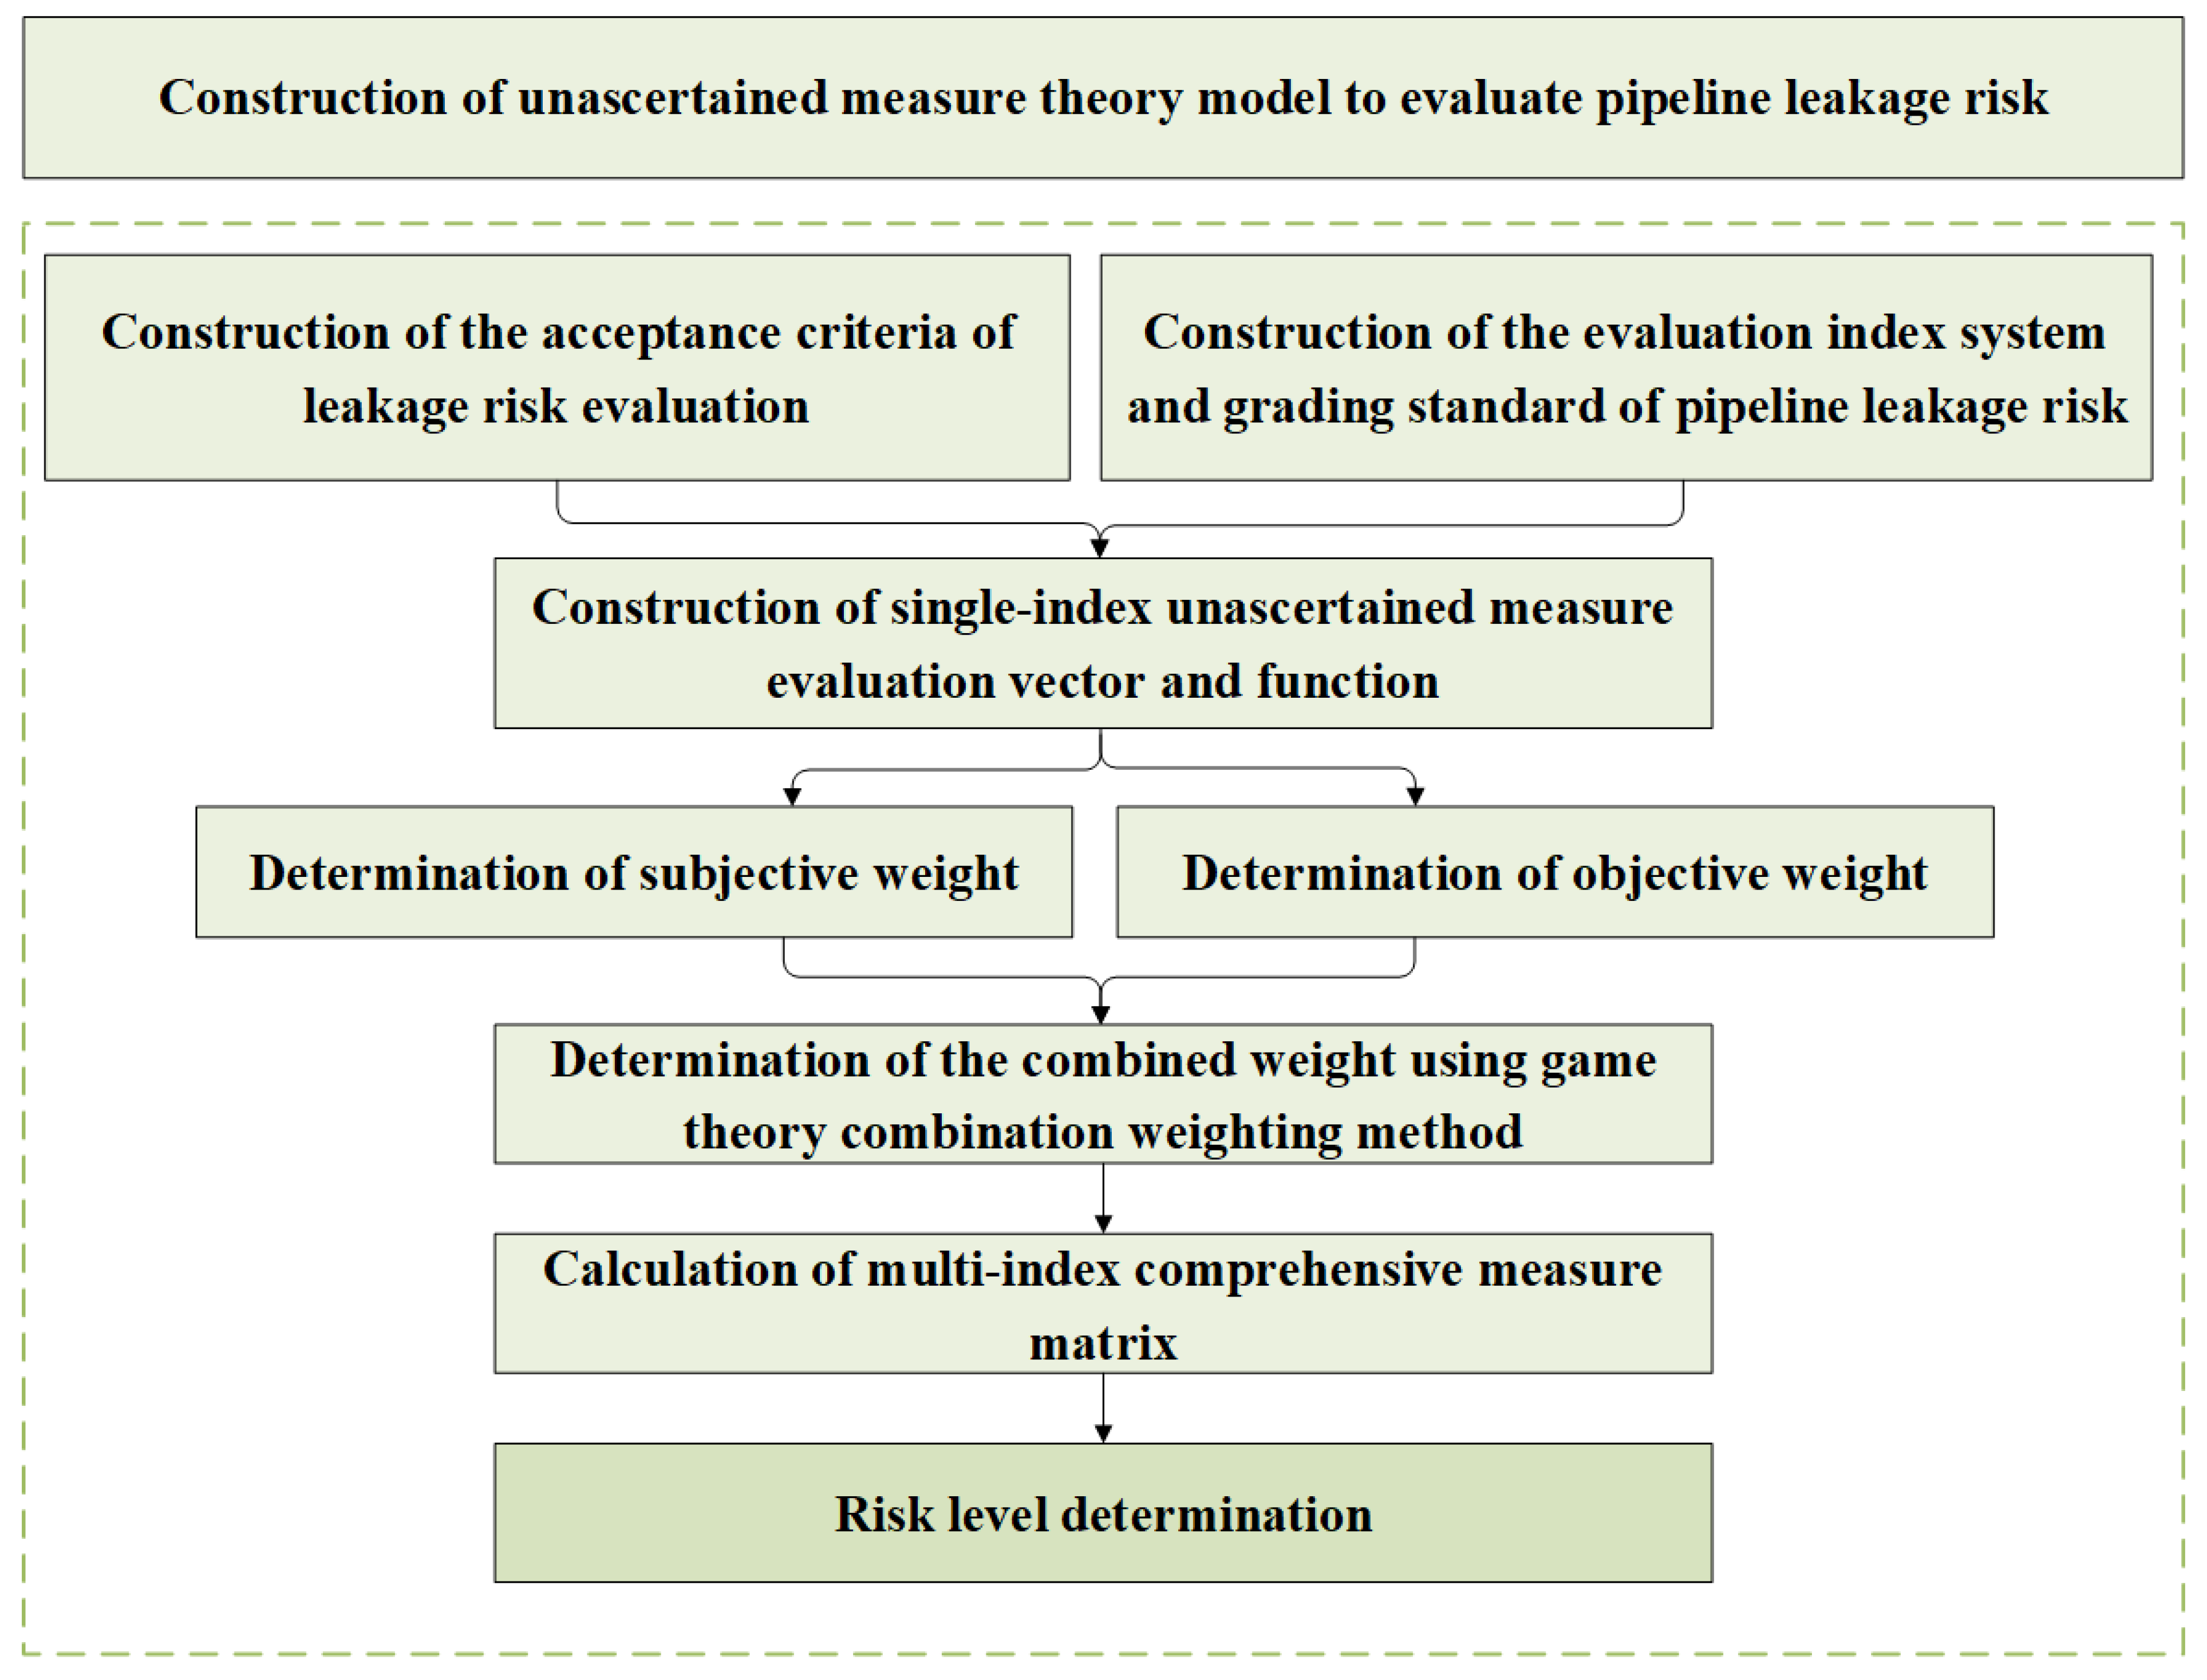
3.2. Pipeline Leakage Risk Assessment Model

In 1990, Wang [38] proposed the concept of ‘unascertained information’. This term described information that was crucial for decision-making but that is currently unknown due to certain limitations. Since being introduced, the unascertained measure model has been widely utilized in risk assessment research across various disciplines. Its advantages lie in its ability to meet additivity and normalization requirements, as well as its suitability for evaluating risk in an ordered environment.
In many cities, the UWDN was primarily established in the past and is not fully integrated into the management system. For instance, the water company may not have knowledge of the exact laying year a pipeline was laid. Nevertheless, the actual laying year of the pipeline remains a definite value, consistent with the notion of ‘unascertained information’. Using the unascertained measure theory to evaluate pipeline leakage risk aligns with theoretical foundations and carries practical significance. The theory enables researchers and water companies to effectively manage uncertainties related to historical data when evaluating pipeline risk. This method ensures a dependable and accurate assessment of leakage risk in UWDN, thereby promoting informed decision-making and targeted risk management strategies.
The process of developing a model for evaluating the risk of pipeline leakage, based on the theory of unascertained measure, is shown in Figure 2. The final risk level of the pipeline can be determined by referring to the evaluation space and the measured values of each index for the respective pipeline.
Steps to establish the risk assessment model are as follows:
Step 1. The construction of a single-index measure evaluation matrix and measure function.
When evaluating a specific pipeline section, a total of ‘n’ pipeline sections need to be evaluated to form a collection P = P 1 ,   P 2 ,   ,   P n . The evaluation index is expressed as R and recorded as R = R 1 ,   R 2 ,   ,   R m .
The evaluation space level is set as C = C 1 ,   C 2 ,   ,   C s , with the order of C 1 < C 2 < < C S . In this study, the evaluation space was orderly divided into five levels according to the characteristics of pipeline leakage risk.
If the measurement value of the ‘i’-th evaluation object P i about the ‘j’-th evaluation index is recorded as r i j , then μ i j k = μ r i j C k will represent the degree of the measured values r i j belonging to the ‘k’-th risk level C k ; if μ satisfies Formula (1), it is called the unascertained measure.
0 μ r i j C k 1 μ r i j l k C l = l = 1 k μ r i j C l μ r i j U = 1
In this formula, i = 1 ,   2 ,   ,   n ;   j = 1 ,   2 ,   ,   m .
A single index measure function was established for each evaluation index, utilizing the unascertained measure definition and the evaluation index system. The commonly used linear distribution unascertained measure function was applied in this study, expressed as Formula (2). By inputting the measured values r i j of the evaluation index into their respective measure functions, we yielded unascertained measure values for each index, corresponding to different evaluation levels. These values are represented as s-dimensional vectors μ i j = μ i j 1 ,   μ i j 2 ,   ,   μ i j s . By combining ‘m’ s-dimensional vectors, the single-index unascertained measure evaluation matrix for the specific pipe section could be constructed.
μ i ( x ) = x a i + 1 a i + a i + 1 a i + 1 a i a i < x a i + 1 0 x > a i + 1 μ i + 1 ( x ) = 0 x a i x a i + 1 a i a i a i + 1 a i a i < x a i + 1
In this formula, ‘x’ represents the measured value of the evaluation index, and μ i ( x ) and μ i + 1 ( x ) are expressed as the unascertained measure values of the measured value according to the ‘i’-th and ‘i + 1’-th evaluation space. ‘ a i ’ and ‘ a i + 1 ’ represent the ‘x’ value when the measured value of each evaluation space reaches the maximum. In this study, the intermediate value of the range was selected.
Combined with Table 1, obtaining the function diagram for each evaluation index can be accomplished through a single index measure, as shown in Figure 3.
Using the measured values of each evaluation index, the measure vector μ i j = μ i j 1 ,   μ i j 2 ,   ,   μ i j s of the corresponding measure function was calculated. Subsequently, the single-index measure evaluation matrix composed of the measured values μ i j k of each evaluation index can be expressed as follows:
μ i j k m × s = μ i 11 μ i 12 μ i 1 s μ i 21 μ i 22 μ i 2 s μ i m 1 μ i m 2 μ i m s
Step 2. The utilization of the combination weighting method.
Pipeline leakage risk evaluation involves multiple levels and factors. To ensure a thorough and precise evaluation, it is crucial to determine the weight of each evaluation index. In this study, the game theory combination weighting method was utilized to achieve this goal.
The method of combining game theory combination and weightings is a systematic approach that facilitates the assignment of weights for each evaluation index. By analyzing the interrelationships and interconnections among the evaluation factors, this method provides an equitable and objective allocation of weights. The final evaluation vector represents a comprehensive measurement, providing a holistic assessment of the pipeline’s risk.
This study implemented the improved analytical hierarchy process (IAHP), also referred to as the three-scale analytical hierarchy process, to evaluate the subjective weights [39]. This technique simplifies the scoring procedure in comparison to the traditional analytical hierarchy process and therefore increases its applicability.
Additionally, the consistent design of the matrix in the three-scale analytical hierarchy process eliminates the need to conduct a consistency test [40], resulting in a faster and more efficient evaluation process.
This study sets up a total of ‘n’ evaluation indexes, and the subjective weights of each index within the same index layer were determined as W = W 1 , W 2 , W n T .
By utilizing the three-scale analytical hierarchy process, researchers can determine the subjective weights of each evaluation index effectively. This allows for a more objective and systematic approach to assessing the importance of each factor in the risk evaluation, leading to a more reliable and informed decision-making process.
The objective weight determination of this study employed the entropy weight method (EWM), based on the information entropy theory. The EWM is a technique that determines the weight of each evaluation index by utilizing the data’s inherent information. It quantifies the effect of the measured values on risk level identification, reflecting the influence of evaluation index information on the overall evaluation results.
By utilizing the information entropy concept in conjunction with the established single-index unascertained measure evaluation matrix, the entropy value of the ‘i’-th evaluation object P i concerning the ‘j’-th evaluation index R j can be calculated. In other words, for the ‘i’-th evaluation object, if there are total of ‘n’ evaluation indexes, the objective weight determined by the entropy weight method is represented as W i = w i 1 , w i 2 , w i n T .
The implementation of the entropy weight method improves the objectivity and efficiency of determining weight. This method allows for a more precise and reliable allocation of weights by quantifying the information conveyed by each evaluation index, ultimately contributing to a more accurate risk evaluation.
The application of game theory (GT) in this study provides an effective method of weight states. It considers the coordination relationship among different weight judgments, resulting in a more scientific, thorough, and impartial weight determination process [41].
Assuming that ‘P’ methods are used to allocate weights to each index, ‘P’ weight vectors are generated as a result. To express a linear combination of these weight vectors, refer to [42]:
W = q = 1 p α q W ( q ) T
In the formula, α q is the linear combination coefficient, and W is the weight vector set.
Based on the game aggregation model, the goal is to minimize the difference between the final weight W and the weight W ( q ) obtained by the method. Therefore, the most optimal weight α q can be determined by Formula (5):
min q = 1 p α q W ( q ) T W ( o ) 2
According to the fractal dimension of the matrix, the optimal condition for obtaining the first derivative of Formula (6) is as follows:
q = 1 p α q W ( o ) W ( q ) T = W ( o ) W ( o ) T
That is, the corresponding linear equations are as follows:
W ( 1 ) W ( 1 ) T W ( 1 ) W ( 2 ) T W ( 1 ) W ( p ) T W ( 2 ) W ( 1 ) T W ( 2 ) W ( 2 ) T W ( 2 ) W ( p ) T W ( p ) W ( 1 ) T W ( p ) W ( 2 ) T W ( p ) W ( p ) T α 1 α 2 α p = W ( 1 ) W ( 1 ) T W ( 2 ) W ( 2 ) T W ( p ) W ( p ) T
The optimal linear combination coefficient, labeled as α 1 , α 2 , , α p , is obtained through Formula (7). It reflects the most favorable state of combination for each weight utilized in the evaluation process. Subsequently, the resulting coefficient α 1 , α 2 , , α p is then normalized to ensure fairness and consistency. This normalized coefficient is integrated into Formula (4) to generate the final weight vector for each evaluation index, represented as W = W 1 , W 2 , W n T .
By normalizing the coefficients and obtaining the conclusive weight vector, this study ensured an equitable and consistent portrayal of the importance of each evaluation index. This process contributed to a comprehensive and reliable assessment of pipeline leakage risk, enabling more effective and objective decision-making for risk management strategies.
Step 3. The construction of a multi-index comprehensive measure vector.
To assist experts in evaluating index importance and determining their weights, a multi-index comprehensive measure vector was also computed based on the criterion layer. This simplified the evaluation process and provided a concise framework that enabled experts to determine the relative significance of each index and assign suitable weights.
In each layer of criterion, a matrix is created for evaluating a single-index unascertained measure. By calculating weights, a multi-index comprehensive measure vector is derived for that layer. If the first layer has ‘k’ evaluation indexes with corresponding weights of ( ω 11 ω 12 ω 1 k ) , then the comprehensive measure vector for the first layer is expressed as follows:
μ 1 = μ 11 μ 12 μ 1 s = ω 11 ω 12 ω 1 k × μ 111 μ 112 μ 11 s μ 121 μ 122 μ 12 s μ 1 k 1 μ 1 k 2 μ 1 k s
The multi-index measurement matrix of the evaluated object is formed by aggregating the ‘n’ comprehensive indicators collected from the ‘n’ criterion layers, designated as μ i k n × s :
μ i k n × s = μ 1 μ 2 μ n = μ 11 μ 12 μ 1 s μ 21 μ 22 μ 2 s μ n 1 μ n 2 μ n s
By assigning weights to each criterion layer, designated as ( ω 1 ω 2 ω n ) , the final risk evaluation generates a new multi-index comprehensive measurement vector that indicates the overall risk evaluation:
μ = ω × μ ik n × s = μ 1 , μ 2 , μ 3 , μ 4 , μ 5
Step 4. Using confidence recognition criterion to determine risk level.
In a structured assessment environment, implementing the confidence recognition standard proved to be a more efficient method of determining the potential risk of pipeline leaks compared to the maximum membership recognition criterion.
The confidence level is set as λ ( λ 0.5 ). According to the multi-index comprehensive measurement vector, if C 1 < C 2 < < C s and λ satisfies the condition specified in Formula (11), then it can be inferred that the pipeline P i falls into the ‘ k 0 ’-th evaluation category C k 0 .
k 0 = min 1 k μ i λ , k = 1 , 2 , , s
A restrictive relationship exists between confidence and accuracy. Typically, a value of 0.6 or 0.7 is considered suitable. In this study, a confidence level of 0.6 was chosen.
Step 5. Arrangement of evaluation objects:
Simply differentiating risk levels for urban water supply pipelines is inadequate in determining the order of leak detection. However, a comprehensive optimal method has not been proposed. Therefore, categorizing objects for evaluation based on the degree of quality deterioration is necessary [43].
To evaluate space C = C 1 , C 2 , , C s ( C 1 < C 2 < < C S ), F r is defined as the score value of C r , as Formula (12) shows:
d i = r = 1 S F r μ i r , ( i = 1 , 2 , , n )
Among these, the uncertain significance of evaluation object P i is referred to as d i and can be defined as a vector with uncertain significance d = d 1 , d 2 , , d s . Then, evaluation objects can be sorted based on the magnitude of their uncertain significance values within the evaluation space.

4. Case Analysis

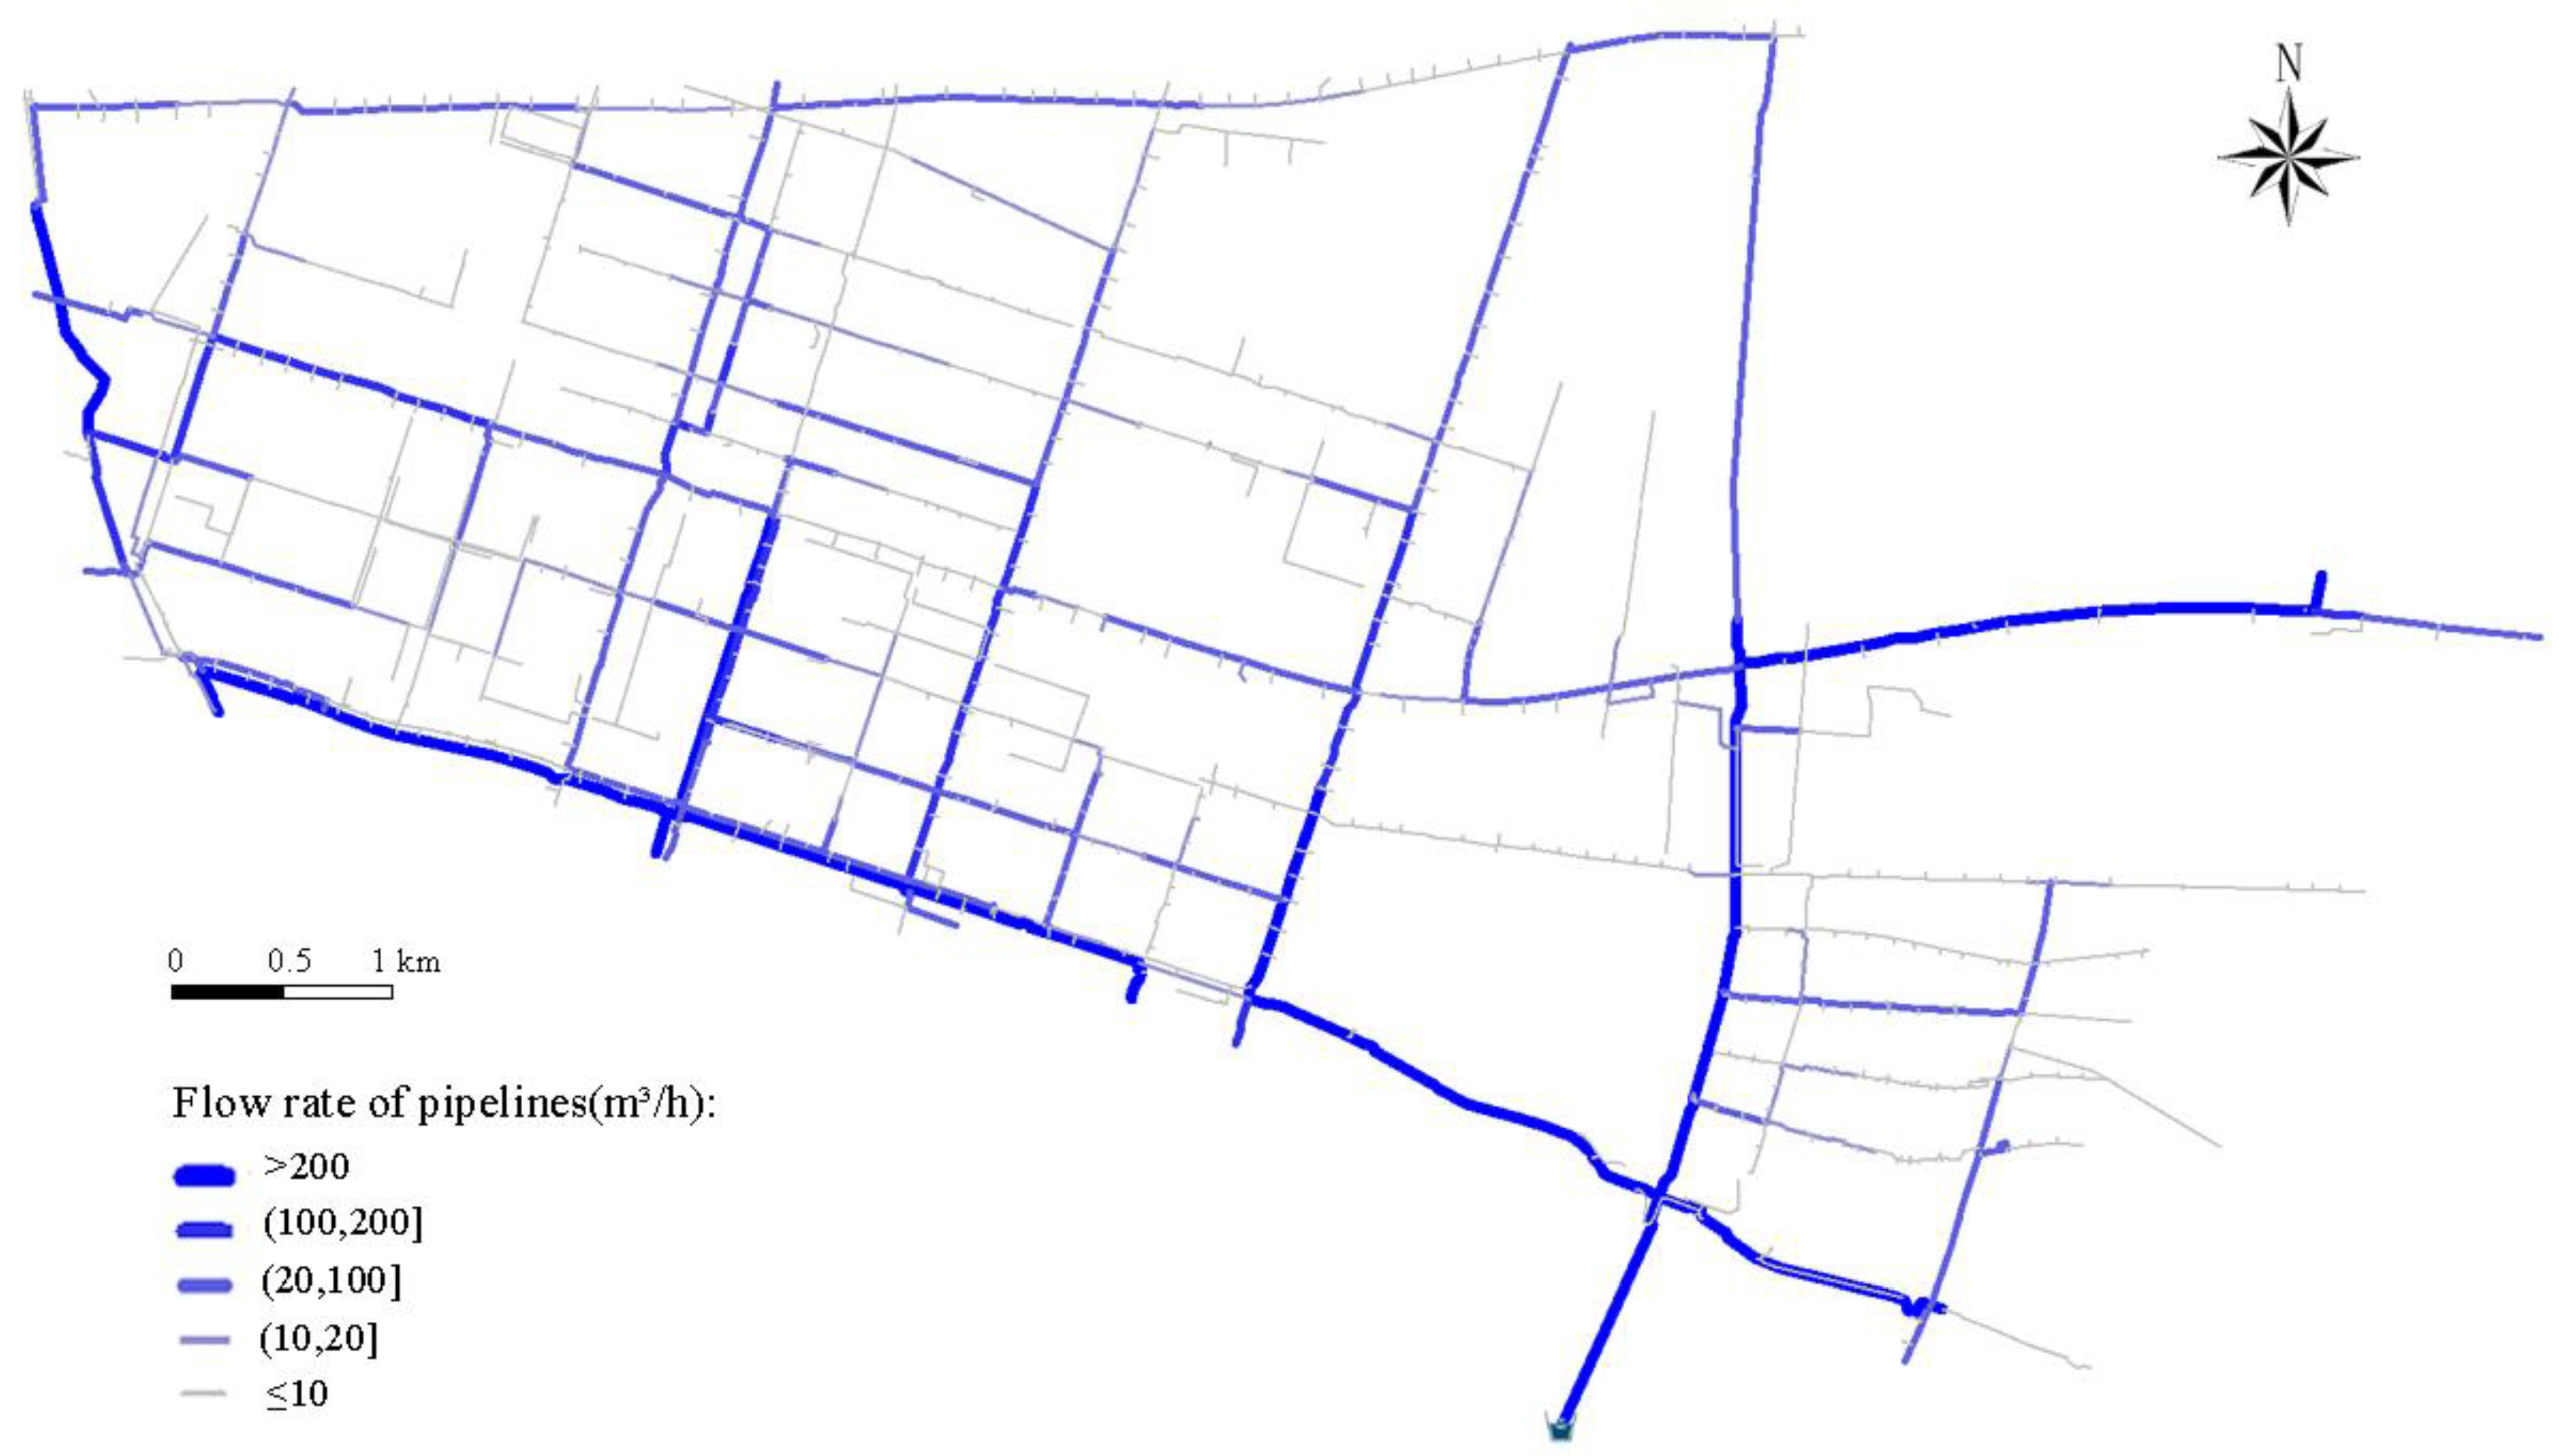
4.1. Project Overview

The M region is located in the city of W, located in the middle and lower sections of the Yangtze River in China. The UWDN in the M region consists of a three-level partition of the UWDN for the entire city. The service area of the UWDN is roughly 33.94 km2, delivering an average daily water supply of around 48,000 m3, with pipelines above DN100 totaling about 212.9 km in length. Figure 4 depicts the hydraulic model topology. The non-revenue ratio in March 2023 was 19.48%. It is imperative to evaluate the hazard of pipeline leaks and perform the targeted detection and maintenance of pipeline sections with a high potential for leakage.
According to maintenance records of pipeline leaks spanning from 2020 to 2022, provided by the M District water company, 370 leaks with a diameter greater than or equal to DN80 were found within the network, unrelated to external damage. These incidents were distributed across 141 distinct pipelines. Using the maintenance data on pipeline leaks and geographic information about the piping network system, a detailed model for evaluating pipeline leak risks within the UWDN was developed. Refer to Table 1 for further details.
Due to the pressing need to control leakage and the extensive data available, this study aimed to evaluate the risk of leaks in 141 pipelines that have previously experienced documented incidents. To illustrate the evaluation process, pipeline ‘P01739’ was chosen as a representative case.

4.2. Selection of Evaluation Indexes

Following a thorough analysis of the factors that impact the risk of pipeline network leakage, including those influencing both the likelihood and severity of leakage, the evaluation factor criterion layer was divided into four distinct categories. Subsequently, each category was further segmented, leading to the classification of the index layer. Fourteen precise evaluation indexes were then selected and specified in Table 1.
By thoughtfully organizing the hierarchical levels and indicators, this study ensured a comprehensive and systematic methodology for assessing the risk of pipeline leakage. This structured approach facilitated an in-depth analysis of multiple factors that contribute to the risk and aided in developing a more effective and targeted risk management strategy.

4.3. Application of Pipeline Leakage Risk Assessment Model

(1)
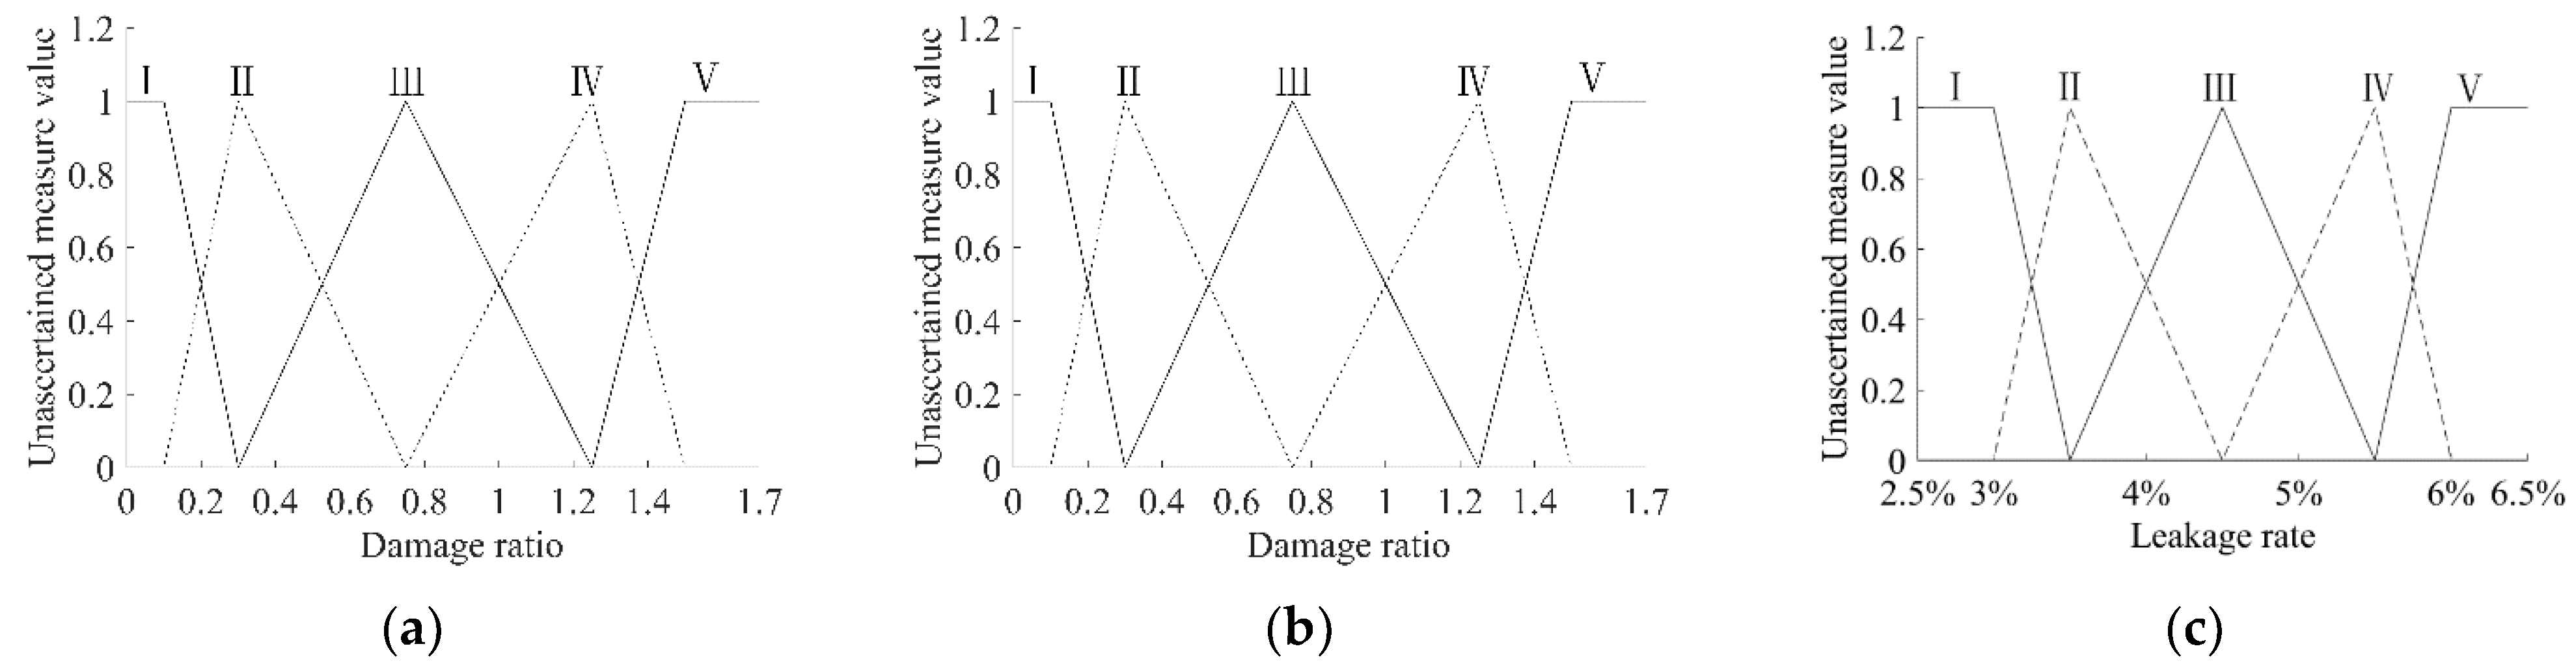
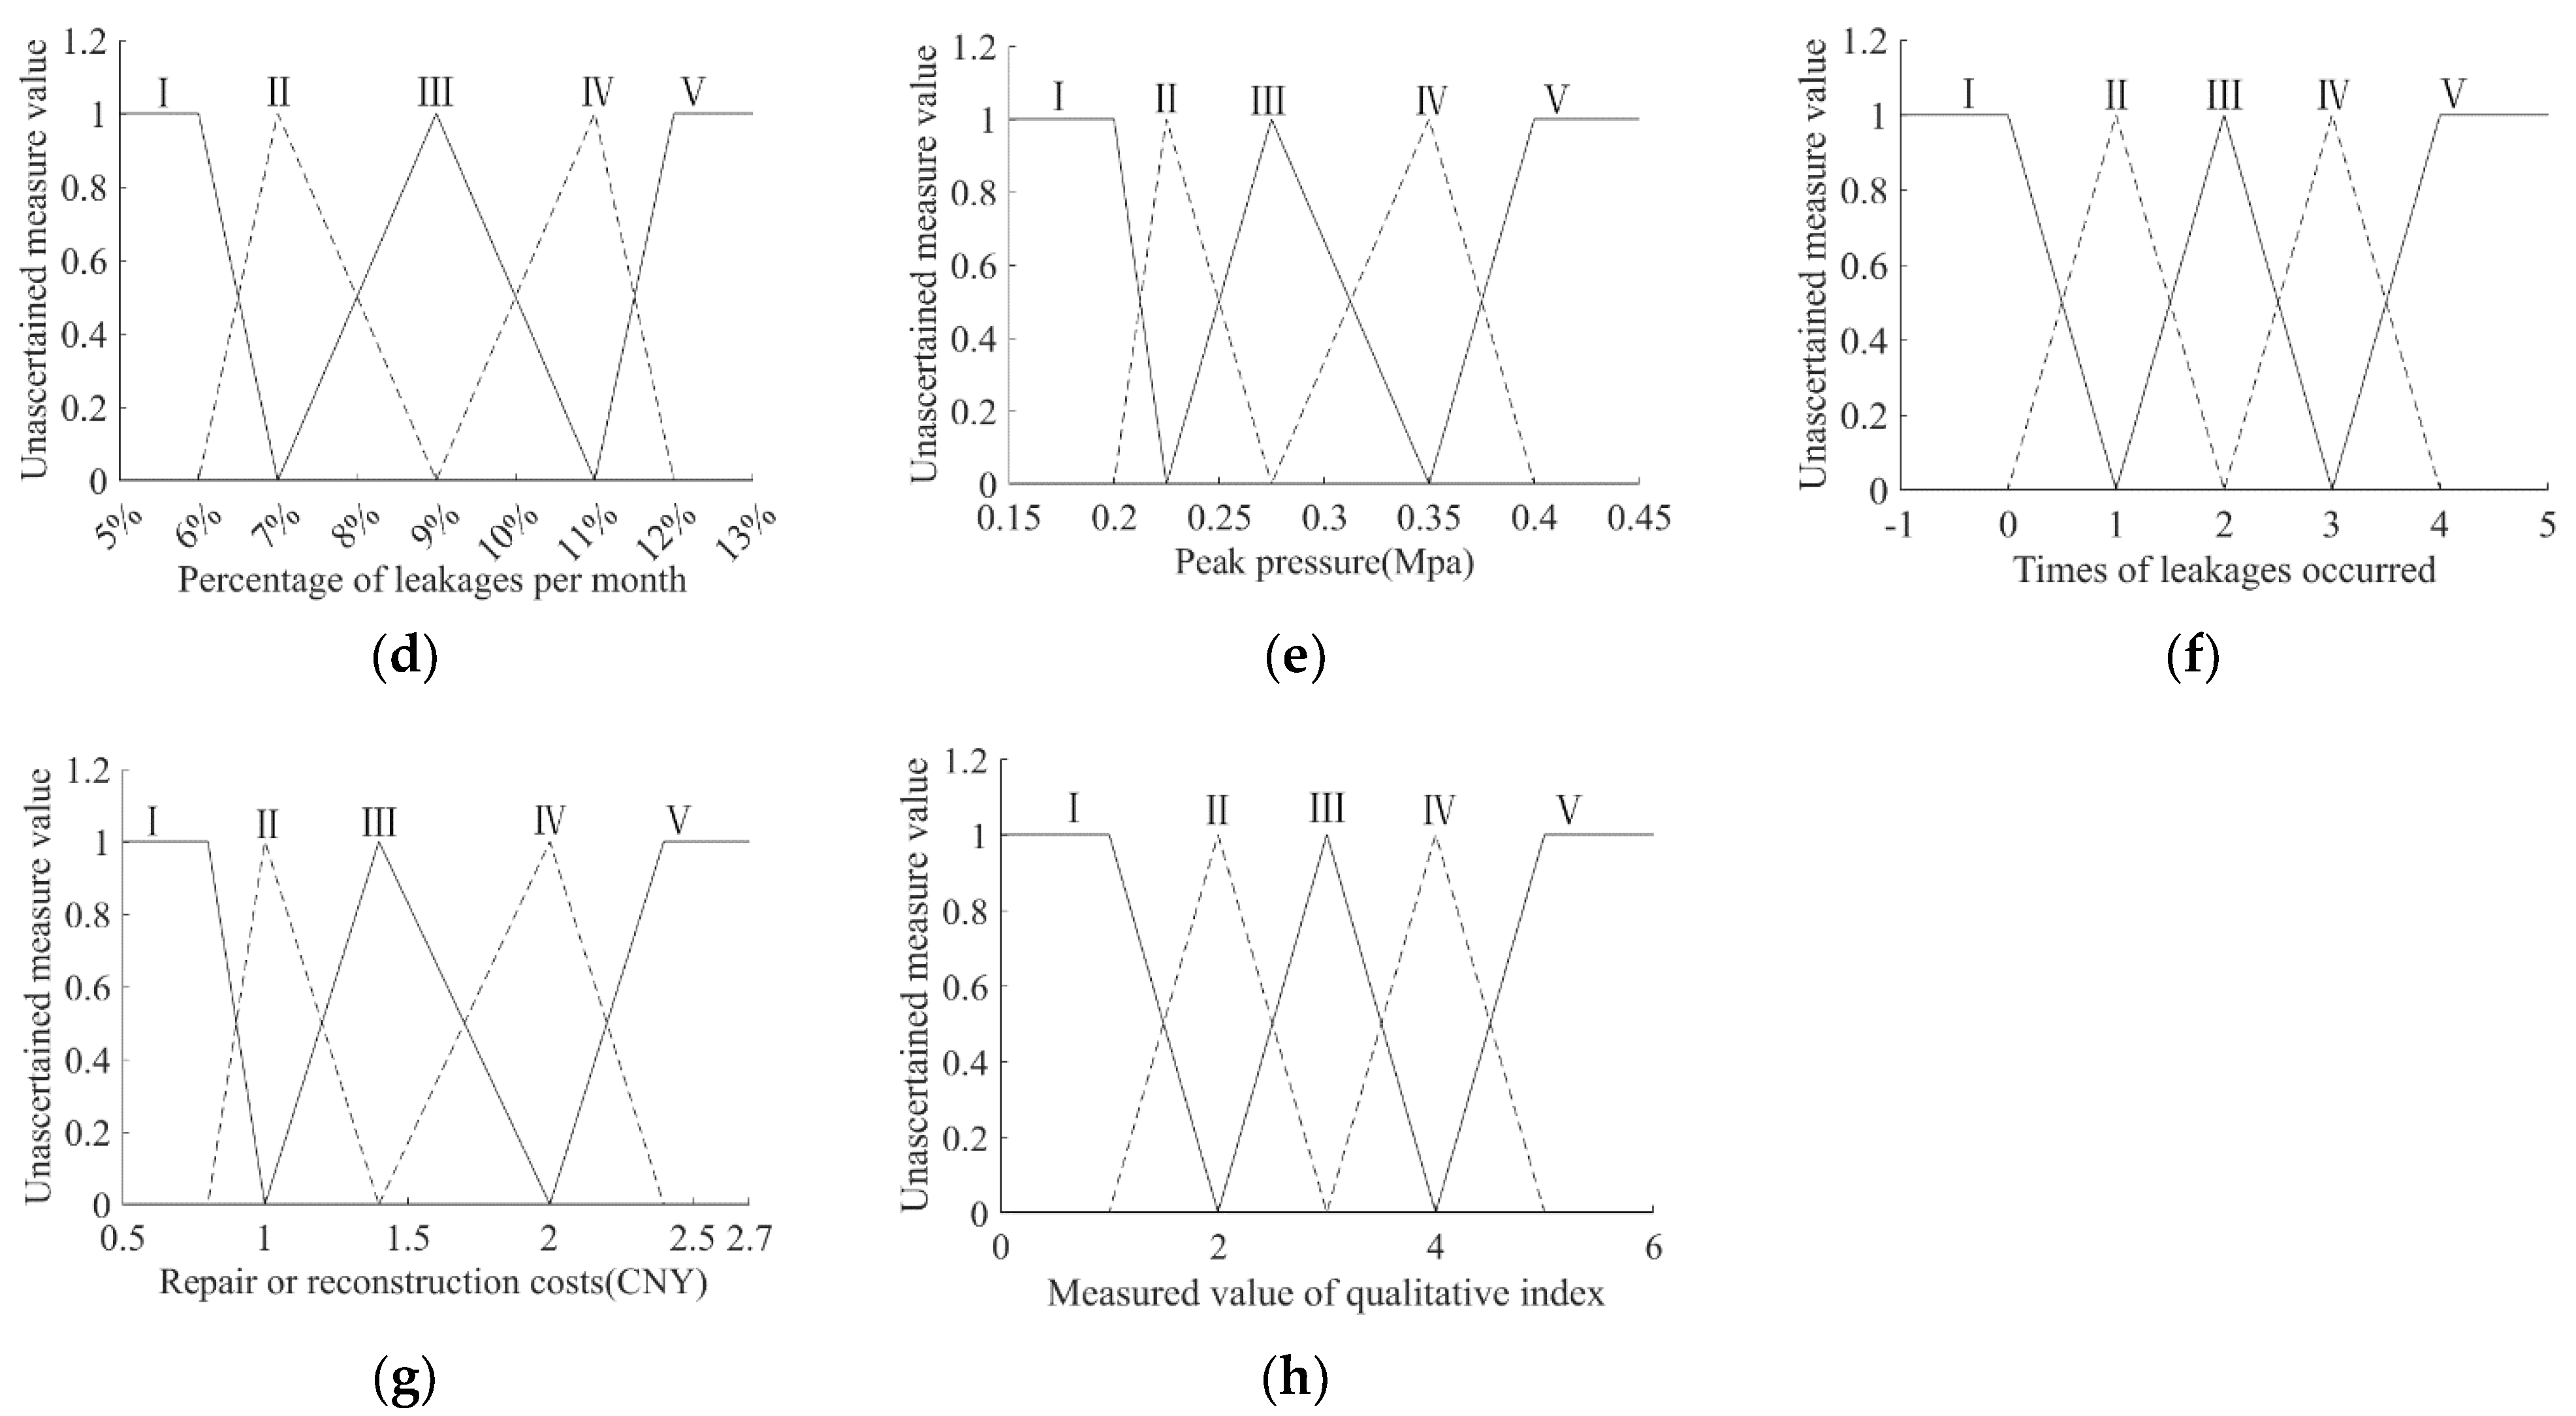
Construction of single-index measurement function
The evaluation index system of pipeline leakage risk can create a distinct index measurement function for each pipeline section that is customized to its unique characteristics. For instance, the pipeline ‘P01739’ consists of ductile iron pipe material, placing the qualitative index for pipe material (R11) in the first level, with an index value of ‘1’. Moreover, the pipeline has a diameter of DN200. Statistical data from leak maintenance records show that the damage ratio of a DN200 pipe diameter is 0.72, resulting in the R12 pipe diameter index being set at ‘0.72’. Table 2 and Table 3 display pertinent details for the ‘P01739’ pipe segment, including index values.
This comprehensive assessment of the potential for leakage took into account each segment of the pipeline, along with the relevant index values, and considered the distinct features of the pipeline components.
The function for each index’s single index measure is shown in Figure 3. Its respective function calculated the corresponding measure vector by using the values from each evaluation index. This produced a single-index unascertained measure evaluation matrix for each criterion layer of the ‘P01739’ pipe section.
This methodical approach to calculating the measurement matrix for each criterion layer ensured a comprehensive, single-index unascertained measure evaluation matrix of the ‘P01739’ pipe section. It guaranteed the inclusion of all relevant factors for obtaining a precise and nuanced evaluation.
The first layer, pipeline intrinsic factors (R1):
μ i j k 5 × 5 = 1.0000 0 0 0 0 0 0.0667 0.9333 0 0 0 0 0 0 1.0000 0 0 1.0000 0 0 0 1.0000 0 0 0
The second layer, pipeline external environmental factors (R2):
μ i j k 3 × 5 = 1.0000 0 0 0 0 0 0 1.0000 0 0 0 0 0 0 1.0000
The third layer, operational management factors (R3):
μ i j k 3 × 5 = 0 0 0 . 9907 0 . 0093 0 0 1.0000 0 0 0 0 1 . 0000 0 0 0
The fourth layer, leakage loss factors (R4):
μ i j k 3 × 5 = 0 0.0394 0.9606 0 0 0 0 1.0000 0 0 0 1.0000 0 0 0
(2)
Weight calculation using the combination weighting method
Professionals from diverse backgrounds, such as college educators, engineers, and experts from different organizations and institutions, were asked to evaluate the impact of each evaluation index on pipeline leakage risk by using a scoring format questionnaire. The indexes were independently scored by the experts within each criterion layer, minimizing any possible interference that might arise due to different index types.
Upon the expert evaluations, the weights of the expert scores were determined through the three-scale analytical hierarchy process. These individual weights were then averaged to ascertain the objective weight for each index.
This approach enabled objective expert insights from various fields to contribute to the evaluation process. By using the analytical hierarchy process with three scales, the weight calculation process was enhanced, leading to a more precise evaluation of the importance of each index.
Based on the single-index unascertained measure evaluation matrix for each criterion layer of the ‘P01739’ pipe section, and according to the weighting principle of the entropy weight method, the objective weight for each index can be calculated.
By utilizing both the subjective weight value and the objective weight value for the ‘P01739’ pipe section, the combined weight for each index can be determined by the game theory combination weighting method according to the equations shown in Formulas (4)–(7). Detailed information such as subjective weight, objective weight, and combined weight are shown in Table 4 and Figure 5.
① Combined weight in each layer:
The first layer, pipeline intrinsic factors (R1):
W 1 = 0.2258 0.0579 0.2715 0.3232 0.1216 T
The second layer, pipeline external environmental factors (R2):
W 2 = 0.3186 0.4044 0.2770 T
The third layer, operational management factors (R3):
W 3 = 0.2105 0.2884 0.5012 T
The fourth layer, leakage loss factors (R4):
W 4 = 0.4003 0.2435 0.3562 T
② Combined weight of the criterion layer:
W 5 = 0.2503 0.1556 0.3744 0.2197 T
(3)
Multi-index comprehensive measure vector and risk level determination
Based on the single-index unascertained measure evaluation matrix of the ‘P01739’ pipe section and the corresponding combined weight assigned to each index, the complete multi-index uncertain measure matrix μ i k 4 × 5 formed by combining four single-layer multi-index comprehensive measure vectors can be calculated using Formulas (8) and (9).
μ i k 4 × 5 = μ 1 μ 2 μ 3 μ 4 = 0.2258 0.1254 0.3773 0 0.2715 0.3186 0 0.4044 0 0.2770 0 0.7895 0.2085 0.0020 0 0 0.3720 0.6280 0 0
When the weight of the criterion layer was combined as W 5 = 0.2503 0.1556 0.3744 0.2197 T , the final risk evaluation produced a comprehensive multi-index measurement vector:
μ = ω × μ ik 4 × 5 = 0.1061 , 0.4087 , 0.3734 , 0.0007 , 0.1111
Taking the confidence level as λ = 0.6 , according to Formula (11), 0.1061 + 0.4087 + 0.3734 = 0 . 8882 > 0.6 , it could be determined that the risk level of the ‘P01739’ pipe section is third-level risk.

4.4. Arrangement of Evaluation Objects

The risk of the remaining pipe sections was evaluated using the same method, resulting in the evaluation of 141 sections. As is shown in Figure 6, out of the total, 84 sections of pipe were classified as having a third-level risk, while 57 sections of pipe were identified as having second-level risk.
To enhance the precision of evaluating the risk of pipeline leakage across identical assessment tiers, the uncertain significance value of each pipe section was computed. For the 84 pipelines categorized under the third-level risk, the uncertain significance vectors, as d = 1 , 2 , , 5 allocated across I to V risk levels, were cumulatively determined using Formula (12). This process led to the generation of ranked outcomes for the uncertain significance of individual pipeline sections. This generated a ranked list of undetermined measurement values for each pipeline section, which is presented in Table 5, exhibiting the top 20 outcomes. The water company can leverage these findings to formulate a better-informed and rational approach for leak management.

4.5. Discussion

Analyzing the weight data shown in Table 4 and Figure 5 revealed that the ‘P01739’ pipeline section poses a risk of leaks owing to issues of pipeline corrosion condition, soil conditions, adherence to construction dats, and costs associated with maintenance or reconstruction. Factors related to operational management have a greater bearing on the overall level of risk.
Upon calculating the risk levels for the 141 pipelines under evaluation, it was evident that the majority of them fall within the third-level and second-level risk range (Figure 6), implying a moderate level of risk. This emphasizes the necessity for the water company to prioritize monitoring, inspection, and maintenance activities to prevent leakage. Any leaks detected should be addressed using systematic and scheduled procedures.
Referring to Table 5 and Figure 7 enables the water company to ascertain the risk ranking of pipelines within the third-level risk category. By doing so, leak checks and detection efforts are given priority, with a focus on higher-risk pipelines before addressing lower-ranked ones. This strategic approach reduces the overall likelihood of pipeline leakage throughout the region.
The outcomes of this case study were promptly communicated to the water company in the respective area, prompting immediate action by relative departments. Leak detection techniques were implemented on pipelines distinguished as higher risks, utilizing noise detectors and additional equipment to confirm the existence of leaks. This proactive method led to the prosperous identification of various leaks. Concurrently, the analysis pinpointed the ‘Top20’ pipelines at the community entrance with an increased risk of leakage. An additional study by management meters of the communities indicated a higher minimum flow at night. The correlation between these discoveries implies that the water company should investigate the potential for hidden leaks within the aforementioned communities.
In water-related engineering, there is significant focus on risk assessment studies pertaining to sizeable water diversion projects [45] and water resource management [46]. Nevertheless, in contrast to these investigations, this research prioritized the evaluation process for leakage risk in small-scale water distribution networks. This theoretical research fully accounted for the uncertain nature of risk assessment. The results have direct applicability in determining the risk levels of specific pipelines, which, in turn, enables the creation of a pipeline risk ranking. This particular guidance can greatly assist water companies in carrying out practical efforts to control leakage. Additionally, within the context of integrated water resource management, the weights allocated to evaluation indexes can be combined with pertinent research methods.
In comparison with similar risk assessment studies using comparable methodologies, it is striking that the previously undiscovered measurement theory is predominantly used in risk assessment studies for large-scale engineering projects, such as rockburst prediction [47] and the risk assessment of water inflow in coal seams [48]. This study pioneered the implementation of this theory in the field of water distribution network engineering. This extension demonstrates the viability of implementing the theory in the realm of leak management and has the potential for wider application outside the scope of the specific case area.
In conclusion, this study’s findings emphasize the importance of proactive management and planned interventions in efficiently mitigating risks associated with pipeline leakage. The investigation conducted within the case area highlights the practical significance of the research results. As such, the results are a valuable guide for the relevant departments of water companies, enabling a more targeted approach to leakage control efforts. The capability to rapidly recognize the locations of leaks through the utilization of appropriate leak detection techniques is a concrete advantage derived from the research discoveries.

5. Conclusions

In this study, a thorough evaluation of the UWDN was performed to identify any potential for leakage. The objective was to build an index system to assess pipeline leakage risk and construct a model for that purpose, taking into account all essential stages of a risk assessment. Utilizing a particular city in the middle and lower reaches of the Yangtze River in China as a case study for the current research, this study uncovered the following contributions:
(1)
This study introduced the concept that risk comprises both the probability of occurrence and loss resulting from such an occurrence, providing a resolution to the problem of recent research’s singular focus on the probability of pipeline leakage. Based on insights from the relevant literature and statistical data collected from various regions of China, this study identified four primary categories as the criterion layer: pipeline intrinsic factors, external environmental factors, operational management factors, and leakage loss factors. A detailed analysis of 14 evaluation indices was carried out within these categories, resulting in the establishment of a comprehensive evaluation system for the risk of pipeline leakage. This system categorized the evaluation space into five sequential levels based on the level of risk.
(2)
The implementation of the theory of unascertained measures to assess pipeline risks empowered researchers and water companies to manage uncertainties linked with historical data efficiently. In order to create an evaluation model for the risk of leaks in UWDN, it was necessary to follow specific steps. These steps included constructing single-index unascertained measure evaluation matrixes, determining combination weights, establishing multi-index comprehensive measurement vectors, and applying the confidence recognition criterion. The resulting model was able to precisely evaluate the likelihood of leaks occurring in particular water supply pipelines during the evaluation timeframe.
(3)
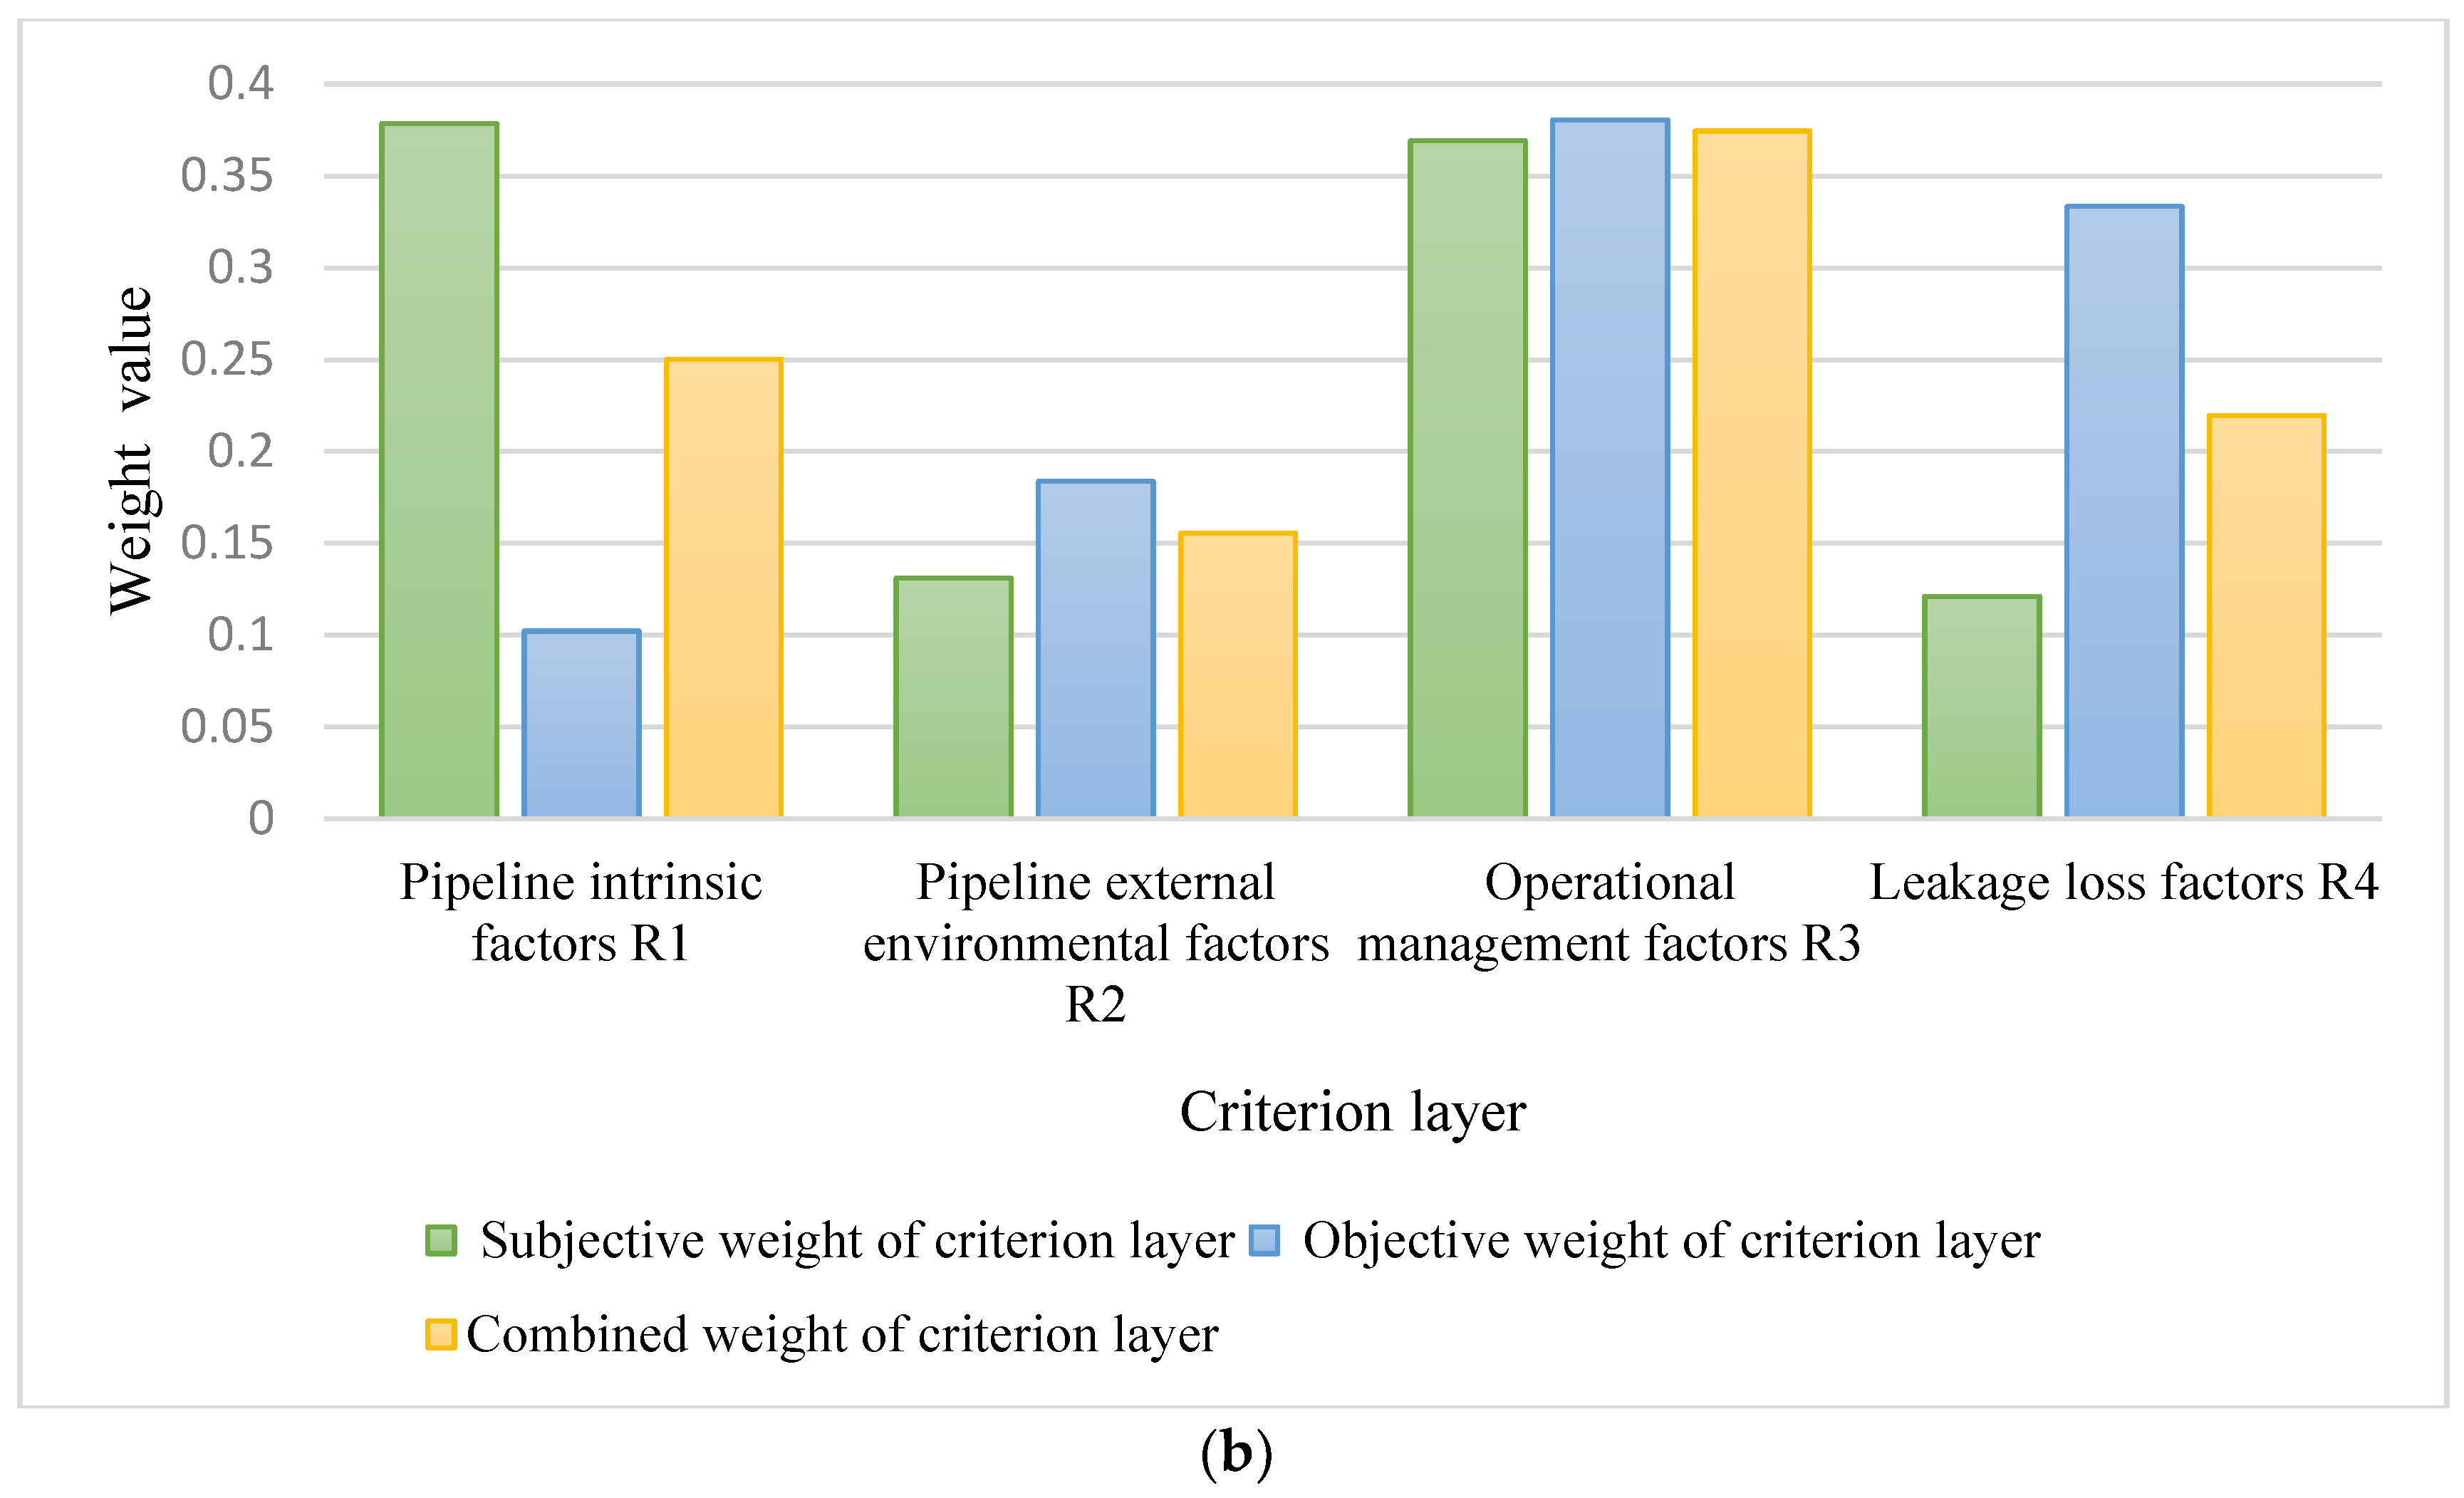
The game theory combination weighting method was utilized in this study to determine the weight of each evaluation index, resulting in a balanced blend of subjective and objective information. Assigning weights was not only a crucial component of risk assessment but also established a basis for controlling and managing water leakage. For example, this study identified that the indexes with the greatest weights were construction conditions and repair or reconstruction costs. Interestingly, previous studies on leakage risk assessment largely disregarded these factors. This discovery enables the water company to concentrate on mitigating the impact of these specific indices, ultimately reducing overall leakage risk. This strategic insight outlines the practical implications of using a weighting methodology to guide targeted interventions for improving the control and management of water leakages.
(4)
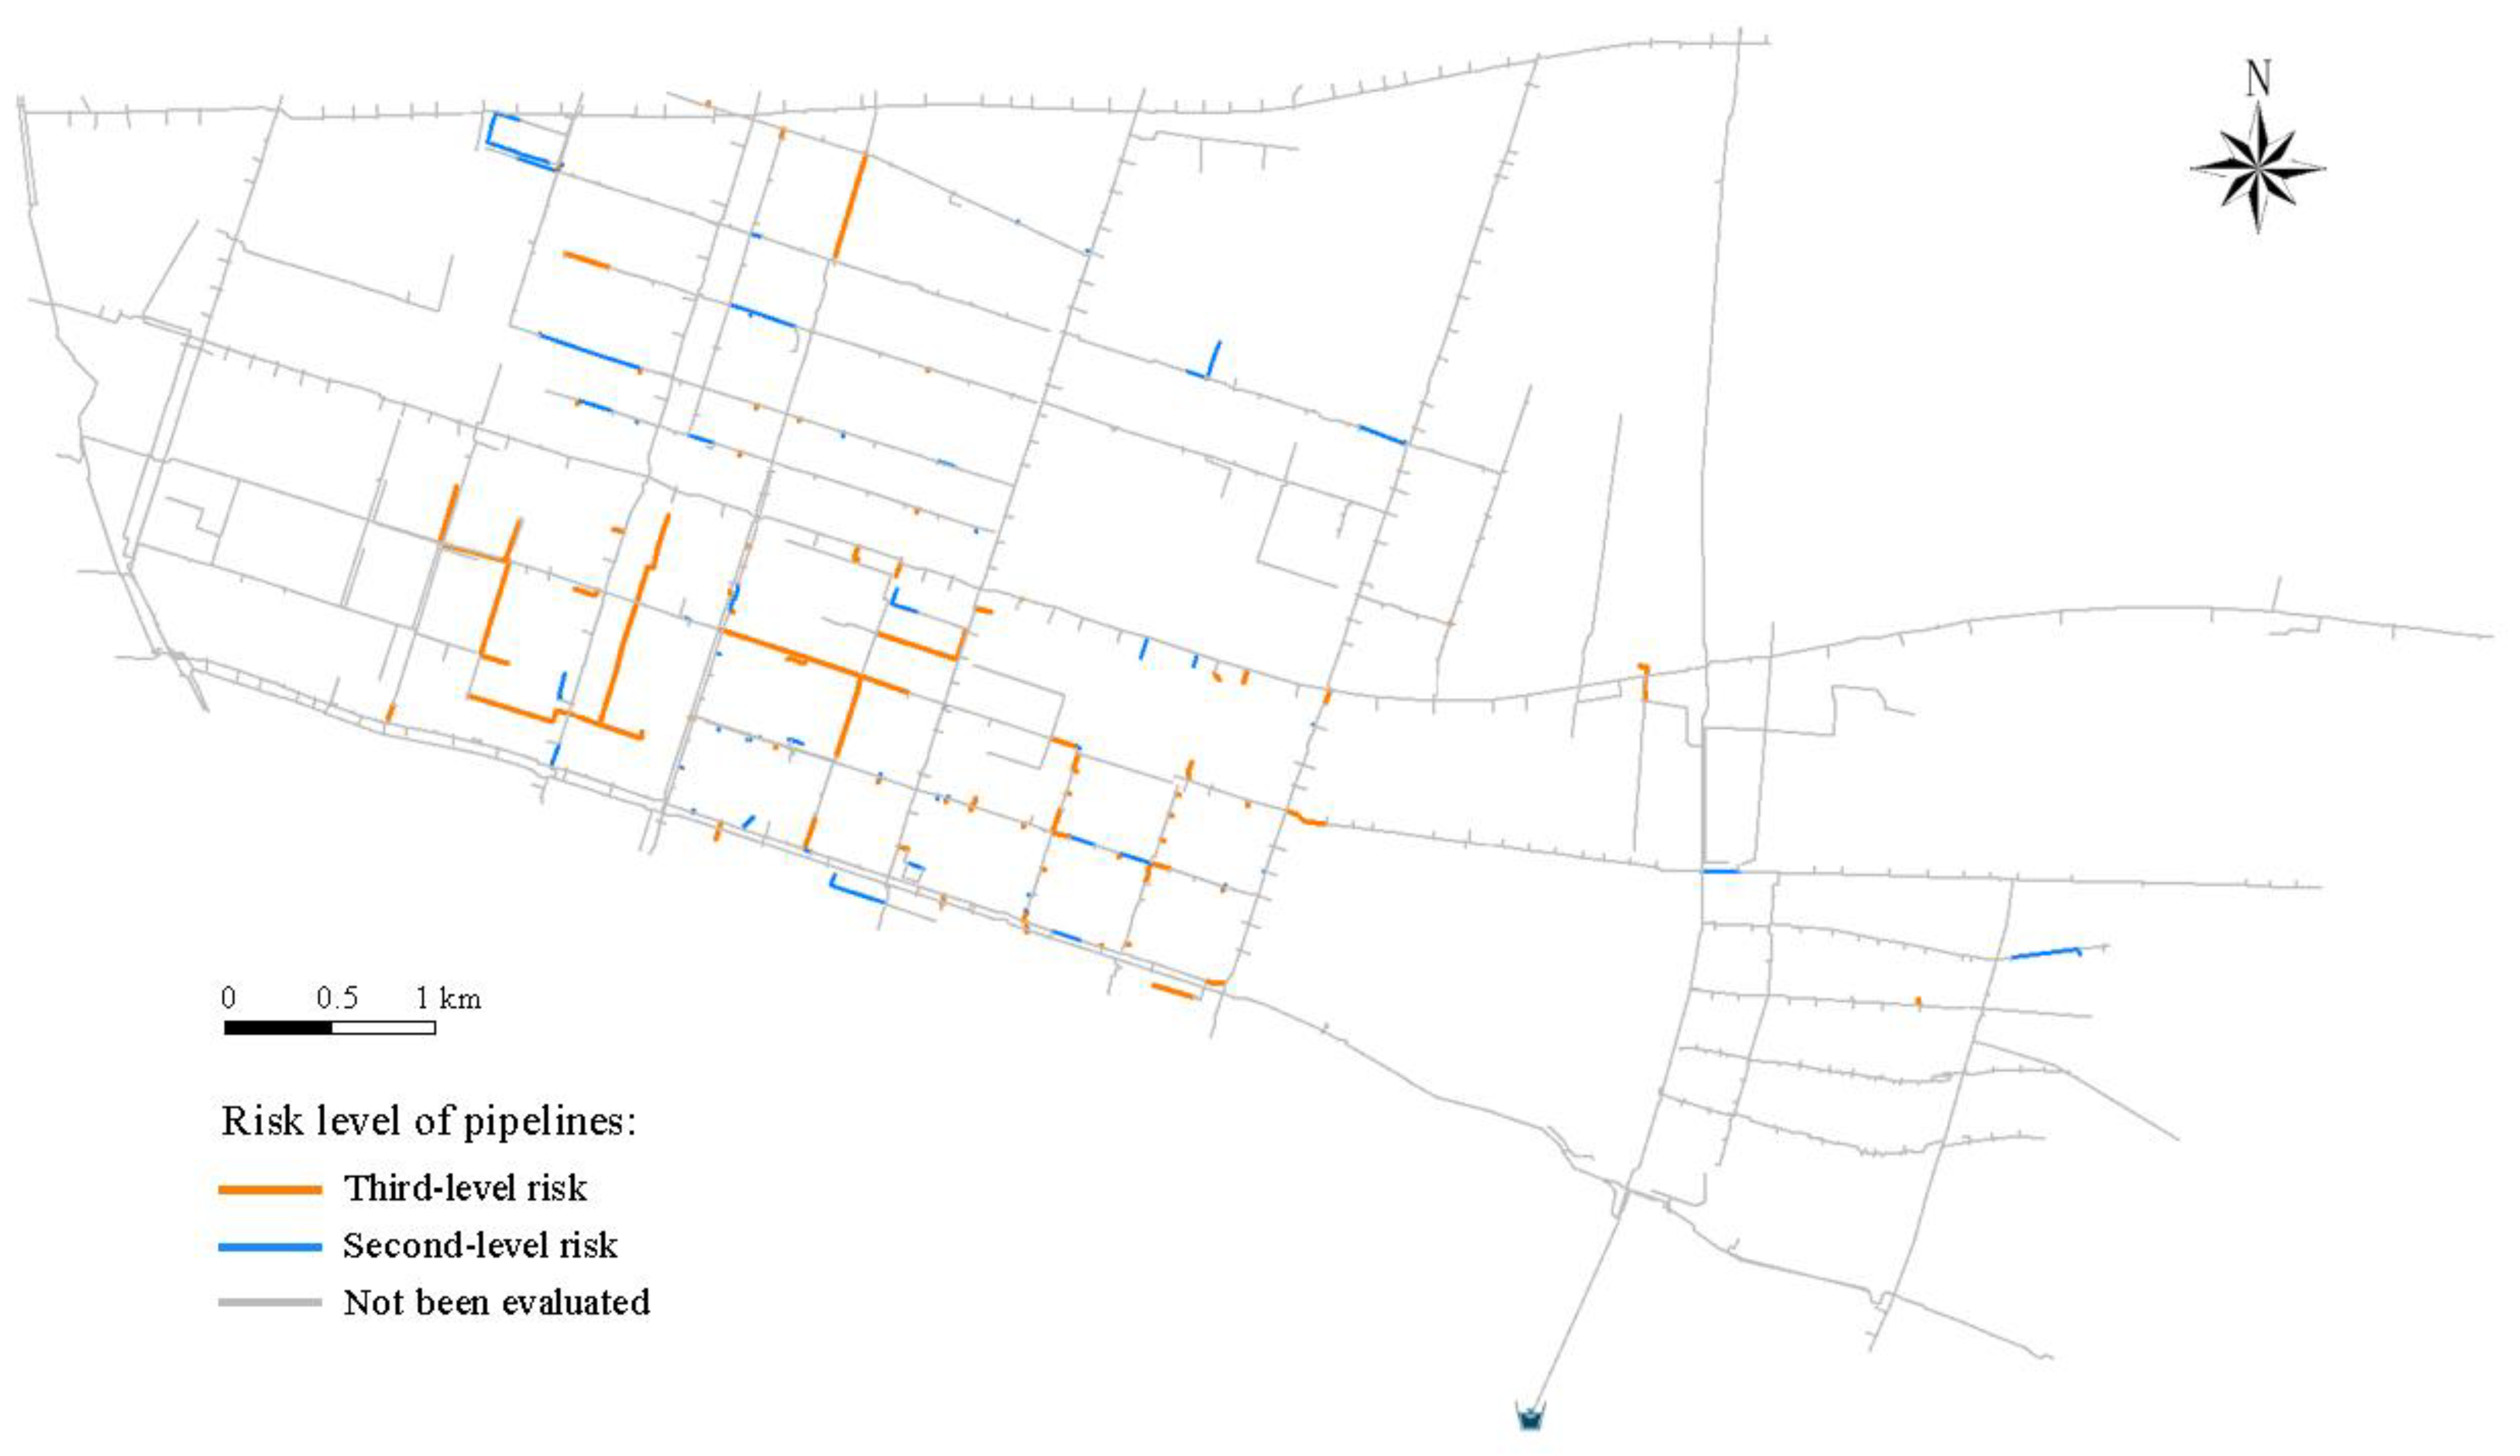
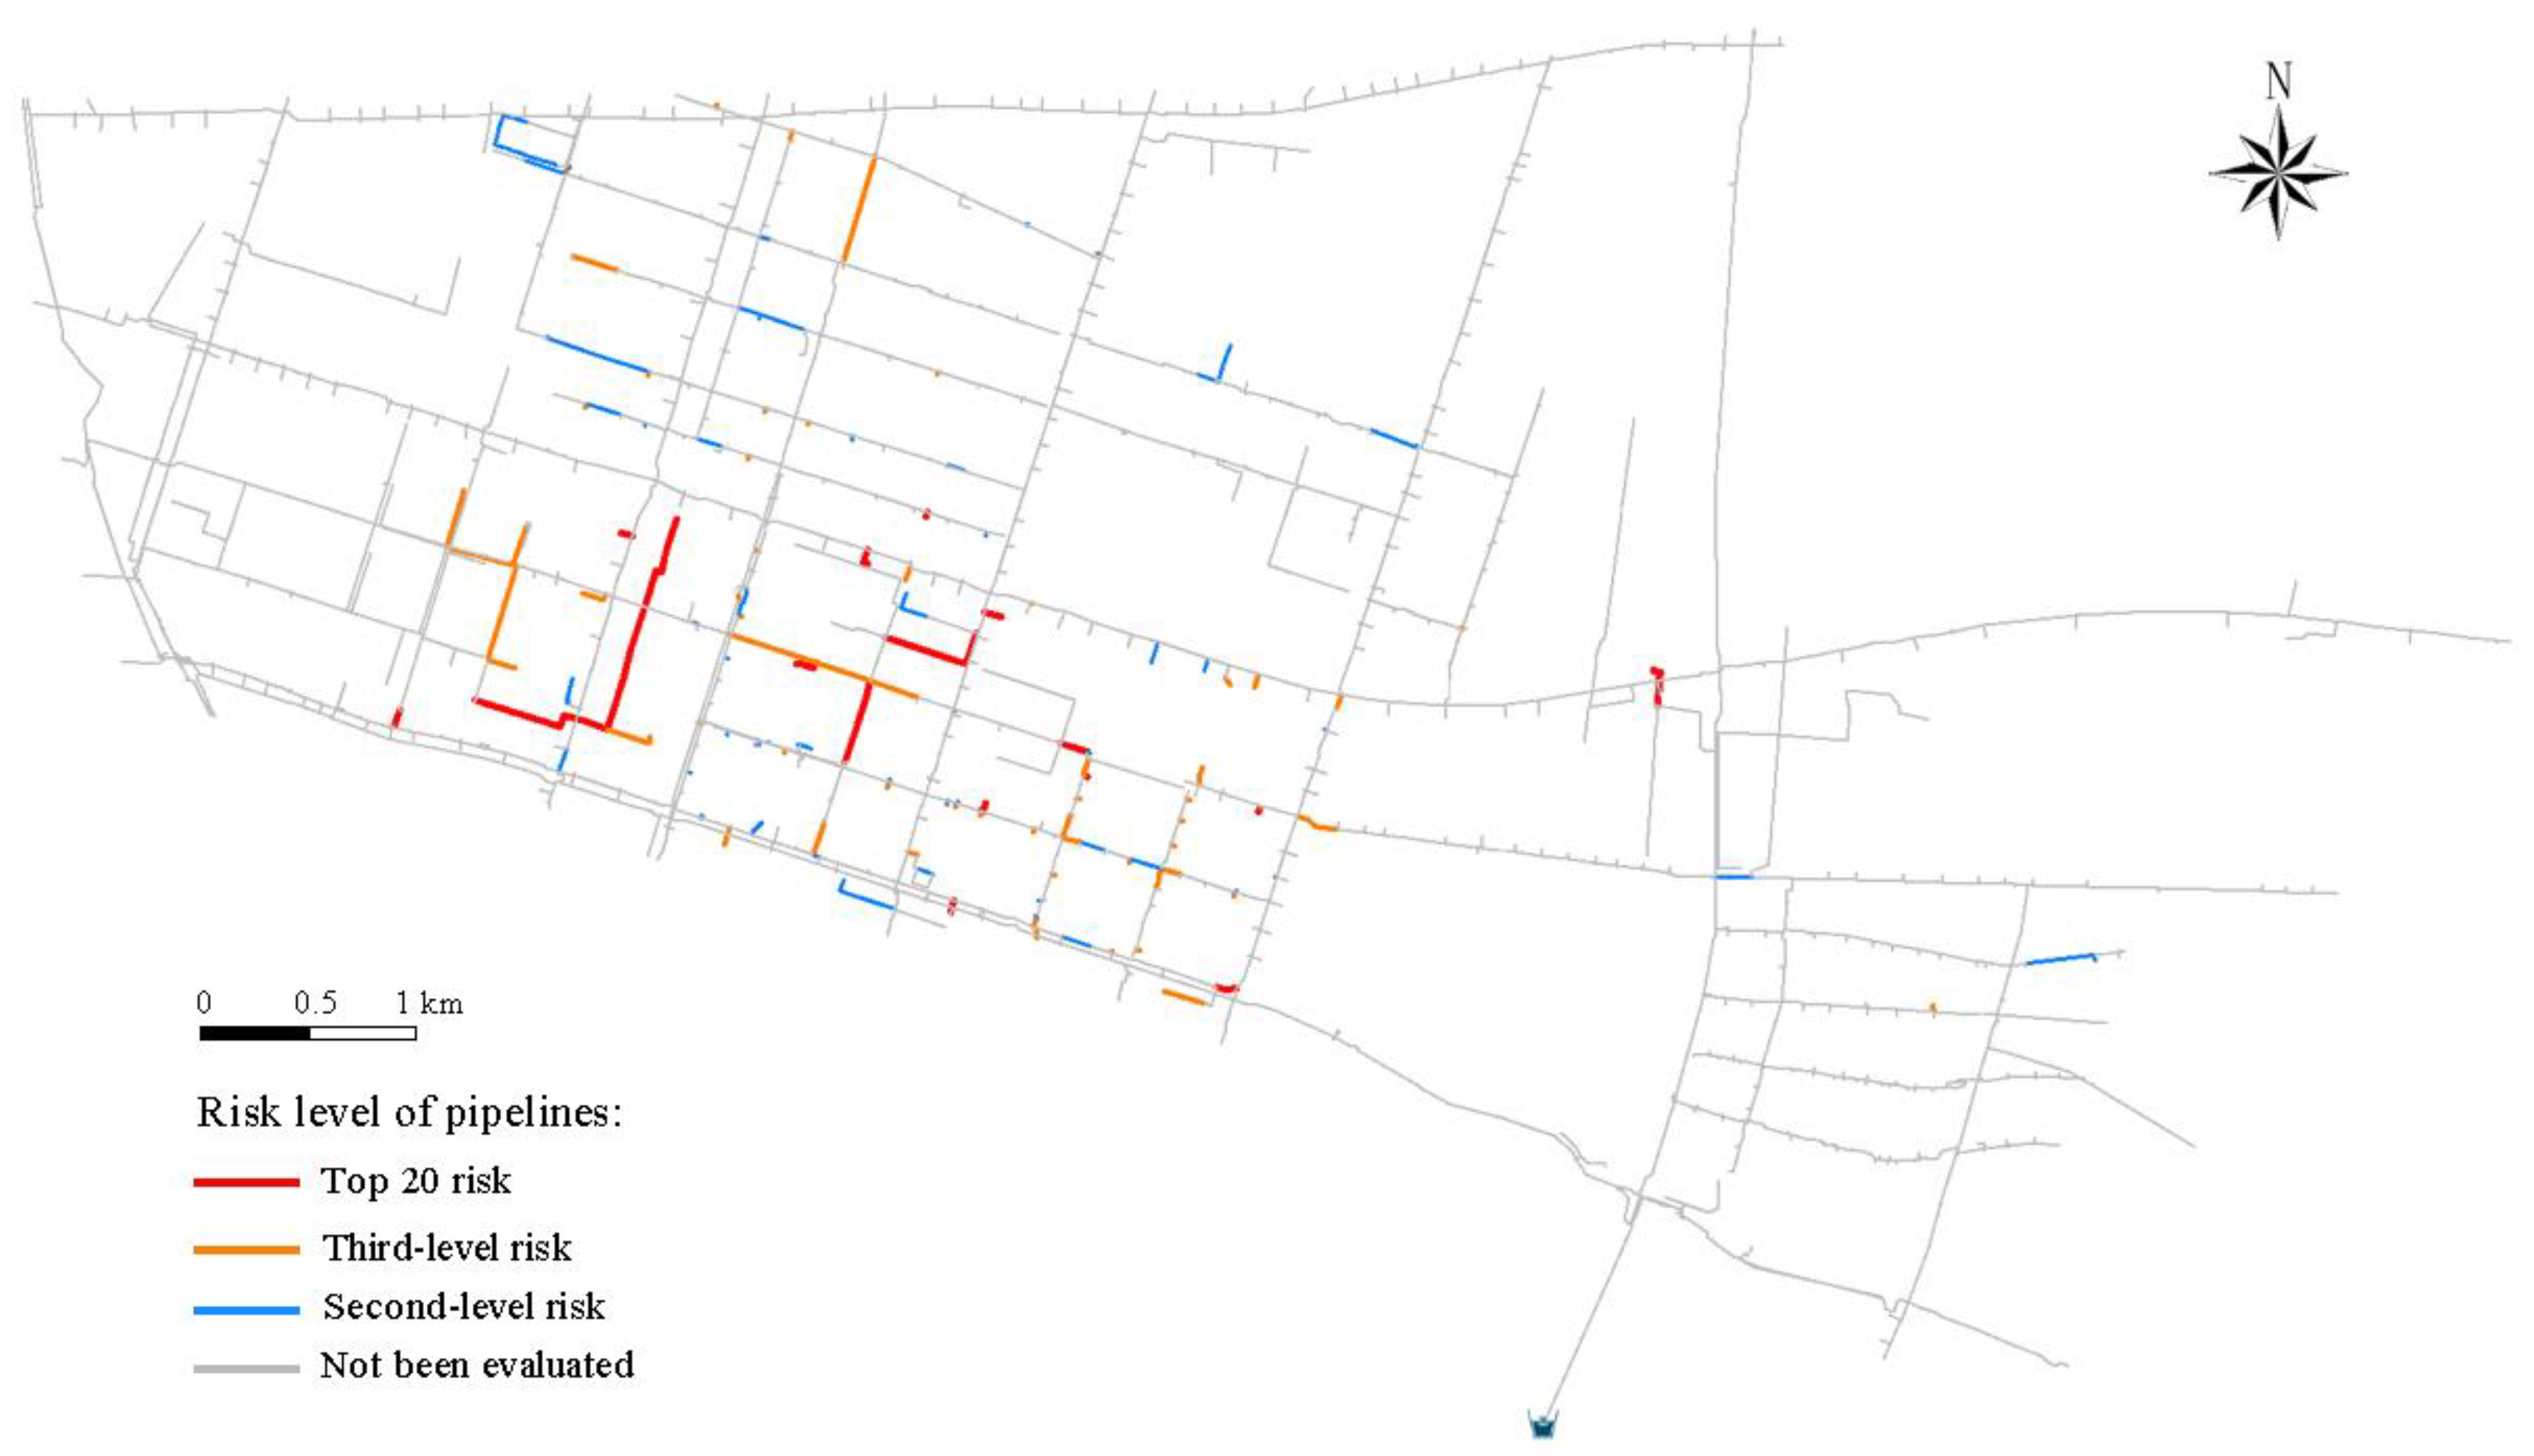
To evaluate the practicability and dependability of this study, the research methodology was employed to conduct a risk assessment on pipelines that have recorded leaks in the M district of W city, China. As a result of this evaluation, the risk level of the tested pipe section lines was found to be at a second to third level of risk. It is vital to continue monitoring the pipeline for leaks, which should be performed daily, as supported by field studies. Uncertain significance values can facilitate the sorting of pipeline risks within a specific level, creating a valuable reference for the water company to develop comprehensive and detailed leak control strategies.
(5)
By integrating theoretical models, statistical analyses, and innovative methodologies, this study presents a durable and methodical method for evaluating and managing leakage risks. This comprehensive approach facilitates decision-making, the allocation of resources, and proactive risk mitigation. In pipeline leakage risk assessment, identifying the precise location of the leak is not the only crucial factor, and ensuring that water companies can repair leaks more efficiently is another factor. This approach holds considerable practical value for decision-makers. Broadening the model’s application and improving its interaction design can enable water companies to make informed decisions and develop effective strategies for managing pipeline leak risks in diverse geographical locations. The model’s versatility guarantees its adjustability to varying contexts, thus supplying water management authorities with a valuable instrument to customize and design their interventions to suit the specific challenges and characteristics of each location.
The future research of this study can be envisioned in the following aspects:
(1)
It is important to note that the approach presented in this study has certain limitations. Conducting a risk assessment for every single pipeline in a specific area would not be practical. Therefore, it is recommended that a select number of crucial pipelines be chosen for assessment, as demonstrated in this paper, and that leak detection procedures be performed on those key pipelines first. A global risk assessment should be conducted on all pipelines in the study area using machine learning classification and regression methods. The suggested approach includes using key pipelines as a sample and a test set and is a follow-up task of this research.
(2)
This study has room for improvement in selecting influencing factors and evaluation indices. For example, when considering the “Special location” index (R43), it primarily evaluates the placement of the pipeline below buildings or in densely populated urban areas. Nonetheless, it is worth mentioning that tourism can notably impact water consumption and treatment costs [49]. In the case area, there are ancient towns and various tourist attractions. This indicates that the index system could be enhanced in future iterations by incorporating tourist destinations.
(3)
The agenda ahead involves implementing a model to conduct further risk evaluations of pipeline leakage in the region. To accomplish this, it is necessary to complete the interaction design of the leakage risk evaluation model by utilizing procedural design functions and integrating it with the database, which is a critical aspect. This will allow for the model to be applied in numerous regions that demand risk assessment. This collaborative endeavor aims to offer dependable technical assistance to the water companies in creating comprehensive leak prevention strategies for diverse locations and circumstances.

Author Contributions

C.X.: formal analysis, investigation, methodology, visualization, writing—original draft. J.W.: writing—review and editing. W.G.: resources and data curation. X.H.: data curation. T.T.: supervision. All authors contributed to the study conception and design. All authors have read and agreed to the published version of the manuscript.

Funding

The authors gratefully acknowledge the financial support from Shanghai Science and Technology Innovation Action Plan [grant No. 22dz1201800].

Data Availability Statement

The datasets used and/or analyzed during the current study are available from the corresponding author on reasonable request.

Conflicts of Interest

Authors W.G. and X.H. were employed by the company Wuxi Water Group Co., Ltd. The remaining authors declare that the research was conducted in the absence of any commercial or financial relationships that could be construed as a potential conflict of interest. All authors confirm that the work described has not been published before (except in the form of an abstract or as part of a published lecture, review, or thesis); that it is not under consideration for publication elsewhere; that its publication has been approved by all co-authors, if any; and that its publication has been approved (tacitly or explicitly) by the responsible authorities at the institution where the work is carried out.

References

  1. Geng, W.M. Control the leakage of water supply network. Urban Public Util. 2005, 2, 17–18. (In Chinese) [Google Scholar] [CrossRef]
  2. National Development and Reform Commission. National Development and Reform Commission and Other Departments on the Issuance of “14th Five-Year” Water-Saving Society Construction Plan Notice. Available online: https://www.ndrc.gov.cn/xxgk/zcfb/ghwb/202111/t20211108_1303414.html (accessed on 13 November 2023).
  3. National Bureau of Statistics. China City Statistical Yearbook 2021; China Statistical Publishing House: Beijing, China, 2022; ISBN 978-7-5037-9786-6. [Google Scholar]
  4. De Silva, D.; Moglia, M.; Davis, P.; Burn, S. Condition Assessment to Estimate Failure Rates in Buried Metallic Pipelines. J. Water Supply Res. Technol.-Aqua 2006, 55, 179–191. [Google Scholar] [CrossRef]
  5. Al-Barqawi, H.; Zayed, T. Infrastructure Management: Integrated AHP/ANN Model to Evaluate Municipal Water Mains’ Performance. J. Infrastruct. Syst. 2008, 14, 305–318. [Google Scholar] [CrossRef]
  6. Zheng, C.Z. Analysis and Evaluation of Urban Water Supply Pipeline Integrity. Master’s Thesis, Harbin Institute of Technology, Harbin, China, 2010. [Google Scholar] [CrossRef]
  7. Kutyłowska, M. K-Nearest Neighbours Method as a Tool for Failure Rate Prediction. Period. Polytech. Civ. Eng. 2018, 62, 318–322. [Google Scholar] [CrossRef]
  8. Zhang, H.X. Research and Application of Pipeline Risk Assessment for Urban Water Supply Network. Master’s Thesis, Chang’an University, Xi’an, China, 2020. [Google Scholar] [CrossRef]
  9. Rogers, P.D.; Grigg, N.S. Failure Assessment Modeling to Prioritize Water Pipe Renewal: Two Case Studies. J. Infrastruct. Syst. 2009, 15, 162–171. [Google Scholar] [CrossRef]
  10. Fayaz, M.; Ahmad, S.; Hang, L.; Kim, D. Water Supply Pipeline Risk Index Assessment Based on Cohesive Hierarchical Fuzzy Inference System. Processes 2019, 7, 182. [Google Scholar] [CrossRef]
  11. Zhang, W.; Lai, T.; Li, Y. Risk Assessment of Water Supply Network Operation Based on ANP-Fuzzy Comprehensive Evaluation Method. J. Pipeline Syst. Eng. Pract. 2022, 13, 04021068. [Google Scholar] [CrossRef]
  12. Lambert, A.; Merks, C.; Trow, S. Good Practices in Leakage Management: Lessons from Europe. 2015. Available online: https://search.ebscohost.com/login.aspx?direct=true&db=eih&AN=102656122&lang=zh-cn&site=ehost-live (accessed on 13 November 2023).
  13. Adedeji, K.B.; Hamam, Y.; Abe, B.T.; Abu-Mahfouz, A.M. Towards Achieving a Reliable Leakage Detection and Localization Algorithm for Application in Water Piping Networks: An Overview. IEEE Access 2017, 5, 20272–20285. [Google Scholar] [CrossRef]
  14. Henry, R.; Luxmoore, A.R. A Pipe-Profiling Adapter for CCTV Inspection Cameras: Development of a Pipe-Profiling Instrument. Meas. Sci. Technol. 1996, 7, 495–504. [Google Scholar] [CrossRef]
  15. Muntakim, A.H.; Dhar, A.S.; Dey, R. Interpretation of Acoustic Field Data for Leak Detection in Ductile Iron and Copper Water-Distribution Pipes. J. Pipeline Syst. Eng. Pract. 2017, 8, 05017001. [Google Scholar] [CrossRef]
  16. Sikder, M.N.K.; Nguyen, M.B.T.; Elliott, E.D.; Batarseh, F.A. Deep H2O: Cyber Attacks Detection in Water Distribution Systems Using Deep Learning. J. Water Process Eng. 2023, 52, 103568. [Google Scholar] [CrossRef]
  17. Ramos, H.M.; Morani, M.C.; Carravetta, A.; Fecarrotta, O.; Adeyeye, K.; López-Jiménez, P.A.; Pérez-Sánchez, M. New Challenges towards Smart Systems’ Efficiency by Digital Twin in Water Distribution Networks. Water 2022, 14, 1304. [Google Scholar] [CrossRef]
  18. Rajani, B.; Zhan, C. On the Estimation of Frost Loads. Can. Geotech. J. 1996, 33, 629–641. [Google Scholar] [CrossRef]
  19. Rajani, B.; Zhan, C.; Kuraoka, S. Pipesoil Interaction Analysis of Jointed Water Mains. Can. Geotech. J. 1996, 33, 393–404. [Google Scholar] [CrossRef]
  20. Zhao, S.; Jiang, X.B.; Gao, H.L. Reliability Method for the Assessment of the Failure Probability and Remaining Life of the Corroded Pipeline. Oil Gas Storage Transp. 2006, 12, 28–31. (In Chinese) [Google Scholar] [CrossRef]
  21. Shen, W.M. Study on Soil-Culvert Interaction and Structural Characteristics of Culvert in Transverse and Longitudinal Direction. Ph.D. Dissertation, Zhejiang University, Hangzhou, China, 2011. Available online: https://kns.cnki.net/kcms2/article/abstract?v=3uoqIhG8C447WN1SO36whHG-SvTYjkCc7dJWN_daf9c2-IbmsiYfKjYNsgKsVO4GjtplRcsdDhIppMOEPvr7zSIb9F6xl0A2&uniplatform=NZKPT (accessed on 13 November 2023).
  22. Jur, T.A.; Middleton, J.I.; Yurko III, A.A.; Windham, R.L.; Grey, J.R. Case Studies in Graphitic Corrosion of Cast Iron Pipe. J. Fail. Anal. Prev. 2021, 21, 376–386. [Google Scholar] [CrossRef]
  23. Lin, P.; Zhang, B.; Wang, Y.; Li, Z.; Li, B.; Wang, Y.; Chen, F. Data Driven Water Pipe Failure Prediction: A Bayesian Nonparametric Approach. In Proceedings of the 24th ACM International on Conference on Information and Knowledge Management (CIKM ‘15). Association for Computing Machinery, New York, NY, USA, 19–23 October 2015; pp. 193–202. [Google Scholar] [CrossRef]
  24. Diaz-Ortiz, J.; Alvarado-Medellin, P.; Ramirez-Aguilera, A.M.; Badillo-Almaraz, H.; Gomez, R.O.; Capetillo, C.B. Water Distribution System Calibration Using the Finite Element Method Coupled to a Genetic Algorithm. J. Water Process Eng. 2023, 54, 104017. [Google Scholar] [CrossRef]
  25. Yamijala, S.; Guikema, S.D.; Brumbelow, K. Statistical Models for the Analysis of Water Distribution System Pipe Break Data. Reliab. Eng. Syst. Saf. 2009, 94, 282–293. [Google Scholar] [CrossRef]
  26. Wang, C.W.; Zhang, H.W.; Niu, Z.G.; Peng, S. Assessment of Operation Conditions of Gray Cast lron Pipes. China Water Wastewater 2010, 26, 50–52+56. (In Chinese) [Google Scholar] [CrossRef]
  27. Kizilöz, B. Prediction Model for the Leakage Rate in a Water Distribution System. Water Supply 2021, 21, 4481–4492. [Google Scholar] [CrossRef]
  28. Wang, J.L.; Hu, Y.M.; Xu, Q.; Zhang, X.Z.; Li, S. Evaluation of influencing factors of pipe leakage for water distribution network based on fuzzy analytic hierarchy process and grey relation analysis methods. Water Wastewater Eng. 2022, 58, 116–122. (In Chinese) [Google Scholar] [CrossRef]
  29. Li, H.C. Research on Risk Assessment of Urban Water Supply Pipeline Network Leakage Based on Unascertained Measure Theory. Ph.D. Dissertation, Taiyuan University of Technology, Taiyuan, China, 2019. Available online: https://kns.cnki.net/kcms2/article/abstract?v=3uoqIhG8C475KOm_zrgu4lQARvep2SAkOsSuGHvNoCRcTRpJSuXuqfnlfiV7zWsMx7W9OKuUqHWPfwxWPMuwGJE90k1PYltS&uniplatform=NZKPT (accessed on 13 November 2023).
  30. Zhong, H.; Tang, Y.; Yan, H.; Zhang, Y.; Dong, L.; Wang, B. Corrosion of Pipelines in Urban Water Systems: Current Research Status and Future Trends Based on Bibliometric Analysis. J. Water Process Eng. 2023, 56, 104288. [Google Scholar] [CrossRef]
  31. Tian, C. Methodology and Application of Pipe Condition Assessment in Urban Water Distribution System. Ph.D. Dissertation, Tsinghua University, Beijing, China, 2016. Available online: https://kns.cnki.net/kcms2/article/abstract?v=hqt_j-uEELGGf6RiMZxxl2MYvYAjrKIgiiQ2dtoGJHEkOeMnRsykeOV6jmSpIjN3W5VHu9NYimdwvk7dT1TjtbI4_wAxwsOrE2BCFVq9OO1JNEF-HY5nXTQJeLL6ZhGWb302FmXFL-o=&uniplatform=NZKPT (accessed on 13 November 2023).
  32. Jiang, M. The Study of Water Supply Network Leakage Evaluation Based on Improved Analytic Hierarchy Process. Ph.D. Dissertation, Harbin Institute of Technology, Harbin, China, 2017. [Google Scholar] [CrossRef]
  33. Zhang, G.L.; Wang, Q.B.; Zhang, F.R.; Wu, K.N.; Cai, C.F.; Zhang, M.K.; Li, D.C.; Zhao, Y.G.; Yang, Y.L. Criteria for Establishment of Soil Family and Soil Series in Chinese Soil Taxonomy. Acta Pedol. Sin. 2013, 50, 826–834. (In Chinese) [Google Scholar] [CrossRef]
  34. Wu, K.N.; Zhao, R. Soil Texture Classification and lts Application in China. Acta Pedol. Sin. 2019, 56, 227–241. (In Chinese) [Google Scholar]
  35. Wu, S.; Liu, Y.H.; Zhang, S.H.; Wang, W.Y.; Ma, Z.Z. Experimental study on influences of pressure regulation and con-trol in water supply pipes on volume of water leakage. Adv. Sci. Technol. Water Resour. 2007, 3, 27–29. (In Chinese) [Google Scholar] [CrossRef]
  36. Li, C.C.; Li, J. Numerical simulation of leakage flow in pipeline leak point. City Town Water Supply 2020, 2, 33–36+11. (In Chinese) [Google Scholar] [CrossRef]
  37. Tan, X. Leakage of Water Supply Pipe Network Prediction and Evaluation of Healthy. Ph.D. Dissertation, Hunan University, Changsha, China, 2009. [Google Scholar] [CrossRef]
  38. Wang, G.Y. Unascertained information and its mathematical treatment. J. Harbin Inst. Archit. Eng. 1990, 4, 1–9. Available online: https://kns.cnki.net/kcms2/article/abstract?v=3uoqIhG8C44YLTlOAiTRKjkpgKvIT9NkyGkCpOZCCacPWZoIEaDzzFLQvQYWq1hBw8IhE0OJMAszlUkyfAYMSMciESwvSz0q&uniplatform=NZKPT (accessed on 13 November 2023). (In Chinese).
  39. Li, L.; Sheng, Z.H.; Xu, N.R. An improved analytic hierarchy process. Syst. Eng. 1989, 3, 5–7+2. Available online: https://kns.cnki.net/kcms2/article/abstract?v=3uoqIhG8C44YLTlOAiTRKqd0WnNPv0wTDjtDUwHroNyoRyUmZKOvx4-642obkUlr5iipJ_mUIDOyiIt2zZtPIdQaXLmjpQha&uniplatform=NZKPT (accessed on 13 November 2023). (In Chinese).
  40. Niu, L.; Chen, K.; Cheng, Y. Application of Improved Analytic Hierarchy Process in Employment Comprehensive Evaluation. Comput. Simul. 2011, 28, 376–379. (In Chinese) [Google Scholar] [CrossRef]
  41. Chen, J.L. Research on combination weighting evaluation method based on game theory. Fujian Comput. 2003, 9, 15–16. (In Chinese) [Google Scholar] [CrossRef]
  42. Zhong, L.M.; Xie, Q.M.; Luo, Y. Stability evaluation of tunnel surrounding rock based on game-extension theory. China Saf. Prod. Sci. Technol. 2019, 15, 56–61. (In Chinese) [Google Scholar] [CrossRef]
  43. Sun, Y.Y.; Hao, W. Application of information entropy-unascertained measure theory in quality optimization of concrete recycled coarse aggregate. Civ. Eng. Environ. Eng. 2017, 39, 87–92. (In Chinese) [Google Scholar] [CrossRef]
  44. Fu, Y.F. Distribution Systems Control on Leakage of Urban Water. Ph.D. Dissertation, Tianjin University, Tianjin, China, 2004. [Google Scholar] [CrossRef]
  45. Zhang, C.; Nong, X.; Zhong, H.; Shao, D.; Chen, L.; Liang, J. A Framework for Exploring Environmental Risk of the Longest Inter-Basin Water Diversion Project under the Influence of Multiple Factors: A Case Study in China. J. Environ. Manag. 2022, 322, 116036. [Google Scholar] [CrossRef] [PubMed]
  46. Zehtabian, E.; Masoudi, R.; Yazdandoost, F.; Sedghi-Asl, M.; Loáiciga, H.A. Investigation of Water Allocation Using Integrated Water Resource Management Approaches in the Zayandehroud River Basin, Iran. J. Clean. Prod. 2023, 395, 136339. [Google Scholar] [CrossRef]
  47. Hu, X.; Huang, L.; Chen, J.; Li, X.; Zhang, H. Rockburst Prediction Based on Optimization of Unascertained Measure Theory with Normal Cloud. Complex Intell. Syst. 2023, 9, 7321–7336. [Google Scholar] [CrossRef]
  48. Wu, Q.; Zhao, D.; Wang, Y.; Shen, J.; Mu, W.; Liu, H. Method for Assessing Coal-Floor Water-Inrush Risk Based on the Variable-Weight Model and Unascertained Measure Theory. Hydrogeol. J. 2017, 25, 2089–2103. [Google Scholar] [CrossRef]
  49. Pérez, D.M.G.; Martín, J.M.M.; Martínez, J.M.G.; Sáez-Fernández, F.J. An Analysis of the Cost of Water Supply Linked to the Tourism Industry. An Application to the Case of the Island of Ibiza in Spain. Water 2020, 12, 2006. [Google Scholar] [CrossRef]
Figure 1. Pipeline leakage risk evaluation index system.
Water 15 04294 g001
Figure 2. Flowchart for developing the pipeline leakage risk assessment model.
Water 15 04294 g002
Figure 3. Single-index measure function diagram. (a) Diameter (R12). (b) Age of the pipeline (R13). (c) Depth of embedment (R21). (d) Temperature and frozen (R23). (e) Peak pressure (R31). (f) Times of leakages occurred (R32). (g) Repair or reconstruction costs (R41). (h) Qualitative index value.
Water 15 04294 g003aWater 15 04294 g003b
Figure 4. Topological structure diagram of the hydraulic model in M area.
Water 15 04294 g004
Figure 5. Index weight diagram of the P01739 pipe section. (a) Weight of the index layer. (b) Weight of the criterion layer.
Water 15 04294 g005aWater 15 04294 g005b
Figure 6. Schematic diagram of the specific location of the pipeline evaluated.
Water 15 04294 g006
Figure 7. Schematic diagram of the specific location of the pipeline ranked in the top 20.
Water 15 04294 g007
Table 1. Pipeline leakage risk evaluation index system.
Goal LayerCriterion LayerIndex LayerEvaluation MethodFirst-Level Risk:
Very Low Risk
Second-Level Risk:
Low Risk
Third-Level Risk:
General Risk
Fourth-Level Risk:
High Risk
Fifth-Level Risk:
Very High Risk
Quantitative Classification Method Description
Leakage risk of urban water distribution networkPipeline intrinsic factors
R1
Pipe material R11CharacterizationDuctile iron pipePlastic pipeGalvanized steel pipeSteel pipeCast iron pipe
Diameter R12Quantification≤0.10.1–0.50.5–1.01.0–1.5≥1.5Damage ratio
Age of the pipeline R13Quantification≤0.10.1–0.50.5–1.01.0–1.5≥1.5Damage ratio
Corrosion condition R14 [29,30]CharacterizationThe pipeline exhibits high resistance to corrosion.The pipeline exhibits high resistance to corrosion.Pipeline corrosion is a prevalent issue.The pipeline is susceptible to corrosion.The pipeline is extremely vulnerable to corrosion.
Joint condition R15 [31,32]CharacterizationFlexible interface, high toughness, good interface strength and tightness.Flexible interface, strong shock resistance, can resist a certain tensile deformation.Strong sealing, relatively strong, water leakage easy to occur on such a pipeline because of poor welding.The rigidity is strong, and the uneven settlement or temperature change of the foundation will break the joint.The rigidity is strong, and the pipeline joint is easily broken due to thermal expansion and cold contraction.
Pipeline external environmental factors R2Depth of embedment R21Quantification≤3%3–4%4–5%5–6%≥6%Leakage rate per unit pipe length
Nature of soil R22 [33,34]CharacterizationCoarse bone soilCoarse bone sandy soilSandy soilLoamClay soil
Temperature and frozen R23Quantification≤6%6–8%8–10%10–12%≥12%Percentage of leakages per month
Operational management factors R3Peak pressure R31 [35,36]Quantification≤0.200.20–0.250.25–0.300.30–0.40≥0.40Unit: Mpa
Times of leakages occurred R32Quantification0123≥4Unit: times
Construction condition R33 [37]CharacterizationThe construction process is in full compliance with the specification.The construction process is in line with the specifications.The construction process is generally in line with the specifications.There are obvious omissions in the construction process.There are many non-compliant processes in the construction.
Leakage loss factors R4Repair or reconstruction costs R41Quantification<80008000–12,00012,000–16,00016,000–24,000>24,000Uni: CNY
Road grade R42CharacterizationRoads within the district.Branch roads to the interior of the district.Third-level road.Second-level road.First-level road.
Special location R43CharacterizationThe special location of the pipeline has no effect on the leakage maintenance.The special location of the pipeline has little effect on the leakage maintenance.The special location of the pipeline has some effect on the leakage maintenance.The special location of the pipeline has a large effect on the leakage maintenance.The special location of the pipeline has a great effect on the leakage maintenance.
Qualitative index value12345
Table 2. Basic information of the P01739 pipe section.
Pipeline NumberUpstream Node
Number
Downstream Node
Number
Diameter (DN)Length (m)Pipe MaterialYear of
Construction
Depth of Embedment (m)Nature of Soil
P01739V00018-BJ136320018.38Ductile iron pipe20101.575Sandy soil
Pipeline NumberPeak Pressure (Mpa)The number of Leakages OccurredCondition of ConstructionPipeline repair or Reconstruction Costs (CNY) [44]Road Grade of PipelineSpecial Circumstances
P017390.2761The construction process is in line with the specifications13,842.39Third-level roadLocated in dense urban areas, passing through sewers or drains
Table 3. The value of each index of the P01739 pipe section.
Evaluation IndexPipe Material R11Diameter R12Age of the Pipeline R13Corrosion Condition R14Joint Condition R15Depth of Embedment R21Nature of Soil R22
Value of index of P0173910.723.3322.74%3
Evaluation IndexTemperature and Frozen R23Peak Pressure R31Times of Leakages Occurred R32Construction Condition
R33
Repair or Reconstruction Costs R41Road Grade R42Special Location R43
Value of index of P0173912.93%0.2761213,842.3932
Table 4. Index weights of the P01739 pipe section.
Goal LayerCriterion LayerSubjective Weight of Criterion LayerObjective Weight of Criterion LayerCombined Weight of Criterion LayerIndex LayerSubjective Weight for Each IndexObjective Weight for Each IndexCombined Weight for Each Index
Leakage risk of urban water distribution networkPipeline intrinsic factors R10.37850.10230.2503Pipe material R110.22780.20630.2258
Diameter R120.04620.17490.0579
Age of the pipeline R130.2780.20630.2715
Corrosion condition R140.33480.20630.3232
Joint condition R150.11310.20630.1216
Pipeline external environmental factors R20.13120.18380.1556Depth of embedment R210.31860.33330.3186
Nature of soil R220.40440.33330.4044
Temperature and Frozen R230.2770.33330.277
Operational management factors R30.36910.38060.3744Peak pressure R310.20670.32590.2105
Times of leakages occurred R320.28680.3370.2884
Construction condition R330.50650.3370.5012
Leakage loss factors R40.12120.33340.2197Repair or reconstruction costs R410.41670.30960.4003
Road grade R420.22510.34520.2435
Special location R430.35820.34520.3562
Table 5. Risk ranking results of three-level risk pipelines in the M area.
Pipeline NumberRisk Level ResultFirst-Level Risk
Membership
Second-Level Risk
Membership
Third-Level Risk
Membership
Fourth-Level Risk
Membership
Fifth-Level Risk
Membership
Uncertain SignificanceRisk Ranking
P089630.09830.18920.32310.25350.13603.13951
P139430.06230.20960.47910.06030.18863.10332
P119230.10270.30670.24050.18750.16263.00053
P144030.08640.24340.42760.08130.16132.98784
P158830.11720.22600.42610.03030.20042.97065
P046130.00000.47350.29380.03180.20092.95996
P140630.13850.20990.41490.04480.19202.94197
P160530.10850.28580.32050.13610.14922.93198
P098130.12890.30650.18200.28150.10112.91949
P017530.05600.34380.33410.15770.10842.918810
P145130.05380.40890.30410.05910.17412.890911
P150830.08550.34650.33080.06610.17112.890712
P118330.13010.23760.41470.06270.15482.874413
P135830.13770.21020.41140.14070.10002.855114
P0175630.21140.19080.23810.26720.09252.838615
P144130.12850.38540.20040.13020.15562.799016
P138830.07390.29810.49920.01620.11252.795317
P145030.10320.33430.37490.04230.14532.792418
P0173830.20260.21170.37740.01540.19292.784219
P172130.08580.48240.20100.03740.19342.770120
Disclaimer/Publisher’s Note: The statements, opinions and data contained in all publications are solely those of the individual author(s) and contributor(s) and not of MDPI and/or the editor(s). MDPI and/or the editor(s) disclaim responsibility for any injury to people or property resulting from any ideas, methods, instructions or products referred to in the content.

