1. Introduction
Reliability-Centered Maintenance (RCM) is a decision methodology to develop applicable and cost-effective proactive preventive and condition-based maintenance tasks to preserve required system functions. Performing an RCM workshop can be thought of as performing a technical accounting of a system that details the functions and functional failures of an asset or system and methodically leads the workshop team through a series of decisions to prescribe maintenance tasks to prevent or mitigate the occurrence of a functional failure. When a maintenance task is implemented based on the findings and recommendation of the RCM, it is easy to understand why that maintenance task was identified and the intended benefit. “If we fully expect that all expenditures of a company be thoroughly documented by sound accounting standards for future audit, then why would we expect less for documenting the purpose of a company’s assets and the strategy in preserving their need?” [
1].
Implementing an RCM workshop is to undertake a thorough and deliberate process of evaluating an asset to:
establish its function;
identify what functional failures may occur that may preclude the asset from fulfilling its function;
review the likelihood and subsequent consequences of a functional failure;
identify tasks that could be developed to reduce the likelihood of a functional failure; and
establish costs for prevention.
RCM, in effect, forces the complete understanding of the system and component analyzed. According to Allen [
2,
3], “The procedure deepens the expertise of the engineer”. Failure can be predicted by identifying system failure modes and causes associated with system functional failures and describing the effects (consequences) of failure at three levels—local, system, and plant. This will assist in identifying predictive signs of potential failures providing for a more aligned condition-based strategy [
4,
5]. During an RCM analysis, teams are prompted to consider tasks that will identify and address failure modes that normally require assessment of the system’s condition [
6].
RCM maintenance principles are based on understanding what is likely to happen if the cause of failure is present, the core premise being to preserve system functionality by determining potential failure modes and then exploring and weighting the causes and consequences of each [
7]. A Failure Modes and Effects Analysis (FMEA) is one aspect of an RCM where the failure modes of how a pipeline can or may fail, the effects of a failure occurring on the overall system are analyzed, and maintenance tasks to prevent or eliminate the failure modes are reviewed [
8].
RCM originated in the airline industry in the 1960s. Early airline maintenance programs were based on the premise that every asset had a life, and periodic overhauls were essential to sustain performance and reliability, but the cost for this practice was becoming unsustainable, so a task force was formed consisting of representatives of both the airlines and the Federal Aviation Administration (FAA) to investigate the capabilities of preventive maintenance. The establishment of this task force subsequently led to the development of a series of guidelines for airlines and aircraft manufacturers to use when establishing maintenance schedules for their aircrafts. These guidelines formed the premise for RCM [
9]. It was so successful that every U.S. commercial airplane since then used the RCM methodology to specify its initial maintenance program to the FAA in order to obtain its type certificate [
10]. Since the 1960s, RCM has been applied to a wide range of industries [
11,
12]. Due to its systematic approach to quantitatively assess and optimize the performance of preventive maintenance tasks and to eliminate non-value adding maintenance actions, RCM analyses provide considerable cost savings by optimizing maintenance effort, increasing safety, and increasing productivity [
13].
Geisbush and Ariaratnam [
10] investigated industries and specific applications of RCM analyses for development of maintenance strategies. Industries included transportation, energy generation, transmission, and distribution; many types of manufacturing, fabrication, and processing; and several applications within the military [
14,
15,
16,
17]. However, one industry that has not applied the principles of RCM as much as other industries is the water/wastewater industry. A few utilities have used RCM to a limited extent, but the vast majority have not [
18]. The AWWA (2020) reports the top issue facing the water industry since 2016 is aging infrastructure, with the second being financing for improvements [
19]. The industry must find ways of extending asset life and reducing maintenance expenditures through proactive pipeline maintenance [
20,
21].
Implementation of RCM to an asset can reduce maintenance costs by as much as 25% and may allow for the extension of an asset’s usable life [
18,
22]. RCM’s approach is to analyze an asset and system with the intent of developing maintenance strategies to maintain function and minimize failures [
23,
24]. A properly planned and executed RCM-based maintenance strategy can reduce the risk of major failures.
2. Water Pipeline Infrastructure
Water is vital to the support of life across the globe, and drinking water infrastructure is vital to public health. The United States uses approximately 160 billion liters (42 billion gallons) of water every day as part of daily activities, from cooking, cleaning, and bathing in homes, to use in manufacturing facilities, medical facilities, and offices across the country. Approximately 80% of water comes from surface waters, such as rivers, lakes, reservoirs, and oceans, with the remaining coming from groundwater aquifers [
21]. Not everyone lives near a source nor are all the water demands adjacent to a source, so the water must be transported to the user. The American Society of Civil Engineers Drinking Water Report [
20] says there are one million miles of pipes across the country that deliver drinking water. Many of the pipes were installed in the early to mid-20th century, with an expected lifespan generally considered to be 75 to 100 years. This means that much of the underground pipeline networks is due for replacement within the next 20 years. Additionally, the lifespan of a system and components comprising the system require regular maintenance to meet that expected lifespan.
The drinking water infrastructure system in the US comprises 3.54 million km (2.2 million miles) of underground pipes that deliver safe, reliable water to millions of people [
20]. Unfortunately, the system is aging and underfunded. An estimated 22.7 billion liters (6 billion gallons) of treated (potable) water is lost every day to pipeline breaks, meaning roughly 14% to 18% of the water treated to meet potable standards never reaches the end user. The amount of potable water lost every day could support 15 million households [
21]. That lost water is also lost revenue for water systems—water that never arrives at its destination cannot be metered, and the water system does not collect payment for treating/delivering the water. This could actually be a twofold loss in some cases. Consider that a utility uses resources (spends money) it cannot regain from treating water, and the water is lost by leaks. Water from a heavily used source is removed from the source and essentially lost. If it were never removed, it could be saved and used another time. The direct cost of these leaks is estimated to be USD 2.6 billion per year [
25].
The Central Arizona Project (CAP) is one of the largest water providers in the United States and contains some of the largest diameter water pipelines in the world. The aqueduct provides a renewable and reliable source of water to over 5 million people residing in the state of Arizona in the United States’ desert southwest. The three predominant materials for large-diameter waterlines in the agency’s inventory are prestressed concrete pipe (PCP), reinforced concrete pipe (cast-in-place and precast), and steel pipe. Prestressed concrete pipes range in diameter from 1.8 m to 6.4 m (72 inches to 252 inches), which is the largest prestressed concrete pipe in the world. Reinforced concrete pipes range in size from 1.8 m to 6.4 m (72 inches to 252 inches), whereas steel pipes range from 3.65 m to 6.4 m (144 inches to 252 inches) in diameter. Each pipe type requires different maintenance activities. This paper and research focus on prestressed concrete pipes due to the amount of PCP that CAP has in its inventory, though mention is made to steel pipelines for some similarities in maintenance planning. Furthermore, the American Water Works Association Research Foundation (AwwaRF) estimates that nearly 30.4 million m (100 million feet) of prestressed concrete pipe was installed in the US between World War II and 2006 [
26].
Figure 1 shows the profile of a typical large-diameter pipeline in the CAP inventory. The pipeline takes water from an open channel canal (open to atmospheric pressure) and transitions from a Check Structure to a square-to-round transition structure to a round pipeline. The pipeline drops in elevation to go beneath a water body such as a river, then climbs in elevation to the other side of the river, transitioning back to an open channel canal through a round-to-square transition structure and back to atmospheric pressure. The water surface elevation in the inlet Check Structure is higher than the water surface elevation in the outlet transition allowing water to be conveyed via gravity. Depending on the location in the aqueduct system, the pipeline may be subject to operating pressures as low as 10 m to as high as almost 85 m, at burial depths of 1.5 m to over 20 m. The pipelines range in length from about 450 m to over 2600 m.
3. Consequences of Failure
Failure of a large-diameter water transmission pipeline can have much larger consequences than a smaller diameter distribution pipeline [
27,
28,
29,
30,
31,
32,
33,
34].
Table 1 presents examples of larger diameter waterline failures and provides the estimated volume of water lost and the impact cost. The impact costs include the cost to repair the pipe, costs related to repair of adjacent infrastructure (such as roads, bridges, etc.), costs associated with purchasing damaged properties, if applicable, and reimbursable costs to businesses temporarily shut down due to water loss or even for production loss due to the pipeline failure.
In 1999, a 2.44 m (96 inch) diameter PCCP owned by Tucson Water ruptured due to loss of prestressing wires. An estimated 144 million liters of water was lost, with the resulting repair and impact cost estimated to be USD 5.5 million USD, which included 12 homes that the agency purchased because of the damage. The waterline was out of service for three months before repairs could be finalized.
In 2006, a 1.69 m (66 inch) PCCP transmission pipeline owned by the San Diego County Water Authority ruptured. The failure occurred on a hillside in a large open space environmental preserve. While the failure was away from the public, it still resulted in substantial water loss and unanticipated cost; the failure caused deep erosion and washed out an adjacent pipeline. The failure required significant environmental mitigation at the break and downstream along the San Diego River. The break also required reconfiguration of the pipeline system.
In 2016, a large irrigation pipeline failed in a farming area in New Mexico.
Figure 2 shows a 5.33 m (210 inch) prestressed concrete pipe that failed due to corroded prestressing wires. Two pieces of pipe failed resulting in the pipeline being out of service for several weeks due to the unplanned outage to perform the repairs. While the estimated water loss was only about one million gallons because the pipeline was able to be isolated quickly, the estimated impact cost was almost USD 20 million. This included the cost to repair and the loss of revenue from crop loss.
In October 2017, a 1.2 m (48 inch) PCCP failed in Oakland County, Michigan, sending 75.7 million liters of water down a busy street, disrupting traffic as well as water service to over 300,000 residents and three nearby hospitals. The drop in pressure caused by the failure resulted in reduced pressure, boiling water advisories, and losses of service. Repairs took five days before service was resumed.
Figure 3 shows the excavated failed pipe in anticipation of repair activity.
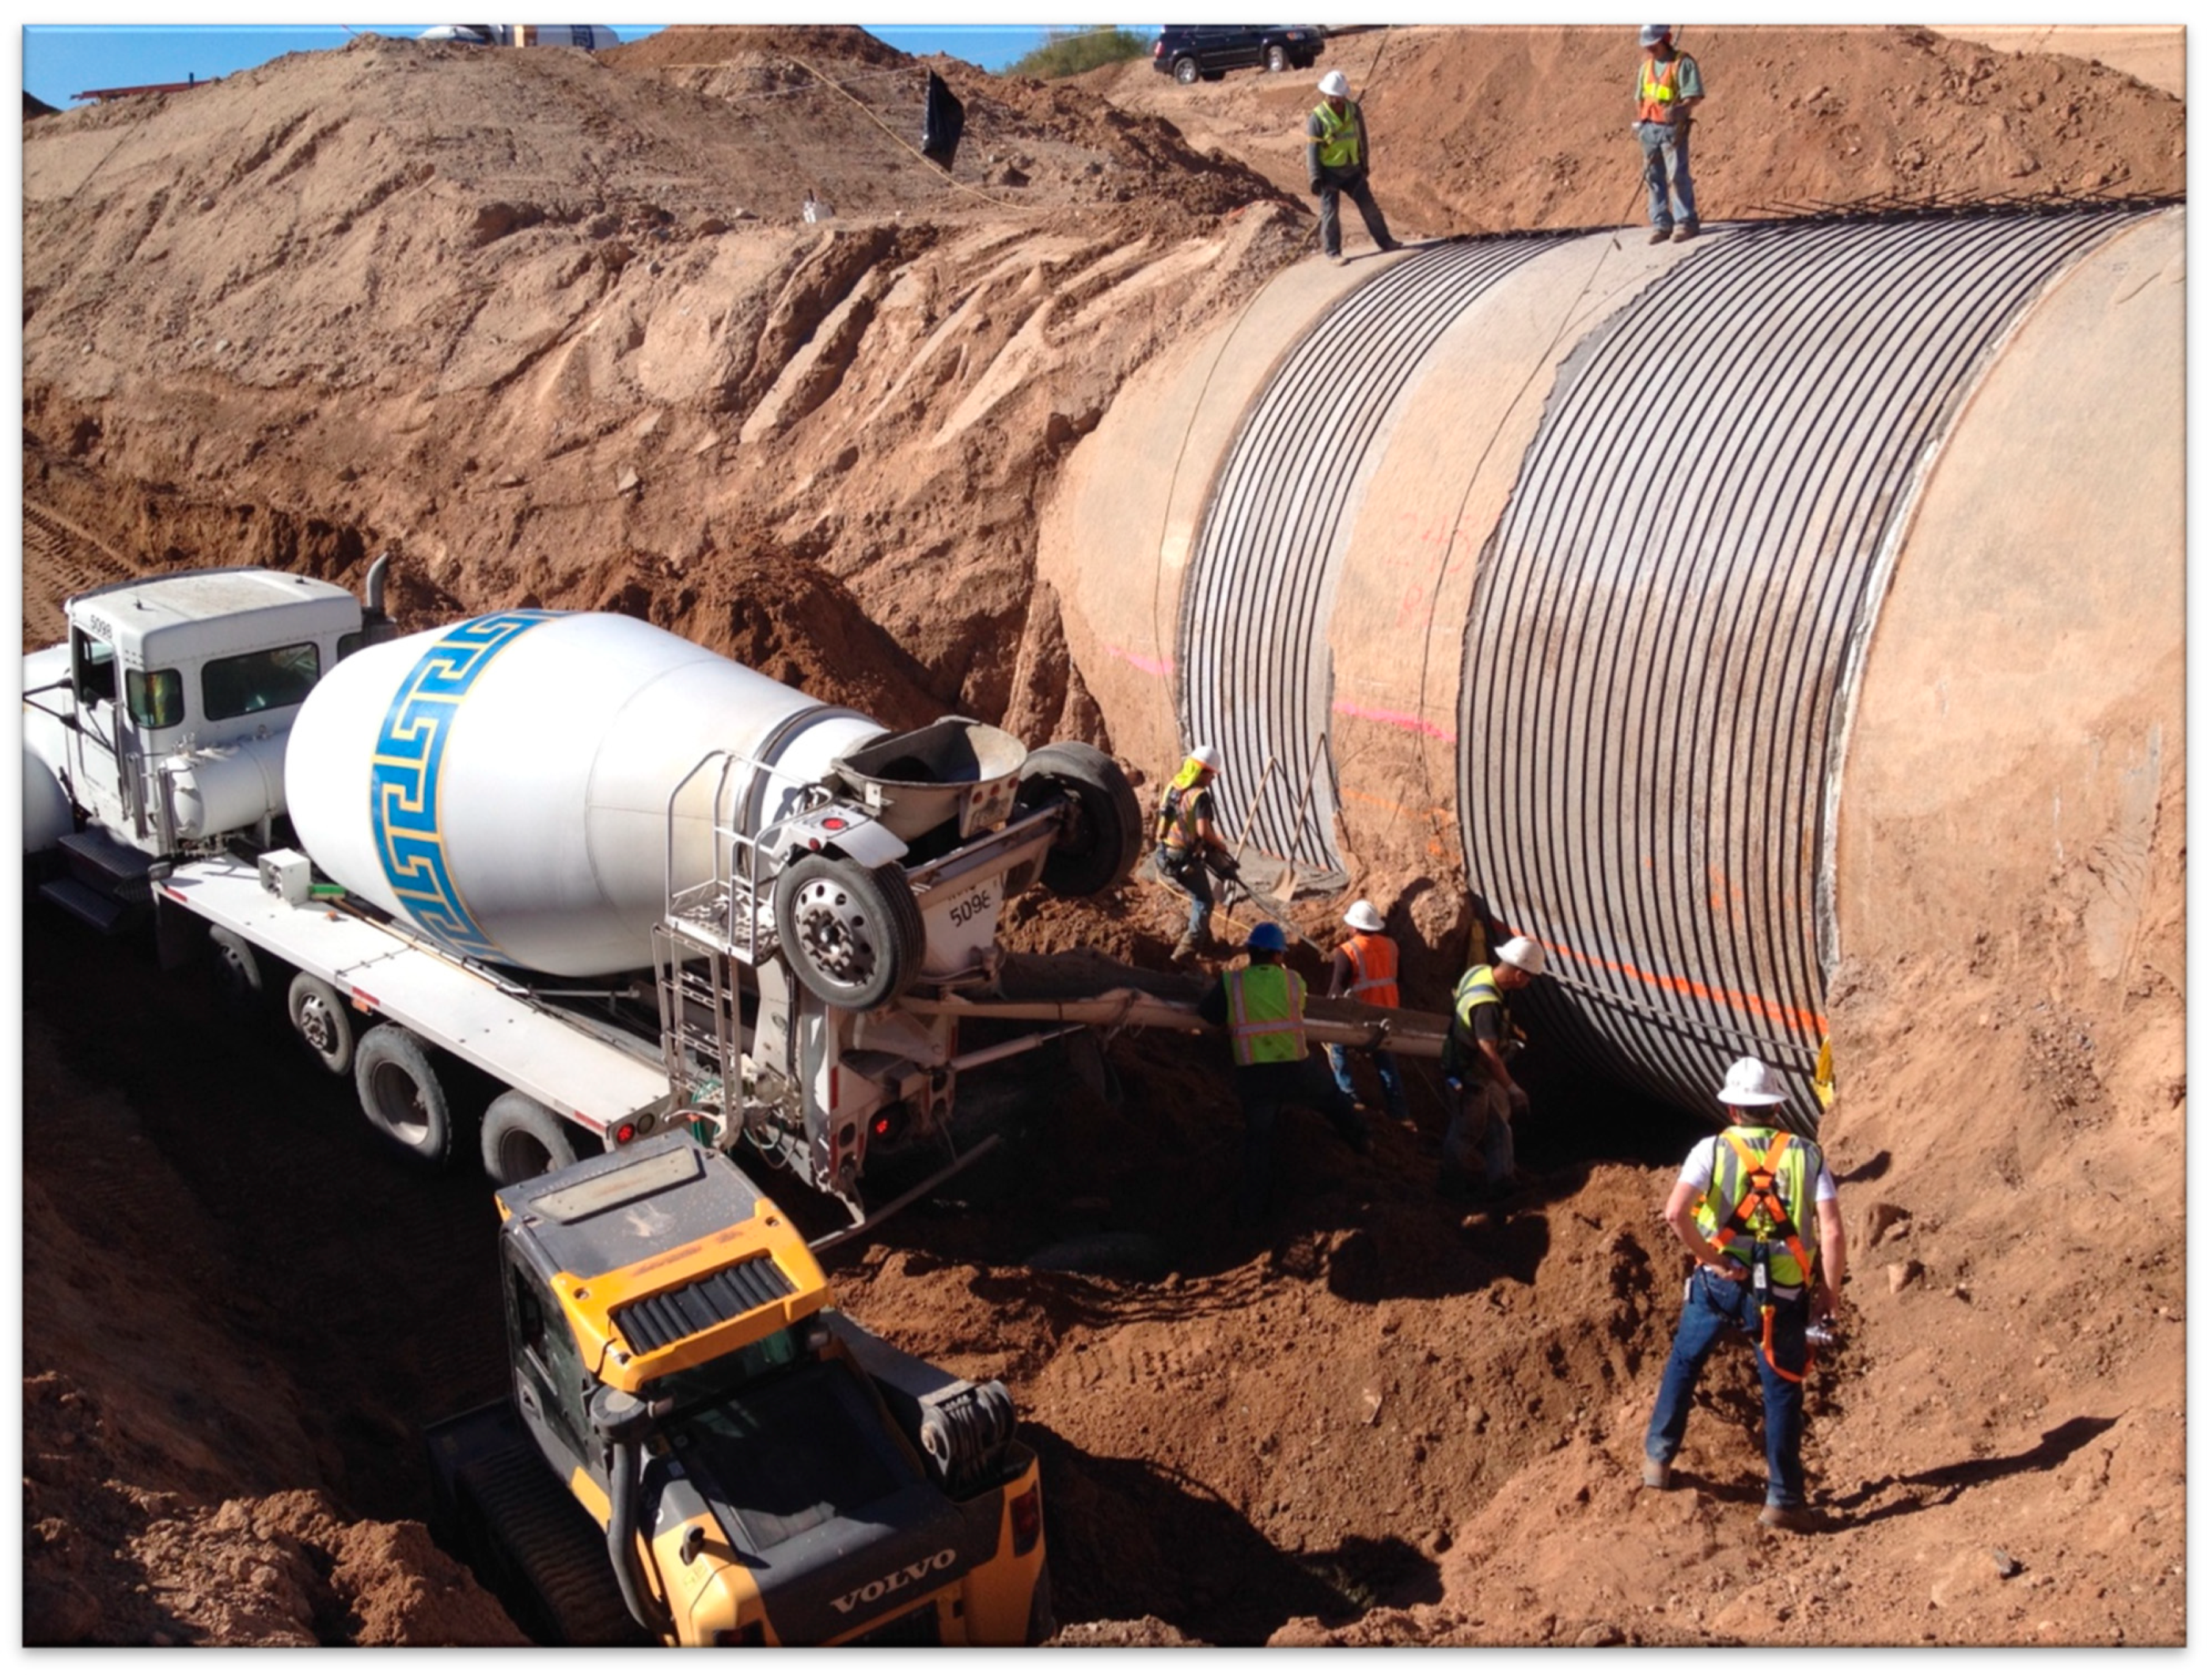
While proactive pipeline maintenance will not always prevent a failure, the relative cost of maintenance compared to the cost of a failure must be considered. In 2014, CAP decided to perform proactive maintenance on a large diameter prestressed concrete pipeline that had several pieces of pipe with a large number of distressed wires. Due to the location of the pipeline (a rural setting under a normally dry wash), a containment failure would not have resulted in adjacent property damage, but it would have resulted in loss of conveyance capability, putting at risk diverting Arizona’s water allotment from the Colorado River, as well as the inability to provide customers with water.
Figure 4 shows planned maintenance activities for a 6.4 m (252 inch) prestressed concrete pipe. This pipeline was intentionally removed from service for repair of nine pieces of pipe and was returned to service in less than two weeks because the agency had been able to plan for repairs based on condition assessment maintenance models, resulting from condition-based monitoring maintenance strategies.
4. Maintenance Activities
There is a fine line between classifying an activity as maintenance versus repair, which can vary from agency to agency. Some may consider performing a structural repair on a large pipe as repair, whereas others consider it part of maintenance. When an asset has a known failure mode, and it is known the asset is deteriorating towards the point of a functional failure, intervening with an activity to prevent that failure and even improving the asset’s condition is considered to be a maintenance activity. However, if the asset were to deteriorate to the point it no longer was able to perform the intended function, an activity to restore the function could be considered as a repair rather than maintenance. The intent of maintenance is to prevent the failure from occurring, not restoring the asset after failure.
There are various maintenance activities that can occur for large-diameter water pipelines, and those activities are dependent on the type of pipeline. For prestressed concrete pipelines, non-structural maintenance activities include inspections, grout repair of the joints, patching of spalled concrete, cathodic protection test station monitoring, cathodic protection system maintenance, close-interval survey, and acoustic fiber optic (AFO) monitoring. Structural maintenance activities include post-tension tendon wrap, brazing or welding of damaged prestressing wires, carbon fiber wrap (internal), and slip lining.
5. Data Gathering/Analyses
Determining the condition of a large-diameter pipeline generally involves manned inspections that require several months, if not over a year, of detailed planning and coordination to establish dewatering and rewatering procedures, safety protocols for entering the pipelines such as confined space programs, ventilation, access, emergency extraction plans, coordinating equipment and personnel, inspection protocols, and ensuring all necessary inspection equipment is available [
35,
36]. Visual inspection is a traditional and essential approach for evaluating the quality of a pipeline’s interior condition. Detailed notetaking, pipe markings, and photography ensure the identification of visible coating degradation and problem areas along a pipe’s length. Quantitative inspection provides measurements of pipe and lining conditions that are not possible by visual inspection alone, and it is the quantitative results that allow for the development and prioritization of maintenance options that consider outage schedules, budget, and maximization of internal lining service life. Information gathered from the inspection includes qualitative and quantitative data that needs to be organized and synthesized into formats that can be analyzed and results interpreted so condition ratings and recommendations can be made for operations and maintenance tasks. A condition rating reflects the combined result of all observed distress indicators for a one-pipe segment [
37].
Different types of pipes require different types of inspection. Steel pipes have corrosion and internal linings that require inspection; they also require analysis of the pipe wall and generally rely on cathodic protection systems for exterior protection that may also have an exterior coating. Concrete pipe material also requires inspection analysis of the walls, as well as inspection of internal components to the wall similar to prestressed concrete pipes, reinforced concrete pipes, and/or other type of concrete pipes with a steel cylinder and reinforcement. Analyzing the cylinder and wire health is critical.
Many utilities across the US use large-diameter prestressed concrete pipe in their transmission systems. While most of this type of pipe has no problems, the predominant failure mode is loss of prestressing wires, generally due to corrosion. Actively monitoring the prestressing wires is one way to ascertain the condition of the pipe, and, with continual monitoring or even periodic inspections, enough data should be gathered to be able to trend the deterioration of the pipe and initiate planned maintenance activities well before a functional failure occurs. Trending analysis is used to predict when a failure may occur and allow the agency to set a threshold of when to enact specific preventative maintenance tasks to prevent a failure.
The Central Arizona Project (CAP) operates and maintains nineteen prestressed concrete pipelines. The three largest diameter pipelines have known degradations of multiple sections, with several being repaired over the last 30 years. To help gather data and understand the condition of the wires, CAP performs limited manned inspections to scan the pipe walls from the interior and also employs an acoustic fiber optics (AFO) condition-based monitoring system to actively “listen” for wire breaks as the pipes are operating. When a wire breaks, the AFO system records the exact time and approximate location along the pipe where the event occurred; the approximate location is accurate to within a meter. Each pipe section is approximately 6.7 m (22 ft) long and is divided into seven approximately one-meter-long “frames”. The wire breaks (also referred to as events) can be graphed over time for the entire pipeline, for individual pipe sections, and by the frame on each individual section of pipe.
Evaluating wire breaks on the entire length of a pipeline may provide some insight on the overall health of the pipeline, but it is the individual pipe segments that need to be evaluated.
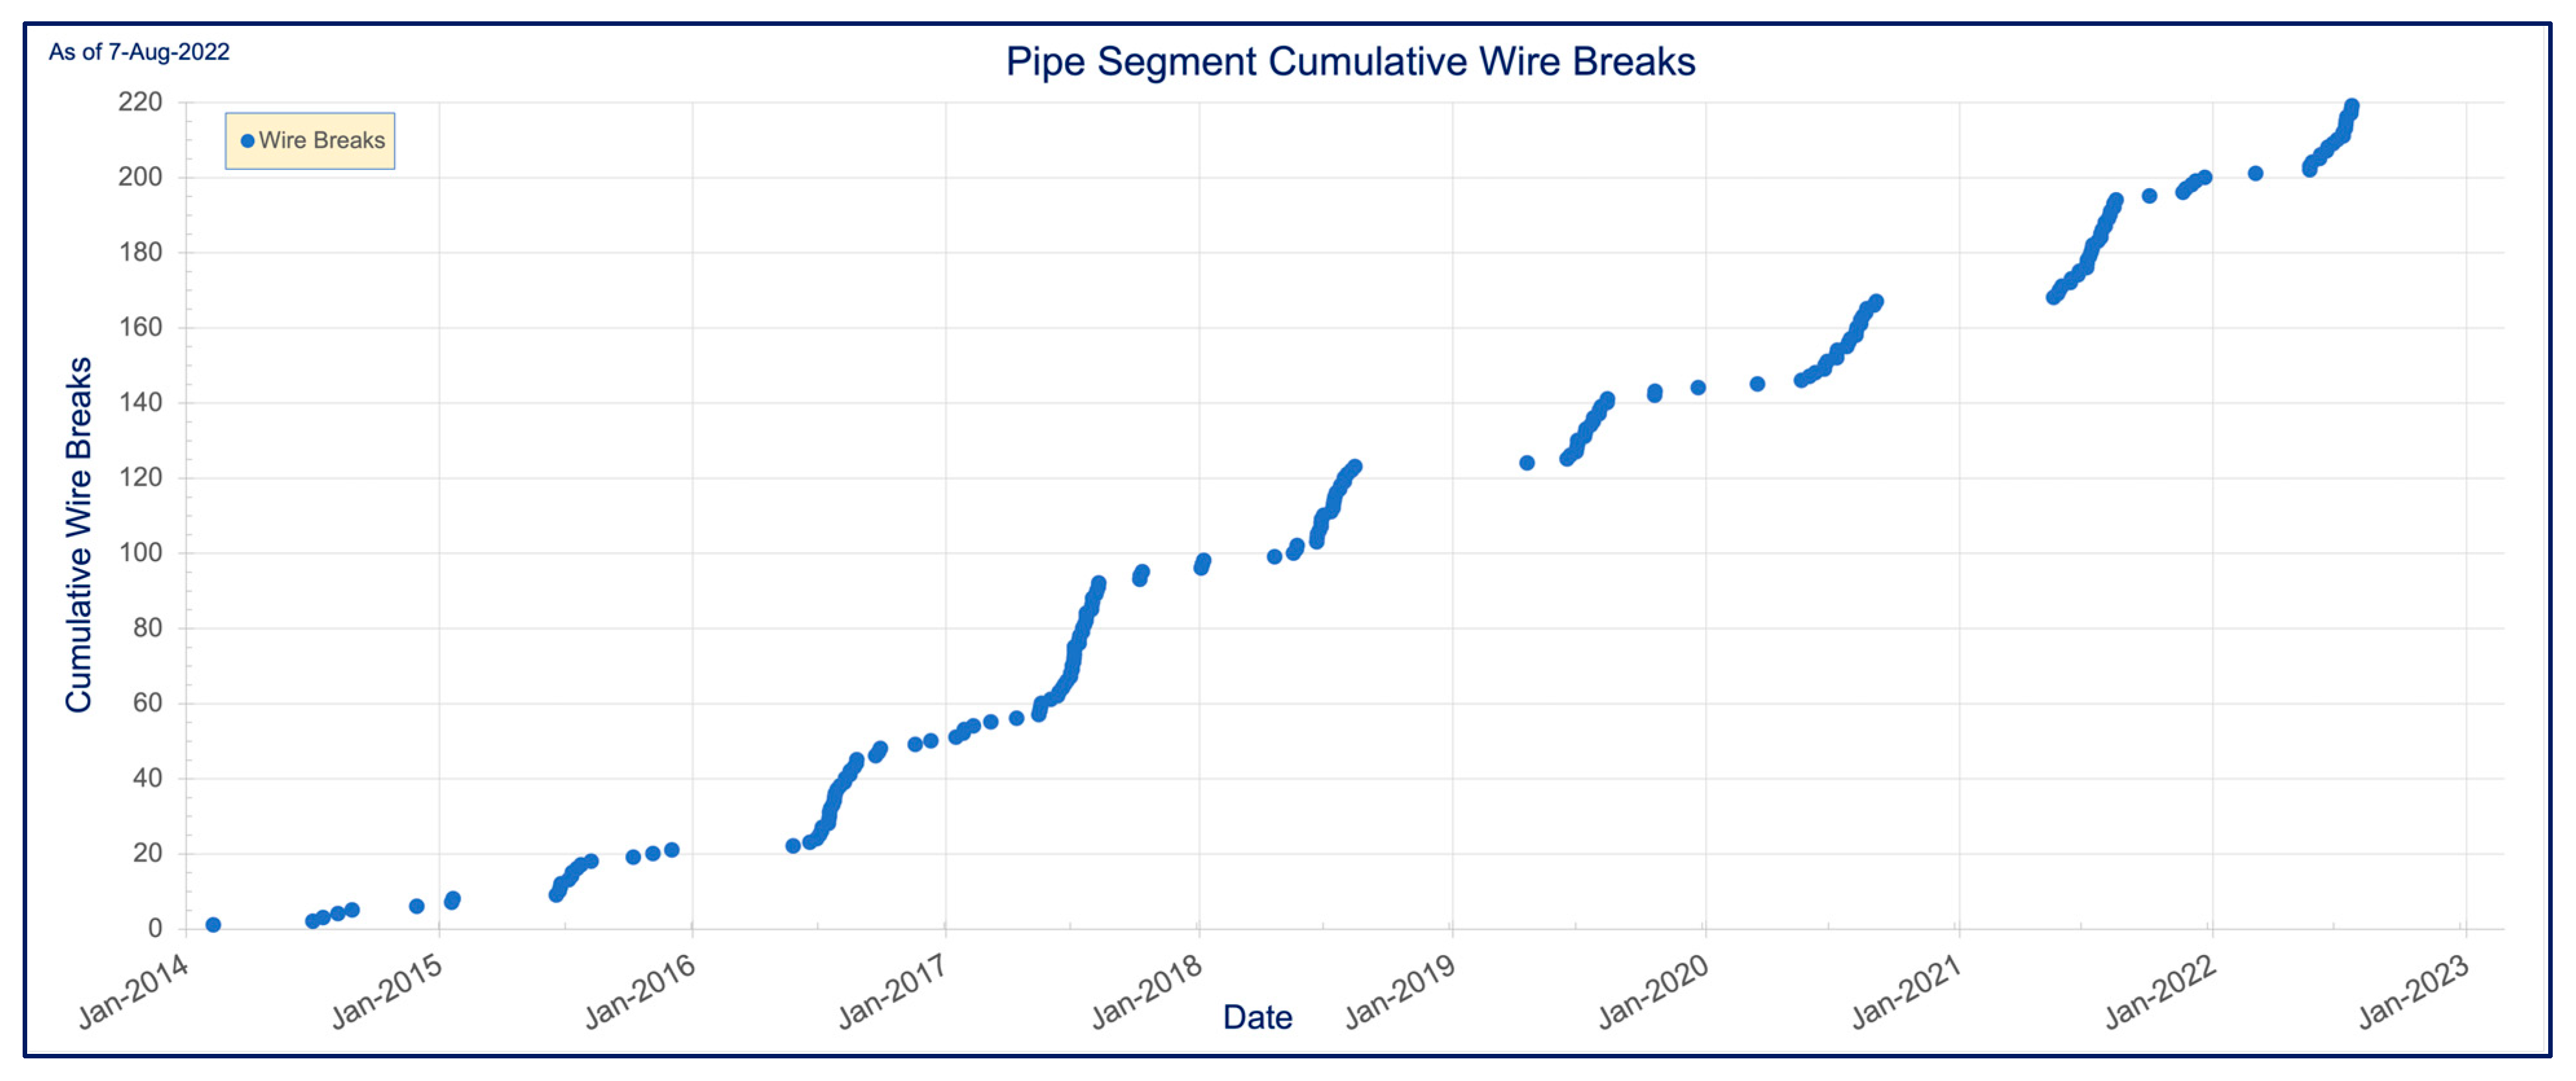
Figure 5 shows wire break events recorded by the AFO system for one section of pipe from a pipeline that has had an AFO system monitoring the pipeline from 2014 to 2022 and is still in service. There is a noticeable growth in the wire breaks over time, and it is apparent the wire break rate increases during the hotter summer months compared to the cooler seasons. However, even these data are not detailed enough to decide when to perform maintenance tasks. Subsequently, further refinement and analyses of the wire break events are necessary.
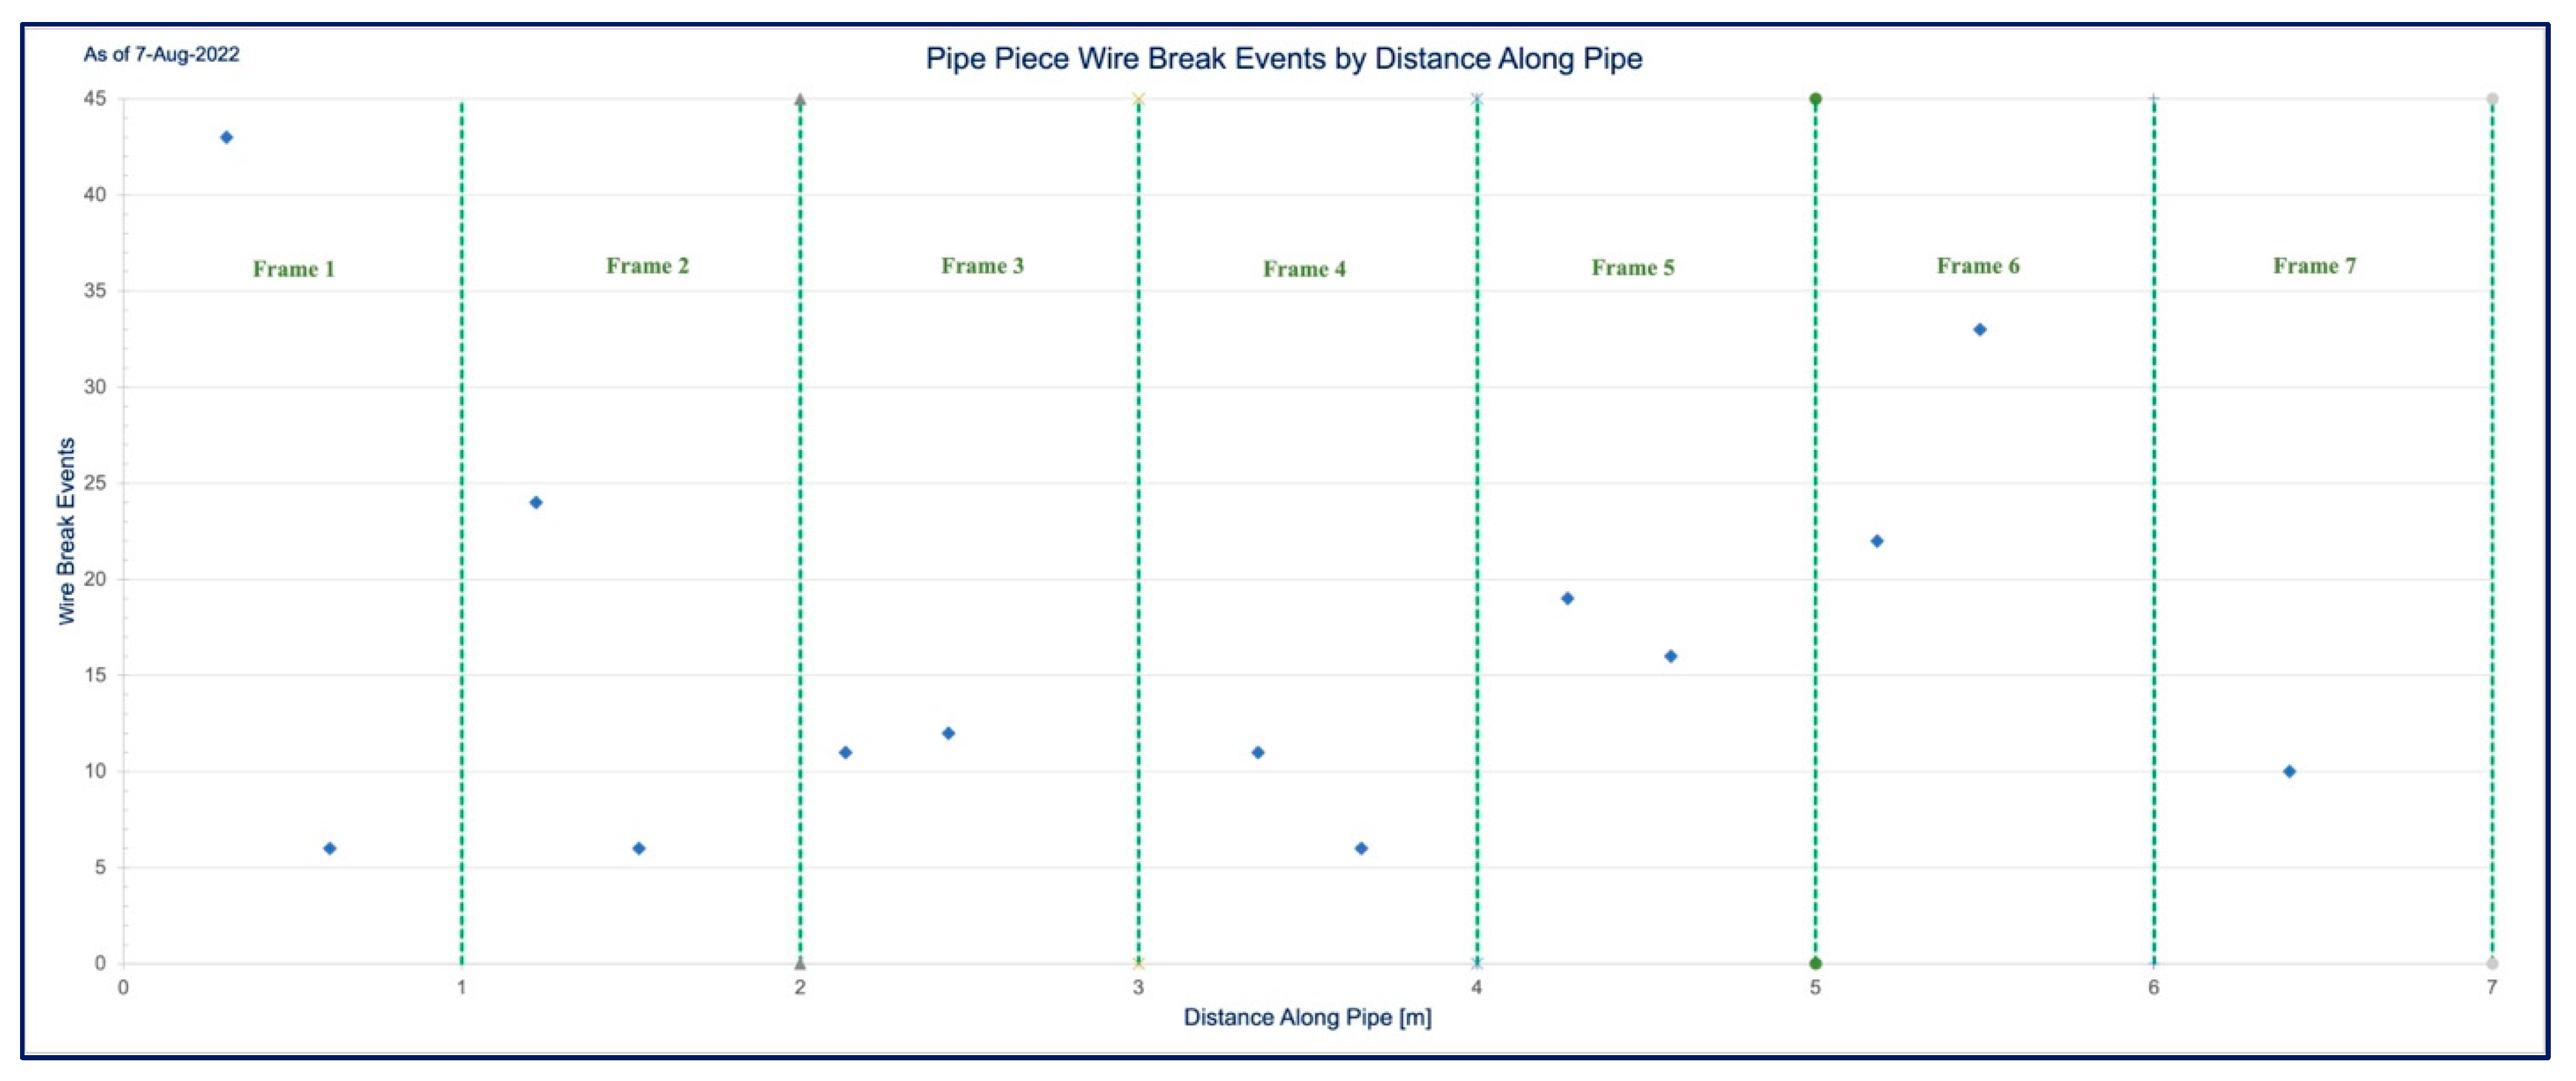
The wire breaks can be further graphed on the pipe section by the frame in which the event occurred.
Figure 6 shows the same pipe section with the wire breaks graphed by location along the pipe section and the frames delineated, Frame 1 through Frame 7.
Between July 2015 and August 2022, the first frame of the pipe section experienced 49 wire breaks, whereas the sixth frame experienced 55 wire breaks. These were the two most active areas along the pipe.
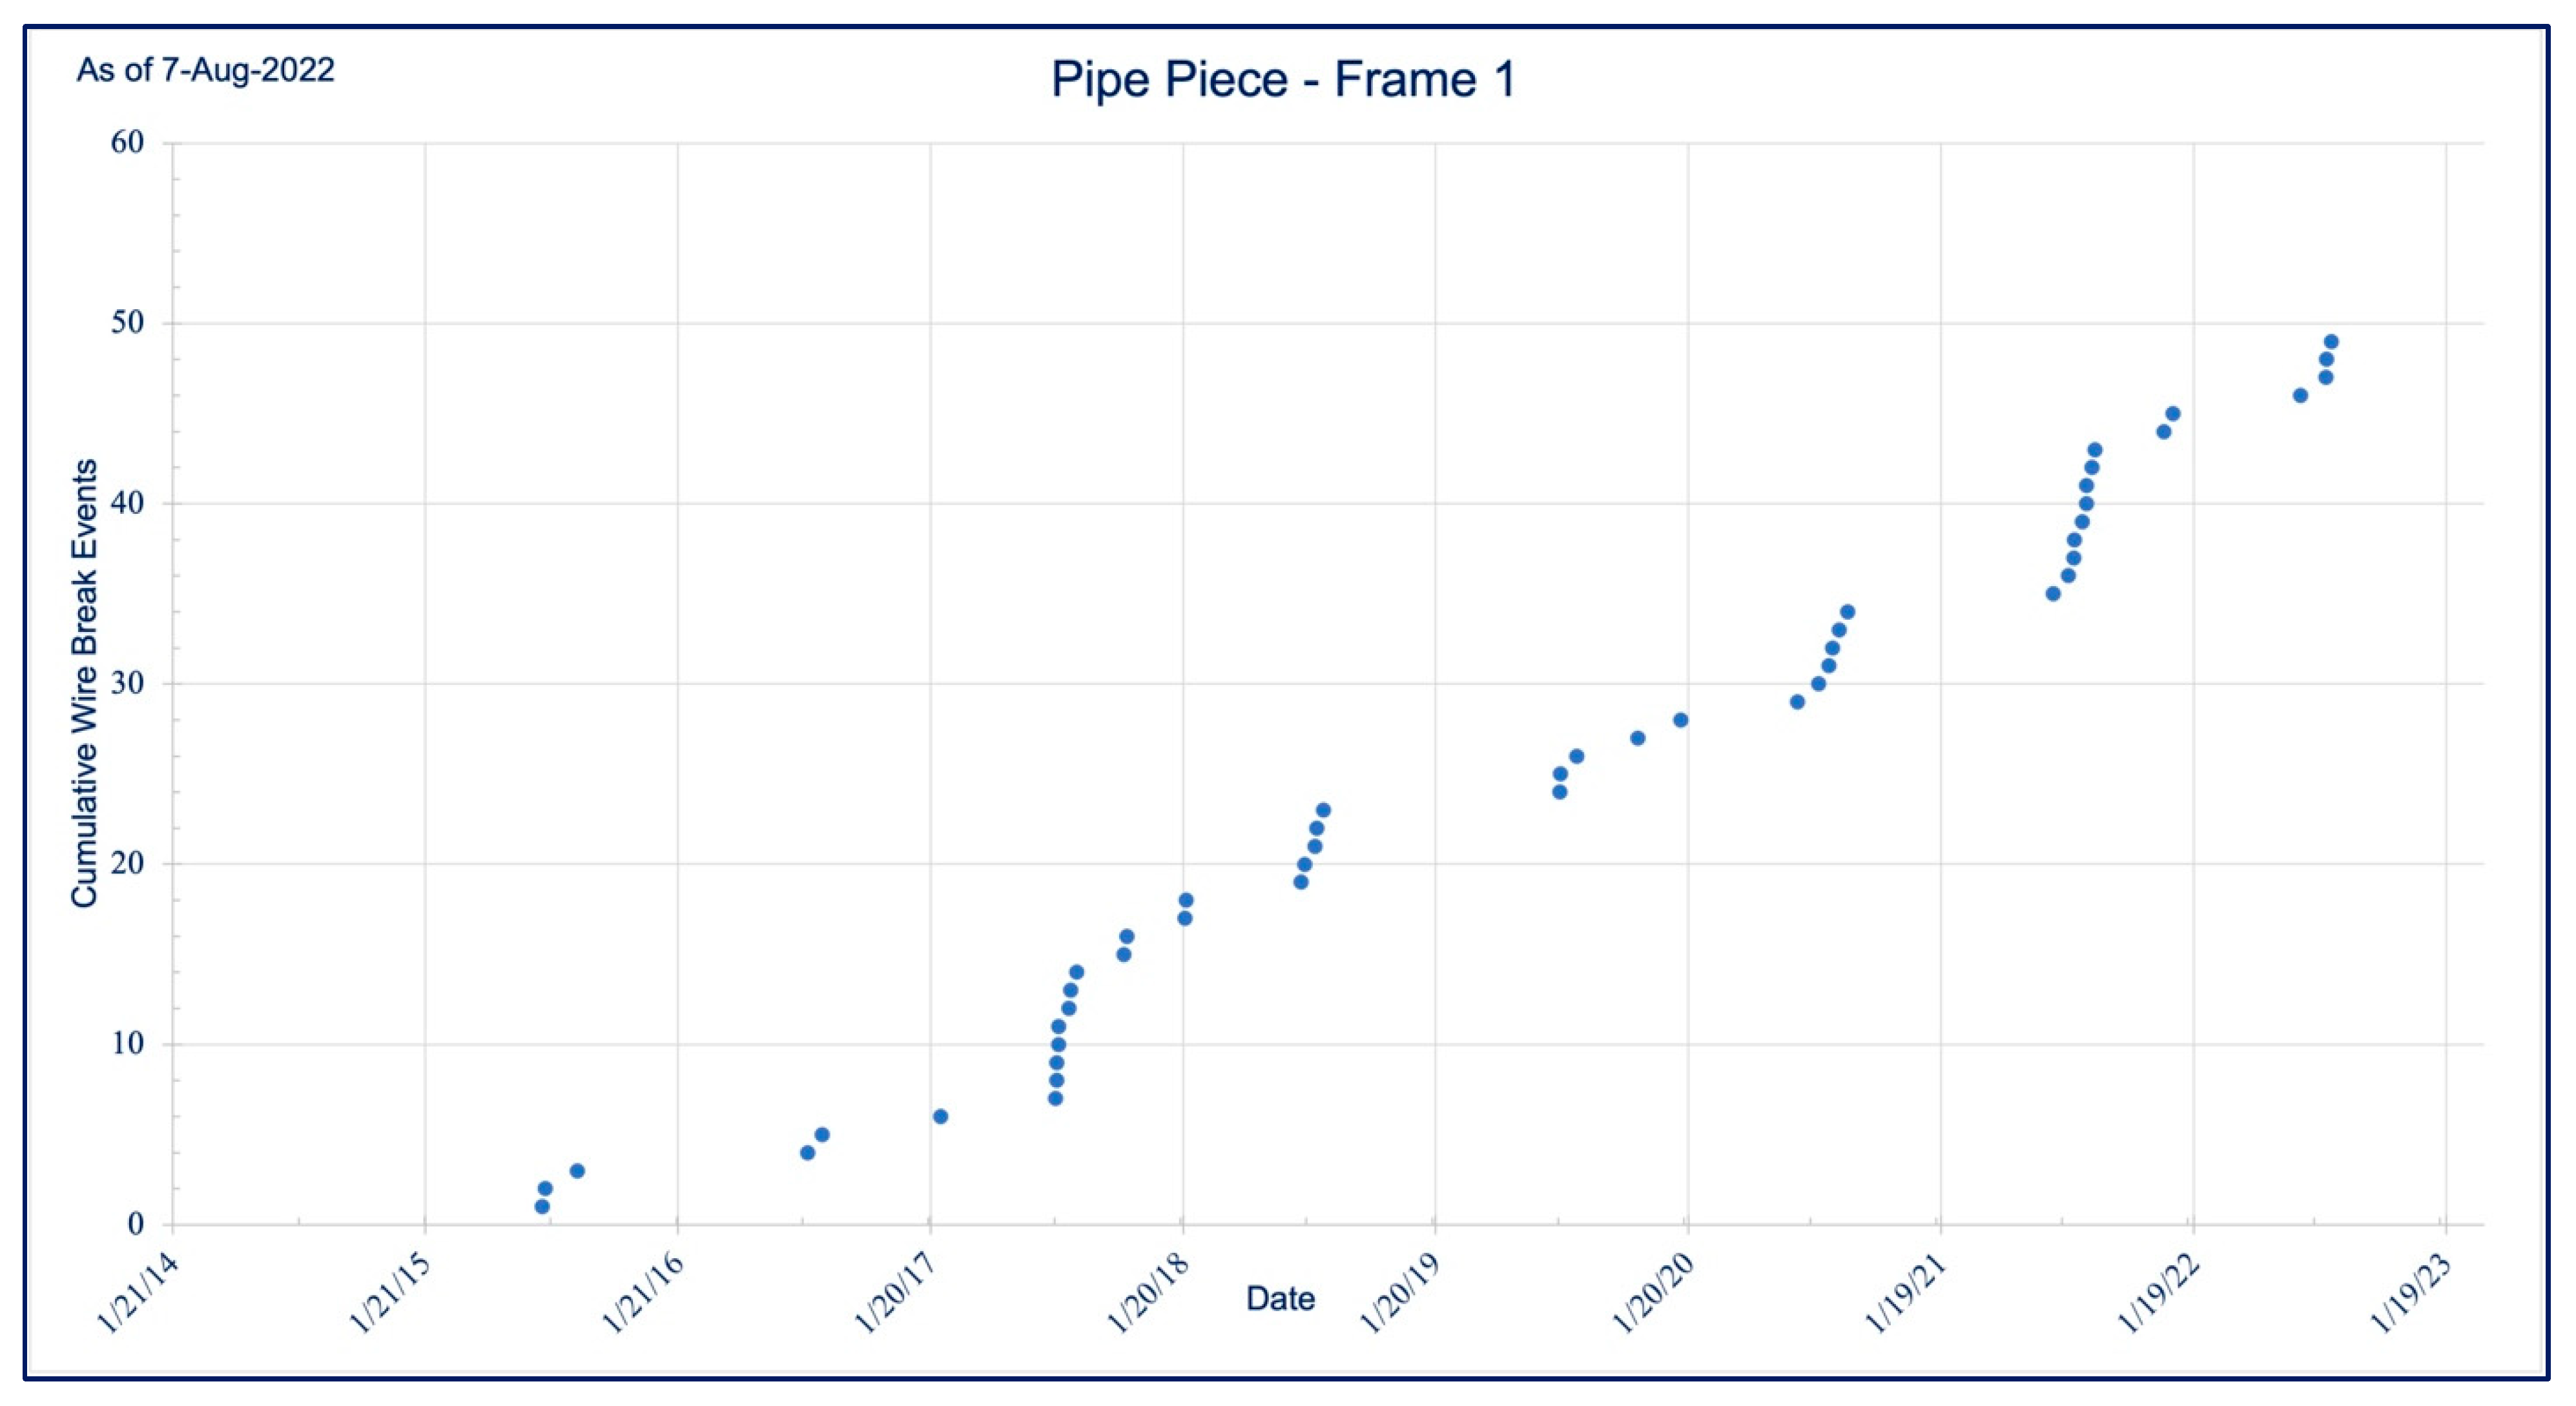
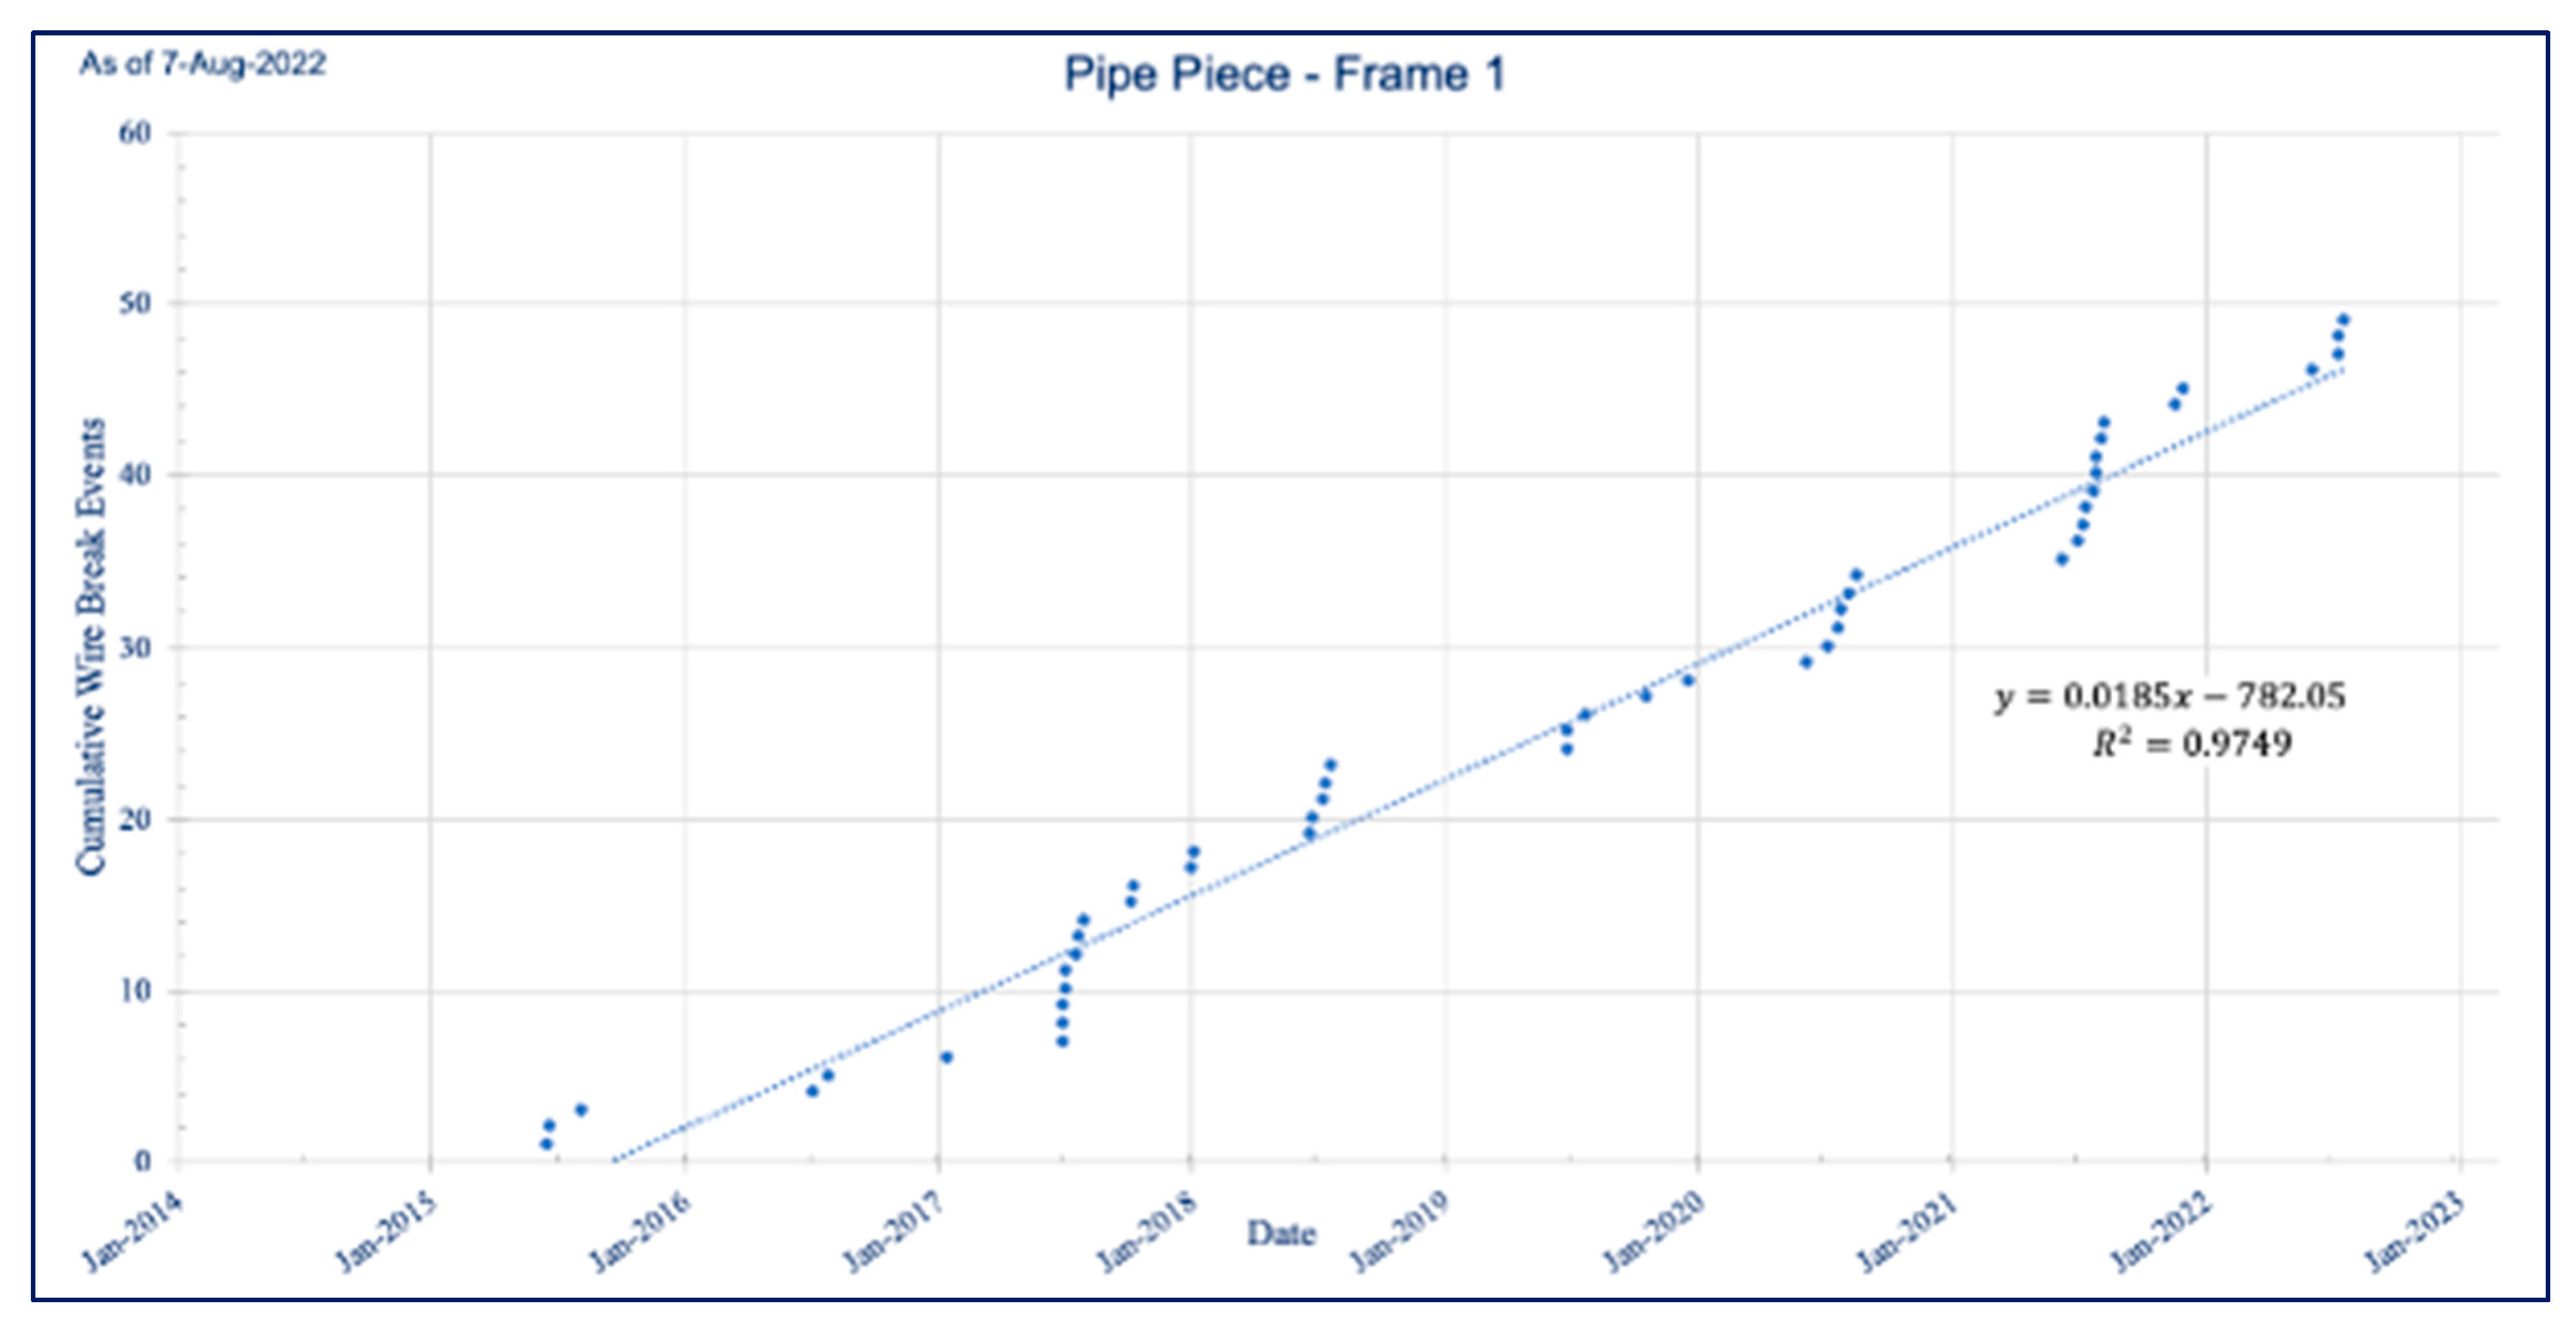
Figure 7 shows the wire break events for the first frame, and, as seen in
Figure 5 for the full pipe segment, the growth in wire breaks over time with an increase in events during the summer months is evident.
To add to the complexity of analyzing the broken wire data, the large-diameter prestressed pipes have two layers of prestressing wires. Currently, there is no proven technology that can differentiate on which layers the wires are broken. Field investigations have revealed the inner wrap to be competent even when the outer wrap has failed. This has most likely led to premature repair of some sections of pipe.
Counting the number of wire breaks on a pipe section is not enough to determine if maintenance needs to be performed. The number of wire breaks needs to be evaluated over the length of pipe based on the pitch of prestressing wires. The length of pipe with broken wires is referred to as the “broken wire zone” (BWZ), described as a distance. If an electromagnetic inspection has occurred on the pipe, those results also need to be included in the evaluation of the BWZ. The BWZ is merely the distance along the pipe where wires are broken. It is possible to have multiple BWZs along a single section of pipe. BWZ is then evaluated on a rating curve (also referred to as a failure curve) that is calculated for the specific pipe class. Failure curves corresponding to limit states for the pipes evaluated herein were developed through finite element modeling [
38]. For the large-diameter pipelines in the CAP inventory, the failure curves are based on both layers being broken, and the BWZ length considers both layers of wires. The rating curves have specific limit states unique for that pipe class.
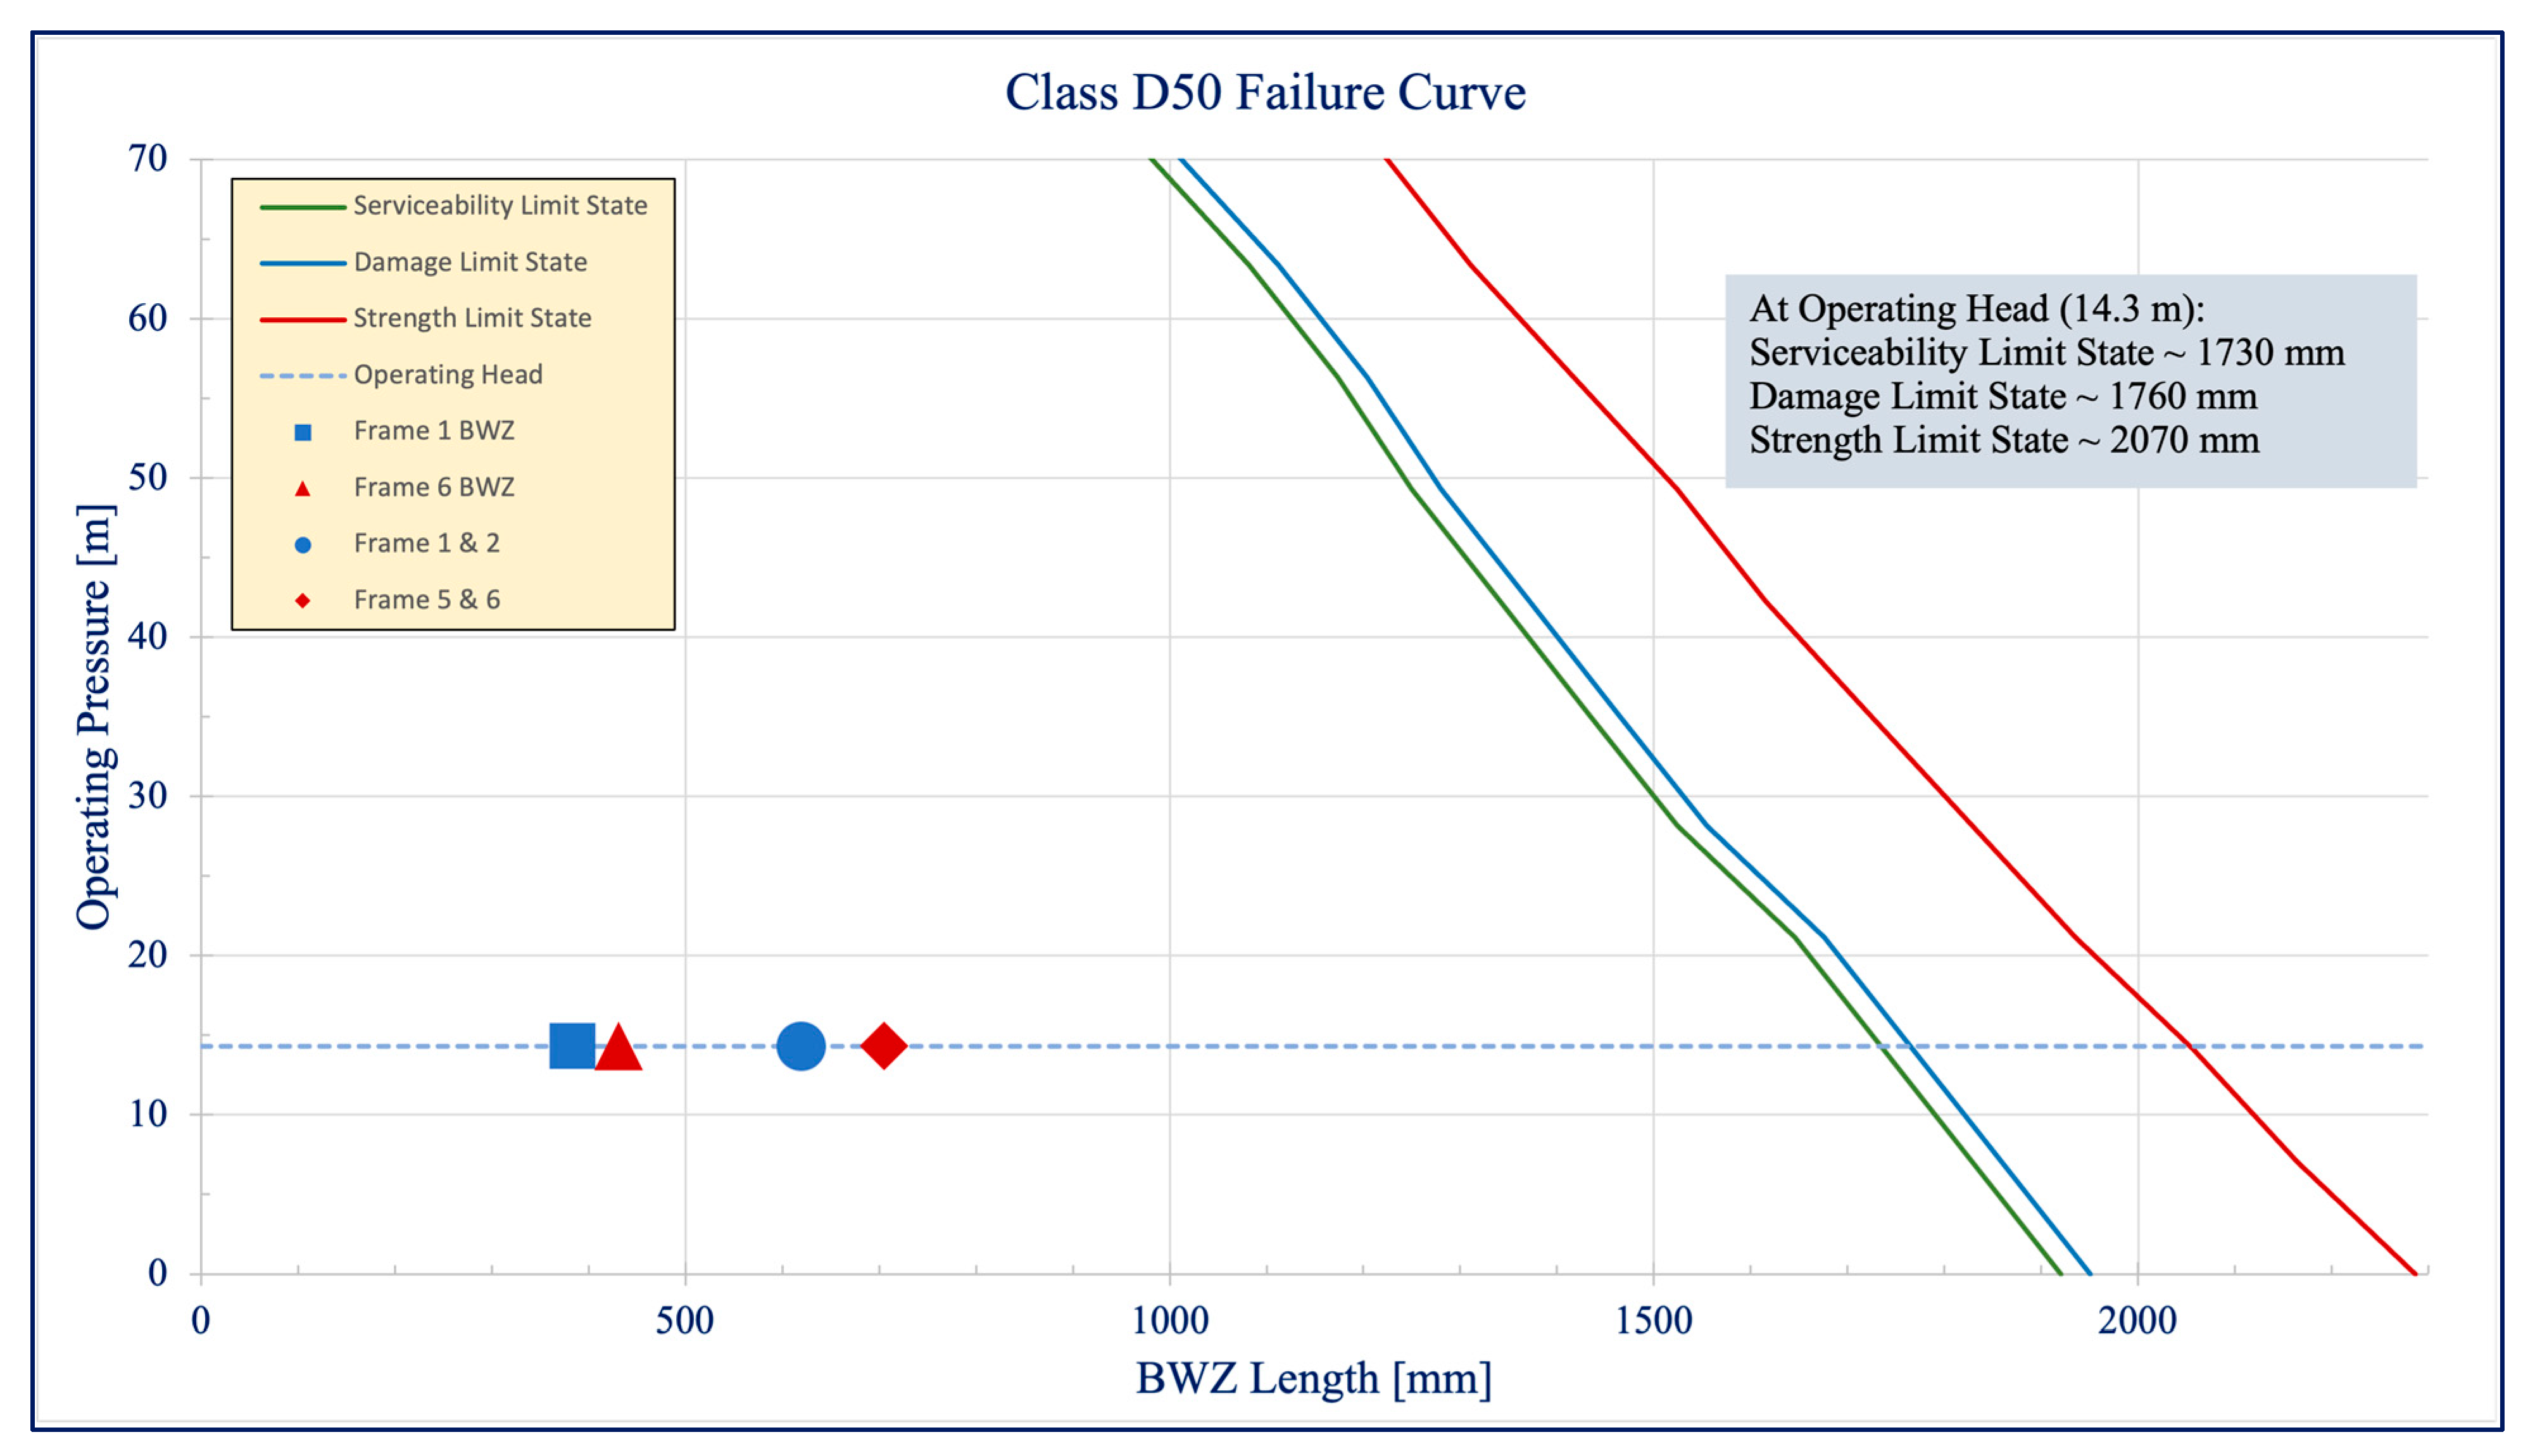
Figure 8 illustrates a rating curve for a pipe section with the three limit states indicated. Those limit states are defined and described as:
Serviceability Limit State: There is visible cracking in the interior of the pipe;
Damage Limit State: There is visible cracking in the exterior of the core at springline or an increase in wire stress adjacent to the broken wire zone by 20 ksi;
Strength Limit State: There is severe leakage through a fully cracked core, concrete crushing, or progressive prestressing wire failure.
Figure 8.
Class D50 Failure Curve.
Figure 8.
Class D50 Failure Curve.
As the prestressing wires break, the BWZ length increases, or a new BWZ may begin. The length of the BWZ is plotted on the rating curve for the operating pressure of the pipeline. The intent from graphing and trending the AFO recorded events is to predict when the BWZ length may intersect the Serviceability Limit State. One preventative maintenance task is to begin planning and budgeting for maintenance on a pipe section when the BWZ reaches 50% of the Serviceability Limit State. Another is to change the frequency of analyses when the BWZ reaches 30% of the Serviceability Limit State.
The number of wire breaks can be plotted on a failure curve developed for the section of pipe based on the pipe class. Forecasting wire breaks in a time series framework can estimate when the pipe might reach such a level of distress that it is time to begin planning and budgeting for repair, and when to schedule and take the pipeline out service for maintenance. Customers can be informed an outage is forthcoming, and the outage can be scheduled and planned, rather than forced.
The BWZ must be calculated based on wire breaks in a single frame and in adjacent frames, not merely adding the entire number of wire breaks on a pipe section.
Table 2 lists the wire breaks by frame for the pipe segment shown in
Figure 5. The number of wire breaks in each frame is converted to BWZ length within the frame, based on the pitch of the prestressing wires. The table presents the number of broken wires recorded by the AFO system by frame, the overall percent of broken wires represented by the frame, (e.g., Frame 1 contains 22.4% of all the broken wires in the pipe section), percent of wires in the frame that are broken, (e.g., 40.1% of the wires in Frame 1), and the estimated BWZ.
Now that a BWZ has been calculated, it can be plotted on the rating curve graph and compared to the limit states introduced above.
Figure 9 shows the results of the BWZ for Frame 1 and Frame 6, as well as adding the BWZs from adjacent frames with the greatest number of wire breaks to “see where they fall” on the curves. All four BWZ data points fall well short of the Serviceability Limit State.
From
Figure 9, the BWZs that equate to the Serviceability and Damage Limit States for the given operating head are approximately 1.74 m (5.7 ft) and 1.77 m (5.8 ft), respectively. Due to the length of time it can take to plan maintenance outages and design and budget for work, an agency may set thresholds as to when to initiate certain work. The Damage Limit State and the Serviceability Limit State are only mm apart; thus, the decision was made to plan for a repair when the BWZ approached a certain percentage of the Serviceability Limit State [
39].
The RCM analysis process broke pipe sections into frames and analyzed sections by the frames, focusing on regions of distressed wires. If not, the pipe section discussed previously had 219 breaks, essentially at the serviceability limit, which would infer it is beyond time to take action. By analyzing the section by frame, the analysis broke the pipe down into “distressed” regions. This enabled analysis of the section more closely, thereby gaining more service from the pipe before undertaking potentially expensive and intrusive maintenance tasks.
6. Condition Assessment
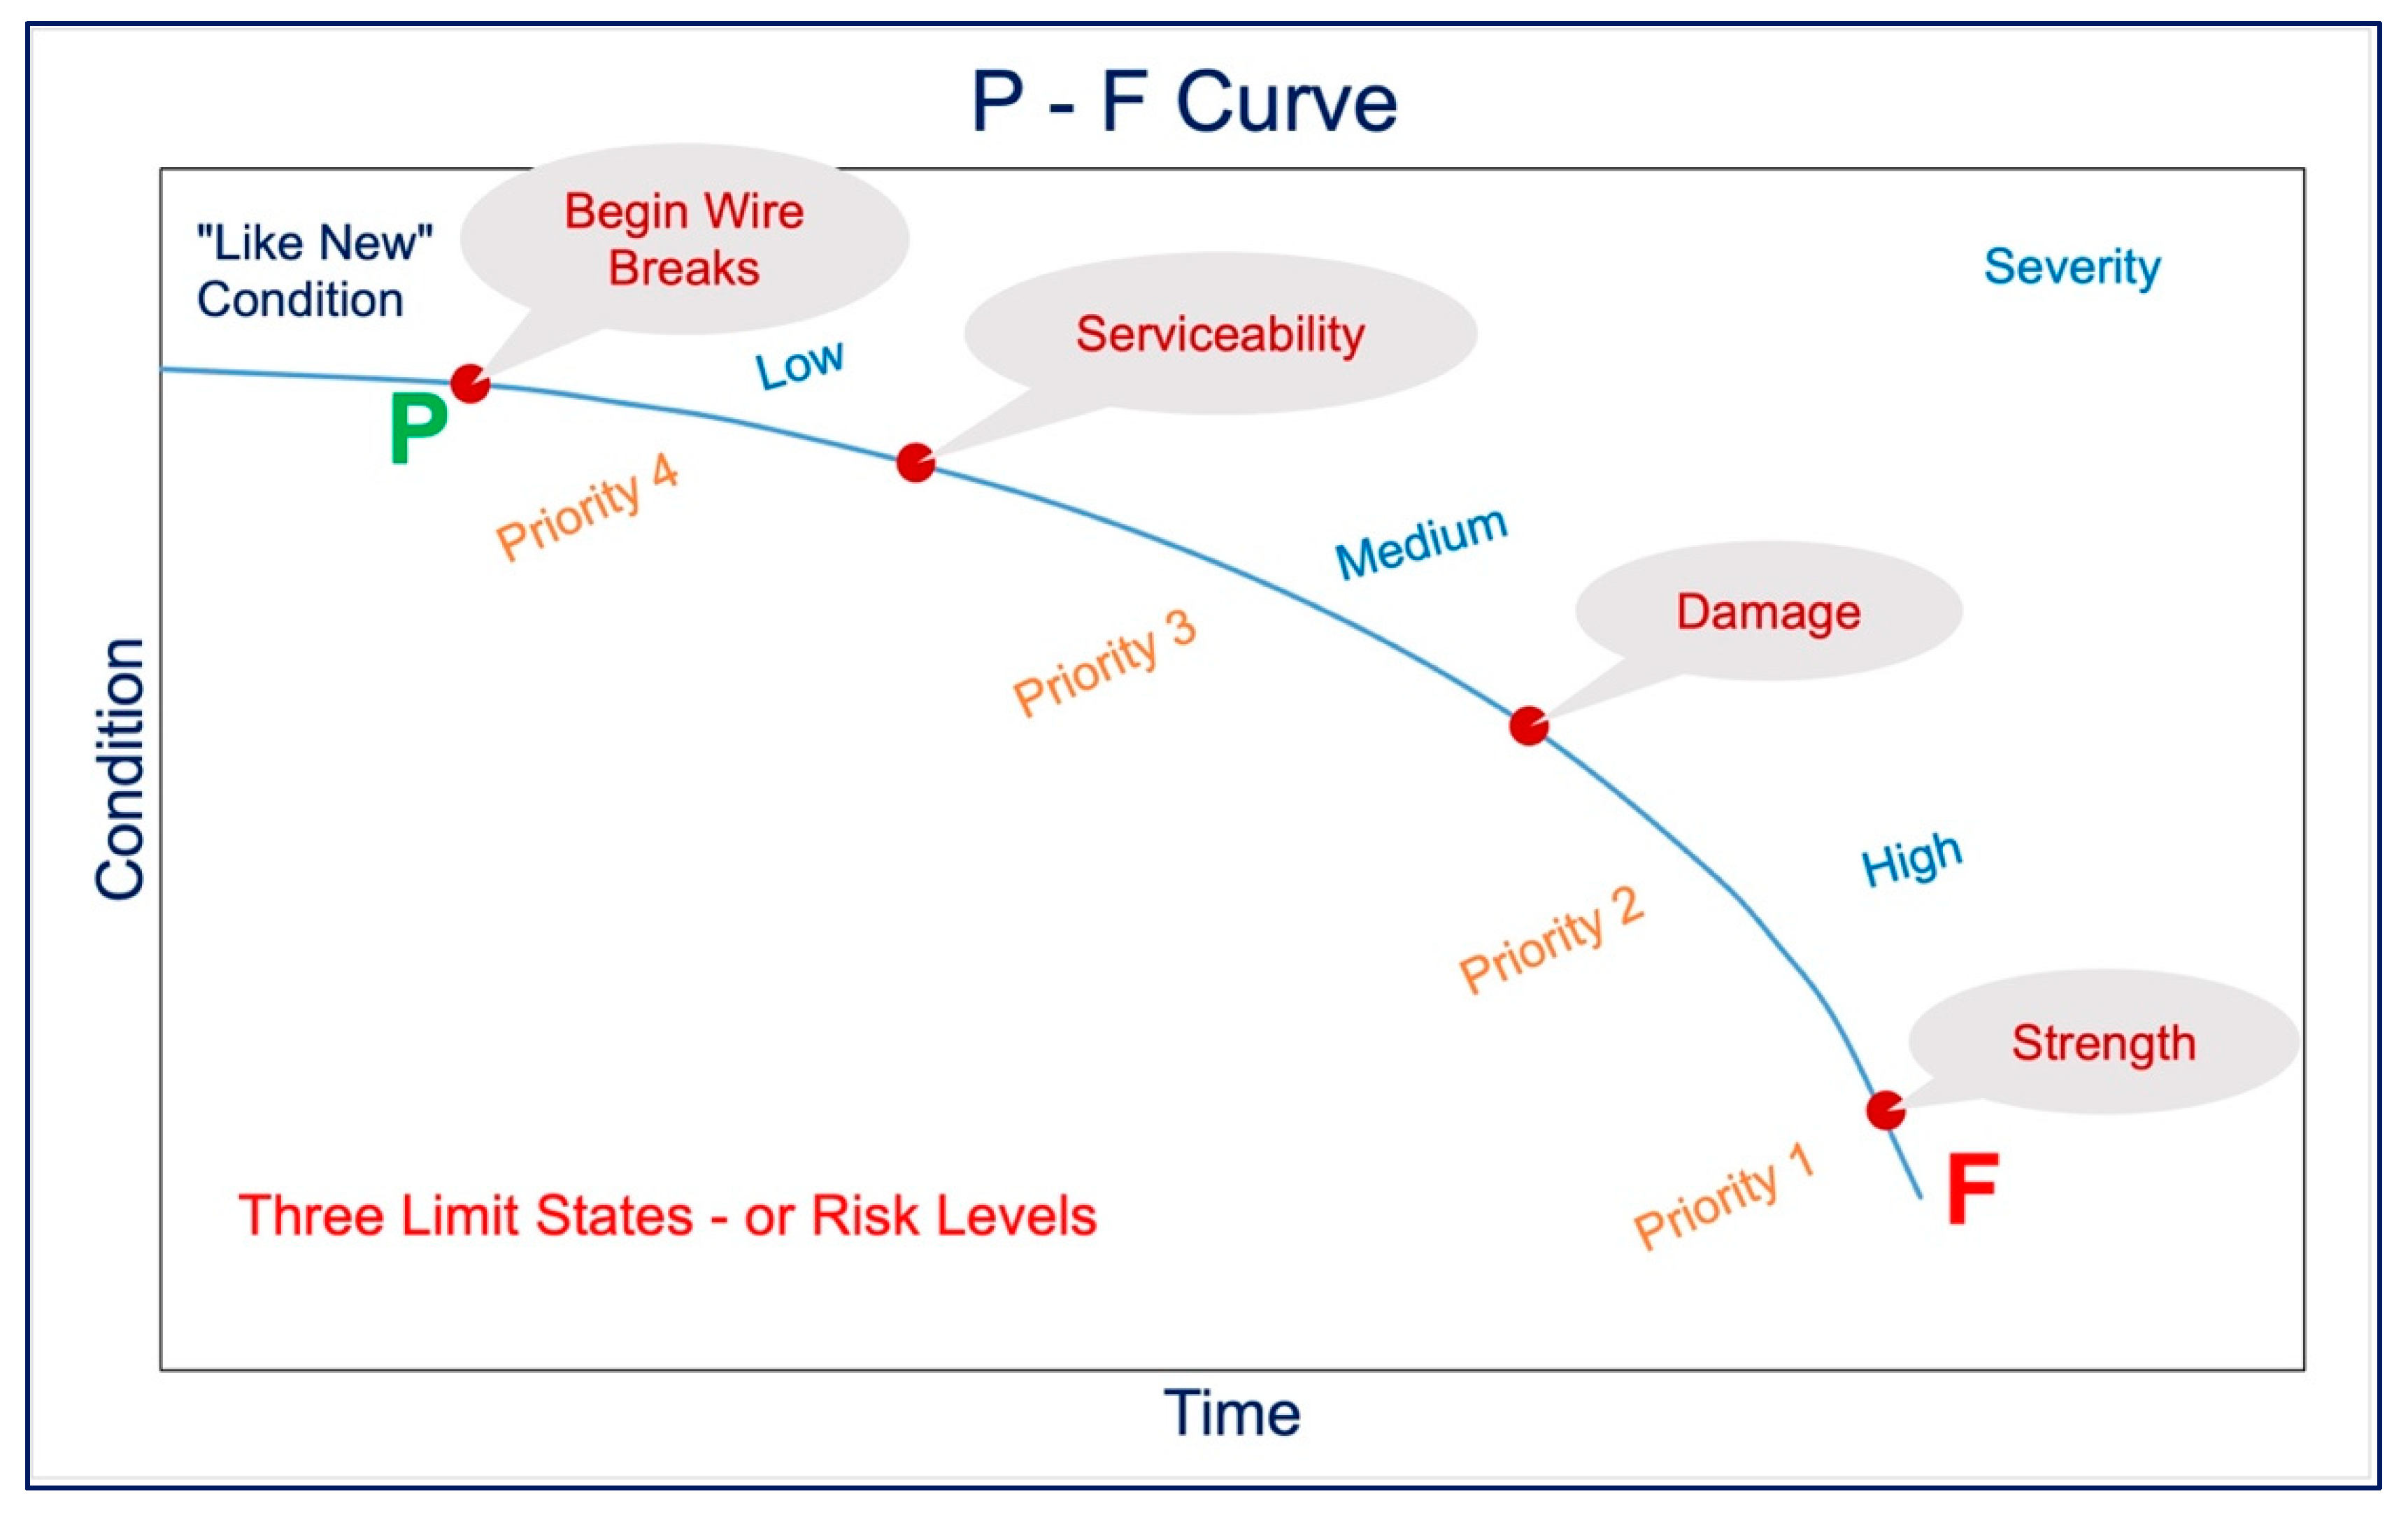
The well-known English idiom, “a chain is only as strong as its weakest link” is easily translatable to a pipeline; “a pipeline is only as reliable as its most distressed pipe section”, or “a water transmission system (aqueduct system) is only as reliable as its weakest pipeline”. Predicting time to failure and having a maintenance plan set in place prior to failure is the ultimate goal of any maintenance strategy. Consider the P-F curve illustrated in
Figure 10. The P-F Curve was developed during the RCM to communicate the fitness of the pipelines’ potential condition over time. When the pipeline (or any component) is first installed, it is considered to be in “good” or “new” condition and can be thought of as 100% reliable. As time progresses and wires break, the reliability (or availability) decreases. At some point along the curve, a pipe section (or sections) will require some form of maintenance. The number of broken wires, or more appropriately the length of BWZ will place the pipe section’s condition at a certain point on the curve. To better understand where a pipe section may lie along the P-F curve, the limit states defined previously can be overlayed on the curve as shown in
Figure 10. Each of these material conditions represent advancing stages along a pipe section P-F curve, with the Strength Limit State representing functional failure.
The P-F curve is one of the most important tools for a Reliability-Centered maintenance plan. It demonstrates the path to failure, illustrating various condition points and can be used to schedule maintenance activities. A potential failure is an identifiable condition that indicates a functional failure is imminent; imminent does not necessarily translate to immediate. A functional failure is the inability of an asset to meet a specified performance standard or function. Another way to consider it is that a functional failure also includes the inability of an asset to function at the level of performance that has been specified as satisfactory. This definition implies that functional failure is an identifiable and measurable condition, a concept that changes how assets are inspected.
The ability to identify either a potential or functional failure depends on three factors:
clear definition of the functions of an asset and how it relates to the system or operating context in which the asset operates;
clear definition of the conditions that constitute a functional failure;
clear definition of the conditions that indicate that a failure is about to occur.
The task of maintenance is not to repair something when it fails, but rather to avoid failure. Some failures are due to normal causes and cannot be avoided, such as belts or bearings failing due to normal wear on a motor. In maintenance, the task is to maintain physical assets in such a way that the consequence of failure can be avoided regardless of the cause. Minimum wear, deterioration, or contamination is not necessarily a problem; a lot of wear, deterioration, or contamination is almost always a problem. If the consequence of failure is small or negligible, the strategy of “run-to-failure” or “no-planned-maintenance” may be selected as the maintenance strategy, especially if performing a task costs more or has more negative consequences than doing nothing. However, if the consequence of failure is not negligible, for example, a large-diameter water pipeline failing, it will almost always be worth the effort to detect the failure “process” as early as possible before the failure, so a corrective action may be taken to either avoid the failure or reduce its consequence.
7. Decision Making Process
As previously stated, the intent of maintenance is not to repair an asset after it has failed, but rather prevent a failure from occurring. The ability to predict when an asset will fail can provide an agency with a timeline as to when to begin planning for specific maintenance tasks. The amount of time taken to perform the maintenance tasks, the time required to assemble the appropriate tools, the time to budget for the task, and the time to schedule an outage and remove the asset from service can all be planned, scheduled, budgeted, and executed on a proactive timescale, rather than reactive after a failure. In the case of a pipeline, it may be the difference between customers having water or having to quickly find another source.
The decisions from the RCM analysis performed by CAP on the large diameter prestressed concrete pipe are:
CAP’s asset management strategy is to monitor the progression of wire breaks and plan, schedule, budget, and perform necessary maintenance prior to functional failure;
Each recorded wire break will be apportioned to one of seven frames along the pipe section;
Each wire break will be assumed to occur on a different individual coil (i.e., multiple breaks will not be considered as occurring on a single coil);
Wire breaks will be assumed to occur first at the outer wrap;
- ○
When the number of recorded wire breaks exceeds the number of outer wire wraps in a frame, it will be assumed that the wire break activity has progressed to the inner wire wrap;
BWZ length calculations shall be based on wire break counts in single frames or adjacent frames;
As the Serviceability and Damage Limit States are approximately the same, and the Strength Limit State occurs within one additional foot of BWZ, CAP will plan, budget, and schedule the maintenance of pipe pieces once the pipe piece experiences at least 10% of a BWZ length of duel outer and inner wire wraps toward the Serviceability Limit State;
- ○
A total of 100% of outer wrap in a fame is broken, and 10% of the inner wrap is broken (i.e., equates to 55% of wires broken in a frame or in two adjacent frames since BWZ could span frame boundary);
BWZ length calculations comprise wire break counts in non-adjacent frames and will be considered if a calculated BWZ exceeds 50% of the Service Limit State;
- ○
A total of 100% of outer wrap in a fame is broken, and 25% of the inner wrap is broken (i.e., equates to ~65% of wires broken in non-adjacent frames);
When a frame is estimated to have lost an entire outer wire wrap, the pipe section Condition Assessment grade will be downgraded to a C—“Worn”—condition to be assessed for increased monitoring frequency and analysis;
As wires break, the remaining wires will experience increased loading, and the subsequent wire break rate may accelerate significantly.
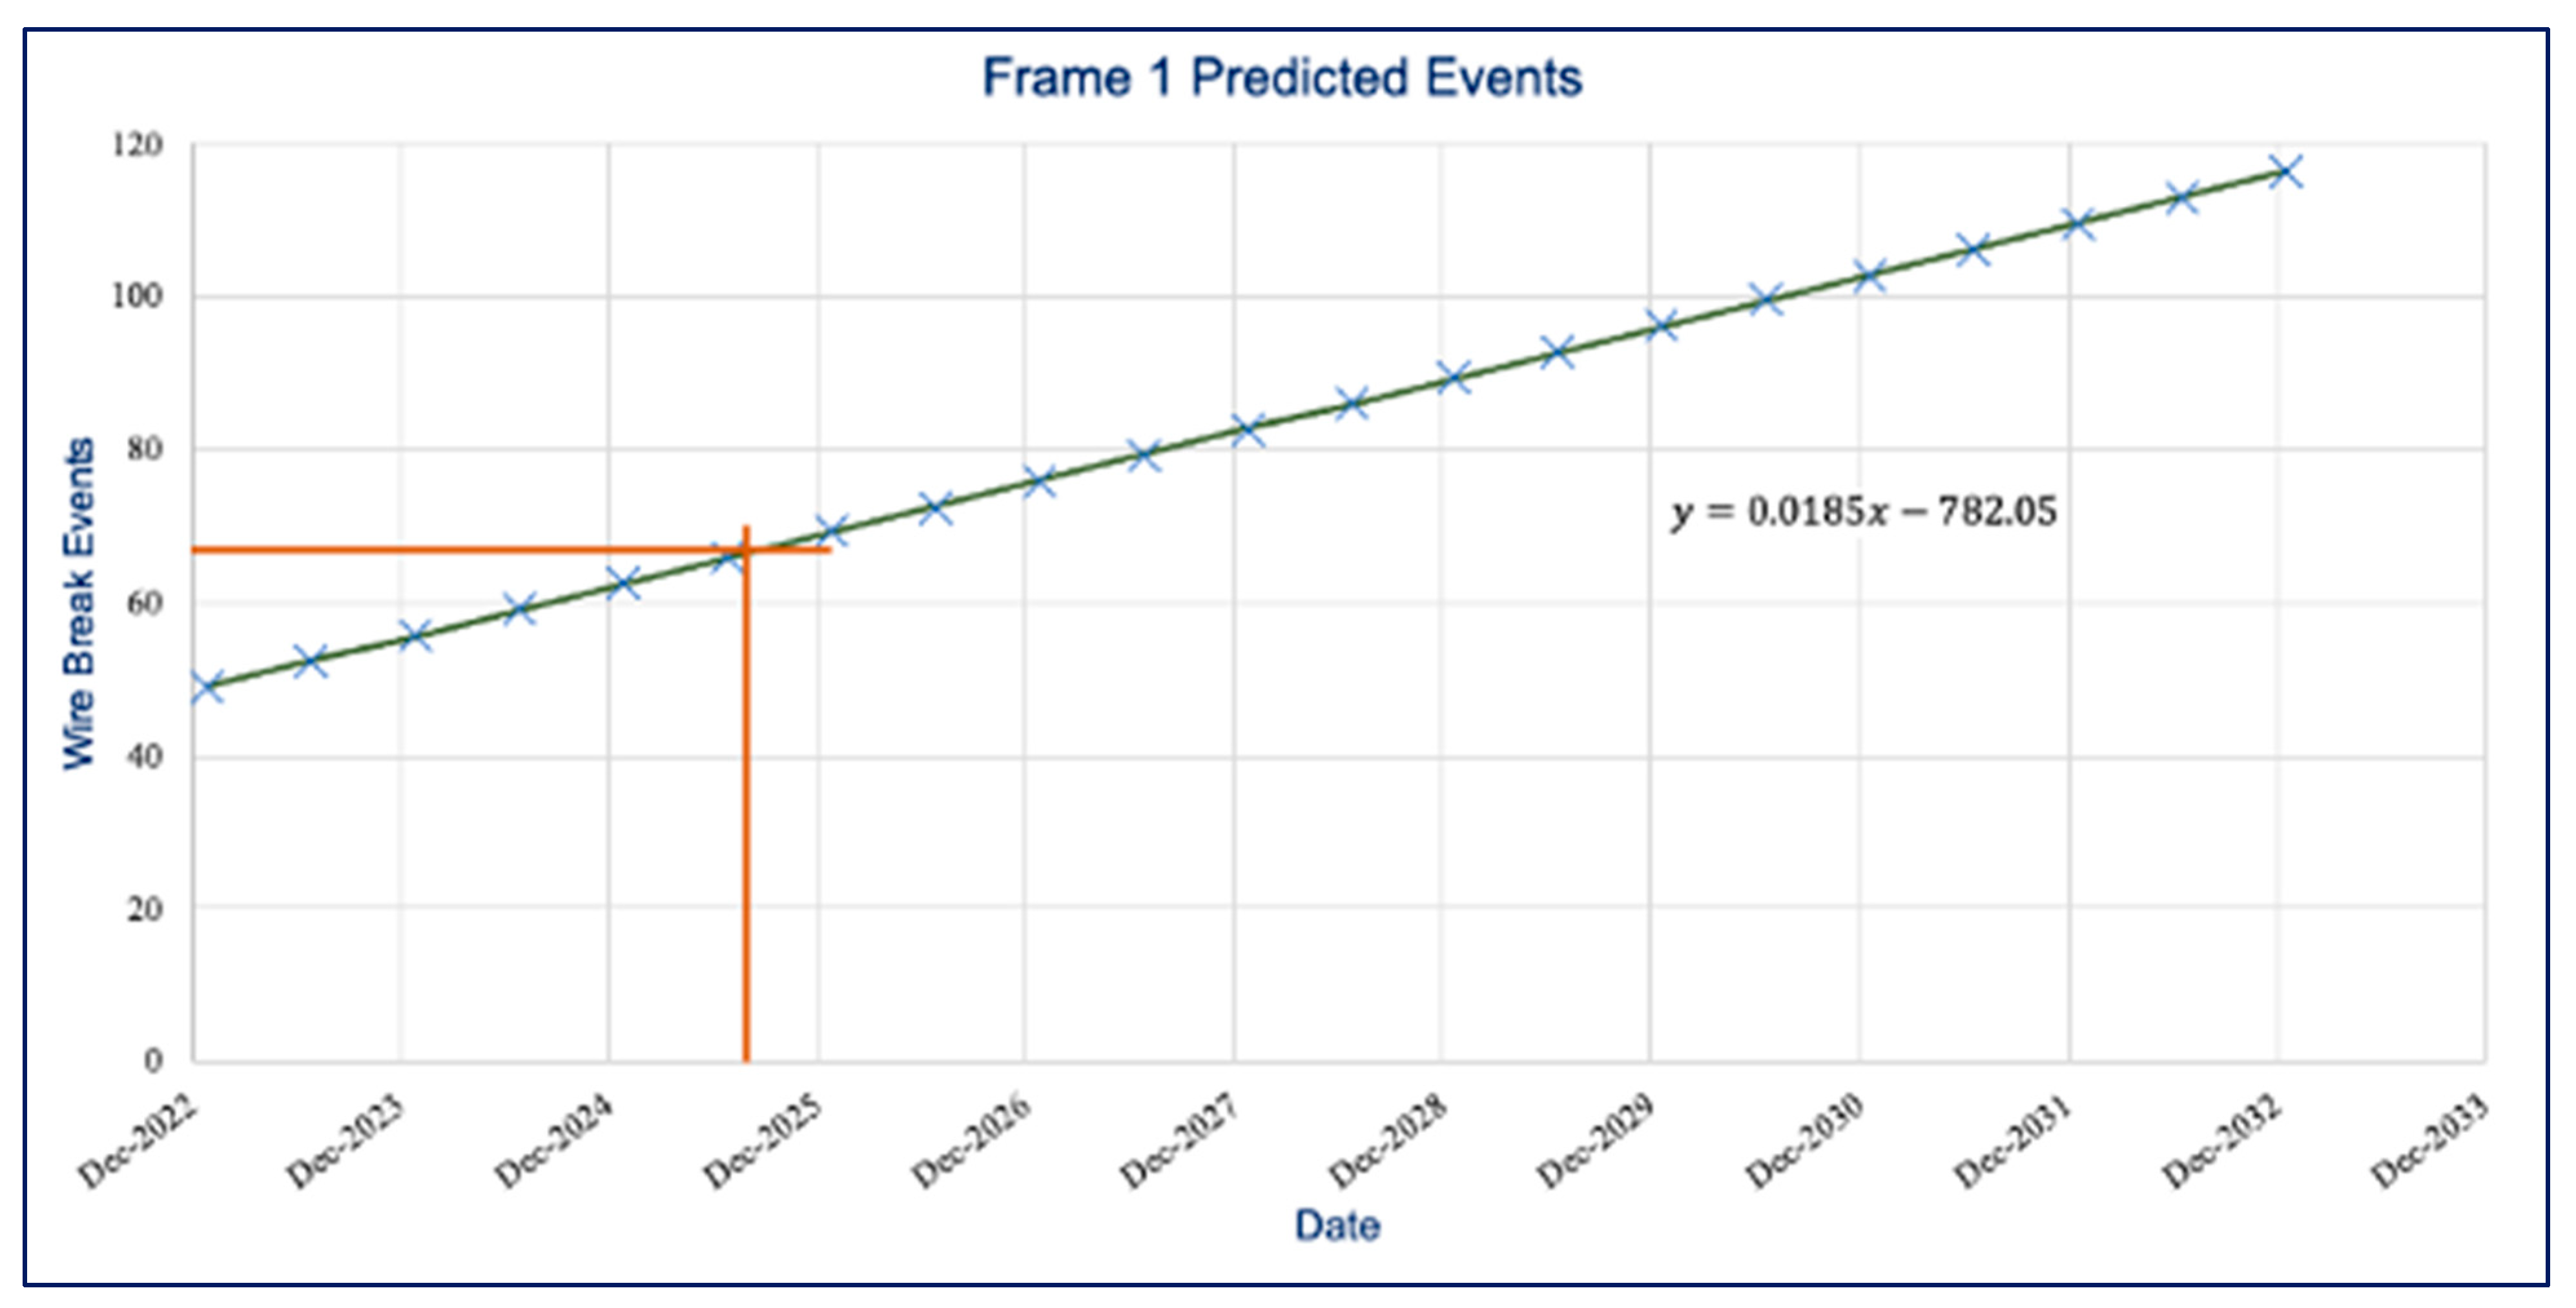
Consider the CAP pipeline previously discussed. Knowing the Serviceability Limit State is reached when 1.74 m (5.7 feet) of a pipe piece is distressed, it was decided during the RCM to begin planning for maintenance tasks when the BWZ reached 10% of the Serviceability Limit State, based on the criteria above established in the RCM. Due to the dual wraps of prestressing wire on the pipe, when 100% of the outer wrap wires are broken, and 10% of the inner wire wrap is broken, the BWZ shall be considered to have reached 10% of the Serviceability Limit State. Referring back to
Table 2, it is clear that has not happened. But knowing when the piece may reach 10% of the Serviceability Limit State (equivalent of 55% wires broken in the frame) will help the agency with planning and budgeting. The criterion of 10% of Serviceability Limit State equates to a BWZ length of approximately 518 mm (1.7 feet), or 67 wire breaks. Referring back to the wire breaks shown in
Figure 6 and using the data, a regression analysis can be applied to the data and then used to predict, or estimate, when 67 wire breaks may occur, based strictly on the data gathered over the previous eight years.
Figure 11 illustrates the wire breaks trending over time with a regression analysis used to estimate when the broken wires in the frame may reach the 10% of Serviceability Limit State.
Figure 12 can be used to estimate when a the 10% of Serviceability Limit State will be reached, when to begin planning for maintenance, and the budget cycle to schedule work. The figure indicates 10% of the Serviceability Limit State will be reached when about 67 wires in the frame are broken, which may occur by August of 2025. This is based on the analysis and the equation obtained from the data shown in
Figure 11.
Table 3 presents wire breaks and reveals that the first and second and fifth and sixth frames need to be considered for maintenance when 10% of the Serviceability Limit State has been reached based on the BWZ in adjacent frames.
Based on this criterion, CAP needs to begin planning for maintenance of the pipe, at least in the first 2 m (6 feet) of the pipe section and from roughly 4 m (13 feet) to 5.5 (18 feet) from the upstream joint. Similar evaluations of non-adjacent frames indicate planning for maintenance needs to begin at the upstream end of the pipe section and progress towards the downstream end.
Potential maintenance activities identified during the RCM include continuing monitoring with AFO, periodic inspection with the EM tool, internal visual inspection, and continued analysis. Structural maintenance tasks identified to restore individual pipe sections to near new condition include carbon fiber as the most cost effective, proven maintenance/repair method.
The analyses only considered a single-pipe section within the entire pipeline. The same type of evaluations should be conducted for each section of pipe with broken wires, but only when a certain threshold of wires is met. Increased monitoring and analysis should occur when all outer wires in a frame are broken. The level of detail presented may not be warranted on a pipe with only a few broken wires; however, as the wire break increases, and more pipe sections become distressed, the analyses could be automated with computer software and automatically generate a warning when specific thresholds are crossed or are within a certain tolerance.
8. Conclusions
Given the state of the drinking water infrastructure in the United States specifically considering pipelines, water utility agencies would benefit significantly from using Reliability-Centered Maintenance (RCM) in establishing maintenance strategies and maintenance task procedures for their pipeline assets. If an agency has a preventative maintenance strategy in place, RCM analyses can determine if there are more cost-effective and/or efficient preventative maintenance activities that could be implemented. If an agency does not have a pipeline maintenance strategy, RCM analyses need to be considered for their large-diameter waterlines since they are such a critical asset in the drinking water infrastructure.
RCM is a strategic approach to maintenance that uses a methodology of targeting maintenance activities on the proper function and probable failures of an asset to insure intended operation. Aging infrastructure does not have to equate to a reduction in reliability. Even pipes that have reached the end of their design life can have extended service for several more years, so long as proactive condition assessment and preventative maintenance tasks are part of the maintenance strategy. Large-diameter water pipelines are “forever assets”, meaning that they can last almost indefinitely, as long as they are maintained. Furthermore, as long as there is a population depending on the services provided by the pipeline, there will always be the need for these assets. A properly planned and executed RCM-based maintenance strategy will reduce the risk of major failures, which, for large-diameter water pipelines, can have significant costs and social consequences. The application of a strategic RCM program can
Significantly improve reliability;
Reduce maintenance costs;
Extend the useful life of infrastructure assets regardless of age.
Using the criteria established in an RCM for developing maintenance strategies, analyzing trends in wire breaks and using analytics to predict when a pipe may cross a limit state, agencies can set thresholds early to be able to plan, budget, and inform stakeholders of upcoming maintenance activities and subsequent scheduling if alternative sources of water is required. Agencies can use a predictive schedule to know when to allocate additional resources to specific assets or how to prioritize maintenance on assets. The intent of maintenance is to prevent failure, not restore the asset after failure.


