
Deformation Pattern and Failure Mechanism of Railway Embankment Caused by Lake Water Fluctuation Using Earth Observation and On-Site Monitoring Techniques

Abstract
:1. Introduction
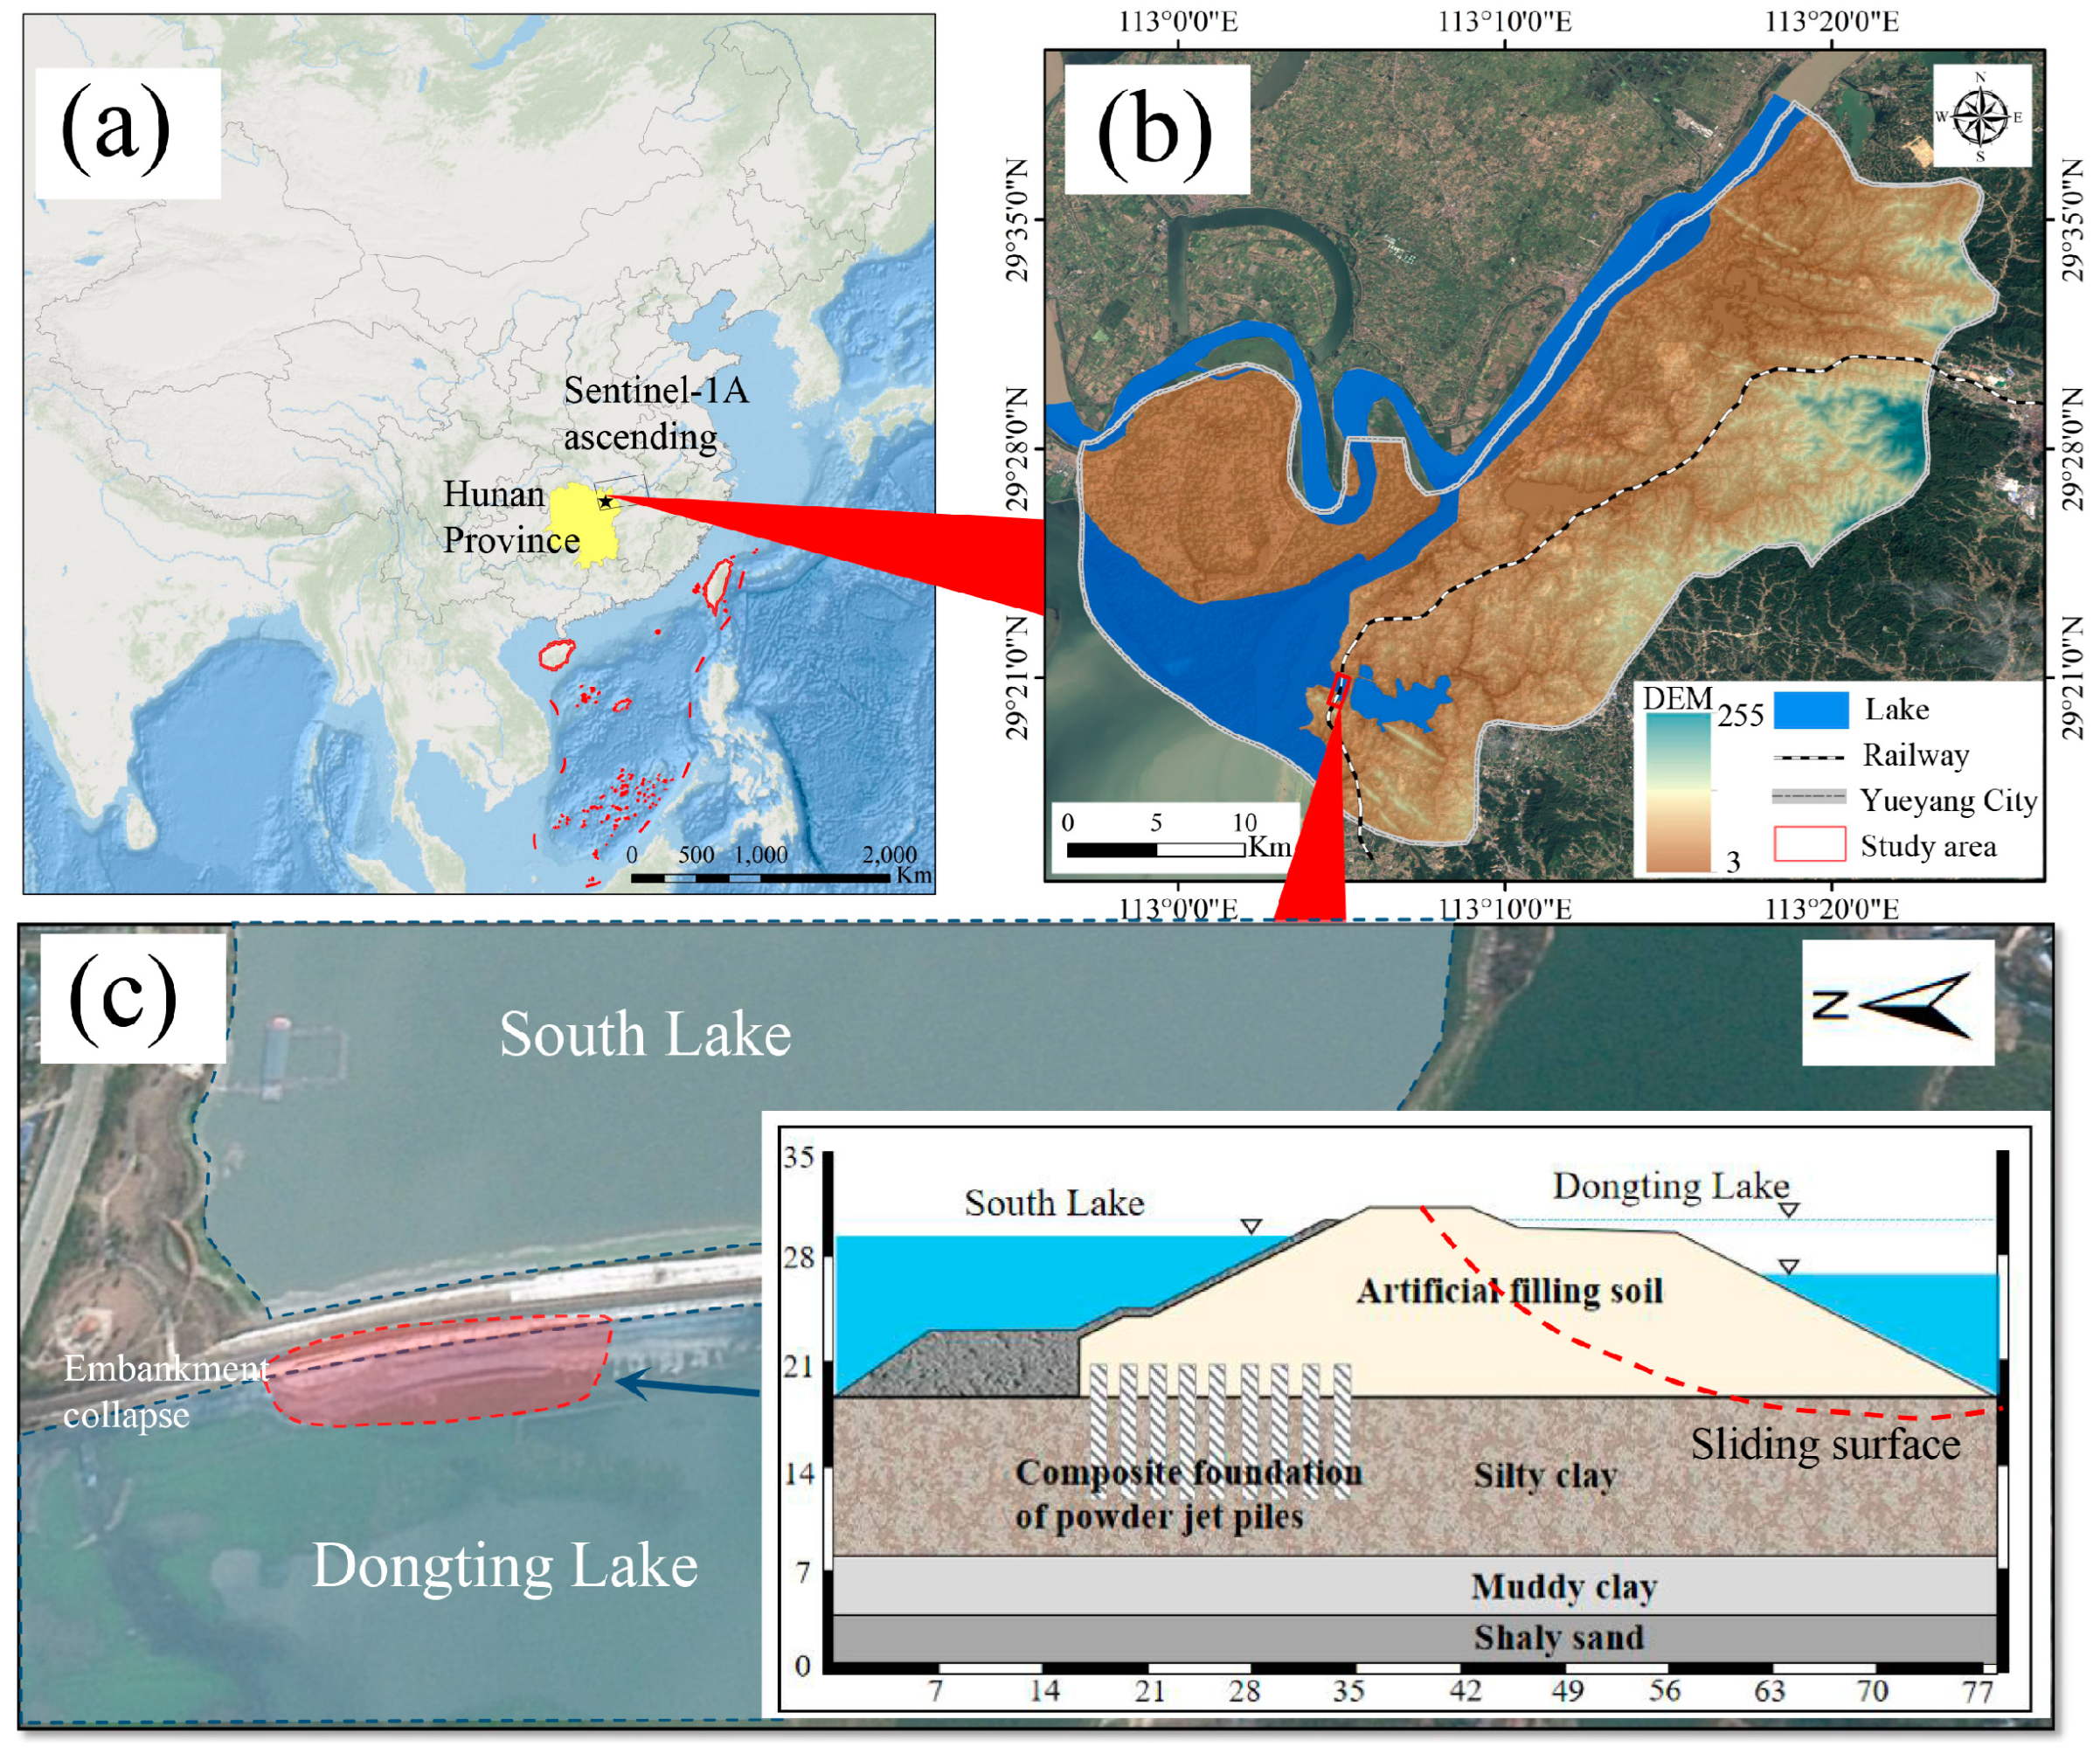
2. Study Area
3. Data
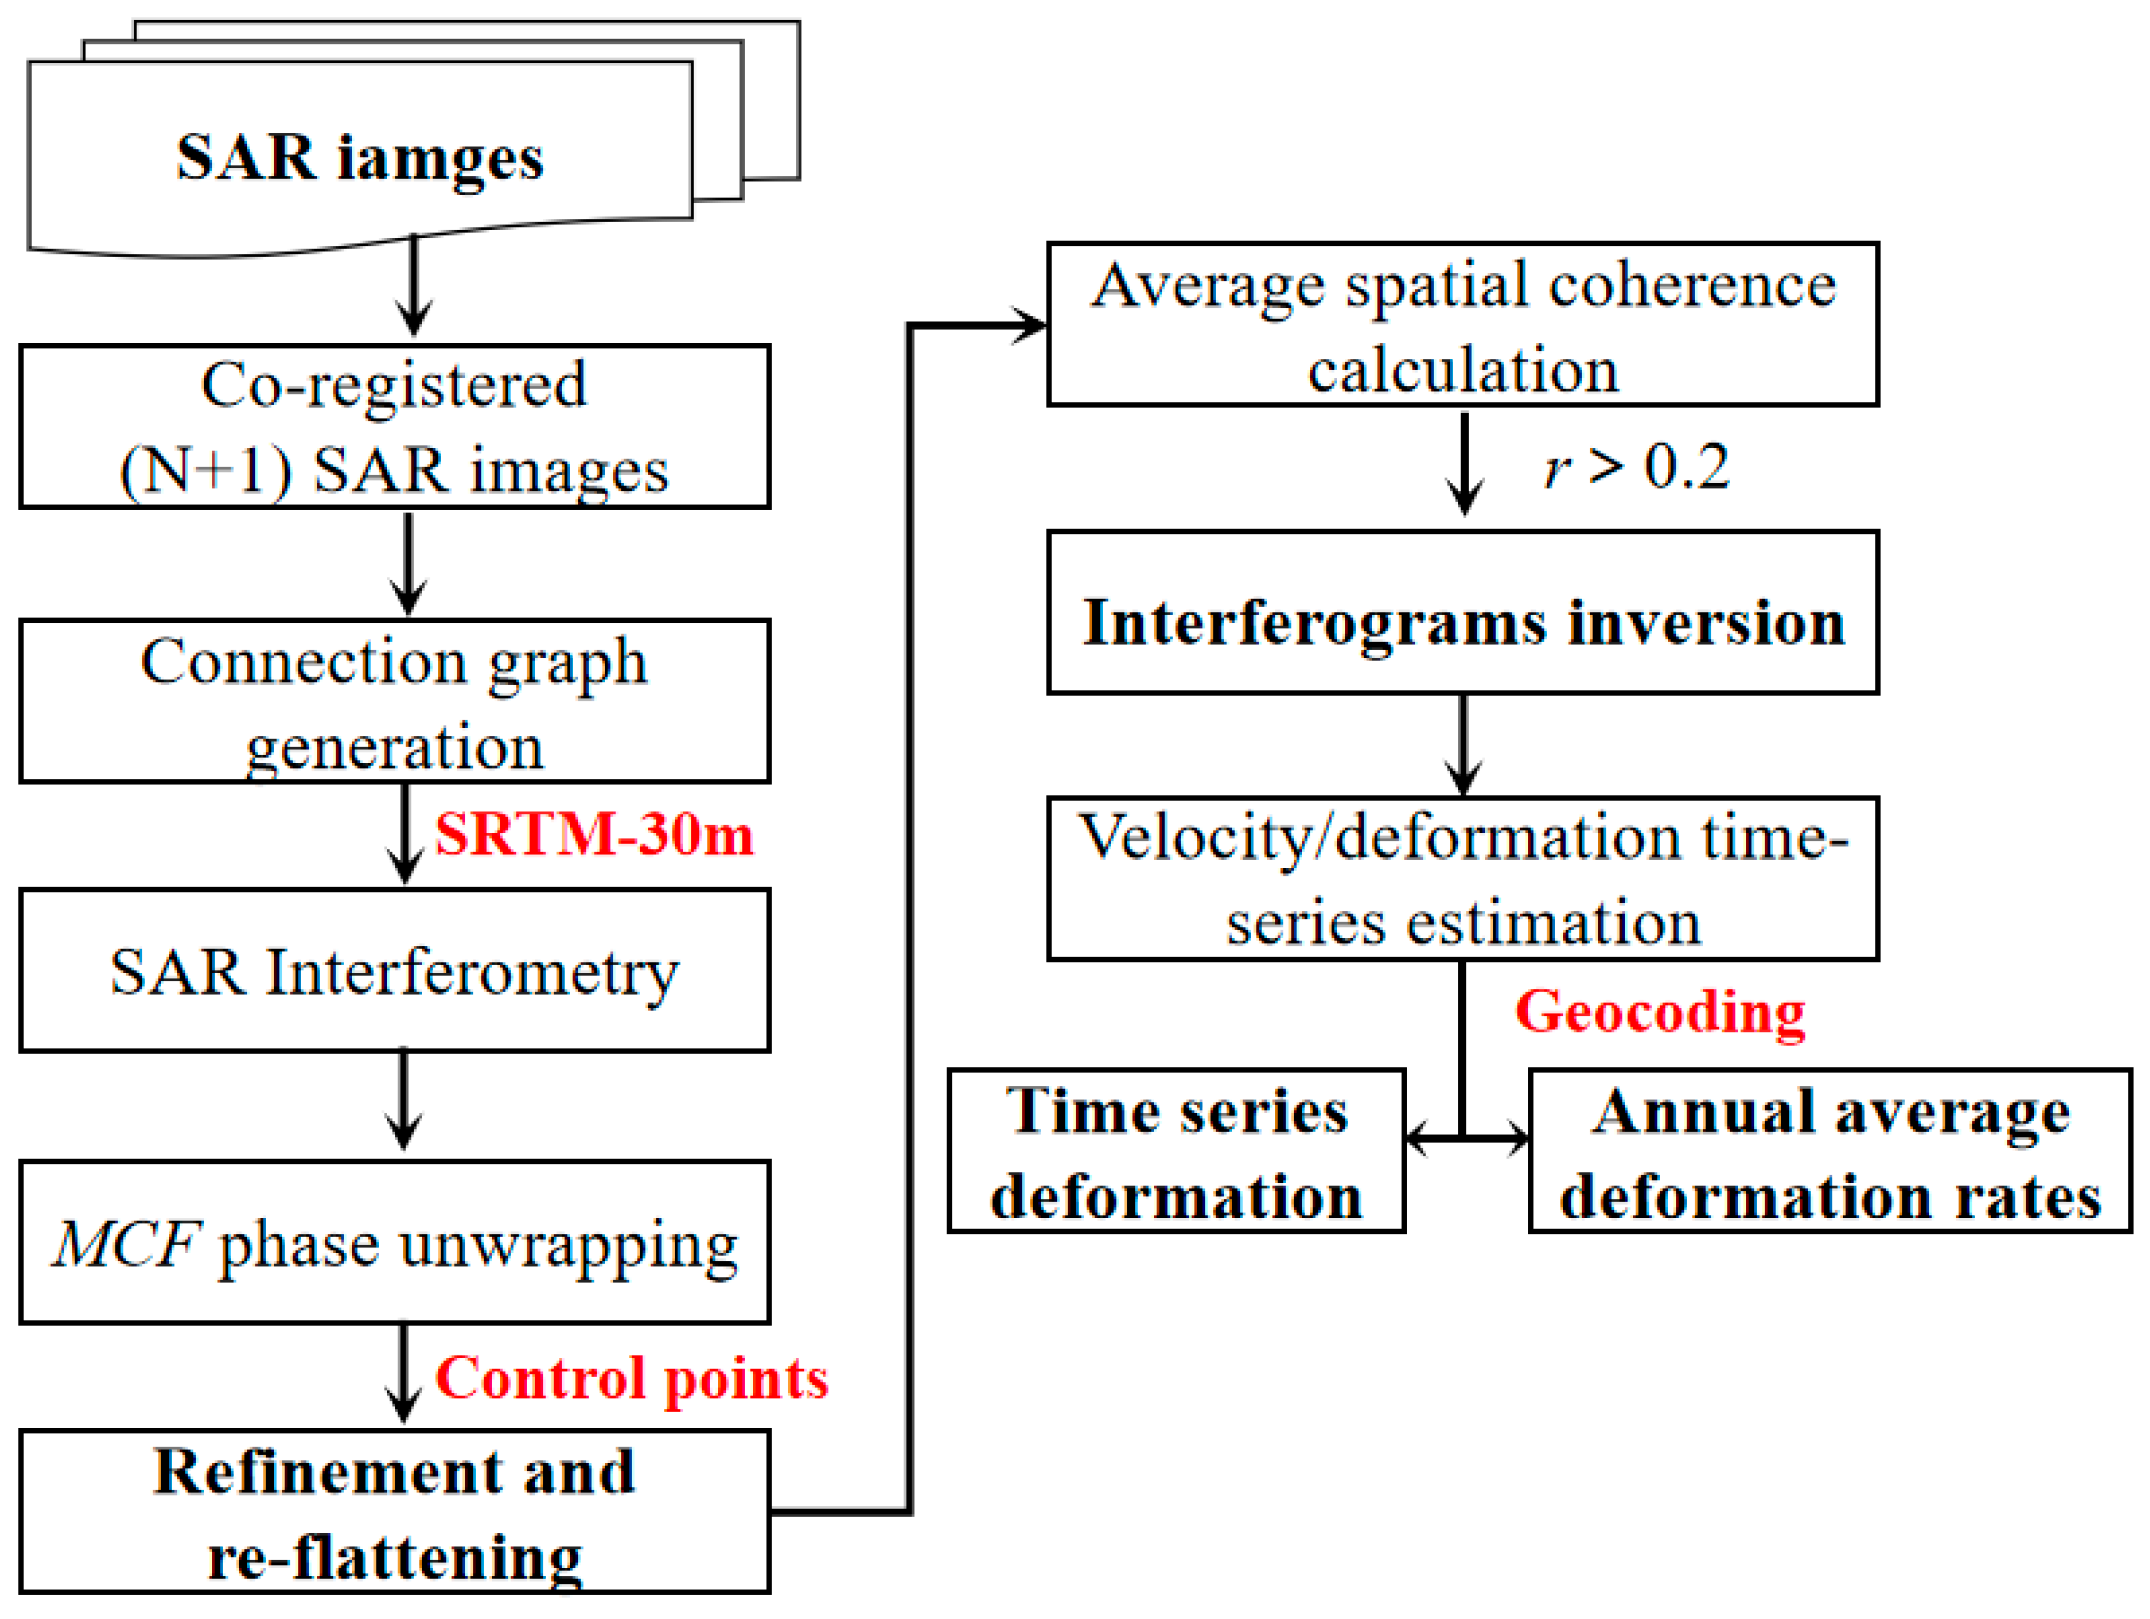
4. Time-Series InSAR Data Processing Method
5. Results
5.1. Deformation Detected Based on SABS-InSAR
5.2. Displacement Time Series of the Railway Embankment
6. Discussion
6.1. Displacement Time Series of the Railway Embankment
- (1)
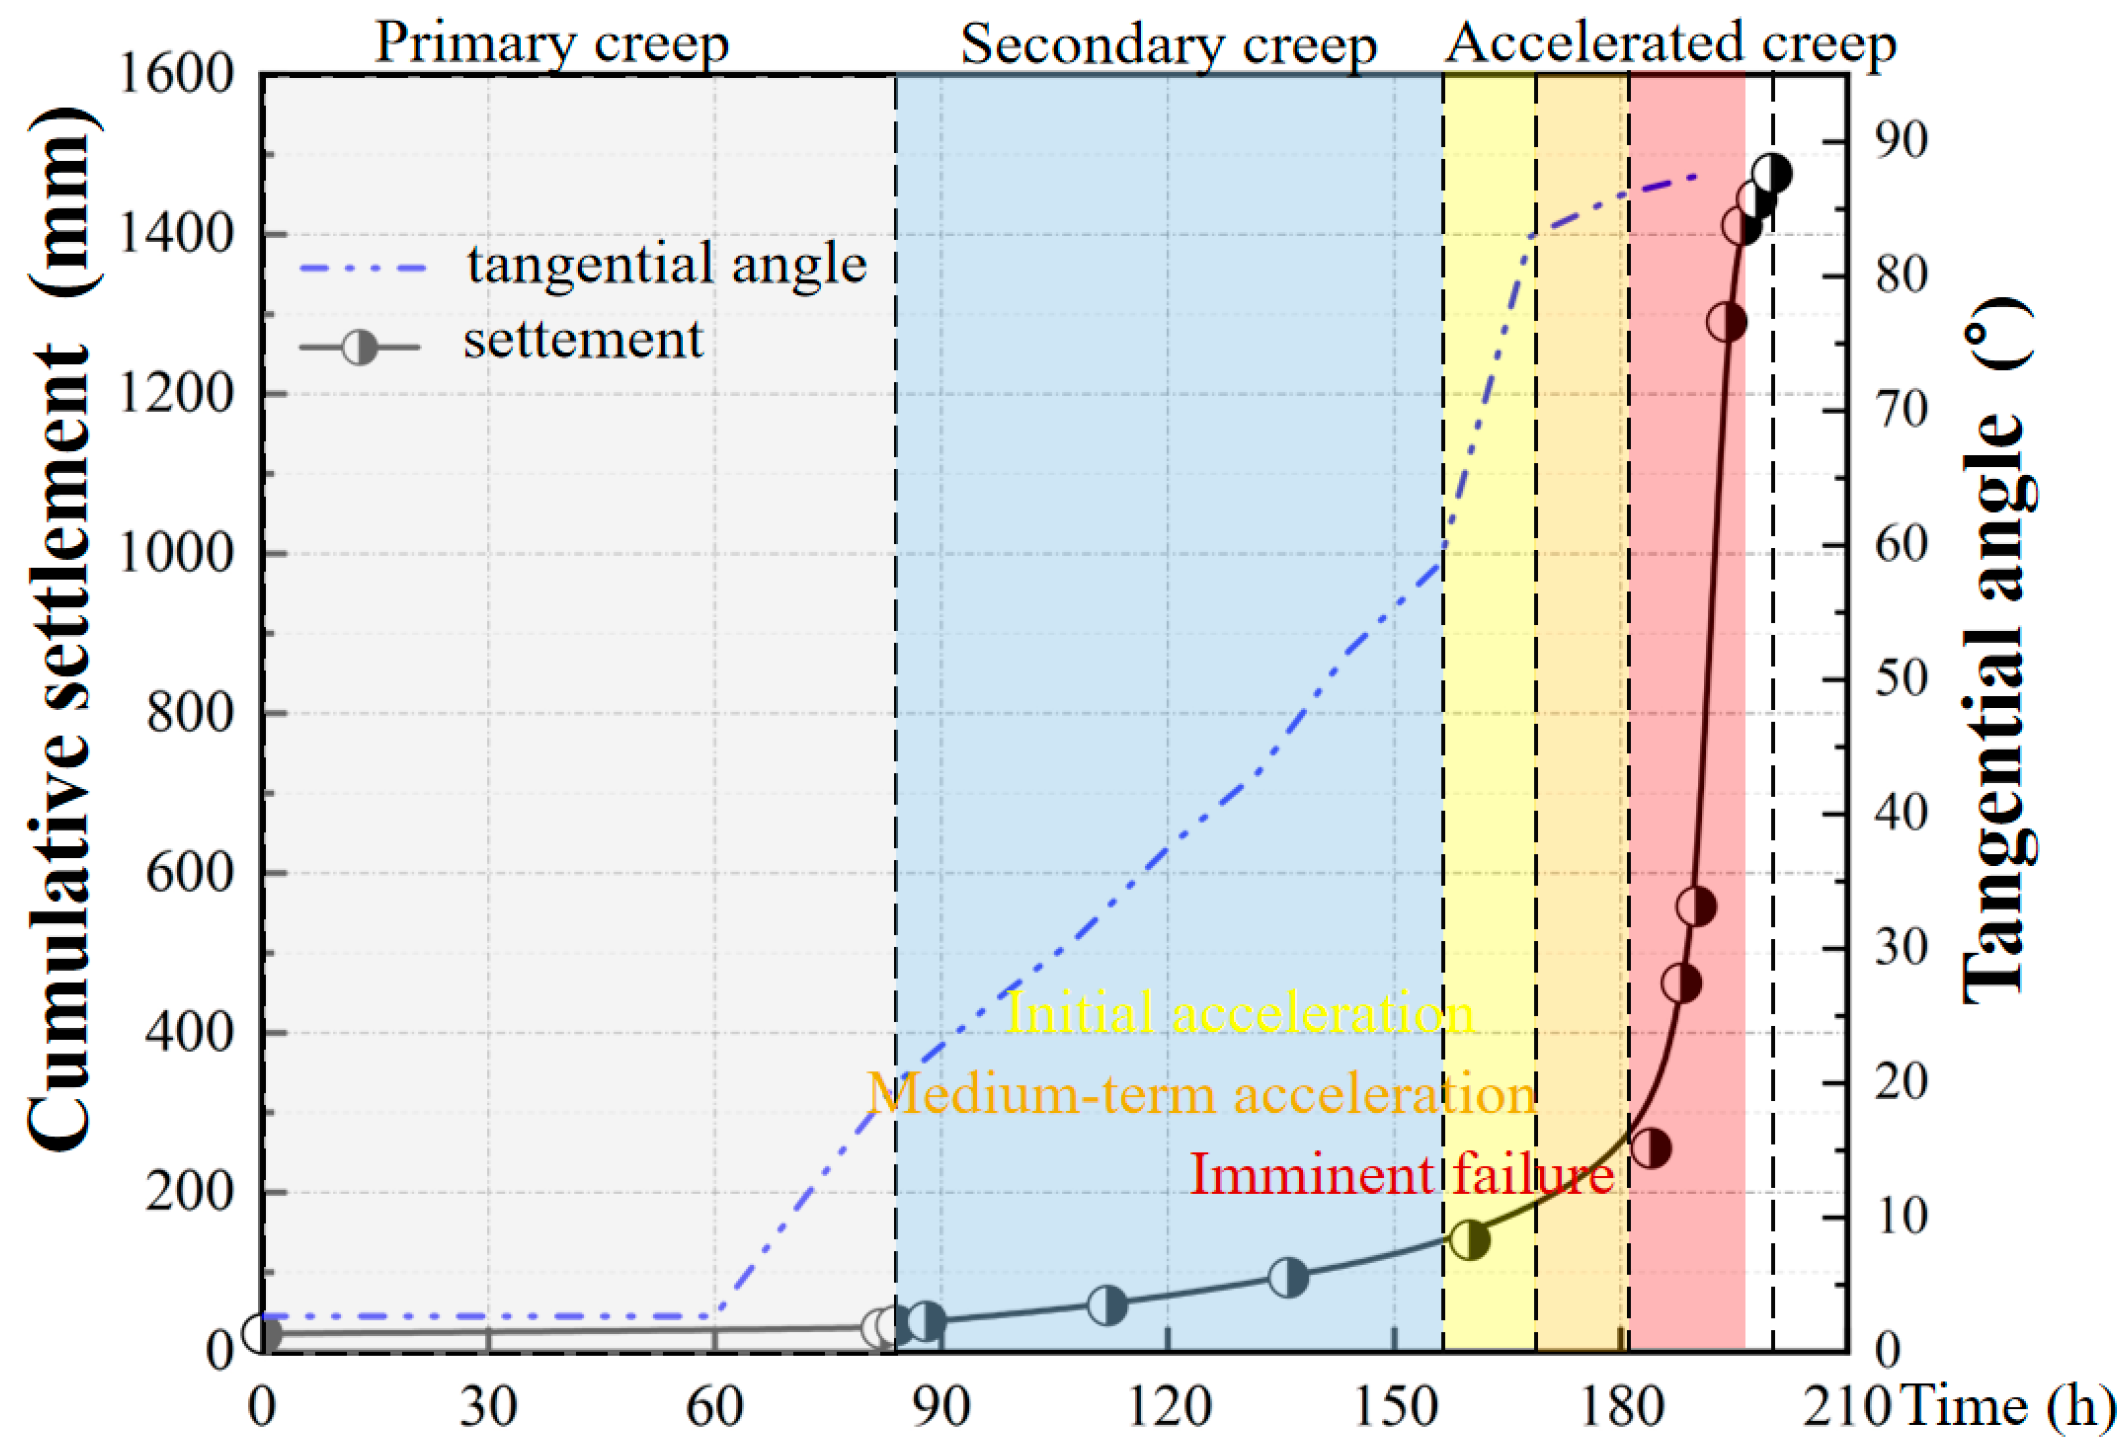
- Primary creep phase (decelerated stage), the velocity and acceleration increased from zero and then decreased (0 to 88 h) (Figure 8). The tangential angle was less than 20° (Figure 7). The settlement was very small in this phase, which was the consolidation of the embankment after the dissipation of the pore pressure under train loading. In this phase, the embankment was in a healthy state and did not affect train operation.
- (2)
- Secondary creep phase (steady-state stage). The velocity increased slowly, and the acceleration varied around zero (88 to 155 h), even becoming a negative value (Figure 8). The tangential angle was less than 60° (Figure 7). The cumulative settlement increased gradually, larger than 70 mm (average value of settlement in this stage). Cracks were observed in the shoulder structure of the embankment via visual interpretation. The phenomenon of shaking and an uncomfortable driving feel were perceived by train drivers at this moment.
- (3)
- Accelerated creep phase (accelerated stage), the velocity and settlement show a trend of increasing non-linearity with time. The initial (lower than 82°), medium-term acceleration (82~85°) and imminent failure (greater than 85°) sub-phase were divided based on the inflection point at the tangential angle-time curve (Figure 7). The velocity increased abruptly in the imminent failure sub-phase and continued to increase until the embankment collapse (Figure 8). The majority of deformation (about 90% of total) occurred in this stage within a short time, resulting in the failure of the railway infrastructure. Since the slip surface developed progressively, obvious deformation and huge pavement cracks were caused successively. At this time, the embankment was not suitable for trains to pass. Nevertheless, when the embankment failed completely, the acceleration dropped sharply, becoming a negative value.
6.2. Comparison of Deformation Patterns of Various Slope
6.3. Failure Mechanism of Embankment Caused by Rapid Drawdown
- (1)
- The saturated surface inside the embankment appeared after a rapid drawdown of the water level, generating the hydraulic gradient and penetration force. Some particles were forced to migrate out of the materials caused by flowing water, which changed the grain grading of embankment materials. The finer particles were washed out, resulting in the increase of the soil pore. The rearrangement of soil particles and the disruption of the soil skeleton caused small deformation under gravity and traffic loading (Figure 10). Thus, the settlement was almost imperceptible in the primary creep phase.
- (2)
- With the continuous falling of lake water, the irregular seepage paths were formed and gradually expanded with the loss of fine particles, forming the erosion tunnels. The hydrostatic pressure acting on the embankment decreased, while a greater hydraulic gradient was formed inside the embankment. Together, the seepage force pointing to the outside of the embankment and the train loading induced the secondary consolidation of soil, leading to significant deformation and a minor fracture around the embankment surface. The shear stress concentrated at the toe of the embankment caused the plastic zone. The deformation velocity and settlement significantly increased, which caused differential settlement in the secondary creep phase.
- (3)
- As the lake water completely ebbed, the hydrostatic pressure acting on the embankment vanished. however, the pore water was not completely drained from the embankment soil. Because of the increase in excessive pore water pressure under repeated train loading, the effective stress and the shear strength of soils became smaller. The plastic-yielding area first appeared at the foot of the embankment. The shear plastic and tensile plastic zone developed gradually upward from the foot and downward from the top of the embankment. The sliding surface formed when the two plastic zones coalesced, and the embankment slid downwards until it collapsed. Thus, the velocity and settlement of the embankment increased abruptly in the accelerated creep phase.
7. Conclusions
- (1)
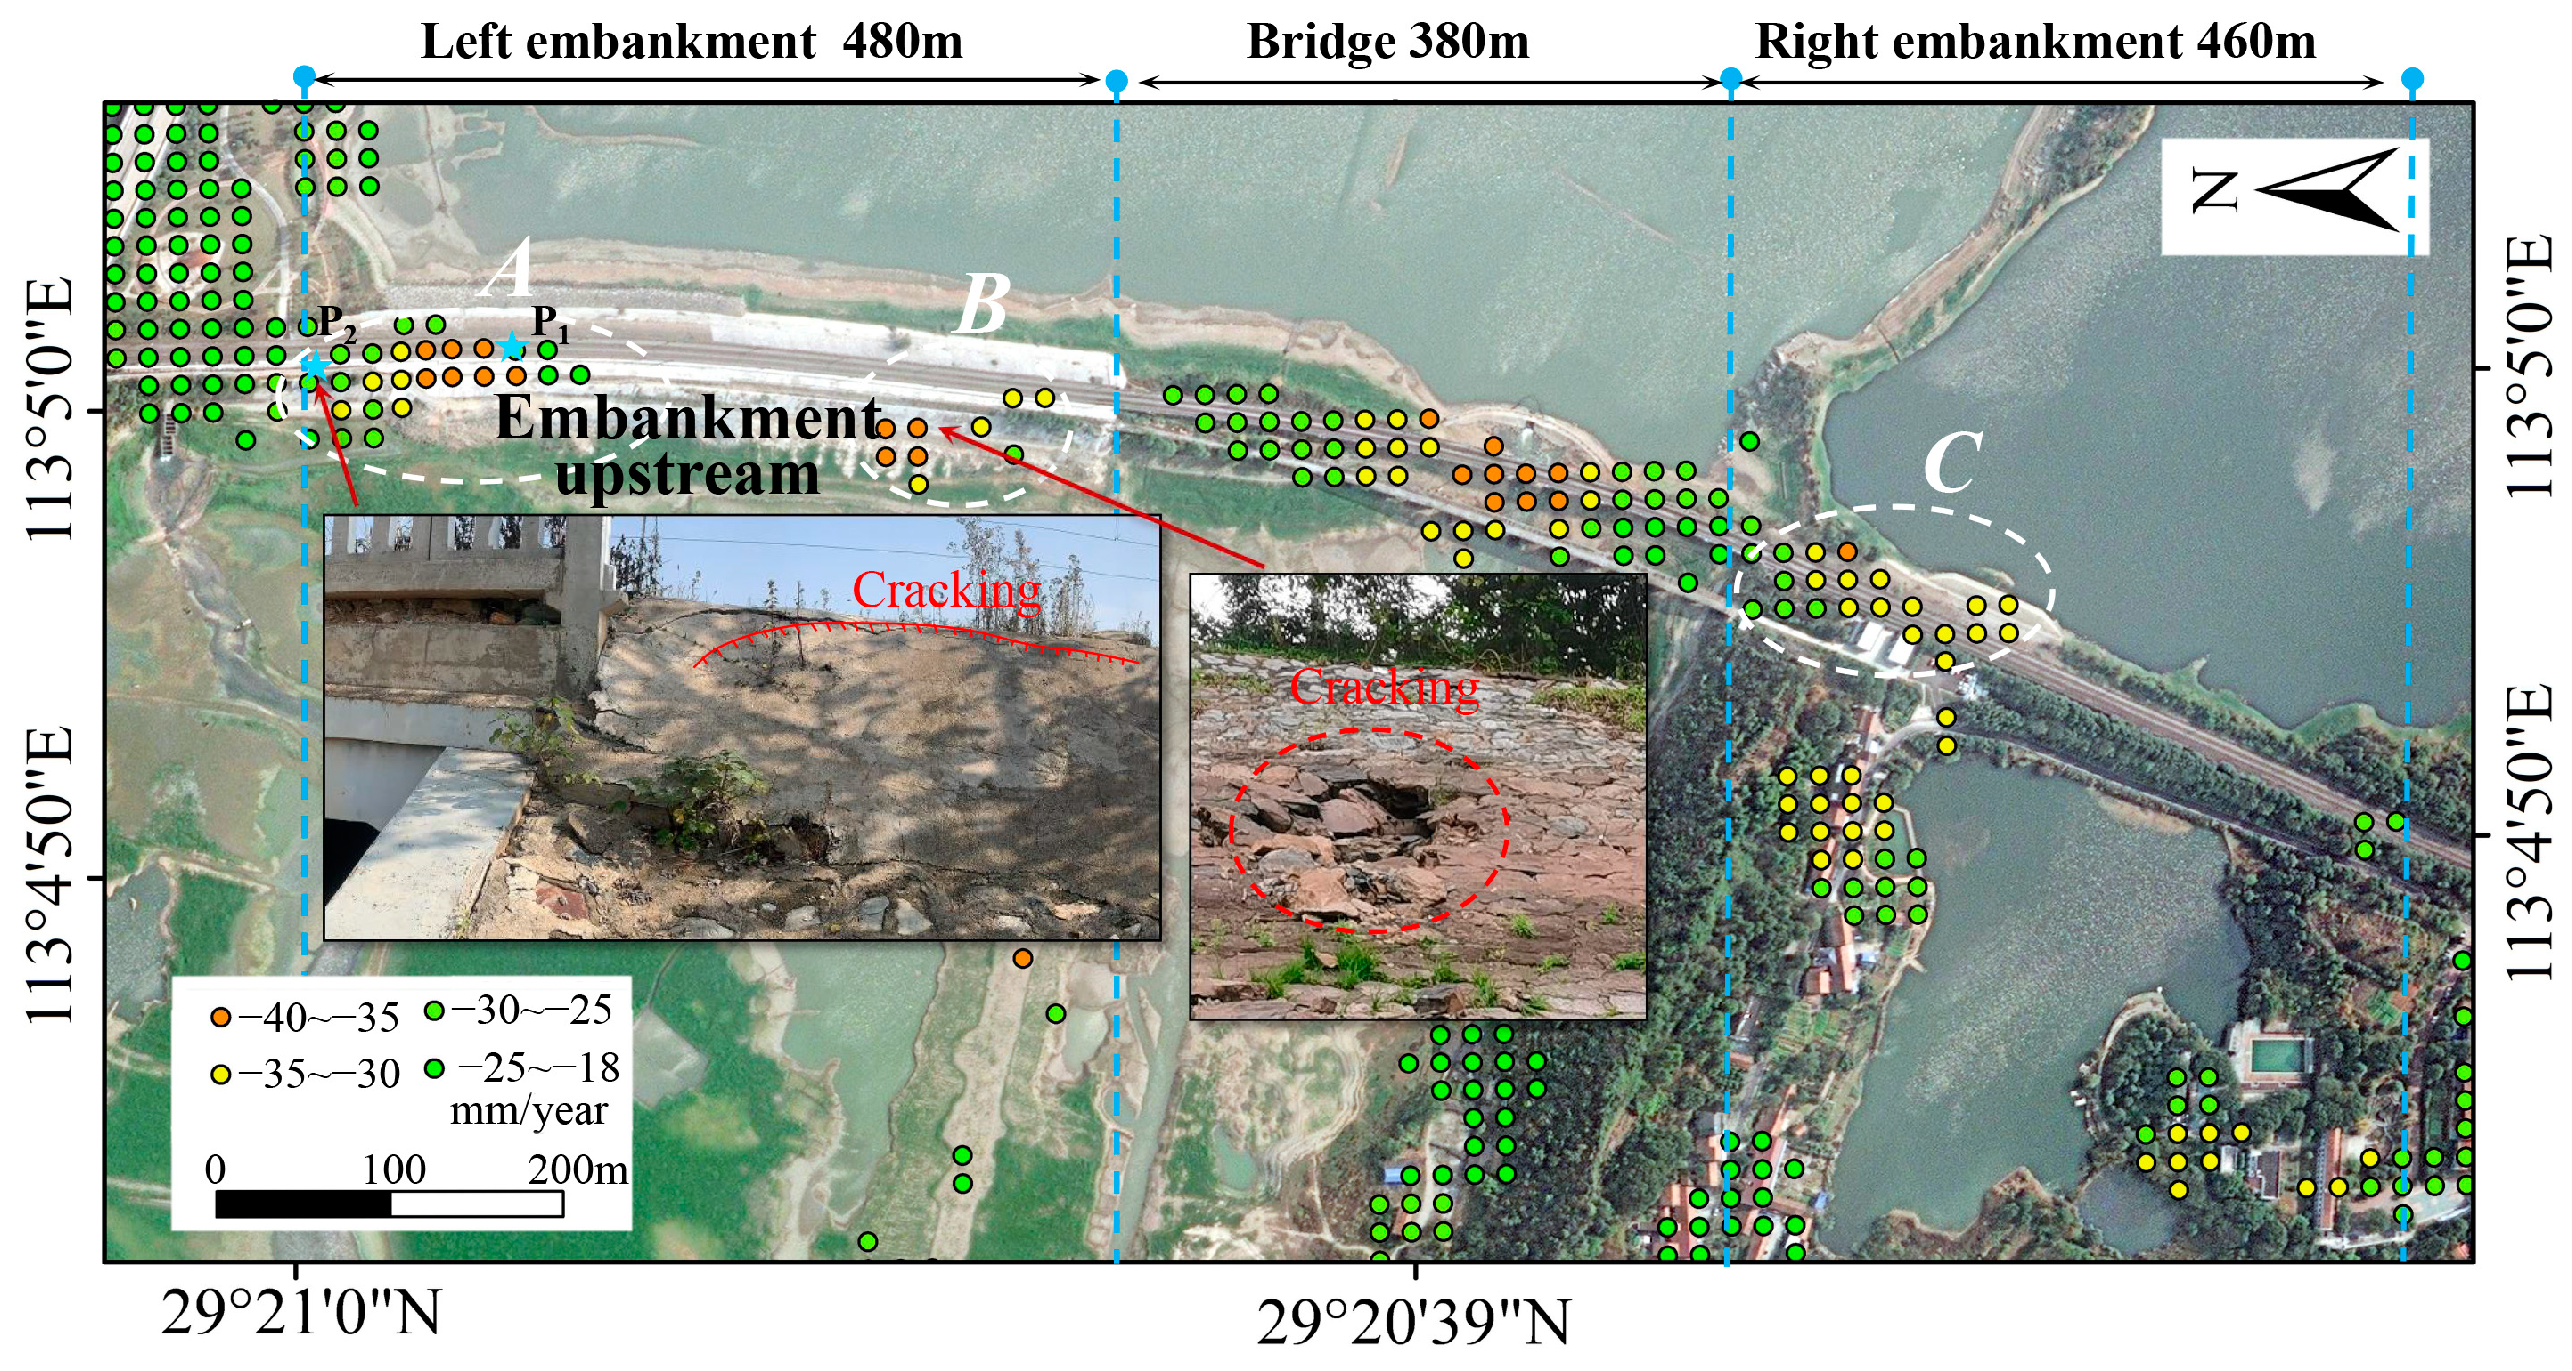
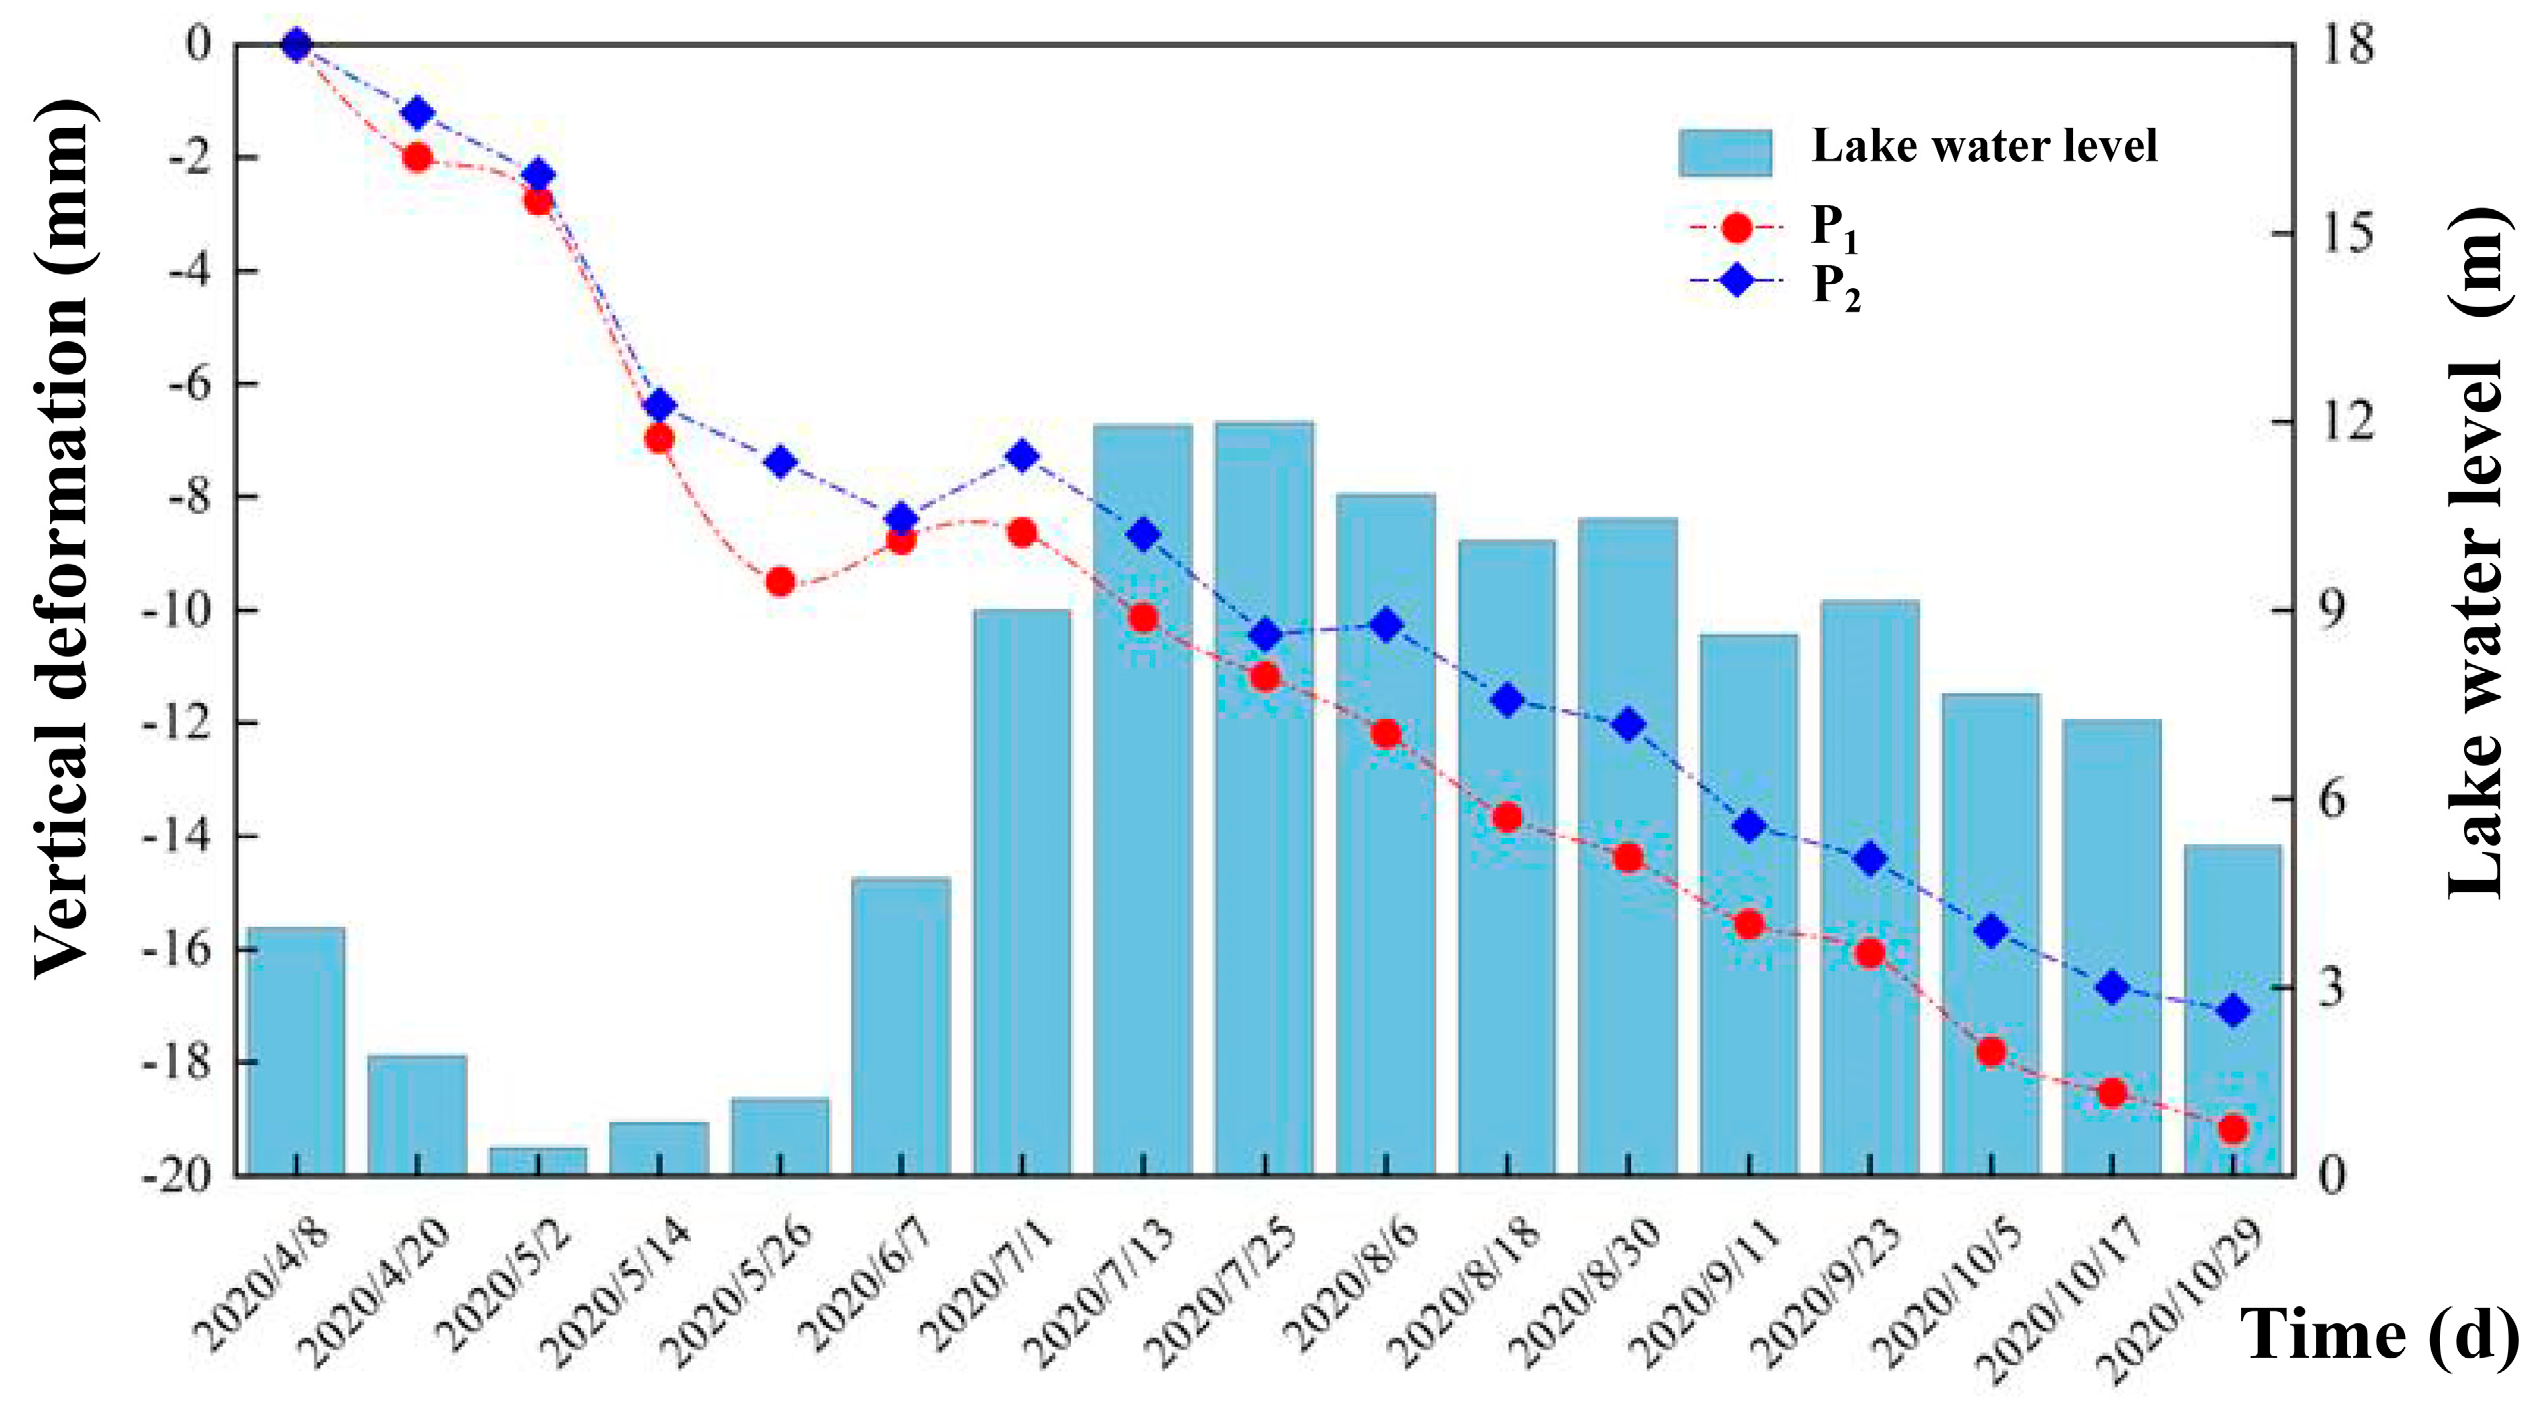
- The differential settlement was revealed via InSAR at section A of the embankment exposed to the lake water before the accident, which exceeded −38 mm yr−1 deformation rates. The cumulative settlements of two sites were found to increase with the decrease in the lake water level from 13 July to 29 October 2020 which was about 19 mm before the failure. This may be an indication of internal erosion caused by rapid drawdown. Although the magnitude of deformation was relatively small, the differential settlement area should have aroused close attention.
- (2)
- The settlement was recorded via leveling every 2 h from abnormal deformation to the final failure after the occurrence of train shaking. It was indicated that the settlement-time curve was initially linear, reaching 232 mm within 102 h. Afterward, the settlement began to show a curvature increase, turning the curve nearly straight up before the failure. The settlement reached more than 1400 mm within the following 16 h, and the embankment completely collapsed at 6:00 a.m. on 6 November 2020.
- (3)
- The railway embankment experienced three phases of primary creep, secondary creep and accelerated creep phase, like the evolution of most landslide or dam failures. Train loading and seepage force may have aggravated the secondary consolidation of soil and promoted the embankment to enter the accelerated creep phase quickly. The majority of the deformation (about 90% of the total) took place in the accelerated creep phase within a short time. Immediate engineering measures should be adopted to prevent future deformation at this stage.
- (4)
- The deformation patterns of many landslides and slides at dams were summarized, which seem to be divided into three modes. However, this work proved that the deformation pattern of the railway embankment was presented as an exponential curve trend after rapid drawdown, unlike the three common modes. The time of the secondary creep phase was shortened due to train loading and the permeation.
- (5)
- The failure mechanism of the embankment considering the coupling of seepage and stress was discussed in various deformation stages. It was indicated that the formation mechanism of the embankment collapse can be summarized as “seepage failure-creep-shear slip-collapse.” This work provides some clues for early warnings and for developing maintenance plans to ensure the safe operation of railways.
Author Contributions
Funding
Data Availability Statement
Acknowledgments
Conflicts of Interest
References
- He, L.D.; Zong, Z. Section Design and Seep Proof Design for Subgrade in Reservoir Area. Subgrade Eng. 2006, 12, 75–81. (In Chinese) [Google Scholar]
- Transportation Safety Board Canada (TSBC). Rail Transportation; Transportation Safety Board Canada (TSBC): Ottawa, ON, Canada, 2019. [Google Scholar]
- Pinyol, N.M.; Alonso, E.E.; Corominas, J.; Moya, J. Canelles landslide: Modelling rapid drawdown and fast potential sliding. Landslides 2012, 9, 33–51. [Google Scholar] [CrossRef]
- Zhang, Y.; Zhang, Z.; Xue, S.; Wang, R.; Xiao, M. Stability analysis of a typical landslide mass in the Three Gorges Reservoir under varying reservoir water levels. Environ. Earth Sci. 2020, 79, 42. [Google Scholar] [CrossRef]
- Xu, Q.; Yuan, Y.; Zeng, Y.P.; Hack, R. Some new pre-warning criteria for creep slope failure. Sci. China Technol. Sci. 2011, 54, 210–220. [Google Scholar] [CrossRef]
- Saito, M. Forecasting the time of occurrence of a slope failure. In Proceedings of the 6th International Conference on Soil Mechanics and Foundation Engineering, Montreal, QC, Canada, 8–15 September 1965; University of Toronto Press: Toronto, ON, Canada, 1965; pp. 537–541. [Google Scholar]
- Varnes, D.J. Time-deformation relations in creep to failure of earth materials. In Proceedings of the 7th South East Asian Geotechnical Conference, Hong Kong, China, 22–26 November 1982; Volume 2, pp. 107–130. [Google Scholar]
- Du, J.; Yin, K.L.; Lacasse, S. Displacement prediction in colluvial landslides, Three Gorges Reservoir, China. Landslides 2013, 10, 203–218. [Google Scholar] [CrossRef]
- Saito, M.; Uezawa, H. Failure of soil due to creep. In Proceedings of the Fifth International Conference on Soil Mechanics and Foundation Engineering, Montreal, QC, Canada, 17–22 July 1961. [Google Scholar]
- Crosta, G.B.; Agliardi, F. Failure forecast for large rock slides by surface displacement measurements. Can. Geotech. J. 2003, 40, 176–191. [Google Scholar] [CrossRef]
- Xu, Q.; Peng, D.; Zhang, S.; Zhu, X.; He, C.; Qi, X.; Zhao, K.; Xiu, D.; Ju, N. Successful implementations of a real-time and intelligent early warning system for loess landslides on the Heifangtai terrace, China. Eng. Geol. 2020, 278, 105817. [Google Scholar] [CrossRef]
- D’Amico, F.; Gagliardi, V.; Ciampoli, L.B.; Tosti, F. Integration of InSAR and GPR techniques for monitoring transition areas in railway bridges. NDT E Int. 2020, 115, 102291. [Google Scholar] [CrossRef]
- Bianchini Ciampoli, L.; Gagliardi, V.; Clementini, C.; Latini, D.; Del Frate, F.; Benedetto, A. Transport infrastructure monitoring by InSAR and GPR data fusion. Surv. Geophys. 2020, 41, 371–394. [Google Scholar] [CrossRef]
- Maltese, A.; Pipitone, C.; Dardanelli, G.; Capodici, F.; Muller, J.P. Toward a comprehensive dam monitoring: On-site and remote-retrieved forcing factors and resulting displacements (GNSS and PS–InSAR). Remote Sens. 2021, 13, 1543. [Google Scholar] [CrossRef]
- Kovačević, M.S.; Bačić, M.; Librić, L.; Gavin, K. Evaluation of creep behavior of soft soils by utilizing multisensor data combined with machine learning. Sensors 2022, 22, 2888. [Google Scholar] [CrossRef]
- Li, L.; Yao, X.; Yao, J.; Zhou, Z.; Feng, X.; Liu, X. Analysis of deformation characteristics for a reservoir landslide before and after impoundment by multiple D-InSAR observations at Jinshajiang River, China. Nat. Hazards 2019, 98, 719–733. [Google Scholar] [CrossRef]
- Zhou, C.; Cao, Y.; Yin, K.; Wang, Y.; Shi, X.; Catani, F.; Ahmed, B. Landslide characterization applying sentinel-1 images and InSAR technique: The muyubao landslide in the three Gorges Reservoir Area, China. Remote Sens. 2020, 12, 3385. [Google Scholar] [CrossRef]
- Du, Z.; Ge, L.; Ng, A.H.M.; Horgan, F.G.; Zhang, Q. Risk assessment for tailings dams in Brumadinho of Brazil using InSAR time series approach. Sci. Total Environ. 2020, 717, 137125. [Google Scholar] [CrossRef] [PubMed]
- Rotta, L.H.S.; Alcântara, E.; Park, E.; Negri, R.G.; Lin, Y.N.; Bernardo, N.; Mendes, T.S.G.; Souza Filho, C.R. The 2019 Brumadinho tailings dam collapse: Possible cause and impacts of the worst human and environmental disaster in Brazil. Int. J. Appl. Earth Obs. Geoinf. 2020, 90, 102119. [Google Scholar]
- Zhou, W.; Li, S.; Zhou, Z.; Chang, X. Remote sensing of deformation of a high concrete-faced rockfill dam using InSAR: A study of the Shuibuya dam, China. Remote Sens. 2016, 8, 255. [Google Scholar] [CrossRef]
- Wang, Q.Q.; Huang, Q.H.; He, N.; He, B.; Wang, Z.C.; Wang, Y.A. Displacement monitoring of upper Atbara dam based on time series InSAR. Surv. Rev. 2020, 52, 485–496. [Google Scholar] [CrossRef]
- Liu, G.; Jia, H.; Zhang, R.; Zhang, H.; Jia, H.; Yu, B.; Sang, M. Exploration of subsidence estimation by persistent scatterer InSAR on time series of high resolution TerraSAR-X images. IEEE J. Sel. Top. Appl. Earth Obs. Remote Sens. 2010, 4, 159–170. [Google Scholar] [CrossRef]
- Luo, Q.; Perissin, D.; Lin, H.; Zhang, Y.; Wang, W. Subsidence monitoring of Tianjin suburbs by TerraSAR-X persistent scatterers interferometry. IEEE J. Sel. Top. Appl. Earth Obs. Remote Sens. 2013, 7, 1642–1650. [Google Scholar] [CrossRef]
- Zhang, Q.; Li, Y.; Zhang, J.; Luo, Y. InSAR technique applied to the monitoring of the Qinghai-Tibet Railway. Nat. Hazards Earth Syst. Sci. 2019, 19, 2229–2240. [Google Scholar] [CrossRef]
- Valentina, M.; Pietro, M.; Chris, B.; Cormac, R.; Giorgia, G. Multi-temporal InSAR for transport infrastructure monitoring: Recent trends and challenges. Proc. Inst. Civ. Eng.-Bridge Eng. 2023, 176, 92–117. [Google Scholar]
- Yan, Y.; Doin, M.P.; López-Quiroz, P.; Tupin, F.; Fruneau, B.; Pinel, V.; Trouvé, E. Mexico City subsidence measured by InSAR time series: Joint analysis using PS and SBAS approaches. IEEE J. Sel. Top. Appl. Earth Obs. Remote Sens. 2012, 5, 1312–1326. [Google Scholar] [CrossRef]
- Liu, M.; Liu, X.; Wu, L.; Zou, X.; Jiang, T.; Zhao, B. A modified spatiotemporal fusion algorithm using phenological information for predicting reflectance of paddy rice in southern China. Remote Sens. 2018, 10, 772. [Google Scholar] [CrossRef]
- Ansari, H.; De Zan, F.; Bamler, R. Efficient phase estimation for interferogram stacks. IEEE Trans. Geosci. Remote Sens. 2018, 56, 4109–4125. [Google Scholar] [CrossRef]
- Zhang, Y.Z.; Fattahi, H.; Amelung, F. Small baseline InSAR time series analysis: Unwrapping error correction and noise reduction. Comput. Geosci. 2019, 133, 104331. [Google Scholar]
- Zhang, P.; Guo, Z.; Guo, S.; Xia, J. Land Subsidence Monitoring Method in Regions of Variable Radar Reflection Characteristics by Integrating PS-InSAR and SBAS-InSAR Techniques. Remote Sens. 2022, 14, 3265. [Google Scholar] [CrossRef]
- Berardino, P.; Fornaro, G.; Lanari, R.; Sansosti, E. A new algorithm for surface deformation monitoring based on small baseline differential SAR interferograms. IEEE Trans. Geosci. Remote Sens. 2002, 40, 2375–2383. [Google Scholar] [CrossRef]
- Chen, C.W.; Zebker, H.A. Two-dimensional phase unwrapping with use of statistical models for cost functions in nonlinear optimization. J. Opt. Soc. Am. A 2001, 18, 338–351. [Google Scholar] [CrossRef]
- Xu, Q. Theoretical studies on prediction of landslides using slope deformation process data. J. Eng. Geol. 2012, 20, 145–151. (In Chinese) [Google Scholar]
- Liu, C.Z. Three types of displacement-time curves and early warning of landslides. J. Eng. Geol. 2021, 29, 86–95. (In Chinese) [Google Scholar]
- Zuan, P.; Huang, Y. Prediction of sliding slope displacement based on intelligent algorithm. Wirel. Pers. Commun. 2018, 102, 3141–3157. [Google Scholar] [CrossRef]
- Zhou, C.; Cao, Y.; Yin, K.; Intrieri, E.; Catani, F.; Wu, L. Characteristic comparison of seepage-driven and buoyancy-driven landslides in Three Gorges Reservoir area, China. Eng. Geol. 2022, 301, 106590. [Google Scholar] [CrossRef]
- Yang, H.; Song, K.; Chen, L.; Qu, L. Hysteresis effect and seasonal step-like creep deformation of the Jiuxianping landslide in the Three Gorges Reservoir Region. Eng. Geol. 2023, 317, 107089. [Google Scholar] [CrossRef]
- Hunter, G.J. The Pre- and Post-Failure Deformation Behavior of Soil Slopes. Ph.D. Thesis, University of New South Wales, Kensington, Australian, 2003. [Google Scholar]
- Chen, H.; Qin, S.; Xue, L.; Xu, C. Why the Xintan landslide was not triggered by the heaviest historical rainfall: Mechanism and review. Eng. Geol. 2021, 294, 106379. [Google Scholar] [CrossRef]
- Jones, F.O.; Embody, D.R.; Peterson, W.L. Landslides along the Columbia River valley, northeastern Washington. In U.S. Geological Survey Professional Paper; 367 Government Printing Office: Washington, DC, USA, 1961. [Google Scholar]
- Nakamura, K. On reservoir landslide. Bull. Soil Water Conserv. 1990, 10, 53–64. (In Chinese) [Google Scholar]
- Xue, G.; Xu, F.; Wu, Y.; Yu, Y. Bank slope stability evaluation for the purpose of ThreeGorges Reservoir Dam Construction. In Landslide Disaster Mitigation inThree Gorges Reservoir, China; Wang, F., Ed.; Springer Press: Berlin/Heidelberg, Germany, 2009; pp. 41–86. [Google Scholar]
- Chen, F.; Jiang, S.Q.; Xiong, H.; Yin, Z.Y.; Chen, X. Micro pore analysis of suffusion in filter layer using tri-layer CFD–DEM model. Comput. Geotech. 2023, 146, 104591. [Google Scholar] [CrossRef]
- Chen, F.; Xiong, H.; Yin, Z.Y.; Chen, X.S. Impermeable and mechanical stability of filter cake under different infiltration conditions via CFD-DEM. Acta Geotech. 2023, 18, 4115–4140. [Google Scholar] [CrossRef]
- Xu, S.; Zsáki, A.M. Maximum safe freight train speed on railway embankments under rapid drawdown conditions based on coupled stress-seepage slope stability analysis. Transp. Geotech. 2021, 27, 100486. [Google Scholar] [CrossRef]


Disclaimer/Publisher’s Note: The statements, opinions and data contained in all publications are solely those of the individual author(s) and contributor(s) and not of MDPI and/or the editor(s). MDPI and/or the editor(s) disclaim responsibility for any injury to people or property resulting from any ideas, methods, instructions or products referred to in the content. |
© 2023 by the authors. Licensee MDPI, Basel, Switzerland. This article is an open access article distributed under the terms and conditions of the Creative Commons Attribution (CC BY) license (https://creativecommons.org/licenses/by/4.0/).
Share and Cite
Li, S.; Li, Y.; Xu, L. Deformation Pattern and Failure Mechanism of Railway Embankment Caused by Lake Water Fluctuation Using Earth Observation and On-Site Monitoring Techniques. Water 2023, 15, 4284. https://doi.org/10.3390/w15244284
Li S, Li Y, Xu L. Deformation Pattern and Failure Mechanism of Railway Embankment Caused by Lake Water Fluctuation Using Earth Observation and On-Site Monitoring Techniques. Water. 2023; 15(24):4284. https://doi.org/10.3390/w15244284
Chicago/Turabian StyleLi, Shengxiang, Yongwei Li, and Linrong Xu. 2023. "Deformation Pattern and Failure Mechanism of Railway Embankment Caused by Lake Water Fluctuation Using Earth Observation and On-Site Monitoring Techniques" Water 15, no. 24: 4284. https://doi.org/10.3390/w15244284
APA StyleLi, S., Li, Y., & Xu, L. (2023). Deformation Pattern and Failure Mechanism of Railway Embankment Caused by Lake Water Fluctuation Using Earth Observation and On-Site Monitoring Techniques. Water, 15(24), 4284. https://doi.org/10.3390/w15244284