Article

Effects of Different Carbon and Nitrogen Ratios on Nitrogen Removal Efficiency and Microbial Communities in Constructed Wetlands

1
State Environmental Protection Key Laboratory of Drinking Water Source Protection, State Key Laboratory of Environmental Criteria and Risk Assessment, Chinese Research Academy of Environmental Sciences, Beijing 100012, China
2
School of Engineering, Jilin Normal University, Siping 136000, China
3
State Environmental Protection Key Laboratory of Wetland Ecology and Vegetation Restoration, Northeast Normal University, Changchun 130117, China
*
Authors to whom correspondence should be addressed.
Water 2023, 15(24), 4272; https://doi.org/10.3390/w15244272
Submission received: 10 November 2023 / Revised: 8 December 2023 / Accepted: 12 December 2023 / Published: 14 December 2023

Abstract

:
Amidst rapid urbanization, municipal wastewater treatment plants remain a significant source of nitrogen compounds, which stems from their effluents. Constructed wetlands, employing denitrification processes, have been proven effective at nitrogen removal. Variations in influent nutrient concentrations are often seen as limiting factors affecting nitrogen removal and influencing microbial communities. This study evaluates the impact of nutrient limitation on nitrogen removal by analyzing changes in microbial communities within constructed wetlands under different influent water C/N ratios. The findings indicate that both excessively high and low C/N ratios constrain nitrogen decomposition, with optimal nitrogen removal observed at C/N ratios of 6 or 7. Moderate C/N values (6–7) support diverse and stable microbial networks, ensuring treatment system stability. Microorganisms play a pivotal role in nitrogen transformation, with the nirk gene being crucial for NH4+−N conversion, while the AOA gene dominates NO2−N and TN conversion. This study offers practical guidance for identifying a suitable C/N ratio for wastewater treatment and establishes a theoretical foundation for regulating nitrogen removal by microbial communities in constructed wetlands within nitrogen removal systems.

1. Introduction

In the face of the increasingly severe issue of environmental pollution today, constructed wetlands have emerged as an effective tool for wastewater treatment and ecosystem restoration [1]. With rapid urbanization, the excessive discharge and imbalanced cycling of nitrogen pose potential threats to aquatic ecosystems and human health [2]. The discharge of nitrogen compounds in the effluents of urban sewage treatment plants has become a major source of nitrogen emissions [3]. These nitrogen compounds, such as nitrates and nitrites, if not effectively treated, can lead to environmental problems such as eutrophication, algal blooms, and fish mortality events [4]. The anaerobic denitrification process of microorganisms plays a crucial role in nitrogen removal from water bodies, where the carbon source supply directly affects the denitrification process [5]. Insufficient carbon can inhibit denitrification, while excessive carbon can limit nitrification reactions due to competition for dissolved oxygen [6]. Properly regulating the C/N in the influent can optimize the design and operation of constructed wetland systems, maximize denitrification efficiency, and reduce the operational costs of denitrification.
Over the past few decades, constructed wetlands have found wide applications in wastewater treatment, ecosystem restoration, and water resource management. They are considered a sustainable, cost-effective solution capable of efficiently removing pollutants from wastewater, enhancing water quality, and providing habitat preservation and ecological services [1,7]. In constructed wetland systems, nitrogen removal is primarily achieved through denitrification processes [8]. In oxygen-deficient or low-oxygen environments, denitrifying bacteria within the microbial community reduce nitrates and nitrites to molecular nitrogen (N2), effectively removing nitrogen from the water [9]. When the C/N is appropriate, nitrogen removal rates are typically higher. An adequate organic carbon supply helps to provide sufficient electron donors, facilitating the reduction of nitrates and nitrites to gaseous nitrogen, resulting in efficient denitrification processes [9]. High C/N ratios may lead to insufficient carbon supply, limiting denitrification rates and decreasing nitrogen removal efficiency [10]. Proper C/N control is essential for optimizing the nitrogen removal performance of constructed wetlands.
Microbial transformation is widely recognized as the primary pathway for nitrogen removal in constructed wetlands [11]. The unique matrix and microenvironment around plant roots provide an ideal living environment for these microorganisms, rich in functional genes essential for nitrogen transformation [12]. In general, nitrogen removal involves nitrification and denitrification [13]. Nitrification is a biological process where ammonia undergoes oxidation, first converting into nitrite and then into nitrate [14]. This process begins with ammonia-oxidizing bacteria (AOB), such as Nitrosomonas and Nitrosospira, which transform ammonia (NH4+−N) into nitrite (NO2−N). Subsequently, NO2−N is further oxidized to nitrate (NO3−N) by nitrite-oxidizing bacteria (NOB) like Nitrobacter and Nitrospira. Denitrification, on the other hand, involves the biological reduction of NO3−N to nitrogen gas (N2) and takes place under anoxic (low or no oxygen) conditions [15]. This multi-step process is executed by denitrifying bacteria, primarily facultative anaerobes. Initially, nitrate-reducing bacteria (NRB), encompassing various species of Pseudomonas and Paracoccus, reduce nitrate to nitrite. Subsequent reduction steps involve converting nitrite to nitric oxide (NO) through nitrite-reducing enzymes, followed by the conversion of nitric oxide to nitrous oxide (N2O) by nitric oxide reductase enzymes [16]. Finally, nitrous oxide is transformed into harmless N2 by nitrous oxide reductase enzymes, typically found in denitrifying bacteria like various species of Pseudomonas, Paracoccus, and Bacillus. The efficiency of these processes is influenced by various factors, with the C/N ratio being a significant determinant of microbial activity within constructed wetlands. Notably, specific microorganisms, including Planctomycetes, Verrucomicrobia, and Crenarchaeota, have demonstrated remarkable adaptations to low-nutrient conditions, showcasing their ability to perform efficient heterotrophic nitrification and aerobic denitrification [17,18]. Although the role of microorganisms in nitrogen removal (especially nitrification and denitrification) is well documented, studies of the composition and function of microbial communities in constructed wetlands are still limited, especially under different C/N influent ratio conditions.
This study involves the construction of a horizontal subsurface flow constructed wetland simulation system to mimic the treatment of urban sewage treatment plant effluent. By utilizing high-throughput sequencing and qPCR techniques, we aim to investigate the denitrification rate and efficiency of horizontal subsurface flow constructed wetlands under different C/N constraints. Our objective is to determine the optimal C/N operational conditions and provide a deeper analysis of the changes in the microbial community and nitrogen transformation functional genes within the constructed wetland system under varying C/N constraints. Our primary goals are as follows: (1) To ascertain the most effective C/N ratio for achieving optimal nitrogen removal and enhancing the performance of the constructed wetland. (2) To delve into the alterations in microbial community structures and nitrogen transformation functional genes under different C/N ratios, highlighting the crucial role of microorganisms in denitrification.

2. Materials and Methods

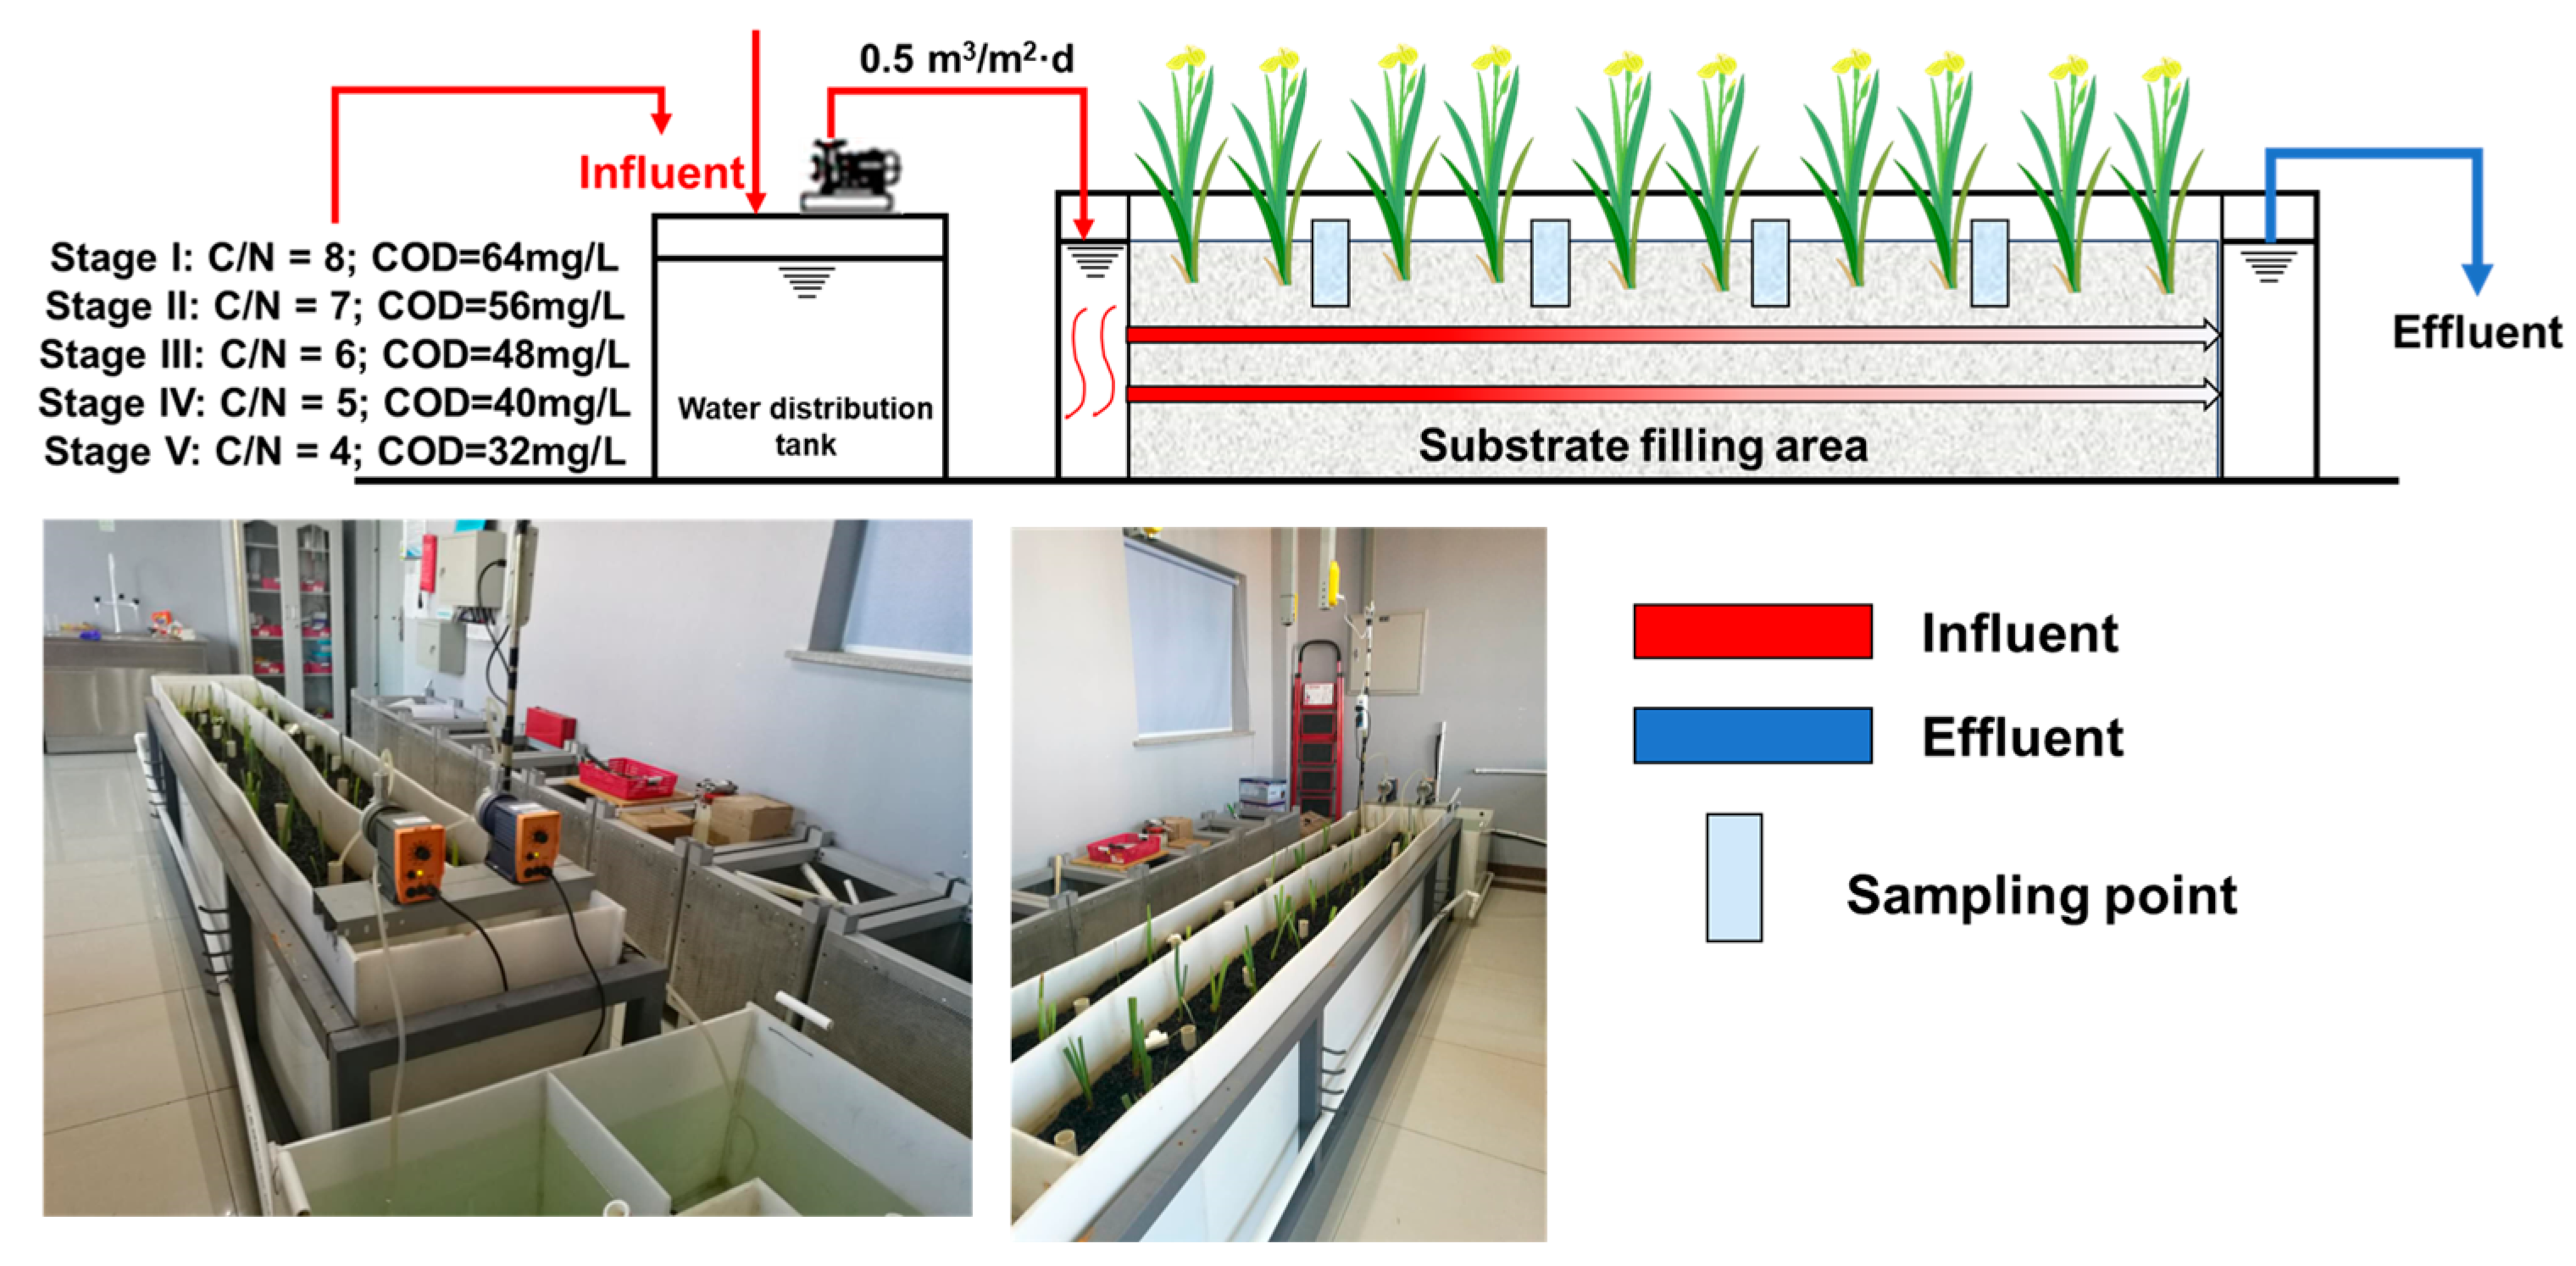
2.1. Construction of a Horizontal Submerged Constructed Wetland Simulation System

A comprehensive indoor horizontal subsurface flow constructed wetland simulation system was built, and experiments were conducted under different hydraulic loading conditions. Each system consisted of three components: a water distribution tank, a metering lift pump, and a constructed wetland simulation device. The constructed wetland simulation device was constructed from reinforced PP panels, with dimensions of 350 × 25 × 80 cm, comprising a 25 cm distribution zone, a 25 cm collection zone, and a central 300 cm filled with natural volcanic rock substrate (cross-sectional area of 0.16 m2).
Volcanic slag is a furnace-like, rough-textured volcanic aggregate formed through high-temperature combustion during volcanic eruptions, primarily composed of elements such as Fe, Si, C, Al, Na, Ca, and Mg. The Longwan Mountain range in Jingyu County and Huinan County, in the southeastern part of Jilin Province, China, boasts abundant reserves of volcanic slag. It has a rough, honeycomb-like surface and well-developed pores, and its lightweight nature and resilience make it an excellent substrate for physical and chemical adsorption. Its beneficial surface activity and porous structure, in particular, promote microbial attachment, forming a stable biofilm. As a substrate in constructed wetlands for sewage denitrification, volcanic slag exhibits significant potential. In this study, the interior of the substrate-filled area was filled with 5–8 mm of natural volcanic cinder substrate with a bulk density of 0.71 g/cm³, with a fill height of 60 cm and an operational water depth of 50–60 cm. Within the substrate, water quality samplers and microbial sampling bags were pre-installed for the regular collection and analysis of water quality and microbial samples. Wetland plants, specifically yellow flag irises, were planted on top of the volcanic slag substrate. Yellow flag iris is a perennial, rhizomatous aquatic plant well-suited for wetland environments. It excels in the removal of ammonia nitrogen and total nitrogen, has a long growth cycle, is cold-resistant, and can endure winter conditions. Its vibrant yellow flowers and beautiful appearance make it an ideal choice for enhancing water landscapes, making it widely applicable for water environment and aquatic ecosystem restoration (Figure 1).
During the initiation and acclimatization stages, microorganisms were cultivated using a nutrient solution. Artificial water (from tap water) addition was employed, consisting of C6H12O6, NH4CI, and KH2PO4 as the primary nutrients, with the addition of trace elements, including FeCl3·7H2O, CaCl2, NaHCO3, and MgSO4·7H2O (trace element additions are shown in Table 1, all experimental chemicals were purchased from Shanghai Aladdin Biochemical Technology Co., Ltd., Shanghai, China or Sinopharm Chemicai Reagent Co., Ltd., Shanghai, China) to simulate the primary B water (the concentrations of primary B substances in water are given in Table 2) quality conditions of municipal wastewater treatment plant effluents. In the initiation stage, the nutrient solution was formulated with a COD:N:P ratio of 50:10:1, with concentrations of COD, and P being 50 mg/L, N 10 mg/L, and 1 mg/L. The pH was maintained between 6.8 and 7.2, inlet dissolved oxygen was maintained at approximately 10.0 mg/L, and the temperature ranged from 14 to 24 °C. The nutrient solution was placed in a distribution tank, and the system operated with intermittent low-flow water addition (hydraulic loading of 0.2 m3/(m2·d)) for three days, after which a partial replacement of the nutrient solution occurred daily, with continued operation for 11 days (biofilm formation for two weeks). The goal was to expedite the adaptation and microbial growth in the constructed wetland through prolonged contact with the wastewater and complete effective microbial inoculation. During this stage, intermittent operation created favorable anaerobic/aerobic microenvironments, promoting the growth and acclimatization of various denitrifying bacterial groups. After the biofilm formation stage, the system entered the acclimatization stage, operating under different hydraulic loading conditions while simulating actual wastewater until the COD removal efficiency exceeded 70%, signifying a successful system startup.

2.2. Different C/N Ratios Settings and Sampling Procedures

A horizontal subsurface flow constructed wetland simulation system was tested for influent C/N control. The system was acclimatized and started up with a hydraulic load of 0.50 m3/(m2·d) and an initial C/N ratio of 10 (COD = 80 mg/L). During the formal operation stage, the C/N values were adjusted to 8, 7, 6, 5 and 4 in sequence, with each stage lasting five weeks. The influent NH4+−N concentration was maintained at 8.0 mg/L throughout the experiment, while the influent COD concentration was adjusted according to the C/N ratios, being 64, 56, 48, 40, and 32 mg/L to facilitate the simulation tests. Water samples and microbiological samples (matrices) were collected every 7 days for the timely measurement of water quality parameters, including COD, NH4+−N, NO2−N, NO3−N, and TN using standard methods (Methods for Monitoring and Analyzing Water and Wastewater, 2002 [19]). Specifically, COD analysis involved the preparation of a solution containing K2Cr2O7 and H2SO4. Through oxidation of organic matter via heating, the remaining dichromate was titrated with ferrous ammonium sulfate to determine oxygen consumption, thus providing COD concentration in mg/L. For the quantification of NH4+−N, methods such as the salicylic acid method were employed. This process involves the conversion of ammonia nitrogen into ammonia gas, leading to the formation of colored compounds that were spectrophotometrically measured to determine NH4+−N concentration. Distinct methods were utilized for the analysis of NO2−N and NO3−N. Nitrite was determined via diazo dye formation using sulfanilamide and N−(1−naphthyl) ethylenediamine dihydrochloride, whereas nitrate was assessed through reduction to nitrite, followed by diazo dye formation. Both concentrations were subsequently spectrophotometrically determined in mg/L. The assessment of TN involved sample digestion to convert nitrogen species into ammonia, followed by NH4+−N measurement, enabling the calculation of TN. pH and dissolved oxygen (DO) levels were monitored using a HACH DR2800 (HACH DR2800, Hach Company, Loveland, Colorado) multifunctional water quality analyzer. These net nitrogen emission rates were determined by subtracting the effluent concentration from the influent concentration and dividing by the 18-h residence time. Four sampling points were taken across the substrate and all samples were evenly mixed. Microbiological samples (substrates) were stored in a refrigerator at −80 °C and subsequently subjected to high-throughput PCR amplification to assess the diversity of bacteria in the samples and determine the gene copy number of AOA, AOB, nxrA, narG, nirK, nirS, and nosZ. Detailed parameters and primers are given in the Supporting Materials.

2.3. Statistical Analysis

Alpha diversity (richness and Shannon diversity) indices of microbial communities under different C/N ratios were assessed using the ‘vegan’ package of R software (version 4.1.3, https://www.r-project.org/). A non-metric multidimensional scale (NMDS) was constructed for analyzing bacterial community structure at different C/N ratios based on the Bray–Curtis distance matrix. And we used the stress value (when stress < 0.05, it means that the NMDS analysis can be well represented) to assess beta diversity. Analysis of variance (ANOVA) and Tukey’s Honest Significant Difference (HSD) post hoc tests were used to assess differences in alpha diversity and nitrogen transformation functional groups between microbial communities. In cases of non-normality or heteroscedasticity, non-parametric Kruskal–Wallis analyses were used. We also assessed the effect of major bacterial taxa on nitrogen transformation using redundancy analysis (RDA). The correlation network of microorganisms was constructed using Spearman’s test and corrected for p-values using the “BH” algorithm, selecting OTUs (Operational Taxonomic Units) with correlation coefficients |r| > 0.7, p < 0.05. The microbial interaction network was plotted using Gephi (v 0.9, https://gephi.org/). The effect of microbial communities on the efficiency of nitrogen removal was assessed using Spearman’s test, and their relationship was analyzed via the random forest model.

3. Results and Discussion

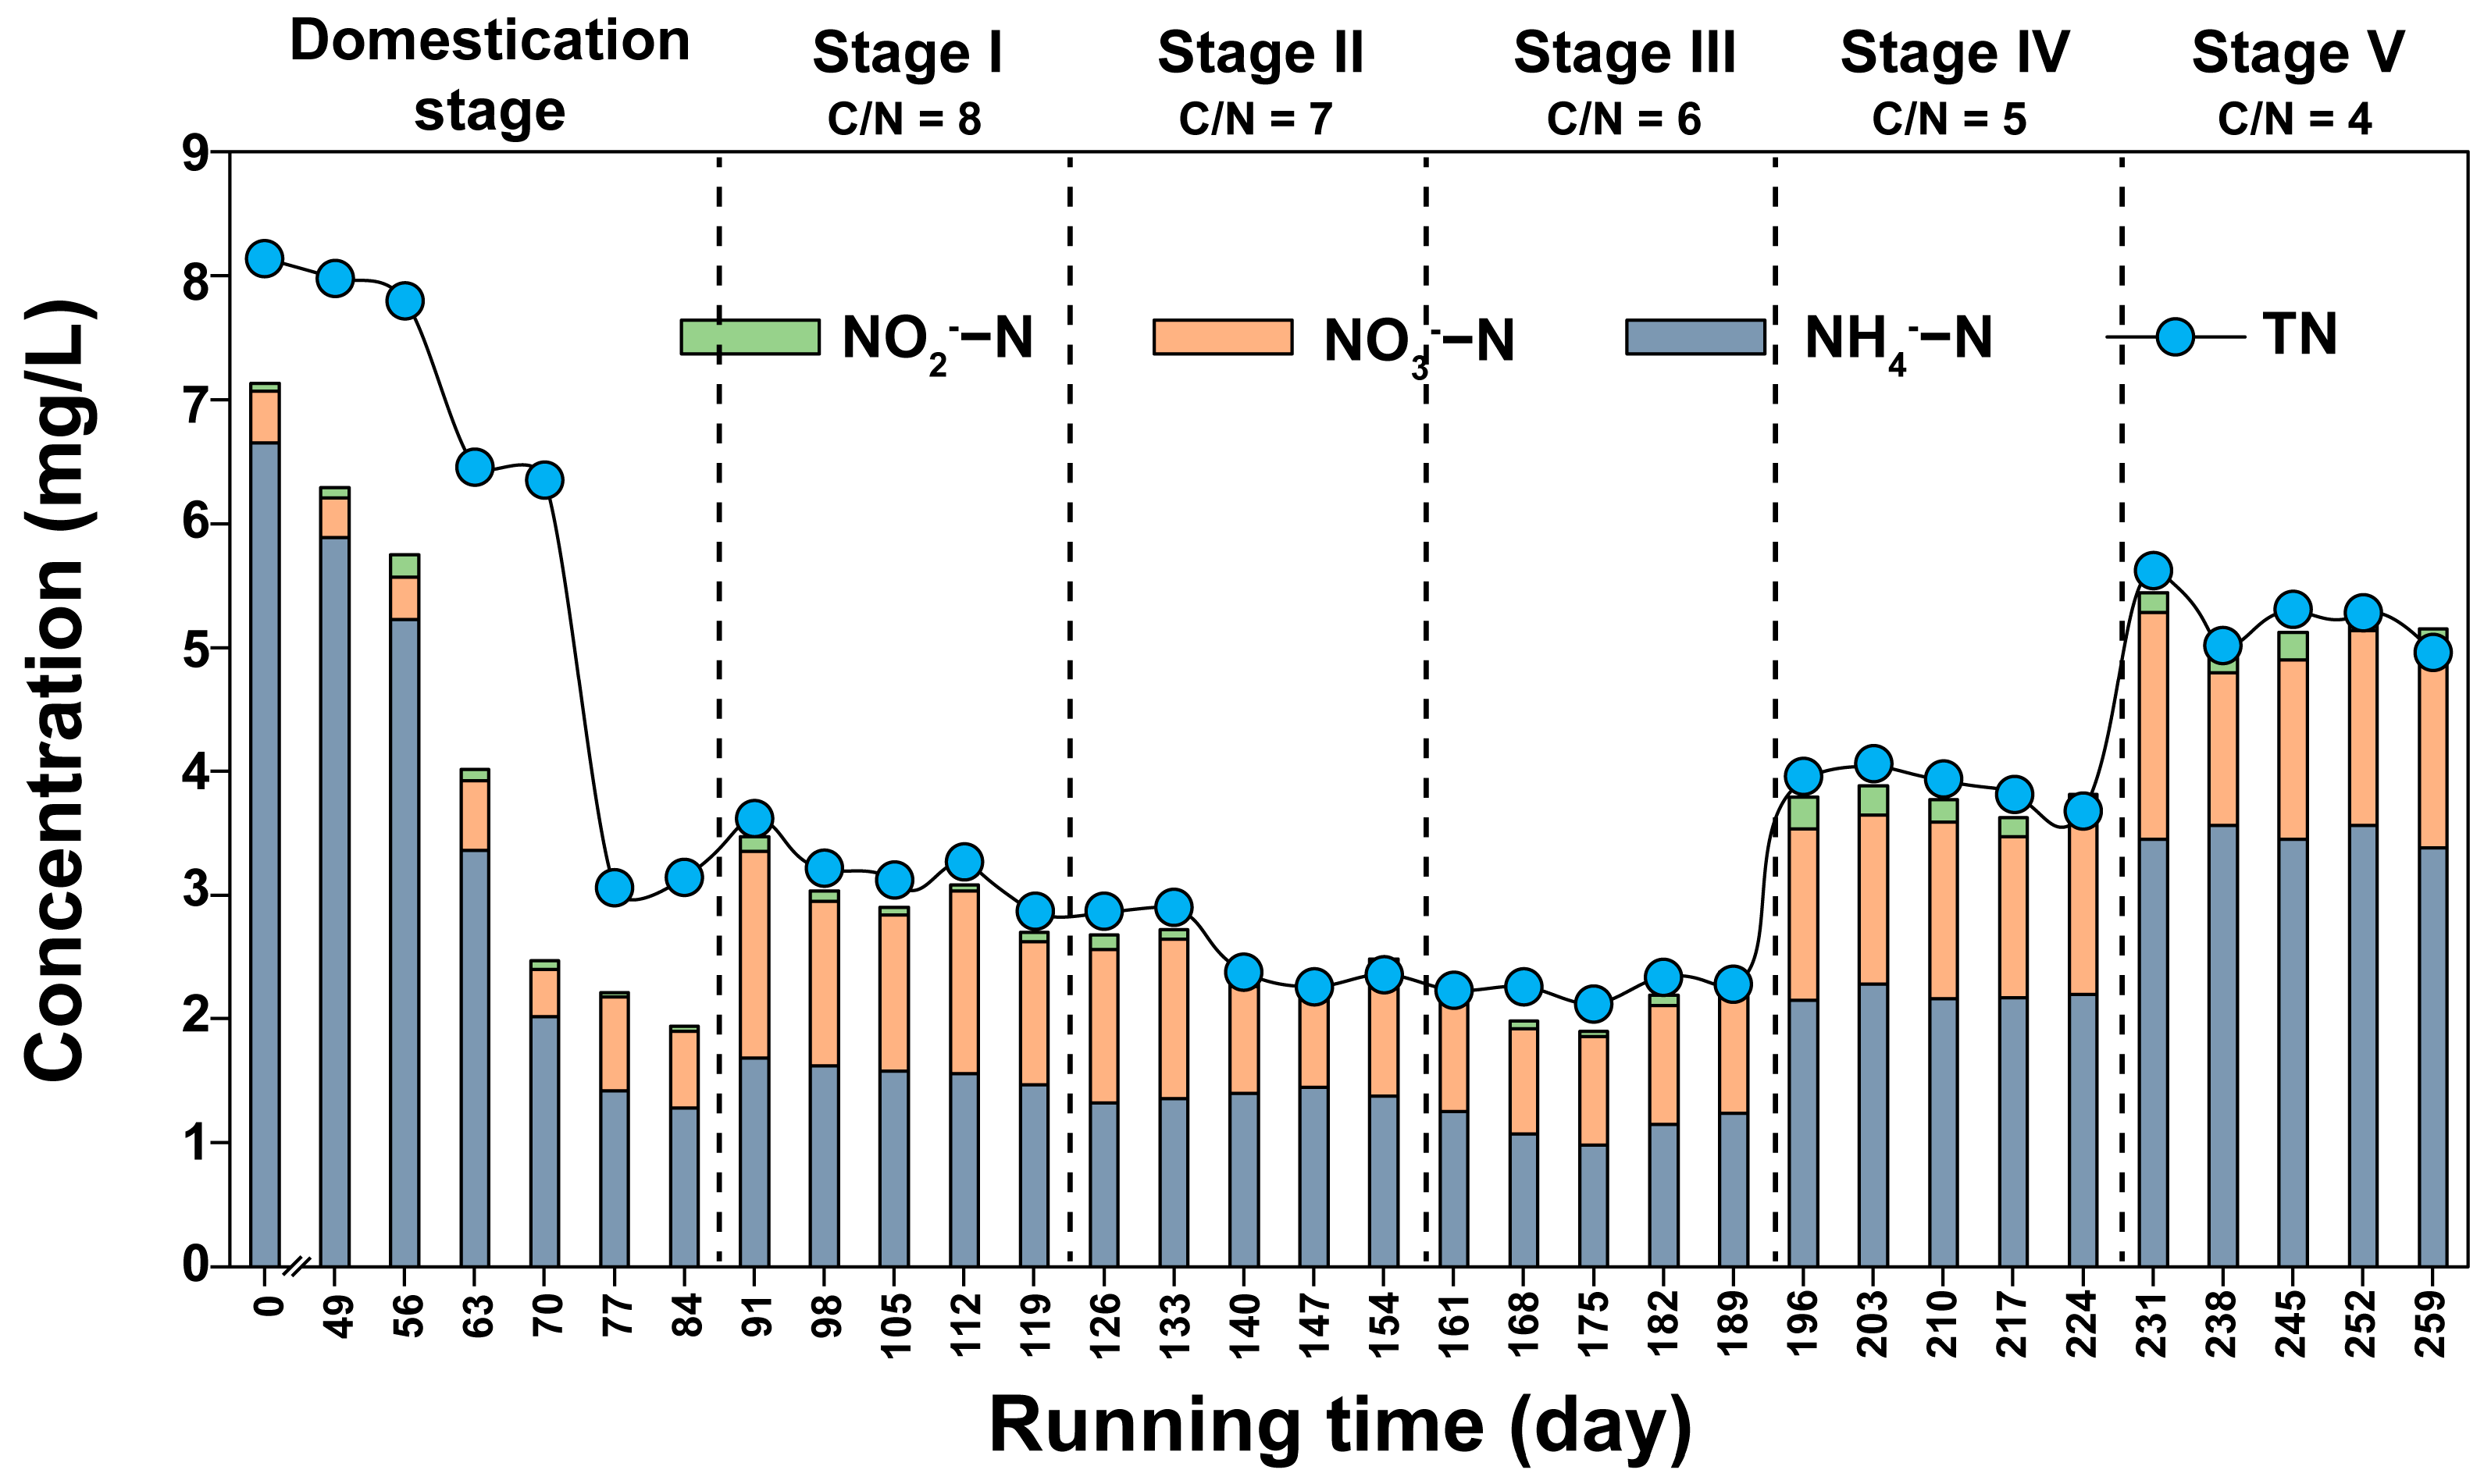
3.1. COD and Nitrogen Removal from Constructed Wetlands under Different C/N Ratios

Under a hydraulic load of 0.5 m3/(m2·d), the constructed wetland system underwent acclimatization and operation. Figure 2 illustrates the changes in COD and NH4+−N influent and effluent concentrations, as well as removal rates. During the acclimatization stage, the average influent COD concentration was 80 mg/L, the NH4+−N concentration was 8.08 mg/L, and the C/N ratio was approximately 10. Starting from day 49, the effluent COD concentration noticeably decreased to 25.28 mg/L, and the NH4+−N concentration began decreasing from day 56, reaching 4.26 mg/L. Over time, the effluent COD and NH4+−N concentrations gradually decreased, while the removal rates increased. By day 70 of system operation, the COD removal rate reached 67.74%, with an effluent concentration of 20.18 mg/L. The NH4+−N removal rate reached 79.86%, with an effluent concentration of 1.68 mg/L, signifying the successful initiation of the domestication stage.
From day 91 onwards, the system transitioned into the formal experimental operational stage (Figure 2). Throughout this period, the influent NH4+−N concentration was maintained at an average of 8.18 mg/L. The experiments involved the control of influent COD concentrations to achieve varying C/N ratios of 8, 7, 6, 5, and 4. As the C/N ratio decreased, both COD (Figure 2a) and NH4+−N (Figure 2b) removal rates initially increased and then declined. The highest removal rates were observed at C/N = 7 and C/N = 6. Under C/N = 7 conditions, the average COD removal rate was 75.34%, and the NH4+−N removal rate was 78.18%. In the case of C/N = 6, the average COD removal rate was 73.22%, and the NH4+−N removal rate was 80.64%. However, as C/N continued to decrease, both COD and NH4+−N removal rates decreased. This phenomenon can be attributed to the predominance of autotrophic nitrifying bacteria in the system. In conditions of a high C/N value (7–8) and elevated influent COD, anaerobic bacteria rapidly proliferate, displacing autotrophic nitrifying bacteria from their ecological niche, disrupting the dominant species or colony structure, and, consequently, limiting the nitrification process [20]. Conversely, when the C/N ratio is lower, in the range of 4–5, the removal rate of NH4+−N decreases due to the lower influent COD concentration. This reduced availability of organic carbon hampers the growth and enrichment of denitrifying bacteria in the system [21]. Denitrification, which is the final step in nitrogen removal, relies on microorganisms using nitrate and nitrite nitrogen as electron acceptors and the water body’s carbon source as an electron donor under anaerobic or low-oxygen conditions [22]. The denitrification process transforms nitrate and nitrite nitrogen into nitrogen gas, which is then discharged from the system. It is well established that the availability of a carbon source is a critical limiting factor for denitrification [5,23,24]. Therefore, in scenarios where deep wastewater treatment is required to meet stringent water quality standards and influent COD concentrations are low, the addition of an external carbon source becomes essential to enhance system performance.

3.2. Conversion Rates of Nitrogen in Constructed Wetlands under Different C/N Ratios

As shown in Figure 3, the inter-transformation between the three nitrogen forms in the constructed wetland system during different stages. The rapid decrease in the NH4+−N concentration during the start-up domestication stage is inseparable from the adsorption of the substrate. This stage represents the establishment of favorable conditions for microbial communities to develop and perform their functions, which include the adsorption of ammonium onto various surfaces in the wetland [25,26]. From the first stage to the third stage of the system (when the C/N ratios was 8–6), the effluent NH4+−N concentration and TN concentration continuously decreased, and when the C/N ratio was 6 (the average water temperature was 20.8 °C), the average effluent NH4+−N concentration was 1.59 mg/L, the average removal rate reached 80%, the average effluent TN concentration was 2.25 mg/L, and the average removal rate reached 74%, and the human system operation was effective in removing the three nitrogen species 74%; thus, the human artificial system operation effect reaches the best possible state. However, in the treatment of low C/N wastewater (C/N ratios of 5–4), with the reduction in the influent COD concentration and C/N ratios, the accumulation of NH4+−N was enhanced, and the removal effect of NH4+−N and TN was relatively limited. This phenomenon can be attributed to the presence of excess nitrate due to the decreased C/N ratio, which negatively impacted the removal of other nitrogen compounds. This suggests that the system’s performance is influenced by the intricate balance of nutrient ratios and their subsequent impact on the treatment processes [27,28].
Through the analysis of the influence of C/N on the net nitrogen emission rates of various forms of nitrogen, it was observed that there were significant differences in the net nitrogen emission rate of NH4+−N, NO3−N, NO2−N, and TN (Figure 4). The accumulation rate of NO2−N was almost zero (ranging from 0.11 to 1.55 g/(m3·d)). Throughout the entire operational period with C/N ratios ranging from 8 to 4, the net nitrogen emission rate of NH4+−N and TN exhibited a consistent operational trend. During the three operational stages with C/N ratios of 8 to 6, the net nitrogen emission rates of NH4+−N and TN remained at relatively higher levels. However, when C/N ratio decreased from 5 to 4, a noticeable decrease in the net nitrogen emission rates of NH4+−N and TN became evident. The average net nitrogen emission rate of NH4+−N decreased from 8.63 g/(m3·d) to 7.81 g/(m3·d), and the system’s average TN net nitrogen emission rate decreased from 7.18 g/(m3·d) to 5.99 g/(m3·d). In cases where the C/N ratio is low (in the 5–4 range), it indicates a shortage of organic carbon relative to the nitrogen content. Under these conditions, the microbial processes responsible for nitrogen removal may become carbon-limited, thereby constraining the system’s ability to efficiently convert NH4+−N into NO3−N and, subsequently, into N2 [10,29]. Also, if nitrate accumulates in constructed wetland ecosystems, it will limit microbial activity, further limiting ammonia and total nitrogen removal [5].

3.3. Effects on Microbial Diversity in Constructed Wetlands under Different C/N Ratios

The community composition of bacteria significantly changed under different C/N ratios (Figure 5a). When the C/N ratio was high, specifically at C/N = 8, Firmicutes dominated the bacterial community. However, as the experimental period progressed, the relative abundance of Firmicutes decreased, and the Proteobacteria population increased. This shift suggests that under high C/N ratios, Firmicutes were favored due to their ability to efficiently utilize the available nutrients, but as nutrient dynamics changed over time, other bacterial groups like Proteobacteria adapted and became more prominent [30,31]. Firmicutes, encompassing a diverse spectrum of bacteria, notably contribute to organic matter degradation in wastewater treatment environments [32]. Certain Firmicutes species possess the ability to break down complex organic compounds, actively participating in the decomposition and mineralization of organic matter [33]. While their primary role is associated with organic matter decomposition, their activity indirectly influences nitrogen transformation processes. By decomposing organic substrates, Firmicutes release nitrogenous compounds, subsequently becoming available for nitrogen-utilizing microorganisms, thereby indirectly impacting nitrogen cycling processes. Notably, under C/N = 6, the abundance of Proteobacteria was relatively low (7.24–10.92%). This could be due to the fact that at this C/N ratio, the system’s nutrient balance may not be as favorable for the rapid growth and proliferation of Proteobacteria, leading to their lower abundance compared to other stages [34]. Proteobacteria, recognized as one of the most abundant bacterial phyla, encompass various genera involved in nitrogen cycling processes [35]. Specifically, Beta-, Gamma-, and Delta-Proteobacteria groups within this phylum are key contributors to nitrogen removal: Members of Beta- and Gamma-Proteobacteria are actively involved in the oxidation of ammonia to nitrite and further to nitrate. These steps are pivotal in the nitrification process, significantly contributing to nitrogen conversion. Certain Gamma- and Delta-Proteobacteria species exhibit facultative anaerobic metabolism, enabling their contribution to denitrification [36]. They play a crucial role in converting nitrate to N2 through denitrification, thereby effectively removing nitrogen from the system. Overall, the changes in bacterial community composition are reflective of the microbial response to variations in nutrient availability, particularly the C/N ratio. Bacterial populations that are better adapted to the prevailing nutrient conditions tend to become more dominant, while those less suited to the changing conditions may decrease in abundance [31]. An analysis of the bacterial community structure using NMDS revealed that the first stage (C/N = 8) was also clearly separated from the later stages, which is closely related to the fact that the system is still in its initial stage (Figure 5b). Bacterial communities often undergo changes in response to various environmental factors, including nutrient availability, temperature, time, and other external stimuli. These alterations can be seen as a form of microbial adaptation or acclimatization rather than a traditional notion of evolutionary change, as bacterial populations typically exhibit rapid changes in composition and structure over shorter time scales.
Different C/N had a large effect on the bacterial diversity and abundance of functional genes (Figure 6). Higher C/N (C/N = 8) or lower bacterial richness and Shannon diversity, as well as the lowest 16 s gene copy number in the first stage, indicated that the abundance of species of microorganisms in the nutrient-poor environment of the constructed wetland was relatively low in the initial stage, despite the high C/N and the fact that bacterial growth was inhibited [37]. However, with the increase in the incubation time, AOA, AOB, nirK, nosZ, and narG gene copy numbers were higher in the third stage (C/N = 6) (p < 0.05). Under moderate C/N ratios (C/N = 7, 6), the nirS gene copy number was higher (p < 0.05), indicating that such moderate C/N ratios were favorable to the activities of nitrogen-transforming microorganisms, and the functioning of the constructed wetland ecosystems gradually reached a more desirable state [38].
With the change in C/N, the network structure of the bacteria also significantly changed (Figure 7), with the most complex network structure and the highest values for the edges and dots being found in the second and third stages (C/N = 6, 7) (Stage I: node = 564, Edge = 2672; Stage 2: node = 535, Edge = 1734). The increase in complexity in the network structure with changing C/N ratios suggests that different microbial interactions and relationships are favored under these specific nutrient conditions. In the case of C/N = 6 and 7, there is a greater diversity of interactions between bacterial species, resulting in more nodes and edges within the network. This complexity may be associated with the presence of a wider range of bacterial species and their diverse metabolic activities [39]. The presence of the highest number of negative links in the bacterial networks at C/N = 6 and 7 implies a greater level of stability within the bacterial community under these conditions. Negative links can indicate a balance in microbial interactions and, potentially, a higher resistance to environmental perturbations [40,41]. This suggests that C/N ratios of 6 and 7 provide conditions that promote a more stable and resilient microbial community. The persistence of Firmicutes and Proteobacteria in all networks indicates that these bacterial phyla are well adapted to a range of C/N conditions and may play crucial roles in maintaining the stability and functionality of the bacterial communities. Their consistent presence suggests that they are keystone species with versatile metabolic capabilities [42].

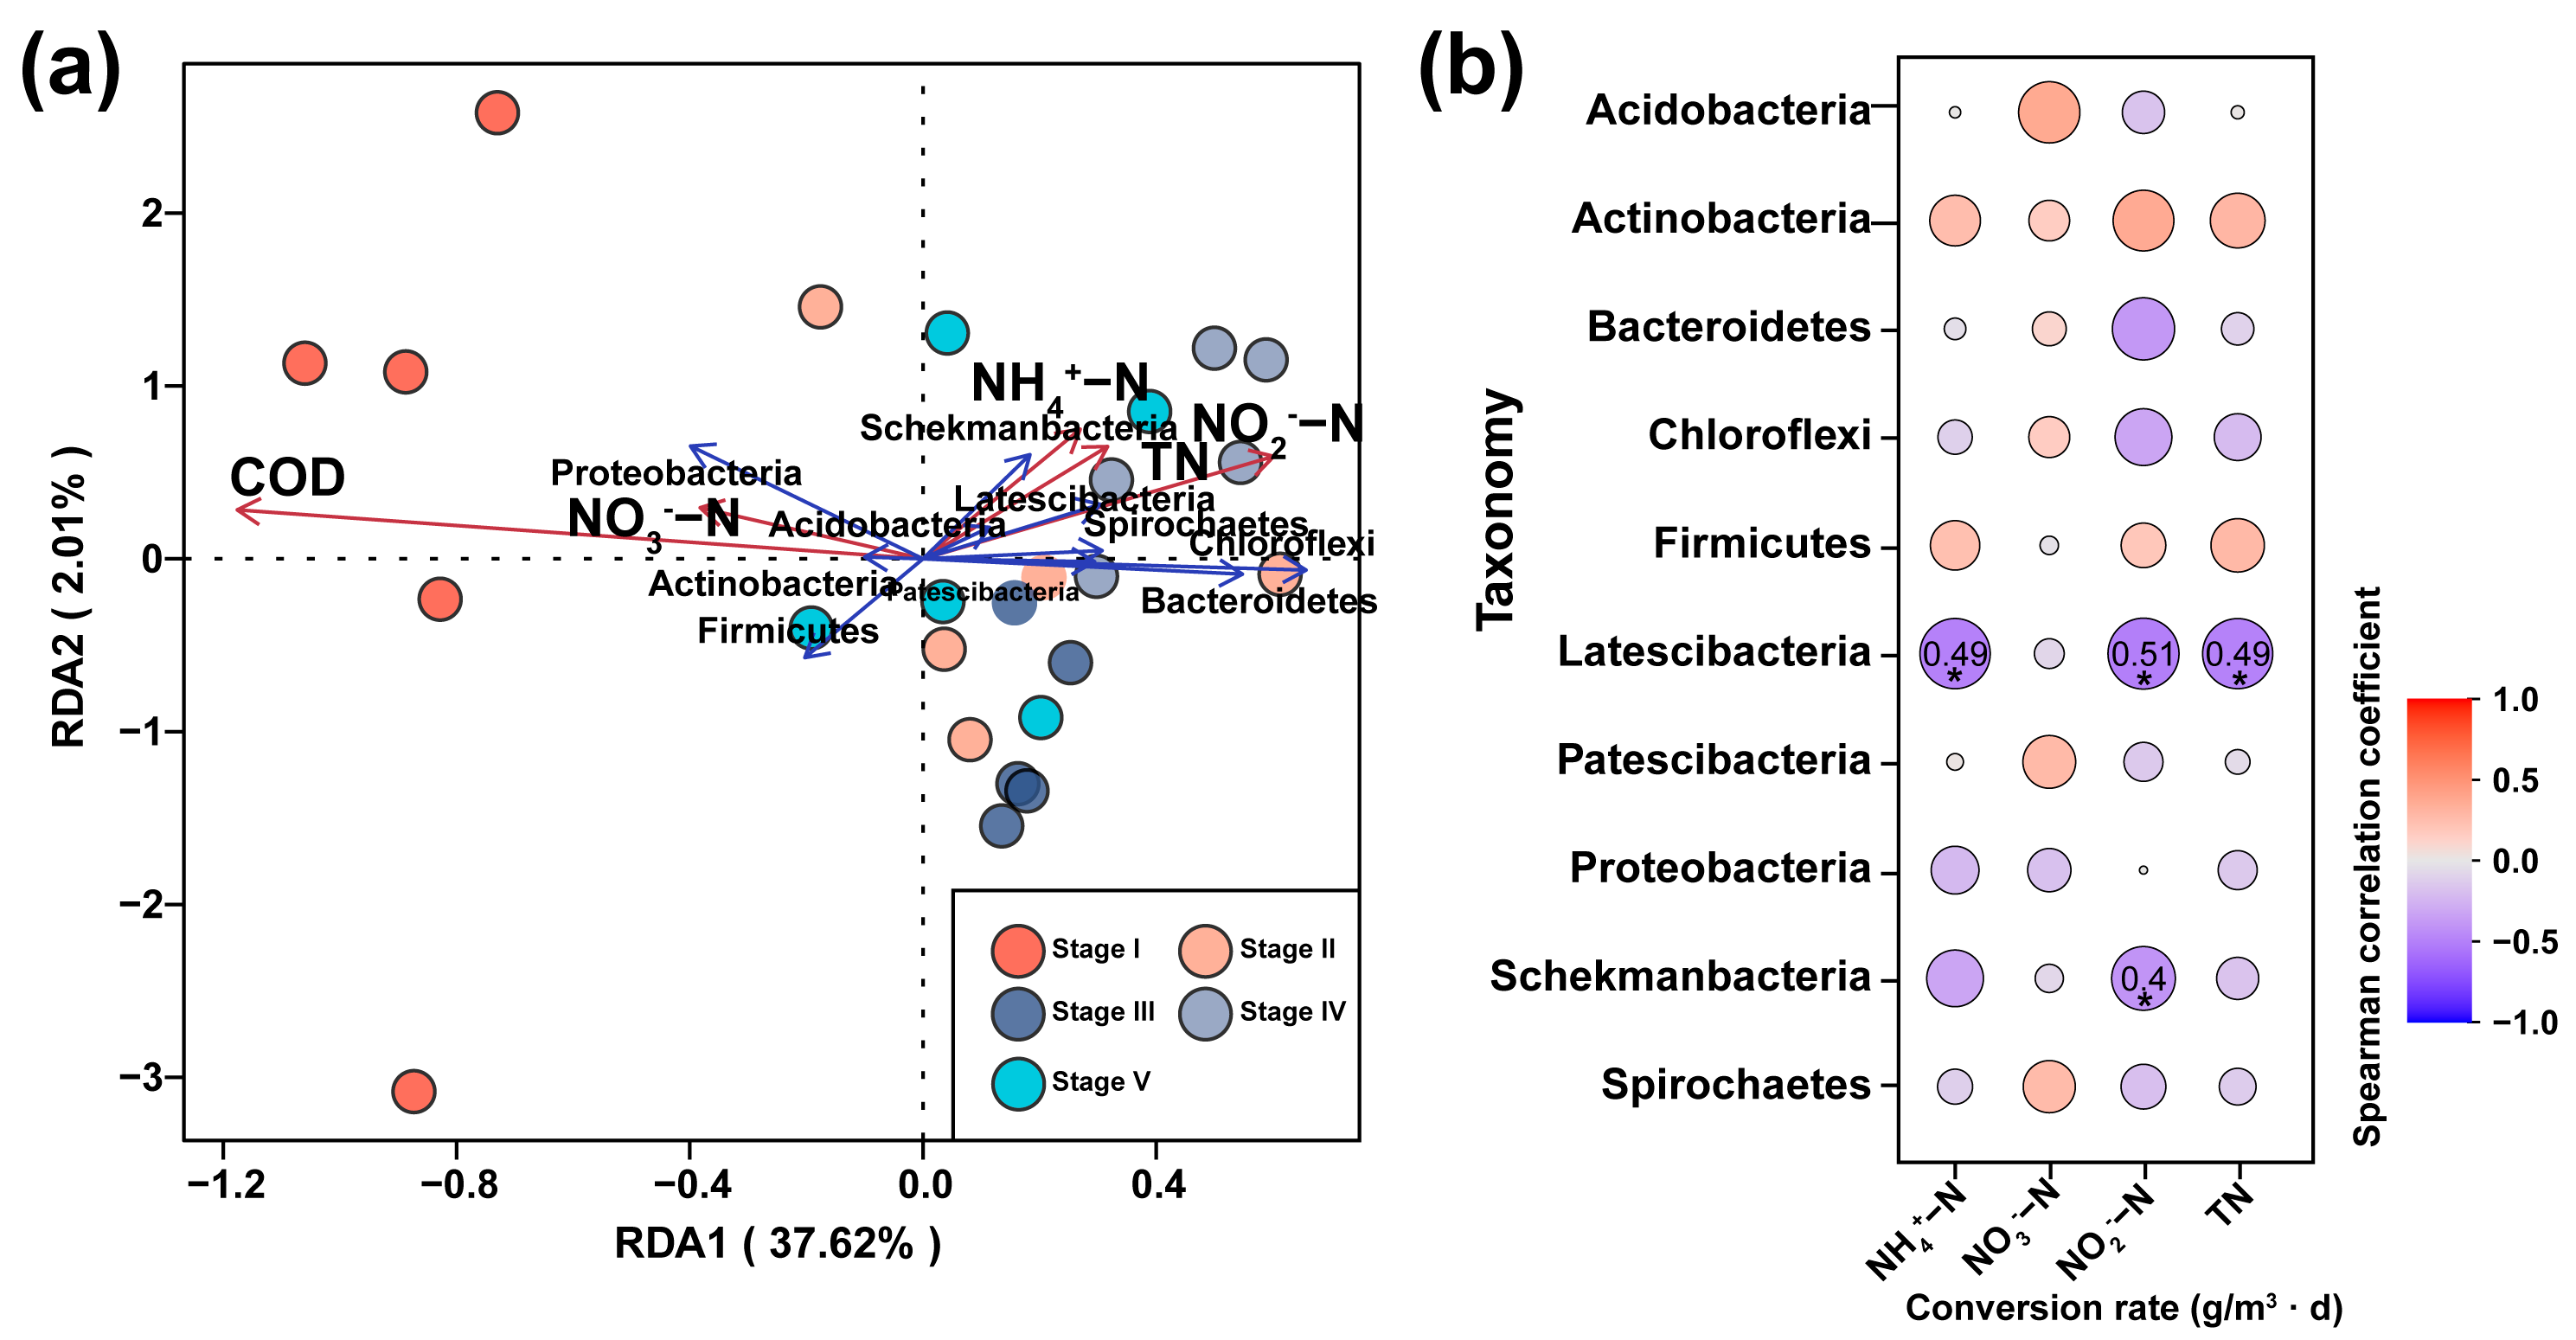
3.4. Effects of Microorganisms on Nitrogen Transformation in Constructed Wetlands

RDA analysis revealed that the sum of the explanatory rates of the first two axes accounted for 39.63% of the variation, with the first axis alone explaining 37.62% (Figure 8a). This indicates that the majority of the variability in the data can be attributed to the first axis, which has a higher explanatory power. Notably, the RDA analysis demonstrated that the removal of COD and NO3−N was more pronounced during the first stage, when the system had a higher C/N ratio (C/N = 8). As the C/N ratios decreased (C/N = 7, 6, 5, 4), the removal of NH4+−N, NO2−N, and TN became more significant. This suggests that the system’s performance in terms of nitrogen and COD removal is closely tied to the C/N ratio, with different stages of the treatment process responding differently to variations in this ratio [43]. The correlation analyses examined the relationship between the dominant bacterial phyla and net nitrogen emission rate (Figure 8b). It was found that the abundance of Latescibacteria was significantly correlated (p < 0.05) with the conversion of NH4+−N, NO2−N, and TN. This correlation indicates that Latescibacteria play a pivotal role in facilitating the conversion of these nitrogen compounds, highlighting their importance in the nitrogen removal process [44].
The random forest model, as depicted in Figure 9, serves as a powerful tool for gaining a clearer understanding of the microbial factors affecting the net nitrogen emission rate [45]. This model employs machine learning techniques to reveal the complex relationships between microorganisms and the net nitrogen emission rate. Many studies have shown that the abundance of major nitrogen cycle functional genes is positively influenced by nitrogen and carbon availability [46,47]. The analysis revealed that microorganisms had the most significant explanatory power for the NH4+−N net nitrogen emission rate, with an R2 value of 80.88% (Figure 9a). This high R2 value indicates that microbial communities play a dominant role in influencing the NH4+−N net nitrogen emission rate. The most influential factor affecting NH4+−N net nitrogen emission rate was found to be the abundance of nirk genes, suggesting that microorganisms harboring these genes are crucial in driving NH4+−N transformations. On the other hand, the net nitrogen emission rate s of NO2−N and TN were most strongly influenced by the abundance of AOA genes (Figure 9c,d). According to [48], NO3−N is the final product of the electrochemical oxidation of NH4+−N in nitrifying constructed wetlands, but it inevitably promotes NO2−N accumulation. This suggests that denitrifying bacteria, especially the nirk gene, are more important in the whole reaction system, and the removal of NH4+−N in this study should mainly be carried out via the nitrification-denitrification process [49].

4. Conclusions

In this study, we meticulously explored the dynamics of microbial communities in constructed wetlands under varying C/N ratios (8, 7, 6, 5, and 4) over 259 days. Our investigation focused on understanding how these ratios influence organic matter decomposition and nitrogen removal. We observed that lower C/N ratios initially boost COD and NH4+−N removal. However, excessively low ratios can impede NH4+−N removal. This underlines the critical balance between nutrient availability and microbial activity for efficient nitrogen processing. The C/N ratio is a significant determinant of microbial community composition. We found that moderate C/N values (6–7) foster a diverse and stable microbial ecosystem, which is crucial for the consistency and reliability of the treatment systems. Our study highlights the pivotal role of microorganisms in nitrogen transformation, particularly in NH4+−N net conversion. The prominence of nirk genes in this process is noteworthy, while AOA genes are instrumental to NO2−N and TN conversion. In summary, our study advances the understanding of the complex interactions between C/N ratios, microbial dynamics, and nitrogen removal in wastewater treatment.

Supplementary Materials

The following supporting information can be downloaded via this link: https://www.mdpi.com/article/10.3390/w15244272/s1, Table S1: Primers used in PCR experiments.

Author Contributions

Conceptualization, X.B. and J.L.; methodology, J.L.; writing—original draft preparation, X.B. and J.L.; writing—review and editing, S.C.; supervision, S.C.; funding acquisition, S.C. All authors have read and agreed to the published version of the manuscript.

Funding

This study was supported by the Open Research Fund of State Environmental Protection Key Laboratory of Drinking Water Source Protection, the Chinese Research Academy of Environmental Sciences (2022YYSYKFYB08), and the Fundamental Research Funds for the Central Public-interest Scientific Institution (2022YSKY-01).

Data Availability Statement

The data are contained within the article.

Conflicts of Interest

The authors declare no conflict of interest.

References

  1. Vymazal, J.; Zhao, Y.; Mander, Ü. Recent Research Challenges in Constructed Wetlands for Wastewater Treatment: A Review. Ecol. Eng. 2021, 169, 106318. [Google Scholar] [CrossRef]
  2. Tang, W.; Pei, Y.; Zheng, H.; Zhao, Y.; Shu, L.; Zhang, H. Twenty Years of China’s Water Pollution Control: Experiences and Challenges. Chemosphere 2022, 295, 133875. [Google Scholar] [CrossRef] [PubMed]
  3. Zheng, F.; Wang, J.; Xiao, R.; Chai, W.; Xing, D.; Lu, H. Dissolved Organic Nitrogen in Wastewater Treatment Processes: Transformation, Biosynthesis and Ecological Impacts. Environ. Pollut. 2021, 273, 116436. [Google Scholar] [CrossRef] [PubMed]
  4. Fouzia, H.B. Monitoring of Marine Pollution; BoD—Books on Demand: Norderstedt, Germany, 2019; ISBN 978-1-83880-811-2. [Google Scholar]
  5. Fu, X.; Hou, R.; Yang, P.; Qian, S.; Feng, Z.; Chen, Z.; Wang, F.; Yuan, R.; Chen, H.; Zhou, B. Application of External Carbon Source in Heterotrophic Denitrification of Domestic Sewage: A Review. Sci. Total Environ. 2022, 817, 153061. [Google Scholar] [CrossRef] [PubMed]
  6. Hu, B.; Wang, T.; Ye, J.; Zhao, J.; Yang, L.; Wu, P.; Duan, J.; Ye, G. Effects of Carbon Sources and Operation Modes on the Performances of Aerobic Denitrification Process and Its Microbial Community Shifts. J. Environ. Manag. 2019, 239, 299–305. [Google Scholar] [CrossRef]
  7. Stefanakis, A.I. The Role of Constructed Wetlands as Green Infrastructure for Sustainable Urban Water Management. Sustainability 2019, 11, 6981. [Google Scholar] [CrossRef]
  8. Wu, H.; Wang, J.; Chen, J.; Wang, X.; Li, D.; Hou, J.; He, X. Advanced Nitrogen and Phosphorus Removal by Combining Endogenous Denitrification and Denitrifying Dephosphatation in Constructed Wetlands. J. Environ. Manag. 2021, 294, 112967. [Google Scholar] [CrossRef]
  9. Tang, S.; Liao, Y.; Xu, Y.; Dang, Z.; Zhu, X.; Ji, G. Microbial Coupling Mechanisms of Nitrogen Removal in Constructed Wetlands: A Review. Bioresour. Technol. 2020, 314, 123759. [Google Scholar] [CrossRef]
  10. Jia, W.; Yang, Y.; Yang, L.; Gao, Y. High-Efficient Nitrogen Removal and Its Microbiological Mechanism of a Novel Carbon Self-Sufficient Constructed Wetland. Sci. Total Environ. 2021, 775, 145901. [Google Scholar] [CrossRef]
  11. Kim, H.; Bae, H.-S.; Reddy, K.R.; Ogram, A. Distributions, Abundances and Activities of Microbes Associated with the Nitrogen Cycle in Riparian and Stream Sediments of a River Tributary. Water Res. 2016, 106, 51–61. [Google Scholar] [CrossRef]
  12. Zhang, M.; Huang, J.-C.; Sun, S.; Rehman, M.M.U.; He, S.; Zhou, W. Nitrogen Removal through Collaborative Microbial Pathways in Tidal Flow Constructed Wetlands. Sci. Total Environ. 2021, 758, 143594. [Google Scholar] [CrossRef] [PubMed]
  13. Ruiz, G.; Jeison, D.; Chamy, R. Development of Denitrifying and Methanogenic Activities in USB Reactors for the Treatment of Wastewater: Effect of COD/N Ratio. Process Biochem. 2006, 41, 1338–1342. [Google Scholar] [CrossRef]
  14. Francis, C.A.; Roberts, K.J.; Beman, J.M.; Santoro, A.E.; Oakley, B.B. Ubiquity and Diversity of Ammonia-Oxidizing Archaea in Water Columns and Sediments of the Ocean. Proc. Natl. Acad. Sci. USA 2005, 102, 14683–14688. [Google Scholar] [CrossRef] [PubMed]
  15. Groffman, P.M.; Altabet, M.A.; Böhlke, J.K.; Butterbach-Bahl, K.; David, M.B.; Firestone, M.K.; Giblin, A.E.; Kana, T.M.; Nielsen, L.P.; Voytek, M.A. Methods for Measuring Denitrification: Diverse Approaches to a Difficult Problem. Ecol. Appl. 2006, 16, 2091–2122. [Google Scholar] [CrossRef] [PubMed]
  16. Hink, L.; Gubry-Rangin, C.; Nicol, G.W.; Prosser, J.I. The Consequences of Niche and Physiological Differentiation of Archaeal and Bacterial Ammonia Oxidisers for Nitrous Oxide Emissions. ISME J. 2018, 12, 1084–1093. [Google Scholar] [CrossRef] [PubMed]
  17. Naylor, D.; McClure, R.; Jansson, J. Trends in Microbial Community Composition and Function by Soil Depth. Microorganisms 2022, 10, 540. [Google Scholar] [CrossRef]
  18. Ruuskanen, M.O.; Colby, G.; St. Pierre, K.A.; St. Louis, V.L.; Aris-Brosou, S.; Poulain, A.J. Microbial Genomes Retrieved from High Arctic Lake Sediments Encode for Adaptation to Cold and Oligotrophic Environments. Limnol. Oceanogr. 2020, 65, S233–S247. [Google Scholar] [CrossRef]
  19. HJ/T91-2002; Technical Specifications for Wastewater Monitoring 2002. China Standard Press: Beijing, China, 2002.
  20. Hossain, S.; Chow, C.W.K.; Cook, D.; Sawade, E.; Hewa, G.A. Review of Nitrification Monitoring and Control Strategies in Drinking Water System. Int. J. Environ. Res. Public Health 2022, 19, 4003. [Google Scholar] [CrossRef]
  21. Chen, H.; Li, X.; Liu, G.; Zhu, J.; Ma, X.; Piao, C.; You, S.; Wang, K. Decoding the Carbon and Nitrogen Metabolism Mechanism in Anammox System Treating Pharmaceutical Wastewater with Varying COD/N Ratios through Metagenomic Analysis. Chem. Eng. J. 2023, 457, 141316. [Google Scholar] [CrossRef]
  22. Ye, F.; Yan, J.; Li, T. Analysis of Municipal Sewage Pollution and Denitrification Treatment under Low Oxygen Conditions. Environ. Technol. Innov. 2021, 21, 101188. [Google Scholar] [CrossRef]
  23. Cherchi, C.; Onnis-Hayden, A.; El-Shawabkeh, I.; Gu, A.Z. Implication of Using Different Carbon Sources for Denitrification in Wastewater Treatments. Water Environ. Res. 2009, 81, 788–799. [Google Scholar] [CrossRef]
  24. Yang, X.; Wang, S.; Zhou, L. Effect of Carbon Source, C/N Ratio, Nitrate and Dissolved Oxygen Concentration on Nitrite and Ammonium Production from Denitrification Process by Pseudomonas Stutzeri D6. Bioresour. Technol. 2012, 104, 65–72. [Google Scholar] [CrossRef] [PubMed]
  25. Wu, J.; Zheng, J.; Ma, K.; Jiang, C.; Zhu, L.; Xu, X. Tertiary Treatment of Municipal Wastewater by a Novel Flow Constructed Wetland Integrated with Biochar and Zero-Valent Iron. J. Water Process Eng. 2022, 47, 102777. [Google Scholar] [CrossRef]
  26. Zhang, M.; Song, G.; Gelardi, D.L.; Huang, L.; Khan, E.; Mašek, O.; Parikh, S.J.; Ok, Y.S. Evaluating Biochar and Its Modifications for the Removal of Ammonium, Nitrate, and Phosphate in Water. Water Res. 2020, 186, 116303. [Google Scholar] [CrossRef] [PubMed]
  27. Hernández-del Amo, E.; Bañeras, L. Effects of High Nitrate Input in the Denitrification-DNRA Activities in the Sediment of a Constructed Wetland under Varying C/N Ratios. Ecol. Eng. 2021, 159, 106098. [Google Scholar] [CrossRef]
  28. Rajta, A.; Bhatia, R.; Setia, H.; Pathania, P. Role of Heterotrophic Aerobic Denitrifying Bacteria in Nitrate Removal from Wastewater. J. Appl. Microbiol. 2020, 128, 1261–1278. [Google Scholar] [CrossRef]
  29. Negi, D.; Verma, S.; Singh, S.; Daverey, A.; Lin, J.-G. Nitrogen Removal via Anammox Process in Constructed Wetland—A Comprehensive Review. Chem. Eng. J. 2022, 437, 135434. [Google Scholar] [CrossRef]
  30. Gualtieri, M.; Goglio, A.; Clagnan, E.; Adani, F. The Importance of the Electron Acceptor: Comparison between Flooded and Tidal Bioelectrochemical Systems for Wastewater Treatment and Nutrients Enriched Solution Production. Bioresour. Technol. Rep. 2023, 24, 101617. [Google Scholar] [CrossRef]
  31. Wang, J.; Long, Y.; Yu, G.; Wang, G.; Zhou, Z.; Li, P.; Zhang, Y.; Yang, K.; Wang, S. A Review on Microorganisms in Constructed Wetlands for Typical Pollutant Removal: Species, Function, and Diversity. Front. Microbiol. 2022, 13, 845725. [Google Scholar] [CrossRef]
  32. Adrados, B.; Sánchez, O.; Arias, C.A.; Becares, E.; Garrido, L.; Mas, J.; Brix, H.; Morató, J. Microbial Communities from Different Types of Natural Wastewater Treatment Systems: Vertical and Horizontal Flow Constructed Wetlands and Biofilters. Water Res. 2014, 55, 304–312. [Google Scholar] [CrossRef]
  33. White, B.A.; Lamed, R.; Bayer, E.A.; Flint, H.J. Biomass Utilization by Gut Microbiomes. Annu. Rev. Microbiol. 2014, 68, 279–296. [Google Scholar] [CrossRef] [PubMed]
  34. Lv, R.; Wu, D.; Ding, J.; Yuan, X.; Zhou, G.; Zhang, Y.; Kong, Q.; Zhao, C.; Du, Y.; Xu, F.; et al. Long-Term Performance and Microbial Mechanism in Intertidal Wetland Sediment Introduced Constructed Wetlands Treating Saline Wastewater. J. Clean. Prod. 2021, 310, 127409. [Google Scholar] [CrossRef]
  35. Cai, W.; Li, Y.; Niu, L.; Zhang, W.; Wang, C.; Wang, P.; Meng, F. New Insights into the Spatial Variability of Biofilm Communities and Potentially Negative Bacterial Groups in Hydraulic Concrete Structures. Water Res. 2017, 123, 495–504. [Google Scholar] [CrossRef] [PubMed]
  36. Thauer, R.K.; Shima, S. Methane as Fuel for Anaerobic Microorganisms. Ann. N. Y. Acad. Sci. 2008, 1125, 158–170. [Google Scholar] [CrossRef]
  37. Yao, Z.; Ren, Y.; Li, B.; Bai, G.; Zhao, S.; Yang, L.; Chi, Y. Effects of Plant Physiological Responses under Nitrogen Stress on Pollutant Removal in Subsurface Constructed Wetlands. J. Water Process Eng. 2023, 51, 103351. [Google Scholar] [CrossRef]
  38. Gao, F.; Liu, G.; She, Z.; Ji, J.; Gao, M.; Zhao, Y.; Guo, L.; Jin, C. Effects of Salinity on Pollutant Removal and Bacterial Community in a Partially Saturated Vertical Flow Constructed Wetland. Bioresour. Technol. 2021, 329, 124890. [Google Scholar] [CrossRef] [PubMed]
  39. Zeng, L.; Tao, R.; Tam, N.F.; Huang, W.; Zhang, L.; Man, Y.; Xu, X.; Dai, Y.; Yang, Y. Differences in Bacterial N, P, and COD Removal in Pilot-Scale Constructed Wetlands with Varying Flow Types. Bioresour. Technol. 2020, 318, 124061. [Google Scholar] [CrossRef]
  40. Huang, L.; Bai, J.; Wen, X.; Zhang, G.; Zhang, C.; Cui, B.; Liu, X. Microbial Resistance and Resilience in Response to Environmental Changes under the Higher Intensity of Human Activities than Global Average Level. Glob. Chang. Biol. 2020, 26, 2377–2389. [Google Scholar] [CrossRef]
  41. Ratzke, C.; Barrere, J.; Gore, J. Strength of Species Interactions Determines Biodiversity and Stability in Microbial Communities. Nat. Ecol. Evol. 2020, 4, 376–383. [Google Scholar] [CrossRef]
  42. Zeng, L.; Dai, Y.; Zhang, X.; Man, Y.; Tai, Y.; Yang, Y.; Tao, R. Keystone Species and Niche Differentiation Promote Microbial N, P, and COD Removal in Pilot Scale Constructed Wetlands Treating Domestic Sewage. Environ. Sci. Technol. 2021, 55, 12652–12663. [Google Scholar] [CrossRef]
  43. Chen, X.; Zhu, H.; Yan, B.; Shutes, B.; Tian, L.; Wen, H. Optimal Influent COD/N Ratio for Obtaining Low GHG Emissions and High Pollutant Removal Efficiency in Constructed Wetlands. J. Clean. Prod. 2020, 267, 122003. [Google Scholar] [CrossRef]
  44. Zhao, L.; Fu, G.; Pang, W.; Tang, J.; Guo, Z.; Hu, Z. Biochar Immobilized Bacteria Enhances Nitrogen Removal Capability of Tidal Flow Constructed Wetlands. Sci. Total Environ. 2022, 836, 155728. [Google Scholar] [CrossRef] [PubMed]
  45. Yang, P.; Tang, K.W.; Tong, C.; Lai, D.Y.F.; Zhang, L.; Lin, X.; Yang, H.; Tan, L.; Zhang, Y.; Hong, Y.; et al. Conversion of Coastal Wetland to Aquaculture Ponds Decreased N2O Emission: Evidence from a Multi-Year Field Study. Water Res. 2022, 227, 119326. [Google Scholar] [CrossRef] [PubMed]
  46. Bahram, M.; Espenberg, M.; Pärn, J.; Lehtovirta-Morley, L.; Anslan, S.; Kasak, K.; Kõljalg, U.; Liira, J.; Maddison, M.; Moora, M.; et al. Structure and Function of the Soil Microbiome Underlying N2O Emissions from Global Wetlands. Nat. Commun. 2022, 13, 1430. [Google Scholar] [CrossRef]
  47. Sun, D.; Liu, M.; Hou, L.; Zhao, M.; Tang, X.; Zhao, Q.; Li, J.; Han, P. Community Structure and Abundance of Comammox Nitrospira in Chongming Eastern Intertidal Sediments. J. Soils Sediments 2021, 21, 3213–3224. [Google Scholar] [CrossRef]
  48. Yu, B.; Liu, C.; Wang, S.; Wang, W.; Zhao, S.; Zhu, G. Applying Constructed Wetland-Microbial Electrochemical System to Enhance NH4+ Removal at Low Temperature. Sci. Total Environ. 2020, 724, 138017. [Google Scholar] [CrossRef]
  49. Chen, H.; Zheng, P.; Zhang, J.; Xie, Z.; Ji, J.; Ghulam, A. Substrates and Pathway of Electricity Generation in a Nitrification-Based Microbial Fuel Cell. Bioresour. Technol. 2014, 161, 208–214. [Google Scholar] [CrossRef]
Figure 1. Schematic diagram of constructed wetland.
Water 15 04272 g001
Figure 2. Inlet and effluent concentrations and the COD (a) and NH4+−N (b) removal rates.
Water 15 04272 g002
Figure 3. Interconversion between different nitrogen species under different C/N ratio conditions.
Water 15 04272 g003
Figure 4. Net nitrogen emission rate of different nitrogen at different C/N ratios.
Water 15 04272 g004
Figure 5. (a) Bacterial community structures in constructed wetlands under different C/N ratios. (b) Bacterial community structures under different C/N ratios using non-metric multidimensional scaling (NMDS).
Water 15 04272 g005
Figure 6. Differences in microbial diversity in constructed wetlands under different C/N ratios. Different lower case letters indicate p < 0.05 between different C/N ratios.
Water 15 04272 g006
Figure 7. Network structures of bacteria in constructed wetlands under different C/N ratios.
Water 15 04272 g007
Figure 8. Effects of constructed wetland bacteria on COD and nitrogen transformation under different C/N ratios. (a) RDA analysis between dominant bacterial phylum and COD and nitrogen. (b) Spearman’s correlation analysis between dominant bacterial phylum and COD and nitrogen; * indicates p < 0.05.
Water 15 04272 g008
Figure 9. Random forest analysis of microbial influences on net nitrogen emission rate in constructed wetlands under different C/N ratios. (ad) represent the Random Forest Explanation Rates of net nitrogen emission rate by microorganisms for NH4+−N, NO3−N, NO2−N and TN, respectively.
Water 15 04272 g009
Table 1. Trace element additions in water.
C6H12O6NH4ClKH2PO4Mg2+Ca2+Fe2+Zn2+Cu2+Mn2+Mo2+Co2+B5+
Concentration (mol/L)0.410.570.038.431.830.030.020.030.030.010.030.26
Table 2. Primary B concentration of substances in water.
CODDOAmmonia NitrogenTotal Phosphorus
Concentration≤20 mg/L≥6 mg/L≤0.15 mg/L≤0.02 mg/L
Disclaimer/Publisher’s Note: The statements, opinions and data contained in all publications are solely those of the individual author(s) and contributor(s) and not of MDPI and/or the editor(s). MDPI and/or the editor(s) disclaim responsibility for any injury to people or property resulting from any ideas, methods, instructions or products referred to in the content.

